CENTRAL BANK OF CYPRUS EUROSYSTEM HOUSEHOLD AND NON-FINANCIAL CORPORATIONS INDEBTEDNESS REPORT OCTOBER 2017 NICOSIA - CYPRUS

Welcome message from author
This document is posted to help you gain knowledge. Please leave a comment to let me know what you think about it! Share it to your friends and learn new things together.
Transcript

CENTRAL BANK OF CYPRUS
EUROSYSTEM
HOUSEHOLD
AND
NON-FINANCIAL
CORPORATIONS
INDEBTEDNESS REPORT
OCTOBER 2017
NICOSIA - CYPRUS

Prepared and published


CONTENTS
Executive Summary .................................................................................................................................... 5
1. Introduction ............................................................................................................................................ 6
2. Overview of financial sector developments and outlook ...................................................................... 6
3. Analysis of the household, NFC and aggregate domestic private non-financial sectors ................... 9
3.1. Household sector .......................................................................................................................................... 9
3.2. Non-financial corporations sector .............................................................................................................. 12
3.3. Aggregate domestic non-financial private sector....................................................................................... 14
4. Annex .................................................................................................................................................... 17
5. Technical notes ..................................................................................................................................... 20
Note: The cut-off date for the data used in this report is 8 September 2017.

TABLES AND CHARTS
CHARTS
1. Bank loans to domestic households 9
2. Breakdown of bank loans to domestic households (%) 9
3. Breakdown of bank loans to domestic households (€ billion) 9
4. Non-performing loans to private individuals, foreborne loans and loan loss provisions 10
5. Household debt 10
6. Household sector’s net financial assets (net worth) 10
7. Household sector’s financial liabilities 11
8. Breakdown of household sector’s financial assets and liabilities (€ million) 11
9. Breakdown of household sector’s financial assets and liabilities (% of total) 11
10. Deposits of domestic households - annual change 12
11. Residential property price indices 12
12. Bank loans to domestic non-financial corporations - annual change 12
13. Non-performing loans to non-financial corporations, foreborne loans and loan loss provisions 13
14. Non-financial corporations debt 13
15. Non-financial corporations sector’s net financial liabilities 13
16. Non-financial corporations sector’s financial liabilities 14
17. Breakdown of non-financial corporations sector’s financial assets and liabilities (€ million) 14
18. Breakdown of non-financial corporations sector’s financial assets and liabilities (% of total) 14
19. Deposits of domestic non-financial corporations - annual change 15
20. Bank credit to the domestic private non-financial sector 15
21. Bank credit-to-GDP gap 15
22. Domestic private non-financial sector debt service ratio 16
23. Non-performing loans to domestic private non-financial sector, foreborne loans and loan loss 16
provisions
24. Aggregate debt in the domestic private non-financial sector 16
TABLES
1. Breakdown of bank loans to the domestic economy by economic activity based on the EU’s
NACE Rev. 2 classification 17
2. Breakdown of non-performing bank loans to the domestic economy by economic activity
based on the EU’s NACE Rev. 2 classification as % of total outstanding loans 18
3. Breakdown of non-performing bank loans to the domestic economy by economic activity
based on the EU’s NACE Rev. 2 classification as % of total outstanding loans per NACE
category 19

CENTRAL BANK OF CYPRUS 4
ABBREVIATIONS AMF Arrears Management Framework
CBC Central Bank of Cyprus
Cystat Statistical Service of the Republic of Cyprus
EBA European Banking Authority
ECB European Central Bank
EU European Union
Eurostat Statistical Office of the European Union
GDP Gross Domestic Product
MFI(s) Monetary Financial Institution(s)
NACE Nomenclature statistique des activités Rev. 1.1 & économiques dans la Communauté Rev. 2 européenne (Statistical classification of economic activities in the European Community)
NFCs Non-Financial Corporations
NPLs Non-Performing Loans SDW Statistical Data Warehouse of the
European Central Bank

CENTRAL BANK OF CYPRUS 5
Household and Non-Financial Corporations Indebtedness Report, October 2017
Executive Summary
Domestic households and non-financial
corporations (NFCs) continue to be highly indebted,
although the latest data indicate a reduction in debt
levels. Private non-financial sector debt stood at
265,4%1 of GDP as at the end of March 2017, down
from 268,3% in the previous quarter. Household and
NFC debt ratios declined gradually to 121,2% and
144,2%2 of GDP, respectively, at the end of March
2017 compared with 126,8% and 147,9% of GDP,
respectively, at the end of March 2016. Bank credit
to the domestic private non-financial sector,
decreased to 221,1% of GDP at end-March 2017
compared with 225,8% at end-December 2016.
The net financial asset position (net worth) of
households, decreased to 110,0% of GDP in 2017Q1,
from 113,7% in the previous quarter. The net
financial liabilities of NFCs, remained high at 204,7%
of GDP at end-March 2017, having increased slightly
from 202,1% in the previous quarter.
GDP growth during 2017, was mainly driven by the
rise in domestic demand and net exports, supported
by, inter alia, low lending rates. In the real estate
market, the Central Bank of Cyprus (CBC) residential
property price index in 2017Q1, recorded a small
increase on an annual basis, while the construction
output index, also recorded growth for the seventh
consecutive quarter, reflecting the improvement
1 Based on non-consolidated statistical data.
2 The NFC debt ratio of 144,2% of GDP excludes debt related to
special purpose entities (SPEs) -mainly ship-owning SPEs- which
observed in the construction industry. Specifically,
the construction output index increased by 36,5% in
2017Q1 compared to 2016Q1.
According to the CBC’s revised projections in June
2017, real GDP for the entire year is expected to
increase by 3,1% compared to the previous year.
Real GDP growth is expected to fluctuate around
this level in both 2018 and 2019, reflecting the
expected strong private consumption and
investment.
In the banking sector, non-performing loans (NPLs)
continue to be the key challenge. Despite the recent
improvements in the legal tools governing
foreclosures and the modernised insolvency regime,
the progress made by Cyprus credit institutions in
managing their NPL portfolios has been below
expectations. NPLs in absolute terms reached their
peak in February 2015 and have been decreasing
ever since. This decrease is expected to help release
necessary funding into the banking system for the
financing of real economic activity. However, the
downward trend in NPLs, needs to be accelerated.
Legislation to expedite the transfer of title deeds is
already in place, while legislation governing the
securitisation of loans is expected to be presented
to the House of Representatives next year.
are classified as residents, even though a large proportion of
their activities is not related to domestic activity, while their
lending is from abroad or secured by cash collateral.

CENTRAL BANK OF CYPRUS 6
Household and Non-Financial Corporations Indebtedness Report, October 2017
1. Introduction This report presents a concise analysis of the level
of indebtedness and the financial position of the
main borrowers of the Cyprus banking system, i.e.
the domestic household and NFC sectors. The
analysis is based on the latest available data from
various sources, mainly from monthly balance
sheet data submitted by monetary financial
institutions (MFIs) to the CBC and from the
quarterly financial accounts. With regard to euro
area comparisons, the source of the data is mainly
the ECB Statistical Data Warehouse (SDW) and
Eurostat.
2. Overview of financial sector developments and outlook
The economic recovery which began in 2015 has
continued, with bank deposits by households and
NFCs exhibiting inflows since May 2015. In
parallel, NPLs have followed a downward trend,
albeit a slow one. There has also been a
continuous increase in net new loan agreements
since the end of 2014 (the period from which data
is available), by both NFCs and households in
Cyprus. This has been due to the generally low
level of interest rates and the pick-up of growth of
the Cyprus economy, which supports the demand
for new loans On the other hand, the deleveraging
of existing loans continues, mainly due to the
decline in NPLs, which, however, remain at very
high levels. Thus, the most important challenge
that the banking sector and the Cyprus economy
are facing, is the effective and timely management
of NPLs.
Thus, addressing the high level of NPLs in the
banking system, is a key priority on the reform
agenda and policy action has been taken and

CENTRAL BANK OF CYPRUS 7
continues to be taken to deal with this priority.
The high level of NPLs, reflects, inter alia, the
recession of the previous years and the legacy
problems arising from the financial crisis. Despite
the early progress that was made in the
restructuring of NPLs, the pace of restructuring
remains slow. Following the initial dynamic in the
number of restructurings, since the end of 2016
this has slowed down as negotiations between
credit institutions and borrowers are becoming
more and more difficult, and sustainable solutions
are limited. Following the restructuring of the
more straight forward cases, the more difficult
cases continue to be left unresolved.
The increase in the level of restructured loans is
partially due to the increasing use of debt-for-
property swaps, in cases where the property
secures only part of the NPLs. Credit institutions
have set up real estate management units to
manage property acquired through debt-for-
property swap agreements (including selective
investment and development), thus bringing
about an accelerated and cheaper foreclosure
process. Credit institutions are focusing their
efforts on tourist / hotel complexes as well as on
commercial property and other real estate.
In addition, the government has taken a number
of initiatives to stimulate the purchase of real
estate by non-residents in Cyprus. The programme
that grants Cypriot citizenship to non-residents
(Cypriot Citizenship Programme) as well as new
business opportunities in the energy, professional
services and tourism sectors, have contributed to
an increase in foreign investor interest. Real estate
investment by non-residents is increasing and
represents about 28% of the total number of new
real estate transfers for the first seven months of
2017. The interest by investors appears to be
focused mainly on large projects, such as
residential developments in prime locations,
casino resorts and marinas.

CENTRAL BANK OF CYPRUS 8
During 2016 the CBC set specific targets for credit
institutions, in an effort to increase the volume
and improve the quality of loan restructurings.
Through this process, the pace of debt
restructuring is expected to pick up. The
downward trend in NPLs is due to increased
repayments, successfully completed
restructurings, which are reclassified as
performing facilities, write-offs and settlement of
debt through swaps with immovable property.
Nevertheless, the decrease in NPLs has been
below expectations.
The results of the CBC’s latest Bank Lending Survey
(July 2017) indicate that net loan demand, from
both households for house purchase and from
NFCs, increased further in 2017Q2, reflecting
robust domestic economic activity. Net loan
demand by households for consumption and
other lending purposes remained unchanged in
2017Q2 compared with 2017Q1. Based on credit
institutions’ expectations, net loan demand is
expected to increase further in 2017Q3, in all loan
categories. Expectations of a further increase in
net loan demand by the domestic non-financial
private sector (households and enterprises) are
anticipated to have a positive impact on domestic
activity and signal a continuation of the sound
economic growth recorded in recent quarters.
According to the BLS, the main factors
contributing to the increase in demand for loans
from households for house purchase were the
increase in consumer confidence and the
reduction in interest rates. For NFCs, the main
factors contributing to the increase in net loan
demand relate to the reduction in interest rates,
the need to increase their inventories, working
capital and fixed assets as well as the need to
restructure debt. The BLS results indicate that as
far as credit institutions’ expectations are
concerned, credit standards in 2017Q3 were
expected to remain unchanged for all loan
categories.

CENTRAL BANK OF CYPRUS 9
Regarding the housing market, the CBC residential
property price index recorded an annual increase
of 0,2% in 2017Q1, compared with a decrease of
0,9% in 2016Q4. This is the first annual increase
observed in the index since 2010.
Other measures already in place to safeguard
prudent borrowing and lending behaviour are the
loan-to-value (LTV) ratio and the debt service to
income ratio (DSTI). The maximum allowable LTV
ratio is set at 80% for a primary residence and at
70% for all other real estate purchases. The debt
servicing amount is defined as the instalment
amount of the credit facility to be granted plus all
other instalments of existing credit facilities with
all credit institutions. The debt servicing amount
is limited to 80% of net disposable income (which
is the difference between the borrower's total
monthly income and total monthly expenditure).
The DSTI ratio is limited to 65% for loans
denominated in foreign currency.
3. Analysis of the household, NFC and aggregate domestic private non-financial sectors
3.1. Household sector
Bank loans
Based on the ECB methodology3, total bank loans
to domestic households, increased annually by
0,2% in June 2017, compared with an increase in
the euro area average (3,0%) in the same period
(Chart 1). As regards the breakdown of lending to
households, based on the ECB methodology, loans
for house purchase constituted the bulk of loans
(55,3%) granted to domestic households in June
2017 (Chart 2). This was followed by other
Chart 1
Chart 2
Chart 3
3 The calculation of annual growth rates for monthly MFI
balance sheet statistics is based on the ECB methodology,
which takes into account net transactions but excludes
reclassifications/other adjustments, revaluations and
exchange rate adjustments.

CENTRAL BANK OF CYPRUS 10
household lending4 (32,3%) and consumer credit
(12,4%). Loans for house purchase, recorded an
annual decrease of 0,9%, while consumer credit
and other lending recorded an annual increase of
0,7% and 1,7% respectively, in June 2017. In
absolute terms, there was a decrease in the level
of bank loans to domestic households in all three
categories (Chart 3).
Non-performing loans
The latest available consolidated prudential
supervisory data indicate that NPLs as a
percentage of total outstanding loans to domestic
households reached 54,5% at end-June 2017,
remaining at the same level as in the previous
quarter (Chart 4). Specifically, NPLs5 decreased by
€498 million between June 2016 and June 2017.
The proportion of exposures with forbearance
measures, i.e. restructured loans as a percentage
of total loans to private individuals, has followed
an increasing trend since the previous year,
reaching 27,7% as at 2017Q2, from 26,2% as at
2016Q2 (Chart 4). The restructured / forborne
balance at the end of each month is affected by,
apart from the new restructurings, repayments
and migrations from the ‘forborne’ category to the
‘performing’ category, due to the expiration of the
probation period for the non-performing
classification6. As a result, a reduction in NPLs is
expected through restructuring due to the
migration of loans from the category of non-
performing to performing. Despite the increase in
Chart 4
Chart 5
Chart 6
4 Other household lending includes, inter alia, MFI loans
granted to individuals, other than those included in "loans for
house purchase" and "consumer credit", such as loans for
medical treatment, education and debt-consolidation, as well
as loans to employers (including own-account workers) and
non-profit institutions serving households
5 In September 2013, a revised CBC directive was published,
whereby a new definition of NPLs was adopted. As a result, a
break in the series appears in September 2013. Moreover, in
December 2014, the EBA published its Implementing
Technical Standards, which all banks adopted, whereby the
NPL definition was harmonised throughout the EU.
6 The probation period for the non-performing classification
ends when the loans have demonstrated compliance with the
new repayment schedule for a period of at least 12 months.

CENTRAL BANK OF CYPRUS 11
NPLs restructured as a percentage of total loans to
households, the absolute number of
restructurings has decreased. Given the NPL
definition, the decline due to successful
restructurings is expected to be gradual and slow.
Indebtedness
In 2017Q1 household debt as a percentage of GDP
reached 121,2%, falling from 122,9% in 2016Q4
(Chart 5). This development suggests that
although domestic households remain over-
indebted, signs of improvement are evident.
Moreover, although household debt ratios are
above the respective euro area average (58,2% of
GDP), these are supported by households’ high net
financial asset position, as households’ financial
assets (e.g. cash, deposits with credit institutions,
investments in financial instruments) on average,
exceed their debts to credit institutions.
Financial position
The household sector’s net financial assets (net
worth) decreased to 110,0% of GDP in 2017Q1
compared with 113,7% of GDP in 2016Q4 (Chart
6). This ratio continues to remain significantly
below the respective euro area average of 148,5%
as at end-March 2017 (Chart 6) 7 . Financial
liabilities of households as a percentage of
financial assets increased marginally to 56,3% in
2017Q1, compared to 2016Q4 (Chart 7). At end-
March 2017, loans still made up a significant
proportion of total household sector’s financial
liabilities (85,4%) (Chart 9). During the same
period, cash and bank deposits continued to
represent the largest portion of households’
financial assets (62,3%), remaining broadly
Chart 7
Chart 8
Chart 9
7 It is noted that an important contributing factor to the
significant fall in the ratio in 2012Q4, is that since December
2012, financial accounts data have been compiled in
accordance with ESA 2010. Prior to December 2012, quarterly
financial accounts were compiled in accordance with ESA
1995. GDP is compiled in accordance with ESA 2010.
CENTRAL BANK OF CYPRUS 12
unchanged in both value and share from the
previous quarter (Chart 8 and Chart 9).
Bank deposits
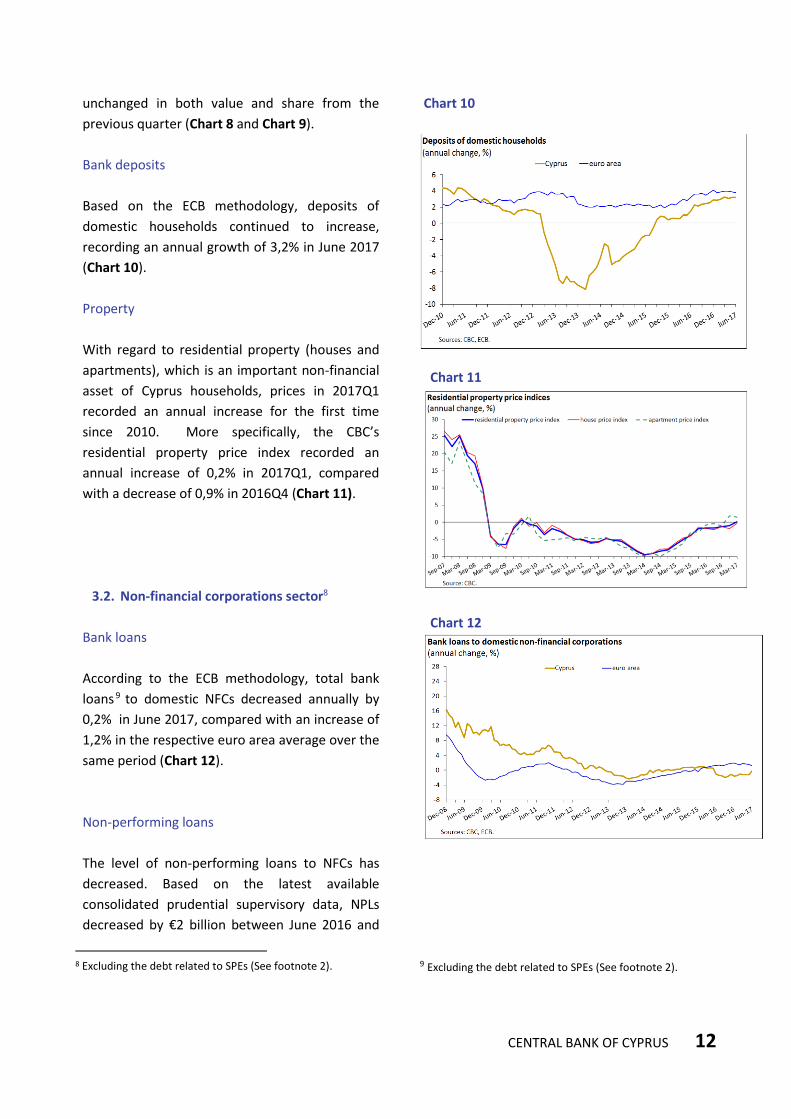
Based on the ECB methodology, deposits of
domestic households continued to increase,
recording an annual growth of 3,2% in June 2017
(Chart 10).
Property
With regard to residential property (houses and
apartments), which is an important non-financial
asset of Cyprus households, prices in 2017Q1
recorded an annual increase for the first time
since 2010. More specifically, the CBC’s
residential property price index recorded an
annual increase of 0,2% in 2017Q1, compared
with a decrease of 0,9% in 2016Q4 (Chart 11).
3.2. Non-financial corporations sector8
Bank loans
According to the ECB methodology, total bank
loans 9 to domestic NFCs decreased annually by
0,2% in June 2017, compared with an increase of
1,2% in the respective euro area average over the
same period (Chart 12).
Non-performing loans
The level of non-performing loans to NFCs has
decreased. Based on the latest available
consolidated prudential supervisory data, NPLs
decreased by €2 billion between June 2016 and
Chart 10
Chart 11
Chart 12
8 Excluding the debt related to SPEs (See footnote 2).
9 Excluding the debt related to SPEs (See footnote 2).

CENTRAL BANK OF CYPRUS 13
June 2017. Total loans to NFCs decreased by €1,2
billion over the same period, thus the ratio NPLs
to NFCs decreased from 57,2% in 2016Q2 to 50,9%
in 2017Q2 (Chart 13).
The proportion of exposures with forbearance
measures, i.e. restructured loans as a percentage
of total loans to NFCs, decreased from 35,8% as at
June 2016 to 32,2% as at June 2017 (Chart 13).
Indebtedness
In 2017Q1, NFC debt as a percentage of GDP fell
to 144,2%10, from 145,4% in 2016Q4 (Chart 14).
Hence, domestic NFCs continue to remain
excessively indebted, despite the downward trend
in their debt levels.
Financial position
The net financial position of NFCs as a percentage
of GDP is negative (i.e. their financial liabilities are
greater than their financial assets) and increased
to 204,7% at the end-March 2017, from 202,1% at
the end-December 2016 11 (Chart 15). Financial
liabilities as a percentage of financial assets
increased to 164,4% in 2017Q1, from 162,8% in
2016Q4 (Chart 16), indicating that the financial
position of NFCs remains weak.
Loans and equity/investment fund shares
constitute the largest components of the NFC
sector’s financial liabilities. Loans represented the
largest part, accounting for 42,9% of financial
liabilities at end-March 2017 (Chart 17 and Chart
18). Equity and investment fund shares
represented the largest constituent of the NFC
sector’s financial assets at the end-March 2017
Chart 13
Chart 14
Chart 15
10 Excluding the debt related to SPEs (See footnote 2).
11 The fluctuations observed during 2012 were due to
significant statistical adjustments effected by the CBC’s
Statistics Department in the holdings of unquoted shares and
other equity of NFCs (Source: quarterly financial accounts
data).

CENTRAL BANK OF CYPRUS 14
(51,6%), with their share decreasing only
marginally compared with the previous quarter
(52,0%).
Bank deposits
Based on the ECB methodology, deposits of
domestic NFCs12 exhibited an annual growth rate
of 18,7% in June 2017 (Chart 19).
3.3. Aggregate domestic non-financial private
sector13
Bank loans
Bank credit to the domestic private non-financial
sector fell to 221,1%14 of GDP at end-March 2017,
down from 225,8% at end-December 2016 (Chart
20). The decrease was due to the upward trend of
GDP in the last three years as well as the decline in
bank lending from credit institutions to the
domestic private non-financial sector during 2016.
This decrease is also reflected in the bank credit-
to-GDP gap, which stood at -40,0% as at March
2017 (Chart 21). This is essentially the deviation of
the bank credit-to-GDP ratio from its long-term
trend. Furthermore, the domestic private non-
financial sector debt service ratio, has followed a
downward trend since 2014Q2, reaching 26,0% as
at March 2017 (Chart 22). The domestic private
non-financial sector debt service ratio, i.e. the
percentage of debt payments to gross disposable
income, which, in addition to the principal
payments, also captures the effect of interest
payments and loan maturities.
Loans to private individuals represented 42,2% of
total outstanding loans in the banking sector at
end-June 2017 (Annex, Table 1). As regards loans
Chart 16
Chart 17
Chart 18
12 Excluding deposits related to SPEs (See footnote 2).
13 Excluding the debt related to SPEs (See footnote 2).
14 Excluding the debt related to SPEs (See footnote 2).

CENTRAL BANK OF CYPRUS 15
to NFCs, credit institutions are significantly
exposed to the broad real estate sector (i.e. loans
to the construction sector, real estate activities
and construction-related manufacturing
activities), with loans to this sector amounting to
20,4% of total outstanding loans in 2017Q2. Loans
to the wholesale and retail trade sector constitute
the second largest exposure of credit institutions
to NFCs, amounting to 9,6% of total outstanding
loans at end-June 2017, followed by loans to the
financial and insurance activities sector (8,9%).
Non-performing loans
Based on non-consolidated statistical data, the
highest NPL ratios 15 as a percentage of total
outstanding loans per category at end-June 2017,
concern loans to the construction sector which
account for 74,5% of total loans to this sector
(Annex, Table 2). This is followed by NPLs in the
agriculture, forestry and fishing sector (72,4%) and
in the arts, entertainment and recreation sector
(68,7%) (Annex, Table 3). Nevertheless, bank
exposures to the last two sectors are relatively
small in absolute terms. In contrast, credit
institutions are highly exposed to the construction
sector. NPLs in the broad real estate sector
exhibited an increase over previous quarters, due
to the deterioration in the financial condition of
land development and construction companies
amid a difficult operating environment. However,
more recently, a slight improvement has been
observed.
Based on consolidated prudential supervisory
data, the ratio of NPLs to total loans decreased,
reaching 44,1% as at 2017Q2 compared with
45,0% in the previous quarter (Chart 23). In
absolute figures, between June 2016 and June
Chart 19
Chart 20
Chart 21
15 The data prior to September 2013 are based on the old
definition of NPLs and hence there is a break in the series
(See footnote 5).

CENTRAL BANK OF CYPRUS 16
2017, total NPLs decreased by €2,5 billion to €22,8
billion. The ratio of loan loss provisions to total
NPLs (coverage ratio) at the end of 2017Q2
increased to 46,2% compared with 42,3%
recorded at the end of 2017Q1.
The proportion of exposures with forbearance
measures, i.e. restructured loans as a percentage
of total loans to the domestic private non-financial
sector, amounted to 25,2% as at 2017Q2,
recording a marginal decrease since the previous
quarter (25,3%) (Chart 23).
Indebtedness
Domestic private non-financial sector debt 16
decreased to 265,4% of GDP at 2017Q1, from
268,3% in the previous quarter (Chart 24).
Bank deposits
Based on the ECB methodology, deposits of the
domestic private non-financial sector17 recorded
an annual growth of 6,1% in 2017Q2, compared
with an annual growth of 5,6% in 2016Q2.
Chart 22
Chart 23
Chart 24
16 Excluding the debt related to SPEs (See footnote 2). 17 Excluding deposits related to SPEs (See footnote 2).

CENTRAL BANK OF CYPRUS 17
4. Annex
(1) Loans to Cyprus residents including organisations or companies with no physical presence in Cyprus. (2) Based on non-consolidated statistical data. Source: CBC.
Table 1: Breakdown of bank loans to the domestic economy by economic activity based on the EU’s NACE Rev. 2 classification (1), (2) (%)
as % of total outstanding loans
September
2015
December
2015
March
2016
June
2016
September
2016
December
2016
March
2017
June
2017
A Agriculture, forestry and fishing 1,0 1,0 1,1 1,1 1,1 1,2 1,1 1,1
B Mining and quarrying 0,3 0,3 0,3 0,3 0,3 0,3 0,3 0,3
C Manufacturing 3,6 3,4 3,6 3,7 3,4 3,4 3,5 3,5
of which: construction-related activities 0,6 0,6 0,6 0,6 0,6 0,6 0,6 0,6
D Electricity, gas, steam and air conditioning supply 0,1 0,1 0,1 0,1 0,1 0,2 0,2 0,2
E Water supply, sewerage, waste management and remediation activities 0,4 0,3 0,3 0,4 0,4 0,3 0,3 0,3
F Construction 14,9 14,1 15,1 14,3 13,9 13,3 13,2 12,7
G Wholesale and retail trade; repair of motor vehicles and motorcycles 9,4 8,8 9,4 9,5 9,4 9,5 9,6 9,6
H Transportation and storage 1,4 1,3 1,4 1,5 1,8 1,5 1,5 1,4
I Accommodation and food service activities 4,9 4,6 4,9 4,9 4,9 5,0 5,0 5,3
J Information and communication 0,7 0,7 0,7 0,7 0,7 0,7 0,8 0,7
K Financial and insurance activities (excluding monetary intermediation) 8,6 13,2 7,5 6,9 7,9 7,7 8,3 8,9
L Real estate activities 6,8 6,4 6,8 7,3 7,3 7,3 7,1 7,0
M Professional, scientific and technical activities 2,4 2,0 2,1 2,1 1,9 1,9 1,9 1,9
N Administrative and support service activities 0,8 0,8 0,8 0,8 0,7 0,7 0,7 0,6
O Public administration and defense; compulsory social security 1,7 1,6 1,7 1,8 1,8 1,7 1,7 1,7
P Education 0,3 0,3 0,4 0,4 0,4 0,4 0,4 0,4
Q Human health and social work activities 0,6 0,6 0,6 0,6 0,6 0,7 0,7 0,7
R Arts, entertainment and recreation 0,3 0,3 0,3 0,4 0,3 0,3 0,3 0,3
S Other service activities 1,5 1,3 1,3 1,3 1,2 1,2 1,2 1,2
T Private individuals 40,3 40,340,340
,3
38,8 41,4 41,9 41,9 42,6 42,2 42,2
TOTAL 100,0 100,0 100,0 100,0 100,0 100,0 100,0 100,0

CENTRAL BANK OF CYPRUS 18
(1) Loans to Cyprus residents including organisations or companies with no physical presence in Cyprus. (2) Based on non-consolidated statistical data. Source: CBC
Table 2: Breakdown of non-performing bank loans to the domestic economy by economic activity based on the EU’s NACE Rev. 2 classification(1), (2)
as % of total outstanding loans
September
2015
December
2015
March
2016
June
2016
September
2016
December
2016
March
2017
June
2017
A Agriculture, forestry and fishing 1,3 1,3 1,4 1,4 1,5 1,5 1,5 1,6
B Mining and quarrying 0,4 0,4 0,3 0,3 0,4 0,4 0,4 0,4
C Manufacturing 3,7 3,6 3,7 3,8 3,5 3,5 3,7 3,7
of which: construction-related activities 0,6 0,6 0,6 0,7 0,7 0,7 0,7 0,7
D Electricity, gas, steam and air conditioning supply 0,1 0,1 0,1 0,1 0,1 0,1 0,1 0,1
E Water supply, sewerage, waste management and remediation
activities
0,1 0,1 0,1 0,1 0,1 0,1 0,1 0,1
F Construction 21,4 21,0 21,1 19,8 19,3 18,6 18,0 17,8
G Wholesale and retail trade; repair of motor vehicles and motorcycles 9,3 9,3 9,2 9,2 9,2 9,3 9,4 9,5
H Transportation and storage 1,3 1,4 1,4 1,5 1,5 0,9 1,7 1,6
I Accommodation and food service activities 5,4 5,6 5,4 5,2 5,2 5,2 5,3 4,7
J Information and communication 0,6 0,6 0,6 0,6 0,6 0,6 0,6 0,6
K Financial and insurance activities (excluding monetary intermediation) 2,4 2,5 1,8 1,5 1,7 2,2 2,2 2,1
L Real estate activities 8,0 7,9 8,2 8,8 8,9 8,7 8,1 7,8
M Professional, scientific and technical activities 2,7 2,6 2,5 2,5 2,3 2,3 2,2 2,1
N Administrative and support service activities 1,0 1,1 1,0 1,0 0,8 0,9 0,8 0,7
O Public administration and defense; compulsory social security 0,2 0,2 0,2 0,2 0,2 0,2 0,2 0,2
P Education 0,3 0,3 0,3 0,3 0,2 0,3 0,2 0,3
Q Human health and social work activities 0,5 0,3 0,3 0,3 0,3 0,3 0,3 0,3
R Arts, entertainment and recreation 0,4 0,4 0,4 0,5 0,4 0,4 0,5 0,4
S Other service activities 1,7 1,6 1,6 1,6 1,6 1,5 1,6 1,5
T Private individuals 39,1 39,9 40,5 41,4 42,1 43,0 43,4 44,5
TOTAL 100,0 100,0 100,0 100,0 100,0 100,0 100,0 100,0

CENTRAL BANK OF CYPRUS 19
(1) Loans to Cyprus residents including organisations or companies with no physical presence in Cyprus. (2) Based on non-consolidated statistical data. Source: CBC
Table 3: Breakdown of non-performing bank loans to the domestic economy by economic activity based on the EU’s NACE Rev. 2 classification (1), (2)
as % of total outstanding loans per NACE category
September
2015
December
2015
March
2016
June 2016 September
2016
December
2016
March
2017
June
2017
A Agriculture, forestry and fishing 74,2 73,6 73,6 74,2 73,5 74,1 73,1 72,4
B Mining and quarrying 80,8 80,2 74,9 71,4 71,0 69,6 70,6 66,9
C Manufacturing 59,3 59,2 58,7 60,0 57,9 56,6 57,4 56,3
of which: construction-related activities 59,4 59,5 59,1 62,8 63,1 61,5 64,0 63,6
D Electricity, gas, steam and air conditioning supply 32,4 33,5 39,4 40,7 43,4 22,4 23,0 21,3
E Water supply, sewerage, waste management and remediation
activities
12,1 10,3 10,3 10,5 10,7 8,9 9,0 9,1
F Construction 83,7 82,2 81,1 79,3 78,8 77,6 73,9 74,5
G Wholesale and retail trade; repair of motor vehicles and
motorcycles
57,7 58,5 56,9 55,8 55,5 54,3 53,0 52,7
H Transportation and storage 56,7 55,9 56,7 54,9 46,8 33,8 61,3 61,1
I Accommodation and food service activities 65,2 66,3 64,3 60,7 60,3 57,9 56,8 47,0
J Information and communication 45,4 45,1 47,3 47,3 48,9 44,4 43,7 45,7
K Financial and insurance activities (excluding monetary
intermediation)
16,5 10,5 14,2 12,2 12,2 16,1 14,5 12,3
L Real estate activities 68,7 68,1 70,1 69,3 69,3 65,8 61,9 58,9
M Professional, scientific and technical activities 65,3 71,5 67,0 70,0 67,3 65,8 62,1 61,3
N Administrative and support service activities 76,7 76,1 74,4 71,8 67,3 70,5 62,7 60,5
O Public administration and defense; compulsory social security 8,0 6,2 6,1 6,8 5,4 5,3 5,2 5,2
P Education 50,6 47,6 47,5 44,3 35,3 45,0 34,6 44,5
Q Human health and social work activities 51,1 29,7 29,3 27,8 28,2 25,0 23,1 24,2
R Arts, entertainment and recreation 77,9 75,7 74,6 74,4 73,7 72,9 72,8 64,4
S Other service activities 66,4 65,6 72,5 71,8 71,9 70,1 69,9 68,7
T Private individuals 56,5 56,9 56,9 56,7 56,8 56,1 55,9 56,0
TOTAL NPLs (% of total outstanding loans) 58,3 58,3 55,3 58,2 57,5 56,5 55,5 54,3

CENTRAL BANK OF CYPRUS 20
5. Technical notes Data coverage The data cover the activities of all credit institutions, including the Co-operative Cyprus Central Bank (up to 23 July 2017 known as the Cooperative Central Bank and its affiliated co-operative credit institutions). Statistical data cover the activities of all credit institutions operating in Cyprus only on a non-consolidated basis, while prudential supervisory data cover the activities of all credit institutions operating in Cyprus, including their overseas activities, on a consolidated basis. Residency definition As a result of the change in the residency definition for statistical purposes in July 2008, statistical data referring to Cyprus residents (e.g. MFI loans to NFCs) also cover legal entities which are registered in Cyprus that do not have their physical presence in Cyprus (i.e. SPEs as per footnote 2). MFI Monthly Balance Sheet Statistics The monthly balance sheet data submitted by MFIs to the CBC, cover the aggregated, non-consolidated figures of all credit institutions operating in Cyprus. Financial Accounts Statistics All financial accounts data are on a non-consolidated basis and cover only resident physical persons and legal entities. Non-performing loan definition Data reported are based on the definition of NPLs used by the CBC. This definition was revised at the end of September 2013 and, as a result, since then, NPL indicators are based on the new, stricter definition. This unavoidably leads to a break in the data series. Bank credit-to-GDP gap The bank credit-to-GDP gap is computed as the deviation ("gap") of credit-to-GDP, calculated as the difference between the ratio of stocks of domestic credit to nominal GDP (non-seasonally adjusted), and its recursive Hodrick-Prescott filtered trend with a smoothing parameter λ of 400.000. GDP data is a four quarter moving sum, up to the quarter of reference, at current prices (nominal) (non-seasonally adjusted) and is compiled in accordance with ESA2010. Bank credit, consists of lending to the private non-financial sector in Cyprus, including loans to and debt
securities from non-financial corporations (excluding loans to SPEs) and to households and non-profit institutions serving households. Households and non-financial corporations debt service ratio The debt service ratio of households and non-financial corporations, is calculated using the following formula:
, where, DSR denotes the Debt Service Ratio, DSC denotes the Debt Service Costs, D denotes an aggregate credit stock, i denotes the average interest rate per year on the stock, s denotes the average remaining maturity in years in the stock, Y denotes annual aggregate income and t denotes time expressed in quarters. The interest rates used for the calculation of the ratio, refer to loans provided by MFIs operating in Cyprus to Cyprus and other euro area residents. Hence, an implicit assumption is made that there is no interest rate discrimination between Cyprus residents and the rest of euro area residents by credit institutions when providing loans (i.e. interest rates on loans provided by credit institutions to Cyprus residents are the same as those on loans provided to other euro area residents). For the calculation of the ratio, the assumption is made that the loan 'D' is structured as a so called installment loan, where the debt costs 'R' are paid in equal portions over the maturity of the loan. For the calculation of the ratio, only loans provided by credit institutions operating in Cyprus are considered. Therefore, loans and any other form of credit provided to Cyprus residents by credit institutions operating abroad (including overseas branches and subsidiaries of Cyprus banks) and by any non-credit institutions (both resident and non-resident) are excluded from the ratio.

CENTRAL BANK OF CYPRUS 21
GDP is used instead of gross disposable income, due to the unavailability of quarterly data for the latter. Due to data unavailability regarding the remaining maturity variable, a simplifying assumption is made that it remains constant over time. Furthermore, it is assumed that the average maturity for loans with remaining maturity below one year is 0,5 years, for those with remaining maturity between one and five years is three years and for those with remaining maturity above five years is 15 years. The methodology used to construct the indicator, is based on Drehmann M. and Juselius M. (2012) "Do debt service costs affect macroeconomic and financial stability?", BIS Quarterly Review, September.
Related Documents


