House Research Department . 600 State Office Building . St. Paul, MN 55155 . (651) 296-6753 House Research Simulation Report: Property Tax Simulation #1H2 Date 4/25/2001 Steve Hinze, Legislative Analyst (651-296-8956) DESCRIPTION BASELINE: Preliminary Pay 2001 ALTERNATIVE: Projected Pay 2002: Current Law (revised 4/25) This report is a projection of property taxes payable in 2002 under current law. It is a refinement over previous current law projections. The payable 2002 projections result from a joint House/Senate/Revenue Dept. working group. Taxable market values were projected to grow at approximately the same rates as the growth from pay 2000 to pay 2001, on a jurisdiction-by- jurisdiction basis. Non-school levy plus aid amounts were generally projected to grow at the average growth rate for the two previous years, on a jurisdiction-by-jurisdiction basis, with levy amounts derived by subtracting projected state aid amounts from projected levy plus aid. School district levies were projected by modeling relevant aid and levy formulas, using underlying statewide levy assumptions made by the Dept. of Children, Families and Learning. KEY POINTS ! Statewide, property taxes are projected to increase by $337 million, or 6.7%, according to the simulation. Approximately $173 million of the $337 million increase is borne by new construction - property appearing on the tax rolls for the first time in 2002. The tax increases are projected to be 7.6% in Greater Minnesota and 6.2% in the Metro area. ! Property tax impacts by property type generally mirror changes in value. Tax increases on existing properties range from -1.9% for public utility property to +8% on low-income apartments. The overall rate of tax increase is projected to be less than the overall growth in taxable market value (9.7%), meaning that effective tax rates would decline for most property types. The simulations are estimates only. House Research strives to make property tax simulations accurate, but simulations are only approximations of reality. They depend upon judgements about how much local government officials will decide to levy, which are highly speculative. Generally the results are most accurate on a statewide level, and tend to be less accurate as the jurisdiction under scrutiny gets smaller.

Welcome message from author
This document is posted to help you gain knowledge. Please leave a comment to let me know what you think about it! Share it to your friends and learn new things together.
Transcript
House Research Department . 600 State Office Building . St. Paul, MN 55155 . (651) 296-6753
House Research Simulation Report: Property Tax Simulation #1H2 Date 4/25/2001
Steve Hinze, Legislative Analyst (651-296-8956)
DESCRIPTION
BASELINE: Preliminary Pay 2001
ALTERNATIVE: Projected Pay 2002: Current Law (revised 4/25)
This report is a projection of property taxes payable in 2002 under currentlaw. It is a refinement over previous current law projections. The payable2002 projections result from a joint House/Senate/Revenue Dept. workinggroup. Taxable market values were projected to grow at approximately thesame rates as the growth from pay 2000 to pay 2001, on a jurisdiction-by-jurisdiction basis. Non-school levy plus aid amounts were generallyprojected to grow at the average growth rate for the two previous years, ona jurisdiction-by-jurisdiction basis, with levy amounts derived bysubtracting projected state aid amounts from projected levy plus aid. School district levies were projected by modeling relevant aid and levyformulas, using underlying statewide levy assumptions made by the Dept.of Children, Families and Learning.
KEY POINTS
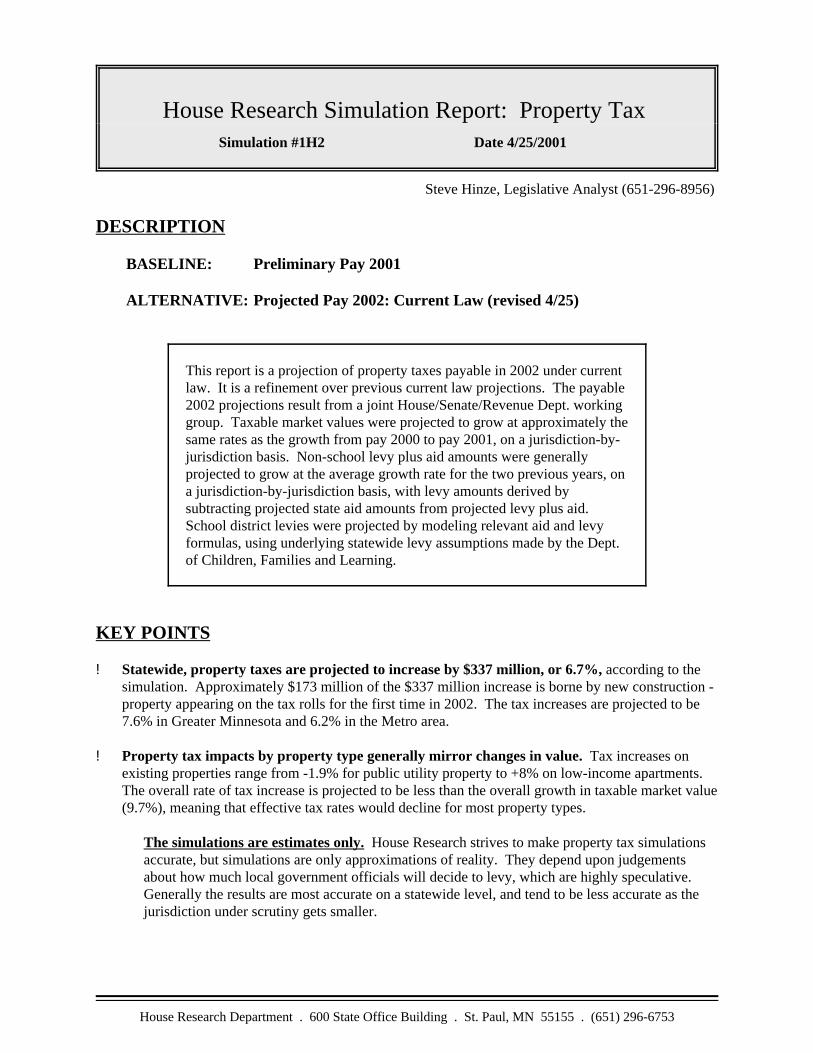
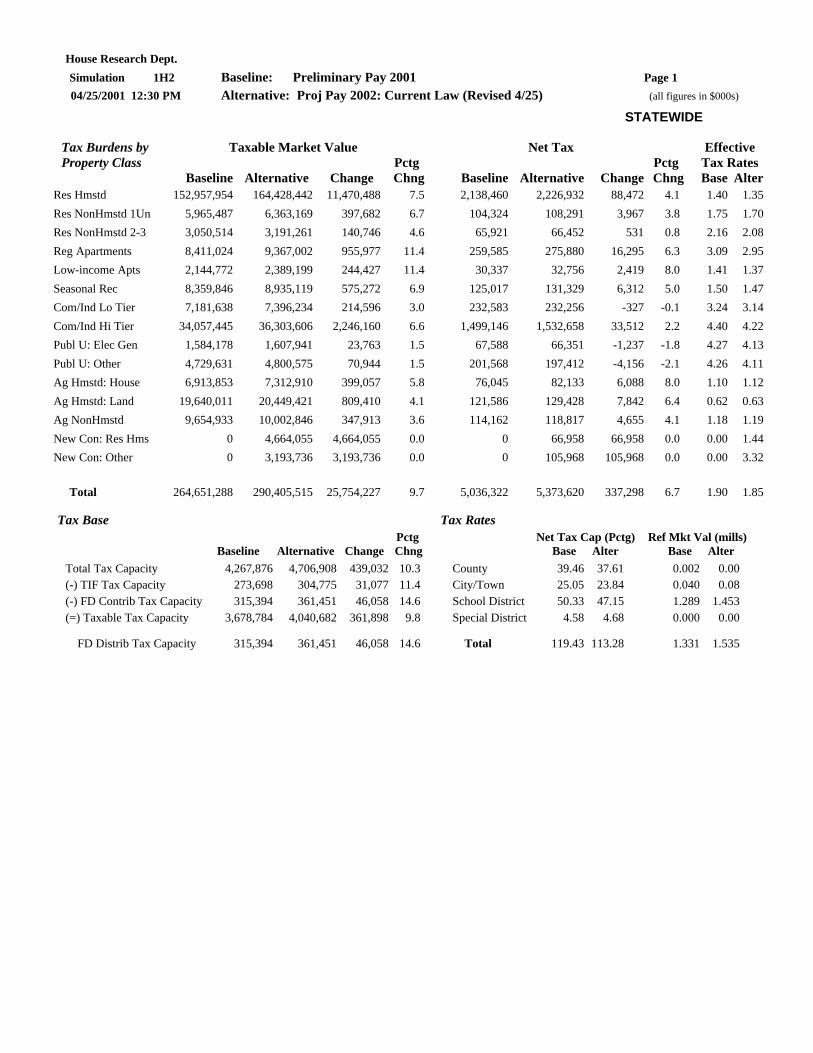
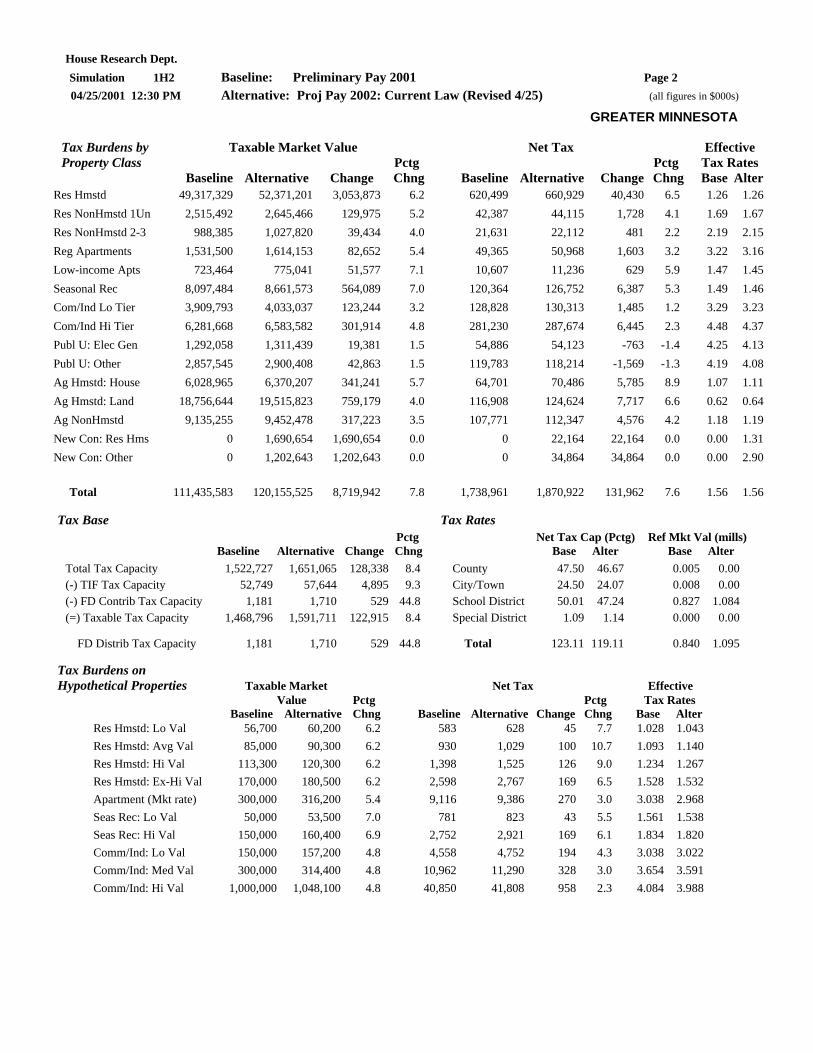
! Statewide, property taxes are projected to increase by $337 million, or 6.7%, according to thesimulation. Approximately $173 million of the $337 million increase is borne by new construction -property appearing on the tax rolls for the first time in 2002. The tax increases are projected to be7.6% in Greater Minnesota and 6.2% in the Metro area.
! Property tax impacts by property type generally mirror changes in value. Tax increases onexisting properties range from -1.9% for public utility property to +8% on low-income apartments.The overall rate of tax increase is projected to be less than the overall growth in taxable market value(9.7%), meaning that effective tax rates would decline for most property types.
The simulations are estimates only. House Research strives to make property tax simulationsaccurate, but simulations are only approximations of reality. They depend upon judgementsabout how much local government officials will decide to levy, which are highly speculative. Generally the results are most accurate on a statewide level, and tend to be less accurate as thejurisdiction under scrutiny gets smaller.

House Research Simulation Report: Property Tax Page ii
House Research Department . 600 State Office Building . St. Paul, MN 55155 . (651) 296-6753
ASSUMPTIONS:
BASELINE: Preliminary Pay 2001
! Property values (limited market values) are actual values reported by county assessors onthe abstracts of assessment.
! Local government levies are from a survey of county auditors done by the Dept. of Revenue.
! Tax increment financing (TIF) net tax capacities are preliminary values from the abstracts ofassessment submitted by county assessors to the Dept. of Revenue; the final figures will be reportedlater this year when the abstracts of tax lists are filed by county auditors.
House Research Simulation Report: Property Tax Page iii
House Research Department . 600 State Office Building . St. Paul, MN 55155 . (651) 296-6753
ASSUMPTIONS:
ALTERNATIVE: Projected Pay 2002: Current Law (revised 4/25)
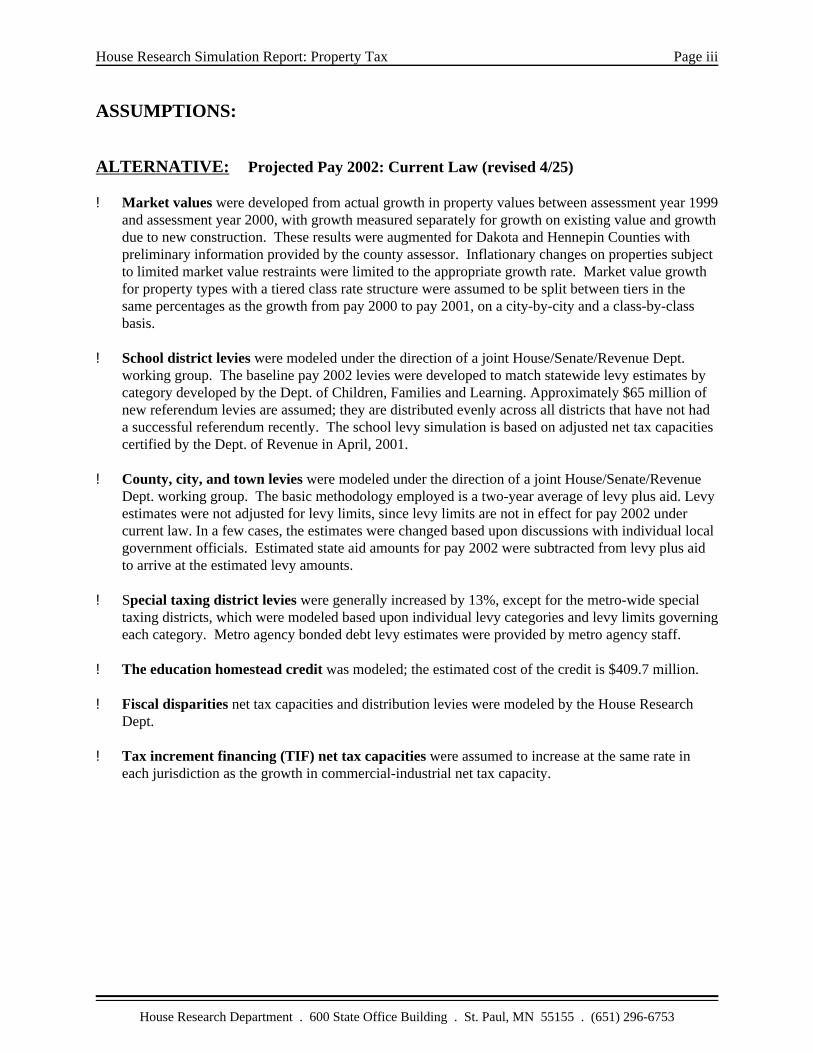
! Market values were developed from actual growth in property values between assessment year 1999and assessment year 2000, with growth measured separately for growth on existing value and growthdue to new construction. These results were augmented for Dakota and Hennepin Counties withpreliminary information provided by the county assessor. Inflationary changes on properties subjectto limited market value restraints were limited to the appropriate growth rate. Market value growthfor property types with a tiered class rate structure were assumed to be split between tiers in thesame percentages as the growth from pay 2000 to pay 2001, on a city-by-city and a class-by-classbasis.
! School district levies were modeled under the direction of a joint House/Senate/Revenue Dept.working group. The baseline pay 2002 levies were developed to match statewide levy estimates bycategory developed by the Dept. of Children, Families and Learning. Approximately $65 million ofnew referendum levies are assumed; they are distributed evenly across all districts that have not hada successful referendum recently. The school levy simulation is based on adjusted net tax capacitiescertified by the Dept. of Revenue in April, 2001.
! County, city, and town levies were modeled under the direction of a joint House/Senate/RevenueDept. working group. The basic methodology employed is a two-year average of levy plus aid. Levyestimates were not adjusted for levy limits, since levy limits are not in effect for pay 2002 undercurrent law. In a few cases, the estimates were changed based upon discussions with individual localgovernment officials. Estimated state aid amounts for pay 2002 were subtracted from levy plus aidto arrive at the estimated levy amounts.
! Special taxing district levies were generally increased by 13%, except for the metro-wide specialtaxing districts, which were modeled based upon individual levy categories and levy limits governingeach category. Metro agency bonded debt levy estimates were provided by metro agency staff.
! The education homestead credit was modeled; the estimated cost of the credit is $409.7 million.
! Fiscal disparities net tax capacities and distribution levies were modeled by the House ResearchDept.
! Tax increment financing (TIF) net tax capacities were assumed to increase at the same rate ineach jurisdiction as the growth in commercial-industrial net tax capacity.
House Research Simulation Report: Property Tax Page iv
House Research Department . 600 State Office Building . St. Paul, MN 55155 . (651) 296-6753
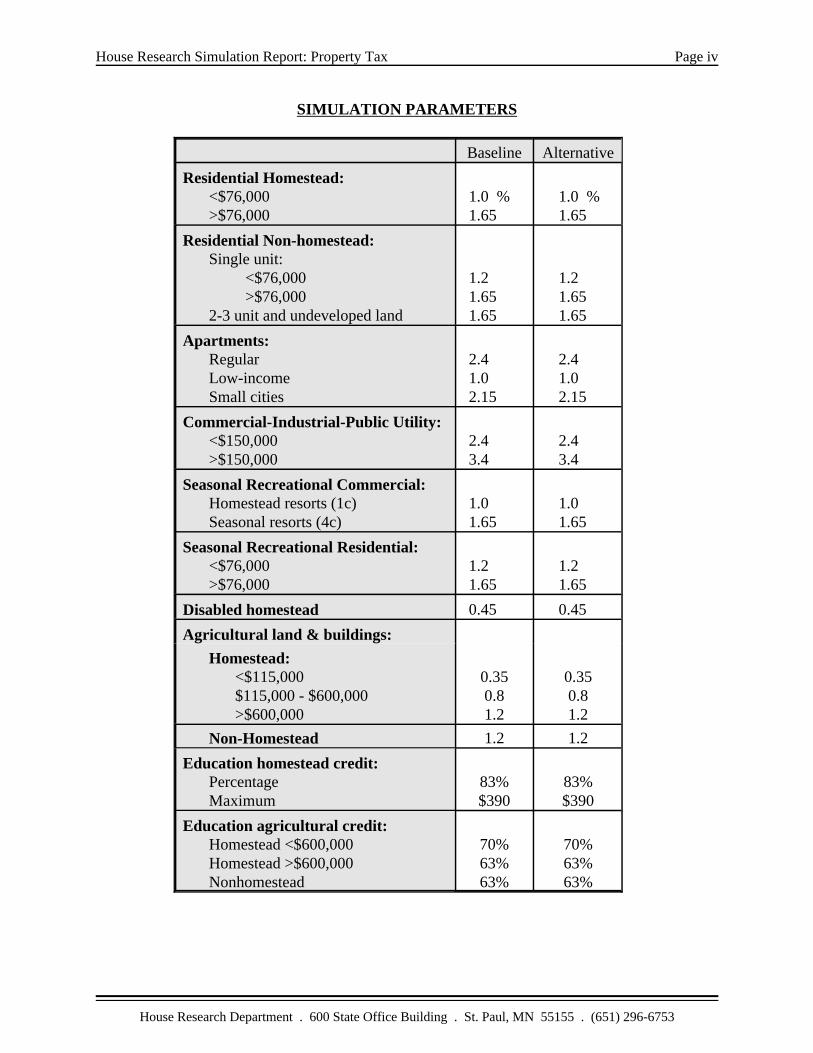
SIMULATION PARAMETERS
Baseline Alternative
Residential Homestead:<$76,000>$76,000
1.0 %1.65
1.0 %1.65
Residential Non-homestead:Single unit:
<$76,000>$76,000
2-3 unit and undeveloped land
1.21.651.65
1.21.651.65
Apartments:RegularLow-incomeSmall cities
2.41.02.15
2.41.02.15
Commercial-Industrial-Public Utility:<$150,000>$150,000
2.43.4
2.43.4
Seasonal Recreational Commercial:Homestead resorts (1c)Seasonal resorts (4c)
1.01.65
1.01.65
Seasonal Recreational Residential:<$76,000>$76,000
1.21.65
1.21.65
Disabled homestead 0.45 0.45
Agricultural land & buildings:
Homestead:<$115,000$115,000 - $600,000>$600,000
0.350.81.2
0.350.81.2
Non-Homestead 1.2 1.2
Education homestead credit:PercentageMaximum
83%$390
83%$390
Education agricultural credit:Homestead <$600,000Homestead >$600,000Nonhomestead
70%63%63%
70%63%63%
House Research Dept. Simulation 1H2 Baseline: Preliminary Pay 2001 Page 1 04/25/2001 12:30 PM Alternative: Proj Pay 2002: Current Law (Revised 4/25) (all figures in $000s)
STATEWIDE
Tax Burdens by Taxable Market Value Net Tax Effective Property Class Pctg Pctg Tax Rates Baseline Alternative Change Chng Baseline Alternative Change Chng Base Alter Res Hmstd 152,957,954 164,428,442 11,470,488 7.5 2,138,460 2,226,932 88,472 4.1 1.40 1.35 Res NonHmstd 1Un 5,965,487 6,363,169 397,682 6.7 104,324 108,291 3,967 3.8 1.75 1.70 Res NonHmstd 2-3 3,050,514 3,191,261 140,746 4.6 65,921 66,452 531 0.8 2.16 2.08 Reg Apartments 8,411,024 9,367,002 955,977 11.4 259,585 275,880 16,295 6.3 3.09 2.95 Low-income Apts 2,144,772 2,389,199 244,427 11.4 30,337 32,756 2,419 8.0 1.41 1.37 Seasonal Rec 8,359,846 8,935,119 575,272 6.9 125,017 131,329 6,312 5.0 1.50 1.47 Com/Ind Lo Tier 7,181,638 7,396,234 214,596 3.0 232,583 232,256 -327 -0.1 3.24 3.14 Com/Ind Hi Tier 34,057,445 36,303,606 2,246,160 6.6 1,499,146 1,532,658 33,512 2.2 4.40 4.22 Publ U: Elec Gen 1,584,178 1,607,941 23,763 1.5 67,588 66,351 -1,237 -1.8 4.27 4.13 Publ U: Other 4,729,631 4,800,575 70,944 1.5 201,568 197,412 -4,156 -2.1 4.26 4.11 Ag Hmstd: House 6,913,853 7,312,910 399,057 5.8 76,045 82,133 6,088 8.0 1.10 1.12 Ag Hmstd: Land 19,640,011 20,449,421 809,410 4.1 121,586 129,428 7,842 6.4 0.62 0.63 Ag NonHmstd 9,654,933 10,002,846 347,913 3.6 114,162 118,817 4,655 4.1 1.18 1.19 New Con: Res Hms 0 4,664,055 4,664,055 0.0 0 66,958 66,958 0.0 0.00 1.44 New Con: Other 0 3,193,736 3,193,736 0.0 0 105,968 105,968 0.0 0.00 3.32
Total 264,651,288 290,405,515 25,754,227 9.7 5,036,322 5,373,620 337,298 6.7 1.90 1.85
Tax Base Tax Rates Pctg Net Tax Cap (Pctg) Ref Mkt Val (mills) Baseline Alternative Change Chng Base Alter Base Alter Total Tax Capacity 4,267,876 4,706,908 439,032 10.3 County 39.46 37.61 0.002 0.00 (-) TIF Tax Capacity 273,698 304,775 31,077 11.4 City/Town 25.05 23.84 0.040 0.08 (-) FD Contrib Tax Capacity 315,394 361,451 46,058 14.6 School District 50.33 47.15 1.289 1.453 (=) Taxable Tax Capacity 3,678,784 4,040,682 361,898 9.8 Special District 4.58 4.68 0.000 0.00
FD Distrib Tax Capacity 315,394 361,451 46,058 14.6 Total 119.43 113.28 1.331 1.535
House Research Dept. Simulation 1H2 Baseline: Preliminary Pay 2001 Page 2 04/25/2001 12:30 PM Alternative: Proj Pay 2002: Current Law (Revised 4/25) (all figures in $000s)
GREATER MINNESOTA
Tax Burdens by Taxable Market Value Net Tax Effective Property Class Pctg Pctg Tax Rates Baseline Alternative Change Chng Baseline Alternative Change Chng Base Alter Res Hmstd 49,317,329 52,371,201 3,053,873 6.2 620,499 660,929 40,430 6.5 1.26 1.26 Res NonHmstd 1Un 2,515,492 2,645,466 129,975 5.2 42,387 44,115 1,728 4.1 1.69 1.67 Res NonHmstd 2-3 988,385 1,027,820 39,434 4.0 21,631 22,112 481 2.2 2.19 2.15 Reg Apartments 1,531,500 1,614,153 82,652 5.4 49,365 50,968 1,603 3.2 3.22 3.16 Low-income Apts 723,464 775,041 51,577 7.1 10,607 11,236 629 5.9 1.47 1.45 Seasonal Rec 8,097,484 8,661,573 564,089 7.0 120,364 126,752 6,387 5.3 1.49 1.46 Com/Ind Lo Tier 3,909,793 4,033,037 123,244 3.2 128,828 130,313 1,485 1.2 3.29 3.23 Com/Ind Hi Tier 6,281,668 6,583,582 301,914 4.8 281,230 287,674 6,445 2.3 4.48 4.37 Publ U: Elec Gen 1,292,058 1,311,439 19,381 1.5 54,886 54,123 -763 -1.4 4.25 4.13 Publ U: Other 2,857,545 2,900,408 42,863 1.5 119,783 118,214 -1,569 -1.3 4.19 4.08 Ag Hmstd: House 6,028,965 6,370,207 341,241 5.7 64,701 70,486 5,785 8.9 1.07 1.11 Ag Hmstd: Land 18,756,644 19,515,823 759,179 4.0 116,908 124,624 7,717 6.6 0.62 0.64 Ag NonHmstd 9,135,255 9,452,478 317,223 3.5 107,771 112,347 4,576 4.2 1.18 1.19 New Con: Res Hms 0 1,690,654 1,690,654 0.0 0 22,164 22,164 0.0 0.00 1.31 New Con: Other 0 1,202,643 1,202,643 0.0 0 34,864 34,864 0.0 0.00 2.90
Total 111,435,583 120,155,525 8,719,942 7.8 1,738,961 1,870,922 131,962 7.6 1.56 1.56
Tax Base Tax Rates Pctg Net Tax Cap (Pctg) Ref Mkt Val (mills) Baseline Alternative Change Chng Base Alter Base Alter Total Tax Capacity 1,522,727 1,651,065 128,338 8.4 County 47.50 46.67 0.005 0.00 (-) TIF Tax Capacity 52,749 57,644 4,895 9.3 City/Town 24.50 24.07 0.008 0.00 (-) FD Contrib Tax Capacity 1,181 1,710 529 44.8 School District 50.01 47.24 0.827 1.084 (=) Taxable Tax Capacity 1,468,796 1,591,711 122,915 8.4 Special District 1.09 1.14 0.000 0.00
FD Distrib Tax Capacity 1,181 1,710 529 44.8 Total 123.11 119.11 0.840 1.095
Tax Burdens on Hypothetical Properties Taxable Market Net Tax Effective Value Pctg Pctg Tax Rates Baseline Alternative Chng Baseline Alternative Change Chng Base Alter Res Hmstd: Lo Val 56,700 60,200 6.2 583 628 45 7.7 1.028 1.043 Res Hmstd: Avg Val 85,000 90,300 6.2 930 1,029 100 10.7 1.093 1.140 Res Hmstd: Hi Val 113,300 120,300 6.2 1,398 1,525 126 9.0 1.234 1.267 Res Hmstd: Ex-Hi Val 170,000 180,500 6.2 2,598 2,767 169 6.5 1.528 1.532 Apartment (Mkt rate) 300,000 316,200 5.4 9,116 9,386 270 3.0 3.038 2.968 Seas Rec: Lo Val 50,000 53,500 7.0 781 823 43 5.5 1.561 1.538 Seas Rec: Hi Val 150,000 160,400 6.9 2,752 2,921 169 6.1 1.834 1.820 Comm/Ind: Lo Val 150,000 157,200 4.8 4,558 4,752 194 4.3 3.038 3.022 Comm/Ind: Med Val 300,000 314,400 4.8 10,962 11,290 328 3.0 3.654 3.591 Comm/Ind: Hi Val 1,000,000 1,048,100 4.8 40,850 41,808 958 2.3 4.084 3.988

House Research Dept. Simulation 1H2 Baseline: Preliminary Pay 2001 Page 3 04/25/2001 12:31 PM Alternative: Proj Pay 2002: Current Law (Revised 4/25) (all figures in $000s)
METRO AREA
Tax Burdens by Taxable Market Value Net Tax Effective Property Class Pctg Pctg Tax Rates Baseline Alternative Change Chng Baseline Alternative Change Chng Base Alter Res Hmstd 103,640,626 112,057,241 8,416,615 8.1 1,517,961 1,566,003 48,041 3.2 1.46 1.40 Res NonHmstd 1Un 3,449,996 3,717,703 267,707 7.8 61,937 64,176 2,239 3.6 1.80 1.73 Res NonHmstd 2-3 2,062,129 2,163,441 101,312 4.9 44,290 44,340 50 0.1 2.15 2.05 Reg Apartments 6,879,524 7,752,849 873,325 12.7 210,220 224,912 14,692 7.0 3.06 2.90 Low-income Apts 1,421,308 1,614,158 192,849 13.6 19,730 21,520 1,790 9.1 1.39 1.33 Seasonal Rec 262,362 273,546 11,184 4.3 4,653 4,577 -76 -1.6 1.77 1.67 Com/Ind Lo Tier 3,271,845 3,363,197 91,352 2.8 103,755 101,943 -1,812 -1.7 3.17 3.03 Com/Ind Hi Tier 27,775,777 29,720,024 1,944,247 7.0 1,217,916 1,244,983 27,067 2.2 4.38 4.19 Publ U: Elec Gen 292,120 296,502 4,382 1.5 12,702 12,228 -474 -3.7 4.35 4.12 Publ U: Other 1,872,086 1,900,167 28,081 1.5 81,785 79,198 -2,587 -3.2 4.37 4.17 Ag Hmstd: House 884,888 942,704 57,816 6.5 11,344 11,647 303 2.7 1.28 1.24 Ag Hmstd: Land 883,367 933,598 50,231 5.7 4,678 4,804 125 2.7 0.53 0.51 Ag NonHmstd 519,678 550,368 30,690 5.9 6,390 6,469 79 1.2 1.23 1.18 New Con: Res Hms 0 2,973,401 2,973,401 0.0 0 44,794 44,794 0.0 0.00 1.51 New Con: Other 0 1,991,094 1,991,094 0.0 0 71,104 71,104 0.0 0.00 3.57
Total 153,215,705 170,249,990 17,034,285 11.1 3,297,361 3,502,698 205,336 6.2 2.15 2.06
Tax Base Tax Rates Pctg Net Tax Cap (Pctg) Ref Mkt Val (mills) Baseline Alternative Change Chng Base Alter Base Alter Total Tax Capacity 2,745,149 3,055,843 310,694 11.3 County 34.11 31.72 0.000 0.00 (-) TIF Tax Capacity 220,948 247,131 26,182 11.8 City/Town 25.42 23.69 0.062 0.12 (-) FD Contrib Tax Capacity 314,212 359,741 45,529 14.5 School District 50.55 47.10 1.604 1.698 (=) Taxable Tax Capacity 2,209,988 2,448,971 238,983 10.8 Special District 6.91 6.98 0.000 0.00
FD Distrib Tax Capacity 314,212 359,741 45,529 14.5 Total 116.99 109.49 1.666 1.828
Tax Burdens on Hypothetical Properties Taxable Market Net Tax Effective Value Pctg Pctg Tax Rates Baseline Alternative Chng Baseline Alternative Change Chng Base Alter Res Hmstd: Lo Val 96,100 103,900 8.1 1,143 1,226 83 7.3 1.189 1.180 Res Hmstd: Avg Val 144,000 155,700 8.1 2,052 2,167 115 5.6 1.424 1.391 Res Hmstd: Hi Val 192,000 207,600 8.1 3,058 3,199 141 4.6 1.592 1.540 Res Hmstd: Ex-Hi Val 288,000 311,400 8.1 5,071 5,264 193 3.8 1.760 1.690 Apartment (Mkt rate) 300,000 338,100 12.7 8,923 9,502 579 6.5 2.974 2.810 Comm/Ind: Lo Val 150,000 160,500 7.0 4,462 4,626 164 3.7 2.974 2.882 Comm/Ind: Med Val 300,000 321,000 7.0 10,678 10,895 216 2.0 3.559 3.393 Comm/Ind: Hi Val 1,000,000 1,070,000 7.0 39,689 40,148 459 1.2 3.968 3.752
House Research Dept. Simulation 1H2 Baseline: Preliminary Pay 2001 Page 4 04/25/2001 12:31 PM Alternative: Proj Pay 2002: Current Law (Revised 4/25) (all figures in $000s)
NORTHWEST CITIES
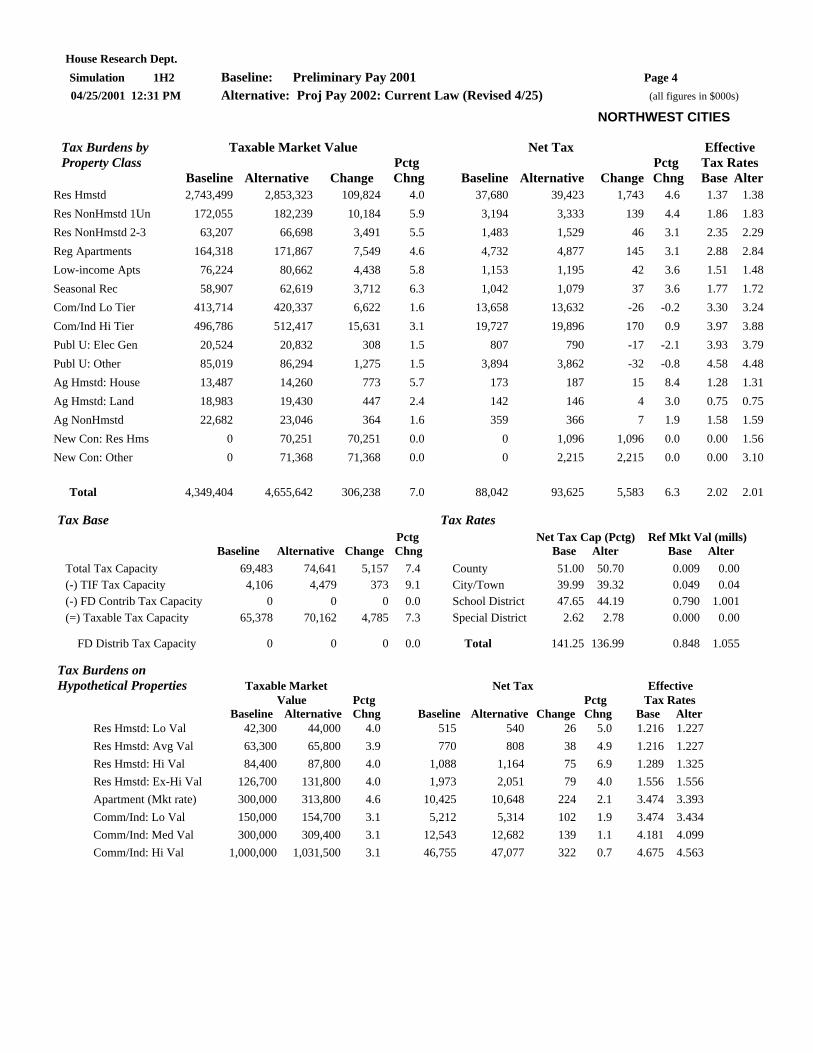
Tax Burdens by Taxable Market Value Net Tax Effective Property Class Pctg Pctg Tax Rates Baseline Alternative Change Chng Baseline Alternative Change Chng Base Alter Res Hmstd 2,743,499 2,853,323 109,824 4.0 37,680 39,423 1,743 4.6 1.37 1.38 Res NonHmstd 1Un 172,055 182,239 10,184 5.9 3,194 3,333 139 4.4 1.86 1.83 Res NonHmstd 2-3 63,207 66,698 3,491 5.5 1,483 1,529 46 3.1 2.35 2.29 Reg Apartments 164,318 171,867 7,549 4.6 4,732 4,877 145 3.1 2.88 2.84 Low-income Apts 76,224 80,662 4,438 5.8 1,153 1,195 42 3.6 1.51 1.48 Seasonal Rec 58,907 62,619 3,712 6.3 1,042 1,079 37 3.6 1.77 1.72 Com/Ind Lo Tier 413,714 420,337 6,622 1.6 13,658 13,632 -26 -0.2 3.30 3.24 Com/Ind Hi Tier 496,786 512,417 15,631 3.1 19,727 19,896 170 0.9 3.97 3.88 Publ U: Elec Gen 20,524 20,832 308 1.5 807 790 -17 -2.1 3.93 3.79 Publ U: Other 85,019 86,294 1,275 1.5 3,894 3,862 -32 -0.8 4.58 4.48 Ag Hmstd: House 13,487 14,260 773 5.7 173 187 15 8.4 1.28 1.31 Ag Hmstd: Land 18,983 19,430 447 2.4 142 146 4 3.0 0.75 0.75 Ag NonHmstd 22,682 23,046 364 1.6 359 366 7 1.9 1.58 1.59 New Con: Res Hms 0 70,251 70,251 0.0 0 1,096 1,096 0.0 0.00 1.56 New Con: Other 0 71,368 71,368 0.0 0 2,215 2,215 0.0 0.00 3.10
Total 4,349,404 4,655,642 306,238 7.0 88,042 93,625 5,583 6.3 2.02 2.01
Tax Base Tax Rates Pctg Net Tax Cap (Pctg) Ref Mkt Val (mills) Baseline Alternative Change Chng Base Alter Base Alter Total Tax Capacity 69,483 74,641 5,157 7.4 County 51.00 50.70 0.009 0.00 (-) TIF Tax Capacity 4,106 4,479 373 9.1 City/Town 39.99 39.32 0.049 0.04 (-) FD Contrib Tax Capacity 0 0 0 0.0 School District 47.65 44.19 0.790 1.001 (=) Taxable Tax Capacity 65,378 70,162 4,785 7.3 Special District 2.62 2.78 0.000 0.00
FD Distrib Tax Capacity 0 0 0 0.0 Total 141.25 136.99 0.848 1.055
Tax Burdens on Hypothetical Properties Taxable Market Net Tax Effective Value Pctg Pctg Tax Rates Baseline Alternative Chng Baseline Alternative Change Chng Base Alter Res Hmstd: Lo Val 42,300 44,000 4.0 515 540 26 5.0 1.216 1.227 Res Hmstd: Avg Val 63,300 65,800 3.9 770 808 38 4.9 1.216 1.227 Res Hmstd: Hi Val 84,400 87,800 4.0 1,088 1,164 75 6.9 1.289 1.325 Res Hmstd: Ex-Hi Val 126,700 131,800 4.0 1,973 2,051 79 4.0 1.556 1.556 Apartment (Mkt rate) 300,000 313,800 4.6 10,425 10,648 224 2.1 3.474 3.393 Comm/Ind: Lo Val 150,000 154,700 3.1 5,212 5,314 102 1.9 3.474 3.434 Comm/Ind: Med Val 300,000 309,400 3.1 12,543 12,682 139 1.1 4.181 4.099 Comm/Ind: Hi Val 1,000,000 1,031,500 3.1 46,755 47,077 322 0.7 4.675 4.563
House Research Dept. Simulation 1H2 Baseline: Preliminary Pay 2001 Page 5 04/25/2001 12:31 PM Alternative: Proj Pay 2002: Current Law (Revised 4/25) (all figures in $000s)
NORTHWEST TOWNS
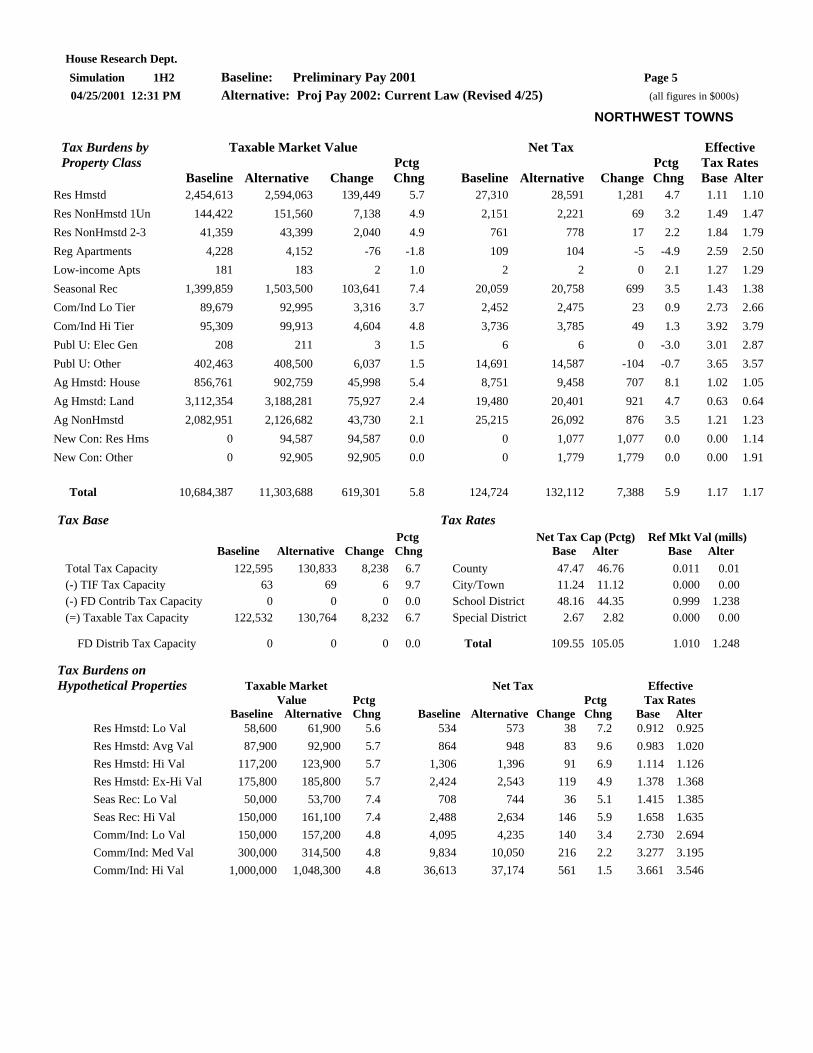
Tax Burdens by Taxable Market Value Net Tax Effective Property Class Pctg Pctg Tax Rates Baseline Alternative Change Chng Baseline Alternative Change Chng Base Alter Res Hmstd 2,454,613 2,594,063 139,449 5.7 27,310 28,591 1,281 4.7 1.11 1.10 Res NonHmstd 1Un 144,422 151,560 7,138 4.9 2,151 2,221 69 3.2 1.49 1.47 Res NonHmstd 2-3 41,359 43,399 2,040 4.9 761 778 17 2.2 1.84 1.79 Reg Apartments 4,228 4,152 -76 -1.8 109 104 -5 -4.9 2.59 2.50 Low-income Apts 181 183 2 1.0 2 2 0 2.1 1.27 1.29 Seasonal Rec 1,399,859 1,503,500 103,641 7.4 20,059 20,758 699 3.5 1.43 1.38 Com/Ind Lo Tier 89,679 92,995 3,316 3.7 2,452 2,475 23 0.9 2.73 2.66 Com/Ind Hi Tier 95,309 99,913 4,604 4.8 3,736 3,785 49 1.3 3.92 3.79 Publ U: Elec Gen 208 211 3 1.5 6 6 0 -3.0 3.01 2.87 Publ U: Other 402,463 408,500 6,037 1.5 14,691 14,587 -104 -0.7 3.65 3.57 Ag Hmstd: House 856,761 902,759 45,998 5.4 8,751 9,458 707 8.1 1.02 1.05 Ag Hmstd: Land 3,112,354 3,188,281 75,927 2.4 19,480 20,401 921 4.7 0.63 0.64 Ag NonHmstd 2,082,951 2,126,682 43,730 2.1 25,215 26,092 876 3.5 1.21 1.23 New Con: Res Hms 0 94,587 94,587 0.0 0 1,077 1,077 0.0 0.00 1.14 New Con: Other 0 92,905 92,905 0.0 0 1,779 1,779 0.0 0.00 1.91
Total 10,684,387 11,303,688 619,301 5.8 124,724 132,112 7,388 5.9 1.17 1.17
Tax Base Tax Rates Pctg Net Tax Cap (Pctg) Ref Mkt Val (mills) Baseline Alternative Change Chng Base Alter Base Alter Total Tax Capacity 122,595 130,833 8,238 6.7 County 47.47 46.76 0.011 0.01 (-) TIF Tax Capacity 63 69 6 9.7 City/Town 11.24 11.12 0.000 0.00 (-) FD Contrib Tax Capacity 0 0 0 0.0 School District 48.16 44.35 0.999 1.238 (=) Taxable Tax Capacity 122,532 130,764 8,232 6.7 Special District 2.67 2.82 0.000 0.00
FD Distrib Tax Capacity 0 0 0 0.0 Total 109.55 105.05 1.010 1.248
Tax Burdens on Hypothetical Properties Taxable Market Net Tax Effective Value Pctg Pctg Tax Rates Baseline Alternative Chng Baseline Alternative Change Chng Base Alter Res Hmstd: Lo Val 58,600 61,900 5.6 534 573 38 7.2 0.912 0.925 Res Hmstd: Avg Val 87,900 92,900 5.7 864 948 83 9.6 0.983 1.020 Res Hmstd: Hi Val 117,200 123,900 5.7 1,306 1,396 91 6.9 1.114 1.126 Res Hmstd: Ex-Hi Val 175,800 185,800 5.7 2,424 2,543 119 4.9 1.378 1.368 Seas Rec: Lo Val 50,000 53,700 7.4 708 744 36 5.1 1.415 1.385 Seas Rec: Hi Val 150,000 161,100 7.4 2,488 2,634 146 5.9 1.658 1.635 Comm/Ind: Lo Val 150,000 157,200 4.8 4,095 4,235 140 3.4 2.730 2.694 Comm/Ind: Med Val 300,000 314,500 4.8 9,834 10,050 216 2.2 3.277 3.195 Comm/Ind: Hi Val 1,000,000 1,048,300 4.8 36,613 37,174 561 1.5 3.661 3.546

House Research Dept. Simulation 1H2 Baseline: Preliminary Pay 2001 Page 6 04/25/2001 12:31 PM Alternative: Proj Pay 2002: Current Law (Revised 4/25) (all figures in $000s)
NORTH CENTRAL CITIES
Tax Burdens by Taxable Market Value Net Tax Effective Property Class Pctg Pctg Tax Rates Baseline Alternative Change Chng Baseline Alternative Change Chng Base Alter Res Hmstd 1,768,965 1,851,884 82,919 4.7 21,815 22,771 956 4.4 1.23 1.23 Res NonHmstd 1Un 131,645 139,635 7,990 6.1 2,228 2,315 87 3.9 1.69 1.66 Res NonHmstd 2-3 56,980 59,670 2,690 4.7 1,265 1,297 32 2.5 2.22 2.17 Reg Apartments 70,590 72,756 2,166 3.1 2,387 2,403 16 0.7 3.38 3.30 Low-income Apts 53,979 56,211 2,232 4.1 830 858 28 3.3 1.54 1.53 Seasonal Rec 739,983 793,482 53,499 7.2 10,408 10,975 567 5.4 1.41 1.38 Com/Ind Lo Tier 339,888 359,243 19,356 5.7 11,301 11,591 289 2.6 3.33 3.23 Com/Ind Hi Tier 454,547 488,425 33,878 7.5 19,948 20,865 917 4.6 4.39 4.27 Publ U: Elec Gen 1,249 1,268 19 1.5 66 68 2 2.9 5.27 5.34 Publ U: Other 62,918 63,861 944 1.5 3,083 3,080 -3 -0.1 4.90 4.82 Ag Hmstd: House 14,517 15,146 629 4.3 170 180 11 6.3 1.17 1.19 Ag Hmstd: Land 15,305 16,244 939 6.1 71 77 6 8.1 0.47 0.47 Ag NonHmstd 15,788 16,827 1,039 6.6 174 184 10 5.8 1.10 1.10 New Con: Res Hms 0 52,078 52,078 0.0 0 646 646 0.0 0.00 1.24 New Con: Other 0 95,326 95,326 0.0 0 3,035 3,035 0.0 0.00 3.18
Total 3,726,353 4,082,056 355,703 9.5 73,746 80,343 6,598 8.9 1.98 1.97
Tax Base Tax Rates Pctg Net Tax Cap (Pctg) Ref Mkt Val (mills) Baseline Alternative Change Chng Base Alter Base Alter Total Tax Capacity 61,747 68,433 6,686 10.8 County 43.80 42.94 0.000 0.00 (-) TIF Tax Capacity 2,737 3,114 377 13.8 City/Town 31.89 31.56 0.038 0.03 (-) FD Contrib Tax Capacity 0 0 0 0.0 School District 47.62 44.87 0.435 0.623 (=) Taxable Tax Capacity 59,010 65,319 6,309 10.7 Special District 0.54 0.56 0.000 0.00
FD Distrib Tax Capacity 0 0 0 0.0 Total 123.86 119.93 0.473 0.658
Tax Burdens on Hypothetical Properties Taxable Market Net Tax Effective Value Pctg Pctg Tax Rates Baseline Alternative Chng Baseline Alternative Change Chng Base Alter Res Hmstd: Lo Val 46,600 48,800 4.7 464 488 24 5.1 0.996 1.000 Res Hmstd: Avg Val 69,900 73,200 4.7 697 732 36 5.1 0.996 1.000 Res Hmstd: Hi Val 93,200 97,600 4.7 1,035 1,107 72 7.0 1.110 1.134 Res Hmstd: Ex-Hi Val 139,800 146,400 4.7 1,921 2,011 90 4.7 1.374 1.373 Apartment (Mkt rate) 300,000 309,200 3.1 9,060 9,103 43 0.5 3.019 2.944 Comm/Ind: Lo Val 150,000 161,200 7.5 4,530 4,880 350 7.7 3.019 3.027 Comm/Ind: Med Val 300,000 322,400 7.5 10,918 11,559 642 5.9 3.639 3.585 Comm/Ind: Hi Val 1,000,000 1,074,500 7.5 40,727 42,722 1,995 4.9 4.072 3.976

House Research Dept. Simulation 1H2 Baseline: Preliminary Pay 2001 Page 7 04/25/2001 12:31 PM Alternative: Proj Pay 2002: Current Law (Revised 4/25) (all figures in $000s)
NORTH CENTRAL TOWNS
Tax Burdens by Taxable Market Value Net Tax Effective Property Class Pctg Pctg Tax Rates Baseline Alternative Change Chng Baseline Alternative Change Chng Base Alter Res Hmstd 2,872,931 3,053,552 180,621 6.3 32,176 34,104 1,928 6.0 1.12 1.12 Res NonHmstd 1Un 154,989 163,114 8,125 5.2 2,368 2,450 82 3.5 1.53 1.50 Res NonHmstd 2-3 37,226 39,033 1,807 4.9 738 761 23 3.2 1.98 1.95 Reg Apartments 4,529 4,428 -101 -2.2 127 123 -3 -2.7 2.80 2.79 Low-income Apts 768 777 8 1.1 11 10 -1 -7.4 1.38 1.26 Seasonal Rec 2,175,109 2,330,492 155,384 7.1 30,078 31,691 1,613 5.4 1.38 1.36 Com/Ind Lo Tier 116,840 122,902 6,062 5.2 3,198 3,291 93 2.9 2.74 2.68 Com/Ind Hi Tier 81,098 86,515 5,417 6.7 3,152 3,287 135 4.3 3.89 3.80 Publ U: Elec Gen 5,298 5,378 79 1.5 276 266 -10 -3.5 5.20 4.94 Publ U: Other 301,478 306,000 4,522 1.5 12,933 12,738 -195 -1.5 4.29 4.16 Ag Hmstd: House 571,376 611,350 39,974 7.0 6,626 7,246 620 9.4 1.16 1.19 Ag Hmstd: Land 886,813 940,366 53,553 6.0 4,501 4,864 363 8.1 0.51 0.52 Ag NonHmstd 333,213 357,046 23,833 7.2 4,339 4,596 256 5.9 1.30 1.29 New Con: Res Hms 0 117,559 117,559 0.0 0 1,387 1,387 0.0 0.00 1.18 New Con: Other 0 92,473 92,473 0.0 0 1,623 1,623 0.0 0.00 1.76
Total 7,541,668 8,230,985 689,317 9.1 100,521 108,436 7,915 7.9 1.33 1.32
Tax Base Tax Rates Pctg Net Tax Cap (Pctg) Ref Mkt Val (mills) Baseline Alternative Change Chng Base Alter Base Alter Total Tax Capacity 95,208 104,288 9,080 9.5 County 49.81 48.59 0.000 0.00 (-) TIF Tax Capacity 21 22 1 4.9 City/Town 13.09 12.86 0.010 0.00 (-) FD Contrib Tax Capacity 0 12 12 0.0 School District 51.20 48.91 0.400 0.578 (=) Taxable Tax Capacity 95,187 104,254 9,068 9.5 Special District 0.43 0.44 0.000 0.00
FD Distrib Tax Capacity 0 0 0 44.8 Total 114.54 110.80 0.410 0.588
Tax Burdens on Hypothetical Properties Taxable Market Net Tax Effective Value Pctg Pctg Tax Rates Baseline Alternative Chng Baseline Alternative Change Chng Base Alter Res Hmstd: Lo Val 58,500 62,200 6.3 522 557 35 6.7 0.892 0.895 Res Hmstd: Avg Val 87,700 93,200 6.3 847 928 81 9.5 0.965 0.995 Res Hmstd: Hi Val 116,900 124,200 6.2 1,301 1,406 105 8.1 1.113 1.132 Res Hmstd: Ex-Hi Val 175,400 186,400 6.3 2,431 2,580 149 6.1 1.385 1.384 Seas Rec: Lo Val 50,000 53,600 7.2 708 744 36 5.1 1.415 1.388 Seas Rec: Hi Val 150,000 160,700 7.1 2,505 2,653 149 5.9 1.669 1.651 Comm/Ind: Lo Val 150,000 160,000 6.7 4,185 4,460 275 6.6 2.789 2.787 Comm/Ind: Med Val 300,000 320,000 6.7 10,088 10,581 493 4.9 3.362 3.306 Comm/Ind: Hi Val 1,000,000 1,066,800 6.7 37,635 39,153 1,518 4.0 3.763 3.670

House Research Dept. Simulation 1H2 Baseline: Preliminary Pay 2001 Page 8 04/25/2001 12:31 PM Alternative: Proj Pay 2002: Current Law (Revised 4/25) (all figures in $000s)
TACONITE CITIES
Tax Burdens by Taxable Market Value Net Tax Effective Property Class Pctg Pctg Tax Rates Baseline Alternative Change Chng Baseline Alternative Change Chng Base Alter Res Hmstd 1,505,697 1,590,753 85,056 5.6 12,861 14,276 1,415 11.0 0.85 0.90 Res NonHmstd 1Un 88,032 94,615 6,584 7.5 1,695 1,822 127 7.5 1.92 1.93 Res NonHmstd 2-3 29,674 30,982 1,309 4.4 754 782 28 3.7 2.54 2.53 Reg Apartments 44,939 46,606 1,667 3.7 1,608 1,657 49 3.1 3.58 3.55 Low-income Apts 47,615 50,210 2,595 5.5 750 790 40 5.4 1.57 1.57 Seasonal Rec 101,990 108,868 6,878 6.7 1,823 1,931 109 6.0 1.79 1.77 Com/Ind Lo Tier 217,880 226,791 8,911 4.1 8,074 8,307 233 2.9 3.71 3.66 Com/Ind Hi Tier 219,283 230,982 11,699 5.3 11,236 11,673 437 3.9 5.12 5.05 Publ U: Elec Gen 201,194 204,212 3,018 1.5 8,480 8,379 -102 -1.2 4.21 4.10 Publ U: Other 111,457 113,128 1,672 1.5 5,142 5,143 1 0.0 4.61 4.55 Ag Hmstd: House 3,634 3,646 12 0.3 34 35 1 2.5 0.94 0.96 Ag Hmstd: Land 2,317 2,491 174 7.5 7 8 1 11.1 0.31 0.32 Ag NonHmstd 23,439 25,132 1,693 7.2 375 423 49 13.0 1.60 1.68 New Con: Res Hms 0 20,743 20,743 0.0 0 219 219 0.0 0.00 1.06 New Con: Other 0 22,979 22,979 0.0 0 861 861 0.0 0.00 3.75
Total 2,597,149 2,772,138 174,989 6.7 52,839 56,308 3,469 6.6 2.03 2.03
Tax Base Tax Rates Pctg Net Tax Cap (Pctg) Ref Mkt Val (mills) Baseline Alternative Change Chng Base Alter Base Alter Total Tax Capacity 44,173 47,023 2,851 6.5 County 55.11 54.38 0.000 0.00 (-) TIF Tax Capacity 2,272 2,554 282 12.4 City/Town 50.23 51.05 0.038 0.03 (-) FD Contrib Tax Capacity 688 1,021 333 48.4 School District 36.39 33.51 0.684 0.938 (=) Taxable Tax Capacity 41,213 43,448 2,235 5.4 Special District 1.41 1.47 0.000 0.00
FD Distrib Tax Capacity 845 1,223 378 44.8 Total 143.14 140.41 0.722 0.974
Tax Burdens on Hypothetical Properties Taxable Market Net Tax Effective Value Pctg Pctg Tax Rates Baseline Alternative Chng Baseline Alternative Change Chng Base Alter Res Hmstd: Lo Val 36,200 38,200 5.5 189 203 14 7.5 0.520 0.530 Res Hmstd: Avg Val 54,300 57,400 5.7 368 419 51 14.0 0.677 0.730 Res Hmstd: Hi Val 72,400 76,500 5.7 587 659 72 12.2 0.810 0.860 Res Hmstd: Ex-Hi Val 108,600 114,700 5.6 1,267 1,412 145 11.5 1.166 1.231 Apartment (Mkt rate) 300,000 311,100 3.7 10,523 10,787 264 2.5 3.507 3.467 Comm/Ind: Lo Val 150,000 158,000 5.3 5,261 5,591 329 6.3 3.507 3.538 Comm/Ind: Med Val 300,000 316,000 5.3 12,670 13,287 618 4.9 4.223 4.204 Comm/Ind: Hi Val 1,000,000 1,053,400 5.3 47,243 49,209 1,966 4.2 4.724 4.671

House Research Dept. Simulation 1H2 Baseline: Preliminary Pay 2001 Page 9 04/25/2001 12:31 PM Alternative: Proj Pay 2002: Current Law (Revised 4/25) (all figures in $000s)
TACONITE TOWNS
Tax Burdens by Taxable Market Value Net Tax Effective Property Class Pctg Pctg Tax Rates Baseline Alternative Change Chng Baseline Alternative Change Chng Base Alter Res Hmstd 2,343,896 2,498,285 154,389 6.6 20,223 22,044 1,821 9.0 0.86 0.88 Res NonHmstd 1Un 87,246 91,720 4,473 5.1 1,351 1,391 39 2.9 1.55 1.52 Res NonHmstd 2-3 15,072 15,532 461 3.1 274 279 5 1.7 1.82 1.79 Reg Apartments 2,134 1,904 -230 -10.8 59 53 -7 -11.0 2.79 2.78 Low-income Apts 225 0 -225 -100.0 2 0 -2 -100. 1.10 0.00 0 Seasonal Rec 1,935,173 2,079,701 144,529 7.5 28,849 30,528 1,680 5.8 1.49 1.47 Com/Ind Lo Tier 53,216 56,235 3,018 5.7 1,553 1,624 71 4.6 2.92 2.89 Com/Ind Hi Tier 89,132 92,994 3,862 4.3 3,767 3,838 71 1.9 4.23 4.13 Publ U: Elec Gen 163 165 2 1.5 6 6 0 -2.6 3.64 3.49 Publ U: Other 233,813 237,320 3,507 1.5 10,027 9,807 -220 -2.2 4.29 4.13 Ag Hmstd: House 112,442 118,846 6,404 5.7 712 829 117 16.4 0.63 0.70 Ag Hmstd: Land 115,231 121,708 6,477 5.6 276 322 46 16.5 0.24 0.26 Ag NonHmstd 222,075 240,065 17,991 8.1 2,706 2,946 240 8.9 1.22 1.23 New Con: Res Hms 0 60,014 60,014 0.0 0 516 516 0.0 0.00 0.86 New Con: Other 0 63,779 63,779 0.0 0 1,043 1,043 0.0 0.00 1.63
Total 5,209,818 5,678,267 468,450 9.0 69,806 75,225 5,419 7.8 1.34 1.32
Tax Base Tax Rates Pctg Net Tax Cap (Pctg) Ref Mkt Val (mills) Baseline Alternative Change Chng Base Alter Base Alter Total Tax Capacity 71,182 77,496 6,313 8.9 County 59.09 58.26 0.000 0.00 (-) TIF Tax Capacity 510 563 53 10.4 City/Town 13.90 13.77 0.000 0.00 (-) FD Contrib Tax Capacity 493 677 184 37.4 School District 39.40 36.18 0.624 0.877 (=) Taxable Tax Capacity 70,180 76,256 6,076 8.7 Special District 2.51 2.62 0.000 0.00
FD Distrib Tax Capacity 336 487 151 44.8 Total 114.90 110.84 0.624 0.877
Tax Burdens on Hypothetical Properties Taxable Market Net Tax Effective Value Pctg Pctg Tax Rates Baseline Alternative Chng Baseline Alternative Change Chng Base Alter Res Hmstd: Lo Val 58,800 62,700 6.6 217 258 41 19.0 0.369 0.412 Res Hmstd: Avg Val 88,100 93,900 6.6 549 640 91 16.7 0.622 0.681 Res Hmstd: Hi Val 117,500 125,200 6.6 1,028 1,147 119 11.5 0.875 0.915 Res Hmstd: Ex-Hi Val 176,300 187,900 6.6 2,180 2,348 169 7.7 1.236 1.249 Seas Rec: Lo Val 50,000 53,700 7.4 721 761 41 5.7 1.441 1.417 Seas Rec: Hi Val 150,000 161,200 7.5 2,544 2,710 166 6.5 1.696 1.681 Comm/Ind: Lo Val 150,000 156,500 4.3 4,230 4,372 142 3.4 2.819 2.793 Comm/Ind: Med Val 300,000 313,000 4.3 10,183 10,407 224 2.2 3.394 3.325 Comm/Ind: Hi Val 1,000,000 1,043,300 4.3 37,966 38,569 603 1.6 3.796 3.696
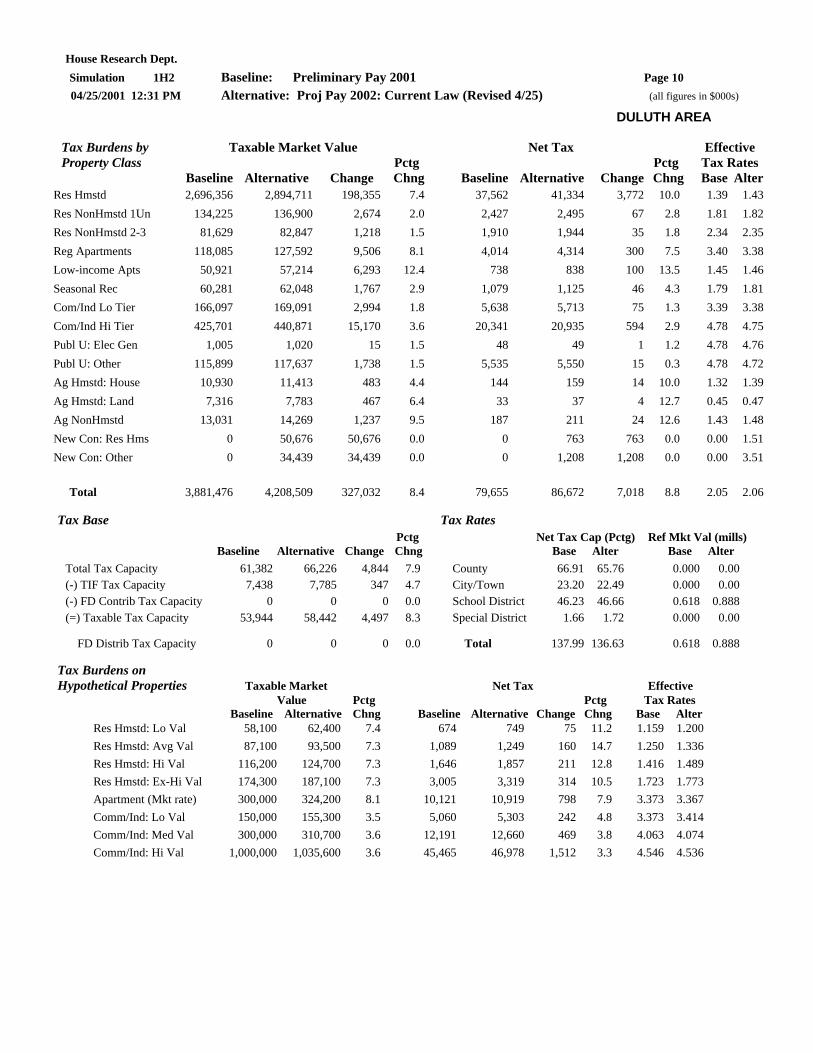
House Research Dept. Simulation 1H2 Baseline: Preliminary Pay 2001 Page 10 04/25/2001 12:31 PM Alternative: Proj Pay 2002: Current Law (Revised 4/25) (all figures in $000s)
DULUTH AREA
Tax Burdens by Taxable Market Value Net Tax Effective Property Class Pctg Pctg Tax Rates Baseline Alternative Change Chng Baseline Alternative Change Chng Base Alter Res Hmstd 2,696,356 2,894,711 198,355 7.4 37,562 41,334 3,772 10.0 1.39 1.43 Res NonHmstd 1Un 134,225 136,900 2,674 2.0 2,427 2,495 67 2.8 1.81 1.82 Res NonHmstd 2-3 81,629 82,847 1,218 1.5 1,910 1,944 35 1.8 2.34 2.35 Reg Apartments 118,085 127,592 9,506 8.1 4,014 4,314 300 7.5 3.40 3.38 Low-income Apts 50,921 57,214 6,293 12.4 738 838 100 13.5 1.45 1.46 Seasonal Rec 60,281 62,048 1,767 2.9 1,079 1,125 46 4.3 1.79 1.81 Com/Ind Lo Tier 166,097 169,091 2,994 1.8 5,638 5,713 75 1.3 3.39 3.38 Com/Ind Hi Tier 425,701 440,871 15,170 3.6 20,341 20,935 594 2.9 4.78 4.75 Publ U: Elec Gen 1,005 1,020 15 1.5 48 49 1 1.2 4.78 4.76 Publ U: Other 115,899 117,637 1,738 1.5 5,535 5,550 15 0.3 4.78 4.72 Ag Hmstd: House 10,930 11,413 483 4.4 144 159 14 10.0 1.32 1.39 Ag Hmstd: Land 7,316 7,783 467 6.4 33 37 4 12.7 0.45 0.47 Ag NonHmstd 13,031 14,269 1,237 9.5 187 211 24 12.6 1.43 1.48 New Con: Res Hms 0 50,676 50,676 0.0 0 763 763 0.0 0.00 1.51 New Con: Other 0 34,439 34,439 0.0 0 1,208 1,208 0.0 0.00 3.51
Total 3,881,476 4,208,509 327,032 8.4 79,655 86,672 7,018 8.8 2.05 2.06
Tax Base Tax Rates Pctg Net Tax Cap (Pctg) Ref Mkt Val (mills) Baseline Alternative Change Chng Base Alter Base Alter Total Tax Capacity 61,382 66,226 4,844 7.9 County 66.91 65.76 0.000 0.00 (-) TIF Tax Capacity 7,438 7,785 347 4.7 City/Town 23.20 22.49 0.000 0.00 (-) FD Contrib Tax Capacity 0 0 0 0.0 School District 46.23 46.66 0.618 0.888 (=) Taxable Tax Capacity 53,944 58,442 4,497 8.3 Special District 1.66 1.72 0.000 0.00
FD Distrib Tax Capacity 0 0 0 0.0 Total 137.99 136.63 0.618 0.888
Tax Burdens on Hypothetical Properties Taxable Market Net Tax Effective Value Pctg Pctg Tax Rates Baseline Alternative Chng Baseline Alternative Change Chng Base Alter Res Hmstd: Lo Val 58,100 62,400 7.4 674 749 75 11.2 1.159 1.200 Res Hmstd: Avg Val 87,100 93,500 7.3 1,089 1,249 160 14.7 1.250 1.336 Res Hmstd: Hi Val 116,200 124,700 7.3 1,646 1,857 211 12.8 1.416 1.489 Res Hmstd: Ex-Hi Val 174,300 187,100 7.3 3,005 3,319 314 10.5 1.723 1.773 Apartment (Mkt rate) 300,000 324,200 8.1 10,121 10,919 798 7.9 3.373 3.367 Comm/Ind: Lo Val 150,000 155,300 3.5 5,060 5,303 242 4.8 3.373 3.414 Comm/Ind: Med Val 300,000 310,700 3.6 12,191 12,660 469 3.8 4.063 4.074 Comm/Ind: Hi Val 1,000,000 1,035,600 3.6 45,465 46,978 1,512 3.3 4.546 4.536

House Research Dept. Simulation 1H2 Baseline: Preliminary Pay 2001 Page 11 04/25/2001 12:31 PM Alternative: Proj Pay 2002: Current Law (Revised 4/25) (all figures in $000s)
EAST CENTRAL CITIES
Tax Burdens by Taxable Market Value Net Tax Effective Property Class Pctg Pctg Tax Rates Baseline Alternative Change Chng Baseline Alternative Change Chng Base Alter Res Hmstd 1,552,576 1,653,532 100,956 6.5 22,458 23,752 1,294 5.8 1.45 1.44 Res NonHmstd 1Un 90,166 96,628 6,462 7.2 1,754 1,855 102 5.8 1.94 1.92 Res NonHmstd 2-3 39,480 41,984 2,504 6.3 980 1,022 41 4.2 2.48 2.43 Reg Apartments 51,470 54,268 2,797 5.4 1,867 1,914 47 2.5 3.63 3.53 Low-income Apts 56,619 60,990 4,372 7.7 912 967 55 6.0 1.61 1.58 Seasonal Rec 36,912 38,136 1,225 3.3 793 824 30 3.8 2.15 2.16 Com/Ind Lo Tier 197,293 208,225 10,932 5.5 7,373 7,604 231 3.1 3.74 3.65 Com/Ind Hi Tier 266,167 283,880 17,713 6.7 13,698 14,235 537 3.9 5.15 5.01 Publ U: Elec Gen 1,872 1,900 28 1.5 86 88 2 2.0 4.59 4.61 Publ U: Other 64,473 65,440 967 1.5 3,252 3,232 -20 -0.6 5.04 4.94 Ag Hmstd: House 42,499 44,736 2,237 5.3 551 588 38 6.9 1.30 1.32 Ag Hmstd: Land 31,504 33,891 2,387 7.6 154 171 17 10.7 0.49 0.50 Ag NonHmstd 15,927 17,005 1,078 6.8 233 248 15 6.6 1.46 1.46 New Con: Res Hms 0 73,043 73,043 0.0 0 1,092 1,092 0.0 0.00 1.50 New Con: Other 0 44,383 44,383 0.0 0 1,433 1,433 0.0 0.00 3.23
Total 2,446,957 2,718,041 271,085 11.1 54,111 59,025 4,913 9.1 2.21 2.17
Tax Base Tax Rates Pctg Net Tax Cap (Pctg) Ref Mkt Val (mills) Baseline Alternative Change Chng Base Alter Base Alter Total Tax Capacity 38,630 42,912 4,282 11.1 County 58.47 55.98 0.015 0.01 (-) TIF Tax Capacity 2,338 2,552 214 9.1 City/Town 38.29 36.55 0.000 0.00 (-) FD Contrib Tax Capacity 0 0 0 0.0 School District 50.78 50.25 0.608 0.851 (=) Taxable Tax Capacity 36,292 40,361 4,069 11.2 Special District 0.69 0.69 0.000 0.00
FD Distrib Tax Capacity 0 0 0 0.0 Total 148.23 143.46 0.623 0.865
Tax Burdens on Hypothetical Properties Taxable Market Net Tax Effective Value Pctg Pctg Tax Rates Baseline Alternative Chng Baseline Alternative Change Chng Base Alter Res Hmstd: Lo Val 55,600 59,200 6.5 698 742 44 6.3 1.256 1.253 Res Hmstd: Avg Val 83,300 88,700 6.5 1,103 1,209 105 9.6 1.324 1.362 Res Hmstd: Hi Val 111,000 118,200 6.5 1,666 1,802 136 8.2 1.500 1.524 Res Hmstd: Ex-Hi Val 166,600 177,400 6.5 3,056 3,254 198 6.5 1.834 1.834 Apartment (Mkt rate) 300,000 316,300 5.4 10,859 11,164 305 2.8 3.619 3.529 Comm/Ind: Lo Val 150,000 160,000 6.7 5,430 5,791 361 6.7 3.619 3.619 Comm/Ind: Med Val 300,000 320,000 6.7 13,083 13,734 651 5.0 4.360 4.291 Comm/Ind: Hi Val 1,000,000 1,066,500 6.7 48,797 50,792 1,995 4.1 4.879 4.762

House Research Dept. Simulation 1H2 Baseline: Preliminary Pay 2001 Page 12 04/25/2001 12:31 PM Alternative: Proj Pay 2002: Current Law (Revised 4/25) (all figures in $000s)
EAST CENTRAL TOWNS
Tax Burdens by Taxable Market Value Net Tax Effective Property Class Pctg Pctg Tax Rates Baseline Alternative Change Chng Baseline Alternative Change Chng Base Alter Res Hmstd 2,525,242 2,713,017 187,775 7.4 33,926 36,410 2,484 7.3 1.34 1.34 Res NonHmstd 1Un 131,759 137,495 5,736 4.4 2,273 2,357 84 3.7 1.72 1.71 Res NonHmstd 2-3 38,013 39,368 1,354 3.6 830 843 13 1.6 2.18 2.14 Reg Apartments 1,212 1,244 32 2.6 39 38 0 -0.9 3.20 3.09 Low-income Apts 27 27 0 0.0 0 0 0 -6.8 1.41 1.31 Seasonal Rec 644,001 685,289 41,288 6.4 11,111 11,932 821 7.4 1.73 1.74 Com/Ind Lo Tier 50,931 53,697 2,767 5.4 1,681 1,739 58 3.4 3.30 3.24 Com/Ind Hi Tier 28,797 30,603 1,806 6.3 1,328 1,366 39 2.9 4.61 4.47 Publ U: Elec Gen 10,075 10,226 151 1.5 500 508 8 1.6 4.97 4.97 Publ U: Other 141,939 144,068 2,129 1.5 6,633 6,527 -106 -1.6 4.67 4.53 Ag Hmstd: House 664,775 707,396 42,621 6.4 8,283 9,052 769 9.3 1.25 1.28 Ag Hmstd: Land 589,562 625,088 35,526 6.0 2,813 3,056 243 8.6 0.48 0.49 Ag NonHmstd 193,073 205,555 12,482 6.5 2,731 2,958 227 8.3 1.41 1.44 New Con: Res Hms 0 124,332 124,332 0.0 0 1,701 1,701 0.0 0.00 1.37 New Con: Other 0 42,508 42,508 0.0 0 859 859 0.0 0.00 2.02
Total 5,019,404 5,519,911 500,506 10.0 72,148 79,346 7,198 10.0 1.44 1.44
Tax Base Tax Rates Pctg Net Tax Cap (Pctg) Ref Mkt Val (mills) Baseline Alternative Change Chng Base Alter Base Alter Total Tax Capacity 60,390 66,620 6,230 10.3 County 61.11 59.31 0.030 0.02 (-) TIF Tax Capacity 87 97 9 10.8 City/Town 15.73 15.48 0.000 0.00 (-) FD Contrib Tax Capacity 0 0 0 0.0 School District 54.64 53.44 0.578 0.810 (=) Taxable Tax Capacity 60,303 66,524 6,221 10.3 Special District 0.57 0.59 0.000 0.00
FD Distrib Tax Capacity 0 0 0 0.0 Total 132.06 128.82 0.608 0.838
Tax Burdens on Hypothetical Properties Taxable Market Net Tax Effective Value Pctg Pctg Tax Rates Baseline Alternative Chng Baseline Alternative Change Chng Base Alter Res Hmstd: Lo Val 64,700 69,500 7.4 703 765 62 8.9 1.085 1.100 Res Hmstd: Avg Val 97,100 104,300 7.4 1,195 1,335 140 11.7 1.230 1.279 Res Hmstd: Hi Val 129,400 139,000 7.4 1,856 2,045 189 10.2 1.434 1.470 Res Hmstd: Ex-Hi Val 194,100 208,500 7.4 3,305 3,580 275 8.3 1.702 1.717 Seas Rec: Lo Val 50,000 53,200 6.4 823 867 44 5.4 1.645 1.629 Seas Rec: Hi Val 150,000 159,600 6.4 2,908 3,085 177 6.1 1.938 1.933 Comm/Ind: Lo Val 150,000 159,400 6.3 4,845 5,183 337 7.0 3.230 3.251 Comm/Ind: Med Val 300,000 318,800 6.3 11,671 12,298 626 5.4 3.890 3.857 Comm/Ind: Hi Val 1,000,000 1,062,700 6.3 43,527 45,503 1,976 4.5 4.352 4.281

House Research Dept. Simulation 1H2 Baseline: Preliminary Pay 2001 Page 13 04/25/2001 12:31 PM Alternative: Proj Pay 2002: Current Law (Revised 4/25) (all figures in $000s)
CENTRAL MINN CITIES
Tax Burdens by Taxable Market Value Net Tax Effective Property Class Pctg Pctg Tax Rates Baseline Alternative Change Chng Baseline Alternative Change Chng Base Alter Res Hmstd 5,190,963 5,539,261 348,297 6.7 72,266 75,920 3,654 5.1 1.39 1.37 Res NonHmstd 1Un 184,441 196,692 12,251 6.6 3,286 3,418 132 4.0 1.78 1.74 Res NonHmstd 2-3 144,796 152,672 7,876 5.4 3,240 3,310 70 2.2 2.24 2.17 Reg Apartments 367,876 383,549 15,673 4.3 12,171 12,350 179 1.5 3.31 3.22 Low-income Apts 152,760 166,884 14,124 9.2 2,195 2,345 150 6.9 1.44 1.41 Seasonal Rec 33,051 34,252 1,201 3.6 635 638 3 0.4 1.92 1.86 Com/Ind Lo Tier 478,513 493,297 14,783 3.1 15,855 15,907 52 0.3 3.31 3.22 Com/Ind Hi Tier 1,101,828 1,170,345 68,517 6.2 50,512 51,797 1,284 2.5 4.58 4.43 Publ U: Elec Gen 676,650 686,799 10,150 1.5 27,979 27,230 -749 -2.7 4.13 3.96 Publ U: Other 331,700 336,676 4,976 1.5 14,229 13,886 -343 -2.4 4.29 4.12 Ag Hmstd: House 88,359 91,686 3,327 3.8 1,259 1,275 16 1.3 1.42 1.39 Ag Hmstd: Land 69,270 72,073 2,803 4.0 370 381 10 2.7 0.53 0.53 Ag NonHmstd 45,085 46,850 1,766 3.9 629 635 7 1.0 1.39 1.36 New Con: Res Hms 0 319,041 319,041 0.0 0 4,414 4,414 0.0 0.00 1.38 New Con: Other 0 170,422 170,422 0.0 0 6,004 6,004 0.0 0.00 3.52
Total 8,865,293 9,860,500 995,207 11.2 204,625 219,509 14,884 7.3 2.31 2.23
Tax Base Tax Rates Pctg Net Tax Cap (Pctg) Ref Mkt Val (mills) Baseline Alternative Change Chng Base Alter Base Alter Total Tax Capacity 163,095 180,153 17,057 10.5 County 37.49 36.78 0.000 0.00 (-) TIF Tax Capacity 11,489 12,881 1,392 12.1 City/Town 32.79 32.12 0.000 0.00 (-) FD Contrib Tax Capacity 0 0 0 0.0 School District 55.35 50.96 1.263 1.525 (=) Taxable Tax Capacity 151,607 167,272 15,665 10.3 Special District 1.84 1.88 0.000 0.00
FD Distrib Tax Capacity 0 0 0 0.0 Total 127.47 121.73 1.263 1.525
Tax Burdens on Hypothetical Properties Taxable Market Net Tax Effective Value Pctg Pctg Tax Rates Baseline Alternative Chng Baseline Alternative Change Chng Base Alter Res Hmstd: Lo Val 68,400 73,000 6.7 771 824 53 6.8 1.127 1.128 Res Hmstd: Avg Val 102,600 109,500 6.7 1,329 1,448 119 8.9 1.295 1.322 Res Hmstd: Hi Val 136,800 146,000 6.7 2,030 2,164 134 6.6 1.484 1.482 Res Hmstd: Ex-Hi Val 205,200 219,000 6.7 3,555 3,741 186 5.2 1.732 1.708 Apartment (Mkt rate) 300,000 312,800 4.3 9,557 9,616 59 0.6 3.185 3.074 Comm/Ind: Lo Val 150,000 159,300 6.2 4,778 5,010 232 4.9 3.185 3.145 Comm/Ind: Med Val 300,000 318,700 6.2 11,469 11,851 382 3.3 3.822 3.718 Comm/Ind: Hi Val 1,000,000 1,062,200 6.2 42,690 43,758 1,067 2.5 4.269 4.119
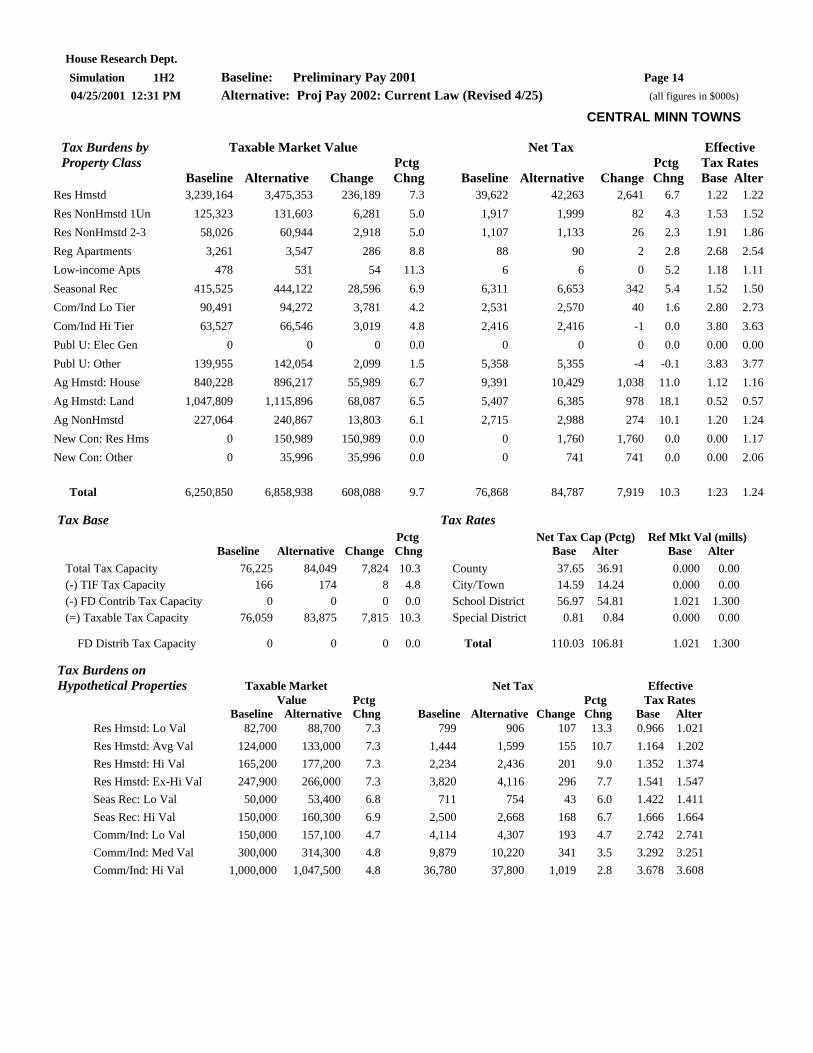
House Research Dept. Simulation 1H2 Baseline: Preliminary Pay 2001 Page 14 04/25/2001 12:31 PM Alternative: Proj Pay 2002: Current Law (Revised 4/25) (all figures in $000s)
CENTRAL MINN TOWNS
Tax Burdens by Taxable Market Value Net Tax Effective Property Class Pctg Pctg Tax Rates Baseline Alternative Change Chng Baseline Alternative Change Chng Base Alter Res Hmstd 3,239,164 3,475,353 236,189 7.3 39,622 42,263 2,641 6.7 1.22 1.22 Res NonHmstd 1Un 125,323 131,603 6,281 5.0 1,917 1,999 82 4.3 1.53 1.52 Res NonHmstd 2-3 58,026 60,944 2,918 5.0 1,107 1,133 26 2.3 1.91 1.86 Reg Apartments 3,261 3,547 286 8.8 88 90 2 2.8 2.68 2.54 Low-income Apts 478 531 54 11.3 6 6 0 5.2 1.18 1.11 Seasonal Rec 415,525 444,122 28,596 6.9 6,311 6,653 342 5.4 1.52 1.50 Com/Ind Lo Tier 90,491 94,272 3,781 4.2 2,531 2,570 40 1.6 2.80 2.73 Com/Ind Hi Tier 63,527 66,546 3,019 4.8 2,416 2,416 -1 0.0 3.80 3.63 Publ U: Elec Gen 0 0 0 0.0 0 0 0 0.0 0.00 0.00 Publ U: Other 139,955 142,054 2,099 1.5 5,358 5,355 -4 -0.1 3.83 3.77 Ag Hmstd: House 840,228 896,217 55,989 6.7 9,391 10,429 1,038 11.0 1.12 1.16 Ag Hmstd: Land 1,047,809 1,115,896 68,087 6.5 5,407 6,385 978 18.1 0.52 0.57 Ag NonHmstd 227,064 240,867 13,803 6.1 2,715 2,988 274 10.1 1.20 1.24 New Con: Res Hms 0 150,989 150,989 0.0 0 1,760 1,760 0.0 0.00 1.17 New Con: Other 0 35,996 35,996 0.0 0 741 741 0.0 0.00 2.06
Total 6,250,850 6,858,938 608,088 9.7 76,868 84,787 7,919 10.3 1.23 1.24
Tax Base Tax Rates Pctg Net Tax Cap (Pctg) Ref Mkt Val (mills) Baseline Alternative Change Chng Base Alter Base Alter Total Tax Capacity 76,225 84,049 7,824 10.3 County 37.65 36.91 0.000 0.00 (-) TIF Tax Capacity 166 174 8 4.8 City/Town 14.59 14.24 0.000 0.00 (-) FD Contrib Tax Capacity 0 0 0 0.0 School District 56.97 54.81 1.021 1.300 (=) Taxable Tax Capacity 76,059 83,875 7,815 10.3 Special District 0.81 0.84 0.000 0.00
FD Distrib Tax Capacity 0 0 0 0.0 Total 110.03 106.81 1.021 1.300
Tax Burdens on Hypothetical Properties Taxable Market Net Tax Effective Value Pctg Pctg Tax Rates Baseline Alternative Chng Baseline Alternative Change Chng Base Alter Res Hmstd: Lo Val 82,700 88,700 7.3 799 906 107 13.3 0.966 1.021 Res Hmstd: Avg Val 124,000 133,000 7.3 1,444 1,599 155 10.7 1.164 1.202 Res Hmstd: Hi Val 165,200 177,200 7.3 2,234 2,436 201 9.0 1.352 1.374 Res Hmstd: Ex-Hi Val 247,900 266,000 7.3 3,820 4,116 296 7.7 1.541 1.547 Seas Rec: Lo Val 50,000 53,400 6.8 711 754 43 6.0 1.422 1.411 Seas Rec: Hi Val 150,000 160,300 6.9 2,500 2,668 168 6.7 1.666 1.664 Comm/Ind: Lo Val 150,000 157,100 4.7 4,114 4,307 193 4.7 2.742 2.741 Comm/Ind: Med Val 300,000 314,300 4.8 9,879 10,220 341 3.5 3.292 3.251 Comm/Ind: Hi Val 1,000,000 1,047,500 4.8 36,780 37,800 1,019 2.8 3.678 3.608
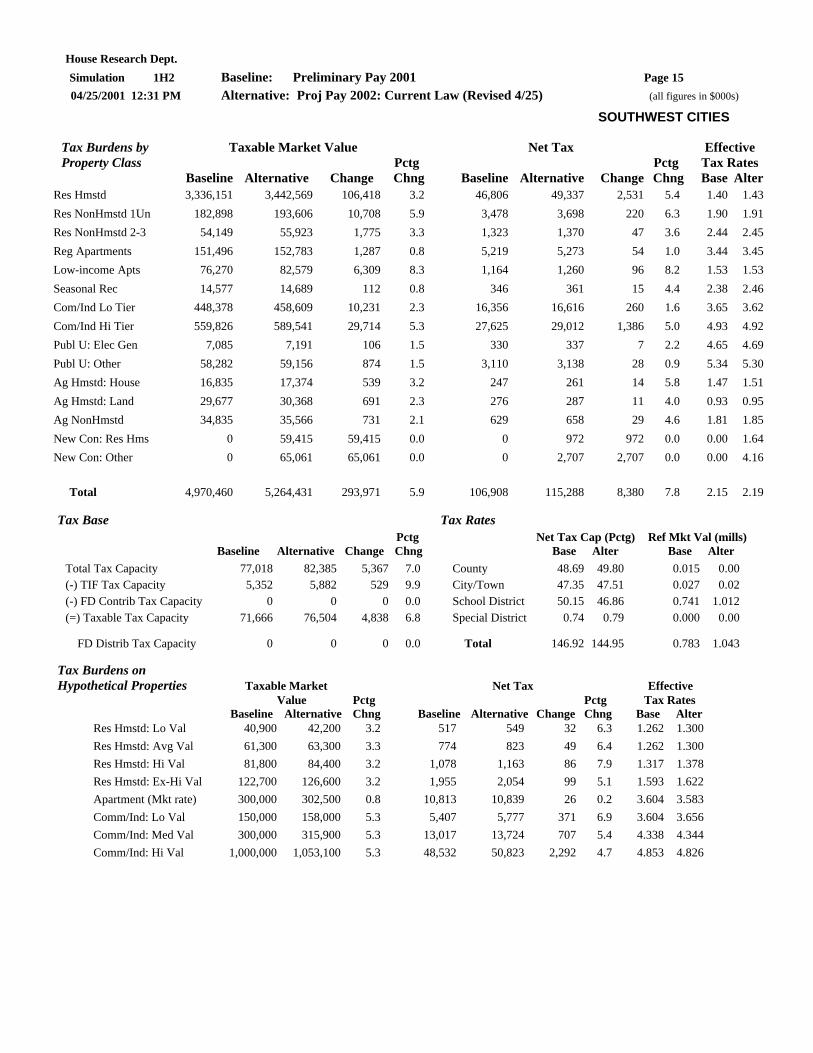
House Research Dept. Simulation 1H2 Baseline: Preliminary Pay 2001 Page 15 04/25/2001 12:31 PM Alternative: Proj Pay 2002: Current Law (Revised 4/25) (all figures in $000s)
SOUTHWEST CITIES
Tax Burdens by Taxable Market Value Net Tax Effective Property Class Pctg Pctg Tax Rates Baseline Alternative Change Chng Baseline Alternative Change Chng Base Alter Res Hmstd 3,336,151 3,442,569 106,418 3.2 46,806 49,337 2,531 5.4 1.40 1.43 Res NonHmstd 1Un 182,898 193,606 10,708 5.9 3,478 3,698 220 6.3 1.90 1.91 Res NonHmstd 2-3 54,149 55,923 1,775 3.3 1,323 1,370 47 3.6 2.44 2.45 Reg Apartments 151,496 152,783 1,287 0.8 5,219 5,273 54 1.0 3.44 3.45 Low-income Apts 76,270 82,579 6,309 8.3 1,164 1,260 96 8.2 1.53 1.53 Seasonal Rec 14,577 14,689 112 0.8 346 361 15 4.4 2.38 2.46 Com/Ind Lo Tier 448,378 458,609 10,231 2.3 16,356 16,616 260 1.6 3.65 3.62 Com/Ind Hi Tier 559,826 589,541 29,714 5.3 27,625 29,012 1,386 5.0 4.93 4.92 Publ U: Elec Gen 7,085 7,191 106 1.5 330 337 7 2.2 4.65 4.69 Publ U: Other 58,282 59,156 874 1.5 3,110 3,138 28 0.9 5.34 5.30 Ag Hmstd: House 16,835 17,374 539 3.2 247 261 14 5.8 1.47 1.51 Ag Hmstd: Land 29,677 30,368 691 2.3 276 287 11 4.0 0.93 0.95 Ag NonHmstd 34,835 35,566 731 2.1 629 658 29 4.6 1.81 1.85 New Con: Res Hms 0 59,415 59,415 0.0 0 972 972 0.0 0.00 1.64 New Con: Other 0 65,061 65,061 0.0 0 2,707 2,707 0.0 0.00 4.16
Total 4,970,460 5,264,431 293,971 5.9 106,908 115,288 8,380 7.8 2.15 2.19
Tax Base Tax Rates Pctg Net Tax Cap (Pctg) Ref Mkt Val (mills) Baseline Alternative Change Chng Base Alter Base Alter Total Tax Capacity 77,018 82,385 5,367 7.0 County 48.69 49.80 0.015 0.00 (-) TIF Tax Capacity 5,352 5,882 529 9.9 City/Town 47.35 47.51 0.027 0.02 (-) FD Contrib Tax Capacity 0 0 0 0.0 School District 50.15 46.86 0.741 1.012 (=) Taxable Tax Capacity 71,666 76,504 4,838 6.8 Special District 0.74 0.79 0.000 0.00
FD Distrib Tax Capacity 0 0 0 0.0 Total 146.92 144.95 0.783 1.043
Tax Burdens on Hypothetical Properties Taxable Market Net Tax Effective Value Pctg Pctg Tax Rates Baseline Alternative Chng Baseline Alternative Change Chng Base Alter Res Hmstd: Lo Val 40,900 42,200 3.2 517 549 32 6.3 1.262 1.300 Res Hmstd: Avg Val 61,300 63,300 3.3 774 823 49 6.4 1.262 1.300 Res Hmstd: Hi Val 81,800 84,400 3.2 1,078 1,163 86 7.9 1.317 1.378 Res Hmstd: Ex-Hi Val 122,700 126,600 3.2 1,955 2,054 99 5.1 1.593 1.622 Apartment (Mkt rate) 300,000 302,500 0.8 10,813 10,839 26 0.2 3.604 3.583 Comm/Ind: Lo Val 150,000 158,000 5.3 5,407 5,777 371 6.9 3.604 3.656 Comm/Ind: Med Val 300,000 315,900 5.3 13,017 13,724 707 5.4 4.338 4.344 Comm/Ind: Hi Val 1,000,000 1,053,100 5.3 48,532 50,823 2,292 4.7 4.853 4.826

House Research Dept. Simulation 1H2 Baseline: Preliminary Pay 2001 Page 16 04/25/2001 12:31 PM Alternative: Proj Pay 2002: Current Law (Revised 4/25) (all figures in $000s)
SOUTHWEST TOWNS
Tax Burdens by Taxable Market Value Net Tax Effective Property Class Pctg Pctg Tax Rates Baseline Alternative Change Chng Baseline Alternative Change Chng Base Alter Res Hmstd 1,345,430 1,413,322 67,892 5.0 16,134 17,402 1,267 7.9 1.20 1.23 Res NonHmstd 1Un 135,704 143,673 7,969 5.9 2,043 2,155 112 5.5 1.51 1.50 Res NonHmstd 2-3 19,211 20,162 950 4.9 393 415 22 5.7 2.04 2.06 Reg Apartments 1,608 1,627 19 1.2 42 41 -1 -2.5 2.61 2.52 Low-income Apts 58 58 0 0.0 1 1 0 -0.3 1.03 1.03 Seasonal Rec 262,112 274,963 12,851 4.9 4,367 4,691 324 7.4 1.67 1.71 Com/Ind Lo Tier 78,736 80,312 1,576 2.0 2,232 2,252 19 0.9 2.83 2.80 Com/Ind Hi Tier 123,220 126,911 3,691 3.0 4,623 4,655 31 0.7 3.75 3.67 Publ U: Elec Gen 31,384 31,855 471 1.5 1,034 1,054 19 1.9 3.30 3.31 Publ U: Other 225,925 229,314 3,389 1.5 8,317 8,065 -252 -3.0 3.68 3.52 Ag Hmstd: House 887,763 930,052 42,288 4.8 8,794 9,479 685 7.8 0.99 1.02 Ag Hmstd: Land 5,510,877 5,636,978 126,102 2.3 36,595 38,057 1,462 4.0 0.66 0.68 Ag NonHmstd 3,058,253 3,127,088 68,835 2.3 35,504 36,453 949 2.7 1.16 1.17 New Con: Res Hms 0 42,403 42,403 0.0 0 535 535 0.0 0.00 1.26 New Con: Other 0 75,086 75,086 0.0 0 1,975 1,975 0.0 0.00 2.63
Total 11,680,283 12,133,805 453,521 3.9 120,079 127,228 7,149 6.0 1.03 1.05
Tax Base Tax Rates Pctg Net Tax Cap (Pctg) Ref Mkt Val (mills) Baseline Alternative Change Chng Base Alter Base Alter Total Tax Capacity 120,410 126,744 6,334 5.3 County 51.03 52.04 0.014 0.00 (-) TIF Tax Capacity 422 429 7 1.8 City/Town 10.27 10.15 0.000 0.00 (-) FD Contrib Tax Capacity 0 0 0 0.0 School District 49.97 44.58 0.876 1.165 (=) Taxable Tax Capacity 119,988 126,315 6,327 5.3 Special District 0.72 0.77 0.000 0.00
FD Distrib Tax Capacity 0 0 0 0.0 Total 111.99 107.55 0.890 1.169
Tax Burdens on Hypothetical Properties Taxable Market Net Tax Effective Value Pctg Pctg Tax Rates Baseline Alternative Chng Baseline Alternative Change Chng Base Alter Res Hmstd: Lo Val 54,600 57,400 5.1 503 543 39 7.8 0.921 0.945 Res Hmstd: Avg Val 81,800 85,900 5.0 785 865 80 10.2 0.960 1.007 Res Hmstd: Hi Val 109,000 114,500 5.0 1,183 1,289 106 9.0 1.085 1.126 Res Hmstd: Ex-Hi Val 163,600 171,900 5.1 2,225 2,330 105 4.7 1.360 1.355 Comm/Ind: Lo Val 150,000 154,500 3.0 4,165 4,217 52 1.2 2.776 2.729 Comm/Ind: Med Val 300,000 309,000 3.0 10,010 10,047 37 0.4 3.336 3.251 Comm/Ind: Hi Val 1,000,000 1,030,000 3.0 37,286 37,254 -31 -0.1 3.728 3.616

House Research Dept. Simulation 1H2 Baseline: Preliminary Pay 2001 Page 17 04/25/2001 12:31 PM Alternative: Proj Pay 2002: Current Law (Revised 4/25) (all figures in $000s)
SOUTH CENTRAL CITIES
Tax Burdens by Taxable Market Value Net Tax Effective Property Class Pctg Pctg Tax Rates Baseline Alternative Change Chng Baseline Alternative Change Chng Base Alter Res Hmstd 3,220,929 3,423,956 203,027 6.3 42,232 44,809 2,576 6.1 1.31 1.31 Res NonHmstd 1Un 137,174 145,103 7,929 5.8 2,413 2,511 98 4.1 1.76 1.73 Res NonHmstd 2-3 77,113 80,334 3,221 4.2 1,702 1,721 19 1.1 2.21 2.14 Reg Apartments 163,074 169,669 6,596 4.0 5,105 5,132 26 0.5 3.13 3.02 Low-income Apts 58,080 60,835 2,756 4.7 809 830 21 2.6 1.39 1.36 Seasonal Rec 9,701 10,168 467 4.8 205 216 11 5.5 2.11 2.12 Com/Ind Lo Tier 352,244 360,149 7,905 2.2 11,728 11,679 -49 -0.4 3.33 3.24 Com/Ind Hi Tier 612,123 651,924 39,801 6.5 27,035 27,841 806 3.0 4.42 4.27 Publ U: Elec Gen 23,522 23,875 353 1.5 996 970 -26 -2.6 4.23 4.06 Publ U: Other 58,524 59,402 878 1.5 2,696 2,644 -51 -1.9 4.61 4.45 Ag Hmstd: House 9,071 9,558 486 5.4 134 143 9 7.0 1.47 1.50 Ag Hmstd: Land 18,431 18,983 552 3.0 153 161 8 5.4 0.83 0.85 Ag NonHmstd 22,249 23,273 1,024 4.6 327 348 21 6.4 1.47 1.50 New Con: Res Hms 0 71,372 71,372 0.0 0 997 997 0.0 0.00 1.40 New Con: Other 0 57,881 57,881 0.0 0 2,003 2,003 0.0 0.00 3.46
Total 4,762,236 5,166,483 404,247 8.5 95,536 102,005 6,470 6.8 2.01 1.97
Tax Base Tax Rates Pctg Net Tax Cap (Pctg) Ref Mkt Val (mills) Baseline Alternative Change Chng Base Alter Base Alter Total Tax Capacity 76,623 83,375 6,752 8.8 County 43.45 42.67 0.000 0.00 (-) TIF Tax Capacity 4,860 5,363 502 10.3 City/Town 40.42 39.34 0.004 0.00 (-) FD Contrib Tax Capacity 0 0 0 0.0 School District 47.30 44.02 0.913 1.171 (=) Taxable Tax Capacity 71,762 78,012 6,250 8.7 Special District 0.30 0.32 0.000 0.00
FD Distrib Tax Capacity 0 0 0 0.0 Total 131.47 126.35 0.917 1.174
Tax Burdens on Hypothetical Properties Taxable Market Net Tax Effective Value Pctg Pctg Tax Rates Baseline Alternative Chng Baseline Alternative Change Chng Base Alter Res Hmstd: Lo Val 50,200 53,400 6.4 564 604 40 7.2 1.122 1.131 Res Hmstd: Avg Val 75,300 80,000 6.2 846 931 86 10.1 1.122 1.164 Res Hmstd: Hi Val 100,400 106,700 6.3 1,291 1,409 118 9.2 1.285 1.320 Res Hmstd: Ex-Hi Val 150,700 160,200 6.3 2,368 2,514 146 6.2 1.571 1.569 Apartment (Mkt rate) 300,000 312,100 4.0 9,741 9,830 90 0.9 3.246 3.149 Comm/Ind: Lo Val 150,000 159,800 6.5 4,870 5,157 287 5.9 3.246 3.227 Comm/Ind: Med Val 300,000 319,500 6.5 11,713 12,205 492 4.2 3.904 3.820 Comm/Ind: Hi Val 1,000,000 1,065,000 6.5 43,644 45,106 1,462 3.3 4.364 4.235

House Research Dept. Simulation 1H2 Baseline: Preliminary Pay 2001 Page 18 04/25/2001 12:31 PM Alternative: Proj Pay 2002: Current Law (Revised 4/25) (all figures in $000s)
SOUTH CENTRAL TOWNS
Tax Burdens by Taxable Market Value Net Tax Effective Property Class Pctg Pctg Tax Rates Baseline Alternative Change Chng Baseline Alternative Change Chng Base Alter Res Hmstd 1,173,544 1,251,381 77,838 6.6 13,222 13,895 673 5.1 1.13 1.11 Res NonHmstd 1Un 93,740 99,153 5,413 5.8 1,325 1,363 39 2.9 1.41 1.38 Res NonHmstd 2-3 17,674 18,529 855 4.8 322 328 5 1.6 1.82 1.77 Reg Apartments 2,035 2,042 7 0.3 54 52 -2 -4.4 2.66 2.53 Low-income Apts 0 0 0 0.0 0 0 0 0.0 0.00 0.00 Seasonal Rec 75,316 78,824 3,508 4.7 1,098 1,106 9 0.8 1.46 1.40 Com/Ind Lo Tier 47,064 47,647 583 1.2 1,207 1,173 -34 -2.8 2.56 2.46 Com/Ind Hi Tier 54,925 56,494 1,569 2.9 1,966 1,923 -43 -2.2 3.58 3.40 Publ U: Elec Gen 10,707 10,868 161 1.5 323 298 -24 -7.5 3.01 2.75 Publ U: Other 139,707 141,802 2,096 1.5 4,876 4,715 -160 -3.3 3.49 3.33 Ag Hmstd: House 674,087 720,458 46,371 6.9 6,536 7,160 625 9.6 0.97 0.99 Ag Hmstd: Land 3,498,132 3,623,242 125,110 3.6 23,038 24,208 1,170 5.1 0.66 0.67 Ag NonHmstd 1,615,599 1,659,874 44,276 2.7 17,670 18,230 560 3.2 1.09 1.10 New Con: Res Hms 0 37,421 37,421 0.0 0 410 410 0.0 0.00 1.10 New Con: Other 0 29,171 29,171 0.0 0 930 930 0.0 0.00 3.19
Total 7,402,530 7,776,908 374,378 5.1 71,635 75,793 4,157 5.8 0.97 0.97
Tax Base Tax Rates Pctg Net Tax Cap (Pctg) Ref Mkt Val (mills) Baseline Alternative Change Chng Base Alter Base Alter Total Tax Capacity 76,826 81,607 4,781 6.2 County 46.40 45.81 0.000 0.00 (-) TIF Tax Capacity 22 22 0 1.8 City/Town 9.76 9.60 0.000 0.00 (-) FD Contrib Tax Capacity 0 0 0 0.0 School District 48.23 43.80 1.089 1.335 (=) Taxable Tax Capacity 76,804 81,585 4,781 6.2 Special District 0.24 0.25 0.000 0.00
FD Distrib Tax Capacity 0 0 0 0.0 Total 104.63 99.46 1.089 1.335
Tax Burdens on Hypothetical Properties Taxable Market Net Tax Effective Value Pctg Pctg Tax Rates Baseline Alternative Chng Baseline Alternative Change Chng Base Alter Res Hmstd: Lo Val 66,100 70,500 6.7 570 618 48 8.4 0.862 0.876 Res Hmstd: Avg Val 99,200 105,800 6.7 970 1,072 102 10.5 0.977 1.012 Res Hmstd: Hi Val 132,200 141,000 6.7 1,519 1,621 102 6.7 1.149 1.149 Res Hmstd: Ex-Hi Val 198,300 211,500 6.7 2,732 2,872 140 5.1 1.377 1.357 Comm/Ind: Lo Val 150,000 154,300 2.9 3,930 3,932 2 0.1 2.620 2.548 Comm/Ind: Med Val 300,000 308,600 2.9 9,430 9,356 -73 -0.8 3.143 3.031 Comm/Ind: Hi Val 1,000,000 1,028,600 2.9 35,094 34,666 -428 -1.2 3.509 3.370

House Research Dept. Simulation 1H2 Baseline: Preliminary Pay 2001 Page 19 04/25/2001 12:31 PM Alternative: Proj Pay 2002: Current Law (Revised 4/25) (all figures in $000s)
OLMSTED COUNTY
Tax Burdens by Taxable Market Value Net Tax Effective Property Class Pctg Pctg Tax Rates Baseline Alternative Change Chng Baseline Alternative Change Chng Base Alter Res Hmstd 3,747,116 4,059,136 312,020 8.3 51,248 55,048 3,800 7.4 1.37 1.36 Res NonHmstd 1Un 148,267 150,666 2,400 1.6 2,552 2,552 1 0.0 1.72 1.69 Res NonHmstd 2-3 67,507 67,671 164 0.2 1,459 1,434 -25 -1.7 2.16 2.12 Reg Apartments 169,791 195,034 25,243 14.9 5,360 6,003 643 12.0 3.16 3.08 Low-income Apts 59,084 64,011 4,926 8.3 813 871 58 7.1 1.38 1.36 Seasonal Rec 5,798 5,891 92 1.6 114 115 2 1.5 1.96 1.96 Com/Ind Lo Tier 179,724 183,371 3,648 2.0 5,641 5,620 -22 -0.4 3.14 3.06 Com/Ind Hi Tier 764,680 783,151 18,471 2.4 33,801 33,647 -155 -0.5 4.42 4.30 Publ U: Elec Gen 0 0 0 0.0 0 0 0 0.0 0.00 0.00 Publ U: Other 46,677 47,377 700 1.5 1,973 1,960 -13 -0.7 4.23 4.14 Ag Hmstd: House 208,853 215,885 7,032 3.4 2,475 2,598 122 4.9 1.19 1.20 Ag Hmstd: Land 337,474 363,509 26,035 7.7 1,939 2,173 234 12.1 0.57 0.60 Ag NonHmstd 106,411 114,220 7,809 7.3 1,239 1,346 106 8.6 1.16 1.18 New Con: Res Hms 0 138,278 138,278 0.0 0 1,862 1,862 0.0 0.00 1.35 New Con: Other 0 82,210 82,210 0.0 0 2,699 2,699 0.0 0.00 3.28
Total 5,841,383 6,470,412 629,029 10.8 108,615 117,928 9,313 8.6 1.86 1.82
Tax Base Tax Rates Pctg Net Tax Cap (Pctg) Ref Mkt Val (mills) Baseline Alternative Change Chng Base Alter Base Alter Total Tax Capacity 91,748 101,287 9,539 10.4 County 45.40 43.16 0.000 0.00 (-) TIF Tax Capacity 3,720 4,021 302 8.1 City/Town 26.32 25.36 0.003 0.00 (-) FD Contrib Tax Capacity 0 0 0 0.0 School District 53.23 52.27 0.902 1.183 (=) Taxable Tax Capacity 88,029 97,266 9,238 10.5 Special District 0.00 0.00 0.000 0.00
FD Distrib Tax Capacity 0 0 0 0.0 Total 124.95 120.79 0.906 1.186
Tax Burdens on Hypothetical Properties Taxable Market Net Tax Effective Value Pctg Pctg Tax Rates Baseline Alternative Chng Baseline Alternative Change Chng Base Alter Res Hmstd: Lo Val 74,000 80,200 8.4 782 874 92 11.8 1.056 1.089 Res Hmstd: Avg Val 110,900 120,100 8.3 1,391 1,549 158 11.4 1.254 1.290 Res Hmstd: Hi Val 147,800 160,100 8.3 2,174 2,394 220 10.1 1.470 1.495 Res Hmstd: Ex-Hi Val 221,800 240,300 8.3 3,766 4,087 321 8.5 1.698 1.700 Apartment (Mkt rate) 300,000 344,600 14.9 9,268 10,398 1,131 12.2 3.089 3.017 Comm/Ind: Lo Val 150,000 153,600 2.4 4,634 4,678 44 1.0 3.089 3.045 Comm/Ind: Med Val 300,000 307,200 2.4 11,142 11,169 27 0.2 3.714 3.635 Comm/Ind: Hi Val 1,000,000 1,024,200 2.4 41,513 41,465 -48 -0.1 4.151 4.048
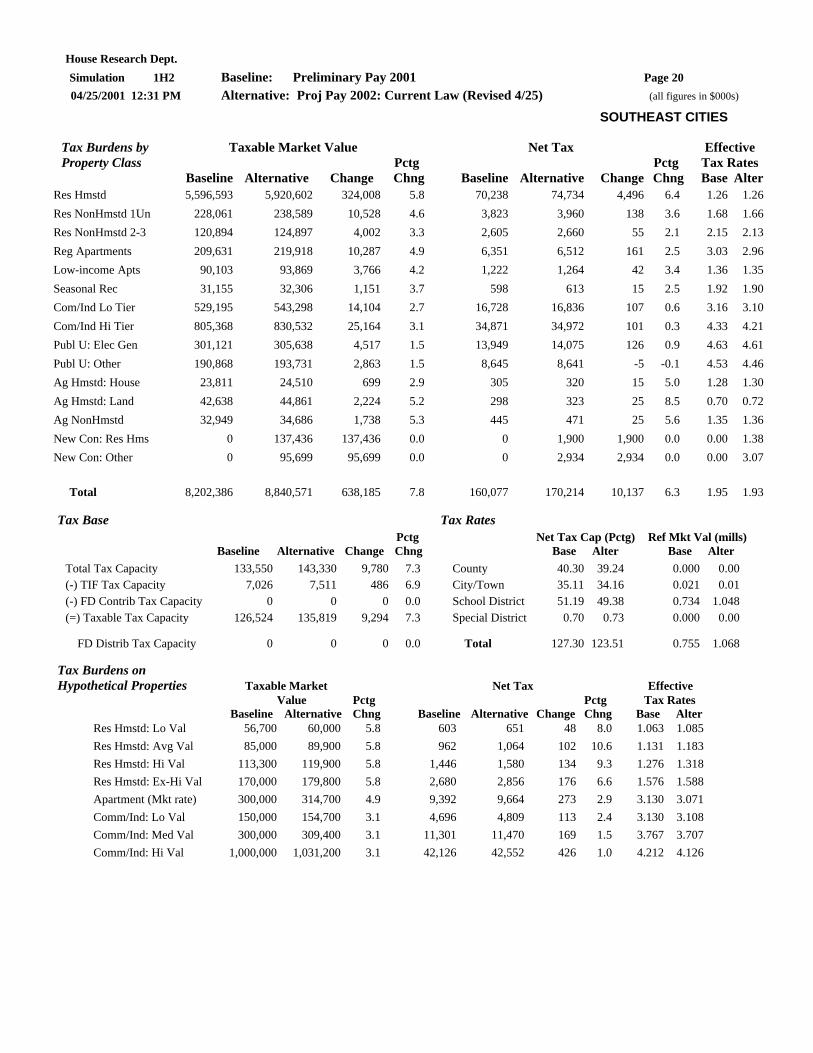
House Research Dept. Simulation 1H2 Baseline: Preliminary Pay 2001 Page 20 04/25/2001 12:31 PM Alternative: Proj Pay 2002: Current Law (Revised 4/25) (all figures in $000s)
SOUTHEAST CITIES
Tax Burdens by Taxable Market Value Net Tax Effective Property Class Pctg Pctg Tax Rates Baseline Alternative Change Chng Baseline Alternative Change Chng Base Alter Res Hmstd 5,596,593 5,920,602 324,008 5.8 70,238 74,734 4,496 6.4 1.26 1.26 Res NonHmstd 1Un 228,061 238,589 10,528 4.6 3,823 3,960 138 3.6 1.68 1.66 Res NonHmstd 2-3 120,894 124,897 4,002 3.3 2,605 2,660 55 2.1 2.15 2.13 Reg Apartments 209,631 219,918 10,287 4.9 6,351 6,512 161 2.5 3.03 2.96 Low-income Apts 90,103 93,869 3,766 4.2 1,222 1,264 42 3.4 1.36 1.35 Seasonal Rec 31,155 32,306 1,151 3.7 598 613 15 2.5 1.92 1.90 Com/Ind Lo Tier 529,195 543,298 14,104 2.7 16,728 16,836 107 0.6 3.16 3.10 Com/Ind Hi Tier 805,368 830,532 25,164 3.1 34,871 34,972 101 0.3 4.33 4.21 Publ U: Elec Gen 301,121 305,638 4,517 1.5 13,949 14,075 126 0.9 4.63 4.61 Publ U: Other 190,868 193,731 2,863 1.5 8,645 8,641 -5 -0.1 4.53 4.46 Ag Hmstd: House 23,811 24,510 699 2.9 305 320 15 5.0 1.28 1.30 Ag Hmstd: Land 42,638 44,861 2,224 5.2 298 323 25 8.5 0.70 0.72 Ag NonHmstd 32,949 34,686 1,738 5.3 445 471 25 5.6 1.35 1.36 New Con: Res Hms 0 137,436 137,436 0.0 0 1,900 1,900 0.0 0.00 1.38 New Con: Other 0 95,699 95,699 0.0 0 2,934 2,934 0.0 0.00 3.07
Total 8,202,386 8,840,571 638,185 7.8 160,077 170,214 10,137 6.3 1.95 1.93
Tax Base Tax Rates Pctg Net Tax Cap (Pctg) Ref Mkt Val (mills) Baseline Alternative Change Chng Base Alter Base Alter Total Tax Capacity 133,550 143,330 9,780 7.3 County 40.30 39.24 0.000 0.00 (-) TIF Tax Capacity 7,026 7,511 486 6.9 City/Town 35.11 34.16 0.021 0.01 (-) FD Contrib Tax Capacity 0 0 0 0.0 School District 51.19 49.38 0.734 1.048 (=) Taxable Tax Capacity 126,524 135,819 9,294 7.3 Special District 0.70 0.73 0.000 0.00
FD Distrib Tax Capacity 0 0 0 0.0 Total 127.30 123.51 0.755 1.068
Tax Burdens on Hypothetical Properties Taxable Market Net Tax Effective Value Pctg Pctg Tax Rates Baseline Alternative Chng Baseline Alternative Change Chng Base Alter Res Hmstd: Lo Val 56,700 60,000 5.8 603 651 48 8.0 1.063 1.085 Res Hmstd: Avg Val 85,000 89,900 5.8 962 1,064 102 10.6 1.131 1.183 Res Hmstd: Hi Val 113,300 119,900 5.8 1,446 1,580 134 9.3 1.276 1.318 Res Hmstd: Ex-Hi Val 170,000 179,800 5.8 2,680 2,856 176 6.6 1.576 1.588 Apartment (Mkt rate) 300,000 314,700 4.9 9,392 9,664 273 2.9 3.130 3.071 Comm/Ind: Lo Val 150,000 154,700 3.1 4,696 4,809 113 2.4 3.130 3.108 Comm/Ind: Med Val 300,000 309,400 3.1 11,301 11,470 169 1.5 3.767 3.707 Comm/Ind: Hi Val 1,000,000 1,031,200 3.1 42,126 42,552 426 1.0 4.212 4.126

House Research Dept. Simulation 1H2 Baseline: Preliminary Pay 2001 Page 21 04/25/2001 12:31 PM Alternative: Proj Pay 2002: Current Law (Revised 4/25) (all figures in $000s)
SOUTHEAST TOWNS
Tax Burdens by Taxable Market Value Net Tax Effective Property Class Pctg Pctg Tax Rates Baseline Alternative Change Chng Baseline Alternative Change Chng Base Alter Res Hmstd 2,003,663 2,142,501 138,839 6.9 22,721 24,818 2,097 9.2 1.13 1.16 Res NonHmstd 1Un 145,345 152,475 7,130 4.9 2,110 2,220 109 5.2 1.45 1.46 Res NonHmstd 2-3 26,375 27,175 799 3.0 485 508 22 4.6 1.84 1.87 Reg Apartments 1,223 1,167 -57 -4.6 34 31 -3 -9.1 2.82 2.69 Low-income Apts 72 0 -72 -100.0 1 0 -1 -100. 1.06 0.00 0 Seasonal Rec 98,034 102,223 4,189 4.3 1,450 1,516 66 4.6 1.48 1.48 Com/Ind Lo Tier 59,664 62,299 2,635 4.4 1,613 1,676 63 3.9 2.70 2.69 Com/Ind Hi Tier 39,098 41,265 2,167 5.5 1,435 1,518 83 5.8 3.67 3.68 Publ U: Elec Gen 0 0 0 0.0 0 0 0 0.0 0.00 0.00 Publ U: Other 146,450 148,647 2,197 1.5 5,387 5,284 -104 -1.9 3.68 3.55 Ag Hmstd: House 989,537 1,034,915 45,378 4.6 10,118 11,087 969 9.6 1.02 1.07 Ag Hmstd: Land 3,422,927 3,654,605 231,679 6.8 21,354 23,568 2,214 10.4 0.62 0.64 Ag NonHmstd 1,070,632 1,144,426 73,795 6.9 12,294 13,194 901 7.3 1.15 1.15 New Con: Res Hms 0 71,017 71,017 0.0 0 817 817 0.0 0.00 1.15 New Con: Other 0 30,825 30,825 0.0 0 812 812 0.0 0.00 2.63
Total 8,003,020 8,613,541 610,521 7.6 79,004 87,049 8,045 10.2 0.99 1.01
Tax Base Tax Rates Pctg Net Tax Cap (Pctg) Ref Mkt Val (mills) Baseline Alternative Change Chng Base Alter Base Alter Total Tax Capacity 82,426 89,642 7,216 8.8 County 42.71 40.86 0.000 0.00 (-) TIF Tax Capacity 108 108 0 0.0 City/Town 13.59 13.13 0.000 0.00 (-) FD Contrib Tax Capacity 0 0 0 0.0 School District 52.11 51.32 0.847 1.140 (=) Taxable Tax Capacity 82,318 89,534 7,216 8.8 Special District 0.49 0.52 0.000 0.00
FD Distrib Tax Capacity 0 0 0 0.0 Total 108.90 105.83 0.847 1.140
Tax Burdens on Hypothetical Properties Taxable Market Net Tax Effective Value Pctg Pctg Tax Rates Baseline Alternative Chng Baseline Alternative Change Chng Base Alter Res Hmstd: Lo Val 69,400 74,200 6.9 615 678 64 10.3 0.885 0.913 Res Hmstd: Avg Val 104,000 111,200 6.9 1,067 1,199 133 12.4 1.025 1.078 Res Hmstd: Hi Val 138,600 148,200 6.9 1,680 1,844 164 9.8 1.212 1.244 Res Hmstd: Ex-Hi Val 208,000 222,400 6.9 2,986 3,224 238 8.0 1.435 1.449 Comm/Ind: Lo Val 150,000 158,300 5.5 4,048 4,289 241 6.0 2.698 2.709 Comm/Ind: Med Val 300,000 316,600 5.5 9,729 10,165 437 4.5 3.242 3.210 Comm/Ind: Hi Val 1,000,000 1,055,400 5.5 36,240 37,591 1,351 3.7 3.624 3.561
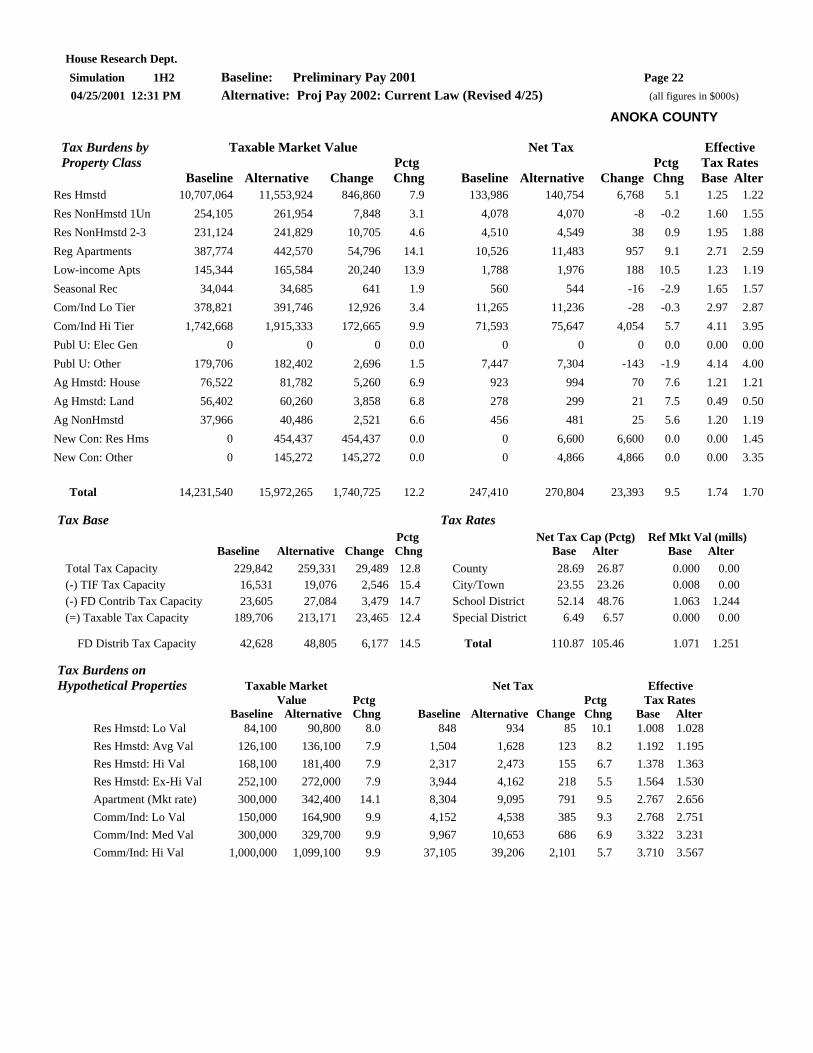
House Research Dept. Simulation 1H2 Baseline: Preliminary Pay 2001 Page 22 04/25/2001 12:31 PM Alternative: Proj Pay 2002: Current Law (Revised 4/25) (all figures in $000s)
ANOKA COUNTY
Tax Burdens by Taxable Market Value Net Tax Effective Property Class Pctg Pctg Tax Rates Baseline Alternative Change Chng Baseline Alternative Change Chng Base Alter Res Hmstd 10,707,064 11,553,924 846,860 7.9 133,986 140,754 6,768 5.1 1.25 1.22 Res NonHmstd 1Un 254,105 261,954 7,848 3.1 4,078 4,070 -8 -0.2 1.60 1.55 Res NonHmstd 2-3 231,124 241,829 10,705 4.6 4,510 4,549 38 0.9 1.95 1.88 Reg Apartments 387,774 442,570 54,796 14.1 10,526 11,483 957 9.1 2.71 2.59 Low-income Apts 145,344 165,584 20,240 13.9 1,788 1,976 188 10.5 1.23 1.19 Seasonal Rec 34,044 34,685 641 1.9 560 544 -16 -2.9 1.65 1.57 Com/Ind Lo Tier 378,821 391,746 12,926 3.4 11,265 11,236 -28 -0.3 2.97 2.87 Com/Ind Hi Tier 1,742,668 1,915,333 172,665 9.9 71,593 75,647 4,054 5.7 4.11 3.95 Publ U: Elec Gen 0 0 0 0.0 0 0 0 0.0 0.00 0.00 Publ U: Other 179,706 182,402 2,696 1.5 7,447 7,304 -143 -1.9 4.14 4.00 Ag Hmstd: House 76,522 81,782 5,260 6.9 923 994 70 7.6 1.21 1.21 Ag Hmstd: Land 56,402 60,260 3,858 6.8 278 299 21 7.5 0.49 0.50 Ag NonHmstd 37,966 40,486 2,521 6.6 456 481 25 5.6 1.20 1.19 New Con: Res Hms 0 454,437 454,437 0.0 0 6,600 6,600 0.0 0.00 1.45 New Con: Other 0 145,272 145,272 0.0 0 4,866 4,866 0.0 0.00 3.35
Total 14,231,540 15,972,265 1,740,725 12.2 247,410 270,804 23,393 9.5 1.74 1.70
Tax Base Tax Rates Pctg Net Tax Cap (Pctg) Ref Mkt Val (mills) Baseline Alternative Change Chng Base Alter Base Alter Total Tax Capacity 229,842 259,331 29,489 12.8 County 28.69 26.87 0.000 0.00 (-) TIF Tax Capacity 16,531 19,076 2,546 15.4 City/Town 23.55 23.26 0.008 0.00 (-) FD Contrib Tax Capacity 23,605 27,084 3,479 14.7 School District 52.14 48.76 1.063 1.244 (=) Taxable Tax Capacity 189,706 213,171 23,465 12.4 Special District 6.49 6.57 0.000 0.00
FD Distrib Tax Capacity 42,628 48,805 6,177 14.5 Total 110.87 105.46 1.071 1.251
Tax Burdens on Hypothetical Properties Taxable Market Net Tax Effective Value Pctg Pctg Tax Rates Baseline Alternative Chng Baseline Alternative Change Chng Base Alter Res Hmstd: Lo Val 84,100 90,800 8.0 848 934 85 10.1 1.008 1.028 Res Hmstd: Avg Val 126,100 136,100 7.9 1,504 1,628 123 8.2 1.192 1.195 Res Hmstd: Hi Val 168,100 181,400 7.9 2,317 2,473 155 6.7 1.378 1.363 Res Hmstd: Ex-Hi Val 252,100 272,000 7.9 3,944 4,162 218 5.5 1.564 1.530 Apartment (Mkt rate) 300,000 342,400 14.1 8,304 9,095 791 9.5 2.767 2.656 Comm/Ind: Lo Val 150,000 164,900 9.9 4,152 4,538 385 9.3 2.768 2.751 Comm/Ind: Med Val 300,000 329,700 9.9 9,967 10,653 686 6.9 3.322 3.231 Comm/Ind: Hi Val 1,000,000 1,099,100 9.9 37,105 39,206 2,101 5.7 3.710 3.567
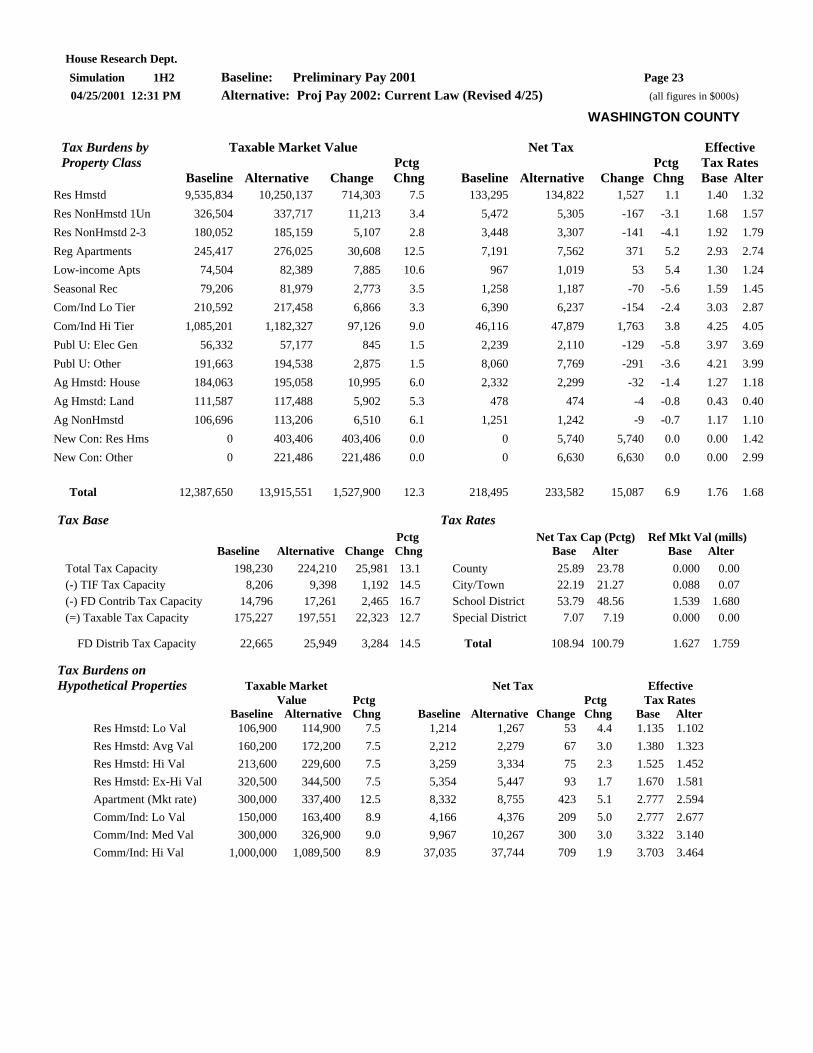
House Research Dept. Simulation 1H2 Baseline: Preliminary Pay 2001 Page 23 04/25/2001 12:31 PM Alternative: Proj Pay 2002: Current Law (Revised 4/25) (all figures in $000s)
WASHINGTON COUNTY
Tax Burdens by Taxable Market Value Net Tax Effective Property Class Pctg Pctg Tax Rates Baseline Alternative Change Chng Baseline Alternative Change Chng Base Alter Res Hmstd 9,535,834 10,250,137 714,303 7.5 133,295 134,822 1,527 1.1 1.40 1.32 Res NonHmstd 1Un 326,504 337,717 11,213 3.4 5,472 5,305 -167 -3.1 1.68 1.57 Res NonHmstd 2-3 180,052 185,159 5,107 2.8 3,448 3,307 -141 -4.1 1.92 1.79 Reg Apartments 245,417 276,025 30,608 12.5 7,191 7,562 371 5.2 2.93 2.74 Low-income Apts 74,504 82,389 7,885 10.6 967 1,019 53 5.4 1.30 1.24 Seasonal Rec 79,206 81,979 2,773 3.5 1,258 1,187 -70 -5.6 1.59 1.45 Com/Ind Lo Tier 210,592 217,458 6,866 3.3 6,390 6,237 -154 -2.4 3.03 2.87 Com/Ind Hi Tier 1,085,201 1,182,327 97,126 9.0 46,116 47,879 1,763 3.8 4.25 4.05 Publ U: Elec Gen 56,332 57,177 845 1.5 2,239 2,110 -129 -5.8 3.97 3.69 Publ U: Other 191,663 194,538 2,875 1.5 8,060 7,769 -291 -3.6 4.21 3.99 Ag Hmstd: House 184,063 195,058 10,995 6.0 2,332 2,299 -32 -1.4 1.27 1.18 Ag Hmstd: Land 111,587 117,488 5,902 5.3 478 474 -4 -0.8 0.43 0.40 Ag NonHmstd 106,696 113,206 6,510 6.1 1,251 1,242 -9 -0.7 1.17 1.10 New Con: Res Hms 0 403,406 403,406 0.0 0 5,740 5,740 0.0 0.00 1.42 New Con: Other 0 221,486 221,486 0.0 0 6,630 6,630 0.0 0.00 2.99
Total 12,387,650 13,915,551 1,527,900 12.3 218,495 233,582 15,087 6.9 1.76 1.68
Tax Base Tax Rates Pctg Net Tax Cap (Pctg) Ref Mkt Val (mills) Baseline Alternative Change Chng Base Alter Base Alter Total Tax Capacity 198,230 224,210 25,981 13.1 County 25.89 23.78 0.000 0.00 (-) TIF Tax Capacity 8,206 9,398 1,192 14.5 City/Town 22.19 21.27 0.088 0.07 (-) FD Contrib Tax Capacity 14,796 17,261 2,465 16.7 School District 53.79 48.56 1.539 1.680 (=) Taxable Tax Capacity 175,227 197,551 22,323 12.7 Special District 7.07 7.19 0.000 0.00
FD Distrib Tax Capacity 22,665 25,949 3,284 14.5 Total 108.94 100.79 1.627 1.759
Tax Burdens on Hypothetical Properties Taxable Market Net Tax Effective Value Pctg Pctg Tax Rates Baseline Alternative Chng Baseline Alternative Change Chng Base Alter Res Hmstd: Lo Val 106,900 114,900 7.5 1,214 1,267 53 4.4 1.135 1.102 Res Hmstd: Avg Val 160,200 172,200 7.5 2,212 2,279 67 3.0 1.380 1.323 Res Hmstd: Hi Val 213,600 229,600 7.5 3,259 3,334 75 2.3 1.525 1.452 Res Hmstd: Ex-Hi Val 320,500 344,500 7.5 5,354 5,447 93 1.7 1.670 1.581 Apartment (Mkt rate) 300,000 337,400 12.5 8,332 8,755 423 5.1 2.777 2.594 Comm/Ind: Lo Val 150,000 163,400 8.9 4,166 4,376 209 5.0 2.777 2.677 Comm/Ind: Med Val 300,000 326,900 9.0 9,967 10,267 300 3.0 3.322 3.140 Comm/Ind: Hi Val 1,000,000 1,089,500 8.9 37,035 37,744 709 1.9 3.703 3.464
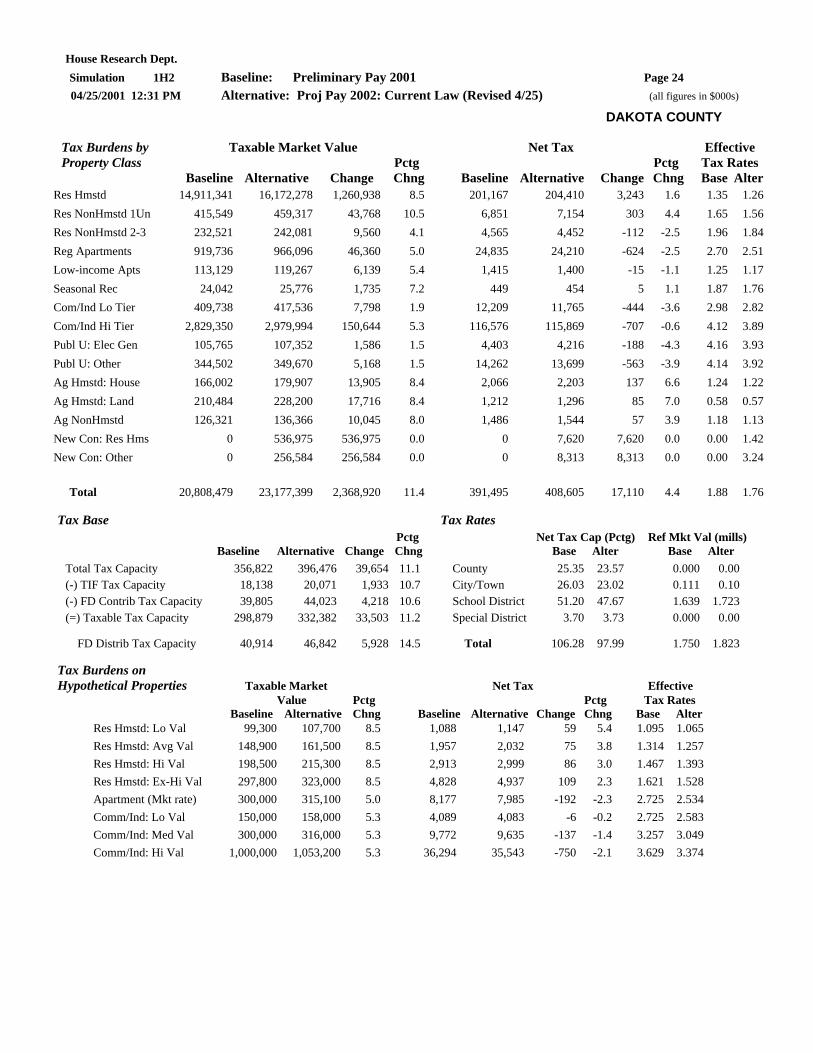
House Research Dept. Simulation 1H2 Baseline: Preliminary Pay 2001 Page 24 04/25/2001 12:31 PM Alternative: Proj Pay 2002: Current Law (Revised 4/25) (all figures in $000s)
DAKOTA COUNTY
Tax Burdens by Taxable Market Value Net Tax Effective Property Class Pctg Pctg Tax Rates Baseline Alternative Change Chng Baseline Alternative Change Chng Base Alter Res Hmstd 14,911,341 16,172,278 1,260,938 8.5 201,167 204,410 3,243 1.6 1.35 1.26 Res NonHmstd 1Un 415,549 459,317 43,768 10.5 6,851 7,154 303 4.4 1.65 1.56 Res NonHmstd 2-3 232,521 242,081 9,560 4.1 4,565 4,452 -112 -2.5 1.96 1.84 Reg Apartments 919,736 966,096 46,360 5.0 24,835 24,210 -624 -2.5 2.70 2.51 Low-income Apts 113,129 119,267 6,139 5.4 1,415 1,400 -15 -1.1 1.25 1.17 Seasonal Rec 24,042 25,776 1,735 7.2 449 454 5 1.1 1.87 1.76 Com/Ind Lo Tier 409,738 417,536 7,798 1.9 12,209 11,765 -444 -3.6 2.98 2.82 Com/Ind Hi Tier 2,829,350 2,979,994 150,644 5.3 116,576 115,869 -707 -0.6 4.12 3.89 Publ U: Elec Gen 105,765 107,352 1,586 1.5 4,403 4,216 -188 -4.3 4.16 3.93 Publ U: Other 344,502 349,670 5,168 1.5 14,262 13,699 -563 -3.9 4.14 3.92 Ag Hmstd: House 166,002 179,907 13,905 8.4 2,066 2,203 137 6.6 1.24 1.22 Ag Hmstd: Land 210,484 228,200 17,716 8.4 1,212 1,296 85 7.0 0.58 0.57 Ag NonHmstd 126,321 136,366 10,045 8.0 1,486 1,544 57 3.9 1.18 1.13 New Con: Res Hms 0 536,975 536,975 0.0 0 7,620 7,620 0.0 0.00 1.42 New Con: Other 0 256,584 256,584 0.0 0 8,313 8,313 0.0 0.00 3.24
Total 20,808,479 23,177,399 2,368,920 11.4 391,495 408,605 17,110 4.4 1.88 1.76
Tax Base Tax Rates Pctg Net Tax Cap (Pctg) Ref Mkt Val (mills) Baseline Alternative Change Chng Base Alter Base Alter Total Tax Capacity 356,822 396,476 39,654 11.1 County 25.35 23.57 0.000 0.00 (-) TIF Tax Capacity 18,138 20,071 1,933 10.7 City/Town 26.03 23.02 0.111 0.10 (-) FD Contrib Tax Capacity 39,805 44,023 4,218 10.6 School District 51.20 47.67 1.639 1.723 (=) Taxable Tax Capacity 298,879 332,382 33,503 11.2 Special District 3.70 3.73 0.000 0.00
FD Distrib Tax Capacity 40,914 46,842 5,928 14.5 Total 106.28 97.99 1.750 1.823
Tax Burdens on Hypothetical Properties Taxable Market Net Tax Effective Value Pctg Pctg Tax Rates Baseline Alternative Chng Baseline Alternative Change Chng Base Alter Res Hmstd: Lo Val 99,300 107,700 8.5 1,088 1,147 59 5.4 1.095 1.065 Res Hmstd: Avg Val 148,900 161,500 8.5 1,957 2,032 75 3.8 1.314 1.257 Res Hmstd: Hi Val 198,500 215,300 8.5 2,913 2,999 86 3.0 1.467 1.393 Res Hmstd: Ex-Hi Val 297,800 323,000 8.5 4,828 4,937 109 2.3 1.621 1.528 Apartment (Mkt rate) 300,000 315,100 5.0 8,177 7,985 -192 -2.3 2.725 2.534 Comm/Ind: Lo Val 150,000 158,000 5.3 4,089 4,083 -6 -0.2 2.725 2.583 Comm/Ind: Med Val 300,000 316,000 5.3 9,772 9,635 -137 -1.4 3.257 3.049 Comm/Ind: Hi Val 1,000,000 1,053,200 5.3 36,294 35,543 -750 -2.1 3.629 3.374

House Research Dept. Simulation 1H2 Baseline: Preliminary Pay 2001 Page 25 04/25/2001 12:31 PM Alternative: Proj Pay 2002: Current Law (Revised 4/25) (all figures in $000s)
CARVER & SCOTT COUNTIES
Tax Burdens by Taxable Market Value Net Tax Effective Property Class Pctg Pctg Tax Rates Baseline Alternative Change Chng Baseline Alternative Change Chng Base Alter Res Hmstd 6,951,936 7,491,422 539,486 7.8 109,808 109,548 -260 -0.2 1.58 1.46 Res NonHmstd 1Un 217,325 219,003 1,678 0.8 4,001 3,729 -272 -6.8 1.84 1.70 Res NonHmstd 2-3 152,616 156,039 3,423 2.2 3,299 3,126 -173 -5.2 2.16 2.00 Reg Apartments 104,287 112,701 8,414 8.1 3,168 3,169 1 0.0 3.04 2.81 Low-income Apts 55,126 57,097 1,970 3.6 770 746 -24 -3.2 1.40 1.31 Seasonal Rec 28,980 30,947 1,967 6.8 557 552 -5 -0.9 1.92 1.78 Com/Ind Lo Tier 214,940 224,265 9,325 4.3 6,822 6,712 -110 -1.6 3.17 2.99 Com/Ind Hi Tier 967,939 1,050,228 82,289 8.5 41,928 42,716 789 1.9 4.33 4.07 Publ U: Elec Gen 16,893 17,146 253 1.5 667 641 -26 -3.9 3.95 3.74 Publ U: Other 99,920 101,419 1,499 1.5 4,346 4,143 -203 -4.7 4.35 4.08 Ag Hmstd: House 345,298 368,903 23,605 6.8 4,301 4,419 118 2.7 1.25 1.20 Ag Hmstd: Land 406,748 427,263 20,515 5.0 2,146 2,168 22 1.0 0.53 0.51 Ag NonHmstd 132,404 140,218 7,814 5.9 1,632 1,635 2 0.2 1.23 1.17 New Con: Res Hms 0 548,660 548,660 0.0 0 8,376 8,376 0.0 0.00 1.53 New Con: Other 0 181,335 181,335 0.0 0 5,570 5,570 0.0 0.00 3.07
Total 9,694,413 11,126,645 1,432,232 14.8 183,443 197,247 13,804 7.5 1.89 1.77
Tax Base Tax Rates Pctg Net Tax Cap (Pctg) Ref Mkt Val (mills) Baseline Alternative Change Chng Base Alter Base Alter Total Tax Capacity 152,721 176,712 23,991 15.7 County 36.72 32.83 0.000 0.00 (-) TIF Tax Capacity 14,645 16,710 2,065 14.1 City/Town 22.74 19.71 0.120 0.10 (-) FD Contrib Tax Capacity 11,545 13,907 2,362 20.5 School District 54.86 51.20 1.685 1.794 (=) Taxable Tax Capacity 126,530 146,095 19,565 15.5 Special District 3.62 3.68 0.000 0.00
FD Distrib Tax Capacity 15,384 17,613 2,229 14.5 Total 117.93 107.43 1.805 1.898
Tax Burdens on Hypothetical Properties Taxable Market Net Tax Effective Value Pctg Pctg Tax Rates Baseline Alternative Chng Baseline Alternative Change Chng Base Alter Res Hmstd: Lo Val 105,600 113,800 7.8 1,341 1,381 40 3.0 1.270 1.213 Res Hmstd: Avg Val 158,400 170,700 7.8 2,396 2,429 33 1.4 1.512 1.423 Res Hmstd: Hi Val 211,100 227,500 7.8 3,516 3,544 28 0.8 1.665 1.557 Res Hmstd: Ex-Hi Val 316,800 341,400 7.8 5,764 5,779 15 0.3 1.819 1.692 Apartment (Mkt rate) 300,000 324,200 8.1 9,033 8,974 -58 -0.6 3.010 2.768 Comm/Ind: Lo Val 150,000 162,800 8.5 4,517 4,644 128 2.8 3.011 2.852 Comm/Ind: Med Val 300,000 325,500 8.5 10,802 10,896 94 0.9 3.600 3.347 Comm/Ind: Hi Val 1,000,000 1,085,000 8.5 40,135 40,081 -54 -0.1 4.013 3.694

House Research Dept. Simulation 1H2 Baseline: Preliminary Pay 2001 Page 26 04/25/2001 12:31 PM Alternative: Proj Pay 2002: Current Law (Revised 4/25) (all figures in $000s)
NORTHERN HENNEPIN CO.
Tax Burdens by Taxable Market Value Net Tax Effective Property Class Pctg Pctg Tax Rates Baseline Alternative Change Chng Baseline Alternative Change Chng Base Alter Res Hmstd 9,451,235 10,252,914 801,678 8.5 143,073 145,952 2,879 2.0 1.51 1.42 Res NonHmstd 1Un 202,529 223,193 20,664 10.2 3,856 4,021 166 4.3 1.90 1.80 Res NonHmstd 2-3 118,225 124,038 5,813 4.9 2,684 2,641 -43 -1.6 2.27 2.13 Reg Apartments 489,813 586,666 96,852 19.8 15,910 17,433 1,523 9.6 3.25 2.97 Low-income Apts 151,118 185,746 34,628 22.9 2,227 2,522 296 13.3 1.47 1.36 Seasonal Rec 10,019 10,456 437 4.4 216 212 -4 -1.7 2.15 2.03 Com/Ind Lo Tier 267,497 274,543 7,046 2.6 8,899 8,565 -334 -3.8 3.33 3.12 Com/Ind Hi Tier 2,040,023 2,145,537 105,514 5.2 95,121 93,832 -1,289 -1.4 4.66 4.37 Publ U: Elec Gen 0 0 0 0.0 0 0 0 0.0 0.00 0.00 Publ U: Other 162,987 165,432 2,445 1.5 7,495 7,191 -304 -4.1 4.60 4.35 Ag Hmstd: House 56,696 58,624 1,928 3.4 868 888 20 2.3 1.53 1.51 Ag Hmstd: Land 57,418 59,010 1,593 2.8 346 354 8 2.4 0.60 0.60 Ag NonHmstd 55,511 57,935 2,425 4.4 816 821 5 0.6 1.47 1.42 New Con: Res Hms 0 355,653 355,653 0.0 0 5,937 5,937 0.0 0.00 1.67 New Con: Other 0 211,479 211,479 0.0 0 8,321 8,321 0.0 0.00 3.93
Total 13,063,072 14,711,226 1,648,154 12.6 281,510 298,690 17,179 6.1 2.16 2.03
Tax Base Tax Rates Pctg Net Tax Cap (Pctg) Ref Mkt Val (mills) Baseline Alternative Change Chng Base Alter Base Alter Total Tax Capacity 220,988 249,786 28,798 13.0 County 37.59 35.23 0.000 0.00 (-) TIF Tax Capacity 26,496 30,081 3,585 13.5 City/Town 27.87 25.88 0.166 0.14 (-) FD Contrib Tax Capacity 25,999 29,779 3,779 14.5 School District 53.95 48.56 1.524 1.587 (=) Taxable Tax Capacity 168,492 189,927 21,434 12.7 Special District 8.06 8.14 0.000 0.00
FD Distrib Tax Capacity 34,105 39,047 4,942 14.5 Total 127.48 117.81 1.690 1.734
Tax Burdens on Hypothetical Properties Taxable Market Net Tax Effective Value Pctg Pctg Tax Rates Baseline Alternative Chng Baseline Alternative Change Chng Base Alter Res Hmstd: Lo Val 85,200 92,400 8.5 1,066 1,131 65 6.1 1.251 1.224 Res Hmstd: Avg Val 127,800 138,600 8.5 1,884 1,963 78 4.1 1.474 1.415 Res Hmstd: Hi Val 170,300 184,700 8.5 2,850 2,939 88 3.1 1.673 1.590 Res Hmstd: Ex-Hi Val 255,600 277,300 8.5 4,788 4,899 111 2.3 1.873 1.766 Apartment (Mkt rate) 300,000 359,300 19.8 9,685 10,782 1,096 11.3 3.228 3.000 Comm/Ind: Lo Val 150,000 157,800 5.2 4,843 4,827 -15 -0.3 3.228 3.059 Comm/Ind: Med Val 300,000 315,500 5.2 11,598 11,418 -180 -1.6 3.865 3.618 Comm/Ind: Hi Val 1,000,000 1,051,700 5.2 43,121 42,183 -938 -2.2 4.312 4.010

House Research Dept. Simulation 1H2 Baseline: Preliminary Pay 2001 Page 27 04/25/2001 12:31 PM Alternative: Proj Pay 2002: Current Law (Revised 4/25) (all figures in $000s)
SOUTHEAST HENNEPIN CO.
Tax Burdens by Taxable Market Value Net Tax Effective Property Class Pctg Pctg Tax Rates Baseline Alternative Change Chng Baseline Alternative Change Chng Base Alter Res Hmstd 12,102,517 13,131,231 1,028,714 8.5 183,076 189,527 6,450 3.5 1.51 1.44 Res NonHmstd 1Un 377,151 409,284 32,133 8.5 6,774 7,031 257 3.8 1.80 1.72 Res NonHmstd 2-3 126,687 137,370 10,683 8.4 2,665 2,730 65 2.4 2.10 1.99 Reg Apartments 1,198,327 1,373,153 174,826 14.6 35,511 38,602 3,091 8.7 2.96 2.81 Low-income Apts 156,567 177,900 21,333 13.6 2,118 2,295 177 8.4 1.35 1.29 Seasonal Rec 5,752 5,817 64 1.1 108 104 -4 -3.9 1.88 1.78 Com/Ind Lo Tier 339,978 342,127 2,149 0.6 10,612 10,217 -395 -3.7 3.12 2.99 Com/Ind Hi Tier 5,237,968 5,483,188 245,221 4.7 225,303 225,286 -17 0.0 4.30 4.11 Publ U: Elec Gen 721 732 11 1.5 31 30 -1 -4.1 4.36 4.11 Publ U: Other 142,291 144,425 2,134 1.5 6,127 5,933 -194 -3.2 4.31 4.11 Ag Hmstd: House 451 489 38 8.5 7 8 0 5.2 1.61 1.56 Ag Hmstd: Land 160 160 0 0.0 1 1 0 -3.6 0.37 0.36 Ag NonHmstd 42 42 0 0.0 1 1 0 -3.9 1.27 1.22 New Con: Res Hms 0 92,215 92,215 0.0 0 1,419 1,419 0.0 0.00 1.54 New Con: Other 0 218,974 218,974 0.0 0 8,172 8,172 0.0 0.00 3.73
Total 19,688,611 21,517,106 1,828,495 9.3 472,334 491,355 19,020 4.0 2.40 2.28
Tax Base Tax Rates Pctg Net Tax Cap (Pctg) Ref Mkt Val (mills) Baseline Alternative Change Chng Base Alter Base Alter Total Tax Capacity 391,244 426,671 35,428 9.1 County 37.60 35.23 0.000 0.00 (-) TIF Tax Capacity 37,384 40,475 3,091 8.3 City/Town 21.44 20.38 0.037 0.03 (-) FD Contrib Tax Capacity 54,270 60,452 6,182 11.4 School District 46.13 42.54 1.975 2.064 (=) Taxable Tax Capacity 299,589 325,744 26,155 8.7 Special District 9.06 9.18 0.000 0.00
FD Distrib Tax Capacity 23,414 26,806 3,393 14.5 Total 114.23 107.33 2.012 2.097
Tax Burdens on Hypothetical Properties Taxable Market Net Tax Effective Value Pctg Pctg Tax Rates Baseline Alternative Chng Baseline Alternative Change Chng Base Alter Res Hmstd: Lo Val 105,800 114,800 8.5 1,302 1,394 92 7.0 1.230 1.214 Res Hmstd: Avg Val 158,600 172,100 8.5 2,354 2,488 135 5.7 1.484 1.445 Res Hmstd: Hi Val 211,500 229,500 8.5 3,457 3,625 168 4.9 1.634 1.579 Res Hmstd: Ex-Hi Val 317,300 344,300 8.5 5,664 5,899 235 4.1 1.785 1.713 Apartment (Mkt rate) 300,000 343,800 14.6 8,828 9,577 749 8.5 2.942 2.785 Comm/Ind: Lo Val 150,000 157,000 4.7 4,414 4,449 35 0.8 2.942 2.833 Comm/Ind: Med Val 300,000 314,000 4.7 10,542 10,508 -34 -0.3 3.513 3.346 Comm/Ind: Hi Val 1,000,000 1,046,800 4.7 39,137 38,787 -350 -0.9 3.913 3.705

House Research Dept. Simulation 1H2 Baseline: Preliminary Pay 2001 Page 28 04/25/2001 12:31 PM Alternative: Proj Pay 2002: Current Law (Revised 4/25) (all figures in $000s)
SOUTHWEST HENNEPIN CO.
Tax Burdens by Taxable Market Value Net Tax Effective Property Class Pctg Pctg Tax Rates Baseline Alternative Change Chng Baseline Alternative Change Chng Base Alter Res Hmstd 15,073,746 16,355,015 1,281,268 8.5 243,568 252,261 8,692 3.6 1.62 1.54 Res NonHmstd 1Un 614,269 681,539 67,271 11.0 11,364 12,137 773 6.8 1.85 1.78 Res NonHmstd 2-3 224,185 228,174 3,989 1.8 4,635 4,485 -150 -3.2 2.07 1.97 Reg Apartments 895,365 1,007,357 111,992 12.5 25,710 27,200 1,489 5.8 2.87 2.70 Low-income Apts 71,516 78,762 7,245 10.1 956 1,003 47 4.9 1.34 1.27 Seasonal Rec 70,997 74,184 3,187 4.5 1,330 1,348 18 1.4 1.87 1.82 Com/Ind Lo Tier 294,868 301,713 6,845 2.3 9,116 8,931 -185 -2.0 3.09 2.96 Com/Ind Hi Tier 4,075,287 4,319,973 244,686 6.0 175,333 177,154 1,820 1.0 4.30 4.10 Publ U: Elec Gen 369 374 6 1.5 16 16 0 -2.9 4.47 4.28 Publ U: Other 170,688 173,248 2,560 1.5 7,304 7,085 -219 -3.0 4.28 4.09 Ag Hmstd: House 54,158 56,174 2,016 3.7 824 814 -10 -1.2 1.52 1.45 Ag Hmstd: Land 39,716 40,338 623 1.6 215 208 -7 -3.2 0.54 0.52 Ag NonHmstd 49,538 50,484 946 1.9 614 606 -8 -1.3 1.24 1.20 New Con: Res Hms 0 340,766 340,766 0.0 0 5,118 5,118 0.0 0.00 1.50 New Con: Other 0 302,553 302,553 0.0 0 10,758 10,758 0.0 0.00 3.56
Total 21,634,701 24,010,654 2,375,953 11.0 480,986 509,122 28,136 5.8 2.22 2.12
Tax Base Tax Rates Pctg Net Tax Cap (Pctg) Ref Mkt Val (mills) Baseline Alternative Change Chng Base Alter Base Alter Total Tax Capacity 403,475 448,008 44,533 11.0 County 37.60 35.23 0.000 0.00 (-) TIF Tax Capacity 8,112 9,084 973 12.0 City/Town 19.09 17.50 0.059 0.05 (-) FD Contrib Tax Capacity 51,184 58,266 7,082 13.8 School District 46.58 43.39 2.103 2.225 (=) Taxable Tax Capacity 344,179 380,658 36,478 10.6 Special District 7.44 7.54 0.000 0.00
FD Distrib Tax Capacity 17,285 19,789 2,505 14.5 Total 110.71 103.65 2.161 2.277
Tax Burdens on Hypothetical Properties Taxable Market Net Tax Effective Value Pctg Pctg Tax Rates Baseline Alternative Chng Baseline Alternative Change Chng Base Alter Res Hmstd: Lo Val 143,500 155,700 8.5 1,995 2,115 121 6.1 1.389 1.358 Res Hmstd: Avg Val 215,200 233,500 8.5 3,459 3,623 164 4.7 1.607 1.551 Res Hmstd: Hi Val 286,900 311,300 8.5 4,924 5,131 207 4.2 1.716 1.648 Res Hmstd: Ex-Hi Val 430,400 467,000 8.5 7,856 8,148 293 3.7 1.825 1.744 Apartment (Mkt rate) 300,000 337,500 12.5 8,620 9,164 545 6.3 2.873 2.715 Comm/Ind: Lo Val 150,000 159,000 6.0 4,310 4,411 101 2.3 2.873 2.774 Comm/Ind: Med Val 300,000 318,000 6.0 10,281 10,377 96 0.9 3.427 3.263 Comm/Ind: Hi Val 1,000,000 1,060,000 6.0 38,145 38,219 74 0.2 3.814 3.605
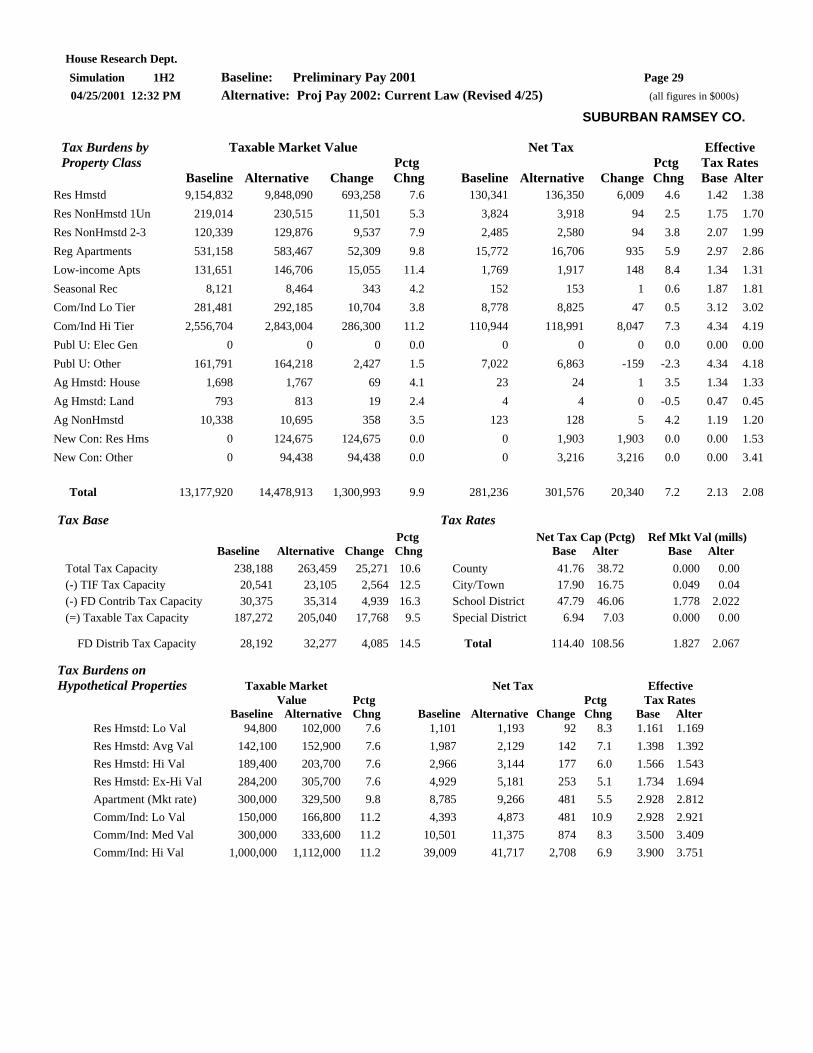
House Research Dept. Simulation 1H2 Baseline: Preliminary Pay 2001 Page 29 04/25/2001 12:32 PM Alternative: Proj Pay 2002: Current Law (Revised 4/25) (all figures in $000s)
SUBURBAN RAMSEY CO.
Tax Burdens by Taxable Market Value Net Tax Effective Property Class Pctg Pctg Tax Rates Baseline Alternative Change Chng Baseline Alternative Change Chng Base Alter Res Hmstd 9,154,832 9,848,090 693,258 7.6 130,341 136,350 6,009 4.6 1.42 1.38 Res NonHmstd 1Un 219,014 230,515 11,501 5.3 3,824 3,918 94 2.5 1.75 1.70 Res NonHmstd 2-3 120,339 129,876 9,537 7.9 2,485 2,580 94 3.8 2.07 1.99 Reg Apartments 531,158 583,467 52,309 9.8 15,772 16,706 935 5.9 2.97 2.86 Low-income Apts 131,651 146,706 15,055 11.4 1,769 1,917 148 8.4 1.34 1.31 Seasonal Rec 8,121 8,464 343 4.2 152 153 1 0.6 1.87 1.81 Com/Ind Lo Tier 281,481 292,185 10,704 3.8 8,778 8,825 47 0.5 3.12 3.02 Com/Ind Hi Tier 2,556,704 2,843,004 286,300 11.2 110,944 118,991 8,047 7.3 4.34 4.19 Publ U: Elec Gen 0 0 0 0.0 0 0 0 0.0 0.00 0.00 Publ U: Other 161,791 164,218 2,427 1.5 7,022 6,863 -159 -2.3 4.34 4.18 Ag Hmstd: House 1,698 1,767 69 4.1 23 24 1 3.5 1.34 1.33 Ag Hmstd: Land 793 813 19 2.4 4 4 0 -0.5 0.47 0.45 Ag NonHmstd 10,338 10,695 358 3.5 123 128 5 4.2 1.19 1.20 New Con: Res Hms 0 124,675 124,675 0.0 0 1,903 1,903 0.0 0.00 1.53 New Con: Other 0 94,438 94,438 0.0 0 3,216 3,216 0.0 0.00 3.41
Total 13,177,920 14,478,913 1,300,993 9.9 281,236 301,576 20,340 7.2 2.13 2.08
Tax Base Tax Rates Pctg Net Tax Cap (Pctg) Ref Mkt Val (mills) Baseline Alternative Change Chng Base Alter Base Alter Total Tax Capacity 238,188 263,459 25,271 10.6 County 41.76 38.72 0.000 0.00 (-) TIF Tax Capacity 20,541 23,105 2,564 12.5 City/Town 17.90 16.75 0.049 0.04 (-) FD Contrib Tax Capacity 30,375 35,314 4,939 16.3 School District 47.79 46.06 1.778 2.022 (=) Taxable Tax Capacity 187,272 205,040 17,768 9.5 Special District 6.94 7.03 0.000 0.00
FD Distrib Tax Capacity 28,192 32,277 4,085 14.5 Total 114.40 108.56 1.827 2.067
Tax Burdens on Hypothetical Properties Taxable Market Net Tax Effective Value Pctg Pctg Tax Rates Baseline Alternative Chng Baseline Alternative Change Chng Base Alter Res Hmstd: Lo Val 94,800 102,000 7.6 1,101 1,193 92 8.3 1.161 1.169 Res Hmstd: Avg Val 142,100 152,900 7.6 1,987 2,129 142 7.1 1.398 1.392 Res Hmstd: Hi Val 189,400 203,700 7.6 2,966 3,144 177 6.0 1.566 1.543 Res Hmstd: Ex-Hi Val 284,200 305,700 7.6 4,929 5,181 253 5.1 1.734 1.694 Apartment (Mkt rate) 300,000 329,500 9.8 8,785 9,266 481 5.5 2.928 2.812 Comm/Ind: Lo Val 150,000 166,800 11.2 4,393 4,873 481 10.9 2.928 2.921 Comm/Ind: Med Val 300,000 333,600 11.2 10,501 11,375 874 8.3 3.500 3.409 Comm/Ind: Hi Val 1,000,000 1,112,000 11.2 39,009 41,717 2,708 6.9 3.900 3.751
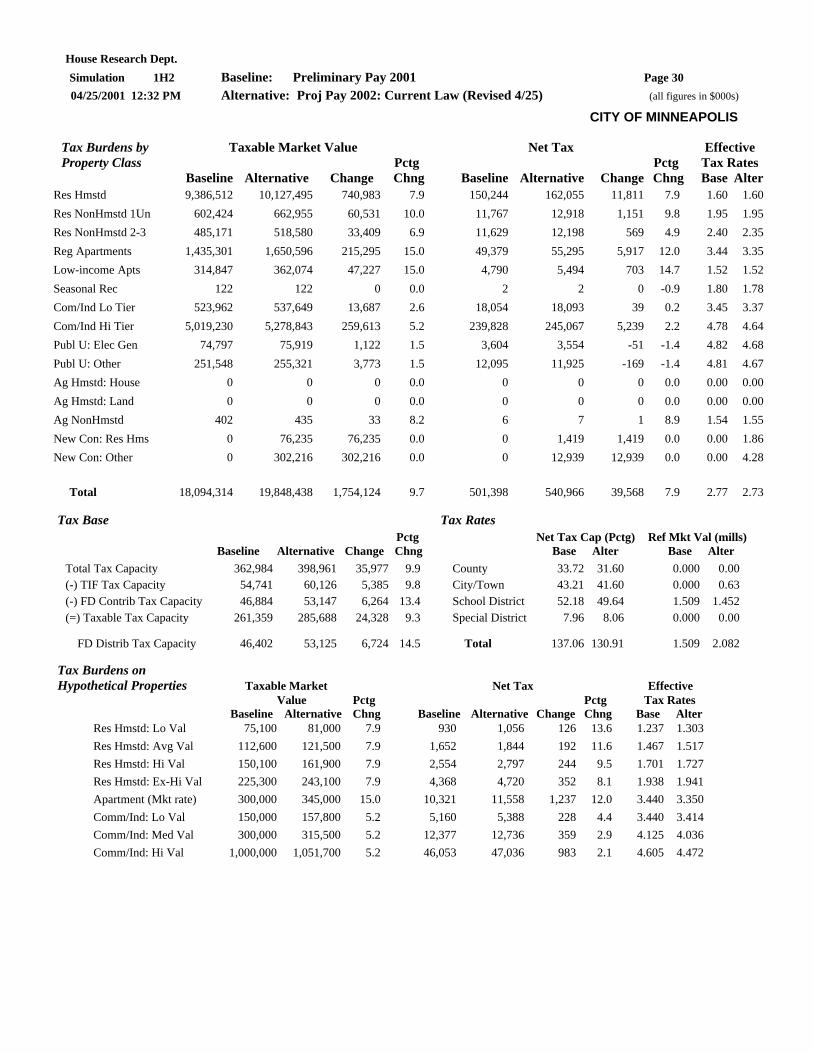
House Research Dept. Simulation 1H2 Baseline: Preliminary Pay 2001 Page 30 04/25/2001 12:32 PM Alternative: Proj Pay 2002: Current Law (Revised 4/25) (all figures in $000s)
CITY OF MINNEAPOLIS
Tax Burdens by Taxable Market Value Net Tax Effective Property Class Pctg Pctg Tax Rates Baseline Alternative Change Chng Baseline Alternative Change Chng Base Alter Res Hmstd 9,386,512 10,127,495 740,983 7.9 150,244 162,055 11,811 7.9 1.60 1.60 Res NonHmstd 1Un 602,424 662,955 60,531 10.0 11,767 12,918 1,151 9.8 1.95 1.95 Res NonHmstd 2-3 485,171 518,580 33,409 6.9 11,629 12,198 569 4.9 2.40 2.35 Reg Apartments 1,435,301 1,650,596 215,295 15.0 49,379 55,295 5,917 12.0 3.44 3.35 Low-income Apts 314,847 362,074 47,227 15.0 4,790 5,494 703 14.7 1.52 1.52 Seasonal Rec 122 122 0 0.0 2 2 0 -0.9 1.80 1.78 Com/Ind Lo Tier 523,962 537,649 13,687 2.6 18,054 18,093 39 0.2 3.45 3.37 Com/Ind Hi Tier 5,019,230 5,278,843 259,613 5.2 239,828 245,067 5,239 2.2 4.78 4.64 Publ U: Elec Gen 74,797 75,919 1,122 1.5 3,604 3,554 -51 -1.4 4.82 4.68 Publ U: Other 251,548 255,321 3,773 1.5 12,095 11,925 -169 -1.4 4.81 4.67 Ag Hmstd: House 0 0 0 0.0 0 0 0 0.0 0.00 0.00 Ag Hmstd: Land 0 0 0 0.0 0 0 0 0.0 0.00 0.00 Ag NonHmstd 402 435 33 8.2 6 7 1 8.9 1.54 1.55 New Con: Res Hms 0 76,235 76,235 0.0 0 1,419 1,419 0.0 0.00 1.86 New Con: Other 0 302,216 302,216 0.0 0 12,939 12,939 0.0 0.00 4.28
Total 18,094,314 19,848,438 1,754,124 9.7 501,398 540,966 39,568 7.9 2.77 2.73
Tax Base Tax Rates Pctg Net Tax Cap (Pctg) Ref Mkt Val (mills) Baseline Alternative Change Chng Base Alter Base Alter Total Tax Capacity 362,984 398,961 35,977 9.9 County 33.72 31.60 0.000 0.00 (-) TIF Tax Capacity 54,741 60,126 5,385 9.8 City/Town 43.21 41.60 0.000 0.63 (-) FD Contrib Tax Capacity 46,884 53,147 6,264 13.4 School District 52.18 49.64 1.509 1.452 (=) Taxable Tax Capacity 261,359 285,688 24,328 9.3 Special District 7.96 8.06 0.000 0.00
FD Distrib Tax Capacity 46,402 53,125 6,724 14.5 Total 137.06 130.91 1.509 2.082
Tax Burdens on Hypothetical Properties Taxable Market Net Tax Effective Value Pctg Pctg Tax Rates Baseline Alternative Chng Baseline Alternative Change Chng Base Alter Res Hmstd: Lo Val 75,100 81,000 7.9 930 1,056 126 13.6 1.237 1.303 Res Hmstd: Avg Val 112,600 121,500 7.9 1,652 1,844 192 11.6 1.467 1.517 Res Hmstd: Hi Val 150,100 161,900 7.9 2,554 2,797 244 9.5 1.701 1.727 Res Hmstd: Ex-Hi Val 225,300 243,100 7.9 4,368 4,720 352 8.1 1.938 1.941 Apartment (Mkt rate) 300,000 345,000 15.0 10,321 11,558 1,237 12.0 3.440 3.350 Comm/Ind: Lo Val 150,000 157,800 5.2 5,160 5,388 228 4.4 3.440 3.414 Comm/Ind: Med Val 300,000 315,500 5.2 12,377 12,736 359 2.9 4.125 4.036 Comm/Ind: Hi Val 1,000,000 1,051,700 5.2 46,053 47,036 983 2.1 4.605 4.472
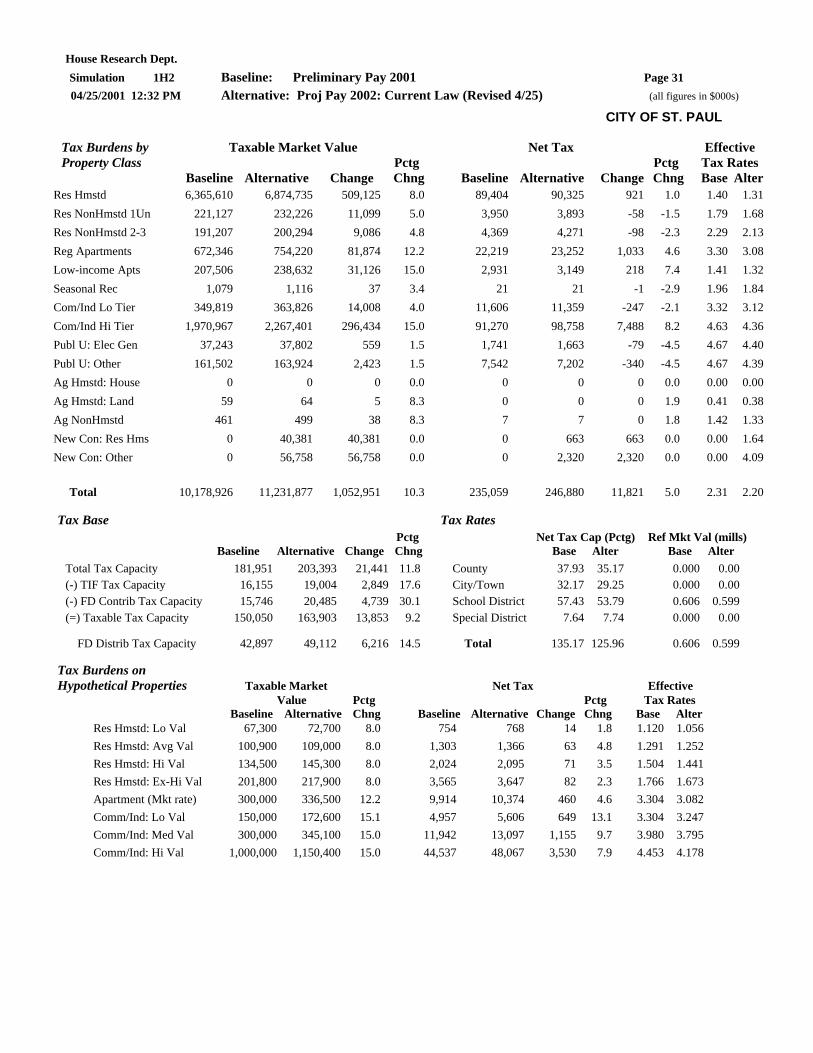
House Research Dept. Simulation 1H2 Baseline: Preliminary Pay 2001 Page 31 04/25/2001 12:32 PM Alternative: Proj Pay 2002: Current Law (Revised 4/25) (all figures in $000s)
CITY OF ST. PAUL
Tax Burdens by Taxable Market Value Net Tax Effective Property Class Pctg Pctg Tax Rates Baseline Alternative Change Chng Baseline Alternative Change Chng Base Alter Res Hmstd 6,365,610 6,874,735 509,125 8.0 89,404 90,325 921 1.0 1.40 1.31 Res NonHmstd 1Un 221,127 232,226 11,099 5.0 3,950 3,893 -58 -1.5 1.79 1.68 Res NonHmstd 2-3 191,207 200,294 9,086 4.8 4,369 4,271 -98 -2.3 2.29 2.13 Reg Apartments 672,346 754,220 81,874 12.2 22,219 23,252 1,033 4.6 3.30 3.08 Low-income Apts 207,506 238,632 31,126 15.0 2,931 3,149 218 7.4 1.41 1.32 Seasonal Rec 1,079 1,116 37 3.4 21 21 -1 -2.9 1.96 1.84 Com/Ind Lo Tier 349,819 363,826 14,008 4.0 11,606 11,359 -247 -2.1 3.32 3.12 Com/Ind Hi Tier 1,970,967 2,267,401 296,434 15.0 91,270 98,758 7,488 8.2 4.63 4.36 Publ U: Elec Gen 37,243 37,802 559 1.5 1,741 1,663 -79 -4.5 4.67 4.40 Publ U: Other 161,502 163,924 2,423 1.5 7,542 7,202 -340 -4.5 4.67 4.39 Ag Hmstd: House 0 0 0 0.0 0 0 0 0.0 0.00 0.00 Ag Hmstd: Land 59 64 5 8.3 0 0 0 1.9 0.41 0.38 Ag NonHmstd 461 499 38 8.3 7 7 0 1.8 1.42 1.33 New Con: Res Hms 0 40,381 40,381 0.0 0 663 663 0.0 0.00 1.64 New Con: Other 0 56,758 56,758 0.0 0 2,320 2,320 0.0 0.00 4.09
Total 10,178,926 11,231,877 1,052,951 10.3 235,059 246,880 11,821 5.0 2.31 2.20
Tax Base Tax Rates Pctg Net Tax Cap (Pctg) Ref Mkt Val (mills) Baseline Alternative Change Chng Base Alter Base Alter Total Tax Capacity 181,951 203,393 21,441 11.8 County 37.93 35.17 0.000 0.00 (-) TIF Tax Capacity 16,155 19,004 2,849 17.6 City/Town 32.17 29.25 0.000 0.00 (-) FD Contrib Tax Capacity 15,746 20,485 4,739 30.1 School District 57.43 53.79 0.606 0.599 (=) Taxable Tax Capacity 150,050 163,903 13,853 9.2 Special District 7.64 7.74 0.000 0.00
FD Distrib Tax Capacity 42,897 49,112 6,216 14.5 Total 135.17 125.96 0.606 0.599
Tax Burdens on Hypothetical Properties Taxable Market Net Tax Effective Value Pctg Pctg Tax Rates Baseline Alternative Chng Baseline Alternative Change Chng Base Alter Res Hmstd: Lo Val 67,300 72,700 8.0 754 768 14 1.8 1.120 1.056 Res Hmstd: Avg Val 100,900 109,000 8.0 1,303 1,366 63 4.8 1.291 1.252 Res Hmstd: Hi Val 134,500 145,300 8.0 2,024 2,095 71 3.5 1.504 1.441 Res Hmstd: Ex-Hi Val 201,800 217,900 8.0 3,565 3,647 82 2.3 1.766 1.673 Apartment (Mkt rate) 300,000 336,500 12.2 9,914 10,374 460 4.6 3.304 3.082 Comm/Ind: Lo Val 150,000 172,600 15.1 4,957 5,606 649 13.1 3.304 3.247 Comm/Ind: Med Val 300,000 345,100 15.0 11,942 13,097 1,155 9.7 3.980 3.795 Comm/Ind: Hi Val 1,000,000 1,150,400 15.0 44,537 48,067 3,530 7.9 4.453 4.178
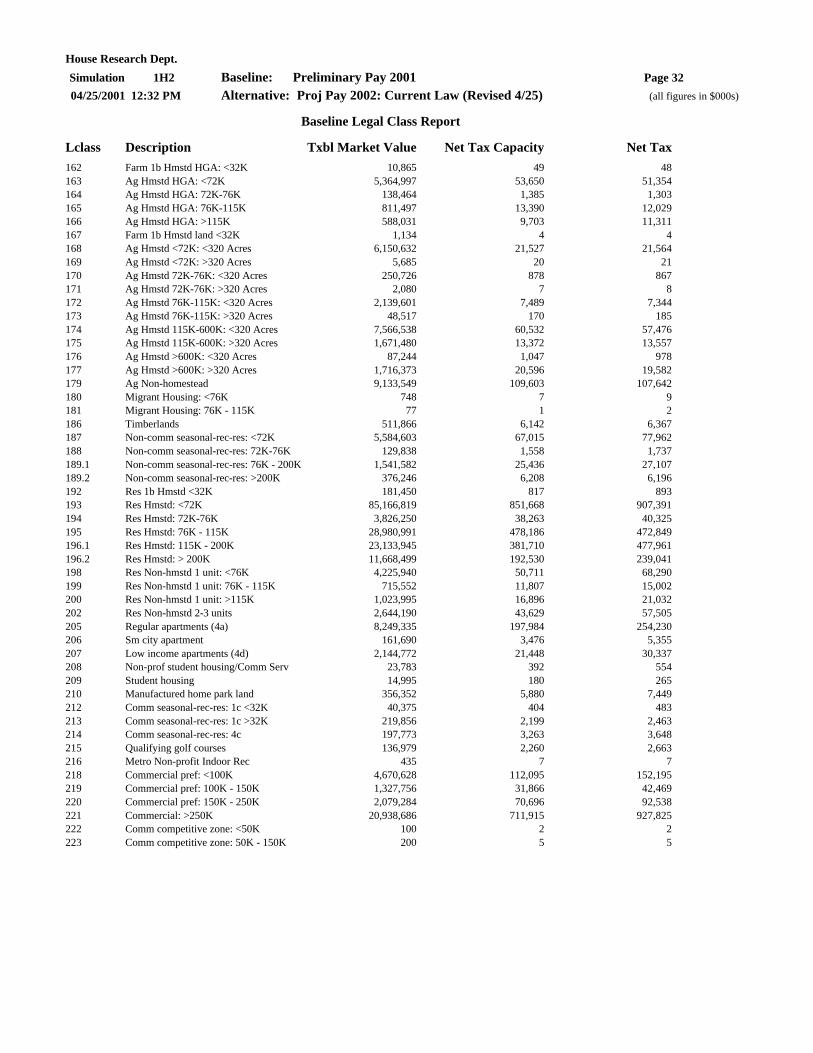
House Research Dept. Simulation 1H2 Baseline: Preliminary Pay 2001 Page 32 04/25/2001 12:32 PM Alternative: Proj Pay 2002: Current Law (Revised 4/25) (all figures in $000s)
Baseline Legal Class Report
Lclass Description Txbl Market Value Net Tax Capacity Net Tax 162 Farm 1b Hmstd HGA: <32K 10,865 49 48 163 Ag Hmstd HGA: <72K 5,364,997 53,650 51,354 164 Ag Hmstd HGA: 72K-76K 138,464 1,385 1,303 165 Ag Hmstd HGA: 76K-115K 811,497 13,390 12,029 166 Ag Hmstd HGA: >115K 588,031 9,703 11,311 167 Farm 1b Hmstd land <32K 1,134 4 4 168 Ag Hmstd <72K: <320 Acres 6,150,632 21,527 21,564 169 Ag Hmstd <72K: >320 Acres 5,685 20 21 170 Ag Hmstd 72K-76K: <320 Acres 250,726 878 867 171 Ag Hmstd 72K-76K: >320 Acres 2,080 7 8 172 Ag Hmstd 76K-115K: <320 Acres 2,139,601 7,489 7,344 173 Ag Hmstd 76K-115K: >320 Acres 48,517 170 185 174 Ag Hmstd 115K-600K: <320 Acres 7,566,538 60,532 57,476 175 Ag Hmstd 115K-600K: >320 Acres 1,671,480 13,372 13,557 176 Ag Hmstd >600K: <320 Acres 87,244 1,047 978 177 Ag Hmstd >600K: >320 Acres 1,716,373 20,596 19,582 179 Ag Non-homestead 9,133,549 109,603 107,642 180 Migrant Housing: <76K 748 7 9 181 Migrant Housing: 76K - 115K 77 1 2 186 Timberlands 511,866 6,142 6,367 187 Non-comm seasonal-rec-res: <72K 5,584,603 67,015 77,962 188 Non-comm seasonal-rec-res: 72K-76K 129,838 1,558 1,737 189.1 Non-comm seasonal-rec-res: 76K - 200K 1,541,582 25,436 27,107 189.2 Non-comm seasonal-rec-res: >200K 376,246 6,208 6,196 192 Res 1b Hmstd <32K 181,450 817 893 193 Res Hmstd: <72K 85,166,819 851,668 907,391 194 Res Hmstd: 72K-76K 3,826,250 38,263 40,325 195 Res Hmstd: 76K - 115K 28,980,991 478,186 472,849 196.1 Res Hmstd: 115K - 200K 23,133,945 381,710 477,961 196.2 Res Hmstd: > 200K 11,668,499 192,530 239,041 198 Res Non-hmstd 1 unit: <76K 4,225,940 50,711 68,290 199 Res Non-hmstd 1 unit: 76K - 115K 715,552 11,807 15,002 200 Res Non-hmstd 1 unit: >115K 1,023,995 16,896 21,032 202 Res Non-hmstd 2-3 units 2,644,190 43,629 57,505 205 Regular apartments (4a) 8,249,335 197,984 254,230 206 Sm city apartment 161,690 3,476 5,355 207 Low income apartments (4d) 2,144,772 21,448 30,337 208 Non-prof student housing/Comm Serv 23,783 392 554 209 Student housing 14,995 180 265 210 Manufactured home park land 356,352 5,880 7,449 212 Comm seasonal-rec-res: 1c <32K 40,375 404 483 213 Comm seasonal-rec-res: 1c >32K 219,856 2,199 2,463 214 Comm seasonal-rec-res: 4c 197,773 3,263 3,648 215 Qualifying golf courses 136,979 2,260 2,663 216 Metro Non-profit Indoor Rec 435 7 7 218 Commercial pref: <100K 4,670,628 112,095 152,195 219 Commercial pref: 100K - 150K 1,327,756 31,866 42,469 220 Commercial pref: 150K - 250K 2,079,284 70,696 92,538 221 Commercial: >250K 20,938,686 711,915 927,825 222 Comm competitive zone: <50K 100 2 2 223 Comm competitive zone: 50K - 150K 200 5 5

House Research Dept. Simulation 1H2 Baseline: Preliminary Pay 2001 Page 33 04/25/2001 12:32 PM Alternative: Proj Pay 2002: Current Law (Revised 4/25) (all figures in $000s) 224 Comm competitive zone: >150K 275 9 6 225 Comm border city: <100K 28,349 680 655 226 Comm border city: 100K - 150K 8,111 195 187 227 Comm border city: 150K - 250K 12,437 423 286 228 Comm border city: >250K 37,711 1,282 867 229 Comm transit zone: <100K 4,697 113 155 230 Comm transit zone: 100K-150K 2,243 54 74 231 Comm transit zone struct:150K-250K 6,687 199 279 232 Comm transit zone struct: >250K 433,583 12,899 18,180 233 Comm transit zone exist: 150K-250K 3,610 123 167 234 Comm transit zone exist: >250K 94,481 3,212 4,382 237 Industrial pref: <100K 780,325 18,728 25,277 238 Industrial pref: 100K-150K 328,518 7,884 10,607 239 Industrial pref: 150K-250K 636,290 21,634 28,672 240 Industrial pref: >250K 8,532,158 290,093 376,570 244 Ind border city: <100K 1,015 24 23 245 Ind border city: 100K-150K 352 8 8 246 Ind border city: 150K-250K 1,230 42 28 247 Ind border city: >250K 30,793 1,047 708 248 Ind Transit Zone: <100K 3,614 87 120 249 Ind Transit Zone: 100K-150K 1,721 41 57 250 Ind Transit Zone Struct: 150K-250K 4,843 144 203 251 Ind Transit Zone Struct: >250K 83,767 2,492 3,427 252 Ind Transit Zone exist: 150K-250K 2,840 97 133 253 Ind Transit Zone exist: >250K 27,848 947 1,301 256 Publ Util: land & bldgs <100K 60,118 1,443 1,864 257 Publ Util: land & bldgs: 100K-150K 14,598 350 455 258 Publ Util: land & bldgs >150K 678,662 23,075 29,168 259.1 Publ Util: machinery (exc generat) 849,984 28,899 35,216 259.2 Publ Util: Electric Generat Mach 1,554,961 52,869 66,629 261 Railroad <100K 16,360 393 517 262 Railroad: 100K-150K 7,029 169 218 263 Railroad >150K 462,402 15,722 20,364 265 Mineral 3,612 123 186 266 Misc class 5 1,157 39 56 269 Personal: 3f 11,194 112 148 270 Non-comm aircraft hangars 22,731 375 482 271.1 Pers: It31 tools&mach excl elec gen 111,399 3,788 4,852 271.2 Pers: It31 electric generation mach 15,779 536 511 272 Pers: Item 32 struct/leased land 109,429 1,806 2,268 273 Pers: Item 33 ag real estate 8,693 104 142 275.1 Pers: Item 41 struct excl elec gen 341,931 11,626 10,905 275.2 Pers: It41 electric generation mach 13,438 457 447 276 Pers: Item 41 EZ <100K 518 12 12 277 Pers: Item 41 EZ: 100K-150K 101 2 2 278 Pers: Item 41 EZ >150K 610 21 14 281 Pers: Item 41 TZ: >150K 1,675 50 69 282 Pers: Item 42 struct/RR land 38,875 1,322 1,966 289 Pers: Item 43 leased real estate 233,093 7,925 7,975 290 Pers: Item 44 electric util trans lines 1,368,686 46,535 60,654 291 Pers: Item 44 electric util distri lines 145,678 4,953 6,658 292 Pers: Item 45 syst/gas utils 1,499,189 50,972 62,642 293 Pers: Item 46 syst/water utils 1,317 45 58 294 Pers: Item 48 misc 47,568 1,617 2,039

House Research Dept. Simulation 1H2 Baseline: Preliminary Pay 2001 Page 34 04/25/2001 12:32 PM Alternative: Proj Pay 2002: Current Law (Revised 4/25) (all figures in $000s)
Baseline State Totals 264,651,288 4,267,876 5,036,322
Alternative Legal Class Report
Lclass Description Txbl Market Value Net Tax Capacity Net Tax 162 Farm 1b Hmstd HGA: <32K 11,259 51 51 163 Ag Hmstd HGA: <72K 5,535,736 55,357 54,107 164 Ag Hmstd HGA: 72K-76K 152,065 1,521 1,454 165 Ag Hmstd HGA: 76K-115K 914,827 15,095 13,564 166 Ag Hmstd HGA: >115K 699,024 11,534 12,958 167 Farm 1b Hmstd land <32K 1,170 4 4 168 Ag Hmstd <72K: <320 Acres 6,303,840 22,063 22,474 169 Ag Hmstd <72K: >320 Acres 5,837 20 21 170 Ag Hmstd 72K-76K: <320 Acres 255,985 896 901 171 Ag Hmstd 72K-76K: >320 Acres 2,134 7 8 172 Ag Hmstd 76K-115K: <320 Acres 2,181,517 7,635 7,627 173 Ag Hmstd 76K-115K: >320 Acres 49,691 174 192 174 Ag Hmstd 115K-600K: <320 Acres 7,937,725 63,502 61,237 175 Ag Hmstd 115K-600K: >320 Acres 1,740,528 13,924 14,432 176 Ag Hmstd >600K: <320 Acres 96,636 1,160 1,077 177 Ag Hmstd >600K: >320 Acres 1,874,359 22,492 21,453 179 Ag Non-homestead 9,435,757 113,229 111,711 180 Migrant Housing: <76K 802 8 9 181 Migrant Housing: 76K - 115K 84 1 2 186 Timberlands 557,379 6,689 6,952 187 Non-comm seasonal-rec-res: <72K 5,823,548 69,883 79,956 188 Non-comm seasonal-rec-res: 72K-76K 143,295 1,720 1,886 189 Non-comm seasonal-rec-res: >76K 2,198,846 36,281 37,187 192 Res 1b Hmstd <32K 193,562 871 944 193 Res Hmstd: <72K 91,286,206 912,862 954,685 194 Res Hmstd: 72K-76K 4,109,968 41,100 42,273 195 Res Hmstd: 76K - 115K 31,288,092 516,254 492,429 196 Res Hmstd: > 115K 37,550,613 619,585 736,601 198 Res Non-hmstd 1 unit: <76K 4,397,372 52,768 69,272 199 Res Non-hmstd 1 unit: 76K - 115K 786,654 12,980 15,844 200 Res Non-hmstd 1 unit: >115K 1,179,143 19,456 23,176 202 Res Non-hmstd 2-3 units 2,753,945 45,440 57,695 205 Regular apartments (4a) 9,198,322 220,760 270,382 206 Sm city apartment 168,680 3,627 5,499 207 Low income apartments (4d) 2,389,199 23,892 32,756 208 Non-prof student housing/Comm Serv 25,854 427 590 209 Student housing 17,145 206 298 210 Manufactured home park land 382,954 6,319 7,721 212 Comm seasonal-rec-res: 1c <32K 43,383 434 509 213 Comm seasonal-rec-res: 1c >32K 235,934 2,359 2,582 214 Comm seasonal-rec-res: 4c 210,876 3,479 3,761 215 Qualifying golf courses 145,001 2,393 2,723 216 Metro Non-profit Indoor Rec 435 7 7 218 Commercial pref: <100K 4,792,338 115,016 151,683 219 Commercial pref: 100K - 150K 1,389,085 33,338 42,978 220 Commercial pref: 150K - 250K 2,162,285 73,518 92,643 221 Commercial: >250K 22,316,127 758,748 948,216

House Research Dept. Simulation 1H2 Baseline: Preliminary Pay 2001 Page 35 04/25/2001 12:32 PM Alternative: Proj Pay 2002: Current Law (Revised 4/25) (all figures in $000s) 222 Comm competitive zone: <50K 100 2 2 223 Comm competitive zone: 50K - 150K 200 5 5 224 Comm competitive zone: >150K 275 9 6 225 Comm border city: <100K 28,355 681 656 226 Comm border city: 100K - 150K 8,114 195 187 227 Comm border city: 150K - 250K 12,442 423 286 228 Comm border city: >250K 37,715 1,282 867 229 Comm transit zone: <100K 4,772 115 149 230 Comm transit zone: 100K-150K 2,495 60 78 231 Comm transit zone struct:150K-250K 7,023 209 283 232 Comm transit zone struct: >250K 464,736 13,826 18,772 233 Comm transit zone exist: 150K-250K 3,610 123 158 234 Comm transit zone exist: >250K 111,772 3,800 4,899 237 Industrial pref: <100K 798,784 19,171 24,973 238 Industrial pref: 100K-150K 339,087 8,138 10,549 239 Industrial pref: 150K-250K 655,581 22,290 28,380 240 Industrial pref: >250K 9,199,229 312,774 388,595 244 Ind border city: <100K 1,015 24 23 245 Ind border city: 100K-150K 352 8 8 246 Ind border city: 150K-250K 1,230 42 28 247 Ind border city: >250K 30,793 1,047 708 248 Ind Transit Zone: <100K 3,670 88 115 249 Ind Transit Zone: 100K-150K 1,847 44 58 250 Ind Transit Zone Struct: 150K-250K 5,135 153 208 251 Ind Transit Zone Struct: >250K 95,466 2,840 3,719 252 Ind Transit Zone exist: 150K-250K 2,840 97 125 253 Ind Transit Zone exist: >250K 27,848 947 1,225 256 Publ Util: land & bldgs <100K 61,020 1,464 1,839 257 Publ Util: land & bldgs: 100K-150K 14,817 356 449 258 Publ Util: land & bldgs >150K 688,842 23,421 28,612 259.1 Publ Util: machinery (exc generat) 862,733 29,333 34,453 259.2 Publ Util: Electric Generat Mach 1,578,285 53,662 65,377 261 Railroad <100K 17,765 426 548 262 Railroad: 100K-150K 7,626 183 231 263 Railroad >150K 491,825 16,722 20,997 265 Mineral 3,666 125 189 266 Misc class 5 301 10 15 269 Personal: 3f 11,362 114 148 270 Non-comm aircraft hangars 22,731 375 454 271.1 Pers: It31 tools&mach excl elec gen 113,070 3,844 4,832 271.2 Pers: It31 electric generation mach 16,016 545 495 272 Pers: Item 32 struct/leased land 111,070 1,833 2,264 273 Pers: Item 33 ag real estate 8,823 106 142 275.1 Pers: Item 41 struct excl elec gen 347,060 11,800 10,518 275.2 Pers: It41 electric generation mach 13,639 464 479 276 Pers: Item 41 EZ <100K 526 13 12 277 Pers: Item 41 EZ: 100K-150K 103 2 2 278 Pers: Item 41 EZ >150K 619 21 14 281 Pers: Item 41 TZ: >150K 1,700 51 66 282 Pers: Item 42 struct/RR land 39,458 1,342 1,946 289 Pers: Item 43 leased real estate 236,590 8,044 7,818 290 Pers: Item 44 electric util trans lines 1,389,216 47,233 59,423 291 Pers: Item 44 electric util distri lines 147,864 5,027 6,520 292 Pers: Item 45 syst/gas utils 1,521,677 51,737 61,228 293 Pers: Item 46 syst/water utils 1,336 45 57

House Research Dept. Simulation 1H2 Baseline: Preliminary Pay 2001 Page 36 04/25/2001 12:32 PM Alternative: Proj Pay 2002: Current Law (Revised 4/25) (all figures in $000s) 294 Pers: Item 48 misc 48,282 1,642 1,977 1162 NewCon: Farm 1b Hmstd HGA: <32K 5 0 0 1163 NewCon: Ag Hmstd HGA: <72K 1,734 17 15 1164 NewCon: Ag Hmstd HGA: 72K-76K 115 1 1 1165 NewCon: Ag Hmstd HGA: 76K-115K 1,096 18 14 1166 NewCon: Ag Hmstd HGA: >115K 1,342 22 23 1167 NewCon: Farm 1b Hmstd land <32K 1 0 0 1168 NewCon: Ag Hmstd <72K: <320 Acres 4,622 16 16 1169 NewCon: Ag Hmstd <72K: >320 Acres 1 0 0 1170 NewCon: Ag Hmstd 72K-76K: <320 140 0 0 1171 NewCon: Ag Hmstd 72K-76K: >320 0 0 0 1172 NewCon: Ag Hmstd 76K-115K: <320 1,069 4 4 1173 NewCon: Ag Hmstd 76K-115K: >320 20 0 0 1174 NewCon: Ag Hmstd 115K-600K: <320 4,762 38 37 1175 NewCon: Ag Hmstd 115K-600K: >320 1,388 11 11 1176 NewCon: Ag Hmstd >600K: <320 Acres 168 2 2 1177 NewCon: Ag Hmstd >600K: >320 Acres 1,372 16 17 1179 NewCon: Ag Non-homestead 6,147 74 75 1187 NewCon: NonComm seas-rec-res: <72K 111,203 1,334 1,561 1188 NewCon: NonCom seas-rec-res: 72K-76K 5,425 65 75 1189 NewCon: NonCom seas-rec-res: >76K 109,819 1,812 1,934 1193 NewCon: Res Hmstd: <72K 2,044,241 20,442 20,779 1194 NewCon: Res Hmstd: 72K-76K 113,569 1,136 1,154 1195 NewCon: Res Hmstd: 76K - 115K 1,107,297 18,270 17,523 1196 NewCon: Res Hmstd: >115K 1,398,948 23,083 27,503 1198 NewCon: Res Non-hmstd 1 unit: <76K 181,539 2,178 2,828 1199 NewCon: Res NonHmstd 1un: 76K - 88,108 1,454 1,757 1200 NewCon: Res Non-hmstd 1 unit: >115K 181,605 2,996 3,524 1202 NewCon: Res Non-hmstd 2-3 units 131,372 2,168 2,619 1205 NewCon: Regular apartments (4a) 276,131 6,627 7,807 1206 NewCon: Sm city apartment 20,710 445 703 1207 NewCon: Low income apartments (4d) 30,922 309 424 1208 NewCon: NonProf student hous/Comm 45 1 1 1209 NewCon: Student housing 3 0 0 1212 NewCon: Comm seas-rec-res: 1c <32K 512 5 6 1213 NewCon: Comm seas-rec-res: 1c >32K 3,035 30 33 1214 NewCon: Comm seas-rec-res: 4c 3,034 50 54 1218 NewCon: Commercial pref: <100K 110,022 2,641 3,396 1219 NewCon: Commercial pref: 100K - 150K 50,021 1,200 1,560 1220 NewCon: Commercial pref: 150K - 250K 87,430 2,973 3,764 1221 NewCon: Commercial: >250K 1,170,741 39,805 49,499 1222 NewCon: Comm competitive zone: <50K 2 0 0 1223 NewCon: Comm comp zone: 50K - 150K 3 0 0 1224 NewCon: Comm competitive zone: 9 0 0 1225 NewCon: Comm border city: <100K 503 12 12 1226 NewCon: Comm border city: 100K - 119 3 3 1227 NewCon: Comm border city: 150K - 73 2 2 1228 NewCon: Comm border city: >250K 4,726 161 109 1229 NewCon: Comm transit zone: <100K 11 0 0 1230 NewCon: Comm transit zone: 38 1 1 1231 NewCon: Comm transit zone:150K-250K 542 16 22 1232 NewCon: Comm transit zone struct: 19,742 587 805 1234 NewCon: Comm transit zone exist: 2,644 90 116 1237 NewCon: Industrial pref: <100K 20,217 485 541 1238 NewCon: Industrial pref: 100K-150K 10,627 255 288
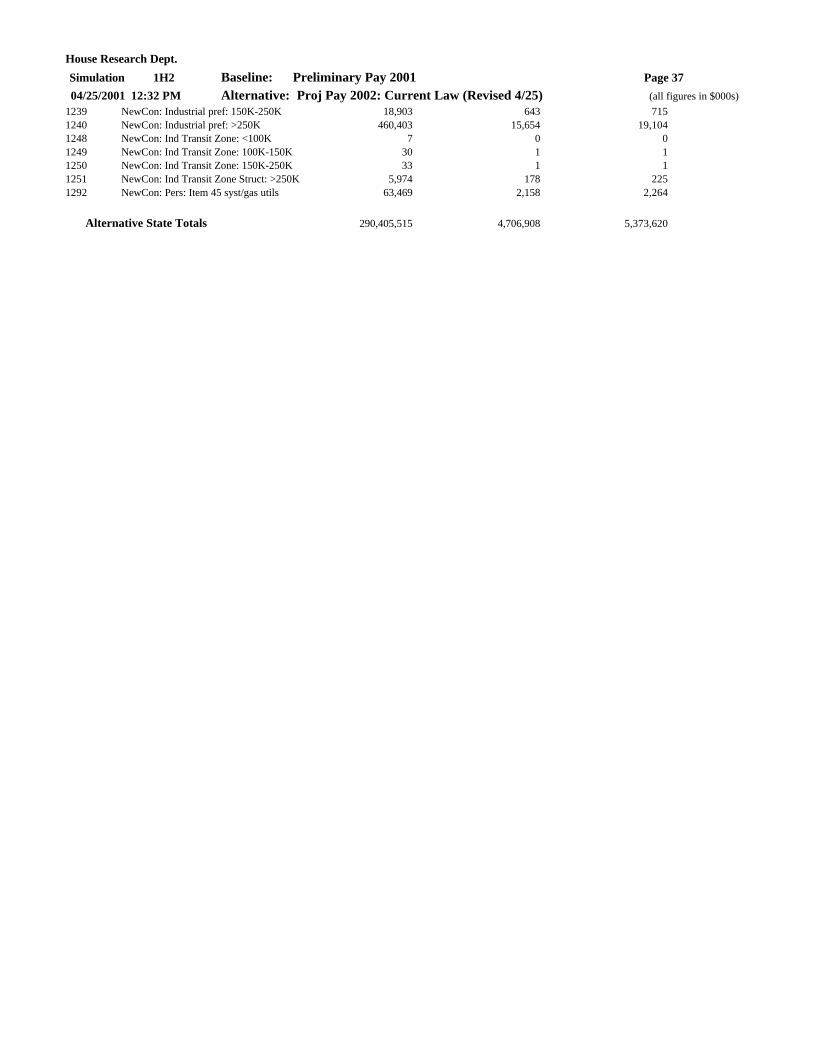
House Research Dept. Simulation 1H2 Baseline: Preliminary Pay 2001 Page 37 04/25/2001 12:32 PM Alternative: Proj Pay 2002: Current Law (Revised 4/25) (all figures in $000s) 1239 NewCon: Industrial pref: 150K-250K 18,903 643 715 1240 NewCon: Industrial pref: >250K 460,403 15,654 19,104 1248 NewCon: Ind Transit Zone: <100K 7 0 0 1249 NewCon: Ind Transit Zone: 100K-150K 30 1 1 1250 NewCon: Ind Transit Zone: 150K-250K 33 1 1 1251 NewCon: Ind Transit Zone Struct: >250K 5,974 178 225 1292 NewCon: Pers: Item 45 syst/gas utils 63,469 2,158 2,264
Alternative State Totals 290,405,515 4,706,908 5,373,620
Related Documents