1

Welcome message from author
This document is posted to help you gain knowledge. Please leave a comment to let me know what you think about it! Share it to your friends and learn new things together.
Transcript

1

Geographers, economists, sociologists, and others have investigated the causes of neighborhood change for many decades. Early models of neighborhood change focus on the life cycle of neighborhoods. These models describe the changes that occur in neighborhoods and suggest some probable causes for these changes, linking neighborhood change to the human life cycle changes as well as disinvestment by landlords, homeowners, and local business owners. More recently, the Urban Institute sponsored a study searching for “clues as to what changes to expect where” with respect to the concentration of poverty The authors promoted the use of GIS and local data to monitorconcentration of poverty. The authors promoted the use of GIS and local data to monitor neighborhood changes and suggested some early warning indicators to predict neighborhood change.
Buffalo, NY’s experience with the national housing bubble, which is now bursting, centers on house flipping and potential predatory lending practices fueling this flipping. Neighborhood activists, armed with anecdotal information, were successful in establishing the Mayor’s Anti‐Flipping Task Force to assist neighborhoods and individuals in dealing with house flipping and related issues. Activists argued that house flipping was causing decline in there neighborhoods, leading to more vacancies, more arson, and more abandoned homes left to deteriorate or facilitate drug deals.
This presentation focuses on the use of local databases and spatial analysis tools in a GIS to investigate the relationship between house flipping and neighborhood change.investigate the relationship between house flipping and neighborhood change.
2

What is house flipping? The phrase became more widely known as the number of real estate investors proliferated with the housing bubble. Several television shows promoted house flipping as a great way to make money. Several web sites tracking foreclosures sprang up to facilitate investors buying cheap to maximize profits. The Buffalo AFTF is focused on fraudulent flipping, however, for analysis purposes they define a flip as “A sale of property by a private individuale (sic) or entity to a private individual or entity within 12 months for profit” http://www.buffaloflipping.com/docs/AFTF_2nd_Year_Report.pdf, pg 42
There are many definitions of house flipping. In general each definition incorporates the time between successive transactions (6 months, 1 year), whether or not renovations/improvements occurred, and whether or not profit was made.
Buffalo is not alone in dealing with flipping. Other cities have similar watchdog groups actively fighting against fraudulent and predatory housing practices.
3

Several different datasets were obtained for this study. Most of the data are administrative data sets that are not collected with research in mind. Some datasets were deficient for identifying flipped properties, so several real estate transaction sources were used. Data quality issues hampered analysis. For example, the Erie County GIS parcel base map (2006) was used to map real estate transactions. The parcel base map does not contain all of the addresses found in the real estate transaction data. The data model does not support multifamily dwelling addresses (e.g. apartments), many parcels are missing street addresses and the address associated with some of the parcels in the database isstreet addresses, and the address associated with some of the parcels in the database is different from the address shown on the structure. Additional problems encountered include 1) there are many housing court cases that do not have corresponding housing code violation inspections, 2) Arsons in the police department database are not the same as arsons in the fire department database, 3) some sources only list real estate transactions over $5,000, and 4) some sources do not provide information on all transactions bundled into one sale. In addition temporal issues need to be addressed. As seen in the timeline, all databases do not cover the same periods of time. Further, is there a sequencing of events to consider, such as flipping then increased arson. Finally, can all flips actually be identified. For example, if you use real estate transactions between January and December 2005 there may be single transaction properties that were purchased in 2004 that are sold in 2005 and single transaction properties purchased in 2005 and sold in 2006.
4

The GIS based analysis also incorporated census data, both block group and tract level to explore the consistency of relationships at different levels of aggregation. A two step Markov approach was used to identify areas that were transitioning with respect to racial distribution. The dark green areas show which neighborhoods the proportion of Black residents increased by 50 – 60% between 1990 and 2000. Blacks and Hispanics have been identified as primary target groups for predatory lending. Most of the house flips between Jan 2003 and March 2006 occur in these transitional neighborhoods.
The distribution of households by income within tracts with a lot of flipping was evaluated using three ways to quantify “a lot” of flipping. The first measure is simply a count of the number of flips within a block group. In areas with twenty or more flips, more than 65% of the households earn less than $35,000. The second measure is the density of flips (per square mile) to adjust for the boundary effects of the block groups. In areas with over 350 flips per square mile, over 80% of the households earn less than $35,000. The third measure is also a density measure to address boundary effects, namely the density of flips per 100 households within a block group. In areas with 5 or more flips per 100 households 70% of the households earn less than $35,000.
5

The Census Bureau has teamed with the US Postal Service to provide vacancy statistics by tract on a quarterly basis. Vacancy statistics are for all property types, not just residential. The first map shows the relationship between flipping and vacancy rates. The flipping data covers 3.25 years between 2003 – 2006 and the vacancy rates are for the first quarter in 2006. The second map indicates areas where there has been an increase or decrease in the percent vacancies between the first quarter in 2006 and the first quarter in 2007. Nearly three fourths of the flips occurred in areas that are now experiencing increasing vacanciesvacancies.
6
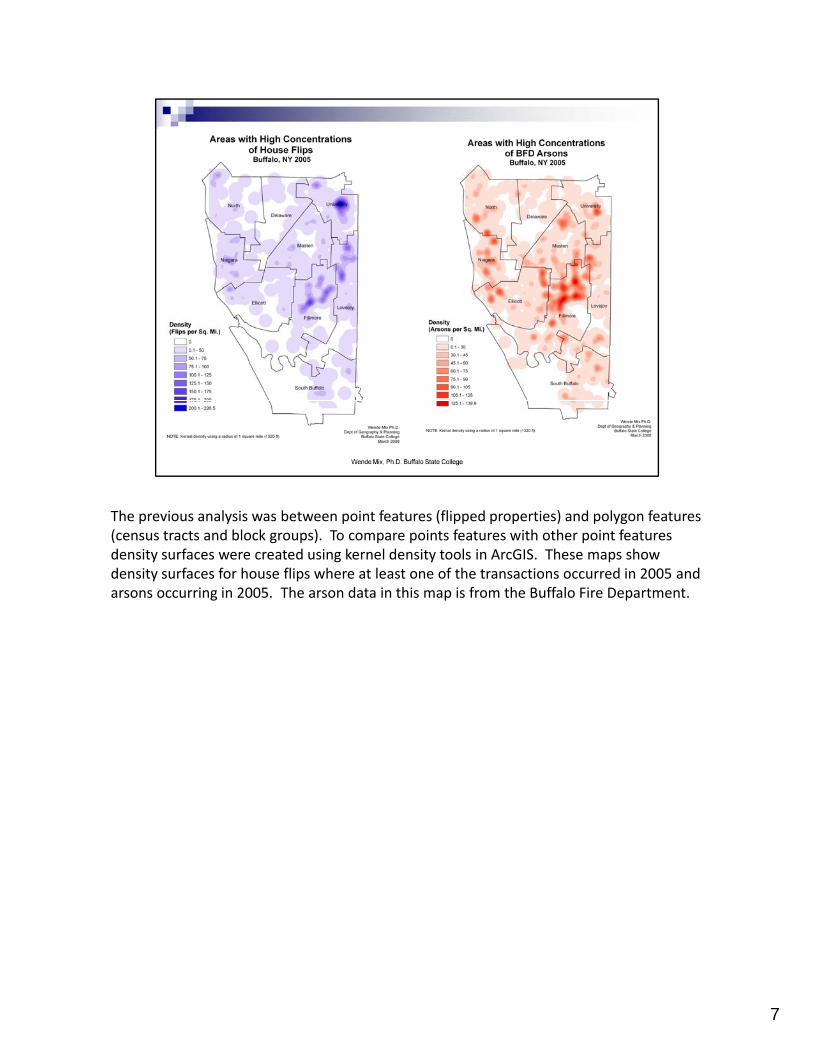
The previous analysis was between point features (flipped properties) and polygon features (census tracts and block groups). To compare points features with other point features density surfaces were created using kernel density tools in ArcGIS. These maps show density surfaces for house flips where at least one of the transactions occurred in 2005 and arsons occurring in 2005. The arson data in this map is from the Buffalo Fire Department.
7

To investigate housing deterioration claims data were obtained on housing inspections. This data contained the individual violations cited at each inspection which is important if we assume the more violations, the worse off a property is. The Masten District contains two areas of high density with respect to inspections and violations.
8

Joint density analysis between flips and arsons and flips and inspections show areas with higher occurrence of both events. Joint occurrence of arsons and flips is prevalent in the Fillmore District, the northern portion of the Masten District, and an area just south of the University of Buffalo South Campus. The later two locations are also higher density areas for the joint occurrence of flips and housing inspections.
9

The G‐function is used to evaluate clustering of points. For this study Nearest Neighbor analysis was used to find the distance of the closest neighbor of each flip to an arson and to a housing inspection. The first graph shows that nearly half of the flips have an arson within 400 feet, and 90% of the flips have an arson occurring within 1000 ft. In addition, 50% of the flips have a housing inspection occurring within slightly over 200 ft and 90% of the flips have a housing inspection occurring within 600 ft. The third graph compares flips to arsons reported in the Buffalo Police Department data. This distribution is quite similar to the others with 50% of the flips having an arson within 300 ft and 90% of the flipsto the others, with 50% of the flips having an arson within 300 ft and 90% of the flips having an arson within 750 ft. Flips and arsons are clustered and flips and housing inspections are clustered. This was also shown using quadrat analysis which is not included here.
Finally, a chi‐square test ( based on ¼ mile sq. grid) is used to test the null hypothesis that there is no relationship between flips and arsons. The hypothesis is rejected at 0.001. The same is true for an analysis of flips and housing code violations. In summary, flips and arsons are very likely not independent, nor are flips and housing code violations.
10

11
12
Related Documents