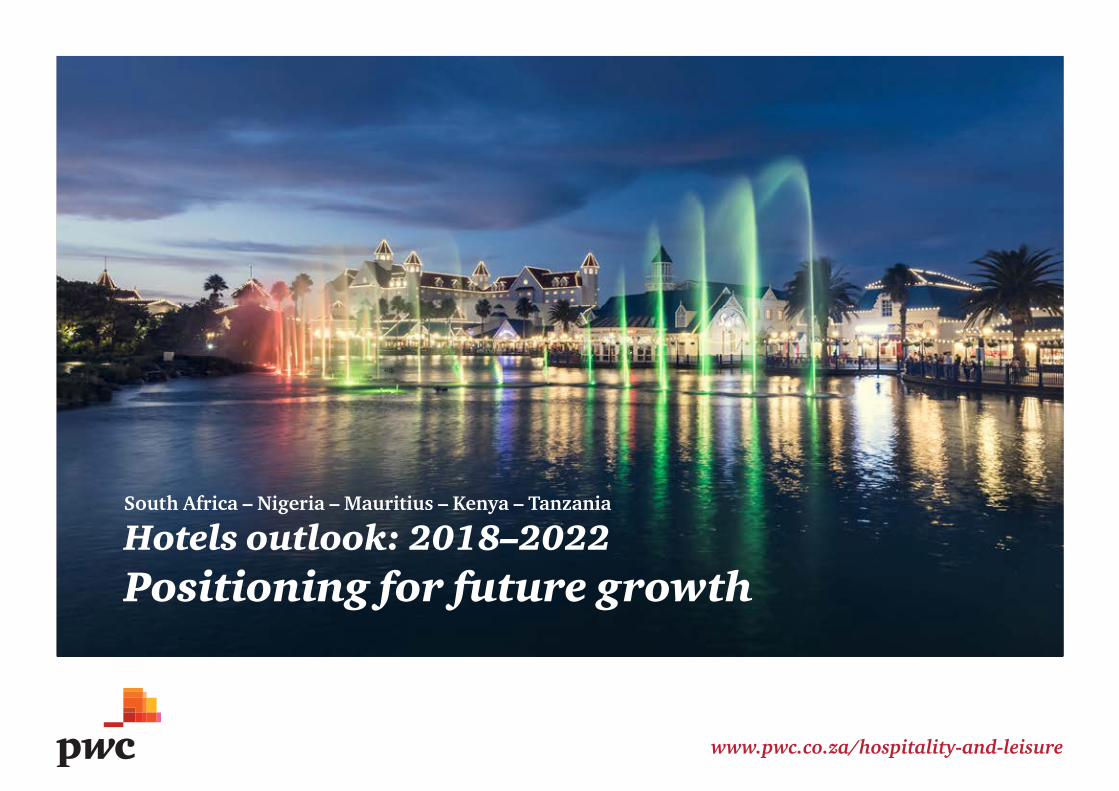
www.pwc.co.za/hospitality-and-leisure South Africa – Nigeria – Mauritius – Kenya – Tanzania Hotels outlook: 2018–2022 Positioning for future growth

Welcome message from author
This document is posted to help you gain knowledge. Please leave a comment to let me know what you think about it! Share it to your friends and learn new things together.
Transcript
www.pwc.co.za/hospitality-and-leisure
South Africa – Nigeria – Mauritius – Kenya – Tanzania
Hotels outlook: 2018–2022Positioning for future growth

South Africa – Nigeria – Mauritius – Kenya – Tanzania
8th editionPwC’s team of hotel specialists provide an unbiased overview of how the hotel industry in South Africa, Nigeria, Mauritius, Kenya and Tanzania is expected to develop over the coming years. It details the key trends observed and discusses the challenges facing the sector, as well as considering its future prospects. It also takes a closer look at how hotels have been affected by the water shortage in Cape Town and measures taken by them to save water, and includes PwC’s view on what’s next for Kenya’s hotel sector, a look at cybersecurity, and privacy within the hotels industry.
Unparalleled experience
Every day, PwC plays a significant supporting role in hospitality businesses across the world. With our local knowledge of culture, laws and business needs, we help clients make the most of changing market scenarios and assist them to deliver on special projects and their organisational growth aspirations.
Our professionals have financial and operational experience, knowledge of business processes, and industry insight that enables us to listen and understand our clients’ goals and the environment (competitive, economic and regulatory) in which they operate. In this way we are able to provide solutions that are right for each organisation.
We understand how developments in the broader hospitality environment are affecting our clients and work with them as a trusted advisor to provide solutions to help improve organisational effectiveness and long-term success. More significantly, we focus on the issues and challenges that are of utmost importance to clients. We have made a substantial commitment to understanding the forces that are impacting these issues and continue to develop and deliver solutions to help clients achieve their financial, operational and strategic objectives.
Hotels outlook: 2018-2022 demonstrates deep knowledge of the local hotel market and is a powerful tool for understanding critical business issues. To learn more about the challenges and opportunities that lie ahead for the hotels industry in South Africa, please visit www.pwc.co.za/hospitality-and-leisure
Image courtesy of Sun International
Cover photograph courtesy of Sun International
Hotels outlook: 2018-2022
Hotels Outlook 2018 – 2022

Acknowledgements
PwC Africa Hotels outlook team
Pietro Calicchio Southern Africa Hospitality Industry Leader
Anita StemmetDirector, PwC South Africa
Veneta EftychisAssociate Director, PwC South Africa
Basheena BhoolaAssociate Director, PwC South Africa
Femi OsinubiDirector, PwC Nigeria
Olivier ReyDirector, PwC Mauritius
Michael MugasaDirector, PwC Kenya
Zainab MsimbeDirector, PwC Tanzania
Busi MatheDirector, PwC South Africa
Kris BudnikDirector, PwC South Africa
Many other PwC professionals across five countries reviewed and added local insights to this publication.
Image courtesy of Tsogo Sun Hotels
Hotels Outlook 2018 – 2022
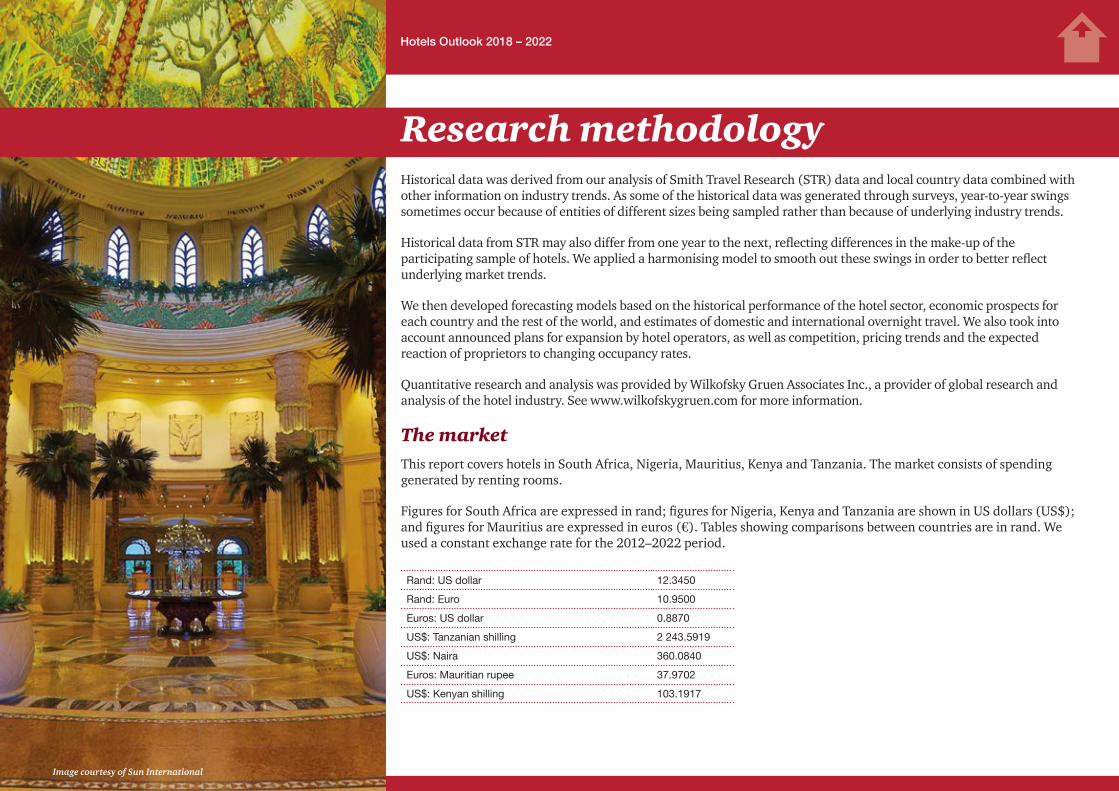
Historical data was derived from our analysis of Smith Travel Research (STR) data and local country data combined with other information on industry trends. As some of the historical data was generated through surveys, year-to-year swings sometimes occur because of entities of different sizes being sampled rather than because of underlying industry trends.
Historical data from STR may also differ from one year to the next, reflecting differences in the make-up of the participating sample of hotels. We applied a harmonising model to smooth out these swings in order to better reflect underlying market trends.
We then developed forecasting models based on the historical performance of the hotel sector, economic prospects for each country and the rest of the world, and estimates of domestic and international overnight travel. We also took into account announced plans for expansion by hotel operators, as well as competition, pricing trends and the expected reaction of proprietors to changing occupancy rates.
Quantitative research and analysis was provided by Wilkofsky Gruen Associates Inc., a provider of global research and analysis of the hotel industry. See www.wilkofskygruen.com for more information.
The marketThis report covers hotels in South Africa, Nigeria, Mauritius, Kenya and Tanzania. The market consists of spending generated by renting rooms.
Figures for South Africa are expressed in rand; figures for Nigeria, Kenya and Tanzania are shown in US dollars (US$); and figures for Mauritius are expressed in euros (€). Tables showing comparisons between countries are in rand. We used a constant exchange rate for the 2012–2022 period.
Rand: US dollar 12.3450
Rand: Euro 10.9500
Euros: US dollar 0.8870
US$: Tanzanian shilling 2 243.5919
US$: Naira 360.0840
Euros: Mauritian rupee 37.9702
US$: Kenyan shilling 103.1917
Research methodology
Image courtesy of Sun International
Hotels Outlook 2018 – 2022
Information in this publication is drawn from data in the Hotels outlook 2018-2022: South Africa – Nigeria – Mauritius – Kenya – Tanzania, a comprehensive source of hotels’ data available at www.pwc.co.za/outlook. PwC continually seeks to update the online Outlook data; therefore, please note that the data in this publication may not be aligned with the data found online.
This document is provided by PwC for general guidance only and does not constitute the provision of legal advice, accounting services, investment advice or professional consulting of any kind. The information provided herein should not be used as a substitute for consultation with professional tax, accounting, legal or other competent advisors. Before making any decision or taking any action, you should consult a professional advisor who has been provided with all pertinent facts relevant to your particular situation.
The information is provided as is, with no assurance or guarantee of completeness, accuracy or timeliness, and without warranty of any kind, express or implied, including but not limited to warranties of performance, merchantability and fitness for a particular purpose.
Outlook content must not be excerpted, used or presented in any portion that would render it misleading in any manner or that fails to provide sufficient context.
Permission to cite No part of this publication may be excerpted, reproduced, stored in a retrieval system, or distributed or transmitted in any form or by any means—including electronic, mechanical, photocopying, recording, or scanning—without the prior written permission of PwC.
Requests should be submitted in writing to Pietro Calicchio at [email protected] outlining the excerpts you wish to use, along with a draft copy of the full report that the excerpts will appear in. Provision of this information is necessary for every citation request to enable PwC to assess the context in which the excerpts are being presented.
Without limiting the foregoing, excerpts from the publication may be used only for background market illustration, should not be the sole source of 2018–2022 information, and must not form the majority of sourced information.
Please cite the Outlook as follows: “PwC Hotels outlook: 2018-2022: South Africa – Nigeria – Mauritius – Kenya – Tanzania), www.pwc.co.za/outlook” in your article.
© 2018 Published in South Africa by PricewaterhouseCoopers. All rights reserved.
Use of Outlook data
Image courtesy of Tsogo Sun Hotels
Hotels Outlook 2018 – 2022
About PwC
Algeria
Tunisia
Egypt
Sudan
SouthSudan
Mauritania NigerChad Eritrea
Ethiopia
Central
African Republic
KenyaUga
nda
DemocraticRepublicof Congo
Camer
oon
Nigeria
Benin
Togo
Gha
naCôted’Ivoire
Burkin
a
Faso
Liberia
Sierra Leone
Guinea
SenegalGambia
Guinea Bissau
Gabon
Con
go
Angola
Zambia
Malaw
i
Moz
ambi
que
Zimbabwe
NamibiaBotswana
SouthAfrica
Lesotho
Swaziland
Mad
agas
car
Mauritius
Comoros
Seychelles
Mayotte
Cape Verde
Morocco
Mali
Somali
a
Djibouti
Rwanda
Burundi
Tanzania
Libya
For services in these territories please contact a neighbouring territory
Réunion
Equatorial Guinea
São Tomé and Príncipe
PwC offices
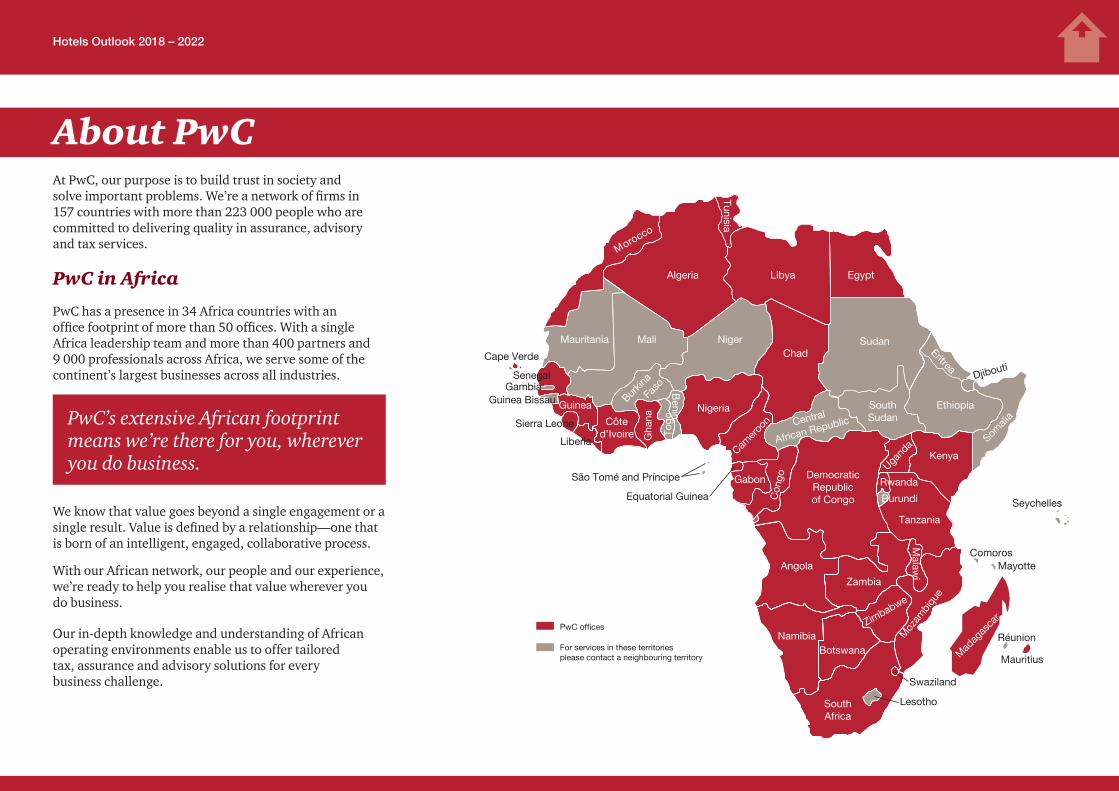
At PwC, our purpose is to build trust in society and solve important problems. We’re a network of firms in 157 countries with more than 223 000 people who are committed to delivering quality in assurance, advisory and tax services.
PwC in Africa
PwC has a presence in 34 Africa countries with an office footprint of more than 50 offices. With a single Africa leadership team and more than 400 partners and 9 000 professionals across Africa, we serve some of the continent’s largest businesses across all industries.
PwC’s extensive African footprint means we’re there for you, wherever you do business.
We know that value goes beyond a single engagement or a single result. Value is defined by a relationship—one that is born of an intelligent, engaged, collaborative process.
With our African network, our people and our experience, we’re ready to help you realise that value wherever you do business.
Our in-depth knowledge and understanding of African operating environments enable us to offer tailored tax, assurance and advisory solutions for every business challenge.
Hotels Outlook 2018 – 2022

Editor’s letter
Over the past eight years, PwC’s Hotels outlook has been providing expert commentary and insights on the hotels segment of the hospitality market, with detailed forecasts and analysis. We take an in-depth look at the key trends observed in the vibrant hotel industry as well as challenges and future prospects for various African markets.
Tourism has again proven to be resilient in the face of economic and political uncertainty, the impact of drought and regulatory changes. The opportunities for this industry to continue to grow are there, but as we continue to see, there are risks facing each country and this is an industry that can be very reactive to the smallest change in political, regulatory, safety and sustainability matters.
In the South African market, overall revenue from hotel room accommodation rose 4.6% to R16.6 billion in 2017. International visitor numbers to South Africa continued to grow with a 2.4% increase overall. The growth in visitor numbers from non-African countries was a healthy 7.2%. The outlook for 2018 remains positive, albeit at lower percentages than enjoyed in 2016. We forecast that foreign visitors and domestic tourism will increase by 5.3% in 2018. There is also continued debate about further relaxation of visa requirements for international visitors and this may impact on our growth forecast. We anticipate that hotel room revenue will grow by 3.3% in 2018 to R17.2 billion, with a compound annual growth rate of 5.6% over the forecast period.
The growth in hotel rooms in South Africa remains similar to that forecast in last year’s Outlook, with an additional 2 900 rooms to be added over the next five years. We also expect occupancy rates to continue to grow over the forecast period and to reach 62.5% in 2022.
This publication also features information about hotel accommodation in Nigeria, Mauritius, Kenya and Tanzania.
The hotel markets in Nigeria and Mauritius continued to perform well in 2017 with both achieving double-digit growth, whereas Kenya and Tanzania saw decreases in room revenue. The Nigerian market grew by 11.7% in 2017 and we forecast that it will continue to grow at a 12.6% compound annual growth rate over the next five years. Hotel room revenue in Mauritius increased by 12.7% in 2017 and growth in foreign visitors continues. Hotel room revenue is projected to grow at 7.2% compounded annually to 2022.
Kenya experienced a drop in visitors following the national elections in August, but recovery was already seen in December with an increase resulting in a 9.9% overall growth in visitor numbers for 2017. However, this was not enough to boost overall room revenue, which showed a 13.5% decline in 2017. Tanzania’s hotel room revenue amounted to US$206 million in 2017, a decline of 5.5% over 2016 due to a drop in guest nights. However, we expect guest nights to grow in 2018 and forecast revenue growth of 10.2% for 2018.
The hotel and tourism markets in each of the countries in our report are all displaying signs of continued growth over
We are pleased to bring you our annual Hotels outlook: South Africa – Nigeria – Mauritius – Kenya – Tanzania 2018-2022.
the forecast period. Tourism remains an important part of each economy with some countries being more dependent on it than others. As noted above though, the smallest change or disruption can have a serious impact on the future growth of a market. It is therefore important that investors, hotel operators, tourism bodies and governments continue to work together to grow this important industry and ensure its sustainability so that all stakeholders derive maximum benefit.
I hope you enjoy this edition of the Outlook. Our PwC hotels professionals continue to stay on top of trends and developments that may impact hospitality companies, now and in the future, and look forward to sharing our thoughts further with you. If you would like to discuss anything covered in this report, please contact us. Finally, we thank you for your support and wish you an exciting and rewarding year ahead.
Sincerely
Pietro Calicchio
Hospitality Industry Leader PwC Southern Africa
Hotels Outlook 2018 – 2022

ContentsOverview. . . . . . . . . . . . . . . . . . . . . . . . . . . . . . 1
South Africa . . . . . . . . . . . . . . . . . . . . . . . . . . . 4
Travel and tourism in South Africa 4
Hotel accommodation 10
Looking back: 2017 22
South African visa regulations: What next? 24
Nigeria . . . . . . . . . . . . . . . . . . . . . . . . . . . . . . . 25
Hotel accommodation 25
Looking back: 2017 29
Outlook: 2018–2022 29
Mauritius . . . . . . . . . . . . . . . . . . . . . . . . . . . . . 30
Hotel accommodation 30
Looking back: 2017 37
Outlook: 2018–2022 38
Kenya. . . . . . . . . . . . . . . . . . . . . . . . . . . . . . . . 39
Hotel accommodation 39
Looking back: 2017 43
Outlook: 2018–2022 43
What’s next for Kenya’s hotel sector? 44
Tanzania . . . . . . . . . . . . . . . . . . . . . . . . . . . . . 45
Hotel accommodation 45
Looking back: 2017 47
Outlook: 2018–2022 48
Cybersecurity and privacy. . . . . . . . . . . . . . . . . . . 49
Do you know the risks you are taking? 49
The information contained in this publication is provided for general information purposes only and does not constitute the provision of legal or professional advice in any way. Before making any decision or taking any action, a professional advisor should be consulted. No responsibility for loss to any person acting or refraining from action as a result of any material in this publication can be accepted by the author, copyright owner or publisher.
Image courtesy of Sun International

Overview Nigeria KenyaSouth Africa Mauritius Tanzania Cybersecurity and privacy
OverviewOverall room revenue in South Africa, Nigeria, Mauritius, Kenya and Tanzania rose 2.7% in 2017, down from the 10.6% increase in 2016, as declines in Kenya and Tanzania offset double-digit increases in Nigeria and Mauritius. Room revenue in South Africa rose 4.6%.
The hotel market in Kenya got off to a good start. However, instability following a Supreme Court ruling in September that overturned the result of the August Presidential election led to a drop in tourist arrivals in October. Although tourist arrivals rebounded strongly in December, hotel guest nights were down during the latter part of the year.
In Tanzania, the imposition of an 18% VAT on park fees in 2016, the introduction of a fixed-rate concession fee in July 2017 (chargeable per person per night for hotels in national parks), multiple taxes/fees, a tight Government expenditure policy and rising visa costs for business visitors led to a drop in guest nights and a reduction in room revenue.
Mauritius and Nigeria had the fastest-growing markets in terms of hotel room revenue with increases of 12.7% and 11.7%, respectively, for 2017. Mauritius has had the fastest-growing hotel market during the past two years, helped by a strong local economy and large increases in tourist arrivals. Combined with declines in available rooms due to hotel renovations or refurbishment temporarily taking rooms out of service, occupancy rates rose, which led to accelerating growth in average daily rate (ADR).
Nigeria, which relies principally on domestic tourism, had been hurt by a weak local economy as falling oil prices led to an economic slowdown that began in 2015
and persisted through early 2017. During the latter part of 2017, however, with oil prices stabilising, the economy began to pick up, guest nights rose, and room revenue accelerated, recording its largest increase during the past six years. (Spending figures expressed in US dollars appear to be much lower than in the 2017 Hotels outlook because of the sharp devaluation of the naira. In this report we show spending using the average exchange rate for 2017.)
Growth in South Africa moderated from a 12.2% increase in 2016 to 4.6% in 2017. This was caused by a smaller increase in international tourist arrivals and slower growth in the average room rate, in part the result of a strengthening rand that made South Africa effectively more expensive to foreign visitors. The increase in tourism was offset by the increased cost.
During the next five years we expect Nigeria to be the fastest-growing country, with a projected 12.6% compound annual increase. A number of new hotels are scheduled to open during this time, which will expand the potential market while keeping ADR growth in check. Meanwhile, continued improvement in the domestic economy will lead to faster growth in guest nights. We expect growth in guest nights to be the principal driver of room revenue in Nigeria during the next five years.
Kenya, Tanzania and Mauritius should be the next fastest growing, with compound annual increases of 9.6%, 9.1% and 7.2%, respectively. Kenya will benefit from a rebound in tourism, new hotels, its growing prominence as an experience destination, infrastructure upgrades, and the expectation of political stability.
Image courtesy of Tsogo Sun Hotels
1 | Hotels Outlook 2018 – 2022

Overview Nigeria KenyaSouth Africa Mauritius Tanzania Cybersecurity and privacy
The Mauritius market will be affected by moderating growth in ADR as hotels look to counter the impact of exchange rate increases and rising costs to travel to Mauritius. At the same time, high occupancy rates, the continued appeal of Mauritius as a tourist destination, and relatively few new hotels will give Mauritius the largest ADR increase of any of the countries covered in this report. During the latter part of the forecast period, however, ADR growth will moderate as competition from alternative accommodation services such as Airbnb picks up.
Whilst the impact of the introduction of VAT in Tanzania in 2016 has by now been largely absorbed, hotels in national parks are slow in recovering from the introduction of the fixed-rate concession fees. We nevertheless expect Tanzania to grow, albeit from a lower level. More flights to Tanzania will boost its foreign tourist potential, new hotels are entering the market, and a strong economy will support domestic tourism. We project a 4.8% compound annual increase in guest nights and 4.2% growth compounded annually in ADR.
We project South Africa to be the slowest-growing market, with a 5.6% compound annual increase in room revenue. We expect somewhat slower growth in 2018 as the water shortage leads to a drop in guest nights in Cape Town, offset by growth in overall tourism to South Africa. A stronger global economy and an improving domestic economy will lead to faster growth in guest nights and room revenue in subsequent years. ADR growth will be the principal driver, with a projected 4.1% compound annual increase. Guest nights will begin to expand again in 2019 but will average a relatively modest 1.4% compound annual increase through 2022.
Hotel room revenue for the five markets as a group will increase at a 7.4% compound annual rate to R50.5 billion in 2022 from R35.2 billion in 2017.
Hotel room revenue in South Africa, Nigeria, Mauritius, Kenya and Tanzania (R millions)
2012 2013 2014 2015 2016 2017 2018 2019 2020 2021 2022 CAGR1
R millions
South Africa 10 688 12 249 13 100 14 165 15 892 16 629 17 181 18 001 19 035 20 304 21 830 5,6
Nigeria 2 074 2 271 2 210 2 185 2 321 2 592 2 876 3 197 3 543 4 099 4 691 12,6
Mauritius 6 143 5 606 5 858 6 252 7 183 8 092 8 804 9 472 10 129 10 808 11 476 7,2
Kenya 6 160 6 000 5 605 5 926 6 222 5 382 5 691 6 407 7 209 7 827 8 518 9,6
Tanzania 1 913 2 123 2 185 2 506 2 691 2 543 2 802 3 111 3 420 3 580 3 938 9,1
Total hotel revenue 26 978 28 249 28 958 31 034 34 309 35 238 37 354 40 188 43 336 46 618 50 453 7,4
% change year on year
South Africa 11,4 14,6 6,9 8,1 12,2 4,6 3,3 4,8 5,7 6,7 7,5
Nigeria 9,8 9,5 -2,7 -1,1 6,2 11,7 11,0 11,2 10,8 15,7 14,4
Mauritius 4,3 -8,7 4,5 6,7 14,9 12,7 8,8 7,6 6,9 6,7 6,2
Kenya -7,1 -2,6 -6,6 5,7 5,0 -13,5 5,7 12,6 12,5 8,6 8,8
Tanzania 6,2 11,0 2,9 14,7 7,4 -5,5 10,2 11,0 9,9 4,7 10,0
Total hotel revenue 4,5 4,7 2,5 7,2 10,6 2,7 6,0 7,6 7,8 7,6 8,2
CAGR - compound annual growth rate (2018-2022)
Sources: PricewaterhouseCoopers LLP, Wilkofsky Gruen Associates
2 | Hotels Outlook 2018 – 2022

Overview Nigeria KenyaSouth Africa Mauritius Tanzania Cybersecurity and privacy
Figure 1: Hotel room revenue in South Africa, Nigeria, Mauritius, Kenya and Tanzania (R millions)
0
5 000
10 000
15 000
20 000
25 000
20222021202020192018201720162015201420132012
Tanzania
Kenya
Mauritius
South Africa
Nigeria
Sources: PricewaterhouseCoopers LLP, Wilkofsky Gruen Associates
Image courtesy of Sun International
Overall room revenue in South Africa, Nigeria, Mauritius, Kenya and Tanzania rose 2.7% in 2017
3 | Hotels Outlook 2018 – 2022

Overview Nigeria KenyaSouth Africa Mauritius Tanzania Cybersecurity and privacy
South Africa
Travel and tourism in South AfricaForeign tourism rose 2.4% in 2017, building on its 12.8% increase in 2016. During the past two years the number of foreign overnight visitors to South Africa rose by a cumulative 1.39 million.
The gain in 2017 was particularly impressive as it was achieved without any boost from a weak rand making it less expensive to travel to South Africa and at the same time as the lifting of visa requirements in China and India in 2016 that made it much easier for people from those countries to visit South Africa. After jumping 38.0% in 2016, visitors from China fell 17.0% in 2017. Travellers from India rose a modest 2.7% in 2017, well below the 21.7% increase recorded in 2016. In both cases, the incremental benefits from the lifting of visa requirements were largely realised in 2016.
Latin America recorded the largest increase in 2017 with a 59.3% gain, principally fuelled by a 74.7% rise in the number of visitors from Brazil. On the strength of double-digit gains from France and Germany, the number of visitors from Europe rose 7.6% in 2017. North America rose 7.8%, and the Middle East increased 4.4%. The decline in China led to a 1.9% decrease for all of Asia Pacific, while visitors from Africa were essentially flat following an 11.2% increase in 2016.
The growth from the various non-African markets resulted in an overall 7.2% increase in foreign visitor numbers from outside of Africa.
Source markets
Foreign overnight visitors by continent
2016 2017 %change
Africa 7 501 512 7 559 342 0.8
Europe* 1 544 026 1 660 848 7.6
Asia Pacific 459 746 450 894 -1.9
North America 406 192 437 903 7.8
Latin America 67 546 107 582 59.3
Middle East* 53 536 55 906 4.4
Unspecified 11 605 12 722 9.6
Total 10 044 163 10 285 197 2.4
* The change from the 2017 Hotel outlook reflects the shift in the listing of Turkey from the Middle East to Europe.
Sources: Statistics South Africa, PricewaterhouseCoopers LLP, Wilkofsky Gruen Associates
Of the top ten non-African countries, Brazil, France and Germany recorded the largest increases. The number of visitors from Canada, the United States, the Netherlands and Australia posted mid-to-high single digit increases, while the United Kingdom held steady and China declined.
Image courtesy of Sun International
Foreign overnight visitors rose by a cumulative 1.39 million
4 | Hotels Outlook 2018 – 2022
Overview Nigeria KenyaSouth Africa Mauritius Tanzania Cybersecurity and privacy
Foreign overnight visitors from SADC countries
2016 2017 % change
Zimbabwe 2 028 881 2 039 932 0.5
Lesotho 1 757 058 1 747 211 -0.6
Mozambique 1 268 258 1 339 245 5.6
Swaziland 893 618 876 992 -1.9
Botswana 679 828 681 379 0.2
Namibia 214 664 208 747 -2.8
Malawi 154 017 175 014 13.6
Zambia 174 767 173 033 -1.0
Angola 43 608 49 299 13.1
Tanzania 38 032 36 306 -4.5
DRC 29 586 29 675 0.3
Mauritius 19 237 19 528 1.5
Seychelles 9 710 8 152 -16.0
Madagascar 2 420 2 446 1.1
Total SADC 7 313 684 7 386 959 1.0
Sources: Statistics South Africa, PricewaterhouseCoopers LLP, Wilkofsky Gruen Associates
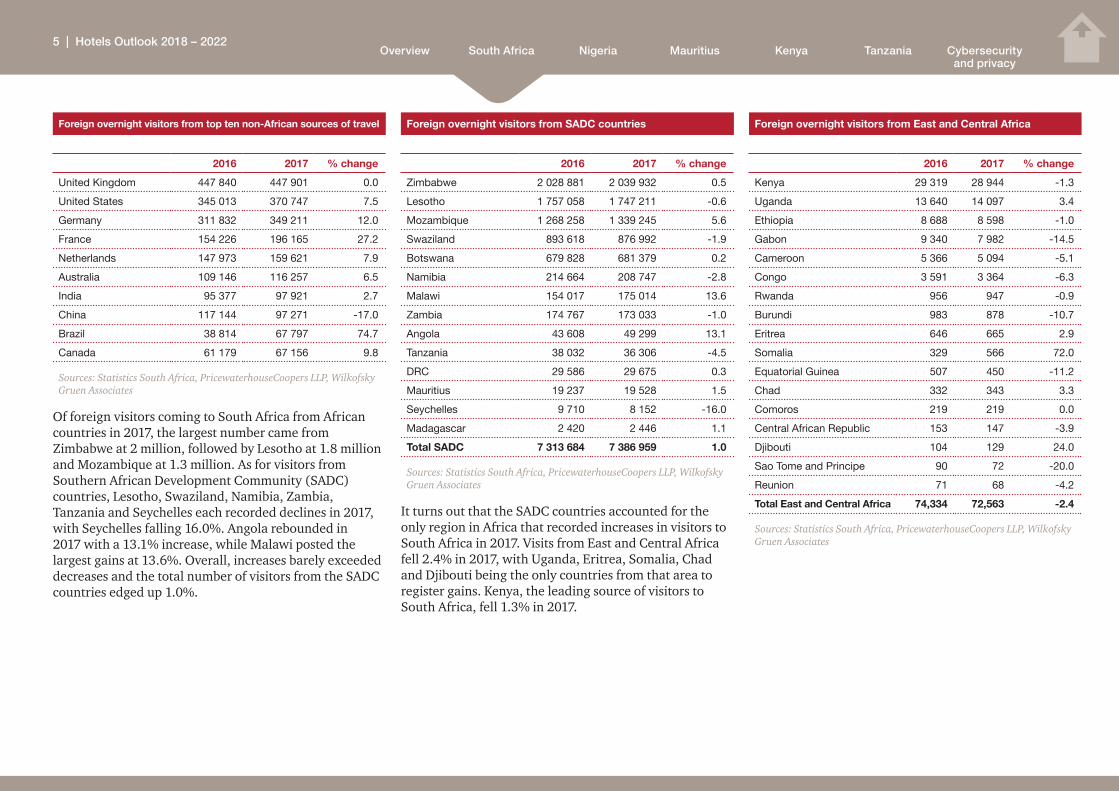
It turns out that the SADC countries accounted for the only region in Africa that recorded increases in visitors to South Africa in 2017. Visits from East and Central Africa fell 2.4% in 2017, with Uganda, Eritrea, Somalia, Chad and Djibouti being the only countries from that area to register gains. Kenya, the leading source of visitors to South Africa, fell 1.3% in 2017.
Foreign overnight visitors from East and Central Africa
2016 2017 % change
Kenya 29 319 28 944 -1.3
Uganda 13 640 14 097 3.4
Ethiopia 8 688 8 598 -1.0
Gabon 9 340 7 982 -14.5
Cameroon 5 366 5 094 -5.1
Congo 3 591 3 364 -6.3
Rwanda 956 947 -0.9
Burundi 983 878 -10.7
Eritrea 646 665 2.9
Somalia 329 566 72.0
Equatorial Guinea 507 450 -11.2
Chad 332 343 3.3
Comoros 219 219 0.0
Central African Republic 153 147 -3.9
Djibouti 104 129 24.0
Sao Tome and Principe 90 72 -20.0
Reunion 71 68 -4.2
Total East and Central Africa 74,334 72,563 -2.4
Sources: Statistics South Africa, PricewaterhouseCoopers LLP, Wilkofsky Gruen Associates
Foreign overnight visitors from top ten non-African sources of travel
2016 2017 % change
United Kingdom 447 840 447 901 0.0
United States 345 013 370 747 7.5
Germany 311 832 349 211 12.0
France 154 226 196 165 27.2
Netherlands 147 973 159 621 7.9
Australia 109 146 116 257 6.5
India 95 377 97 921 2.7
China 117 144 97 271 -17.0
Brazil 38 814 67 797 74.7
Canada 61 179 67 156 9.8
Sources: Statistics South Africa, PricewaterhouseCoopers LLP, Wilkofsky Gruen Associates
Of foreign visitors coming to South Africa from African countries in 2017, the largest number came from Zimbabwe at 2 million, followed by Lesotho at 1.8 million and Mozambique at 1.3 million. As for visitors from Southern African Development Community (SADC) countries, Lesotho, Swaziland, Namibia, Zambia, Tanzania and Seychelles each recorded declines in 2017, with Seychelles falling 16.0%. Angola rebounded in 2017 with a 13.1% increase, while Malawi posted the largest gains at 13.6%. Overall, increases barely exceeded decreases and the total number of visitors from the SADC countries edged up 1.0%.
5 | Hotels Outlook 2018 – 2022
Overview Nigeria KenyaSouth Africa Mauritius Tanzania Cybersecurity and privacy
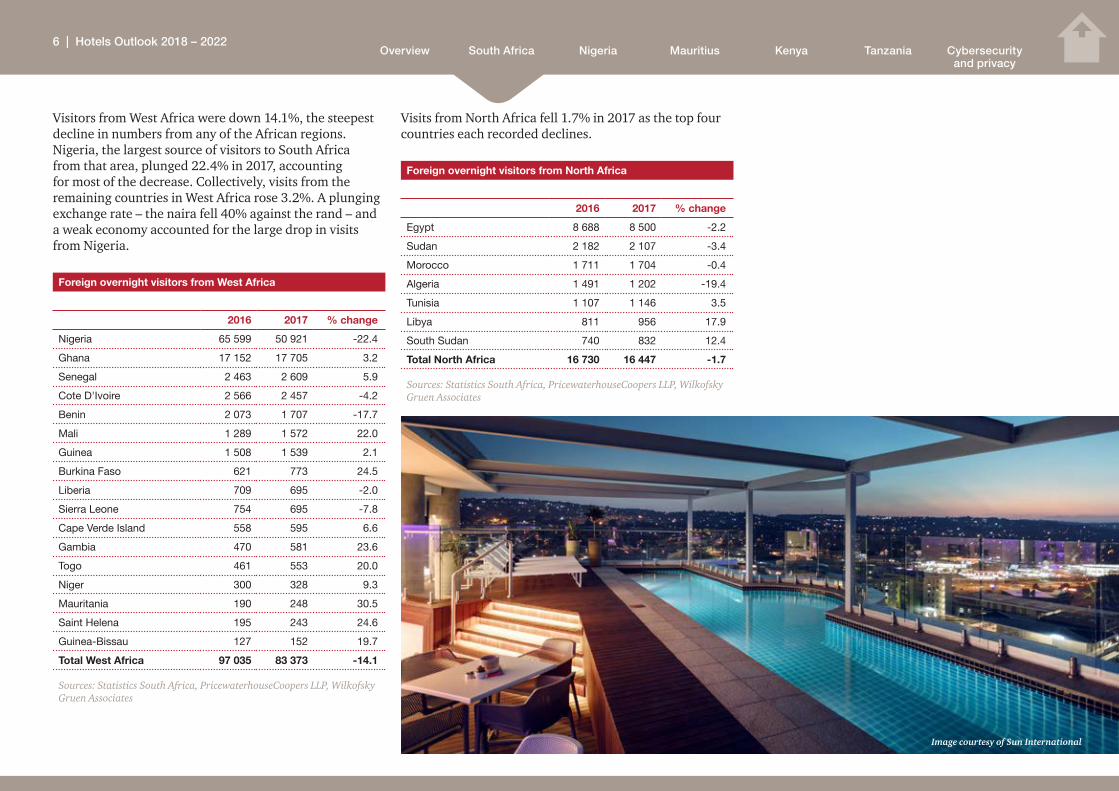
Visitors from West Africa were down 14.1%, the steepest decline in numbers from any of the African regions. Nigeria, the largest source of visitors to South Africa from that area, plunged 22.4% in 2017, accounting for most of the decrease. Collectively, visits from the remaining countries in West Africa rose 3.2%. A plunging exchange rate – the naira fell 40% against the rand – and a weak economy accounted for the large drop in visits from Nigeria.
Foreign overnight visitors from West Africa
2016 2017 % change
Nigeria 65 599 50 921 -22.4
Ghana 17 152 17 705 3.2
Senegal 2 463 2 609 5.9
Cote D'Ivoire 2 566 2 457 -4.2
Benin 2 073 1 707 -17.7
Mali 1 289 1 572 22.0
Guinea 1 508 1 539 2.1
Burkina Faso 621 773 24.5
Liberia 709 695 -2.0
Sierra Leone 754 695 -7.8
Cape Verde Island 558 595 6.6
Gambia 470 581 23.6
Togo 461 553 20.0
Niger 300 328 9.3
Mauritania 190 248 30.5
Saint Helena 195 243 24.6
Guinea-Bissau 127 152 19.7
Total West Africa 97 035 83 373 -14.1
Sources: Statistics South Africa, PricewaterhouseCoopers LLP, Wilkofsky Gruen Associates
Visits from North Africa fell 1.7% in 2017 as the top four countries each recorded declines.
Foreign overnight visitors from North Africa
2016 2017 % change
Egypt 8 688 8 500 -2.2
Sudan 2 182 2 107 -3.4
Morocco 1 711 1 704 -0.4
Algeria 1 491 1 202 -19.4
Tunisia 1 107 1 146 3.5
Libya 811 956 17.9
South Sudan 740 832 12.4
Total North Africa 16 730 16 447 -1.7
Sources: Statistics South Africa, PricewaterhouseCoopers LLP, Wilkofsky Gruen Associates
Image courtesy of Sun International
6 | Hotels Outlook 2018 – 2022
Overview Nigeria KenyaSouth Africa Mauritius Tanzania Cybersecurity and privacy
Foreign and domestic visitors:The global economy, a key driver of foreign tourism, picked up noticeably in 2017 with a 3.0% gain, its largest increase since 2010. Growth is expected to remain roughly at that level over the next five years, which will have a positive impact on foreign tourism.
The South African economy, which affects domestic tourism, also picked up in 2017 with a 1.3% increase, up from the 0.6% rise in 2016. Economic growth is expected to further improve in 2018 with a projected 1.7% increase, followed by annual gains in excess of 2% over the 2019–22 period. Growth for the entire forecast period will average an estimated 2.2%, compounded annually – a much stronger performance compared with the 2014–17 period.
The improvement in real GDP growth for South Africa was accompanied by a drop in consumer price inflation from 6.4% in 2016 to 5.3% in 2017. Inflation for the early part of 2018 has been slowing even more, and we expect it to average only 4.0% in 2018, its lowest level since 2010. Faster economic growth will likely lead to somewhat faster price increases thereafter, but we still expect inflation to remain lower than in recent years, averaging 4.3%, compounded annually over the entire forecast period.
Real GDP growth and consumer price inflation (%)
2011 2012 2013 2014 2015 2016 2017 2018 2019 2020 2021 2022 CAGR1
South Africa real GDP growth
3.3 2.2 2.5 1.8 1.3 0.6 1.3 1.7 2.2 2.3 2.3 2.3 2.2
Global real GDP growth 2.8 2.3 2.4 2.7 2.8 2.4 3.0 3.1 3.0 2.9 2.9 2.9 3.0
South Africa consumer price inflation*
5.0 5.7 5.7 6.1 4.6 6.4 5.3 4.0 4.2 4.4 4.5 4.5 4.3
1CAGR - compound annual growth rate (2018-2022)
*Annual averages
Sources: International Monetary Fund, World Bank, Statistics South Africa, PricewaterhouseCoopers LLP, Wilkofsky Gruen Associates
Image courtesy of Tsogo Sun Hotels
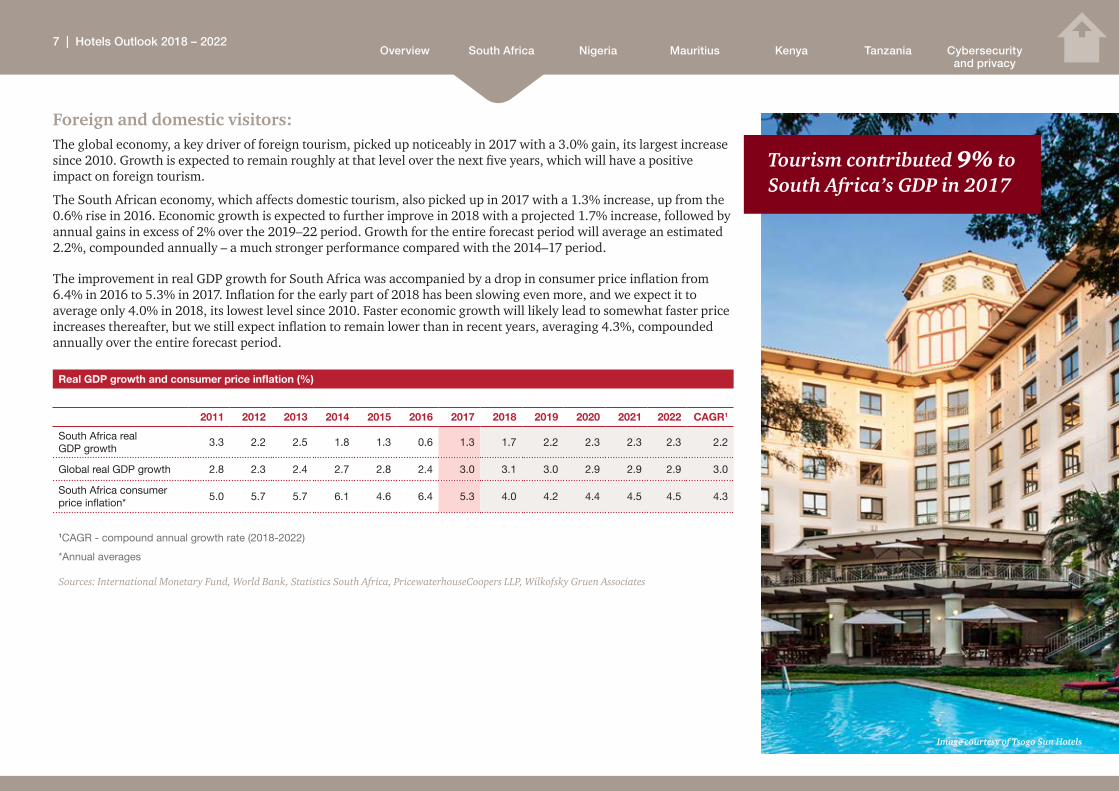
Tourism contributed 9% to South Africa’s GDP in 2017
7 | Hotels Outlook 2018 – 2022

Overview Nigeria KenyaSouth Africa Mauritius Tanzania Cybersecurity and privacy
Figure 2: Real GDP growth and consumer price inflation (%)
0
1
2
3
4
5
6
7
202220212020201920182017201620152014201320122011
South Africa consumer price inflation
Global real GDP
South Africa real GDP
Source: International Monetary Fund, World Bank, Statistics South Africa, PricewaterhouseCoopers LLP, Wilkofsky Gruen Associates
While the fundamentals affecting tourism to South Africa remain favourable, helped by an improving global and local economy, the key impediment is the water shortage in Cape Town. Hotels are reporting cancellations, tourism in Nelson Mandela Bay was down during the festive season, and there is growing concern about the availability of water.
As tourism plays a critical role in the economy – accounting for 9% of GDP in 2017 – the government is taking steps to provide water to hotels. Many hotels and commercial centres are in ‘economic protected zones’ where they are exempt from water queues in Cape Town and will continue to receive water even if Day Zero occurs. Tourists continue to be encouraged to visit Cape Town and will still have access to popular attractions such as Cape Point in Table Mountain National Park and Kirstenbosch National Botanical Gardens. The Cape Town International Convention Centre furthermore still plans to host all of the events scheduled for 2018. A desalination plant that converts two million litres of sea water into potable water per day is in place at the V&A Waterfront.
Hotels are taking steps to conserve water, including installing low-flow shower heads and timed shower heads that limit showers to two minutes, discouraging taking baths, using sea water for pools, using recycled water for gardens, providing hand sanitizers to wash hands, and other such measures.
Meanwhile, the winter rainfall season for Cape Town historically begins in April, although it has sometimes not begun until June. If the rains come, the crisis may be averted or at least limited in scope. If they do not, the impact on tourism could be significant.
At the end of June 2018, the City of Cape Town announced that Day Zero has been pushed out for two years.
8 | Hotels Outlook 2018 – 2022

Overview Nigeria KenyaSouth Africa Mauritius Tanzania Cybersecurity and privacy
As there is little historical precedence, it is difficult to project the impact of the drought on tourism. Although bookings were down in Cape Town, overall tourism to South Africa held up during the festive season and actually picked up in the first quarter of 2018. We project that the number of foreign overnight visitors will increase 5.0% in 2018.
We look for continued growth in foreign tourism, as South Africa remains a popular destination. The International Congress and Convention Association ranked Cape Town as the best business tourism city in Africa, and Euromonitor International ranked Johannesburg among the top 100 city destinations in the world.
Economic trends are also favourable, with real global GDP being projected to grow faster during the next five years than during the past five years. We project the number of foreign overnight visitors to South Africa to increase at an estimated 3.6% compound annual rate to 12.3 million in 2022 from 10.29 million in 2017.
Helped by an improving economy, domestic travel showed the largest increase since 2014, rising 4.2% in 2017. This was well above the gains of less than two per cent annually in 2015–16. Going forward, the expectation of healthier economic growth will have a positive impact on domestic tourism.
We project domestic tourism to average 4.7%, compounded annually over the next five years, rising to an estimated 7.2 million in 2022 from 5.71 million in 2017.
The total number of travellers in South Africa will reach a projected 19.5 million by 2022, a 4.0% compound annual increase from 16 million in 2017.
Travel and tourism to South Africa (R millions)
2011 2012 2013 2014 2015 2016 2017 2018 2019 2020 2021 2022 CAGR1
Foreign overnight visitors 8.34 9.19 9.53 9.55 8.90 10.04 10.29 10.80 11.10 11.45 11.85 12.30 3.6
Domestic travellers 5.43 4.97 5.09 5.31 5.40 5.48 5.71 6.05 6.30 6.55 6.85 7.20 4.7
Total 13.77 14.16 14.62 14.86 14.30 15.52 16.00 16.85 17.40 18.00 18.70 19.50 4.0
% change year on year
Foreign overnight visitors 3.3 10.2 3.7 0.2 -6.8 12.8 2.5 5.0 2.8 3.2 3.5 3.8
Domestic travellers 5.8 -8.5 2.4 4.3 1.7 1.5 4.2 6.0 4.1 4.0 4.6 5.1
Total 4.3 2.8 3.2 1.6 -3.8 8.5 3.1 5.3 3.3 3.4 3.9 4.3
1CAGR - compound annual growth rate (2018-2022)
Sources: PricewaterhouseCoopers LLP, Wilkofsky Gruen Associates
Figure 3: Domestic and foreign visitors, 2011-2022
Foreign overnight visitors Domestic travellers Total
0
5
10
15
20
202220212020201920182017201620152014201320122011
Source: International Monetary Fund, World Bank, Statistics South Africa, PricewaterhouseCoopers LLP, Wilkofsky Gruen Associates
9 | Hotels Outlook 2018 – 2022

Overview Nigeria KenyaSouth Africa Mauritius Tanzania Cybersecurity and privacy
Hotel accommodationThe number of available rooms rose 1.3% in 2017, the largest increase since 2011. Openings in 2017 included the Radisson Blu Hotel & Residences and Radisson Red V&A Waterfront in Cape Town and the Sun International Meropa in Polokwane, each of which is a four-star hotel; and the Stayeasy Cape Town City Bowl, a three-star hotel.
We expect an even larger increase in available rooms in 2018, accounting for a 1.8% gain, with Menlyn Time Square in Pretoria entering the market and the refurbished Grandwest in Goodwood and Carnival City Resort in Brakpan reopening in 2018. The market will also benefit from the full-year impact of the 2017 openings.
Scheduled openings for 2019–21 include the Radisson Blu Oceans Umhlanga in Durban, the Marriott Johannesburg Melrose Arch, the Marriott Executive Apartments in Johannesburg, two Hilton Garden Inns – one in Durban and another in Malelane, and the Novotel Sandton Summit. Each of these is a four-star hotel.
We expect the overall number of available rooms to increase at a 0.9% compound annual rate to 64 900 in 2022 from 62 000 in 2017.
Guest nights edged up 0.7% in 2017, not matching the 3.0% increase in 2016 as growth in international tourism slowed. We expect guest nights to be steady in 2018, followed by a pickup in subsequent years due to a stronger economy and faster growth in foreign and domestic tourism. For the forecast period as a whole, we look for the number of guest nights to increase at a 1.4% compound annual rate to 14.8 million in 2022 from 13.8 million in 2017.
With guest nights projected to grow a bit faster than room supply, the occupancy rate for hotels will edge up to a projected 62.5% in 2022 from 61.0% in 2017.
Figure 4: Hotel occupancy rates (%)
50%
60%
70%
80%
53
56.5
58.9 59 59.661.2 61
59.9 60.1 6060.9
62.5
202220212020201920182017201620152014201320122011
Sources: PricewaterhouseCoopers LLP, Wilkofsky Gruen Associates
Image courtesy of Tsogo Sun Hotels
10 | Hotels Outlook 2018 – 2022
Overview Nigeria KenyaSouth Africa Mauritius Tanzania Cybersecurity and privacy
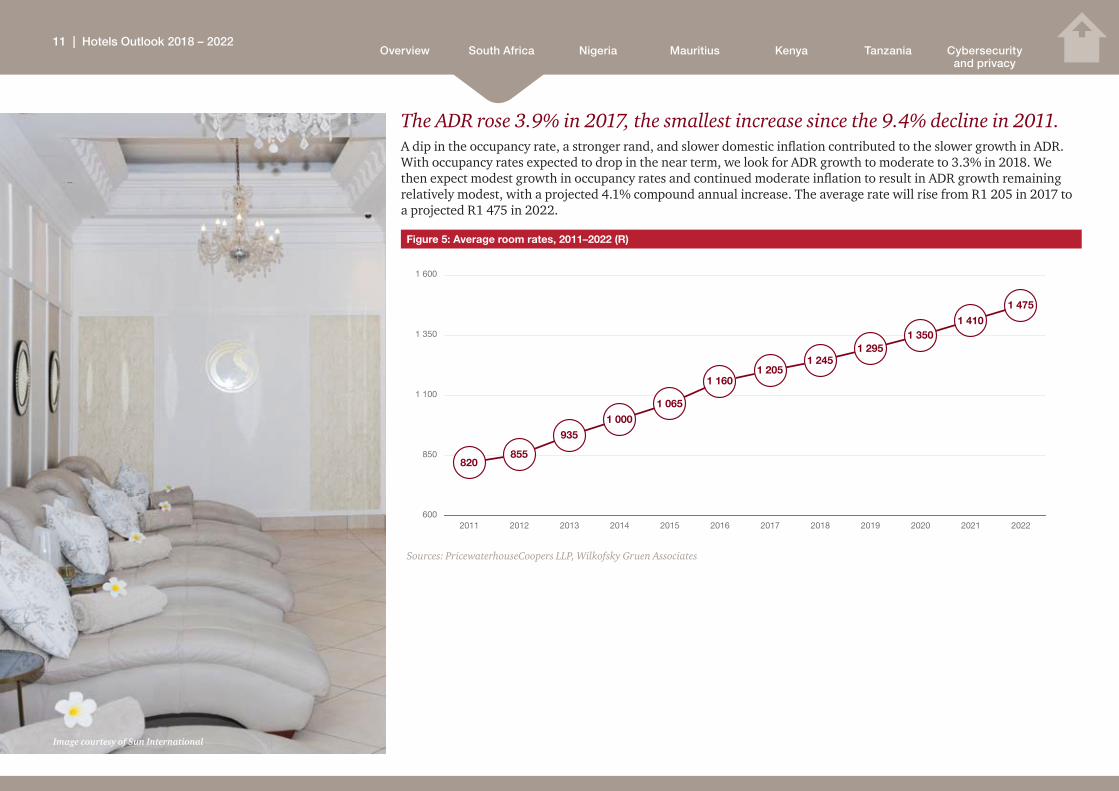
The ADR rose 3.9% in 2017, the smallest increase since the 9.4% decline in 2011.A dip in the occupancy rate, a stronger rand, and slower domestic inflation contributed to the slower growth in ADR. With occupancy rates expected to drop in the near term, we look for ADR growth to moderate to 3.3% in 2018. We then expect modest growth in occupancy rates and continued moderate inflation to result in ADR growth remaining relatively modest, with a projected 4.1% compound annual increase. The average rate will rise from R1 205 in 2017 to a projected R1 475 in 2022.
Figure 5: Average room rates, 2011–2022 (R)
600
850
1 100
1 350
1 600
820855
9351 000
1 065
1 1601 205
1 2451 295
1 3501 410
1 475
202220212020201920182017201620152014201320122011
Sources: PricewaterhouseCoopers LLP, Wilkofsky Gruen Associates
Image courtesy of Sun International
11 | Hotels Outlook 2018 – 2022
Overview Nigeria KenyaSouth Africa Mauritius Tanzania Cybersecurity and privacy
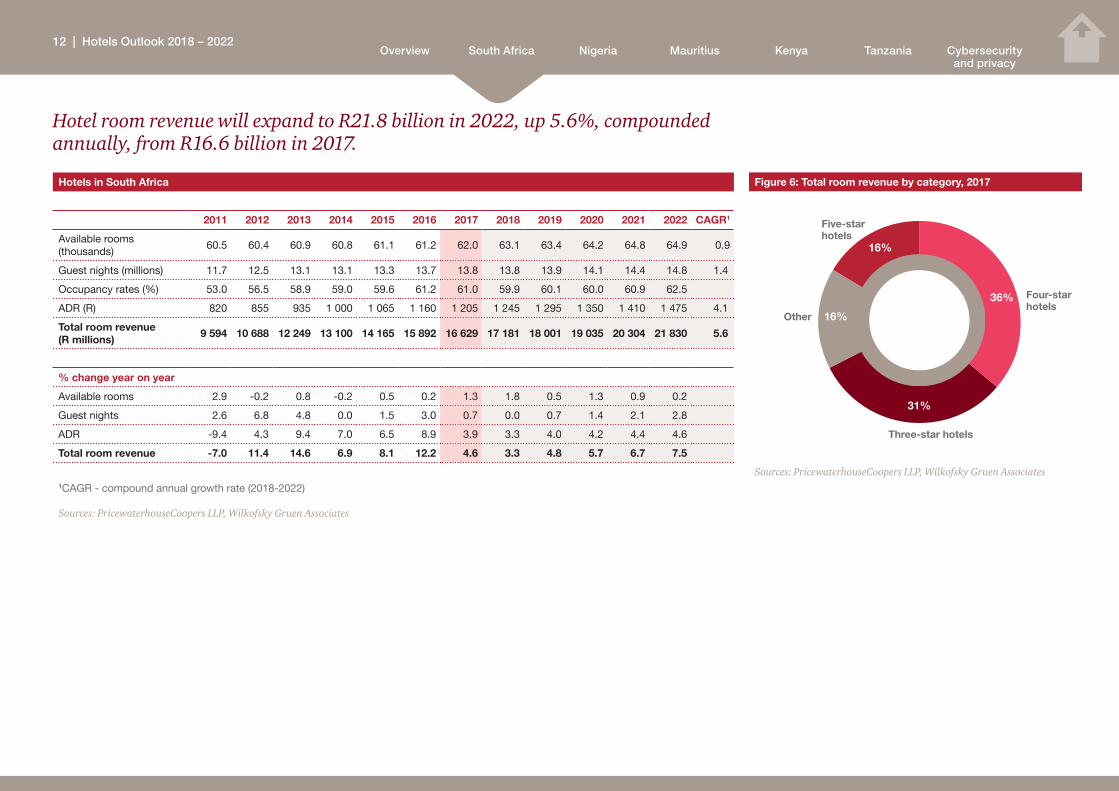
Hotel room revenue will expand to R21.8 billion in 2022, up 5.6%, compounded annually, from R16.6 billion in 2017.
Hotels in South Africa
2011 2012 2013 2014 2015 2016 2017 2018 2019 2020 2021 2022 CAGR1
Available rooms (thousands)
60.5 60.4 60.9 60.8 61.1 61.2 62.0 63.1 63.4 64.2 64.8 64.9 0.9
Guest nights (millions) 11.7 12.5 13.1 13.1 13.3 13.7 13.8 13.8 13.9 14.1 14.4 14.8 1.4
Occupancy rates (%) 53.0 56.5 58.9 59.0 59.6 61.2 61.0 59.9 60.1 60.0 60.9 62.5
ADR (R) 820 855 935 1 000 1 065 1 160 1 205 1 245 1 295 1 350 1 410 1 475 4.1
Total room revenue (R millions) 9 594 10 688 12 249 13 100 14 165 15 892 16 629 17 181 18 001 19 035 20 304 21 830 5.6
% change year on year
Available rooms 2.9 -0.2 0.8 -0.2 0.5 0.2 1.3 1.8 0.5 1.3 0.9 0.2
Guest nights 2.6 6.8 4.8 0.0 1.5 3.0 0.7 0.0 0.7 1.4 2.1 2.8
ADR -9.4 4.3 9.4 7.0 6.5 8.9 3.9 3.3 4.0 4.2 4.4 4.6
Total room revenue -7.0 11.4 14.6 6.9 8.1 12.2 4.6 3.3 4.8 5.7 6.7 7.5
1CAGR - compound annual growth rate (2018-2022)
Sources: PricewaterhouseCoopers LLP, Wilkofsky Gruen Associates
Figure 6: Total room revenue by category, 2017
16%
16%
36%
31%
Other
Three-star hotels
Four-star hotels
Five-star hotels
Sources: PricewaterhouseCoopers LLP, Wilkofsky Gruen Associates
12 | Hotels Outlook 2018 – 2022

Overview Nigeria KenyaSouth Africa Mauritius Tanzania Cybersecurity and privacy
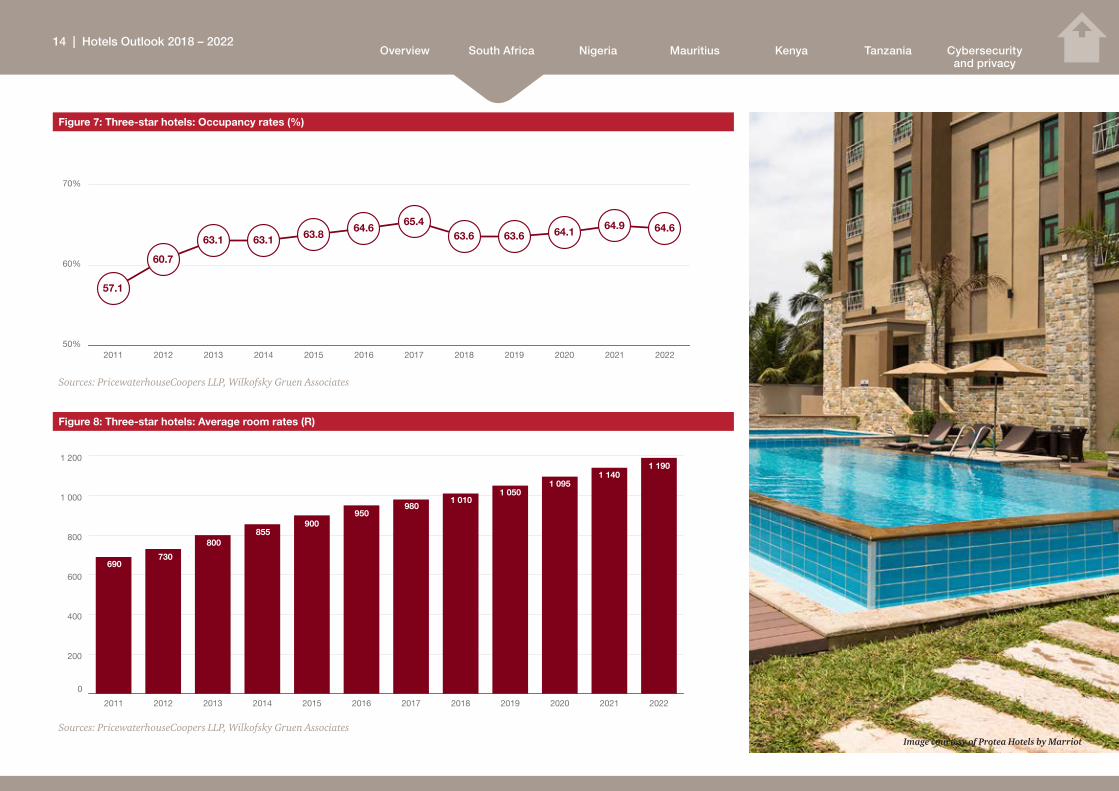
Three-star hotelsThree-star hotels accounted for 36% of all available hotel rooms in South Africa and 31% of total hotel room revenue. The ADR of R980 in 2017 was 19% below the overall average rate of R1 205 for all hotels.
Guest nights for three-star hotels rose 1.9% and, combined with the 3.2% increase in the ADR, room revenue rose 5.1%.
We expect guest nights to drop slightly in 2018, stabilise in 2019 and then rise in 2020 and 2021 as the economy picks up, averaging 0.4%, compounded annually, for the forecast period as a whole. The number of available rooms will increase at a 0.6% annual rate, resulting in a modest drop in the occupancy rate to 64.6% in 2022 from 65.4% in 2017.
The ADR will rise to a projected R1 190 in 2022, growing at a 4.0% compound annual rate. Room revenue in three-star hotels will expand at a projected 4.3% compound annual rate to R6.4 billion in 2022, from R5.2 billion in 2017.
Three-star hotels
2011 2012 2013 2014 2015 2016 2017 2018 2019 2020 2021 2022 CAGR1
Available rooms (thousands)
21.6 21.6 21.7 21.7 21.9 22.0 22.2 22.4 22.4 22.6 22.8 22.9 0.6
Guest nights (millions) 4.5 4.8 5.0 5.0 5.1 5.2 5.3 5.2 5.2 5.3 5.4 5.4 0.44
Occupancy rates (%) 57.1 60.7 63.1 63.1 63.8 64.6 65.4 63.6 63.6 64.1 64.9 64.6
ADR (R) 690 730 800 855 900 950 980 1 010 1 050 1 095 1 140 1 190 4.0
Total room revenue (R millions) 3 105 3 504 4 000 4 275 4 590 4 940 5 194 5 252 5 460 5 804 6 156 6 426 4.3
% change year on year
Available rooms 5.9 0.0 0.5 0.0 0.9 0.5 0.9 0.9 0.0 0.9 0.9 0.4
Guest nights 4.7 6.7 4.2 0.0 2.0 2.0 1.9 -1.9 0.0 1.9 1.9 0.0
ADR -4.2 5.8 9.6 6.9 5.3 5.6 3.2 3.1 4.0 4.3 4.1 4.4
Total room revenue 0.3 12.9 14.2 6.9 7.4 7.6 5.1 1.1 4.0 6.3 6.1 4.4
1CAGR - compound annual growth rate (2018-2022)
Sources: PricewaterhouseCoopers LLP, Wilkofsky Gruen Associates
Image courtesy of Protea Hotels by Marriot
Three-star hotels accounted for 31% of total hotel revenue
13 | Hotels Outlook 2018 – 2022
Overview Nigeria KenyaSouth Africa Mauritius Tanzania Cybersecurity and privacy
Figure 7: Three-star hotels: Occupancy rates (%)
50%
60%
70%
80%
57.1
60.7
63.1 63.1 63.864.6
65.463.6 63.6 64.1
64.9 64.6
202220212020201920182017201620152014201320122011
Sources: PricewaterhouseCoopers LLP, Wilkofsky Gruen Associates
Figure 8: Three-star hotels: Average room rates (R)
0
200
400
600
800
1 000
1 200
202220212020201920182017201620152014201320122011
690730
800855
900950
9801 010
1 0501 095
1 1401 190
Sources: PricewaterhouseCoopers LLP, Wilkofsky Gruen AssociatesImage courtesy of Protea Hotels by Marriot
14 | Hotels Outlook 2018 – 2022

Overview Nigeria KenyaSouth Africa Mauritius Tanzania Cybersecurity and privacy
Four-star hotelsWith a number of four-star hotels opening in 2017, available rooms increased 1.8%, the first rise since 2013. Guest nights rose 2.4% in 2017, down from the 5.1% increase in 2016. ADR growth slowed markedly, rising only 3.2% in 2017, the slowest gain since 2012 and well below the 8.5% rise in 2016.
Most of the hotel openings scheduled for the coming years will be four-star hotels, leading to a projected 2.4% compound annual increase in available rooms over the next five years, 76% of the total increase in available rooms for all hotels in South Africa.
We expect guest nights to rise as tourism picks up. Most of the projected growth in guest nights, 60%, will be in four-star hotels, up 2.7%, compounded annually. That increase will be a bit faster than growth in available rooms, and the occupancy rate will edge up from 66.1% in 2017 to a projected 67.1% in 2022.
We expect ADR growth to remain modest with a projected 3.4% compound annual increase, from R1 445 in 2017 to an estimated R1 710 in 2022. Room revenue will increase to R8.2 billion in 2022, growing at a 6.2% compound annual rate from R6.1 billion in 2017.
Four-star hotels
2011 2012 2013 2014 2015 2016 2017 2018 2019 2020 2021 2022 CAGR1
Available rooms (thousands)
16.7 16.6 17.1 17.1 17.1 17.1 17.4 18.1 18.5 19.1 19.5 19.6 2.4
Guest nights (millions) 3.3 3.6 3.9 3.9 3.9 4.1 4.2 4.3 4.5 4.6 4.7 4.8 2.7
Occupancy rates (%) 54.1 59.3 62.5 62.5 62.5 65.5 66.1 65.1 66.6 65.8 66.0 67.1
ADR (R) 1 030 1 055 1 140 1 200 1 290 1 400 1 445 1 455 1 505 1 565 1 635 1 710 3.4
Total room revenue (R millions) 3 399 3 798 4 446 4 680 5 031 5 740 6 069 6 257 6 773 7 199 7 685 8 208 6.2
% change year on year
Available rooms 3.7 -0.6 3.0 0.0 0.0 0.0 1.8 4.0 2.2 3.2 2.1 0.5
Guest nights 3.1 9.1 8.3 0.0 0.0 5.1 2.4 2.4 4.7 2.2 2.2 2.1
ADR -12.3 2.4 8.1 5.3 7.5 8.5 3.2 0.7 3.4 4.0 4.5 4.6
Total room revenue -9.6 11.7 17.1 5.3 7.5 14.1 5.7 3.1 8.2 6.3 6.8 6.8
1CAGR - compound annual growth rate (2018-2022)
Sources: PricewaterhouseCoopers LLP, Wilkofsky Gruen Associates
Image courtesy of Tsogo Sun Hotels
Four-star room revenue will increase to R2.8 billion in 2022
15 | Hotels Outlook 2018 – 2022
Overview Nigeria KenyaSouth Africa Mauritius Tanzania Cybersecurity and privacy
Five-star hotels
2011 2012 2013 2014 2015 2016 2017 2018 2019 2020 2021 2022 CAGR1
Available rooms (thousands)
3.2 3.2 3.2 3.1 3.1 3.1 3.1 3.1 3.1 3.1 3.1 3.1 0.0
Guest nights (millions) 0.6 0.7 0.8 0.8 0.9 0.9 0.9 0.9 0.9 1.0 1.0 1.0 2.1
Occupancy rates (%) 51.4 59.8 68.5 70.7 79.5 79.3 79.5 79.5 79.5 88.1 88.4 88.4
ADR (R) 1 750 1 780 1 950 2 200 2 370 2 720 2 960 3 190 3 430 3 700 4 015 4 375 8.1
Total room revenue (R millions) 1 050 1 246 1 560 1 760 2 133 2 448 2 664 2 871 3 087 3 700 4 015 4 375 10.4
% change year on year
Available rooms 3.2 0.0 0.0 -3.1 0.0 0.0 0.0 0.0 0.0 0.0 0.0 0.0
Guest nights 0.0 16.7 14.3 0.0 12.5 0.0 0.0 0.0 0.0 11.1 0.0 0.0
ADR -17.3 1.7 9.6 12.8 7.7 14.8 8.8 7.8 7.5 7.9 8.5 9.0
Total room revenue -17.3 18.7 25.2 12.8 21.2 14.8 8.8 7.8 7.5 19.9 8.5 9.0
1CAGR - compound annual growth rate (2018-2022)
Sources: PricewaterhouseCoopers LLP, Wilkofsky Gruen Associates
Five-star hotels
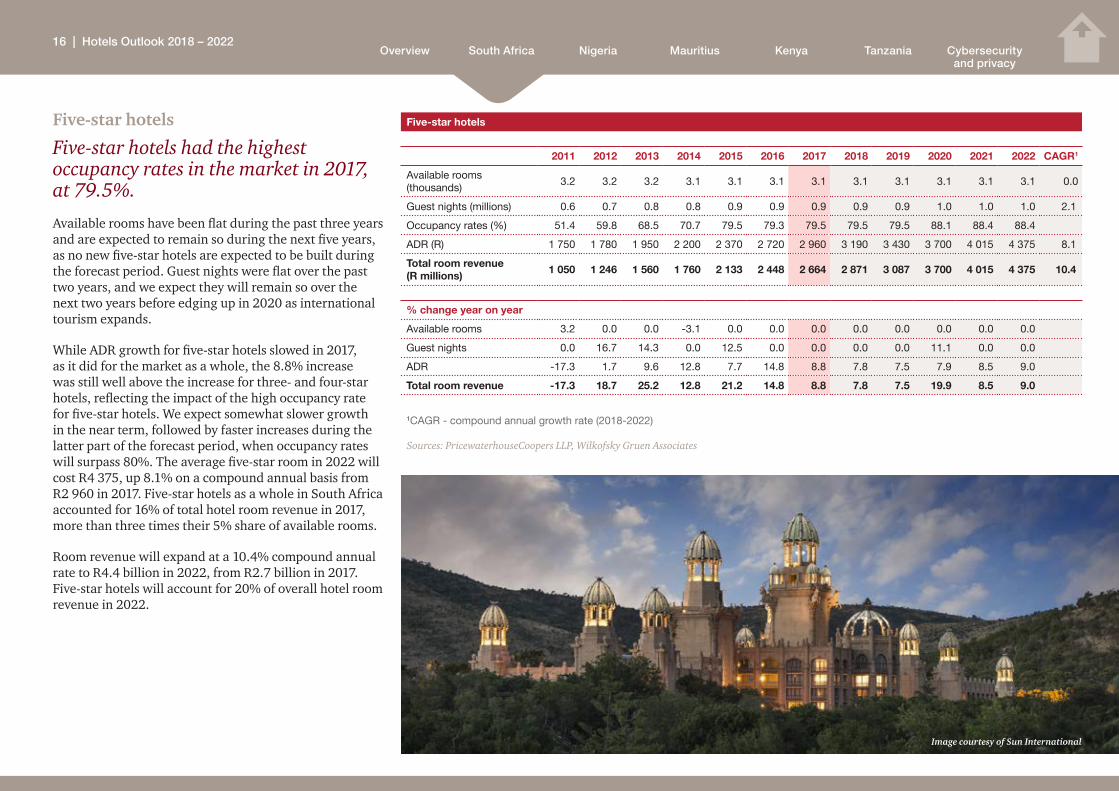
Five-star hotels had the highest occupancy rates in the market in 2017, at 79.5%.
Available rooms have been flat during the past three years and are expected to remain so during the next five years, as no new five-star hotels are expected to be built during the forecast period. Guest nights were flat over the past two years, and we expect they will remain so over the next two years before edging up in 2020 as international tourism expands.
While ADR growth for five-star hotels slowed in 2017, as it did for the market as a whole, the 8.8% increase was still well above the increase for three- and four-star hotels, reflecting the impact of the high occupancy rate for five-star hotels. We expect somewhat slower growth in the near term, followed by faster increases during the latter part of the forecast period, when occupancy rates will surpass 80%. The average five-star room in 2022 will cost R4 375, up 8.1% on a compound annual basis from R2 960 in 2017. Five-star hotels as a whole in South Africa accounted for 16% of total hotel room revenue in 2017, more than three times their 5% share of available rooms.
Room revenue will expand at a 10.4% compound annual rate to R4.4 billion in 2022, from R2.7 billion in 2017. Five-star hotels will account for 20% of overall hotel room revenue in 2022.
Image courtesy of Sun International
16 | Hotels Outlook 2018 – 2022

Overview Nigeria KenyaSouth Africa Mauritius Tanzania Cybersecurity and privacy
Figure 9: Guest nights: Three-, four- and five-star hotels (millions)
0
1
2
3
4
5
6
0.6 0.7 0.8 0.8 0.9 0.9 0.9 0.9 0.9 1 1 1
3.33.6
3.9 3.9 3.94.1 4.2 4.3
4.5 4.6 4.7 4.84.5
4.85 5 5.1 5.2 5.3 5.2 5.2 5.3 5.4 5.4
202220212020201920182017201620152014201320122011
Five-star hotels
Four-star hotels
Three-star hotels
Sources: PricewaterhouseCoopers LLP, Wilkofsky Gruen Associates
Figure 10: Occupancy rates: Three-, four- and five-star hotels (%)
Five-star hotels
Four-star hotels
Three-star hotels
40%
50%
60%
70%
80%
90%
100%
51.4
59.8
68.570.7
79.5 79.3 79.5 79.5 79.5
88.1 88.4 88.4
54.1 59.3
62.5 62.5 62.5
65.5 66.1 65.166.6 65.8 66 67.1
57.1
60.763.1 63.1 63.8 64.6 65.4
63.6 63.6 64.1 64.9 64.6
202220212020201920182017201620152014201320122011
Sources: PricewaterhouseCoopers LLP, Wilkofsky Gruen Associates Image courtesy of Tsogo Sun Hotels
17 | Hotels Outlook 2018 – 2022
Overview Nigeria KenyaSouth Africa Mauritius Tanzania Cybersecurity and privacy
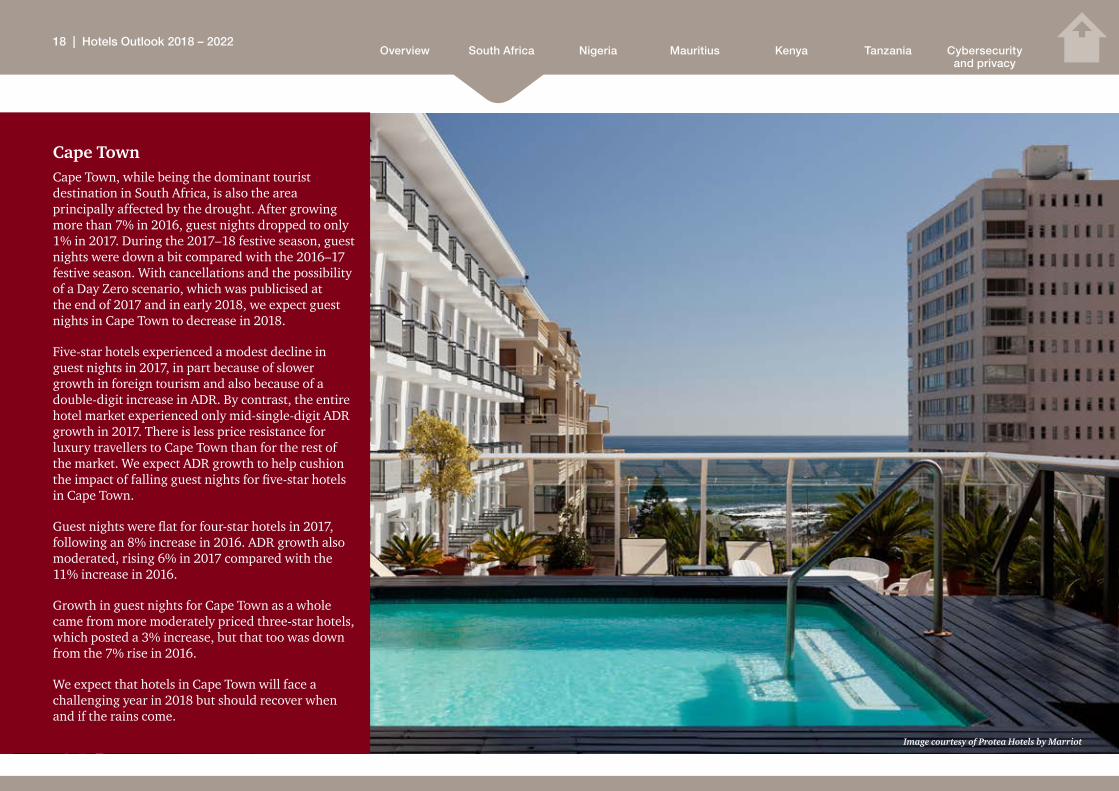
Cape TownCape Town, while being the dominant tourist destination in South Africa, is also the area principally affected by the drought. After growing more than 7% in 2016, guest nights dropped to only 1% in 2017. During the 2017–18 festive season, guest nights were down a bit compared with the 2016–17 festive season. With cancellations and the possibility of a Day Zero scenario, which was publicised at the end of 2017 and in early 2018, we expect guest nights in Cape Town to decrease in 2018.
Five-star hotels experienced a modest decline in guest nights in 2017, in part because of slower growth in foreign tourism and also because of a double-digit increase in ADR. By contrast, the entire hotel market experienced only mid-single-digit ADR growth in 2017. There is less price resistance for luxury travellers to Cape Town than for the rest of the market. We expect ADR growth to help cushion the impact of falling guest nights for five-star hotels in Cape Town.
Guest nights were flat for four-star hotels in 2017, following an 8% increase in 2016. ADR growth also moderated, rising 6% in 2017 compared with the 11% increase in 2016.
Growth in guest nights for Cape Town as a whole came from more moderately priced three-star hotels, which posted a 3% increase, but that too was down from the 7% rise in 2016.
We expect that hotels in Cape Town will face a challenging year in 2018 but should recover when and if the rains come.
Image courtesy of Protea Hotels by Marriot
18 | Hotels Outlook 2018 – 2022
Overview Nigeria KenyaSouth Africa Mauritius Tanzania Cybersecurity and privacy
Cape Town’s water shortage – Silver lining: Sustainable tourismTourism is a key economic driver in the Western Cape and contributes to job creation, with around 300 000 people being employed by the industry. The hospitality industry alone contributes R40 billion to the Western Cape economy, which it simply cannot lose. Cape Town is an international leader in business tourism, according to ratings published by the United Nations World Tourism Organisation.
According to Statistics South Africa, Cape Town is Africa’s most popular tourist destination, with some 3.5 million people passing through its entry ports in August 2017.
A survey completed by Wesgro, the official tourism, trade and investment promotion agency for Cape Town and the Western Cape, indicated that 2018 January and February bookings for hotels surveyed were between 10% and 15% worse when compared to the same period last year. These hotels also indicated that there had been a drop in bookings for the period from April to September.
Cape Town and its many attractions and hotels remain very much open for business. The difference is that people need to be more sparing with their water usage, which may deter certain tourists somewhat. The most significant impact has been a change in behaviour regarding water consumption – a positive change for the future.
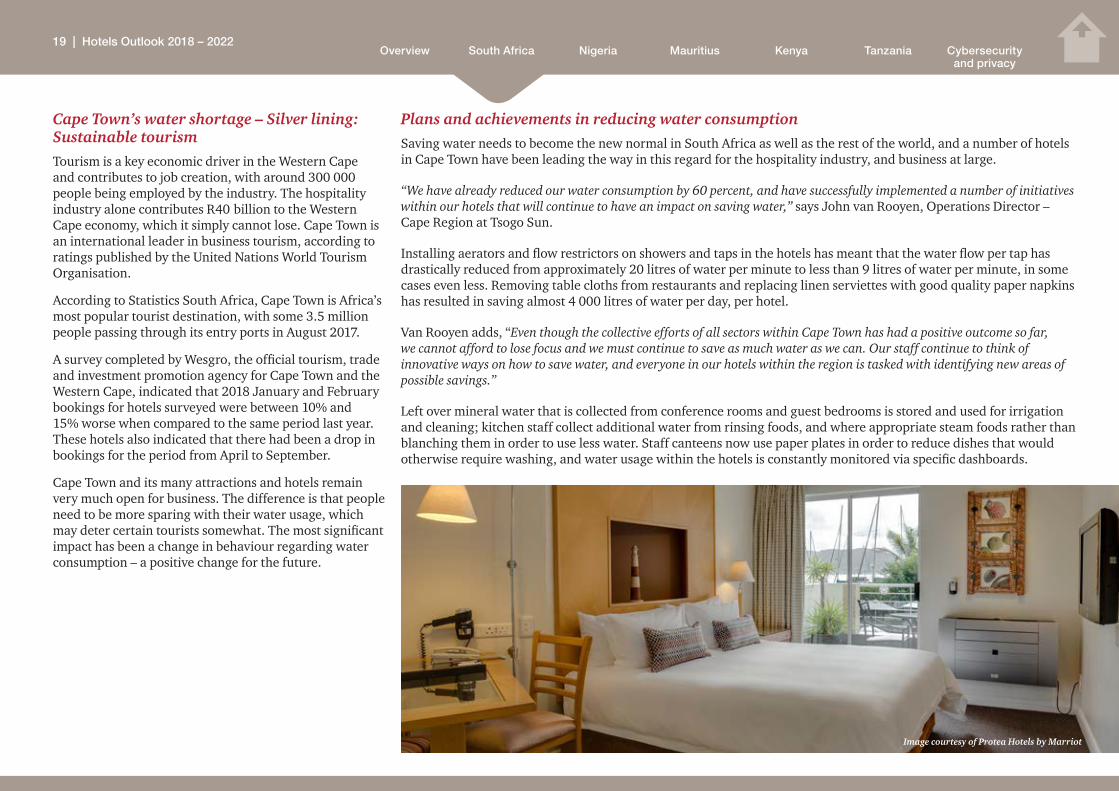
Plans and achievements in reducing water consumptionSaving water needs to become the new normal in South Africa as well as the rest of the world, and a number of hotels in Cape Town have been leading the way in this regard for the hospitality industry, and business at large.
“We have already reduced our water consumption by 60 percent, and have successfully implemented a number of initiatives within our hotels that will continue to have an impact on saving water,” says John van Rooyen, Operations Director – Cape Region at Tsogo Sun.
Installing aerators and flow restrictors on showers and taps in the hotels has meant that the water flow per tap has drastically reduced from approximately 20 litres of water per minute to less than 9 litres of water per minute, in some cases even less. Removing table cloths from restaurants and replacing linen serviettes with good quality paper napkins has resulted in saving almost 4 000 litres of water per day, per hotel.
Van Rooyen adds, “Even though the collective efforts of all sectors within Cape Town has had a positive outcome so far, we cannot afford to lose focus and we must continue to save as much water as we can. Our staff continue to think of innovative ways on how to save water, and everyone in our hotels within the region is tasked with identifying new areas of possible savings.”
Left over mineral water that is collected from conference rooms and guest bedrooms is stored and used for irrigation and cleaning; kitchen staff collect additional water from rinsing foods, and where appropriate steam foods rather than blanching them in order to use less water. Staff canteens now use paper plates in order to reduce dishes that would otherwise require washing, and water usage within the hotels is constantly monitored via specific dashboards.
Image courtesy of Protea Hotels by Marriot
19 | Hotels Outlook 2018 – 2022

Overview Nigeria KenyaSouth Africa Mauritius Tanzania Cybersecurity and privacy
Over and above these water saving initiatives, the group has embarked on a number of alternative water augmentation plans. These include upgrading the borehole at the Southern Sun Newlands hotel, which has allowed the hotel to go off the city’s water grid completely. Other boreholes have been drilled at SunSquare Cape Town Gardens and Garden Court Nelson Mandela Boulevard.
The installation of a desalination plant by the Hospitality Property Fund, a subsidiary of Tsogo Sun has been in progress since last year and once online will support 3 hotels including The Westin Cape Town, Southern Sun The Cullinan and Southern Sun Waterfront. This will allow for a further reduction in the group’s dependency for water supplied by the City of Cape Town.
“Hotels going off the grid means that we are taking the water we would ordinarily use and allowing it to remain in the system for the greater Cape Town area, helping the city to use their water where it’s needed most. Tsogo Sun remains committed to saving water and have a firm focus on implementing measures that will not only have a positive impact in the current situation but will also contribute to long-term sustainable and effective water use,” says van Rooyen in conclusion.
“ The Table Bay has introduced efficient new water-wise behaviours that do not in any way detract from our guests’ experience. Many measures are common to all of our properties such as water-wise tap fittings, low flow showers, dual flush toilet systems, and pressure reducers. Our outdoor water saving initiatives include using indigenous plants in landscaping projects, relying on recycled water to irrigate gardens, treating leaks as a matter of priority and introducing drip irrigation. Significant water savings have also been achieved since installing water harvesting systems, smart metering and recycling water from air-conditioning…
… On the whole guests have been happy to do in Cape Town what Capetonians do. Furthermore, many of the water saving initiatives are back-of-house operational initiatives that have no effect on guests that keep us a little more mindful, every day, of how important this precious resource is to our lives and livelihoods.”
Joanne Selby, General Manager, The Table Bay
“One&Only Cape Town has gone on a journey towards water security at the resort. Several projects and initiatives have been implemented in order to ensure water sustainability in a water-scarce environment. The resort is taking every possible step to effectively manage water consumption and have actively encouraged guests to ‘Save Like A Local’ – short showers are trending!
Some of these initiatives include conversion of cooling towers to enable the use of waste water, rain catchment tanks and removing water treatments from the Spa. One&Only Cape Town has reduced our municipal water usage from 220,000 liters per day to around 60,000 liters per day. In overall terms, our water usage has reduced by 60%. All guests are still able to enjoy the many wonders of the Mother City while we set new World benchmarks in water sustainability.”
Richard Lyon GM of the One&Only Cape Town Image courtesy of Protea Hotels by Marriot
Image courtesy of Protea Hotels by Marriot
20 | Hotels Outlook 2018 – 2022
Overview Nigeria KenyaSouth Africa Mauritius Tanzania Cybersecurity and privacy
Effect on numbers and the expected impact going forward
The tourism industry has largely been affected by the drought. A survey conducted by WESGRO in March showed that among 18 hotels in Cape Town, bookings were down between 10% and 15% in January and February compared with the same period last year. Tourists are opting for other locations where water is not an issue which is specifically impacting occupancies in the hotels.
There is a constant need to share information with visitors that despite the water restrictions, the majority of businesses operating in the hospitality and tourism sector have implemented various water-saving and alternative water augmentation initiatives, and if visitors are mindful of their water usage when visiting the Mother City and help to save like a local, their visits not only have a minimal effect of the water usage within the city, but have a far greater benefit to the economy of the city in a time when it is most needed.
There has been a greater impact on the guest houses within the Cape Town area. This is due to fewer visitors opting to stay at guest houses as Day Zero was announced.
Water tariffs have increased over the past months. This has impacted the smaller mid-tier guest houses, leaving them with significantly higher municipal bills.
Certain five-star hotels have alternative measures in place, e.g. the Silo hotel has its own desalination plant so is unlikely to feel the impact as much as it can still cater for the luxury traveller. The Westin Hotel and other Tsogo Sun Hotels also recently installed their own desalination plants to alleviate the demand on the City’s supply.
Water consumption in Cape Town has reduced tremendously over the past 12 months. This has been possible through the use of certain programmes such as extracting groundwater from underground aquifers, temporary desalination and reclaiming/reusing water. Despite initial concerns, the water crisis may ultimately help to position the country as a global leader in
sustainable tourism practices, including the sensible use of water.
We are also seeing local government and the private sector work together to obtain positive end results. The V&A Waterfront has allocated part of its land to the City of Cape Town and installed a temporary desalination plant.
Wesgro has indicated that Cape Town is launching a global water-wise campaign to position itself as a sustainable tourist destination amid the drought it is experiencing. It has been working with local communities as well as government to build sustainable business and tourism practices in an effort to make Cape Town a global leader in sustainable tourism practices, including the wise use of water.
Judging from the number of conferences that have taken place over recent months, including the Mining Indaba in Cape Town, the water restrictions and drought have not affected the marketing of Cape Town as an international tourist and conference destination.
Along with the expected impact of the water crisis on occupancy rates for 2018/2019, it is possible that we could see an increase in ADR to compensate for higher water costs in the future.
JohannesburgThe hotel market in Johannesburg continued to struggle in 2017 with guest nights falling 1%, which was better than the 4% decline in 2016. Room rates edged up 3% in 2017, less than the market as a whole but enough to generate a modest increase in room revenue.
In contrast with Cape Town, where the drought is hurting the market, guest nights during the 2017–18 festive season in Johannesburg were up 7%. This suggests that the improving South African economy, together with the stronger global economy, may finally be supporting growth for Johannesburg hotels. Room rates in early 2018 are also showing greater strength, with a 5% increase.
There was little difference between four- and five-star hotels compared with three-star hotels. Each experienced declines in guest nights and modest growth in room revenue – 4% for three- and four-star hotels and 3% for five-star hotels.
The hotel market in Johannesburg appears to be on the rebound in 2018 as economic conditions pick up. We expect guest nights to increase and look for faster growth in room revenue compared with 2017.
DurbanGuest nights were essentially flat in Durban in 2017. However, a 2% drop in ADR led to a decline in room revenue, a sharp reversal from the 12% increase in room revenue in 2016.
The hotel market in Durban did not show any improvement in early 2018. Guest nights were down 6%, but a 4% rise in ADR helped to mitigate the impact of that. Nevertheless, room revenue still fell at a rate of 2%.
References
Brown, Justin. “The latest regarding Cape Town’s water supply.” City Press, 17 February 2018.
Water-wise tourism campaign, The Citizen (Gauteng), 11 May 2018.
Dimmer, Kerry. “Water crisis not stopping tourists from visiting city.” Cape Argus, 2 May 2018.
Smith, Carin. “Drought impact already reflects in Cape Town hotel bookings.” Fin24, 25 March 2018.
“Life travel.” The Sunday Independent, 6 May 2018.
21 | Hotels Outlook 2018 – 2022
Overview Nigeria KenyaSouth Africa Mauritius Tanzania Cybersecurity and privacy
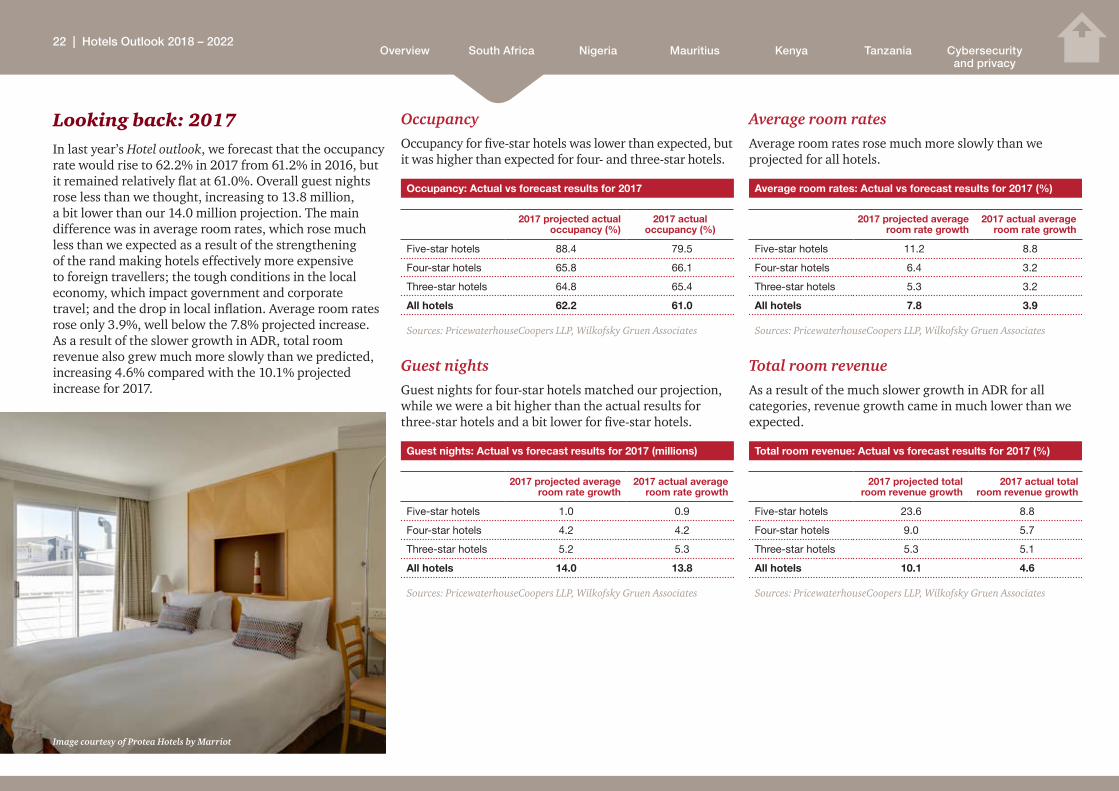
Looking back: 2017In last year’s Hotel outlook, we forecast that the occupancy rate would rise to 62.2% in 2017 from 61.2% in 2016, but it remained relatively flat at 61.0%. Overall guest nights rose less than we thought, increasing to 13.8 million, a bit lower than our 14.0 million projection. The main difference was in average room rates, which rose much less than we expected as a result of the strengthening of the rand making hotels effectively more expensive to foreign travellers; the tough conditions in the local economy, which impact government and corporate travel; and the drop in local inflation. Average room rates rose only 3.9%, well below the 7.8% projected increase. As a result of the slower growth in ADR, total room revenue also grew much more slowly than we predicted, increasing 4.6% compared with the 10.1% projected increase for 2017.
OccupancyOccupancy for five-star hotels was lower than expected, but it was higher than expected for four- and three-star hotels.
Occupancy: Actual vs forecast results for 2017
2017 projected actual occupancy (%)
2017 actual occupancy (%)
Five-star hotels 88.4 79.5
Four-star hotels 65.8 66.1
Three-star hotels 64.8 65.4
All hotels 62.2 61.0
Sources: PricewaterhouseCoopers LLP, Wilkofsky Gruen Associates
Guest nightsGuest nights for four-star hotels matched our projection, while we were a bit higher than the actual results for three-star hotels and a bit lower for five-star hotels.
Guest nights: Actual vs forecast results for 2017 (millions)
2017 projected average room rate growth
2017 actual average room rate growth
Five-star hotels 1.0 0.9
Four-star hotels 4.2 4.2
Three-star hotels 5.2 5.3
All hotels 14.0 13.8
Sources: PricewaterhouseCoopers LLP, Wilkofsky Gruen Associates
Average room ratesAverage room rates rose much more slowly than we projected for all hotels.
Average room rates: Actual vs forecast results for 2017 (%)
2017 projected average room rate growth
2017 actual average room rate growth
Five-star hotels 11.2 8.8
Four-star hotels 6.4 3.2
Three-star hotels 5.3 3.2
All hotels 7.8 3.9
Sources: PricewaterhouseCoopers LLP, Wilkofsky Gruen Associates
Total room revenueAs a result of the much slower growth in ADR for all categories, revenue growth came in much lower than we expected.
Total room revenue: Actual vs forecast results for 2017 (%)
2017 projected total room revenue growth
2017 actual total room revenue growth
Five-star hotels 23.6 8.8
Four-star hotels 9.0 5.7
Three-star hotels 5.3 5.1
All hotels 10.1 4.6
Sources: PricewaterhouseCoopers LLP, Wilkofsky Gruen Associates
Image courtesy of Protea Hotels by Marriot
22 | Hotels Outlook 2018 – 2022
Overview Nigeria KenyaSouth Africa Mauritius Tanzania Cybersecurity and privacy
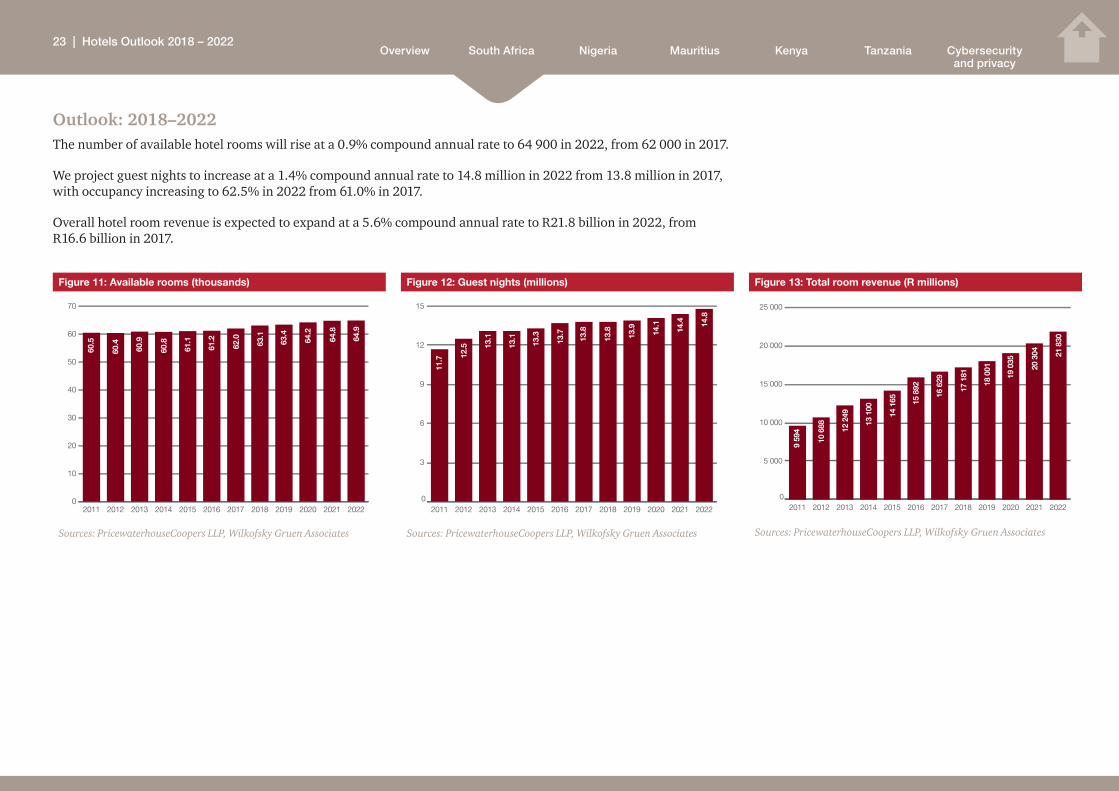
Outlook: 2018–2022The number of available hotel rooms will rise at a 0.9% compound annual rate to 64 900 in 2022, from 62 000 in 2017.
We project guest nights to increase at a 1.4% compound annual rate to 14.8 million in 2022 from 13.8 million in 2017, with occupancy increasing to 62.5% in 2022 from 61.0% in 2017.
Overall hotel room revenue is expected to expand at a 5.6% compound annual rate to R21.8 billion in 2022, from R16.6 billion in 2017.
Figure 11: Available rooms (thousands)
0
10
20
30
40
50
60
70
202220212020201920182017201620152014201320122011
60.5
60.4
60.9
60.8
61.1
61.2
62.0
63.1
63.4
64.2
64.8
64.9
Sources: PricewaterhouseCoopers LLP, Wilkofsky Gruen Associates
Figure 12: Guest nights (millions)
0
3
6
9
12
15
202220212020201920182017201620152014201320122011
11.7 12
.5 13.1
13.1
13.3
13.7
13.8
13.8
13.9
14.1
14.4 14
.8
Sources: PricewaterhouseCoopers LLP, Wilkofsky Gruen Associates
Figure 13: Total room revenue (R millions)
0
5 000
10 000
15 000
20 000
25 000
202220212020201920182017201620152014201320122011
9 59
4
10 6
88 12 2
49
13 1
00
14 1
65 15 8
92
16 6
29
17 1
81
18 0
01
19 0
35
20 3
04 21 8
30
Sources: PricewaterhouseCoopers LLP, Wilkofsky Gruen Associates
23 | Hotels Outlook 2018 – 2022
Overview Nigeria KenyaSouth Africa Mauritius Tanzania Cybersecurity and privacy
South African visa regulations: What next?The relaxation of visa regulations played a large role in boosting tourism in 2016, particularly from China and India. It continued to have a positive impact in 2017, with an increase in visits from Russia.
April 2017 saw Russian citizens no longer requiring a visitor’s visa to enter South Africa, and vice versa. This was brought about by the upcoming Fifa World Cup, with the intention being to make it easier for South Africans to plan a trip to Russia without the hassle of incurring visa costs. The scrapping of visa requirements between Russia and South Africa should promote travel and tourism among citizens of both countries, and has already led to a 52% increase in Russian visitors to South Africa in 2017.
In a recent interview with the CEO of the Southern African Tourism Services Association, David Frost, he noted that there are renewed efforts to revisit the unabridged birth certificate requirement and other visa regulations to make it easier for tourists to visit the country. This is particularly relevant where South Africa has key relationships with other countries, for example China, India and New Zealand.
As detailed in our 2014 Hotels outlook, ‘Rooms with an African view’, in countries where there are only a few South African visa processing centres, such as China and India, it became difficult for people to obtain visas for South Africa. These difficulties caused the number of travellers to South Africa from China to decrease by 46% in 2014, while those from India decreased by 23.5%.
Although it is not certain yet what effect the new regulations may have, after the relaxation of visa regulations in the past, international visitor numbers to South Africa rebounded significantly, with a 12.8% increase in 2016 compared to a 6.8% decrease in 2015.
Tourism in South Africa is under the spotlight, especially considering the impact that the water crisis in Cape Town has had on current visitor numbers. Tourism is the largest contributor to GDP across the African continent, and it is crucial for the private sector, together with Government, to make South Africa as desirable a destination as possible. This might lead to visa regulations being further relaxed in some form or another.
References
“Visa-Free Travel Between South Africa and Russia Now official.” Immigration South Africa.
https://www.immigrationsouthafrica.org/blog/visa-free-travel-between-south-africa-and-russia-now-official/
“Unabridged birth certificates and visa regulations hamper tourism.” Radio 702 http://www.702.co.za/articles/297291/unabridged-birth-certificates-and-visa-regulations-hamper-tourism
PwC South Africa. Hotels outlook: 2016–2020. 2016. https://www.pwc.co.za/en/assets/pdf/hotels-outlook-2016-sm.pdf
PwC South Africa. Hotels outlook: 2017–2021. 2017. https://www.pwc.co.za/en/assets/pdf/hotel-outlook2017.pdf
24 | Hotels Outlook 2018 – 2022
https://www.immigrationsouthafrica.org/blog/visa-free-travel-between-south-africa-and-russia-now-off

Overview Nigeria KenyaSouth Africa Mauritius Tanzania Cybersecurity and privacy
Nigeria
Hotel accommodationGuest nights rose 6.7% in 2017, the first increase since 2013, as economic conditions stabilised and confidence in business increased.
With the Nigerian economy being based on oil, falling oil prices led to a slowdown in economic growth in 2015, followed by a 1.6% decline in 2016 that persisted through the first quarter of 2017. The declining value of the naira led to the imposition of foreign exchange restrictions by the Central Bank of Nigeria that discouraged foreign travel. In June 2016, United Airlines cancelled a scheduled flight from Houston to Lagos – a route principally serving the oil industry – because of the currency restrictions and the decrease in oil business.
As from the second quarter of 2017, in view of oil prices having stabilized, the Nigerian economy began to recover. Real GDP rose 0.8% for 2017 as a whole, but averaged 1.6% growth during the latter half of the year. Real GDP growth is expected to improve to 1.9% in 2018 and to expand at rates averaging 2.8%, compounded annually, over the 2019–22 period. For the forecast period as a whole, real GDP will increase at a 2.6% compound annual rate, a marked improvement over the past three years.
The Nigerian economy had also been plagued by soaring inflation, the result of a sharply depreciating naira whose value fell by a cumulative 45% against the US dollar between 2015 and 2017. The decline in the naira made imports more expensive, which led to a jump in inflation. Consumer price inflation rose from 9.0% in 2015 to 16.4% in 2017. During the latter part of 2017 and early 2018, however, the rate of inflation began to ease. We expect inflation to moderate during the next two years and to drop to single digits beginning in 2020, averaging 9.7%, compounded annually, for the entire forecast period.
Image courtesy of Southern Sun Ikoyi
25 | Hotels Outlook 2018 – 2022

Overview Nigeria KenyaSouth Africa Mauritius Tanzania Cybersecurity and privacy
Real GDP growth and consumer price inflation (%)
2012 2013 2014 2015 2016 2017 2018 2019 2020 2021 2022 CAGR1
Nigeria real GDP 4.3 5.4 6.3 2.7 -1.6 0.8 1.9 2.5 2.8 2.9 2.9 2.6
Global real GDP 2.3 2.4 2.7 2.8 2.4 3.0 3.1 3.0 2.9 2.9 2.9 3.0
Nigeria consumer price inflation*
12.2 8.5 8.1 9.0 15.7 16.4 14.0 10.0 9.0 8.0 7.5 9.7
1CAGR - compound annual growth rate (2018-2022)
*Annual averages
Sources: International Monetary Fund, World Bank, Statistics South Africa, PricewaterhouseCoopers LLP, Wilkofsky Gruen Associates
Figure 14: Real GDP growth and consumer price inflation (%)
-5
0
5
10
15
20
20222021202020192018201720162015201420132012
Nigeria consumer price inflation
Global real GDP
Nigeria real GDP
Source: International Monetary Fund, World Bank, Statistics South Africa, PricewaterhouseCoopers LLP, Wilkofsky Gruen Associates
The domestic economy is the key driver of tourism in Nigeria, with 97% of tourist spending in Nigeria in 2017 having been generated by domestic travellers. Tourism accounts for about 5% of GDP in Nigeria, the smallest percentage for the countries covered in this report.
Despite these impediments, Nigeria remains an attractive market for international hotel brands because of its large economy. Sheraton, Best Western, Hilton, Radisson, City Lodge, Tsogo Sun and Sun International are among the major international and South African brands that have hotels in Nigeria. Over the past five years, the total number of available rooms rose a cumulative 21%, and an additional 30% increase in available rooms is expected over the next five years. Hilton, Marriott, Westin, Sheraton, Radisson and Best Western are among the international brands scheduled to open new hotels in Nigeria during the next five years.
At the same time, because of the difficult economic environment in Nigeria, some brands have delayed or abandoned openings. City Lodge of South Africa, for example, is planning a major expansion in Africa but is currently not planning to build in Nigeria. In the 2017 Hotel outlook, we predicted that by 2021 there would be 13 200 available rooms in Nigeria based on planned openings. We now expect a figure of 11 400 for the same year.
For the forecast period as a whole, the number of available rooms will rise from 9 700 in 2017 to 12 600 in 2022, a 5.4% compound annual increase – still the largest expansion of any country in the report.
26 | Hotels Outlook 2018 – 2022

Overview Nigeria KenyaSouth Africa Mauritius Tanzania Cybersecurity and privacy
Figure 15: Available rooms (thousands)
0
3
6
9
12
15
20222021202020192018201720162015201420132012
8.0 8.
4 8.8 9.
2 9.4 9.7
10.0 10
.6 11.2
11.4
12.6
Sources: PricewaterhouseCoopers LLP, Wilkofsky Gruen Associates
The government is looking to expand the tourist market. The National Council of Arts and Culture is making an effort to promote local culture as part of a campaign to make Nigeria an international destination. The government is also providing incentives for building new facilities. A quarter of hotel income generated from tourists in convertible currencies is now tax exempt if the money is used to build new hotels or conference centres. There is also an additional 5% depreciation above existing levels for hotels.
With the local economy improving, we look for guest nights to continue to increase over the forecast period, with gains accelerating in 2021–22 as forecast economic growth accelerates. Growth for the five-year forecast period will average 7.5%, compounded annually; this is also the highest among the five countries covered in this report. The occupancy rate, which averaged 45.2% in 2017, will climb to 50% or higher in 2021–22. The average room rate increased by 4.8% in 2017, and overall room revenue rose by 11.7%.
Hotels in Nigeria
2012 2013 2014 2015 2016 2017 2018 2019 2020 2021 2022 CAGR1
Available rooms (thousands) 8.0 8.4 8.8 9.2 9.4 9.7 10.0 10.6 11.2 11.4 12.6 5.4
Guest nights (millions) 1.6 1.7 1.6 1.5 1.5 1.6 1.7 1.8 1.9 2.1 2.3 7.5
Occupancy rates (%) 54.6 55.4 49.8 44.7 43.6 45.2 46.6 46.5 46.4 50.5 50.0
ADR (US$) 105 108 112 118 125 131 137 144 151 158 165 4.7
Total room revenue (US$) 168 184 179 177 188 210 233 259 287 332 380 12.6
% change year on year
Available rooms 1.3 5.0 4.8 4.5 2.2 3.2 3.1 6.0 5.7 1.8 10.5
Guest nights 1.6 1.7 1.6 1.5 1.5 1.6 1.7 1.8 1.9 2.1 2.3
ADR 54.6 55.4 49.8 44.7 43.6 45.2 46.6 46.5 46.4 50.5 50.0
Total room revenue 9.8 9.5 -2.7 -1.1 6.2 11.7 11.0 11.2 10.8 15.7 14.5
1CAGR - compound annual growth rate (2018-2022)
Sources: PricewaterhouseCoopers LLP, Wilkofsky Gruen Associates
Figure 16: Occupancy rates (%)
0%
10%
20%
30%
40%
50%
60%
20222021202020192018201720162015201420132012
54.6
%
55.4
%
49.8
%
44.7
%
43.6
%
45.2
%
46.6
%
46.5
%
46.4
% 50.5
%
50.0
%
Sources: PricewaterhouseCoopers LLP, Wilkofsky Gruen Associates
5.4% compund annual increase in available rooms for the forecast period
27 | Hotels Outlook 2018 – 2022
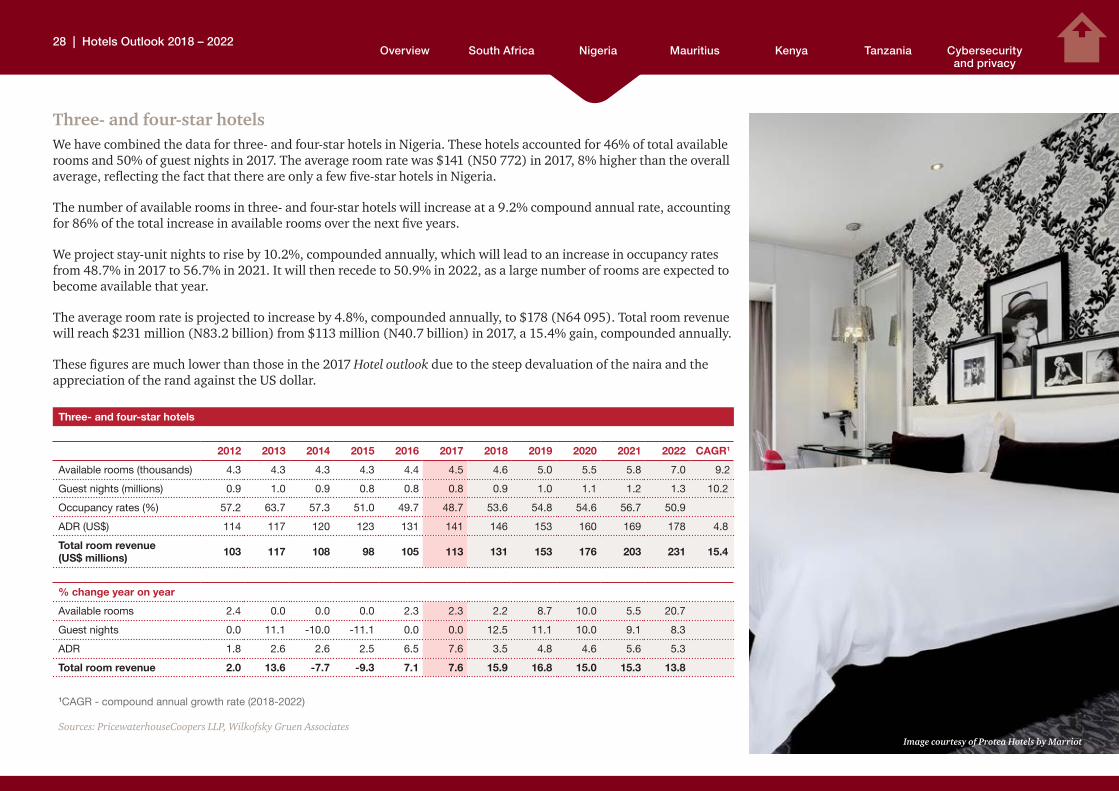
Overview Nigeria KenyaSouth Africa Mauritius Tanzania Cybersecurity and privacy
Three- and four-star hotelsWe have combined the data for three- and four-star hotels in Nigeria. These hotels accounted for 46% of total available rooms and 50% of guest nights in 2017. The average room rate was $141 (N50 772) in 2017, 8% higher than the overall average, reflecting the fact that there are only a few five-star hotels in Nigeria.
The number of available rooms in three- and four-star hotels will increase at a 9.2% compound annual rate, accounting for 86% of the total increase in available rooms over the next five years.
We project stay-unit nights to rise by 10.2%, compounded annually, which will lead to an increase in occupancy rates from 48.7% in 2017 to 56.7% in 2021. It will then recede to 50.9% in 2022, as a large number of rooms are expected to become available that year.
The average room rate is projected to increase by 4.8%, compounded annually, to $178 (N64 095). Total room revenue will reach $231 million (N83.2 billion) from $113 million (N40.7 billion) in 2017, a 15.4% gain, compounded annually.
These figures are much lower than those in the 2017 Hotel outlook due to the steep devaluation of the naira and the appreciation of the rand against the US dollar.
Three- and four-star hotels
2012 2013 2014 2015 2016 2017 2018 2019 2020 2021 2022 CAGR1
Available rooms (thousands) 4.3 4.3 4.3 4.3 4.4 4.5 4.6 5.0 5.5 5.8 7.0 9.2
Guest nights (millions) 0.9 1.0 0.9 0.8 0.8 0.8 0.9 1.0 1.1 1.2 1.3 10.2
Occupancy rates (%) 57.2 63.7 57.3 51.0 49.7 48.7 53.6 54.8 54.6 56.7 50.9
ADR (US$) 114 117 120 123 131 141 146 153 160 169 178 4.8
Total room revenue (US$ millions) 103 117 108 98 105 113 131 153 176 203 231 15.4
% change year on year
Available rooms 2.4 0.0 0.0 0.0 2.3 2.3 2.2 8.7 10.0 5.5 20.7
Guest nights 0.0 11.1 -10.0 -11.1 0.0 0.0 12.5 11.1 10.0 9.1 8.3
ADR 1.8 2.6 2.6 2.5 6.5 7.6 3.5 4.8 4.6 5.6 5.3
Total room revenue 2.0 13.6 -7.7 -9.3 7.1 7.6 15.9 16.8 15.0 15.3 13.8
1CAGR - compound annual growth rate (2018-2022)
Sources: PricewaterhouseCoopers LLP, Wilkofsky Gruen AssociatesImage courtesy of Protea Hotels by Marriot
28 | Hotels Outlook 2018 – 2022

Overview Nigeria KenyaSouth Africa Mauritius Tanzania Cybersecurity and privacy
Looking back: 2017Nigeria’s overall hotel market outperformed our expectations in 2017. Guest nights rose to 1.6 million instead of holding steady at 1.5 million, and the occupancy rate of 45.2% was higher than the 42.4% expected, reflecting the increase in guest nights. Room revenue rose 11.7% in 2017, comparable to the 11.5% projected increase. We had projected three- and four-star hotels to do better than the overall average, but that was not the case, as room revenue for that category increased 7.6%, lower than the 13.0% projected increase.
Actual vs forecast results for 2017
2017 projected 2017 actual
Occupancy (%) 42.4 45.2
Guest nights (millions) 1.5 1.6
Total hotel room revenue growth (%)
11.5 11.7
Three-/four-star hotel room revenue growth (%)
13.0 7.6
Sources: Statistics South Africa, PricewaterhouseCoopers LLP, Wilkofsky Gruen Associates
Outlook: 2018–2022Guest nights will continue to increase over the forecast period, rising at a 7.5% compound annual rate to 2.3 million in 2022 from 1.6 million in 2017.
The average room rate increased 4.8% in 2017. We look for comparable growth over the next five years, averaging 4.7%, compounded annually.
Overall hotel room revenue is expected to expand at a 12.6% compound annual rate to $380 million (N136.8 billion) in 2022 from $210 million (N75.6 billion) in 2017.
Figure 17: Guest nights (millions)
0,0
0,5
1,0
1,5
2,0
2,5
20222021202020192018201720162015201420132012
1.6
1.6
1.6
1.5
1.5
1.7
1.7 1.
8 1.9
2.1
2.3
Sources: PricewaterhouseCoopers LLP, Wilkofsky Gruen Associates
Figure 18: Total room revenue (US$ millions)
0
50
100
150
200
250
300
350
400
20222021202020192018201720162015201420132012
168 18
4
179
177 18
8 210 23
3 259 28
7
332
380
Sources: PricewaterhouseCoopers LLP, Wilkofsky Gruen Associates
29 | Hotels Outlook 2018 – 2022

Overview Nigeria KenyaSouth Africa Mauritius Tanzania Cybersecurity and privacy
Mauritius
Hotel accommodationIn recent years Mauritius has had the strongest hotel market of the countries covered in this report, with a 12.7% increase in room revenue in 2017 and 38% cumulative growth since 2014. Mauritius has had a strong, steady economy and relatively low inflation and remains a popular tourist destination.
According to the ‘Three-year Strategic Plan 2018–21 – Adapting to the changing Global Environment’ published by the Government of Mauritius, in 2017 the tourism sector contributed 8% to GDP while providing 10% of active employment in the country and attracting 8% of investments.
Since 2014, the number of tourists arriving in Mauritius has increased by more than 300 000, a 29% gain. The average length of stay, at the date of publication of this report, was 10.9 nights (2017, 10.8 nights). Gross revenues for 2017 reached EUR1.4bn. There were 114 hotels, with a capacity of 29 656 bed places.
The recent success of the Mauritian tourism and hotel market in part reflects a strong local economy – real GDP recorded an annual expansion of 3.8% during the past two years, and we expect it to continue growing at that pace during the next five years. Mauritius will also benefit from a stronger global economy, which will support international tourism.
One negative factor is the increase in inflation. Consumer price inflation was less than 2% in 2015–16, but it began to pick up in 2017. Even larger increases are expected in the coming years, averaging 4.6%, compounded annually. Paired with increasing currency exchange rates and rising fuel costs, higher prices may make Mauritius a more expensive destination, which we expect may cut into tourist growth.
Image courtesy of Attitude Hotels
12.7% increase in room revenue in 2017
30 | Hotels Outlook 2018 – 2022

Overview Nigeria KenyaSouth Africa Mauritius Tanzania Cybersecurity and privacy
Real GDP growth and consumer price inflation (%)
2012 2013 2014 2015 2016 2017 2018 2019 2020 2021 2022 CAGR1
Mauritius real GDP 3.4 3.2 3.7 3.6 3.8 3.8 3.9 3.8 3.8 3.7 3.6 3.8
Global real GDP 2.3 2.4 2.7 2.8 2.4 3.0 3.1 3.0 2.9 2.9 2.9 3.0
Mauritius consumer price inflation*
3.9 3.5 3.2 1.3 1.0 3.7 5.2 4.8 4.6 4.3 4.2 4.6
1CAGR - compound annual growth rate (2018-2022)
*Annual averages
Sources: International Monetary Fund, World Bank, Statistics South Africa, PricewaterhouseCoopers LLP, Wilkofsky Gruen Associates
Figure 19: Real GDP growth and consumer price inflation (%)
0
1
2
3
4
5
6
20222021202020192018201720162015201420132012
Mauritius consumer price inflation
Global real GDP
Mauritius real GDP
Sources: PricewaterhouseCoopers LLP, Wilkofsky Gruen Associates
Following annual increases of 10.8% in 2015 and 2016, tourist arrivals rose an additional 5.2% in 2017. Faster global GDP growth contributed to that gain, along with the addition of more flights to Mauritius. KLM introduced a flight from Amsterdam to Mauritius in 2017, which is already expanding visitor numbers from the Netherlands, besides the opportunities from other countries such as Scandinavia. Air Mauritius also added a weekly flight to Singapore.
A major tourism challenge has been set by representatives of tourist offices from the Indian Ocean. The ‘Vanilla Islands’ project aims to unite and enhance the assets of islands by pairing them up for a shared tourism experience that combines the specific features of various destinations. The actions implemented by the Vanilla Islands project to bring cruising companies to the Indian Ocean, for example, are bearing fruits, as a number of luxury operations have announced that they will be offering Indian Ocean cruises as from this year.
The Government’s Three-year Strategic Plan 2018–21: Adapting to the Changing Global Environment stressed the importance of the tourism sector for the Mauritian economy and proposed a number of measures to address the challenges at both domestic and external levels. In a nutshell, Government intends to revise its promotional strategy, further liberalise its air access, and reinforce various diversification programmes relating to its tourism products (such as cruise tourism, cultural tourism, medical tourism, etc.) with the focus on the promotion of local products and handicrafts and an eco-friendly infrastructure. Some bold measures have been announced around the upskilling of the workforce to uphold and enhance the quality of service delivery.
31 | Hotels Outlook 2018 – 2022
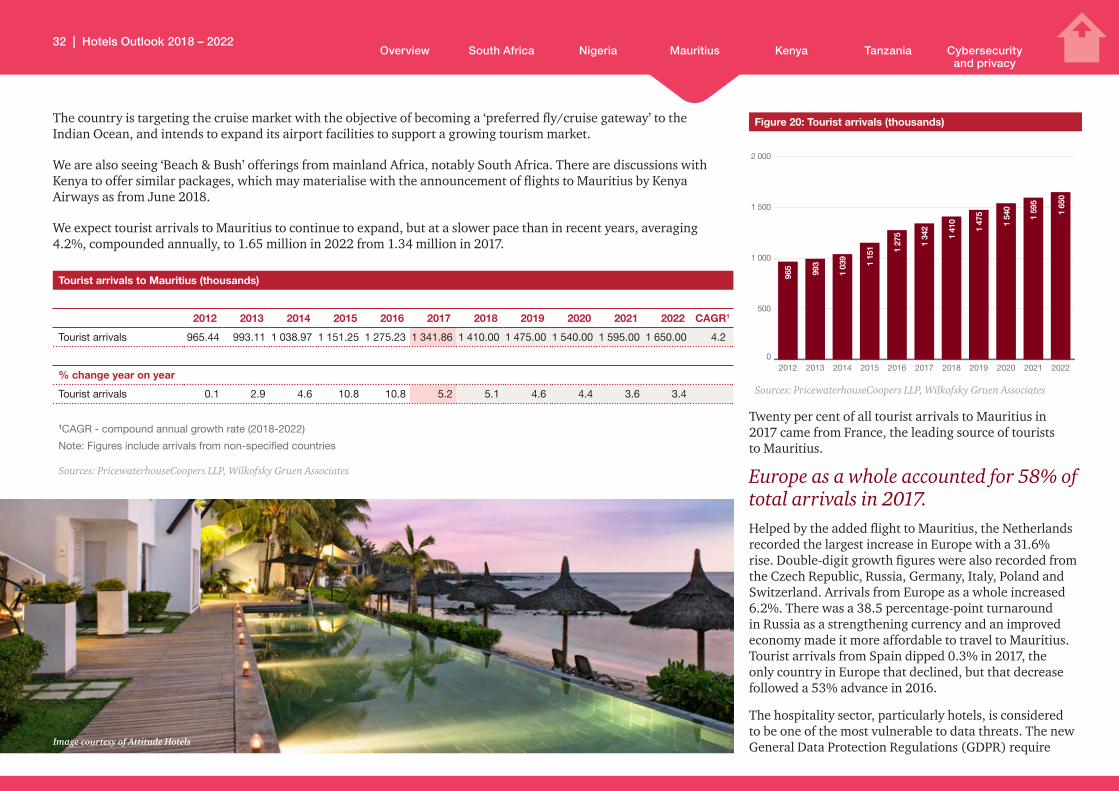
Overview Nigeria KenyaSouth Africa Mauritius Tanzania Cybersecurity and privacy
The country is targeting the cruise market with the objective of becoming a ‘preferred fly/cruise gateway’ to the Indian Ocean, and intends to expand its airport facilities to support a growing tourism market.
We are also seeing ‘Beach & Bush’ offerings from mainland Africa, notably South Africa. There are discussions with Kenya to offer similar packages, which may materialise with the announcement of flights to Mauritius by Kenya Airways as from June 2018.
We expect tourist arrivals to Mauritius to continue to expand, but at a slower pace than in recent years, averaging 4.2%, compounded annually, to 1.65 million in 2022 from 1.34 million in 2017.
Tourist arrivals to Mauritius (thousands)
2012 2013 2014 2015 2016 2017 2018 2019 2020 2021 2022 CAGR1
Tourist arrivals 965.44 993.11 1 038.97 1 151.25 1 275.23 1 341.86 1 410.00 1 475.00 1 540.00 1 595.00 1 650.00 4.2
% change year on year
Tourist arrivals 0.1 2.9 4.6 10.8 10.8 5.2 5.1 4.6 4.4 3.6 3.4
1CAGR - compound annual growth rate (2018-2022)
Note: Figures include arrivals from non-specified countries
Sources: PricewaterhouseCoopers LLP, Wilkofsky Gruen Associates
Figure 20: Tourist arrivals (thousands)
0
500
1 000
1 500
2 000
20222021202020192018201720162015201420132012
965
993
1 03
9
1 15
1 1 27
5
1 34
2
1 41
0
1 47
5
1 54
0
1 59
5
1 65
0
Sources: PricewaterhouseCoopers LLP, Wilkofsky Gruen Associates
Twenty per cent of all tourist arrivals to Mauritius in 2017 came from France, the leading source of tourists to Mauritius.
Europe as a whole accounted for 58% of total arrivals in 2017. Helped by the added flight to Mauritius, the Netherlands recorded the largest increase in Europe with a 31.6% rise. Double-digit growth figures were also recorded from the Czech Republic, Russia, Germany, Italy, Poland and Switzerland. Arrivals from Europe as a whole increased 6.2%. There was a 38.5 percentage-point turnaround in Russia as a strengthening currency and an improved economy made it more affordable to travel to Mauritius. Tourist arrivals from Spain dipped 0.3% in 2017, the only country in Europe that declined, but that decrease followed a 53% advance in 2016.
The hospitality sector, particularly hotels, is considered to be one of the most vulnerable to data threats. The new General Data Protection Regulations (GDPR) require Image courtesy of Attitude Hotels
32 | Hotels Outlook 2018 – 2022

Overview Nigeria KenyaSouth Africa Mauritius Tanzania Cybersecurity and privacy
a programmatic approach to data privacy, and rather intensive actions are required to ensure that the personal data of EU citizens are handled appropriately to prevent theft or misuse. The industry now has to conform to a number of regulations or risk facing significant penalties and reputational damage. Going forward, operators in the sector will need to determine what new processes they will need to implement to become compliant.
A number of large hotel groups have started their compliance journey with regard to the GDPR requirements and are making substantial investments to achieve compliance in a sustainable and demonstrable manner.
Africa accounted for 22.5% of tourist arrivals in 2017, 86% of whom came from Réunion and South Africa. Arrivals from Réunion were virtually flat in 2017, but South Africa was up 7.0%, helped by a stronger rand. Overall tourist arrivals from Africa increased 3.4% in 2017.
In line with its policy of increasing connectivity with mainland Africa, Kenya Airways announced the introduction of direct flights from Nairobi to Mauritius four times a week, starting June 2018. This will complement the existing code-share agreement with Air Mauritius’ three-weekly flights to Nairobi, and should benefit both economic exchanges and tourism (‘Beach & Bush’ offerings) from Kenya and its surrounding countries which are not presently linked to Mauritius.
Tourist arrivals from Africa
2016 2017 % change
Réunion 146 203 146 040 -0.1
South Africa 104 834 112 129 7.0
Malagasy 11 740 12 730 8.4
Seychelles 6 393 6 258 -2.1
Kenya 3 185 3 422 7.4
Zimbabwe 2 047 2 553 24.7
Namibia 1 715 1 505 -12.2
Mayotte 1 189 1 340 12.7
Nigeria 1 372 1 331 -3.0
Botswana 1 088 1 072 -1.5
Zambia 999 994 -0.5
Mozambique 1 144 876 -23.4
Other 9 981 11 648 16.7
Total 291 890 301 898 3.4
Source: Ministry of Finance and Economic Development
As the country is opening up as a stand-out destination for investors and high-net-worth individuals, the Island has seen a growing expatriate community. This creates scope for an increase in the number of family and friends visiting local residents who have either permanent residency or a work permit.
Mauritius is also becoming one of the most popular destination wedding locations at a time when predominant travel trends centre around overseas weddings.
Tourist arrivals from Europe
2016 2017 % change
France 271 963 273 419 0.5
United Kingdom 141 904 149 807 5.6
Germany 103 761 118 856 14.5
Switzerland 36 272 40 252 11.0
Italy 31 337 35 101 12.0
Austria 16 643 17 596 5.7
Belgium 15 675 16 420 4.8
Sweden 14 551 15 516 6.6
Spain 15 304 15 252 -0.3
Netherlands 10 080 13 269 31.6
Poland 10 126 11 318 11.8
Russia 9 295 11 153 20.0
Czech Republic 8 503 10 495 23.4
Other 49 092 51 755 5.4
Total Europe 734 506 780 209 6.2
Source: Ministry of Finance and Economic Development
Image courtesy of Attitude Hotels
33 | Hotels Outlook 2018 – 2022
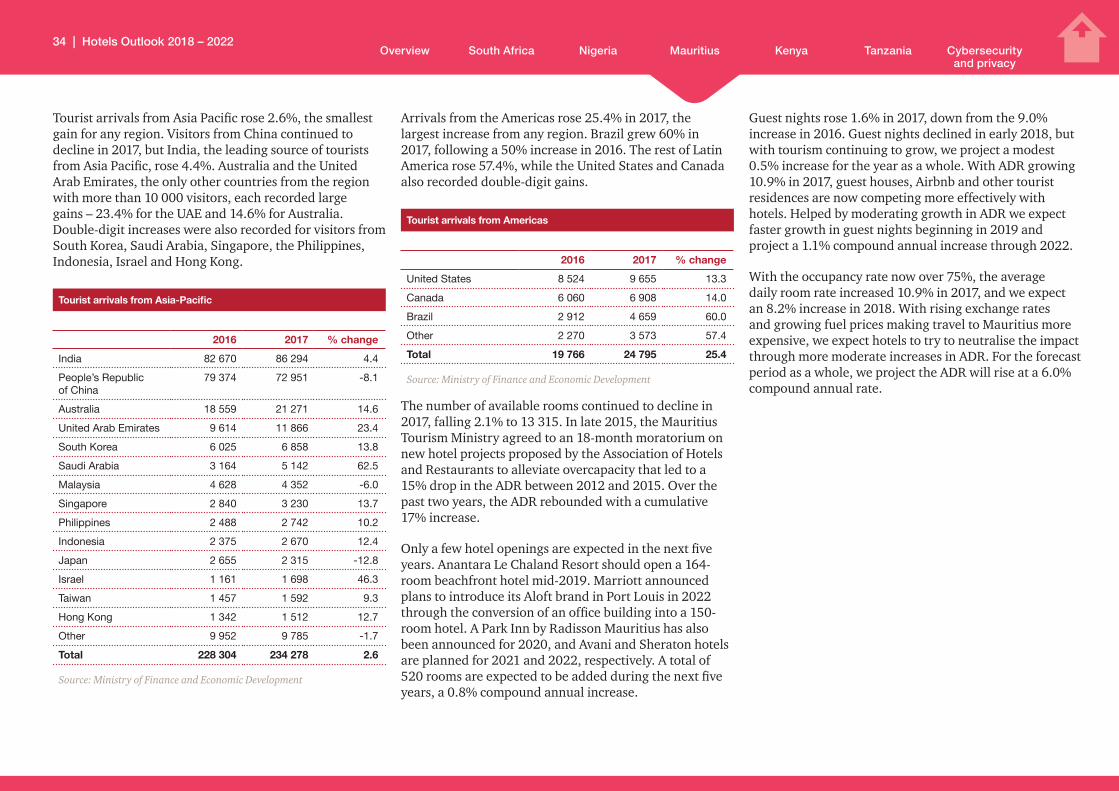
Overview Nigeria KenyaSouth Africa Mauritius Tanzania Cybersecurity and privacy
Tourist arrivals from Asia Pacific rose 2.6%, the smallest gain for any region. Visitors from China continued to decline in 2017, but India, the leading source of tourists from Asia Pacific, rose 4.4%. Australia and the United Arab Emirates, the only other countries from the region with more than 10 000 visitors, each recorded large gains – 23.4% for the UAE and 14.6% for Australia. Double-digit increases were also recorded for visitors from South Korea, Saudi Arabia, Singapore, the Philippines, Indonesia, Israel and Hong Kong.
Tourist arrivals from Asia-Pacific
2016 2017 % change
India 82 670 86 294 4.4
People’s Republic of China
79 374 72 951 -8.1
Australia 18 559 21 271 14.6
United Arab Emirates 9 614 11 866 23.4
South Korea 6 025 6 858 13.8
Saudi Arabia 3 164 5 142 62.5
Malaysia 4 628 4 352 -6.0
Singapore 2 840 3 230 13.7
Philippines 2 488 2 742 10.2
Indonesia 2 375 2 670 12.4
Japan 2 655 2 315 -12.8
Israel 1 161 1 698 46.3
Taiwan 1 457 1 592 9.3
Hong Kong 1 342 1 512 12.7
Other 9 952 9 785 -1.7
Total 228 304 234 278 2.6
Source: Ministry of Finance and Economic Development
Arrivals from the Americas rose 25.4% in 2017, the largest increase from any region. Brazil grew 60% in 2017, following a 50% increase in 2016. The rest of Latin America rose 57.4%, while the United States and Canada also recorded double-digit gains.
Tourist arrivals from Americas
2016 2017 % change
United States 8 524 9 655 13.3
Canada 6 060 6 908 14.0
Brazil 2 912 4 659 60.0
Other 2 270 3 573 57.4
Total 19 766 24 795 25.4
Source: Ministry of Finance and Economic Development
The number of available rooms continued to decline in 2017, falling 2.1% to 13 315. In late 2015, the Mauritius Tourism Ministry agreed to an 18-month moratorium on new hotel projects proposed by the Association of Hotels and Restaurants to alleviate overcapacity that led to a 15% drop in the ADR between 2012 and 2015. Over the past two years, the ADR rebounded with a cumulative 17% increase.
Only a few hotel openings are expected in the next five years. Anantara Le Chaland Resort should open a 164-room beachfront hotel mid-2019. Marriott announced plans to introduce its Aloft brand in Port Louis in 2022 through the conversion of an office building into a 150-room hotel. A Park Inn by Radisson Mauritius has also been announced for 2020, and Avani and Sheraton hotels are planned for 2021 and 2022, respectively. A total of 520 rooms are expected to be added during the next five years, a 0.8% compound annual increase.
Guest nights rose 1.6% in 2017, down from the 9.0% increase in 2016. Guest nights declined in early 2018, but with tourism continuing to grow, we project a modest 0.5% increase for the year as a whole. With ADR growing 10.9% in 2017, guest houses, Airbnb and other tourist residences are now competing more effectively with hotels. Helped by moderating growth in ADR we expect faster growth in guest nights beginning in 2019 and project a 1.1% compound annual increase through 2022.
With the occupancy rate now over 75%, the average daily room rate increased 10.9% in 2017, and we expect an 8.2% increase in 2018. With rising exchange rates and growing fuel prices making travel to Mauritius more expensive, we expect hotels to try to neutralise the impact through more moderate increases in ADR. For the forecast period as a whole, we project the ADR will rise at a 6.0% compound annual rate.
34 | Hotels Outlook 2018 – 2022

Overview Nigeria KenyaSouth Africa Mauritius Tanzania Cybersecurity and privacy
Room revenue rose 12.7% in 2017, principally reflecting the increase in ADR. We look for an additional 8.8% increase in room revenue in 2018. We then expect moderating ADR growth to lead to slower growth in room revenue. For the forecast period as a whole, we project room revenue to increase at a 7.2% compound annual rate from €739 million (R8.1 billion) in 2017 to a projected €1.0 billion (R11.5 billion) in 2022.
Hotels in Mauritius
2012 2013 2014 2015 2016 2017 2018 2019 2020 2021 2022 CAGR1
Available rooms (thousands) 12.527 12.376 12.799 13.617 13.605 13.315 13.330 13.465 13.510 13.645 13.835 0.8
Guest nights (millions) 2.86 2.86 3.02 3.44 3.75 3.81 3.83 3.86 3.92 3.98 4.03 1.1
Occupancy rates (%) 62.4 63.3 64.6 69.2 75.3 78.4 78.7 78.5 79.3 79.9 79.8
ADR (€) 196 179 177 166 175 194 210 224 236 248 260 6.0
Total room revenue (€ millions) 561 512 535 571 656 739 804 865 925 987 1 048 7.2
% change year on year
Available rooms 5.0 -1.2 3.4 6.4 -0.1 -2.1 0.1 1.0 0.3 1.0 1.4
Guest nights 1.1 0.0 5.6 13.9 9.0 1.6 0.5 0.8 1.6 1.5 1.3
ADR 3.2 -8.7 -1.1 -6.2 5.4 10.9 8.2 6.7 5.4 5.1 4.8
Total room revenue 4.3 -8.7 4.5 6.7 14.9 12.7 8.8 7.6 6.9 6.7 6.2
1CAGR - compound annual growth rate (2018-2022)
Sources: PricewaterhouseCoopers LLP, Wilkofsky Gruen Associates
Figure 21: Occupancy rates (%)
0%
10%
20%
30%
40%
50%
60%
70%
80%
20222021202020192018201720162015201420132012
62.4
%
63.3
%
64.6
% 69.2
% 75.3
%
78.4
%
78.7
%
78.5
%
79.3
%
79.9
%
79.8
%
Sources: PricewaterhouseCoopers LLP, Wilkofsky Gruen Associates
Figure 22: Average room rates (€)
0
50
100
150
200
250
300
20222021202020192018201720162015201420132012
196
179
177
166 17
5 194 21
0 224 23
6 248 26
0
Sources: PricewaterhouseCoopers LLP, Wilkofsky Gruen Associates
35 | Hotels Outlook 2018 – 2022

Overview Nigeria KenyaSouth Africa Mauritius Tanzania Cybersecurity and privacy
Five-star hotelsRoom revenue for five-star hotels increased 16.4% in 2017, buoyed by an 8.3% rise in guest nights and a 7.5% increase in ADR. The increase in overall guest nights in 2017 was largely concentrated among five-star hotels.
We expect five-star hotels to continue to outperform the overall market in the coming years. Guest nights will remain steady in 2018 even as the total market declines, and we look for increases in 2020–21 as ADR growth moderates. For the forecast period as a whole, we expect guest nights to increase at a 2.9% compound annual rate.
We look for an 8.1% rise in the average room rate in 2018, followed by mid-single-digit increases thereafter. By 2022, the average rate for a five-star hotel will rise to €366 (R4 008) from €272 (R2 978) in 2017, an 8.1% compound annual increase.
Total room revenue for five-star hotels will increase by a projected 9.2%, compounded annually, to €549 million (R6.0 billion) in 2022 from €354 million (R3.9) billion in 2017.
Five-star hotels
2012 2013 2014 2015 2016 2017 2018 2019 2020 2021 2022 CAGR1
Available rooms (thousands) 5.0 5.1 5.1 5.0 5.1 4.9 5.0 5.1 5.2 5.2 5.2 1.2
Guest nights (millions) 1.0 1.0 1.1 1.2 1.2 1.3 1.3 1.3 1.4 1.5 1.5 2.9
Occupancy rates (%) 54.6 53.7 59.1 65.8 64.3 72.7 71.2 69.8 73.6 79.0 79.0
ADR (€) 250 249 250 233 253 272 294 314 331 348 366 6.1
Total room revenue (€ millions) 250 249 275 280 304 354 382 408 463 522 549 9.2
% change year on year
Available rooms 4.2 2.0 0.0 -2.0 2.0 -3.9 2.0 2.0 2.0 0.0 0.0
Guest nights 11.1 0.0 10.0 9.1 0.0 8.3 0.0 0.0 7.7 7.1 0.0
ADR 3.7 -0.4 0.4 -6.8 8.6 7.5 8.1 6.8 5.4 5.1 5.2
Total room revenue 15.2 -0.4 10.4 1.8 8.6 16.4 7.9 6.8 13.5 12.7 5.2
1CAGR - compound annual growth rate (2018-2022)
Sources: PricewaterhouseCoopers LLP, Wilkofsky Gruen Associates
Figure 23: Average room rates for five-star hotels (€)
0
50
100
150
200
250
300
350
400
20222021202020192018201720162015201420132012
250
250
249
233 25
3 272 29
4 314 33
1 348 36
6
Sources: PricewaterhouseCoopers LLP, Wilkofsky Gruen Associates
Room revenue for Five-star hotels increased 16.4% in 2017
36 | Hotels Outlook 2018 – 2022
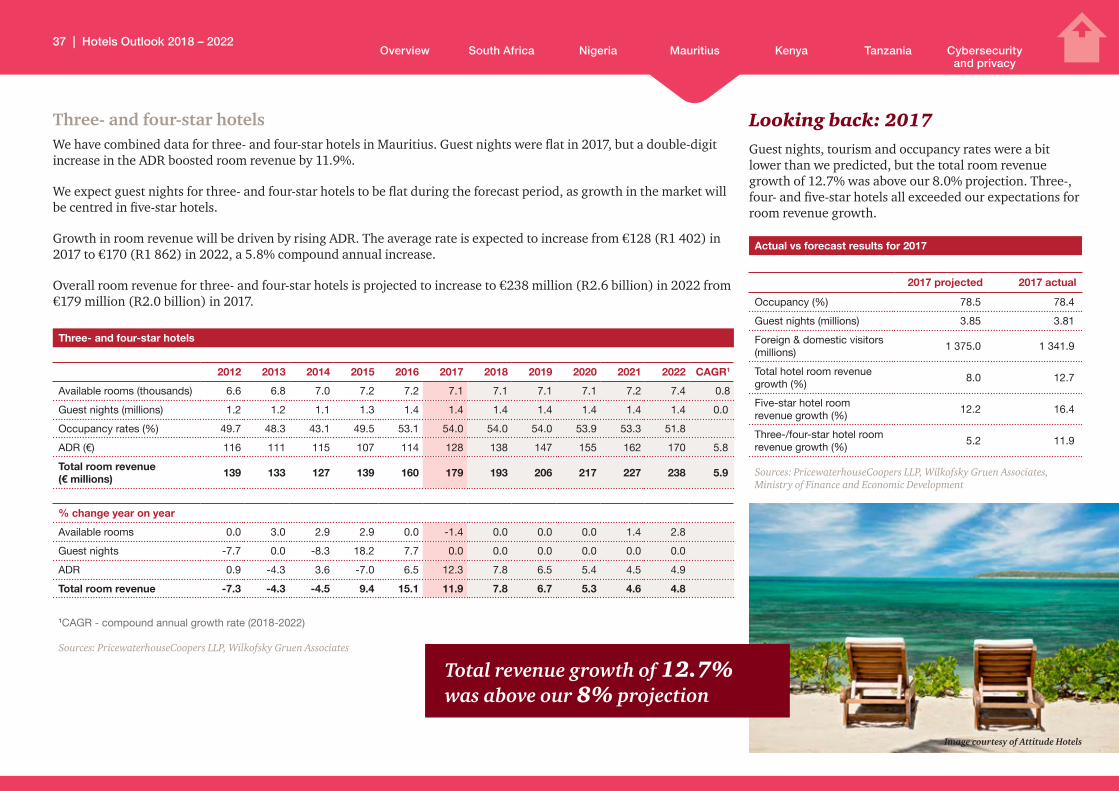
Overview Nigeria KenyaSouth Africa Mauritius Tanzania Cybersecurity and privacy
Three- and four-star hotelsWe have combined data for three- and four-star hotels in Mauritius. Guest nights were flat in 2017, but a double-digit increase in the ADR boosted room revenue by 11.9%.
We expect guest nights for three- and four-star hotels to be flat during the forecast period, as growth in the market will be centred in five-star hotels.
Growth in room revenue will be driven by rising ADR. The average rate is expected to increase from €128 (R1 402) in 2017 to €170 (R1 862) in 2022, a 5.8% compound annual increase.
Overall room revenue for three- and four-star hotels is projected to increase to €238 million (R2.6 billion) in 2022 from €179 million (R2.0 billion) in 2017.
Three- and four-star hotels
2012 2013 2014 2015 2016 2017 2018 2019 2020 2021 2022 CAGR1
Available rooms (thousands) 6.6 6.8 7.0 7.2 7.2 7.1 7.1 7.1 7.1 7.2 7.4 0.8
Guest nights (millions) 1.2 1.2 1.1 1.3 1.4 1.4 1.4 1.4 1.4 1.4 1.4 0.0
Occupancy rates (%) 49.7 48.3 43.1 49.5 53.1 54.0 54.0 54.0 53.9 53.3 51.8
ADR (€) 116 111 115 107 114 128 138 147 155 162 170 5.8
Total room revenue (€ millions) 139 133 127 139 160 179 193 206 217 227 238 5.9
% change year on year
Available rooms 0.0 3.0 2.9 2.9 0.0 -1.4 0.0 0.0 0.0 1.4 2.8
Guest nights -7.7 0.0 -8.3 18.2 7.7 0.0 0.0 0.0 0.0 0.0 0.0
ADR 0.9 -4.3 3.6 -7.0 6.5 12.3 7.8 6.5 5.4 4.5 4.9
Total room revenue -7.3 -4.3 -4.5 9.4 15.1 11.9 7.8 6.7 5.3 4.6 4.8
1CAGR - compound annual growth rate (2018-2022)
Sources: PricewaterhouseCoopers LLP, Wilkofsky Gruen Associates
Looking back: 2017Guest nights, tourism and occupancy rates were a bit lower than we predicted, but the total room revenue growth of 12.7% was above our 8.0% projection. Three-, four- and five-star hotels all exceeded our expectations for room revenue growth.
Actual vs forecast results for 2017
2017 projected 2017 actual
Occupancy (%) 78.5 78.4
Guest nights (millions) 3.85 3.81
Foreign & domestic visitors (millions)
1 375.0 1 341.9
Total hotel room revenue growth (%)
8.0 12.7
Five-star hotel room revenue growth (%)
12.2 16.4
Three-/four-star hotel room revenue growth (%)
5.2 11.9
Sources: PricewaterhouseCoopers LLP, Wilkofsky Gruen Associates, Ministry of Finance and Economic Development
Image courtesy of Attitude Hotels
Total revenue growth of 12.7% was above our 8% projection
37 | Hotels Outlook 2018 – 2022

Overview Nigeria KenyaSouth Africa Mauritius Tanzania Cybersecurity and privacy
Outlook: 2018–2022According to our projections, the number of available hotel rooms will increase at a 0.8% compound annual rate, rising to 14 835 in 2022.
The average occupancy rate will rise from 78.4% in 2017 to 79.8% in 2022.
We project that guest nights for the forecast period as a whole will rise from 3.81 million in 2017 to 4.03 million in 2022, a 1.1% compound annual increase.
Average room rates should increase by 6.0%, compounded annually to 2022.
Hotel room revenue in Mauritius is expected to grow at a 7.2% compound annual rate to 2022.
Figure 24: Guest nights (millions)
0
1
2
3
4
5
20222021202020192018201720162015201420132012
2.86
2.86 3.
02
3.44
3.75 3.81
3.83
3.86 3.92 3.98 4.03
Sources: PricewaterhouseCoopers LLP, Wilkofsky Gruen Associates
Figure 25: Total room revenue (€ millions)
0
200
400
600
800
1 000
1 200
20222021202020192018201720162015201420132012
561
512
535 57
1
656 73
9 804 86
5 925 98
7 1 04
8
Sources: PricewaterhouseCoopers LLP, Wilkofsky Gruen Associates
Image courtesy of Attitude Hotels
38 | Hotels Outlook 2018 – 2022

Overview Nigeria KenyaSouth Africa Mauritius Tanzania Cybersecurity and privacy
Kenya
Hotel accommodationThe tourist market in Kenya had an up-and-down year. After falling a cumulative 31% between 2012 and 2015 as a result of terrorist attacks and travel advisories discouraging travel to Kenya, international arrivals rose 13.7% in 2016, reflecting the retraction of negative travel advisories. That momentum continued in 2017, helped by the launch of the Standard Gauge Railway (SGR), which makes travelling within Kenya much easier and less time consuming; the opening of new international hotels; and a period of peace and security, all of which made Kenya an attractive destination once more.
Growth was temporarily interrupted in late 2017 when the Supreme Court overturned the August 2017 Presidential election, creating a new period of uncertainty. Cancellations increased and tourism declined in October. Tourist arrivals rebounded in December, however, and overall growth for the year averaged 9.9%. Real GDP growth slowed to 4.7%, the smallest increase since 2012, and inflation jumped to 8.0%, the highest level since 2012.
Hotel guest nights, which were on track to grow at a rate of 6%, fell 19% during the latter part of the year, leading to an 8.3% decrease for 2017 as a whole. The ADR also declined, falling 5.7%, which further depressed the hotel market, leading to a 13.5% decline in hotel room revenue in 2017.
With the immediate impact of the Supreme Court decision wearing off, the hotel market has been showing signs of recovery in early 2018, and we expect a rebound. Guest nights were up in early 2018 and we expect a 9.1% increase for 2018 as a whole.
Inflation is moderating and economic growth is accelerating. We project inflation to drop to 4.5% for 2018 and to average 4.1%, compounded annually through 2022. Real GDP is trending up and is expected to grow 5.3% in 2018, with larger increases thereafter. For the forecast period as a whole, real GDP is projected to grow at a 5.8% compound annual rate.
Image courtesy of Serena lodges
Overall growth in tourist arrivals for the year averaged 9.9%
39 | Hotels Outlook 2018 – 2022

Overview Nigeria KenyaSouth Africa Mauritius Tanzania Cybersecurity and privacy
Real GDP growth and consumer price inflation (%)
2012 2013 2014 2015 2016 2017 2018 2019 2020 2021 2022 CAGR1
Kenya real GDP 4.5 5.9 5.4 5.7 5.8 4.7 5.3 5.7 5.9 6.0 6.0 5.8
Global real GDP 2.8 2.3 2.4 2.7 2.8 2.4 3.0 3.1 3.0 2.9 2.9 3.0
Kenya consumer price inflation*
9.4 5.7 6.9 6.6 6.3 8.0 4.5 4.2 4.0 4.0 4.0 4.1
1CAGR - compound annual growth rate (2018-2022)
*Annual averages
Sources: International Monetary Fund, Kenya National Bureau of Statistics, World Bank, PricewaterhouseCoopers LLP, Wilkofsky Gruen Associates
Figure 26: Real GDP growth and consumer price inflation (%)
0
2
4
6
8
10
20222021202020192018201720162015201420132012
Kenya consumer price inflation
Global real GDP
Kenya real GDP
Sources: PricewaterhouseCoopers LLP, Wilkofsky Gruen Associates
Kenya Airways is introducing a direct flight to the United States in late 2018 that should boost U.S. travel to Kenya. Kenya should also continue to benefit from rising tourism from India, Poland, Russia, the Czech Republic and China, which has been a source of growth in recent years.
Kenya is also making a more concerted push to promote tourism from African countries by marketing the country as a destination for experiences. It won a number of international awards as a tourist destination in the past two years, including being named the leading safari destination in early 2017.
Another initiative has taken the form of Kenya promoting itself as a beach destination, which should be aided by the ‘Beach & Bush’ tourism campaign with Mauritius to promote both countries as tourist destinations.
Image courtesy of Serena lodges
40 | Hotels Outlook 2018 – 2022
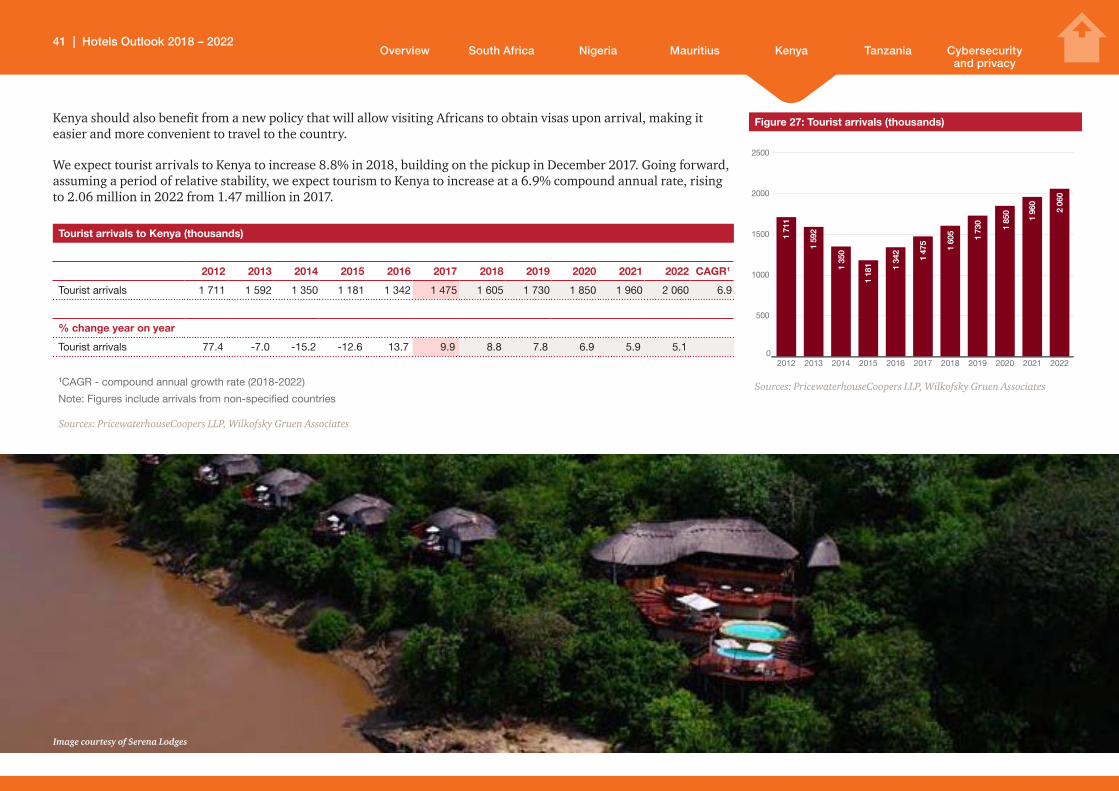
Overview Nigeria KenyaSouth Africa Mauritius Tanzania Cybersecurity and privacy
Kenya should also benefit from a new policy that will allow visiting Africans to obtain visas upon arrival, making it easier and more convenient to travel to the country.
We expect tourist arrivals to Kenya to increase 8.8% in 2018, building on the pickup in December 2017. Going forward, assuming a period of relative stability, we expect tourism to Kenya to increase at a 6.9% compound annual rate, rising to 2.06 million in 2022 from 1.47 million in 2017.
Tourist arrivals to Kenya (thousands)
2012 2013 2014 2015 2016 2017 2018 2019 2020 2021 2022 CAGR1
Tourist arrivals 1 711 1 592 1 350 1 181 1 342 1 475 1 605 1 730 1 850 1 960 2 060 6.9
% change year on year
Tourist arrivals 77.4 -7.0 -15.2 -12.6 13.7 9.9 8.8 7.8 6.9 5.9 5.1
1CAGR - compound annual growth rate (2018-2022)
Note: Figures include arrivals from non-specified countries
Sources: PricewaterhouseCoopers LLP, Wilkofsky Gruen Associates
Figure 27: Tourist arrivals (thousands)
0
500
1000
1500
2000
2500
20222021202020192018201720162015201420132012
1 71
1
1 59
2
1 35
0
1 18
1 1 34
2
1 47
5
1 60
5 1 73
0
1 85
0
1 96
0
2 06
0
Sources: PricewaterhouseCoopers LLP, Wilkofsky Gruen Associates
Image courtesy of Serena Lodges
41 | Hotels Outlook 2018 – 2022
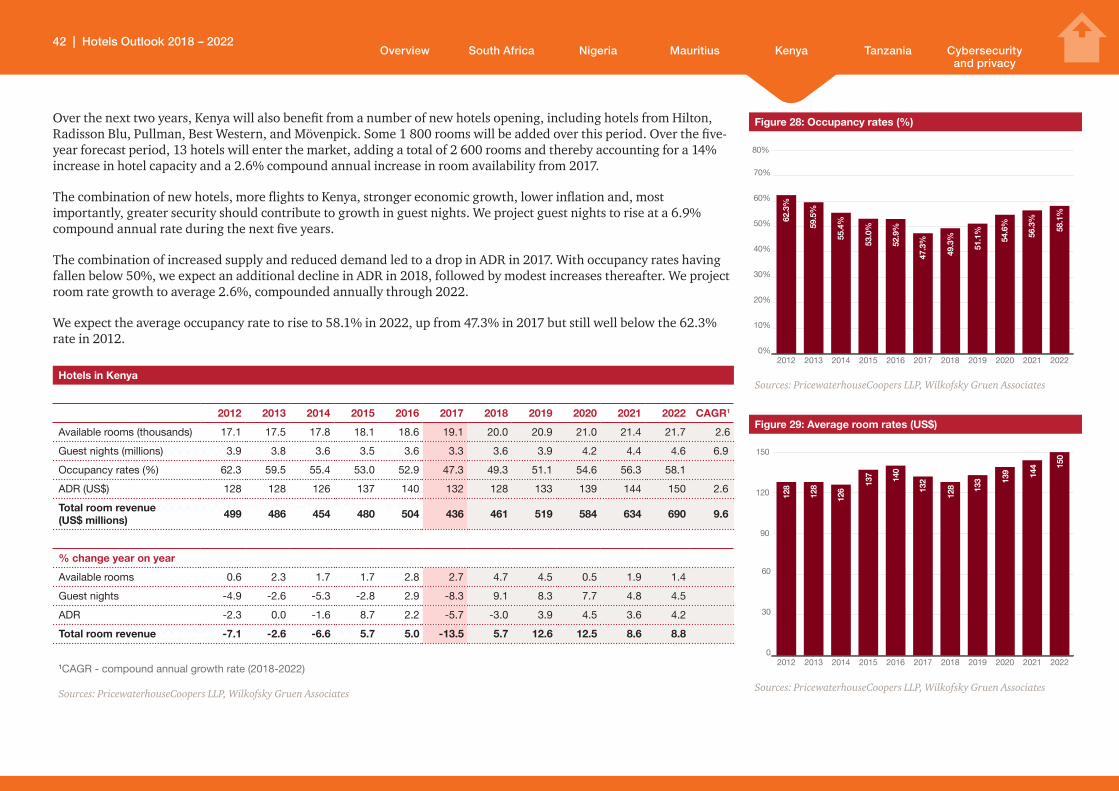
Overview Nigeria KenyaSouth Africa Mauritius Tanzania Cybersecurity and privacy
Over the next two years, Kenya will also benefit from a number of new hotels opening, including hotels from Hilton, Radisson Blu, Pullman, Best Western, and Mövenpick. Some 1 800 rooms will be added over this period. Over the five-year forecast period, 13 hotels will enter the market, adding a total of 2 600 rooms and thereby accounting for a 14% increase in hotel capacity and a 2.6% compound annual increase in room availability from 2017.
The combination of new hotels, more flights to Kenya, stronger economic growth, lower inflation and, most importantly, greater security should contribute to growth in guest nights. We project guest nights to rise at a 6.9% compound annual rate during the next five years.
The combination of increased supply and reduced demand led to a drop in ADR in 2017. With occupancy rates having fallen below 50%, we expect an additional decline in ADR in 2018, followed by modest increases thereafter. We project room rate growth to average 2.6%, compounded annually through 2022.
We expect the average occupancy rate to rise to 58.1% in 2022, up from 47.3% in 2017 but still well below the 62.3% rate in 2012.
Hotels in Kenya
2012 2013 2014 2015 2016 2017 2018 2019 2020 2021 2022 CAGR1
Available rooms (thousands) 17.1 17.5 17.8 18.1 18.6 19.1 20.0 20.9 21.0 21.4 21.7 2.6
Guest nights (millions) 3.9 3.8 3.6 3.5 3.6 3.3 3.6 3.9 4.2 4.4 4.6 6.9
Occupancy rates (%) 62.3 59.5 55.4 53.0 52.9 47.3 49.3 51.1 54.6 56.3 58.1
ADR (US$) 128 128 126 137 140 132 128 133 139 144 150 2.6
Total room revenue (US$ millions) 499 486 454 480 504 436 461 519 584 634 690 9.6
% change year on year
Available rooms 0.6 2.3 1.7 1.7 2.8 2.7 4.7 4.5 0.5 1.9 1.4
Guest nights -4.9 -2.6 -5.3 -2.8 2.9 -8.3 9.1 8.3 7.7 4.8 4.5
ADR -2.3 0.0 -1.6 8.7 2.2 -5.7 -3.0 3.9 4.5 3.6 4.2
Total room revenue -7.1 -2.6 -6.6 5.7 5.0 -13.5 5.7 12.6 12.5 8.6 8.8
1CAGR - compound annual growth rate (2018-2022)
Sources: PricewaterhouseCoopers LLP, Wilkofsky Gruen Associates
Figure 28: Occupancy rates (%)
0%
10%
20%
30%
40%
50%
60%
70%
80%
20222021202020192018201720162015201420132012
62.3
%
59.5
%
55.4
%
53.0
%
52.9
%
47.3
%
49.3
%
51.1
%
54.6
%
56.3
%
58.1
%
Sources: PricewaterhouseCoopers LLP, Wilkofsky Gruen Associates
Figure 29: Average room rates (US$)
0
30
60
90
120
150
20222021202020192018201720162015201420132012
128
128
126
137 140
132
128 13
3 139 14
4 150
Sources: PricewaterhouseCoopers LLP, Wilkofsky Gruen Associates
42 | Hotels Outlook 2018 – 2022
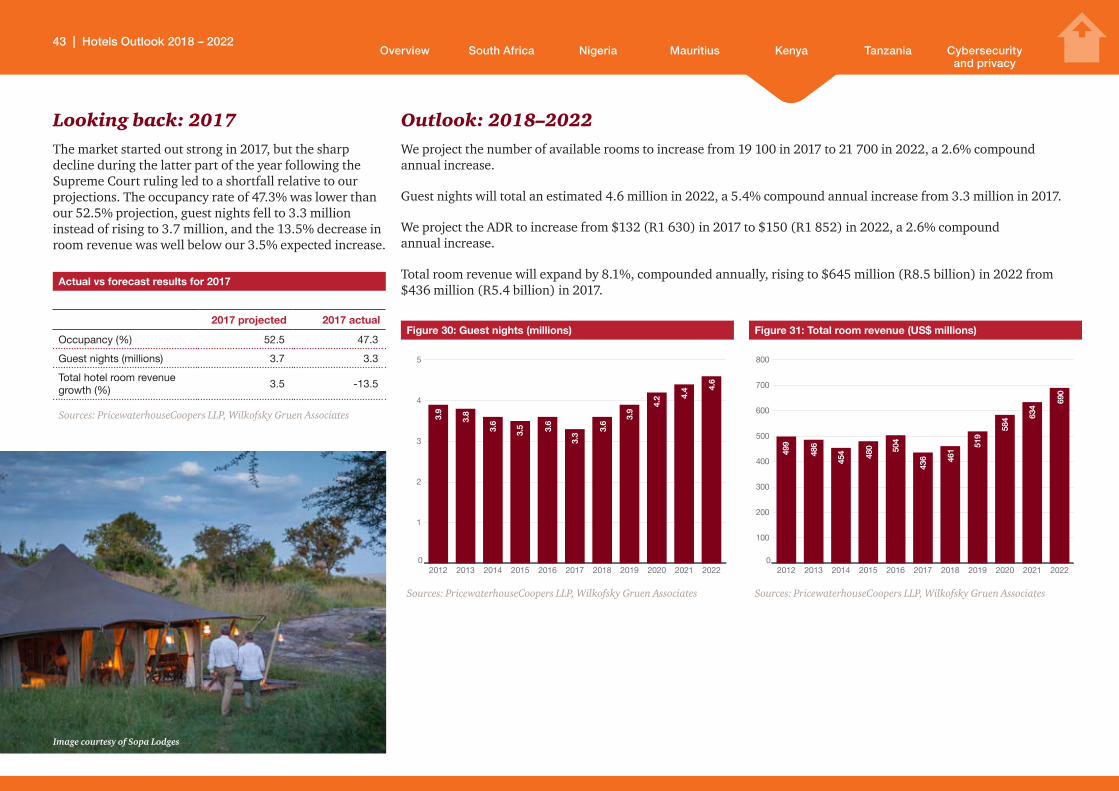
Overview Nigeria KenyaSouth Africa Mauritius Tanzania Cybersecurity and privacy
Looking back: 2017The market started out strong in 2017, but the sharp decline during the latter part of the year following the Supreme Court ruling led to a shortfall relative to our projections. The occupancy rate of 47.3% was lower than our 52.5% projection, guest nights fell to 3.3 million instead of rising to 3.7 million, and the 13.5% decrease in room revenue was well below our 3.5% expected increase.
Actual vs forecast results for 2017
2017 projected 2017 actual
Occupancy (%) 52.5 47.3
Guest nights (millions) 3.7 3.3
Total hotel room revenue growth (%)
3.5 -13.5
Sources: PricewaterhouseCoopers LLP, Wilkofsky Gruen Associates
Outlook: 2018–2022We project the number of available rooms to increase from 19 100 in 2017 to 21 700 in 2022, a 2.6% compound annual increase.
Guest nights will total an estimated 4.6 million in 2022, a 5.4% compound annual increase from 3.3 million in 2017.
We project the ADR to increase from $132 (R1 630) in 2017 to $150 (R1 852) in 2022, a 2.6% compound annual increase.
Total room revenue will expand by 8.1%, compounded annually, rising to $645 million (R8.5 billion) in 2022 from $436 million (R5.4 billion) in 2017.
Figure 30: Guest nights (millions)
0
1
2
3
4
5
20222021202020192018201720162015201420132012
3.9
3.9
4.2 4.
4 4.6
3.8
3.6
3.5 3.6
3.3
3.6
Sources: PricewaterhouseCoopers LLP, Wilkofsky Gruen Associates
Figure 31: Total room revenue (US$ millions)
0
100
200
300
400
500
600
700
800
20222021202020192018201720162015201420132012
499
486
454 48
0 504
436 46
1
519
584 63
4
690
Sources: PricewaterhouseCoopers LLP, Wilkofsky Gruen Associates
Image courtesy of Sopa Lodges
43 | Hotels Outlook 2018 – 2022

Overview Nigeria KenyaSouth Africa Mauritius Tanzania Cybersecurity and privacy
What’s next for Kenya’s hotel sector?Kenya’s hotel sector is experiencing growth, challenges and change. Competition is increasing and putting pressure on hotels to differentiate themselves. Their marketing and the experiences that they offer must be different to reinforce a competitive advantage in the market. Investors in Kenya’s hotels sector should look at the sector’s growth potential, underlying economic fundamentals and differentiation in equal measure.
PwC’s 2018–2022 Hospitality outlook projects that hotel room revenue will grow 9.6%, compounded annually, in response to a rising number of domestic and foreign business and leisure visitors. We project that guests will stay longer and occupancy rates will improve – guest nights are projected to increase from an average of 3.6 million in 2018 to 4.6 million in 2022, and occupancy rates should increase from 49.3% in 2018 to 58.1% in 2022.
The increase in the development of new hotels and the refurbishment of existing ones is an indication of confidence in Kenya’s economic growth. Several new properties under development in Nairobi and some upcountry towns indicate a targeted effort to attract increasing numbers of business travellers who may require specific services like conferencing facilities. Increasing business traveller demand is driven by Nairobi’s position as an East Africa commercial hub and the multiplier effect of devolved government including county economic development.
New investment in tourist-sector hospitality is still limited. The tourism sector continues to face challenges related to insecurity but we have seen steady growth in the number of arrivals for both business and tourism thanks in part to a targeted government publicity campaign. Local, resident tourism is rising in response to devolution and at the same time, domestic air travel is becoming more affordable.
I would expect that 2018 will be a year of much more business travel, particularly at the county level outside of Nairobi and Mombasa. Economic growth, ongoing investment in transport infrastructure and oil production is likely to spur more economic activity across the country.
Staying competitiveWe have seen significant differentiation within the hotels sector and specifically among four- and five-star hotels. Certain hotels have hosted global leaders and international conferences, helping to position them as high-end and world class. Some offer bespoke, luxury experiences whereas others have focused on amenities attractive to short-term business travellers. Some hotels have gone so far as to bring in Michelin starred chefs to operate restaurants as distinct businesses within the hotel environment. Others offer a warm cookie at reception or boast exceptionally comfortable mattresses. Whatever the differentiating factors, they contribute to the experience and make the experience memorable.
Whether business or leisure-focused (or both), every hotelier tries to distinguish themselves on the quality of customer service. They also tend to articulate their value proposition by focusing on the quality of the product in a certain price range. Some hotels are making investments to maintain or improve the experience of staying with them whereas others are struggling a bit. Remaining or becoming relevant could end up being a factor of how much money they have and the willingness of their owners to invest.
Location matters, too. In Nairobi, areas like Upper Hill, Westlands and the Jomo Kenyatta International Airport now host multiple new hotels, some within walking distance of one another. Conference facilities primarily serve to augment the brand and any sizable hotel is expected to offer conferencing facilities. When conference attendees experience the hotel first-hand or, better yet, stay a night or two, conferencing has served
a dual purpose: service to the conference customer and improved hotel brand recognition among attendees.
Investing in Kenya’s hotels sector
There are several factors that investors in Kenya’s hotels sector should consider. First, government has remained a significant client of the hotels sector, even when Kenya experienced a tourism downturn in 2008 and 2013. Second, devolution has facilitated increased opportunity in Kenya’s counties.
While location certainly matters, successful hotel investors also wisely consider whether a well-rounded value proposition truly justifies the investment. Cost and location are not the only factors to consider; a differentiated guest experience matters, too.
Many hotels sector investors have recognised that Kenya provides a range of experiences including business centres as well as safari and beach destinations, all conveniently within short flights of each other. Nairobi and other cities also offer easy access to the East Africa region. Kenya’s hospitality institutes and programmes offer a talented pool of trained professionals, whose quality service and credentials are recognised globally. It is not uncommon to encounter Kenyans working in hotels in Dubai, for example.
Overall, I would encourage investors to be cautious about the current size of the market and competition. This is not to downplay Kenya’s advantages but instead to convey realism. With a competitive and differentiated value proposition, hotels can prosper in the short- and medium-term. But a one-size-fits-all approach is not likely to work in Kenya.
Bernice Kimacia is a PwC Assurance Partner and provides services to hotel sector organisations in Kenya and the East Africa region.
44 | Hotels Outlook 2018 – 2022

Overview Nigeria KenyaSouth Africa Mauritius Tanzania Cybersecurity and privacy
Tanzania
Hotel accommodationIn 2016, the Government introduced an 18% VAT on tourism services and increased the visa charge for business travel to US$200. In July 2017, fixed-rate concession fees were introduced for hotels in the national parks – some as high as US$59 per person per night. These developments led to an expected drop in guest nights in 2017 and a 5.5% decrease in room revenue.
With the impact of the VAT amendment now having been more or less absorbed, some hotel properties are still trying to recover from the introduction of the fixed-rate concession fee. We look for the market to rebound beginning from mid-2018, though, as more flights, a strong economy and new hotels provide a boost to the market.
The government purchased two planes from Canada in 2016 and one in 2017 that were added to the Air Tanzania fleet, with three more coming in 2018. These planes from Bombardier in Canada and Boeing in the United States will enable Air Tanzania to increase its number of flights and to fly to more regions. The Tanzania Tourist Board and Air Tanzania also agreed to team up to jointly promote tourism to Tanzania.
Turkish Airlines added three weekly flights to Zanzibar in late 2016 that will expand tourist opportunities from that region.
Tanzania has a strong domestic economy, with real GDP growing 6.8% in 2017. Real GDP is projected to average 7.0% growth, compounded annually over the next five years, making it one of the fastest-growing economies in the world.
Consumer price inflation was 5.3% in 2017, up a bit from the 5.2% increase in 2016 but well below that of previous years. After slowing during the latter part of 2017, it is projected to moderate to 4.2% in 2018 and to average 4.3%, compounded annually over the next five years. The favourable economic outlook will have a positive impact on domestic tourism.
Tanzania should also benefit from faster growth in global GDP, which should boost tourism, although the higher taxes and rates will remain an impediment to growth.
Room revenue fell 5.5% in 2017 due to decrease in guest nights
Image courtesy of Protea Hotels by Marriot
45 | Hotels Outlook 2018 – 2022

Overview Nigeria KenyaSouth Africa Mauritius Tanzania Cybersecurity and privacy
Real GDP growth and consumer price inflation (%)
2012 2013 2014 2015 2016 2017 2018 2019 2020 2021 2022 CAGR1
Tanzania real GDP 5.1 7.3 6.9 7.0 7.0 6.8 7.0 7.1 7.1 7.0 7.0 7.0
Global real GDP 2.8 2.3 2.4 2.7 2.8 2.4 3.0 3.1 3.0 2.9 2.9 3.0
Tanzania consumer price inflation*
16.0 7.9 6.1 5.6 5.2 5.3 4.2 4.0 4.5 4.5 4.5 4.3
1CAGR - compound annual growth rate (2018-2022)
*Annual averages
Sources: International Monetary Fund, World Bank, Tanzania Bureau of Statistics, PricewaterhouseCoopers LLP, Wilkofsky Gruen Associates
Figure 32: Real GDP growth and consumer price inflation (%)
0
5
10
15
20
20222021202020192018201720162015201420132012
Tanzania consumer price inflation
Global real GDP
Tanzania real GDP
Sources: PricewaterhouseCoopers LLP, Wilkofsky Gruen Associates
Image courtesy of Sopa Lodges Image courtesy of Serena Lodges
46 | Hotels Outlook 2018 – 2022
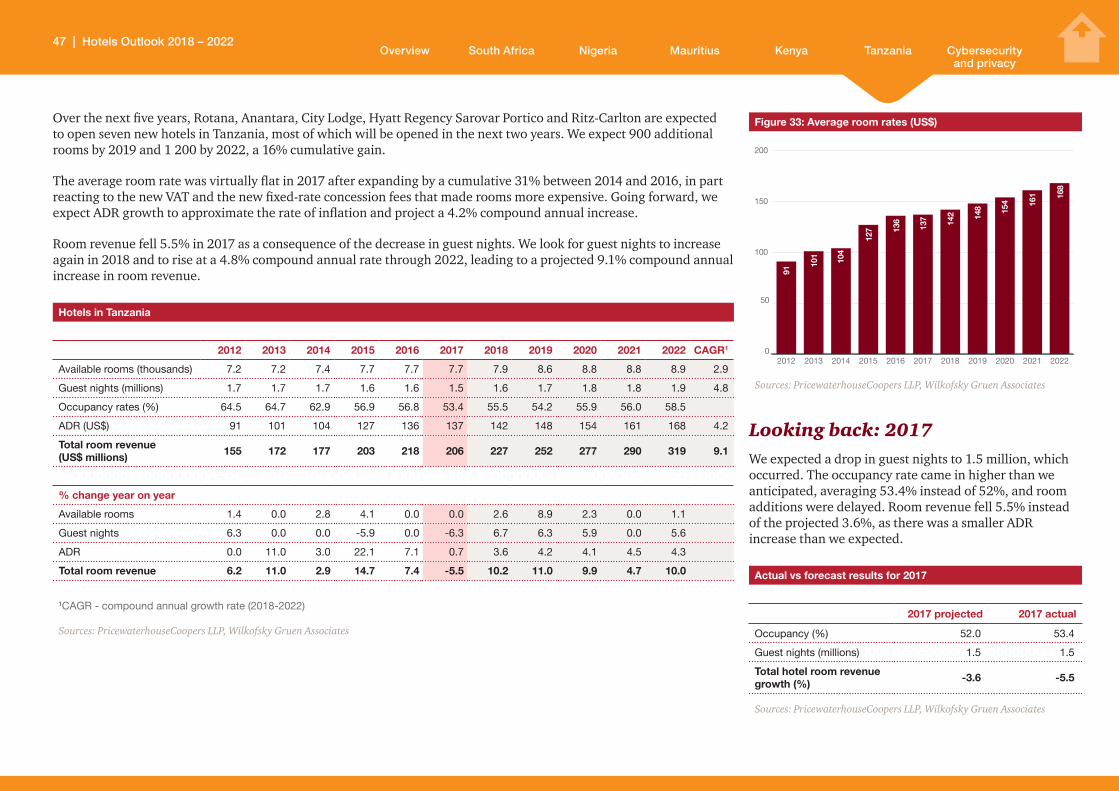
Overview Nigeria KenyaSouth Africa Mauritius Tanzania Cybersecurity and privacy
Over the next five years, Rotana, Anantara, City Lodge, Hyatt Regency Sarovar Portico and Ritz-Carlton are expected to open seven new hotels in Tanzania, most of which will be opened in the next two years. We expect 900 additional rooms by 2019 and 1 200 by 2022, a 16% cumulative gain.
The average room rate was virtually flat in 2017 after expanding by a cumulative 31% between 2014 and 2016, in part reacting to the new VAT and the new fixed-rate concession fees that made rooms more expensive. Going forward, we expect ADR growth to approximate the rate of inflation and project a 4.2% compound annual increase.
Room revenue fell 5.5% in 2017 as a consequence of the decrease in guest nights. We look for guest nights to increase again in 2018 and to rise at a 4.8% compound annual rate through 2022, leading to a projected 9.1% compound annual increase in room revenue.
Hotels in Tanzania
2012 2013 2014 2015 2016 2017 2018 2019 2020 2021 2022 CAGR1
Available rooms (thousands) 7.2 7.2 7.4 7.7 7.7 7.7 7.9 8.6 8.8 8.8 8.9 2.9
Guest nights (millions) 1.7 1.7 1.7 1.6 1.6 1.5 1.6 1.7 1.8 1.8 1.9 4.8
Occupancy rates (%) 64.5 64.7 62.9 56.9 56.8 53.4 55.5 54.2 55.9 56.0 58.5
ADR (US$) 91 101 104 127 136 137 142 148 154 161 168 4.2
Total room revenue (US$ millions) 155 172 177 203 218 206 227 252 277 290 319 9.1
% change year on year
Available rooms 1.4 0.0 2.8 4.1 0.0 0.0 2.6 8.9 2.3 0.0 1.1
Guest nights 6.3 0.0 0.0 -5.9 0.0 -6.3 6.7 6.3 5.9 0.0 5.6
ADR 0.0 11.0 3.0 22.1 7.1 0.7 3.6 4.2 4.1 4.5 4.3
Total room revenue 6.2 11.0 2.9 14.7 7.4 -5.5 10.2 11.0 9.9 4.7 10.0
1CAGR - compound annual growth rate (2018-2022)
Sources: PricewaterhouseCoopers LLP, Wilkofsky Gruen Associates
Figure 33: Average room rates (US$)
0
50
100
150
200
20222021202020192018201720162015201420132012
91
101 104
127 13
6
137 14
2 148 15
4 161 16
8
Sources: PricewaterhouseCoopers LLP, Wilkofsky Gruen Associates
Looking back: 2017We expected a drop in guest nights to 1.5 million, which occurred. The occupancy rate came in higher than we anticipated, averaging 53.4% instead of 52%, and room additions were delayed. Room revenue fell 5.5% instead of the projected 3.6%, as there was a smaller ADR increase than we expected.
Actual vs forecast results for 2017
2017 projected 2017 actual
Occupancy (%) 52.0 53.4
Guest nights (millions) 1.5 1.5
Total hotel room revenue growth (%) -3.6 -5.5
Sources: PricewaterhouseCoopers LLP, Wilkofsky Gruen Associates
47 | Hotels Outlook 2018 – 2022

Overview Nigeria KenyaSouth Africa Mauritius Tanzania Cybersecurity and privacy
Outlook: 2018–2022Growth in available rooms will average 2.9%, compounded annually, with the number of available rooms increasing from 7 700 in 2017 to 8 900 in 2022.
We project guest nights to rise from 1.5 million in 2017 to 1.9 million in 2022, a 4.8% compound annual increase.
Guest nights will grow faster than available rooms, and hotel occupancy will increase from 53.4% in 2017 to 58.5% in 2022.
We project the ADR to increase from $137 (R1 691) in 2017 to $168 (R2 074) in 2022, a 4.2% compound annual increase.
Total room revenue will expand by 9.1%, compounded annually, rising to $319 million (R3.9 billion) in 2022 from $206 million (R2.5 billion) in 2017.
Figure 34: Guest nights (millions)
0,0
0,5
1,0
1,5
2,0
20222021202020192018201720162015201420132012
1.7
1.7
1.7
1.7
1.8
1.8 1.
9
1.6
1.6
1.5 1.
6
Sources: PricewaterhouseCoopers LLP, Wilkofsky Gruen Associates
Figure 35: Occupancy rates (%)
0%
10%
20%
30%
40%
50%
60%
70%
80%
20222021202020192018201720162015201420132012
64.5
%
62.9
%
56.9
%
56.8
%
53.4
%
55.5
%
54.2
%
55.9
%
56.0
%
58.5
%64.7
%
Sources: PricewaterhouseCoopers LLP, Wilkofsky Gruen Associates
Figure 36: Total room revenue (US$ millions)
0
50
100
150
200
250
300
350
20222021202020192018201720162015201420132012
155 17
2 177
218
206 22
7
252
277 29
0
319
203
Sources: PricewaterhouseCoopers LLP, Wilkofsky Gruen Associates
Image courtesy of Serena Lodges
48 | Hotels Outlook 2018 – 2022
Overview Nigeria KenyaSouth Africa Mauritius Tanzania Cybersecurity and privacy
Cybersecurity and privacy
Do you know the risks you are taking? What should you do about cybersecurity, data theft and privacy? What does the EU General Data Protection Regulation have to do with your business and how does this correlate with your country specific Data Protection regulations?
Do you know the risks you are taking?There has always been an explicit driver for risk management but responding to risks in today’s complex and changing market requires a new focus.
CEOs who participated in PwC’s 21st Annual Global CEO Survey say that over-regulation, terrorism, geopolitical uncertainty and cybersecurity are the top threats that keep them up at night.1 Leaders in the tourism and hospitality industry in particular cannot be resting easy.
Spotlight on cyberHow often do you read or hear news stories about cybersecurity and data privacy issues? Is it something that you pick up on once or twice a month, or maybe more frequently?
Cybersecurity and data privacy risks in the hotel sector
• Awareness levels around cybersecurity and data privacy issues are rising rapidly
• Hotels are already in the spotlight due to high-profile breaches
• Trust, confidence, brand and reputation are put at risk
• The legal risks are significant
• Hotels need a vision for security and privacy
Awareness levels about cybersecurity and data privacy are risingThe simple truth is that cybersecurity and data privacy is big news and newsworthiness drives awareness. The public, lawmakers, regulators and judiciary are all sighted on these risks and, in particular, how to protect individuals against adverse consequences following the misuse or unauthorised disclosure of their information.
Individuals provide ‘adverse scrutiny’ to entities when things go wrong and they are fully aware of the fact that some of the world’s biggest, richest and more powerful entities have been humbled by poor approaches to cybersecurity and privacy.
As awareness grows, we are rapidly approaching a tipping point, when entities realise that they have no choice: They have to do much more to tackle the cybersecurity and privacy risks they face and to live up to the expectations that society places in them. If the number of entities that have been humbled in the news is considered, the conclusion seems to be obvious: cybersecurity and privacy issues are not being accorded the priority they deserve.
121st Annual Global CEO Survey: The Anxious Optimist in the Corner Office. PwC. https://www.pwc.com/gx/en/ceo-survey/2018/pwc-ceo-survey-report-2018.pdf
49 | Hotels Outlook 2018 – 2022
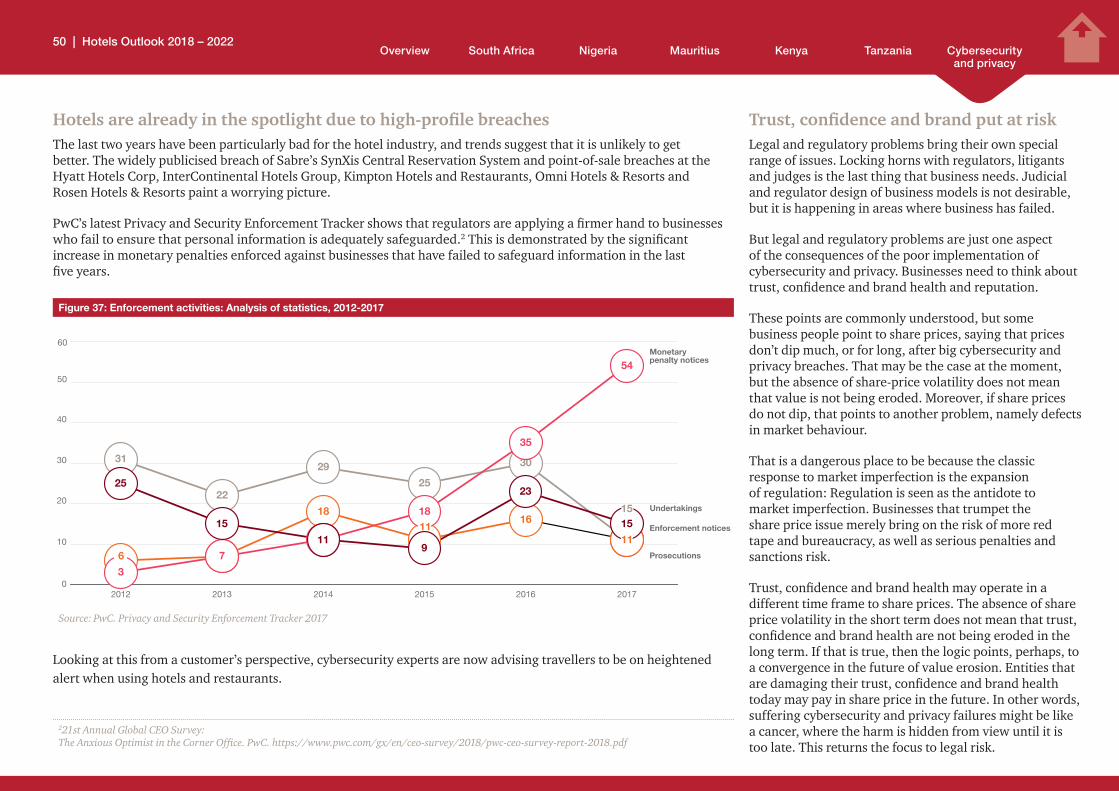
Overview Nigeria KenyaSouth Africa Mauritius Tanzania Cybersecurity and privacy
Hotels are already in the spotlight due to high-profile breachesThe last two years have been particularly bad for the hotel industry, and trends suggest that it is unlikely to get better. The widely publicised breach of Sabre’s SynXis Central Reservation System and point-of-sale breaches at the Hyatt Hotels Corp, InterContinental Hotels Group, Kimpton Hotels and Restaurants, Omni Hotels & Resorts and Rosen Hotels & Resorts paint a worrying picture.
PwC’s latest Privacy and Security Enforcement Tracker shows that regulators are applying a firmer hand to businesses who fail to ensure that personal information is adequately safeguarded.2 This is demonstrated by the significant increase in monetary penalties enforced against businesses that have failed to safeguard information in the last five years.
Figure 37: Enforcement activities: Analysis of statistics, 2012-2017
0
10
20
30
40
50
60
31
22
29
25
30
11
6 7
18
11
16
11
3
7
11
18
35
54
25
15
119
23
15
201720162015201420132012
Undertakings
Prosecutions
Monetary penalty notices
Enforcement notices11
11
15
6
Source: PwC. Privacy and Security Enforcement Tracker 2017
Looking at this from a customer’s perspective, cybersecurity experts are now advising travellers to be on heightened alert when using hotels and restaurants.
Trust, confidence and brand put at riskLegal and regulatory problems bring their own special range of issues. Locking horns with regulators, litigants and judges is the last thing that business needs. Judicial and regulator design of business models is not desirable, but it is happening in areas where business has failed.
But legal and regulatory problems are just one aspect of the consequences of the poor implementation of cybersecurity and privacy. Businesses need to think about trust, confidence and brand health and reputation.
These points are commonly understood, but some business people point to share prices, saying that prices don’t dip much, or for long, after big cybersecurity and privacy breaches. That may be the case at the moment, but the absence of share-price volatility does not mean that value is not being eroded. Moreover, if share prices do not dip, that points to another problem, namely defects in market behaviour.
That is a dangerous place to be because the classic response to market imperfection is the expansion of regulation: Regulation is seen as the antidote to market imperfection. Businesses that trumpet the share price issue merely bring on the risk of more red tape and bureaucracy, as well as serious penalties and sanctions risk.
Trust, confidence and brand health may operate in a different time frame to share prices. The absence of share price volatility in the short term does not mean that trust, confidence and brand health are not being eroded in the long term. If that is true, then the logic points, perhaps, to a convergence in the future of value erosion. Entities that are damaging their trust, confidence and brand health today may pay in share price in the future. In other words, suffering cybersecurity and privacy failures might be like a cancer, where the harm is hidden from view until it is too late. This returns the focus to legal risk.
221st Annual Global CEO Survey: The Anxious Optimist in the Corner Office. PwC. https://www.pwc.com/gx/en/ceo-survey/2018/pwc-ceo-survey-report-2018.pdf
50 | Hotels Outlook 2018 – 2022
Overview Nigeria KenyaSouth Africa Mauritius Tanzania Cybersecurity and privacy
The legal risks are significantThe EU has adopted the General Data Protection Regulation (GDPR). This is a landmark piece of legislation that radically changes our perceptions of how personal data should be handled in business. The GDPR will also have a global effect as businesses offering goods and services to EU residents fall within its broad territorial scope.
Coupled with this, South Africa’s Protection of Personal Information Act (POPIA) is nearing commencement, with the Regulator driving to have the legislation commenced within the next year, after which businesses will have one year to comply with its conditions. However, in the interim the Regulator is not taking a wait-and-see approach, but actively responding to privacy complaints and asking businesses to investigate and remediate.
Together, these two pieces of legislation put people back in control of their personal information and aim to improve how businesses look after personal information while it is in their custody.
As individuals become more aware of the way in which businesses use and, in some instances, abuse their personal information to achieve profits, privacy concerns increase. Furthermore, legislators and regulators have becoming increasingly focussed on protecting the right to privacy of individuals and have taken strong action against businesses that have failed to handle personal information responsibly.
The tough approach to failed cybersecurity and privacy is represented by the powers that the regulators have to intervene, redesign business models and to impose financial penalties and the rights that people will gain to recover compensation if they are unhappy with the way their information is being handled.
PwC’s Global State of Information Security® Survey 2018 (GSISS) – based on responses of 9 500 executives in 122 countries and more than 75 industries – found that 59% of security leaders say digitisation has increased information security spending.3 Going deeper, organisations anticipate cyberattacks against their use of automation/robotics.
59% of security leaders say digitisation has increased information security spending. Going deeper, organisations anticipate cyberattacks against their use of automation/robotics.
One of the key principles of privacy, is that businesses should deploy appropriate measures to safeguard information against unauthorised access, disclosure and misuse. Hence, in a narrow sense privacy legislation establishes the mandate for businesses to deploy effective privacy and security as a matter of law.
In an expansive sense, it is legislation for transparency and individual choice in the handling of personal information. This means that businesses have to tell people what they are doing with their data and come clean if there is a breach of security.
The financial penalty power will enable regulators to impose fines on entities of up to 4% of group annual worldwide turnover under the GDPR and up to R10 million under POPIA per breach. Furthermore, both pieces of legislation envisage the ability of individuals to pursue civil liability claims for the misuse or breach of personal information.
If the litigation risk is modelled by reference to some of world’s largest data breach cases (those affecting personal data), which have exceeded 100 million people on a number of occasions, the financial exposure is £1e+11 (100 million people affected x £1 000 per person), i.e. too big for the calculator app on an iPhone to present in digits.
Respondents in GSISS report that over the past year, the top sources of security incidents in their organisations were current employees (30%), former employees (27%), and unknown hackers (23%). The main impacts include customer and employee records being compromised, and the loss or damage of internal records.
Top sources of security incidents
Current employees 30%
Former employees 27%
Unknown hackers 23%
Source: PwC. Global State of Information Security® Survey 2018
What we are talking about is a potentially ruinous legal risk for businesses with a global footprint, like many in the hospitality and tourism industry. Surely when the penny drops, we will see share price volatility.
For good and bad, cybersecurity and privacy is built on a web of interdependencies and one of them is the foreseeability of harm in a legal sense that follows from past failures. Therefore, when judging legal risk, organisations would be wise to reflect on the fact that there is now global legal connectivity as far as failure events are concerned.
3 Revitalizing privacy and trust in a data-driven world: Key findings from The Global State of Information Security® Survey 2018. PwC. 2018. https://www.pwc.com/us/en/cybersecurity/assets/revitalizing-privacy-trust-in-data-driven-world.pdf
51 | Hotels Outlook 2018 – 2022
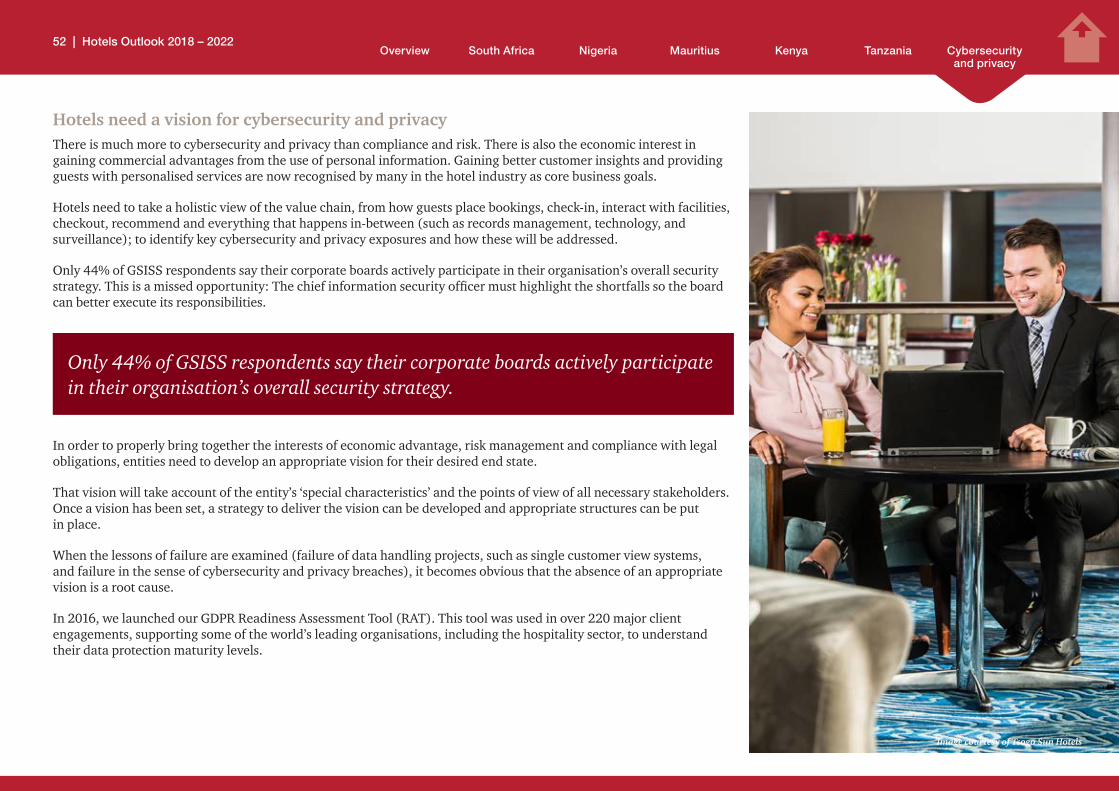
Overview Nigeria KenyaSouth Africa Mauritius Tanzania Cybersecurity and privacy
Hotels need a vision for cybersecurity and privacyThere is much more to cybersecurity and privacy than compliance and risk. There is also the economic interest in gaining commercial advantages from the use of personal information. Gaining better customer insights and providing guests with personalised services are now recognised by many in the hotel industry as core business goals.
Hotels need to take a holistic view of the value chain, from how guests place bookings, check-in, interact with facilities, checkout, recommend and everything that happens in-between (such as records management, technology, and surveillance); to identify key cybersecurity and privacy exposures and how these will be addressed.
Only 44% of GSISS respondents say their corporate boards actively participate in their organisation’s overall security strategy. This is a missed opportunity: The chief information security officer must highlight the shortfalls so the board can better execute its responsibilities.
Only 44% of GSISS respondents say their corporate boards actively participate in their organisation’s overall security strategy.
In order to properly bring together the interests of economic advantage, risk management and compliance with legal obligations, entities need to develop an appropriate vision for their desired end state.
That vision will take account of the entity’s ‘special characteristics’ and the points of view of all necessary stakeholders. Once a vision has been set, a strategy to deliver the vision can be developed and appropriate structures can be put in place.
When the lessons of failure are examined (failure of data handling projects, such as single customer view systems, and failure in the sense of cybersecurity and privacy breaches), it becomes obvious that the absence of an appropriate vision is a root cause.
In 2016, we launched our GDPR Readiness Assessment Tool (RAT). This tool was used in over 220 major client engagements, supporting some of the world’s leading organisations, including the hospitality sector, to understand their data protection maturity levels.
Image courtesy of Tsogo Sun Hotels
52 | Hotels Outlook 2018 – 2022

Overview Nigeria KenyaSouth Africa Mauritius Tanzania Cybersecurity and privacy
In our experience, organisations have had to travel a significant distance from their starting point to levels of acceptable GDPR compliance. Our four-point maturity matrix sets ‘three’ as a notional compliance level and most organisations were performing considerably below that level at the point they engaged with us.
Figure 38: PwC’s GDPR Readiness Assessment Statistics
0
1
2
3
4
Tran
sfer
s
Rig
hts
Inte
grity
&
confi
dent
ialit
y
Sto
rage
lim
itatio
n
Acc
urac
y
Dat
a m
inim
isat
ion
Pur
pose
lim
itatio
n
Law
fuln
ess,
fa
irnes
s &
tr
ansp
aren
cy
Rem
edia
tion
Acc
ount
abili
ty
Cha
lleng
e
Third
par
ties
Ass
uran
ce
Edu
catio
n &
awar
enes
s
Con
trol
s
Des
ign
Pol
icie
s
Reg
iste
rs
Dat
a pr
otec
tion
role
s &
resp
onsi
bilit
y
Gov
erna
nce
Pro
gram
me
build
Visi
on &
str
ateg
y
Terr
itoria
l sco
pe
A maturity score of 3 indicates notional compliance in an Assessment Category
Ave
rag
e m
atur
ity s
core
Domain
Entertainment & media/hospitalityWhole population
Source: PwC GDPR Readiness Assessment. https://www.pwc.co.uk/issues/regulation/general-data-protection-regulation/insights/gdpr-readiness-assessment.html
People responsible for cybersecurity and privacy in hotels ought to ask themselves whether their organisations have appropriate visions for desired end states. If not, they should bring together the stakeholders to discuss ways to take things forward.
Busi Mathe is a Risk Assurance Partner and Privacy Leader at PwC South Africa. Kris Budnik is a Partner and Cyber Security Leader at PwC South Africa.
53 | Hotels Outlook 2018 – 2022
The information contained in this publication is provided for general information purposes only, and does not constitute the provision of legal or professional advice in any way. Before making any decision or taking any action, a professional adviser should be consulted. No responsibility for loss to any person acting or refraining from action as a result of any material in thias publication can be accepted by the author, copyright owner or publisher.
This publication has been prepared for general guidance on matters of interest only, and does not constitute professional advice. You should not act upon the information contained in this publication without obtaining specific professional advice. No representation or warranty (express or implied) is given as to the accuracy or completeness of the information contained in this publication, and, to the extent permitted by law, PricewaterhouseCoopers Inc, its subsidiary and associated companies and entities and their respective directors, employees agents and subcontractors do not accept or assume any liability, responsibility or duty of care for any consequences of you or anyone else acting, or refraining to act, in reliance on the information contained in this publication or for any decision based on it.
© 2018 PricewaterhouseCoopers (“PwC”), a South African firm, PwC is part of the PricewaterhouseCoopers International Limited (“PwCIL”) network that consists of separate and independent legal entities that do not act as agents of PwCIL or any other member firm, nor is PwCIL or the separate firms responsible or liable for the acts or omissions of each other in any way. No portion of this document may be reproduced by any process without the written permission of PwC. (18-22191)
www.pwc.co.za/hospitality-and-leisure
Related Documents