HOT GAS DESULPHURISATION USING LIQUID TIN A Thesis Submitted to The University of Sheffield by Mohd Halim Shah Ismail, B. Eng., MEng. for the degree of Doctor of Philosophy (PhD. ) Project Supervisors: Professor V. N. Sharifi & Professor J. Swithenbank Department of Chemical and Process Engineering The University of Sheffield April 2008

Welcome message from author
This document is posted to help you gain knowledge. Please leave a comment to let me know what you think about it! Share it to your friends and learn new things together.
Transcript
HOT GAS DESULPHURISATION USING LIQUID TIN
A Thesis Submitted to
The University of Sheffield
by
Mohd Halim Shah Ismail, B. Eng., MEng.
for the degree of
Doctor of Philosophy (PhD. )
Project Supervisors:
Professor V. N. Sharifi & Professor J. Swithenbank
Department of Chemical and Process Engineering
The University of Sheffield
April 2008
SUMMARY
Present integrated gasification combined cycle (IGCC) systems demonstrate high
system efficiency and impressive environmental performance, giving them an edge
over conventional pulverised fuel power stations. A key area in the development of IGCC is hot fuel gas clean-up (HGCU). Fuel gas cleaning at elevated temperatures
reduces thermal efficiency losses associated with gas quenching in conventional coal
gas cleaning methods. The current hot gas clean-up method centres on the use of
metal oxide sorbents for sulphur removal and the utilisation of a ceramic barrier filter
for particulate cleaning. A fresh and radical approach may provide the key to
overcoming the inherent limitations associated with metal oxide sorbents.
A molten tin irrigated packed bed scrubber adopted in this research project is one
such innovative way forward in HGCU. The hot scrubber offers the prospect of a
multicomponent clean-up device. In this proposed system, high-temperature sulphur
removal take place via absorption of H2S into molten tin whilst discrete molten tin droplets and rivulets on the packing surface act as solid particulate collectors. The
main objective of this PhD research programme was to investigate a novel hot flue
clean-up system using molten tin as the scrubbing medium for the removal of solid
particulates and H2S. Towards the end of this research work, tin sulphide cleaning tests were performed to investigate the effects of both zinc and no zinc powder on tin
sulphide during the cleaning processes.
Major modifications were made to the existing rig in order to investigate the process of
particulate cleaning. Various parts of the equipment have been modified including a
packing support plate, gas heaters, air seal and gas lift. For particulate removal tests,
an additional system was added to the original design i. e. particle feeder. It consisted of a screw feeder and a venturi system. An online filter was also added to the system to determine the total efficiency of particle removal. This modification work
represented a major contribution during the research work.
I
The liquid tin-irrigated packed bed scrubber demonstrated particulate removal
performance with total efficiency ranging from 60 to 98%. The total efficiency
decreased as the inlet dust loading increased. The results also showed that the
temperature had a significant influence on the total efficiency. As the temperature
increased from 350°C and 400°C, the total efficiency decreased. The major reason for
this is the temperature difference between the inlet particles and the scrubber, which
resulted in the formation of a thicker bed of agglomerates. The resulting grade
efficiency curves were not able to demonstrate fully realistic results. This was
because at corresponding liquid flow rates and inlet solid loading, the particles
collected in the impinger were not a true representation of the total removal efficiency.
Thus from the particulate cleaning test, the equipment operation had low efficiency.
Nevertheless, the proposed objectives have been met and it is evident that with
several important modifications, the particle removal system would be able to operate
satisfactorily.
The absorption behavior of H2S in the novel liquid tin irrigated hot gas scrubber was
investigated for various operating parameters in the lab-scale packed bed. Height of a
gas film transfer unit values ranged from 0.84 to 0.181 m for tested conditions at 1000
ppm of H2S concentration, which meant that this system has a very good potential for
efficient desulphurisation at industrial scale. This was the most important conclusion
from this research. The cleaning of SnS was performed with and without the presence
of zinc powder. Addition of zinc powder saw around 20% reduction of sulphur in the
sample compared to without zinc.
Fluent modelling work was carried out to model the particulate removal in a packed
bed of spheres operating under hot gas conditions. Efficiencies of 98% were predicted
for particles of 40 µm and larger. The main conclusion for this CFD study was that
high gas velocity would significantly improve the total efficiency of the particle removal.
A mathematical model using a Microsoft' Excel spreadsheet was used to simulate the
rate of reaction in the packed-bed scrubber. The range of reaction rate constants from
this work was between 0.011 to 0.019 m/s for various operating temperatures, which
are within the range of values as reported by Hedden (1986).
ii
ACKNOWLEDGEMENTS
The present work was carried out at the Combustion and Incineration Laboratory at
the Chemical & Process Engineering Department (CPE) Department, University of
Sheffield. I would like to thank all the persons who have through their cooperation
contributed to the achievement of my PhD thesis.
First I would like to praise and thank Allah the Almighty, Who have granted me all these graces to complete this thesis. All praises are due to Allah, the Creator of humankind.
I would like to express my gratitude to my supervisors Professor Vida Nasserzadeh
Sharifi and Professor Jim Swithenbank for their help, supervision, scientific guidance,
valuable discussions, continued support of my work and numerous helpful
discussions provided.
I am also very grateful to Dr Changkook Ryu for his invaluable help and suggestions in the research project.
I would also like to thank to PQ Potters Europe GmbH for the supplies of glass powder that made the experimental work possible.
I would like to thank the technical and secretarial staff at the Chemical and Process Engineering Department, University of Sheffield: Mr Chris Wright, Mr. Adrian Lumby,
Mr. Andy Patrick, Mr. Oz McFarlane, Mr. Keith Penny for the technical assistance
with the experimental work and analytical assistance, and Ms Maria Soto for her
secretarial support. Special thanks to Stuart Richards who helped in the construction
of the test rig and helped me run the experiments, worked with me from the very
early stages of the research. I am also very appreciative to Mr. Alan Cox from the
Department of Chemistry for their laboratory help.
All my colleagues of the Laboratory for Combustion and Incineration and other
research laboratories at University of Sheffield for their help and the friendly
atmosphere at the CPE are also acknowledged.
Finally I would like to wish personal thanks to my wife, Zuraida and my kids
Muhammad Azlan Shah, Muhammad Azren Shah and Nur Addina Shah, for their
encouragement and support during this study. 111

CONTENTS
Summary Acknowledgements
Content iv
List of Figures xi
List of Tables xv
Nomenclature xvii
Acronyms and Abbreviations xxiii
1. Introduction 1
1.1 Background 1
1.2 Statement of The Problem 4
1.3 Objective of Research 5
1.4 Overview and Scope of the Research 6
2. Review of Combustion Technologies for Power Generation 8
2.1 Overview of Gasification 8 2.1.1 Basic Reactions 8
2.1.2 Technical Description of the Gasification Process 9
2.1.3 Type of Gasification 11
2.1.4 Comparison with Combustion 13
2.2 Integrated Gasification Combined Cycle (IGCC) System 15
2.2.1 Ultra-Low Emissions 15
2.2.2 Air and Solid Emissions 16
2.2.3 Great Diversity of World Fuel Supply 17 2.3 Overview of Other Combined Cycle Technologies 17
2.3.1 Natural Gas Combined Cycle (NGCC) Process 17
2.3.2 Subcritical and Supercritical Pulverised Coal Combustion (PCC) 18
2.3.3 Atmospheric and Pressurised Fluidised Bed Combustion 18 (AFBC and PFBC)
2.3.4 Environmental Control Comparison of IGCC with PC and FBC 19 Power Plants
2.3.5 Status of the Current Gasification Process 19
2.4 The Need for Hot Fuel Gas Cleaning 20
IV

2.4.1 Environmental Requirements 20
2.4.1.1 Energy Policy in Europe 21
2.4.1.2 Legislation Regarding Discharge to Water 22
2.4.1.3 Legislation Regarding Emission to Air 22
2.4.1.4 Legislation Regarding Waste Disposal 23 2.4.2 Gas Turbine 24
2.4.3 Fuel Gas Cleaning versus Flue Gas Cleaning 25
2.4.4 Hot Fuel Gas Cleaning versus Cold Fuel Gas Cleaning 26
2.5 Identification and Characterisation of Air Pollutant Criteria 27
2.5.1 Sulphur Dioxide (SO2) 27
2.5.2 Nitrogen Oxide (NOX) 28
2.5.3 Particulate Matter (PM) 29
2.6 Summary: Future of Hot Fuel Gas Cleaning 30
3. Rev iew of Existing High Temperature Gas Cleaning Technologies 31
3.1 Techniques and Development of Particulate Control in Hot Gas Clean-Up 31
3.1.1 Particulate Cleaning Technology 31
3.1.1.1 Ceramic (Rigid) Barrier Filters 32
3.1.1.2 Cyclones 33
3.1.1.3 Electrostatic Precipitators 34
3.1.1.4 Fabric Filters (Baghouses) 35
3.1.1.5 Metallic Filters 37
3.1.1.6 Granular Filters 38
3.1.1.7 Hybrid Systems 39 3.1.2 Current Limitation 39
3.2 Techniques and Development of Desulphurisation Processes in Hot Gas 40 Clean-Up
3.2.1 Conventional Gas Cleaning Technology for Power Generation 40 Plant
3.2.2 High-Temperature Sulphur Removal Using Sorbent Technology 41
3.2.3 Current Limitation 46
3.3 Development of Hot Gas Desulphurisation & Particulate Cleaning by Liquid 46 Metal
3.3.1 Early Work - Gas Desuiphurisation with Molten Lead 47
3.3.2 Early Work - Gas Desulphurisation with Molten Tin 48
3.3.3 Gas Desulphurisation with Gaseous Metallic Zinc 52
V

3.4 Current Proposal - Particulate Removal/Gas Desulphurisation with Molten 53 Tin
3.4.1 Selection of Liquid Metal System 53 3.4.2 Gas Desulphurisation 54
3.4.3 Particulate Removal 55 3.4.4 Liquid Metal Circulation and Packing Irrigation via Gas Lift 55 3.4.5 Metal Recovery 55
3.4.6 Effect of Other Constituents in Gasification Fuel Gas 56 3.5 Defining the Research Scope-Investigation of a Packed Bed Scrubber 58
4. Packed Bed Wet Scrubber for Hot Fuel Gas Cleaning - Theory 59 4.1 Gas-Solid Separation (Particulate Cleaning) 59
4.1.1 Particle Collection 59
4.1.2 Particle Rebound or Retention 62 4.1.3 Separation Efficiency 63
4.1.3.1 Total Efficiency, El and Number of Transfer Units, Nt 64
4.1.3.2 Grade Efficiency, G(x) 64 4.1.3.3 Factors Affecting Separation Efficiency 66 4.1.3.4 Packed Bed Scrubber 66
4.2 Gas C leaning (Absorption) 67 4.2.1 Absorption Equipment 68 4.2.2 Packed Tower 68 4.2.3 Gas-Liquid Equilibrium Considerations 69 4.2.4 Physical Absorption 71
4.2.4.1 Mass Transfer Across A Phase Boundary 71 4.2.4.2 The Two-Film Theory 71 4.2.4.3 Overall and Film Mass Transfer Coefficients 73 4.2.4.4 Gas Film or Liquid Film Controlled Processes 74
4.2.4.5 The Transfer Unit in Gas Absorption 75 4.2.5 Chemical Absorption - Kinetic Regimes for Two-Film Model 77
4.2.5.1 Rate Equation for Instantaneous Reaction 77 4.2.5.2 Rate Equation for Fast Reaction 80
4.2.6 Chemical Absorption in a Packed Bed 81
vi

5. Experimental Programme 83
5.1 Original Design of Hot Gas Scrubbing System (Chang 2003) 83 5.1.1 Main Gas Scrubber Unit 83
5.1.1.1 Materials of Construction 83
5.1.1.2 Design of the Main Scrubber Unit 84
5.1.1.3 Design of Gas Lift 87 5.1.1.4 Loading and Removal of Tin 87
5.1.1.5 Tin Level Indicator 88 5.1.1.6 Gas Supply 89 5.1.1.7 System Heating and Insulation 89
5.1.2 Analytical Setup 90 5.1.2.1 Temperature Measurement and Control 90 5.1.2.2 Gas Analyser 91
5.1.3 Schematic Diagram 92 5.2 Modification of the Original Experimental Design 93
5.2.1 Packing Support Plate 93 5.2.2 Gas Heaters 93 5.2.3 Air Seal 94 5.2.4 Gas Lift 94 5.2.5 Particle Feeder (Screw Feeder) 95 5.2.6 Control Valves 98 5.2.7 In-Line Filter (Particles Collection) 99 5.2.8 Final Modified Design 100
5.3 Operation Procedures and Experimental Setup 104 5.3.1 Particulate Removal 104
5.3.1.1 Particle Size Analysis 104
5.3.1.2 Determination of Total Efficiency 106 5.3.1.3 Determination of Grade Efficiency 109
5.3.2 Desulphurisation 112
5.3.2.1 Experimental Setup 112 5.3.2.2 Operating Parameters 112 5.3.2.3 Experimental Procedures 113
5.3.3 Normal Shut-Down Procedures 114 5.3.4 Emergency Shut-Down Procedures 115 5.3.5 Tin Sulphide Cleaning 115
Vll
5.3.5.1 Experimental Setup 115
5.3.5.2 Operating Parameters 116
5.3.5.3 Experimental Procedures 116
5.3.5.3.1 Cleaning In The Presence of Zinc Powder 116
5.3.5.3.2 Cleaning Without Zinc Powder 117
5.4 Summary 118
6. Experimental Results and Discussion 119
6.1 Particulate Cleaning 119
6.1.1 Particle Size Distribution of Glass Powder 119
6.1.2 Experimental Observation 120
6.1.3 Total Efficiency of Particulate Removal 126
6.1.3.1 Effect of Fluid Flowrates and Solid Loading 128
6.1.3.2 Effect of Operating Temperature 129
6.1.4 Grade Efficiency 131
6.1.4.1 Dust Collection in the Impinger 131
6.1.4.2 Determination of Grade Efficiency 131
6.1.5 Experiment Measurement Accuracy 133
6.1.5.1 Dust Deposition in the Inlet Nitrogen Gas Line 133
6.1.5.2 Experimental Measurement Accuracy 133
6.2 Desulphurisation 134
6.2.1 Determination of Overall Mass Transfer Efficiency 134
6.2.2 Assessment of Results 134
6.2.3 Correction for End Effects 137
6.2.4 Blank Test and Test Duration 139
6.2.5 Effect of Gas and Liquid Tin Flow Rates 140
6.2.6 Effect of H2S Concentration 144
6.2.7 Effect of Operating Temperature 145
6.2.8 Effect of Scrubber Packing Height 149
6.2.9 Experiment Measurement Accuracy 150
6.3 Tin Sulphide Cleaning 151
6.3.1 Cleaning In The Presence of Zinc Powder 151
6.3.1.1 Amount of Sulphur Collected 151
6.3.1.2 Reaction with Zn Powder (15t Method) 151
6.3.1.3 Reaction with Zn Powder (2"d Method) 153
viii
6.3.2 Cleaning Without Zinc Powder 154
6.3.2.1 Experimental Observations 154
6.3.2.2 Amount of Sulphur Collected 155
6.3.3 Experiment Measurement Accuracy 155
6.4 Summary 156
6.4.1 Particulate Removal 156
6.4.2 Desulphurisation 157
6.4.3 Tin Sulphide Cleaning 157
7. Mathematical Modelling 158
7.1 Computational Fluid Dynamics - Particulate Removal 158
7.1.1 Problem Definition and Geometry Assumptions 158
7.1.2 Geometry Setup and Grid Generation 159
7.1.3 Mathematical Models 161
7.1.3.1 Continuity and Momentum Equations 161
7.1.3.2 Turbulence Model 162
7.1.3.3 Discrete Phase Model 162
7.1.4 Material Properties, Operating and Boundary Conditions 164
7.1.5 Results and Discussion 165
7.1.5.1 Continuous Gas Phase Results 165
7.1.5.2 Particles Separation 167
7.2 Microsoft Excel - Desulphurisation 170
7.2.1 Introduction 170
7.2.2 Mathematical Model 170
7.2.3 Source of Data Input 172
7.2.4 Simulation Results and Discussion 174
7.2.4.1 Concentration Profiles In the Packed-bed 174
7.2.4.2 Comparison of Activation Energy 175
7.2.4.3 Effect of Operating Temperature 176
7.2.4.4 Effect of Gas Superficial Velocities 176
7.2.4.5 Effect of Effective Specific Interfacial Area 177
7.3 Summary 178
7.3.1 Computational Fluid Dynamic - Particulate Cleaning 178
7.3.2 Reaction Rate - Desulphurisation 179
ix

8. Overall Discussion on the Packed Bed Hot Gas Scrubber 180
9. Conclusions and Recommendations for Future Work 184
9.1 Conclusion 184
9.2 Study Limitations 186
9.3 Recommendations for Future Work 187
References 189
Appendix: List of Journal Publication and Oral/Poster Presentations 199
x

LIST OF FIGURES
Figure Page Number
1.1 Energy prices - BP statistical review of world energy 2007 2 (Christof, 2007)
1.2 Total world electricity generation (% by fuel 2004), (WCI, 2006) 3
1.3 Proved coal reserves at the end of 2006 (Christof, 2007) 3
2.1 Schematic diagram of a typical gasification unit (Ness et al., 1999) 10
2.2 The three major types of gasification processes (Ratafia-Brown et al., 12 2002)
2.3 Sulphur dioxide emissions and targets: 1970-2010 (DEFRA, 2008) 22
2.4 Turbine tolerance and particulate emission requirements in coal fueled 24 gas turbine applications (Lippert, 1996)
2.5 Options for HTHP gasification fuel gas cleaning (Lippert et al., 1996) 26
3.1 Ceramic candle filter (Oak-Ridge, 2005) 33
3.2 Process cyclone schematic 34
3.3 ESP particle collection procedure (EPA, 2005) 35
3.4 Pulse-air-jet - Baghouses (EPA, 2004) 36
3.5 Variation of Gibbs free energy for the desulphurisation reaction of tin by 49 H2/H2S ratio and temperature (Schürmann, 1984)
3.6 Phase diagram H20/H2 molar ratio versus temperature 57 (Nielsen and Sigurdardottir, 1993)
4.1 Impaction 60
4.2 Diffusion 61
4.3 Schematic diagram of a gas-solid separator 63
4.4 A typical grade efficiency curve (Svarovsky, 1981) 65 4.5 Equipment used commercially for gas absorption (McCabe et al., 1993) 69
4.6 Visualisation of two-film theory (EPA, 2007) 72
4.7 Countercurrent gas absorption column 75
4.8 Interfacial behaviour for the liquid phase reaction (Levenspiel, 1999) 78
4.9 Concentration of reactants as visualised by two film theory 79 (Levenspiel, 1999)
5.1 High-purity ceramic alumina (AI203) spheres 84
5.2 Alumina combustion tube and stainless steel column 85
5.3 Support plate 85
5.4 Orifice type liquid distributor with dimensions (Chang, 2003) 86
xi
5.5 Calibration chart of liquid tin flowrates 87
5.6 Loading vessel 88
5.7 Electronic system controller 91
5.8 Oxygen gas analyser 91
5.9 Original schematic diagram of scrubbing system (Chang, 2003) 92
5.10 Packing Support Plate 93
5.11 Packing Support Net 93
5.12 O-ring plate (Glass Wool Gasket) 94
5.13 O-ring plate (Cast Steel) 94
5.14 Nitrogen injection before modification 94
5.15 Nitrogen injection after modification 95
5.16(a) Screw feeder (top view) 96
5.16(b) Screw feeder (side view) 96
5.17 Venturi system 96
5.18 Venturi system for dust injection (outside view) 97
5.19 Venturi system for dust injection (inside view) 97
5.20 Calibration chart of screw feeder 98
5.21 New control valves locations 99
5.22 In-line filter 99
5.23 Modified hot gas scrubber used for experiments 100
5.24 Dimensions of the hot gas scrubber with an additional valves 101
5.25 New overall particulate cleaning system 102
5.26 New overall H2S cleaning system 103
5.27 Glass Powder supplied by PQ Potters Europe GmBH 104
5.28 Sample in screw feeder 106 5.29 Fresh tin 107
5.30 Dust impinger 109
5.31 Experimental setup to collect unseparated particles for particle size 111 analysis
5.32 Experimental setup for tin sulphide cleaning in the present of zinc powder 116
5.33 Tin sulphide and zinc powder in a crucible 117
5.34 Tin sulphide in a flask 117
5.35 Experimental setup for tin sulphide cleaning without zinc powder 117
6.1 Number distribution for glass powder suspension 119
6.2 A photograph of agglomerates from the solidification of liquid tin and 121 glass powder after 3 runs in the scrubber
xii

6.3 A photograph of blockage caused by the solidification of liquid tin and 121 glass powder at the end of all runs (8-10 runs)
6.4 Number distribution for unseparated glass particles (Test 1 a) and total 122 amount of original particles loading
6.5 Unseparated glass powder on the filter paper 122
6.6 Original sample of glass powder (Sample 1) 124
6.7 Unseparated glass powder at 350°C (Sample 2) 124
6.8 Unseparated glass powder at 400 °C (Sample 3) 124
6.9 Chemical analysis using Atomic Emission Spectrometry 125 - Full element analysis
6.10 Accumulation of glass particles and solid tin in the packing material 126
6.11 Temperature history for three different locations within the hot gas 127 scrubber during heating up of the system
6.12 Variation of total efficiency with operating temperature 350 °C 129
6.13 Variation of total efficiency with operating temperature 130
6.14 Grade efficiency curve for three separate runs at the same operating fluid 131 flowrates and solid loading
6.15 Grade efficiency curve for three separate runs at the same operating 132 fluids flowrates and solid loading (Test 1d and 2d)
6.16 Determination of end effects 137
6.17 NOG versus Ned Height, Z 138
6.18 History of H2S concentration for the test duration (mG = 0.258 kg/(m2s); 139 mL = 3.860 kg/(m2s) except for the blank test; T= 400°C)
6.19 History of H2S for the test duration with various gas superficial velocities 141 and constant liquid superficial velocities = 3.157 kg/m2s (Inlet H2S concentration: 1000ppm)
6.20 Figure 6.19: H2S removal efficiency (TI) and the gas transfer unit height 141 (Ho(3) for various gas and liquid superficial velocities (Inlet H2S concentration: 1000ppm; T=400°C)
6.21 Comparison of test conditions to flooding capacity of non-wetting flows 143
6.22 Bed pressure drop as a function of gas superficial velocity for three liquid 143 superficial velocities
6.23 History of H2S for the test duration with various gas inlet concentrations 144 (liquid superficial velocity & gas superficial velocity constant)
6.24 H2S removal efficiency (11) and the gas transfer unit height (HOG) for 145 different inlet H2S concentrations (mG= 0.258 kg/m2s; mL= 3.860 kg/m2s; T=400°C)
6.25 History of H2S for the test duration with various operating temperatures 146 (liquid superficial velocity and gas superficial velocity constant)
xiii
6.26 H2S removal efficiency (TI) and gas transfer unit height (HOG) for different 146 operation temperatures (mG= 0.258 kg/m2s; ML= 3.860 kg/m2s)
6.27 Arrhenius plot for the reaction of Sn and H2S at various operating 148 temperature
6.28 H2S removal efficiency (il) and the gas transfer unit height (HOG) for 150 different packing heights (mo= 0.258 kg/m2s; mL= 3.860 kg/m2s; T=400°C)
6.29 Original SnS and zinc powder in the crucible before test 151
6.30 SnS crucible after test (Run 1) 152
6.31 Formation of zinc sulphide during the cleaning process 152
6.32 SnS crucible after test (Run 2) 152
6.33 Original SnS and zinc powder in the crucible before test 153
6.34 SnS crucible after test 154
6.35 SnS in glass flask during the test 154
7.1 Square and simple rhombic layers 159
7.2 Basic unit geometry: Space between solid spheres in column 160
7.3 Front and side views of meshed packed-bed model 161
7.4 Contours of absolute pressure (Pa), [MG =9x 10.5 kg/s] 166
7.5 Contours of velocity magnitude (m/s) [MG =9x 10⁻⁵ kg/s] 166
7.6 Contours of turbulent kinetic energy, k (m2/s2) [MG =9x 10"5 kg/s] 166
7.7 Simulated particle trajectories 167
7.8 Variation of E1ota, with particle size 168
7.9 Variation of Etta, with particle density 169
7.10 Variation of Etotai with particle size 169
7.11 Flowchart for the H2S-Sn simulation model 173
7.12 Concentration profiles for different gas superficial velocities 174
7.13 Reaction rate constants with different operating temperatures 175
7.14 Comparison of predicted and measured il for different operating 176 temperature
7.15 Comparison of predicted and measured il for different gas superficial 177 velocity
7.16 Effect of effective specific interfacial area with different liquid superficial 178 velocity
xlv

LIST OF TABLES
Table Page Number
1 Important characteristics of energy source (WCI, 2003) 1
2.1 Important characteristics of generic types of gasifiers - Performance 13 comparison of different types of coal gasification technology (Ratafia- Brown et al., 2002)
2.2 Emission comparison (ChevronChevron, 2002) 16
2.3 Worldwide gasification use in power plants source (Rhodes, 2006) 19
2.4 Environmental legislation, plant size >50MWth 21 (IEA Coal Research, 1999)
2.5 Gas quality specifications for a gas turbine (Ron and Pia, 2004) 25
3.1 Sorbents general characteristics (Williams and McMullan, 1998) 43
3.2 Vapour pressure comparison (ASM, 1981) 54
4.0 Particle collection mechanisms for wet scrubbing systems (EPA, 2007) 60
5.1 Characteristics of the alumina packing (Chang, 2003) 84
5.2 Temperature measurements locations 90
5.3 New control valves locations 98
5.4 Typical spherical® hollow glass microspheres properties 104
5.5 Test conditions for hot particulate cleaning in the packed bed scrubber 107
5.6 Test conditions for hot gas desulphurisation in the packed bed scrubber 113
6.1 Chemical analysis of original and unseparated glass powder 123
6.2 Experimental data for particulate cleaning 128
6.3 Accuracy of equipment used 133
6.4 Experimental data for various gas and liquid flow rates 142
6.5 Experimental data for various inlet gas concentration 145
6.6 Experimental data for various operating temperature 147
6.7 Rate constant value from experimental data for various operating 148 temperature
6.8 Experimental data for different height of packing 149
6.9 Accuracy of equipment used 150
6.10 Results of sulphur determination for SnS cleaning in the presence of Zn 151
6.11 Physical properties of tin compounds of interest 153
6.12 Results of sulphur determination for SnS cleaning without the presence 155 of Zinc
xv
6.13 Accuracy of equipment used 155
7.1 Systematic assemblages of spheres (Gordon and Fraser, 1935) 159
7.2 Boundary conditions of packed-bed column 165
7.3 The inputs used to solve the continuous gas phase 165
7.4 Test conditions for hot gas desulphurisation in the packed-bed scrubber 172
7.5 References used to estimate the main parameters 173
7.6 Arrhenius constant for high-temperature desulphurisation reaction 175
8.0 Design conditions of the packed bed scrubber estimated for 150 tons per 183 day (Masaki, 2002) throughput coal gasifier
xvi
NOMENCLATURE
Symbol Description Unit
a Cross-section area of annular flow ft2 a, ae Interfacial area per unit volume of column m2/m3
ap Packing specific surface area (1/m)
a Empirical constant - A Gas lift pipe cross-section area ft2 A Column cross-section area m2 c Concentration in liquid phase kmol/m3
C* Concentration in liquid phase in equilibrium with gas phase kmol/m3 CD Discharge coefficient - CD Drag coefficient - Co Orifice coefficient - Cp Dust concentration ppmw Cs Capacity factor = ug{pG/(pL-pG)}0.5 ft/s d Particle diameter; Packing size or characteristic length m dcontact Contact diameter m de Equatorial diameter m dequiv Packing particle equivalent diameter m do Orifice diameter inch ds Diameter measured from distance de up from base of drop m ds, Surface-volume diameter of Sauter diameter m d50 Median diameter gm D Gas lift riser inside diameter in, m DG Gas phase diffusion coefficient or diffusivity m2/s Dh Hydraulic diameter mm DL Liquid phase diffusion coefficient or diffusivity m2/s Dc0/ dpe Column diameter m e Absolute error - ED Eddy diffusivity m2/s ET/ Etotal Total or overall efficiency - f Moody friction factor - F Packing factor m2/m3 F Wall frictional pressure gradient in two-phase flow Pa/m F; Source term in momentum equation kg/m2s2 Fs Wall frictional pressure gradient in single liquid phase flow Pa/m Fx Source term in force balance m/s2 g Gravitational acceleration (m/s2) G Gas superficial mass velocity kg/m2s
xvii

G' Molar gas flowrate per unit cross-sectional area of column kmol/m2s
G' Gas mass flowrate to base of air lift pump kg/s (Clark and Dabolt's model)
G(x) Grade efficiency - OGR Gibbs free energy change of reaction kJ/mol hatm Liquid head corresponding to atmospheric pressure m ho Dynamic (operating or moving) liquid holdup m3/m3 hE Effective liquid holdup m3/m3 hL Liquid head ft hs Static liquid holdup m3/m3 fis Average static liquid holdup m3/m3 h-r Total liquid holdup m3/m3 H Shape dependent quantity - HOG Height of a gas film transfer unit m HOL Height of a liquid film transfer unit m HT Total volumetric liquid holdup ml H Henry's Law constant Pa,
Turbulence intensity % k Turbulent kinetic energy m2/s2 Ko Overall mass transfer coefficient m/s kG Gas film mass transfer coefficient kmol/m2sPa k'G Gas film mass transfer coefficient in term of mol fraction kmol/m2s k'Ga Volumetric gas film mass transfer coefficient in term of mol kmol/m3s
fraction kL Liquid film mass transfer coefficient m/s k'L Liquid film mass transfer coefficient in term of mol fraction kmol/m2s
k'La Volumetric liquid film mass transfer coefficient in term of mol kmol/m3s fraction
K Vapour-liquid equilibrium constant mol/mol Kc Sudden concentration loss coefficient = 0.5 - KG Overall gas phase mass transfer coefficient kmol/m2sPa K'G Overall gas phase mass transfer coefficient in term of mol kmol/m2s
fraction
Kea Overall volumetric gas phase mass transfer coefficient kmol/m3sPa K'Ga Overall volumetric gas phase mass transfer coefficient in term kmol/m3s
of mol fraction KL Overall liquid phase mass transfer coefficient m/s K'L Overall liquid phase mass transfer coefficient in term of mol kmol/m2s
fraction Kea Overall volumetric liquid phase mass transfer coefficient i/s K'La Overall volumetric liquid phase mass transfer coefficient in kmol/m3s
term of mol fraction
xviii
Kp Equilibrium constant in terms of partial pressure - K Vapour-liquid equilibrium constant - Kn Kundsen number - kr Reaction kinetic effect at the interface m/s
Bed thickness or bed height m L Length/Lift m L Liquid superficial mass velocity kg/m2s L' Molar liquid flowrate per unit cross-sectional area of column kmol/m2s
L, Liquid superficial volumetric velocity m3/s. m2 LW Wetting rate m2/s m Vapour-liquid equilibrium constant mol/mol M Mass of sample g Min Mass of dust fed into scrubber g moot Mass of unseparated dust in exit air retained on filter g M WGP = G'Patm/ApG kg/s3 M Mass flowrate of a sample kg/s M Mean mass flowrate g/s M0 Mass flowrate of coarse (separated) dust in underflow kg/s Mt Mass flowrate of fine (unseparated or penetrating) dust in kg/s
overflow MG Mass flowrate of gas phase kg/s M, 0 Mass flowrate of feed (challenging) dust kg/s MX Mass flowrate of particles of size x in the sample kg/s N Total molar flux (relative to a fixed plane); Molar rate of kmol/m2s
absorption per unit area N Number of data sets - NG Number of gas film transfer units - NL Number of liquid film transfer units - N° Number of orifices - NOG Number of overall gas phase transfer units - NOL Number of overall liquid phase transfer units - Nt Number of transfer units - p Partial pressure in bulk gas phase Pa p Partial pressure in gas phase in equilibrium with liquid phase Pa p° Vapour pressure of pure component Pa
p; Partial pressure at interface Pa P Total pressure Pa Patm Atmospheric pressure Pa Pg Gauge pressure Pa P° Pressure at air injector level Pa Pop Operating pressure Pa
xix

AP Pressure drop Pa
APdry Dry bed pressure drop Pa
LPA Accelerative pressure loss Pa
OPD Downcomer pressure loss Pa
AP/I Pressure gradient Pa/m
Q Volumetric flowrate I/min
R Universal gas constant J/kmol. K
R2 Coefficient of determination - Re Reynolds number - ReG Gas phase Reynolds number - ReL Liquid phase Reynolds number - Rep Single particle Reynolds number = pud/µ - ReR Relative Reynolds number = pGURd/µG - Re* Reynolds number for packed bed flow - S Specific surface area of particle or packing m2/m3 S Shape dependent quantity - S Submergence m, ft SR, Source term in continuity equation kg/m3s Sp External area of a packing particle m2 SB Specific surface area of packed bed m2/m3
SR Submergence ratio - SS1 Spreading coefficient N/m SCG Gas phase Schmidt number = µG/pGDG - SCL Liquid phase Schmidt number = µL/pLDL - t Time s T Temperature K
u Superficial velocity m/s u' Actual single phase velocity in two-phase flow m/s u' Root-mean-square of velocity fluctuations in turbulent flow m/s u Mean flow velocity m/s UG True gas velocity based on irrigated bed porosity = uG/Eeff m/s UR Relative velocity of gas and liquid stream m/s v Superficial velocity m/s V Volume m3 VG Gas volumetric flowrate m3/s Vp Volume of a packing particle m3 x Mole fraction in liquid phase mol/mol x Mole fraction in liquid phase in equilibrium with gas phase mol/mol x Distance m X Dust particle size (particle physical diameter) µm
xx

Xae Particle aerodynamic diameter µm(g/cm3)"2 xmax Limit separation gm
x50 Cut size µm
x98 Approximate limit of separation µm
y Mole fraction in gas phase mol/mol
y Distance M
Yin Inlet gas concentration ppm
you, Outlet gas concentration ppm
y' Mole fraction in gas phase in equilibrium with liquid phase mol/mol
ZG, ZL Effective gas film thickness and effective liquid film thickness m respectively
Z Packed bed height m Zend Equilibrium bed height of end effects m
Greek Symbol
a Empirical constant - a Gas voidage fraction in two-phase flow - ß Empirical constant - A Change in - E Dry bed voidage or porosity - E Turbulent dissipation rate m2/s3 Eeff Effective voidage or porosity -
TIP Pumping efficiency -
cp Gas density correction factor = (PG/Pair, 293K)0'5 -
Mean free path of gas molecules µm Absolute viscosity (in centipoises in GPDC) kg/ms
RG, µL Viscosity of gas, Viscosity of liquid kg/ms
µs Ratio of liquid viscosity to water (20°C) viscosity - µ, Turbulent viscosity kg/ms
v Kinematic viscosity = µ/p cst, m2/s 0 Contact angle degree
p Density kg/m3
PP Particle density kg/m3
Ps Ratio of liquid density to water (20°C) density -
a Surface tension mN/m
aC Critical surface tension N/m
69 Geometric standard deviation - 6s Ratio of liquid surface tension of water (20°C) surface tension - ti; j Stress tensor kg/ms2
XXI

c, Mass fraction of particles size x in the sample kg/kg
ck, X Mass fraction of coarse (separated) dust at particle size x kg/kg
", x Mass fraction of fine (unseparated or penetrating) dust at particle kg/kg size x
uýn, X Mass fraction of feed dust at particle size x kg/kg
woaX Mass fraction of exit dust at particle size x kg/kg
yr Liquid density correction factor = (Pwater/PL) - ys Sphericity -
Subscript Atm Atmospheric pressure A Component A B Bottom of packed bed F Fluid G (Bulk) Gas phase
Gas-liquid interface Im Logarithmic mean L (Bulk) Liquid phase Iv Liquid-vapour
p Particle si Solid-liquid
sv Solid-vapour
T Top of packed bed
XXII
ACRONYMS & ABBREVIATIONS
AFBC Atmospheric Fluidised Bed Combustor
AHPC Advanced Hybrid Particulate Collector
ASU Air Separation Unit
ATS Advanced Turbine Systems
BGL British Gas Lurgi (gasifier) CCGT Combined Cycle Gas Turbine CCT Clean Coal Technologies CFB Circulating Fluidized Bed CHP Combined Heat and Power COHPAC Compact Hybrid Particulate
Technology
DEFRA Department for Environment, Food & Rural Affairs
DOE United States Department of Energy
EEC European Economic Commission
ESP Electrostatic Precipitator
FBC Fluidised Bed Combustor FGD Flue Gas Desulphurisation
HGCU Hot Gas Clean-Up HGS Hot Gas Scrubber HHV Higher Heating Value HP High Pressure HTHP High Temperature & High
Pressure HRSG Heat Recovery Steam
Generator IC Internal Combustion (Engine)
IEA International Energy Agency IGCC Integrated Gasification
Combined Cycle ICP-AES Inductively Coupled Plasma-
Atomic Emission Spectrometry IPPC Integrated Pollution Prevention
& Control
LHV Lower Heating Value
LNG Liquefied Natural Gas
LP Low Pressure LRTAP Long-Range Transboundary Air
Pollution MEA Monoethanolamine MJ Mega Joule (106 Joule) MWt Megawatt Thermal NGCC Natural Gas Combined Cycle Nm3 Normal Cubic Meter NRA National Rivers Authority
NRC National Research Council's
OPOS Single Particle Optical Sensing
PAH Polyaromatic Hydrocarbon
PCC Sub & Supercritical Pulverised Coal Combustion
PF Pulverised Fuel
PFBC Pressurised Fluidised Bed Combustor ppm Parts Per Million
RDF Refuse-Derived Fuel SCR Selective Catalytic Reduction SOx Oxides of Sulphur Syngas Synthesis Gas
STP Standard Temperature & Pressure
Nm3 Normal Metre3 NO, Oxides of Nitrogen PC Pulverised Coal
UNECE Nations Economic Commission for Europe
WCI World Coal Institute
XXI11
CHAPTER ONE
Introduction
1.1 Background
Natural gas prices are on the rise, environmental requirements are becoming ever
more stringent, and there is an urgent need to diversify the world's fuel supply. In
addition, energy demand is surging in developing countries, whilst pressure builds to
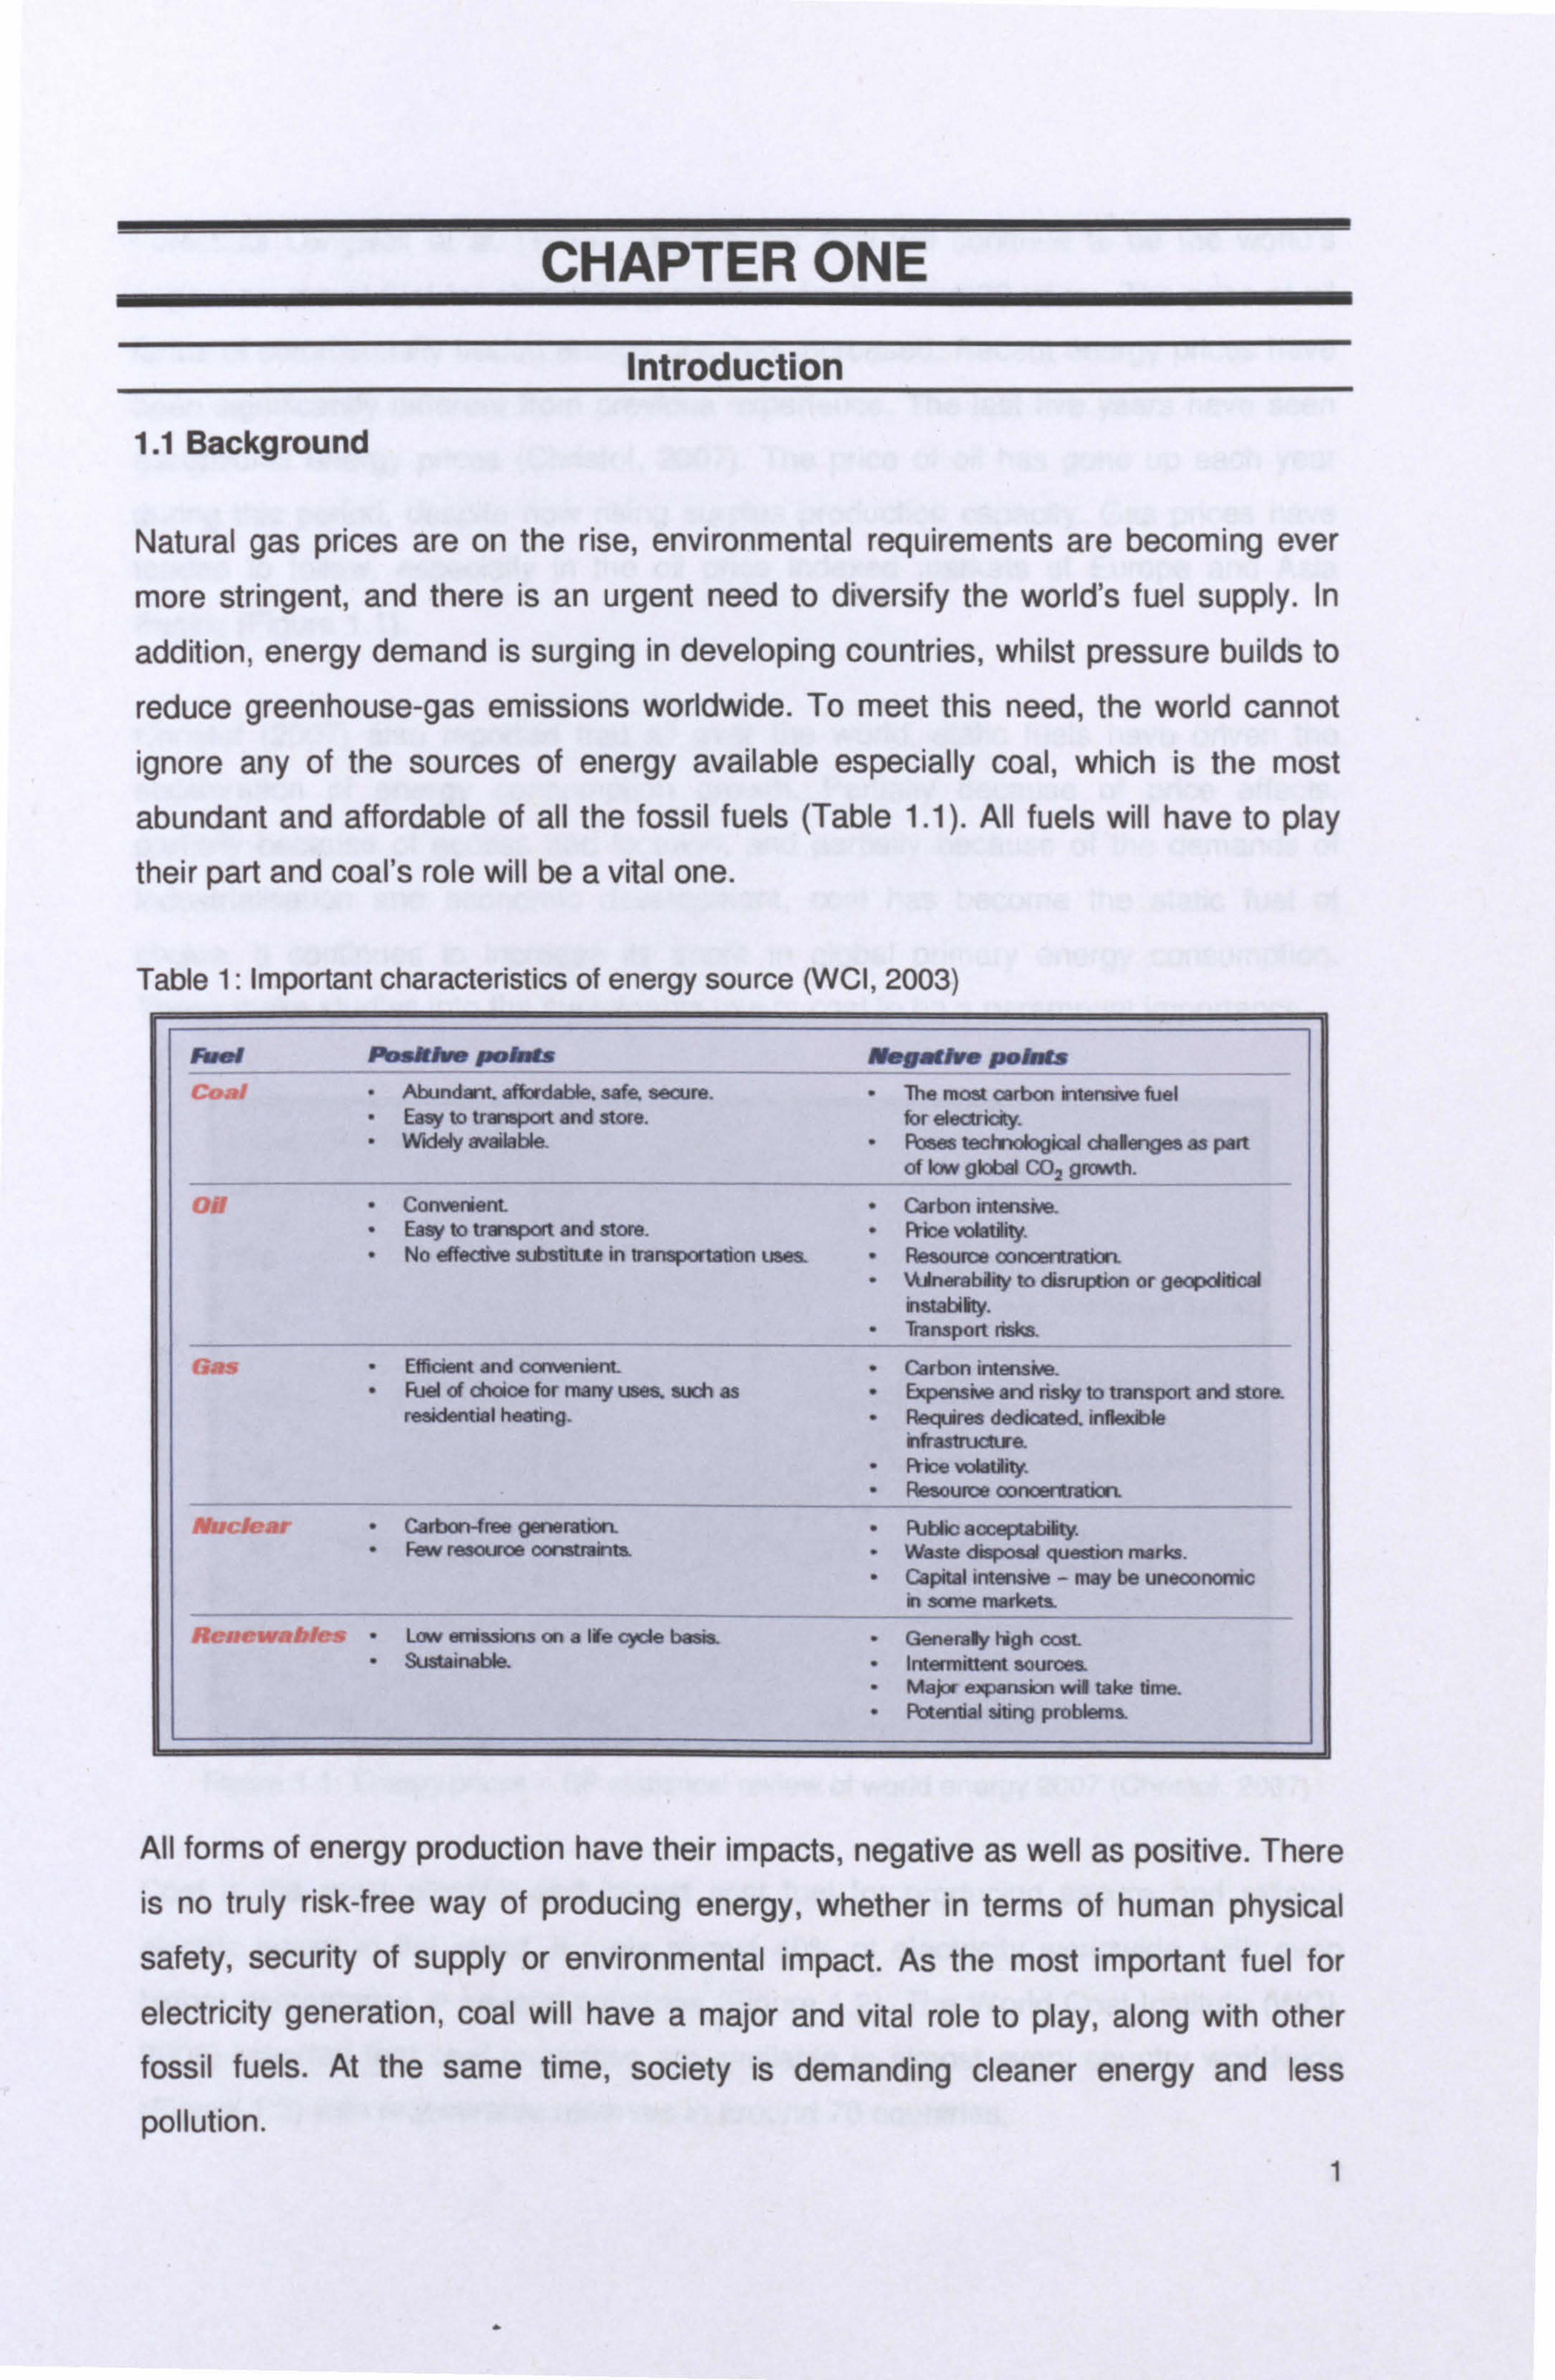
reduce greenhouse-gas emissions worldwide. To meet this need, the world cannot ignore any of the sources of energy available especially coal, which is the most
abundant and affordable of all the fossil fuels (Table 1.1). All fuels will have to play their part and coal's role will be a vital one.
Table 1: Important characteristics of energy source (WCI, 2003)
Fa e+ PbskiVe pobrs N Rnfl- points
" Abundant affordable. safe, secure. " The most carbon intensive fuel " Easy to transport and store. for electricity. " widely available. " Poses tecMrologioal challenges as part
of low global CO2 growth.
rail " Convenient " Carbon intensive. " Easy to transport and store. " Rice volatility. " No effective substitute in transportation uses. " Resouros oonoertration.
Efficient and convenient " Fuel of choice for many uses. auch as
residential heating.
Nu, Ira. " carbon-tree generation. " Few rea«, roa oona, a., u.
---- -- ------- -- ----------- Rý Low erriasions on a Ire cyde bears. " Sustainab{e.
" %Vnerabiity to disruption or geopolitical instability.
" Transport risks.
" Carbon intensive. " Expensive and risk/ to transport and store " Requires dedicated inflexible
nfastruct ra " Rice volatility. " Resource oonoentratim
" Public acceptability. " Waste disposal question marin. " Capital intensive - may be uneconomic
in sane markets.
" Generaly high cost " Intermittent sources. " Major expansion wil take time. " Potential siting problems.
All forms of energy production have their impacts, negative as well as positive. There
is no truly risk-free way of producing energy, whether in terms of human physical
safety, security of supply or environmental impact. As the most important fuel for
electricity generation, coal will have a major and vital role to play, along with other fossil fuels. At the same time, society is demanding cleaner energy and less
pollution. 1
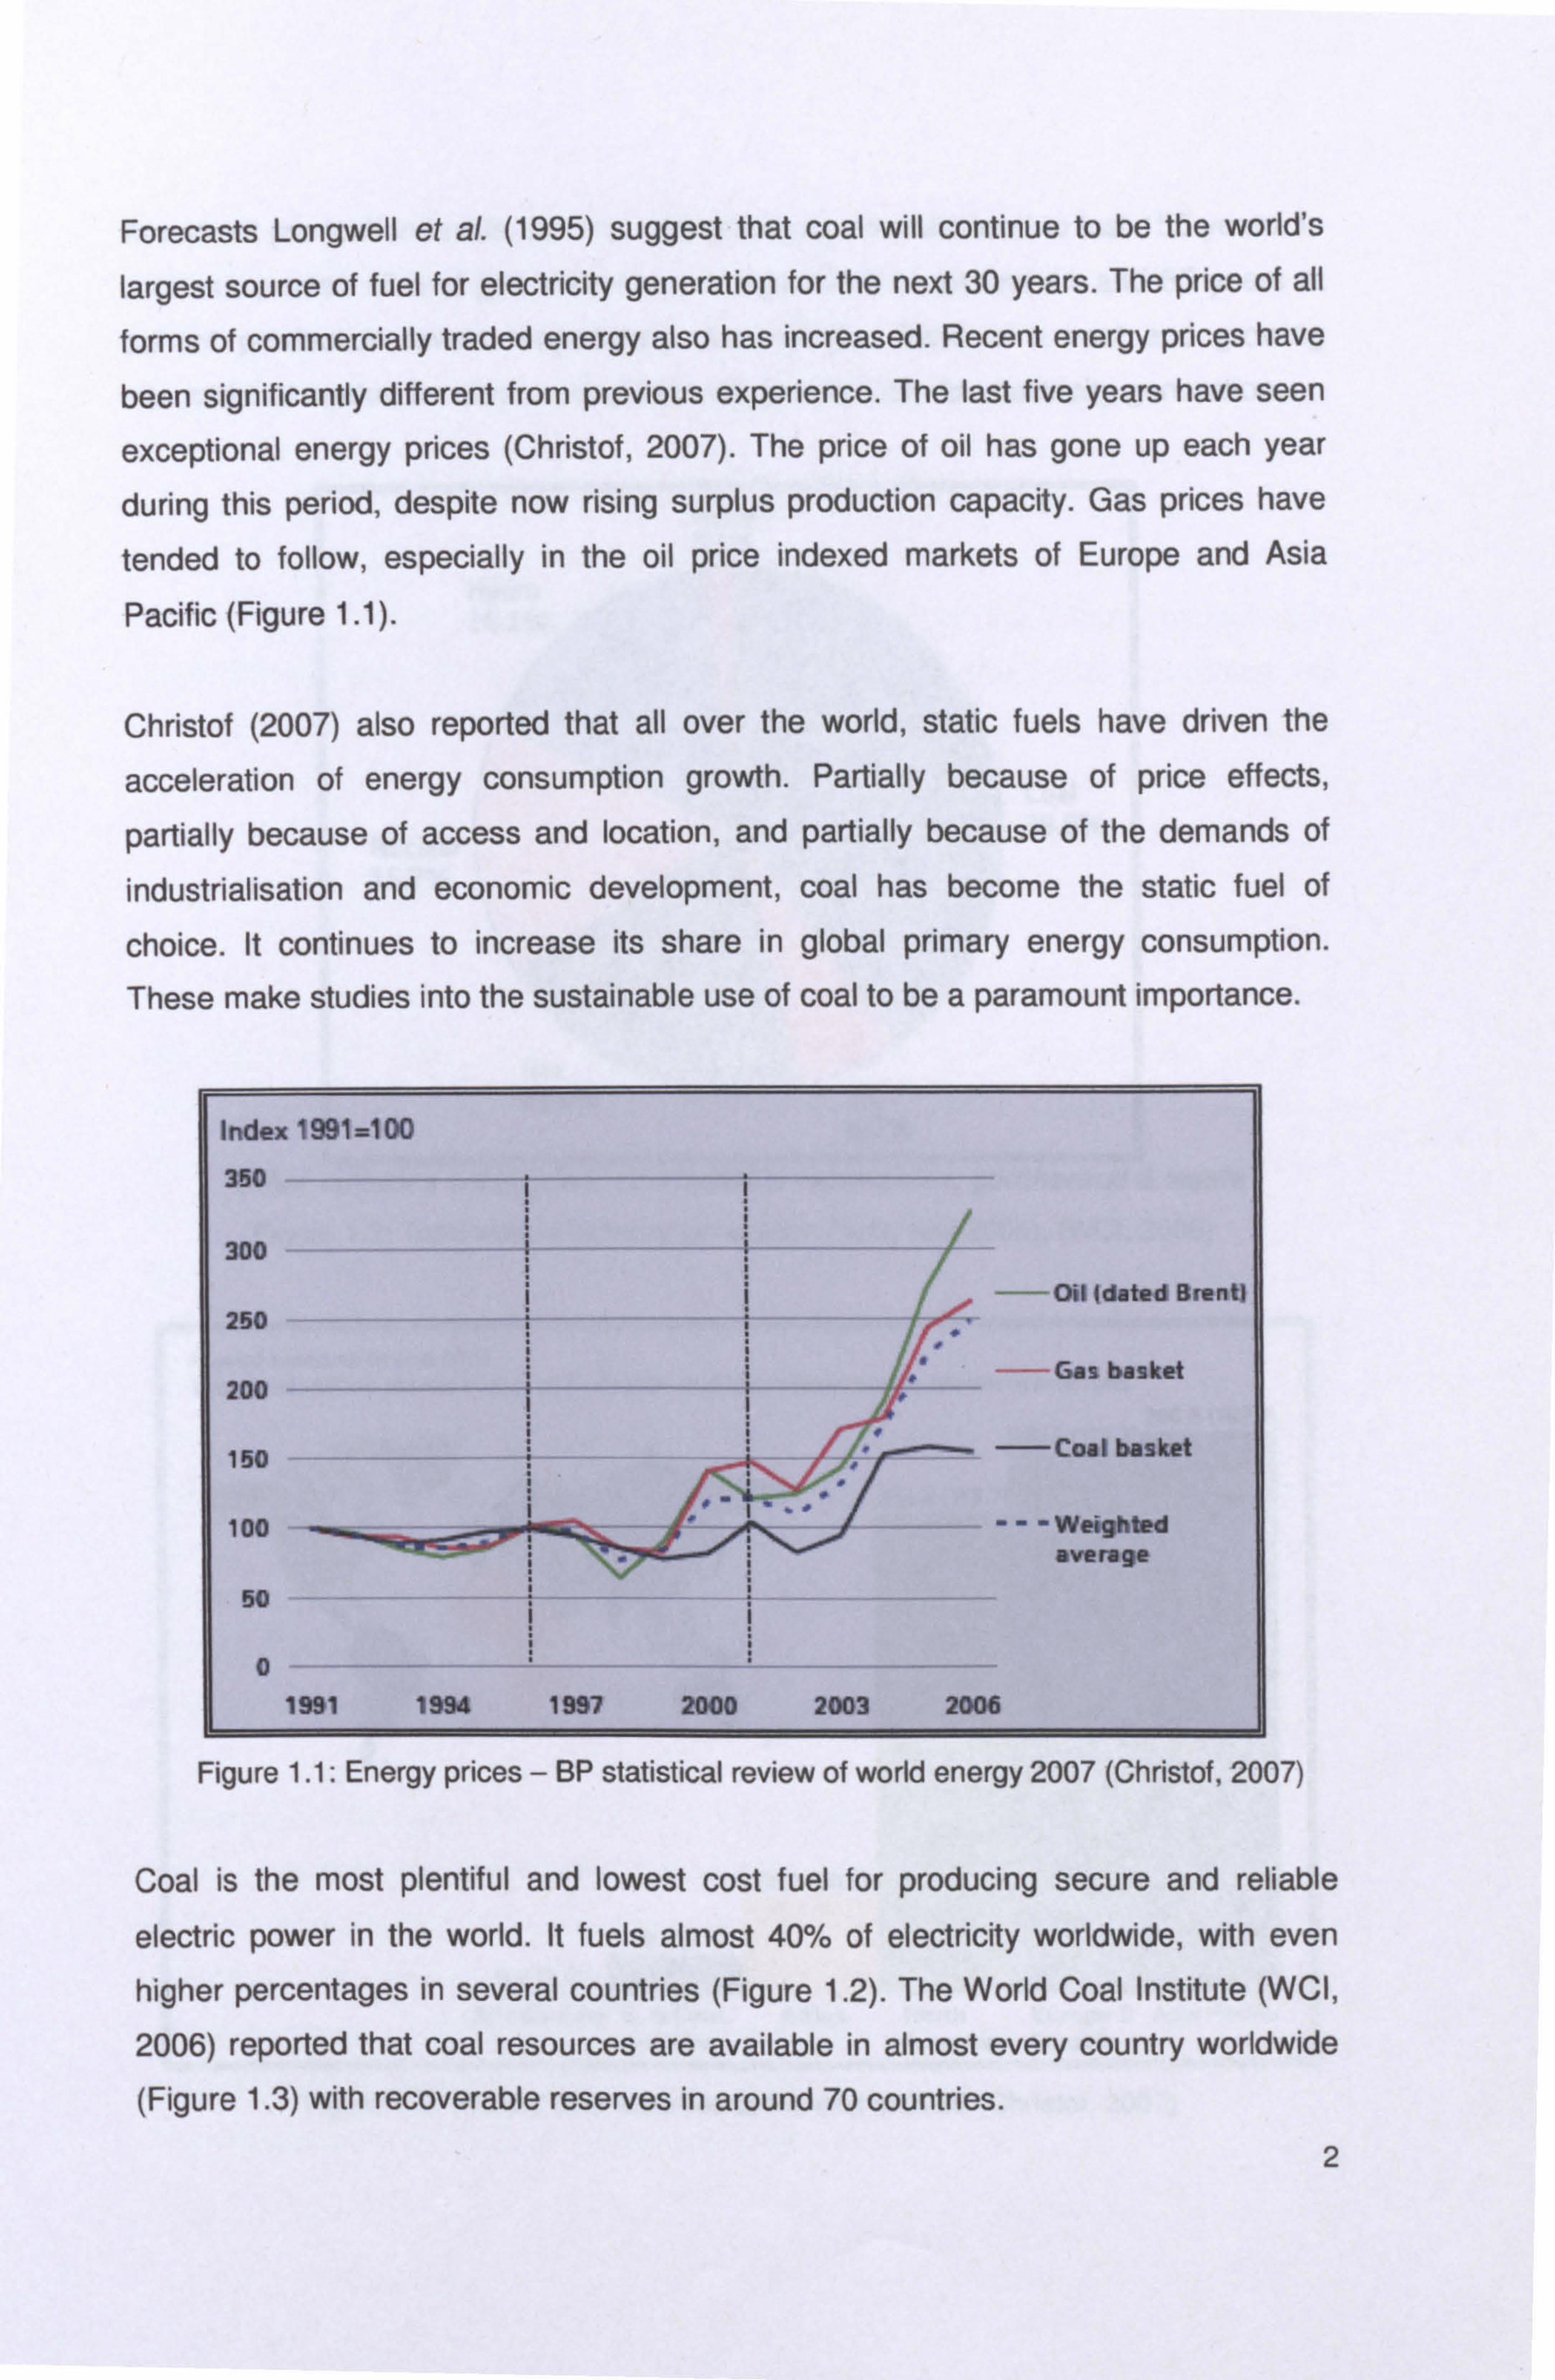
Forecasts Longwell et al. (1995) suggest that coal will continue to be the world's
largest source of fuel for electricity generation for the next 30 years. The price of all
forms of commercially traded energy also has increased. Recent energy prices have
been significantly different from previous experience. The last five years have seen
exceptional energy prices (Christof, 2007). The price of oil has gone up each year
during this period, despite now rising surplus production capacity. Gas prices have
tended to follow, especially in the oil price indexed markets of Europe and Asia
Pacific (Figure 1.1).
Christof (2007) also reported that all over the world, static fuels have driven the
acceleration of energy consumption growth. Partially because of price effects,
partially because of access and location, and partially because of the demands of
industrialisation and economic development, coal has become the static fuel of
choice. It continues to increase its share in global primary energy consumption.
These make studies into the sustainable use of coal to be a paramount importance.
Index 1991=100
350
300
Oil ldated Brent] 250
j
200 Gas basket
150 -Coal basket
100 """,
--- Weighted average
50
0 1991 1994 1997 2000 2003 2006
Figure 1.1: Energy prices - BP statistical review of world energy 2007 (Christof, 2007)
Coal is the most plentiful and lowest cost fuel for producing secure and reliable
electric power in the world. It fuels almost 40% of electricity worldwide, with even higher percentages in several countries (Figure 1.2). The World Coal Institute (WCI,
2006) reported that coal resources are available in almost every country worldwide (Figure 1.3) with recoverable reserves in around 70 countries.
2
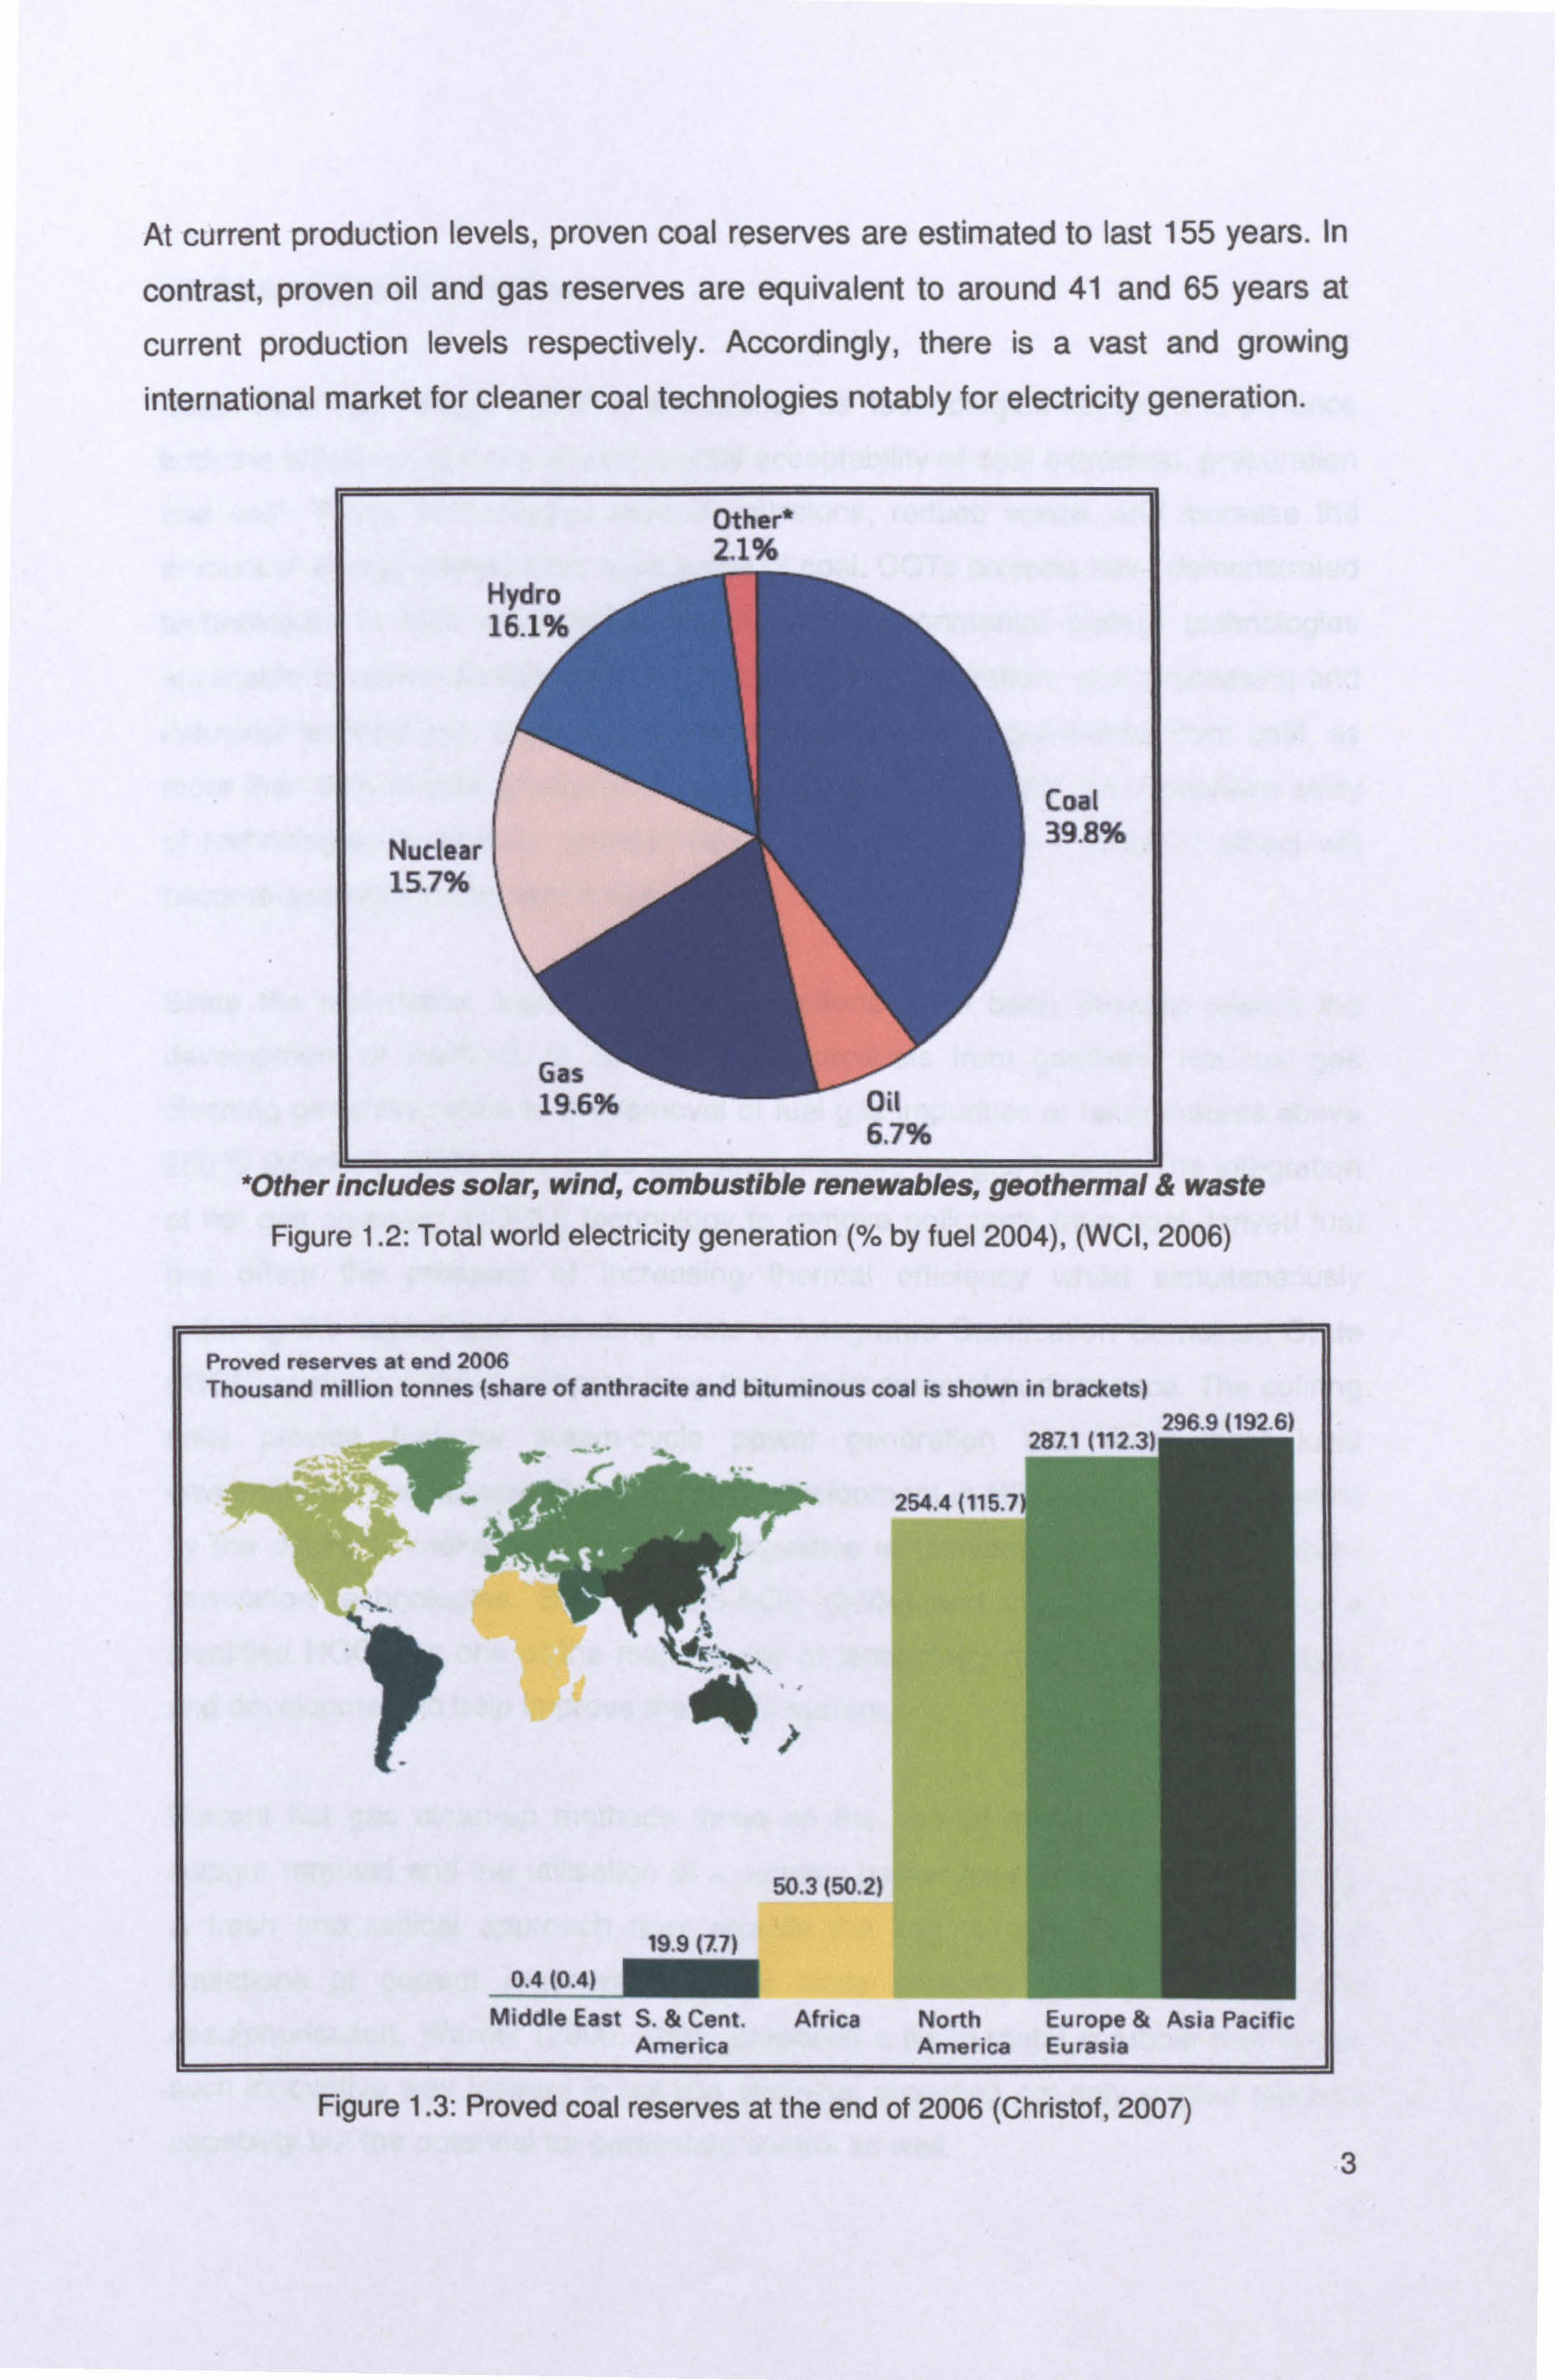
At current production levels, proven coal reserves are estimated to last 155 years. In
contrast, proven oil and gas reserves are equivalent to around 41 and 65 years at
current production levels respectively. Accordingly, there is a vast and growing
international market for cleaner coal technologies notably for electricity generation.
Other' 2.1%
Nuclear 15.7%
Coal 39.8%
*Other Includes solar, wind, combustible renewables, geothermal & waste Figure 1.2: Total world electricity generation (% by fuel 2004), (WCI, 2006)
Proved reserves at end 2006 Thousand million tonnes (share of anthracite and bituminous coal is shown in brackets)
296 9 1192 6)
"r
2871
254.4 (115.7)
50.3 (50.2)
0.4 (0.4) Middle East S. & Cent. Africa North Europe & Asia Pacific
America America Eurasia
Figure 1.3: Proved coal reserves at the end of 2006 (Christof, 2007)
3
17.07b 2«
6.7%
1.2 Statement of the Problem
Clean Coal Technologies (CCTs) are defined as 'technologies designed to enhance
both the efficiency and the environmental acceptability of coal extraction, preparation
and use'. These technologies reduce emissions, reduce waste, and increase the
amount of energy gained from each tonne of coal. CCTs projects have demonstrated
technologies in four main areas which are: environmental control technologies
applicable to conventional plants, advanced power generation, coal processing and
industrial applications. Most CCTs concentrate on power generation from coal, as
more than 50% of coal produced is used to generate electricity. An impressive array
of technologies is already commercially viable, and a large number of others will
become available in the near future.
Since the mid-1980s, significant research efforts have been directed toward the
development of methods to clean the raw products from gasifiers. Hot fuel gas
cleaning generally refers to the removal of fuel gas impurities at temperatures above
250°C (Mitchell, 1998) before the gas stream enters the gas turbine. The integration
of hot gas clean-up (HGCU) technology to remove pollutants from coal-derived fuel
gas offers the prospect of increasing thermal efficiency whilst simultaneously
reducing the capital and operating costs of Integrated Gasification Combined Cycle
(IGCC) systems without compromising their environmental performance. The cofiring
units provide fuel for steam-cycle power generation and must meet local
environmental regulations. Research and development in HGCU has been propelled
by the desire to make IGCCs more competitive to conventional coal-based power
generation technologies. Both the US-DOE (2004) and the UK-DTI (1998) have
identified HGCU as one of the major areas of technology requiring further research
and development to help improve the IGCC system.
Current hot gas clean-up methods focus on the use of metal oxide sorbents for
sulphur removal and the utilisation of a ceramic barrier filter for particulate cleaning.
A fresh and radical approach may provide the key to overcoming the inherent
limitations of current regenerable metal oxide sorbents employed in hot gas
desulphurisation. Warner (2000,2001) proposed a liquid metal scrubber that is one
such innovative way forward in hot gas cleaning, providing not only sulphur removal
capability but the potential for particulate control as well.
4

The concept of using liquid metals for gas desulphurisation dates back to the late
1970s when Meissner (1976) first patented the concept of removing sulphur from hot
reducing gases using liquid lead. However since than, only few others have
propounded the use of liquid metals for gas cleaning theoretically and experimentally.
They are Meissner and Shora (1981), Schuermann (1984), Hedden et al., (1987) and
most recently, Warner (1997,2000,2001). However, none of these studies have
been able to successfully demonstrate hot gas cleaning by liquid metal. Hence, this
thesis in intended to broaden and deepen our knowledge of hot gas cleaning taking
place in a packed bed hot gas scrubber. This subject is identified as essential to
optimise the operation of hot gas wet scrubber systems and their future development.
1.3 Objective of Research
The present approach to the investigation of the fundamental aspects of hot gas-
cleaning is based upon an experimental investigation in a packed bed hot gas
scrubber. This research project explores a new approach to hot fuel gas cleaning
technology incorporating molten tin as the scrubbing medium for the removal of H2S
and solid particulates, as first put forward by Warner (2001).
In the proposed gas cleaning process, high temperature sulphur removal takes place in a packed bed wet scrubber. Sulphur removal occurs via absorption of H2S into
molten tin:
H2S + Sn - SnS + H2
In addition to gas desulphurisation, the packed bed offers the prospect of
simultaneous removal of solid particulates from the gas stream, hence acting as a
multicomponent clean-up device. Molten tin having high surface energy exhibits non-
wetting droplet and rivulet flow on the solid packing surface, potentially giving good inertial capture of solid particulates by the packed bed from the gas stream. The aim
of this research project is to perform studies of hot gas cleaning using a pilot unit of the high temperature gas scrubbing by liquid metal constructed by Chang (2003).
Liquid tin introduced at the top of the packed bed disintegrates into discrete droplets
and rivulets flowing downwards by gravity, countercurrently to an upward nitrogen gas flow.
5
This hot experiment would concentrate on the H2S absorption performance and
particulate removal of the packed column operation under high temperature
conditions. As the hot gas cleaning using molten metal is a relatively new field in gas
cleaning, there is limited data available. Findings from the investigation would provide
better understanding into the operation and performance of a packed bed hot gas
scrubber. A molten tin irrigated packed bed scrubber adopted in this research project
is one such innovative way forward in HGCU. The novel liquid tin irrigated packed
bed scrubber is thereby a key feature in this research work.
The specific objectives for the research can be summarised as follows:
* To investigate particulates removal and gas absorption performance of the
packed bed hot gas scrubber using molten tin.
* To obtain comprehensive data on the liquid and gas flows, height of packing,
temperatures and concentrations to determine the optimum running conditions.
* To investigate the possibility of cleaning tin sulphide using zinc powder.
* To perform computational fluid dynamics modelling using FLUENT on particulate
removal in a packed bed hot gas scrubber under non-wetting conditions.
* To model the absorption of H2S in liquid tin with chemical reaction in a packed
bed column using Microsoft Excel.
* To evaluate, economically, the feasibility of incorporating such a packed bed hot
gas scrubber into a power plant.
1.4 Overview and Scope of the Research
This PhD thesis presents the research work carried out over a period of three years.
It consists of eight chapters. These are as follows:
Chapter one introduces the purpose of this research by giving the background of
recent world energy developments. A brief background to current hot gas clean-up
methods is also presented. This section outlines the aim of this PhD research.
Chapter two of this thesis gives an overview of the combustion technologies used for
power generation. The remaining part of the chapter describes the IGCC system with
other combined cycle technologies. Discussion includes the legislation covering the
environmental and energy policies. 6

Chapter three reviews existing high temperature gas cleaning technologies for
particles and sulphur and also previous work on hot has cleaning by molten metal.
First, a short explanation is presented about the need for hot fuel gas cleaning. The
remainder of the chapter focuses on the techniques and development of particulate
control and desulphurisation processes in hot gas clean-up.
Chapter four explains the theoretical background and previous work on gas-solid
separation and gas absorption. Mass transfer with chemical reaction theory is also
detailed in this chapter.
Chapter five gives a description of the whole of the experimental rig set-up. Here the
materials used in the experiments are described in detail showing how they fit into
the research being carried out. The experimental procedure for all the tests is also
given
Chapter six covers the experimental results and discussion of the particulate
cleaning and H2S absorption experiments conducted in the packed bed hot gas
scrubber. This chapter also contains the experimental results on the tin recovery
using zinc powder.
Chapter seven covers the computational fluid dynamic simulations performed on
particulate removal in a packed bed using FLUENT. This section also presents the
conditions applied in the mathematical model that was used to simulate the gas
absorption in the packed bed. Microsoft Excel was used to illustrate the rate of
reaction between molten tin and H2S. The discussion of the computational modelling
results includes comparison with experimental values.
Chapter eight compares the particulate cleaning and gas absorption performance
obtained from this study with current apparatus. The limitations of these two
processes, affecting the subsequent energy recovery systems and application in
`real' plants are discussed.
Chapter nine completes this thesis with the conclusion derived from this study as well as suggestions for future work in the next stage of this research programme.
7
snow CHAPTER TWO
Review of Combustion Technologies for Power Generation
This chapter reviews the gasification technologies for power generation in general, including basic reactions, technical descriptions, type of gasification and comparison
with combustion process. IGCC systems demonstrate high system efficiency and
impressive environmental performance, emphasis is therefore given to the IGCC
system. This is followed by a review on various combined cycle technologies such as
the natural gas combined cycle (NGCC), sub and supercritical pulverised coal
combustion (PCC), atmospheric and pressurised fluidised bed combustion (AFBC
and PFBC). Status of current gasification processes and review of conventional gas
cleaning technologies for power generation plant are then discussed. The current
energy policies in Europe are discussed at the end of this chapter.
2.1 Overview of Gasification
Gasification-based energy conversion systems are capable of providing a stable,
affordable, high-efficiency energy supply with minimal environmental impact. They
can provide flexibility in the production of a wide range of products including
electricity, fuels, chemicals, hydrogen, and steam, while utilizing low-cost, widely
available feedstocks. All carbon-containing feedstocks including hazardous wastes,
municipal solid waste and sewage sludge, biomass, etc., can be readily gasified after
proper preparation, to produce clean synthesis gas for further processing. Because
of its ability to use low-cost feedstocks, gasification is the technology of choice for
many industrial applications such as in refineries.
2.1.1 Basic Reactions
Gasification is a thermal chemical conversion process designed to maximise the
conversion of the carbonaceous fuel and waste to a synthesis gas (syngas)
containing primarily carbon monoxide and hydrogen (over 85%) with lesser amounts
of carbon dioxide, water, methane, argon, and nitrogen. The chemical reactions take
place in the presence of steam in an oxygen-lean reducing atmosphere, in contrast to
combustion where reactions take place in an oxygen-rich, excess air environment. In
other words, the ratio of oxygen molecules to carbon molecules is less than one in
the gasification reactor. 8

The following simplified chemical conversion formulas describe the basic gasification
process (Neville, 2004)
The following reactions are important in coal gasification:
"C (Fuel) + 02 -3 CO2 (exothermic) (2.1)
" C+ 1/2 02 ---ý CO (exothermic) (2.2)
"C+ H2O (steam) -* CO + H2 (endothermic) (2.3)
"C+ CO2 --) 2CO (endothermic) (2.4)
" CO + H2O -ý CO2 + H2 (exothermic) (2.5)
" CO + 3H2 -ý CH4 + H2O (exothermic) (2.6)
"C+ 2H2 -4 CH4 (exothermic) (2.7)
2.1.2 Technical Description of the Gasification Process
The heart of any gasification-based system is the gasifier, which can process a wide
variety of feedstocks, including coal, biomass, petroleum coke, refinery residues, and
other wastes. The gasifier converts carbonaceous feedstock into gaseous products
at high temperature and (usually) elevated pressure in the presence of oxygen and
steam. Partial oxidation of the feedstock in a reducing (oxygen starved) atmosphere
provides the heat. At operating conditions, chemical reactions occur that produce the
syngas, a mixture of predominantly CO and H2. Minerals in the feedstock (ash)
separate and leave the bottom of the gasifier as an inert slag (or bottom ash), a
potentially marketable solid product. The fraction of the ash entrained with the
syngas, which is dependent upon the type of gasifier employed, requires removal downstream in particulate control equipment, such as filtration and water scrubbers. This particulate is typically recycled to the gasifier to ensure high carbon conversion. Some gasifiers also yield devolatilisation or pyrolysis products (coal tars, oils,
phenols, etc. ) that can and must be controlled. While this is a major issue with
moving-bed gasifiers, it is less of a concern for fluidised-bed and multi-stage/single-
stage entrained-flow gasifiers. Fig. 2.1 presents a simplified schematic diagram of
many of the technology options which could constitute the energy plants for the 21st
century.
9
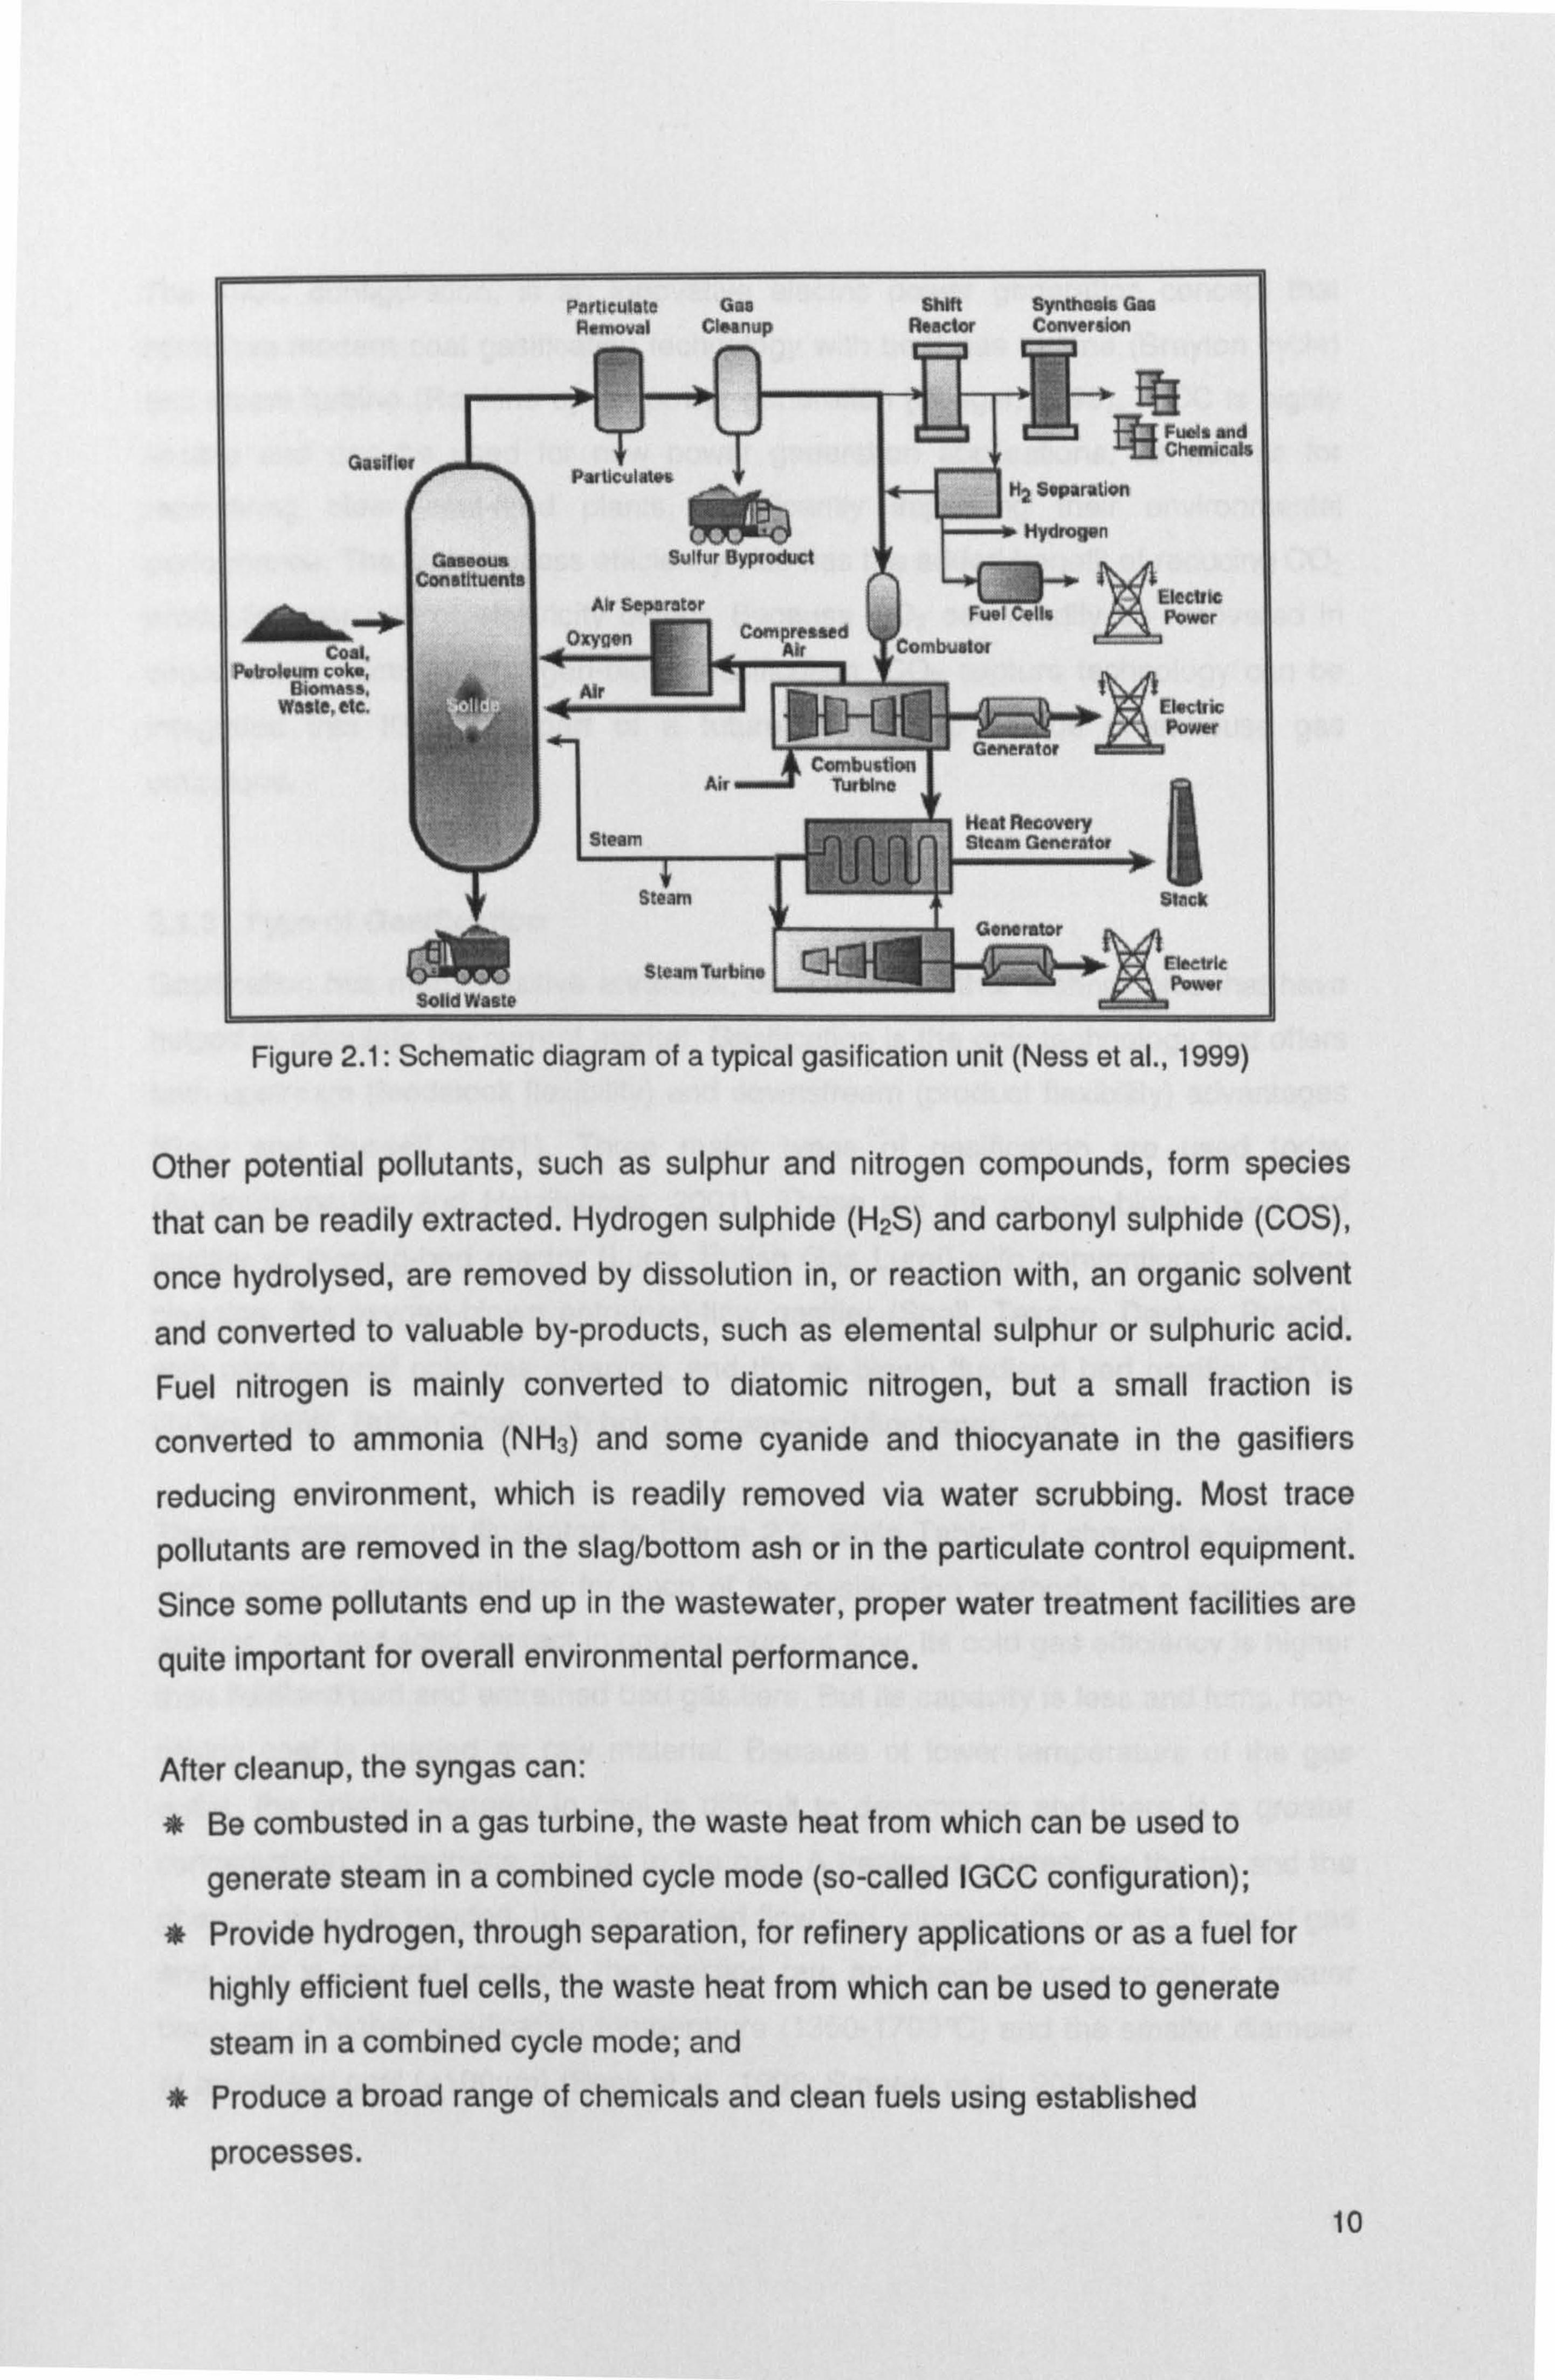
Other potential pollutants, such as sulphur and nitrogen compounds, form species
that can be readily extracted. Hydrogen sulphide (H2S) and carbonyl sulphide (COS),
once hydrolysed, are removed by dissolution in, or reaction with, an organic solvent
and converted to valuable by-products, such as elemental sulphur or sulphuric acid. Fuel nitrogen is mainly converted to diatomic nitrogen, but a small fraction is
converted to ammonia (NH3) and some cyanide and thiocyanate in the gasifiers
reducing environment, which is readily removed via water scrubbing. Most trace
pollutants are removed in the slag/bottom ash or in the particulate control equipment. Since some pollutants end up in the wastewater, proper water treatment facilities are
quite important for overall environmental performance.
After cleanup, the syngas can: Be combusted in a gas turbine, the waste heat from which can be used to
generate steam in a combined cycle mode (so-called IGCC configuration); Provide hydrogen, through separation, for refinery applications or as a fuel for
highly efficient fuel cells, the waste heat from which can be used to generate
steam in a combined cycle mode; and * Produce a broad range of chemicals and clean fuels using established
processes.
10
Figure 2.1: Schematic diagram of a typical gasification unit (Ness et al., 1999)
The IGCC configuration, is an innovative electric power generation concept that
combines modern coal gasification technology with both gas turbine (Brayton cycle)
and steam turbine (Rankine cycle) power generation (Stieget, 1999). IGCC is highly
flexible and can be used for new power generation applications, as well as for
repowering older coal-fired plants, significantly improving their environmental
performance. The high process efficiency also has the added benefit of reducing CO2
production per unit of electricity output. Because CO2 can readily be recovered in
concentrated form with oxygen-blown gasification, CO2 capture technology can be
integrated into IGCC as part of a future strategy to reduce greenhouse gas
emissions.
2.1.3 Type of Gasification
Gasification has many positive attributes, compared to other technologies that have
helped to stimulate the current market. Gasification is the only technology that offers both upstream (feedstock flexibility) and downstream (product flexibility) advantages
(Gary and Russell, 2001). Three major types of gasification are used today
(Androutsopoulos and Hatzilyberis, 2001). These are the oxygen-blown fixed bed
gasifier or moving-bed reactor (Lurgi, British Gas Lurgi) with conventional cold gas
cleaning, the oxygen-blown entrained-flow gasifier (Shell, Texaco, Destec, Prenflo)
with conventional cold gas cleaning, and the air-blown fluidised bed gasifier (HTW,
U-Gas, KRW, British Coal) with hot gas cleaning (Minchener, 2005).
These processes are illustrated in Figure 2.2, while Table 2.1 shows the feed fuel
and operating characteristics for each of the gasification methods. In a moving bed
gasifier, gas and solid contact in counter-current flow. Its cold gas efficiency is higher
than fluidised bed and entrained bed gasifiers. But its capacity is less and lump, non- caking coal is needed as raw material. Because of lower temperature of the gas
outlet, the volatile material in coal is difficult to decompose and there is a greater
concentration of methane and tar in the gas. A treatment system for the tar and the
phenolic water is needed. In an entrained flow bed, although the contact time of gas and solid is several seconds, the reaction rate and gasification capacity is greater because of higher gasification temperature (1350-1700°C) and the smaller diameter
of pulverised coal (<I 00µm) (Bonk et al., 1996; Smeers et al., 2001).
11
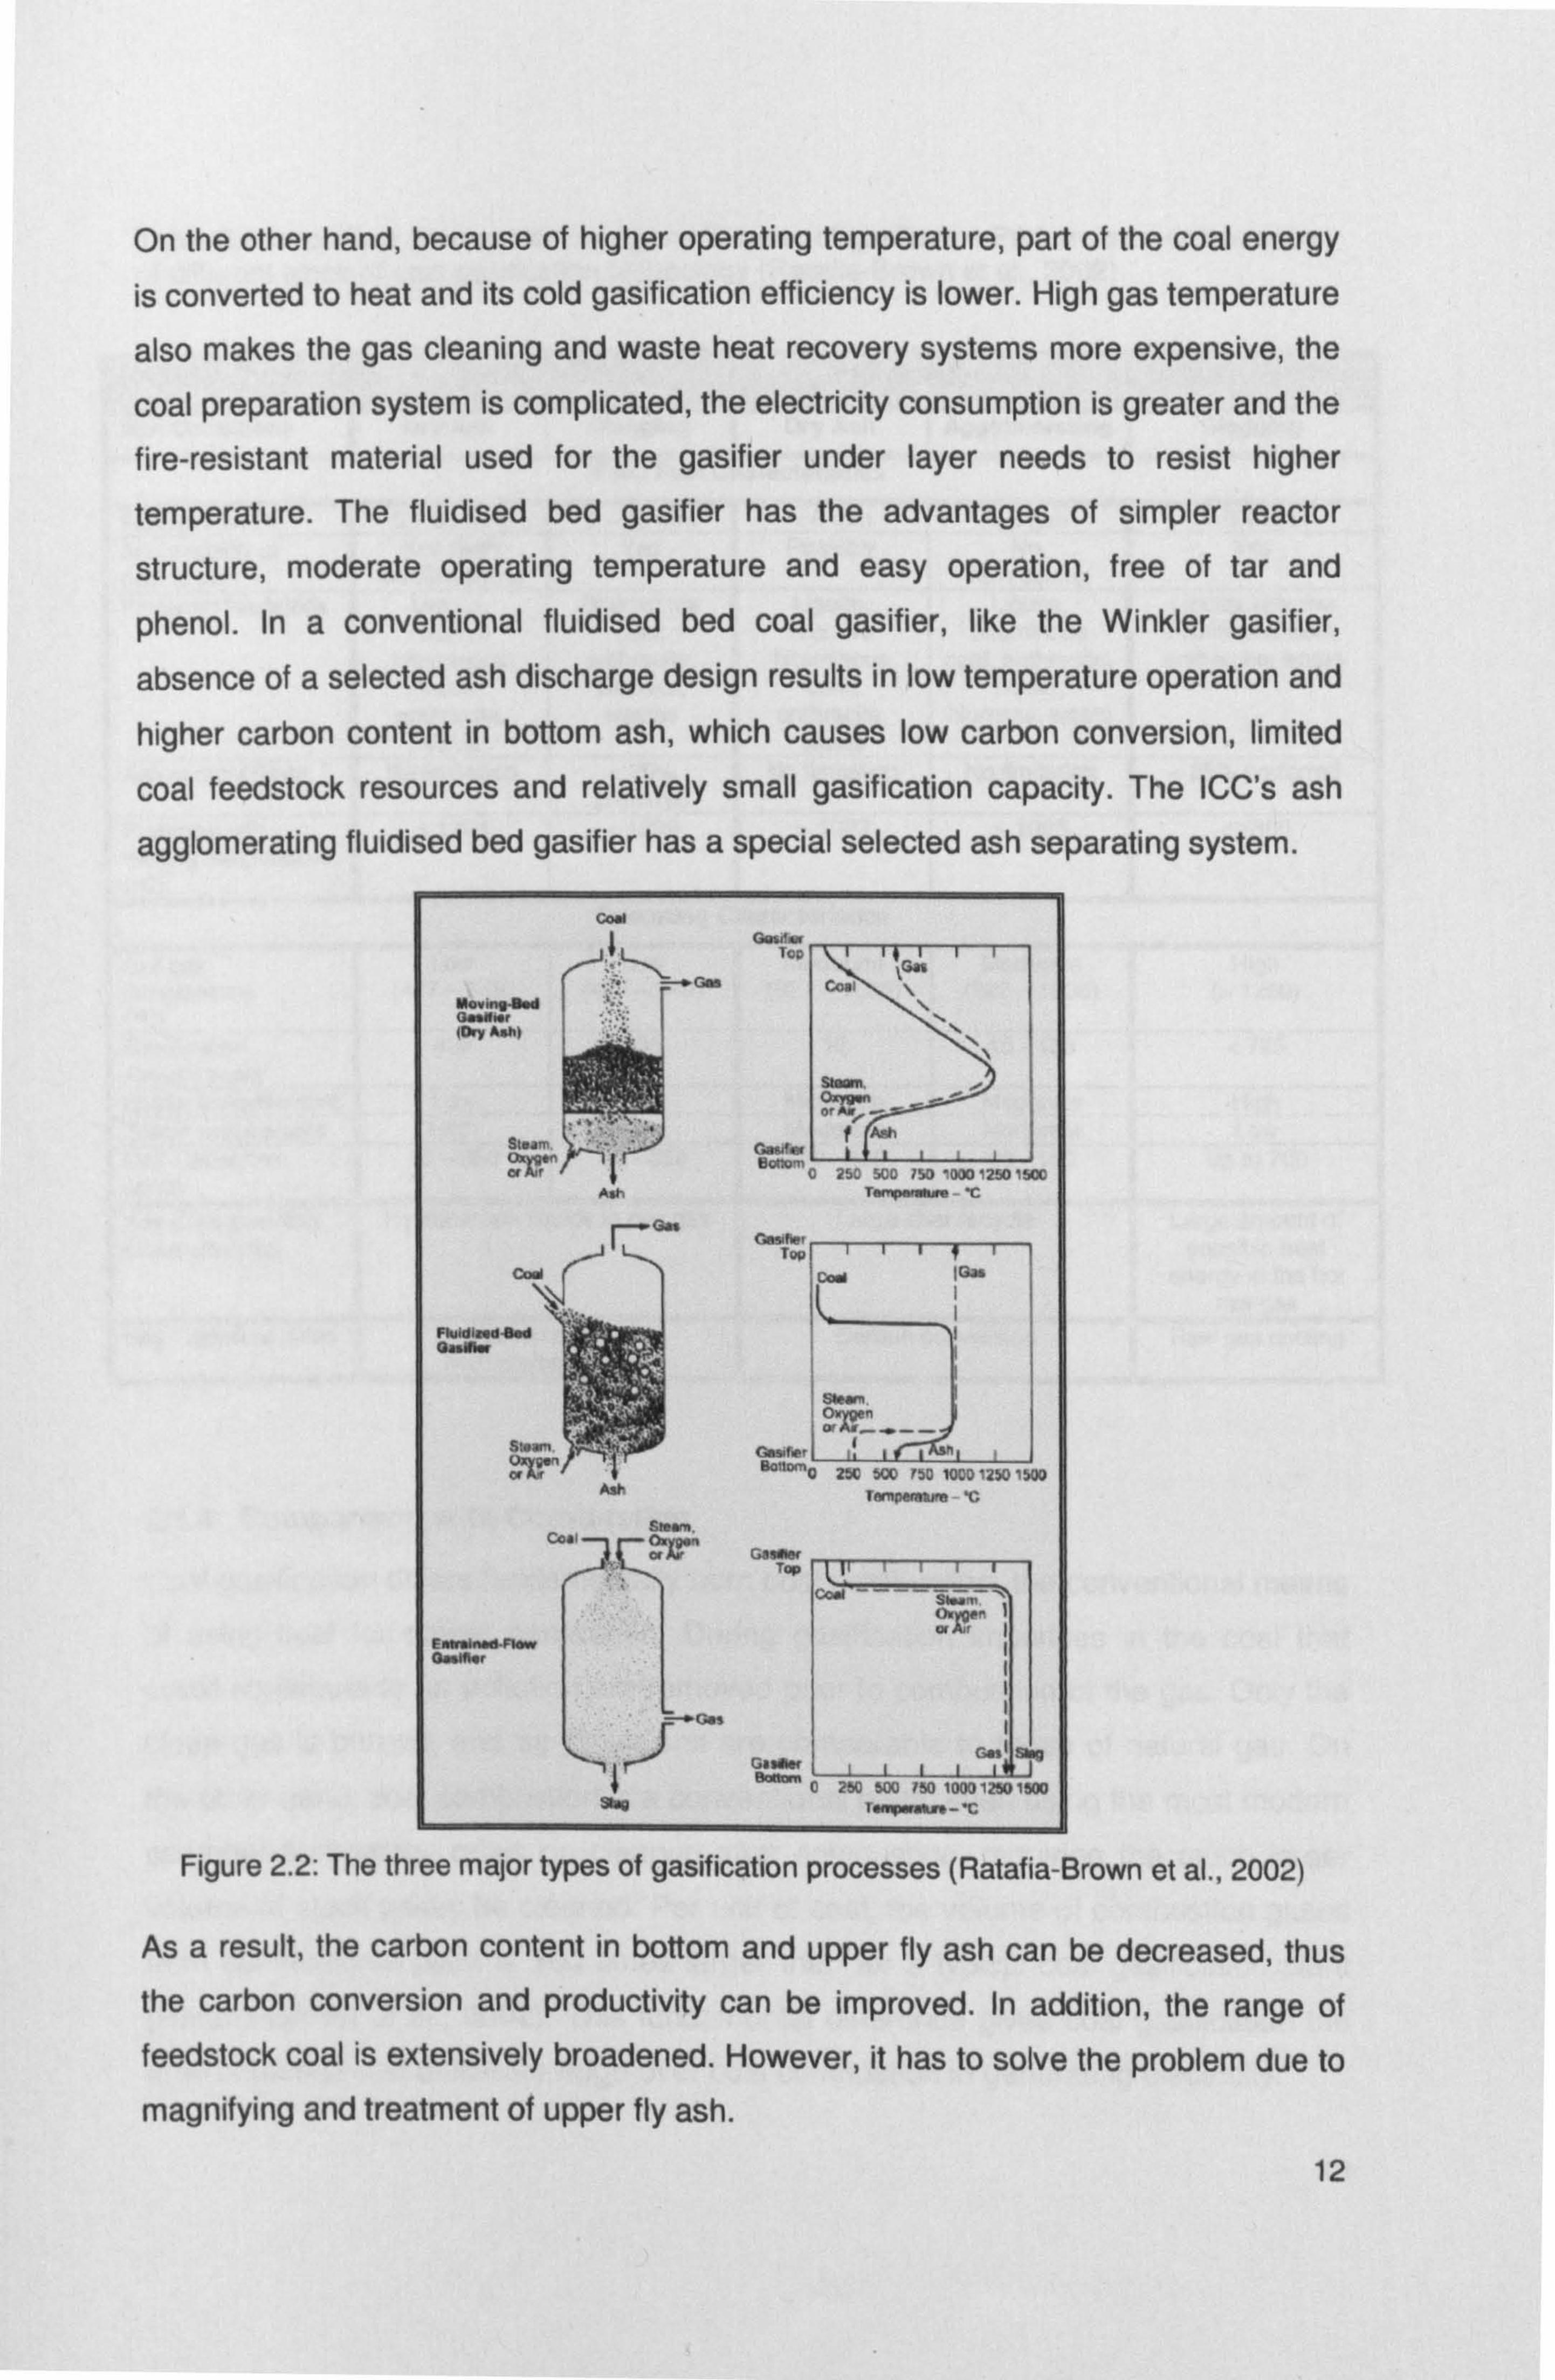
On the other hand, because of higher operating temperature, part of the coal energy is converted to heat and its cold gasification efficiency is lower. High gas temperature
also makes the gas cleaning and waste heat recovery systems more expensive, the
coal preparation system is complicated, the electricity consumption is greater and the
fire-resistant material used for the gasifier under layer needs to resist higher
temperature. The fluidised bed gasifier has the advantages of simpler reactor
structure, moderate operating temperature and easy operation, free of tar and
phenol. In a conventional fluidised bed coal gasifier, like the Winkler gasifier,
absence of a selected ash discharge design results in low temperature operation and
higher carbon content in bottom ash, which causes low carbon conversion, limited
coal feedstock resources and relatively small gasification capacity. The ICC's ash
agglomerating fluidised bed gasifier has a special selected ash separating system.
Cool
Novirp"N. d
ý
`"" .
lav...,.
Of /Y/
A. h
Flo"
Ca. l
FlWdIa d4. d\ Gas"
Sean
4
;. ý
Aah
CaSi ulir
EýYYwMF1ew OMIMr
-ýCas
t
0wxr Top
Cýl
smm,
epklm0 250 500 7501000,2501500
TrrpMr+s - "C
T op Carl ION
7
Sbm-
orner --
B000. o 200 500 T50 100012501500 rernpema, m "c
c1/0w Top
coal ... sO. Tom i
BaOO1e 0 250 500 700 100012501500 1. Iw a S, -'C
Figure 2.2: The three major types of gasification processes (Ratafia-Brown et at., 2002)
As a result, the carbon content in bottom and upper fly ash can be decreased, thus the carbon conversion and productivity can be improved. In addition, the range of feedstock coal is extensively broadened. However, it has to solve the problem due to
magnifying and treatment of upper fly ash.
12
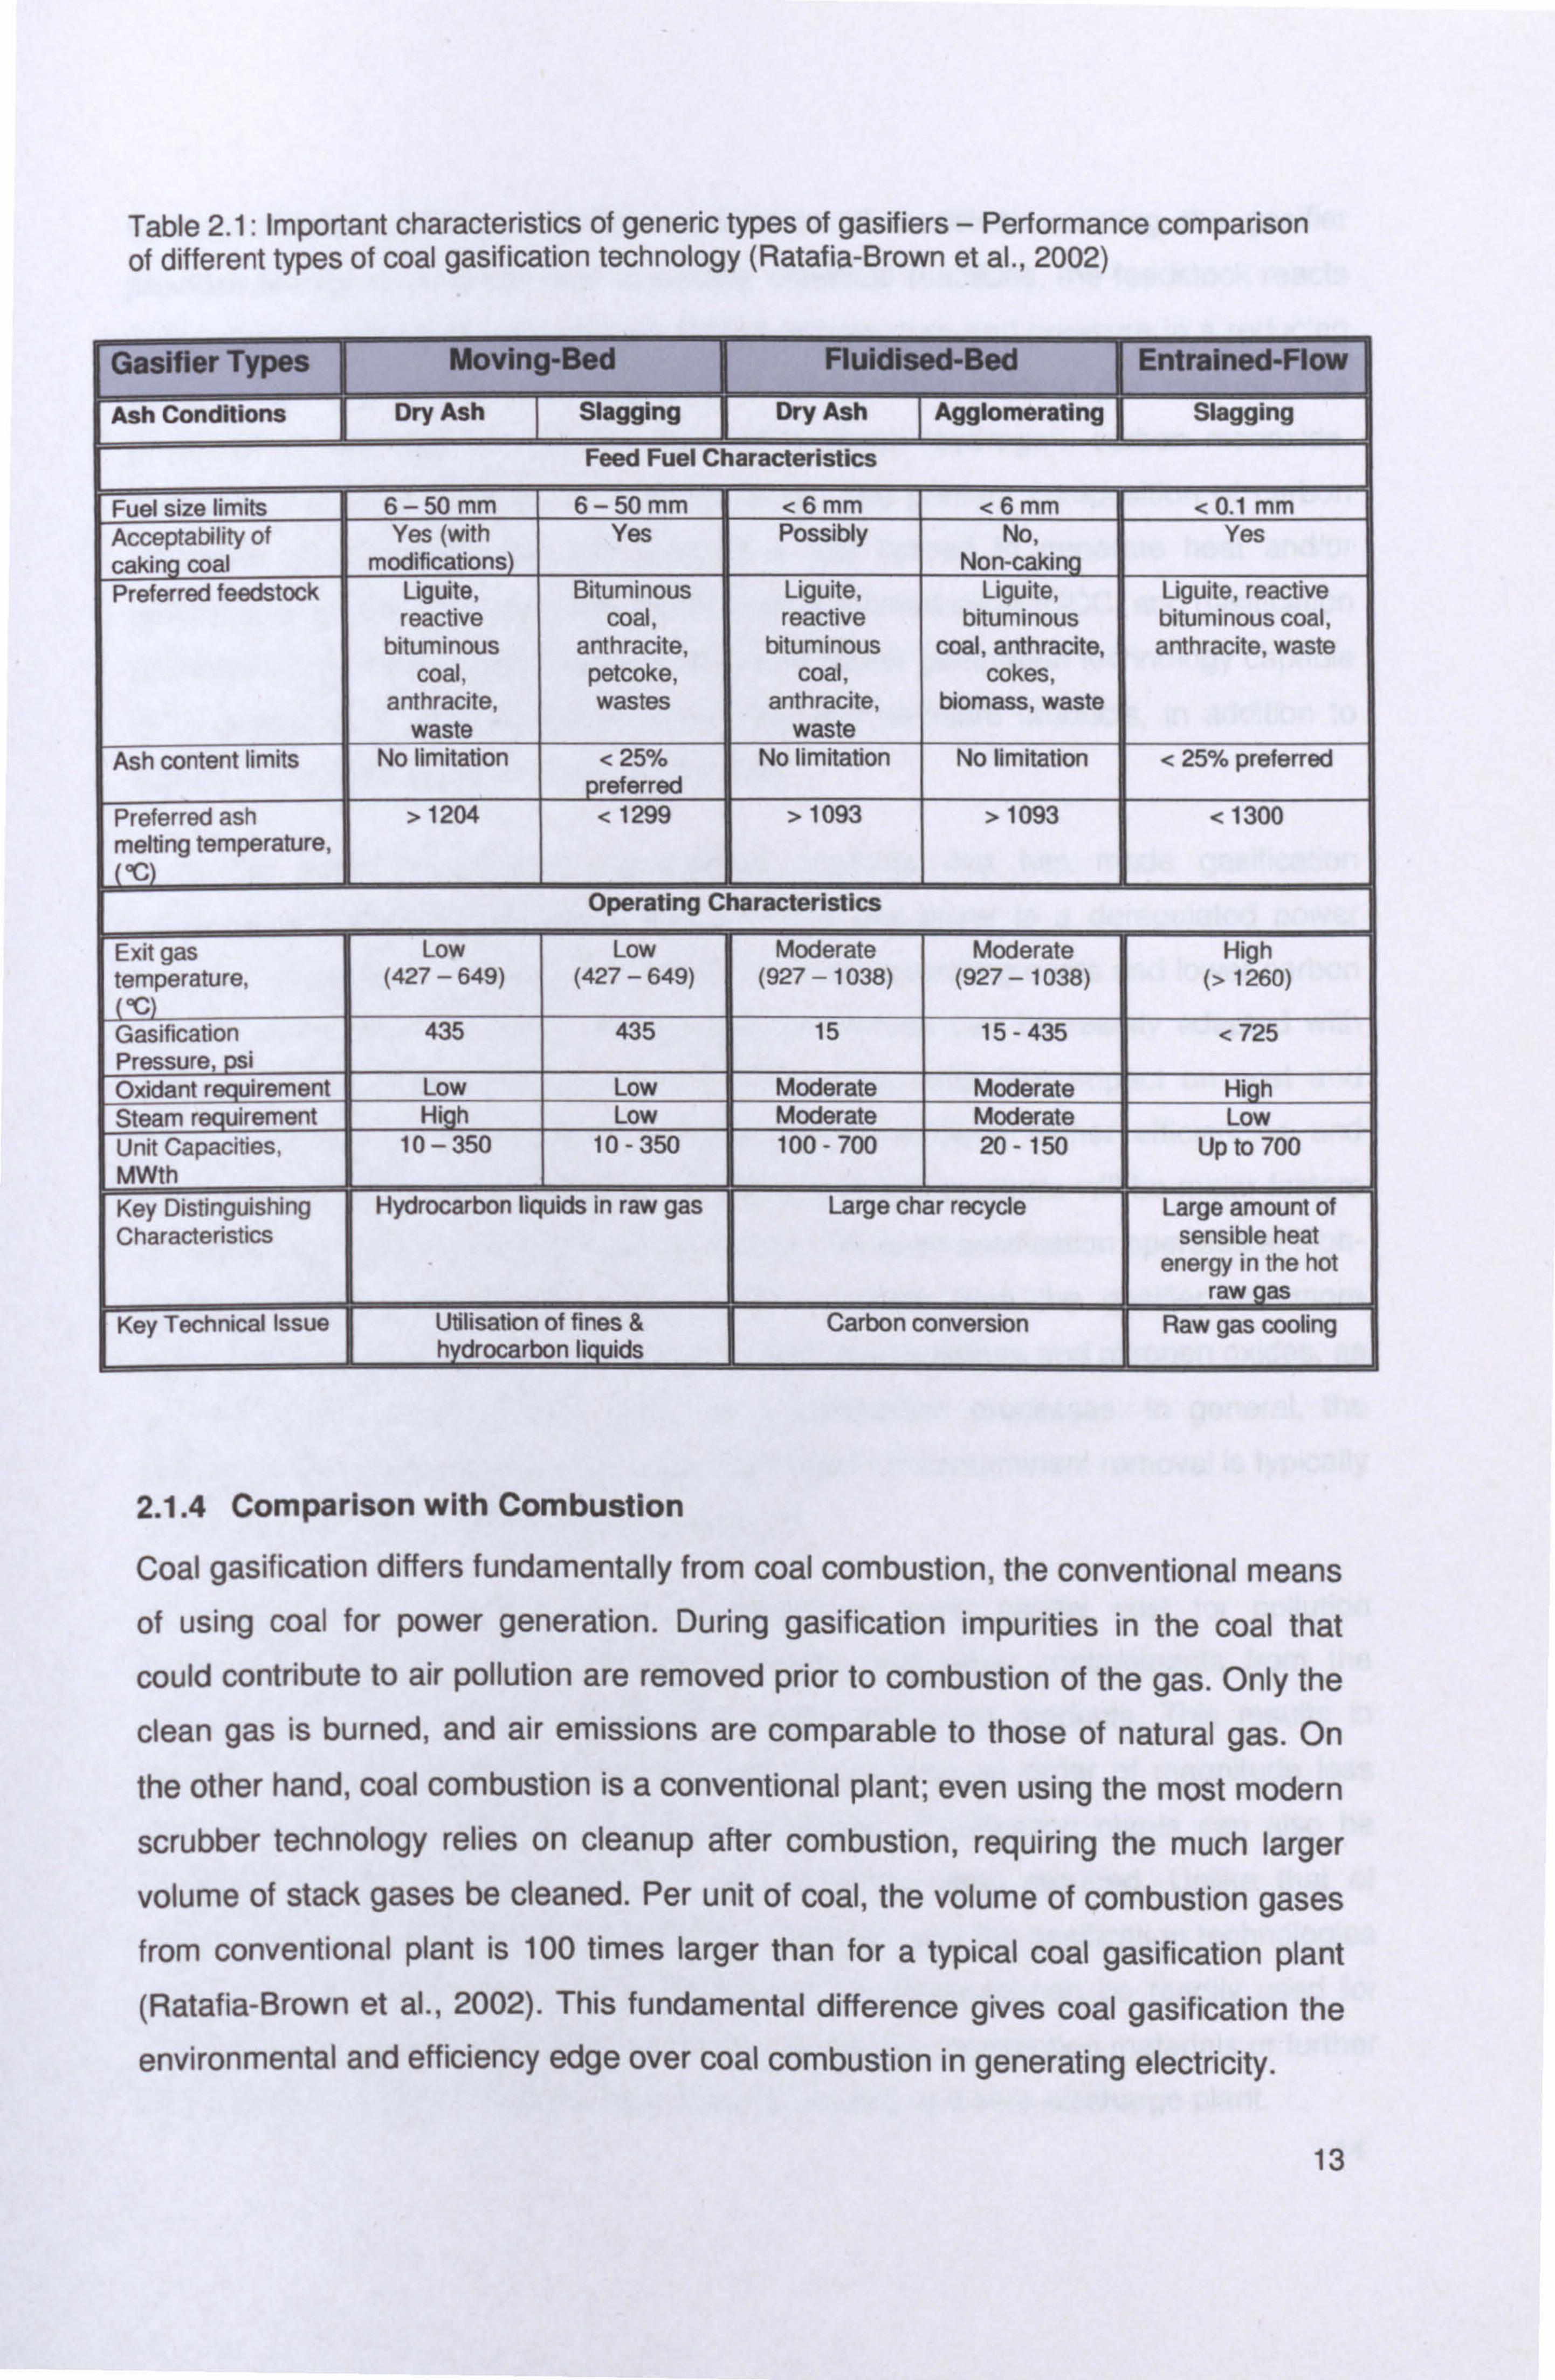
Table 2.1: Important characteristics of generic types of gasifiers - Performance comparison of different types of coal gasification technology (Ratafia-Brown et al., 2002)
Gasifier Types Moving-Bed Fluidised-Bed Entrained-Flow
Ash Conditions Dry Ash Slagging Dry Ash Agglomerating Slagging
Feed Fuel Characteristics
Fuel size limits 6- 50 mm 6- 50 mm <6 mm <6 mm < 0.1 mm Acceptability of Yes (with Yes Possibly No, Yes caking coal modifications) Non-caking Preferred feedstock Liguite, Bituminous Liguite, Liguite, Liguite, reactive
reactive coal, reactive bituminous bituminous coal, bituminous anthracite, bituminous coal, anthracite, anthracite, waste
coal, petcoke, coal, cokes, anthracite, wastes anthracite, biomass, waste
waste waste Ash content limits No limitation < 25% No limitation No limitation < 25% preferred
preferred Preferred ash > 1204 < 1299 > 1093 > 1093 < 1300 melting temperature, °C
Operating C haracteristics
Exit gas Low Low Moderate Moderate High temperature, (427-649) (427-649) (927-1038) (927-1038) (> 1260) °C
Gasification 435 435 15 15 - 435 < 725 Pressure, i Oxidant requirement Low Low Moderate Moderate Hi ah Steam requirement High Low Moderate Moderate Low Unit Capacities, 10 - 350 10 - 350 100 - 700 20 - 150 Up to 700 MWth Key Distinguishing Hydrocarbon liquids in raw gas Large char recycle Large amount of Characteristics sensible heat
energy in the hot raw gas
Key Technical Issue I Utilisation of fines & Carbon conversion Raw gas cooling hydrocarbon liquids
2.1.4 Comparison with Combustion
Coal gasification differs fundamentally from coal combustion, the conventional means
of using coal for power generation. During gasification impurities in the coal that
could contribute to air pollution are removed prior to combustion of the gas. Only the
clean gas is burned, and air emissions are comparable to those of natural gas. On
the other hand, coal combustion is a conventional plant; even using the most modern
scrubber technology relies on cleanup after combustion, requiring the much larger
volume of stack gases be cleaned. Per unit of coal, the volume of combustion gases from conventional plant is 100 times larger than for a typical coal gasification plant (Ratafia-Brown et al., 2002). This fundamental difference gives coal gasification the
environmental and efficiency edge over coal combustion in generating electricity.
13
In conventional gasifiers, a partial combustion of feedstock entering the gasifier
provides energy to drive the heat absorbing chemical reactions, the feedstock reacts in the gasifier with steam and oxygen at high temperature and pressure in a reducing (oxygen starved) atmosphere, that yield a combustible product gas mixture. The
produced gas mixture includes the flammable gases (hydrogen, carbon monoxide,
methane, and small amounts of hydrocarbons). The primary composition of carbon
monoxide and hydrogen can be used as a fuel burned to generate heat and/or
electricity or steam. The integrated gasification combined cycle IGCC, and gasification
processes in general, is also the only advanced power generation technology capable
of co-producing a wide variety of commodity and premium products, in addition to
electricity, to meet future market requirements.
It is this ability to produce value-added products that has made gasification
economical in selected situations and will be a key driver in a deregulated power
market. These higher efficiencies translate to lower operating costs and lower carbon
dioxide emissions. In addition, the gasification process can be readily adapted with
advanced technologies for the concentration of CO with little impact on cost and
thermal efficiency. The ability of a technology to achieve higher efficiencies and
concentrate CO with minimal impact on the cost of final products will be major factors
in technology selection for future energy plants. Because gasification operates at high-
pressure with a reducing atmosphere, the products from the gasifier are more
amenable to cleaning to reduce ultimate emissions of sulphurs and nitrogen oxides, as
well as other pollutants, than those from combustion processes. In general, the
volume of the fuel gas processed in an IGCC plant for contaminant removal is typically
one-third that from a conventional power plant.
Processing lower volumes of gas translates to lower capital cost for pollution
prevention. The removal of sulphurs, nitrogen, and other contaminants from the
reducing gas is also much easier than from combustion products. This results in
sulphur and nitrogen oxide emissions being more than an order of magnitude less
than those of conventional combustion processes. Gasification plants can also be
configured to reach near-zero levels of emissions when required. Unlike that of
combustion processes, the by-product ash and slag from the gasification technologies
have also been shown to be non-hazardous. The material can be readily used for
landfill without added disposal costs or can be used in construction materials or further
processed to produce value-added products, leading to a zero-discharge plant. 14
Although current cost for green field sites are high, gasification processes can be
economically integrated into existing refineries and chemical plants. With proper integration and the use of existing infrastructure, the overall cost of a project can be
significantly reduced.
2.2 Integrated Gasification Combined Cycle (IGCC) System
IGCC plants are extremely clean and more efficient than traditional coal-fired
systems. In IGCC plants, coal is not burned in a traditional boiler but is converted into
a hydrocarbon vapour (syngas) in a gasifier. The syngas is then cleaned, stripped of
impurities and used as fuel instead of natural gas in a conventional combined cycle
plant (see description of the natural gas combined cycle plant, below). The result is
an integrated gasification combined-cycle configuration that provides ultra-low
pollution levels and high system efficiencies. The IGCC systems that are operating
commercially have demonstrated exceptional environmental performance. Emissions
of SO2 and NO, are less than one-tenth of those allowed under U. S. New Source
Performance Standards limits. Moreover, IGCC efficiency levels can be as high as 45%. Most of the existing IGCC plants were built on a demonstration basis with
government subsidies; however, these plants are nearing full commercial operation. For example, it is reported that the Wabash River plant in Indiana had an overall
reliability of 79% in 1999 and operators are now receiving a lot of interest in their
technology. The numerous benefits of coal IGCC are prompting electric utilities and independent power producers to consider the use of coal:
2.2.1 Ultra-Low Emissions
There is increasing pressure to consider the environmental impacts associated with the use of fossil fuels. Depending on the gasification technology that is used, IGCC
can be the cleanest means of producing electricity from coal, resulting in lower
emissions of both gases and solids. IGCC plants would dramatically reduce
emissions of sulphur dioxide, nitrogen oxides, mercury, particulates, and carbon
dioxide compared to levels produced by conventional coal-fuelled plants. In fact,
sulphur dioxide and nitrogen oxides can be reduced substantially below the Clean Air
Act's new source performance standard ("NSPS") requirements for coal-fuelled
facilities. 15

Carbon dioxide emissions can also be controlled more effectively with IGCC
technology than with other coal-fuelled or natural gas fuelled technologies. Capture
of carbon dioxide emissions reduces the power output of an IGCC power plant by
only 14%, whereas the decrease is 21% for natural gas-fuelled plants and 28% for
conventional coal-fuelled plants when comparing similar percentage levels of carbon dioxide reduction (O'Brien et al., 2004).
2.2.2 Air and Solid Emissions
IGCC can achieve greater reductions of air emissions at lower cost than less
advanced technologies (ChevronChevron, 2002), offers the lowest emissions of
sulphur dioxide (SO2) and NO), of any coal-fed technology. In addition, the reductions
of carbon dioxide (CO2) and particulates from an IGCC plant are significantly better
than those achieved by plants using competing clean-coal technologies. Due to IGCC's high efficiency, CO2 emissions are low (the higher the conversion efficiency, the lower the emissions of C02). This process produces a high pressure and high
quality CO2 product that can be recovered for sale. During gasification, virtually all of the carbon in the feedstock is converted to syngas. The mineral matter in the
feedstock separates from the gaseous products, the ash and other inert materials
such as metals fall to the bottom of the gasifier as non-leach able, glass-like solids or
other marketable material. This material can be safely used for many construction or building applications. In addition, more than 99% (ChevronChevron, 2002) of the
sulphur in the coal can be removed and converted into marketable elemental sulphur. Competing technologies for generating clean power from coal cannot match the
environmental performance of IGCC (Table 2.2). For instance, utilities using
circulating fluidised bed combustion (CFBC) and pulverised coal boilers with FGD
must remove sulphur from post-combustion flue gases. This generates large
amounts of waste. Utilities using IGCC can readily remove more than 99 percent of the sulphur, pre-combustion, while producing marketable sulphur products instead of
waste.
Table 2.2: Emission comparison (ChevronChevron, 2002) NGCC IGCC CFB
SCR Yes No No Stack Gas Scrubber No No Yes NO,, 3m <9m 85 m Sulphur Recovery - > 98 % 95 % CO2 (lb/kWh) 0.81 1.95 2.26
16
2.2.3 Great Diversity of World Fuel Supply
Around the world, there is a growing appreciation for the need to diversify the energy
supply and to avoid the dependence on limited fuel sources. IGCC technology allows
for the clean, sustainable use of the UK's coal reserves, which increases energy self-
sufficiency, and lessens reliance on foreign energy sources.
2.3 Overview of Other Combined Cycle Technologies
All coal combustion technologies rely on the generation of high pressure steam using
heat produced by burning coal. This high pressure steam then drives a turbine, and
electricity is produced from an electrical generator attached to the steam turbine. The
combustion of coal in the boiler can be accomplished in various ways, described
below. In general, the most energy-efficient plants have the lowest emissions, as
they produce more electricity per unit of coal burned. However, emissions from less-
efficient plants can be reduced with "add-on" pollution control options.
2.3.1 Natural Gas Combined Cycle (NGCC) Process
The best standard for today's power generation technology is set by the NGCC
system which provides high efficiency, low environmental emission and low cost.
Coupled with the relatively low cost of natural gas, NGCC offers the most cost-
efficient way of generating electricity. However due to the fact that natural gas costs
are on the rise, environmental requirements are becoming ever more stringent, and
there is an urgent need to diversify the world's fuel supply. It is not a coal combustion
process, but a description is included here for comparison with the various coal-fired
options. Commercial-grade natural gas burns more cleanly than other fossil fuels
because it consists mostly of methane and has already been cleaned of sulphur. In
NGCC plants, natural gas is used as fuel in a gas turbine. Electricity produced from
the generator coupled to the gas turbine, hot exhaust gas from the turbine is used to
generate steam in a waste heat recovery unit. The steam is then used to produce
more electricity.
17

2.3.2 Subcritical and Supercritical Pulverised Coal Combustion (PCC)
Coal combustion has traditionally occurred at atmospheric pressure using subcritical
steam, but today, greater efficiencies can be obtained by using higher steam
pressures in the supercritical range. Both of these processes begin with coal being
ground into a fine powder. The powdered coal is blown with air into the boiler through
a series of burner nozzles where combustion takes place at temperatures from 1300-
1700°C, depending largely on the coal type. Combustion occurs at near-atmospheric
pressure, which simplifies the burner and coal handling facilities. Subcritical PCC
plants use steam in the range of 16 MPa pressure and 550°C while supercritical PCC
plants use steam with pressures as high as 30 MPa and 600°C. The higher steam
pressure in supercritical plants results in higher energy efficiency, 38-45%, compared
with 33% for subcritical plants. While supercritical plants have higher capital costs
and some added risk due to the higher pressure and temperature, they have been in
commercial use for many years.
2.3.3 Atmospheric & Pressurised Fluidised Bed Combustion (AFBC & PFBC)
FBC processes are commonly used with high sulphur coal. In a FBC plant, hot air
blown up through the floor of the boiler suspends or "fluidises" powdered coal mixed
with a sorbent such as powdered limestone. The combustion of the coal in the
presence of the sorbent facilitates the capture of SO2. Conventional boilers, by
contrast, simply burn the fuel on a grate in the firebox. FBC plants can remove up to
98% of the SO2 and the coal burns more efficiently because it stays longer in the
combustion chamber. AFBC plants operate at atmospheric pressure, and NOX
generation is minimised due to lower combustion temperatures (815-875°C) than in
conventional PCC plants. In contrast to AFBC plants, PFBC plants operate at
elevated pressures (Sadownik et al., 2004). PFBC plants are typically more compact than similar capacity AFBC and PCC plants due to the higher pressure. The PFBC
design allows for potentially greater efficiency, reduced operating costs and less
waste than the AFBC design. PFBC plants use the same process as AFBC plants to
fluidise or float the coal/sorbent mixtures. In both AFBC and PFBC plants, the
reacted sorbent forms a dry, granular material that is easily disposed of or used as a
commercial by-product. The reacted sorbent is removed with the bed ash through the
bottom of the boiler and with the fly ash that has been collected in the dust collectors
at the top of the boiler stacks.
18

2.3.4 Environmental Control Comparison of IGCC with PC & FBC Power Plants
IGCC, PC, and FBC power plants use different methods of environmental control due
to their different design configurations. Generally, stringent emission requirements
favour IGCC over PC and FBC power plants. Coal gasification can meet strict air
pollutant emission standards, produce only a small amount of inert solid waste, and
recover sulphur as valuable elemental sulphur or sulphuric acid. PC and FBC plants
can also achieve relatively low levels of emissions by utilising advanced low-NOx
burners and SCR for high-efficiency NOX control, high-efficiency FG for SO2 control
(95%+ removal), and state-of-the-art particulate control (e. g., fabric filter). The major
environmental benefit of selecting FBC technology is the removal of SO2 (90-95%)
and NOX (emission is less than 100 ppm) in the combustion process without adding
post-combustion cleaning equipment, such as wet or dry FGD systems and selective
catalytic reduction (SCR) systems. The available published comparison of
environment control methods for IGCC, PC and FBC power generation technologies
have been tabulated in Table 1-9, page 1-29 in Ratafia-Brown et al. (2002).
2.3.5 Status of the Current Gasification Process In the EU, many companies have actively been developing IGCC technology.
Globally, gasification - of coal, petroleum, petroleum coke and biomass/waste is
used to fuel more than two dozen power plants in 12 countries (Rhodes, 2006) as
shown in Table 2.3.
Table 2.3: Worldwide Gasification use in power plants source (Rhodes. 2006) Plant Owner Country Year
Started Status* Total No. Gasifiers
MWth Output
Feed
Steelhead Energy United States 2010 D 2 0 Coal Excelsior Energy United States 2009 D 3 0 Coal Sistemas de Energia Renovavel Brazil 2006 D 1 68.4 Biomass ATI Sulcis Italy 2006 D 2 956.9 Coal Sokolovska Uhelna, A. S. Czech Republic 2005 C 1 787.4 Coal EPZ Netherlands 2000 0 1 84 Biomass IBIL Energy Systems Ltd. India 2002 0 1 109.1 Coal Sekundärrohstoff-GmbH Germany 1999 0 1 155.6 Biomass Lahden Läm övoima Oy Finland 1998 0 1 48 Biomass Elcogas SA Spain 1997 0 1 587.8 Coal Tampa Electric Co. United States 1996 0 1 451.1 Coal Sokolovska Uhelna, A. S. Czech Republic 1996 0 26 636.4 Coal Nuon Power Buggenum Netherlands 1994 O 1 465.9 Coal Sydkraft AB Sweden 1993 O 1 14.4 Biomass
-u = ueveiopmenr, u=c, onsrrucuon, u= Operating 19
Europe has three large IGCC demonstration projects: at Buggenum in the
Netherlands (operated by Nuon), Puertollano in Spain (Elcogas) and Priolo Gargallo,
Italy (ISAB Energy). The 253 MW Buggenum plant uses a Shell coal gasifier with a
Siemens V94.2 gas turbine and a Siemens KN steam turbine on a single shaft. The
plant has been running since 1994, and has supplied the Dutch grid on a commercial
basis since 1998. Two Siemens V94.2k gas turbines are used in the 521 MW Priolo
plant, which has a Texaco gasifier fed by refinery residues. The 340 MW Puertollano
plant uses a Krupp-Uhde Prenflo gasifier burning coal and petroleum coke to supply
a Siemens V94.3 turbine (Parkinson, 2004). Europe is also a world leader in
Biomass-Fueled IGCC (BIGCC) plants. Notable projects include Arbre Energy
(Eggborough, UK) and Sydkraft (Malmo, Sweden), both of which are based around 5
MW Typhoon gas turbines from Demag Delaval Industrial Turbomachinery (Lincoln,
UK), formerly Alstom and now part of the Siemens group.
2.4 The Need for Hot Fuel Gas Cleaning
Hot fuel gas cleaning generally refers to the removal of fuel gas impurities at
temperatures above 250°C (Mitchell, 1998) before the gas stream enters the gas
turbine. The integration of hot gas clean-up (HGCU) technology to remove pollutants
from coal-derived fuel gas offers the prospect of increasing thermal efficiency whilst
simultaneously reducing the capital and operating cost of IGCC systems without
compromising the environmental performance.
2.4.1 Environmental Requirements
The important goal of gas cleaning is to ensure that emission levels from power
plants conform to existing environmental standards especially with regards to the
three major pollutants i. e. solid particulates or dust, SO2 and NO,. Air pollution
legislation is being established worldwide as concern over air pollution and its local,
regional and transboundary effects increase (McConville, 1997). Existing emission
standards in the industrialised nations of Western Europe, North America and Japan
are being tightened whilst countries in Central and Eastern Europe are putting into
place new air pollution legislation, mainly adopted from the EC. Existing and new
coal-based power plants in Asia have to conform to increasingly stringent national air
pollution regulations, which are very much driven by changes in international
legislation. 20

A number of international standards have been established to control transboundary
air pollution (McConville, 1997). These include protocols made under the United
Nations Economic Commission for Europe (UNECE) Convention on Long-Range
Transboundary Air Pollution (or LRTAP Convention) signed by European countries
as well as US and Canada, the European Community's (EC) environmental
legislation which is binding on its 15 member countries and which also influences
Central and Eastern European countries, and the world Bank environmental
guidelines which are increasing in developing countries in which projects are funded
by the World Bank. Table 2.4 lists the emission standards for particulates, SO2 and
NO, from various sources having plant size greater than 5OMWth in selected
countries as well as several international standards. The emission standards range
from 20 to 37°C mg/m3 for particulates, 30 to 3400 mg/m3 for SO2 and 95 to 1690
mg/m3 for NOR.
2.4.1.1 Energy Policy in Europe
Energy use continues to be dominated by fossil fuels. Despite continued growth in
renewables, substantial further growth is required to meet the EU indicative
renewables targets of 12 % of total energy consumption and 22.1 % of electricity
consumption by 2010 (EEA, 2002). Emissions of nitrogen oxides, sulphur dioxide and
carbon dioxide from electricity production fell while electricity output increased, due
largely to switching to fuels that produce fewer emissions, introducing emission-
specific abatement measures, efficiency improvements and increased use of non- fossil fuel. Electricity production from combined heat and power increased, but
increasingly liberalised energy markets may challenge the EU indicative `combined heat and power in electricity' target of 18 % by 2010.
21
Table 2.4: Environmental legislation, plant size >50MWth (lEA, 2003)

The UK is committed to reducing annual emissions of sulphur dioxide to 585
thousand tonnes by 2010 under the EC National Emission Ceilings Directive. The
aim is to reduce acidification and ground level ozone across Europe. The Directive
sets emission ceilings for all Member States to achieve from 2001, as well as a set of
indicative ceilings for the whole of the European Union to be reviewed in 2004.
Figure 2.3 shows how levels of sulphur dioxide emissions have changed since 1970,
together with the targets for the UK and the EU. The main source of emissions in
2006 was coal use in power stations and other industries.
mdhon tonnes United KsVdom 7
Q 2nd Sulphur Protocol targets for total emissions TOS °° "° EU NECD csing lot total ernfssArw 6
Gothenburg target for total erross. ons 5a EU targets for LCPs
4
s
2 combustion plrris (LCPs)
U
000 toirce_ AEA Energy & Envkonnsnt 0
1975 1980 1985 1990 1995 2000 2005 2010
Figure 2.3: Sulphur dioxide emissions and targets: 1970-2010 (DEFRA, 2008)
2.4.1.2 Legislation Regarding Discharge to Water
Electricity generation can have a significant impact on rivers and estuaries which are
used as a source of cooling water and also for the disposal of surface water and
certain permitted liquid wastes. Most Flue Gas Desulphurisation (FGD) processes
may also produce liquid effluent. These discharges are regulated by National Rivers
Authority (NRA) and the Scottish River Purification Boards Association, and will be
incorporated into the conditions required by HMIP under Integrated Pollution Control.
In addition, the Water Resources Act 1991 enables the Secretary of State to set
statutory water quality objectives which will incorporate the existing requirements of
relevant EC Directives.
2.4.1.3 Legislation Regarding Emission to Air
The EC Large Combustion Plants Directive requires member states of the European Community to reduce total SO2 emissions from existing combustion installation, with
an annual capacity to greater than 50 MW (thermal), of 20 % by end of 1993,40 % by 1998 and 60 % by 2003 taking 1980 emissions as the baseline.
22
Those target reduction have been formally set out in the UK National Plan. Emissions
from large combustion plants in the UK in 1996 were 57 % below the 1980 baseline,
well ahead of the EC target. With the agreement of HMIP, power station quotas can
be reallocated to other stations within the company provided the total quota of SO2
and NO, emissions is not exceeded.
2.4.1.4 Legislation Regarding Waste Disposal
Over 10 millions tonnes of ash and other solid wastes are produced by UK power
stations annually. Additionally, the limestone gypsum FGD process will produce
significant quantities of gypsum which may have to be disposed of at licensed sites.
The Environmental Protection Act provides for stronger licensing power for waste
regulation authorities which if fully implemented, will raise standards for landfill
substantially and thus increase the costs of landfill relative to other forms of treatment
and disposal. It should also, over time, impose a statutory care on producers of
waste with respects to the production, storage, and disposal of waste. The UK
Government published "Climate Change - the UK Programme" in November 2000,
setting out a wide range of policies to address emissions. The programme included
(DEFRA, 2006):
" An obligation on electricity suppliers to source 10 per cent of electricity from
renewable sources by 2010, subject to the cost to the consumer being
acceptable. This was extended in 2004 to a requirement to source 15 per cent from renewables by 2015;
" Measures to improve domestic energy efficiency, including the new Energy
Efficiency Commitment that requires electricity suppliers to promote energy
savings by households;
" The Climate Change Levy on business use of energy, including exemptions for
renewables and Combined Heat and Power (CHP);
" Climate Change Agreements with energy intensive sectors and the implementation of Integrated Pollution Prevention and Control (IPPC);
" Voluntary reductions through the first stage of the UK Emissions Trading Scheme launched in 2002;
" The Ten Year Plan for Transport.
23

The Energy White Paper, published in February 2003 (Heath, 2004), committed the
UK Government to work towards reducing carbon dioxide emissions, the major
greenhouse gas, by 60 per cent from current levels by about 2050, with real progress
by 2020. The White Paper, entitled "Our energy future - creating a low carbon
economy" also set three further goals for UK energy policy, these being to maintain
the reliability of energy supplies; to promote competitive energy markets in the UK
and beyond; and to ensure that every home is adequately and affordably heated.
2.4.2 Gas Turbine
The operation of a gas turbine puts high demands on the quality of the gas to the
turbine combustor. Properties of concern are the heating value, gas composition and
possible contamination comprising solid particulates, sulphur (H2S, COS) and
nitrogen compounds (NH3, HCN) as well as minor contaminants of alkali metals (Na,
K), alkaline earth metals (Ca, Mg), heavy trace metals (Pb, V, Zn, As, Se, Hg, Cd),
halogens (Cl, F), and polycyclic aromatic hydrocarbons (PAHs). In long term
perspective, contamination of the gas will be important as it will influence the over all lifetime of the gas turbine and degradation of downstream equipment such as deposition, erosion and corrosion (Simms et al., 1995), (Oakey et al., 2004). The
National Research Council's (NRC) reported to DOE was that an assessment of hot
gas cleanup systems for advanced IGCC and PFBC should be undertaken to
determine the ability to meet, within the next three to five years, all requirements for
future high temperature (>1260°C) turbine operation and environmental acceptability (Rutkowski et al., 1996). Turbine tolerance estimates and current NSPS requirements
are shown in Figure 2.4. Cumulative Loading > Site. ppm
-T-r Turbine Tolerance Goals (Erosion)
100
NSPS: 0.03 Ib/MM81u
10
Turbine Tolerance
" Erosion (d >5 p)
" Deposition (d <2 ii " Corrosion
1 10 100
Particle Size, Jim
Figure 2.4: Turbine tolerance and particulate emission requirements in coal fueled gas turbine applications (Lippert et at., 1996)
Range Representing Turbine Tolerance Goals -
4,0 Barrier Filter Test Data-HTHP
24
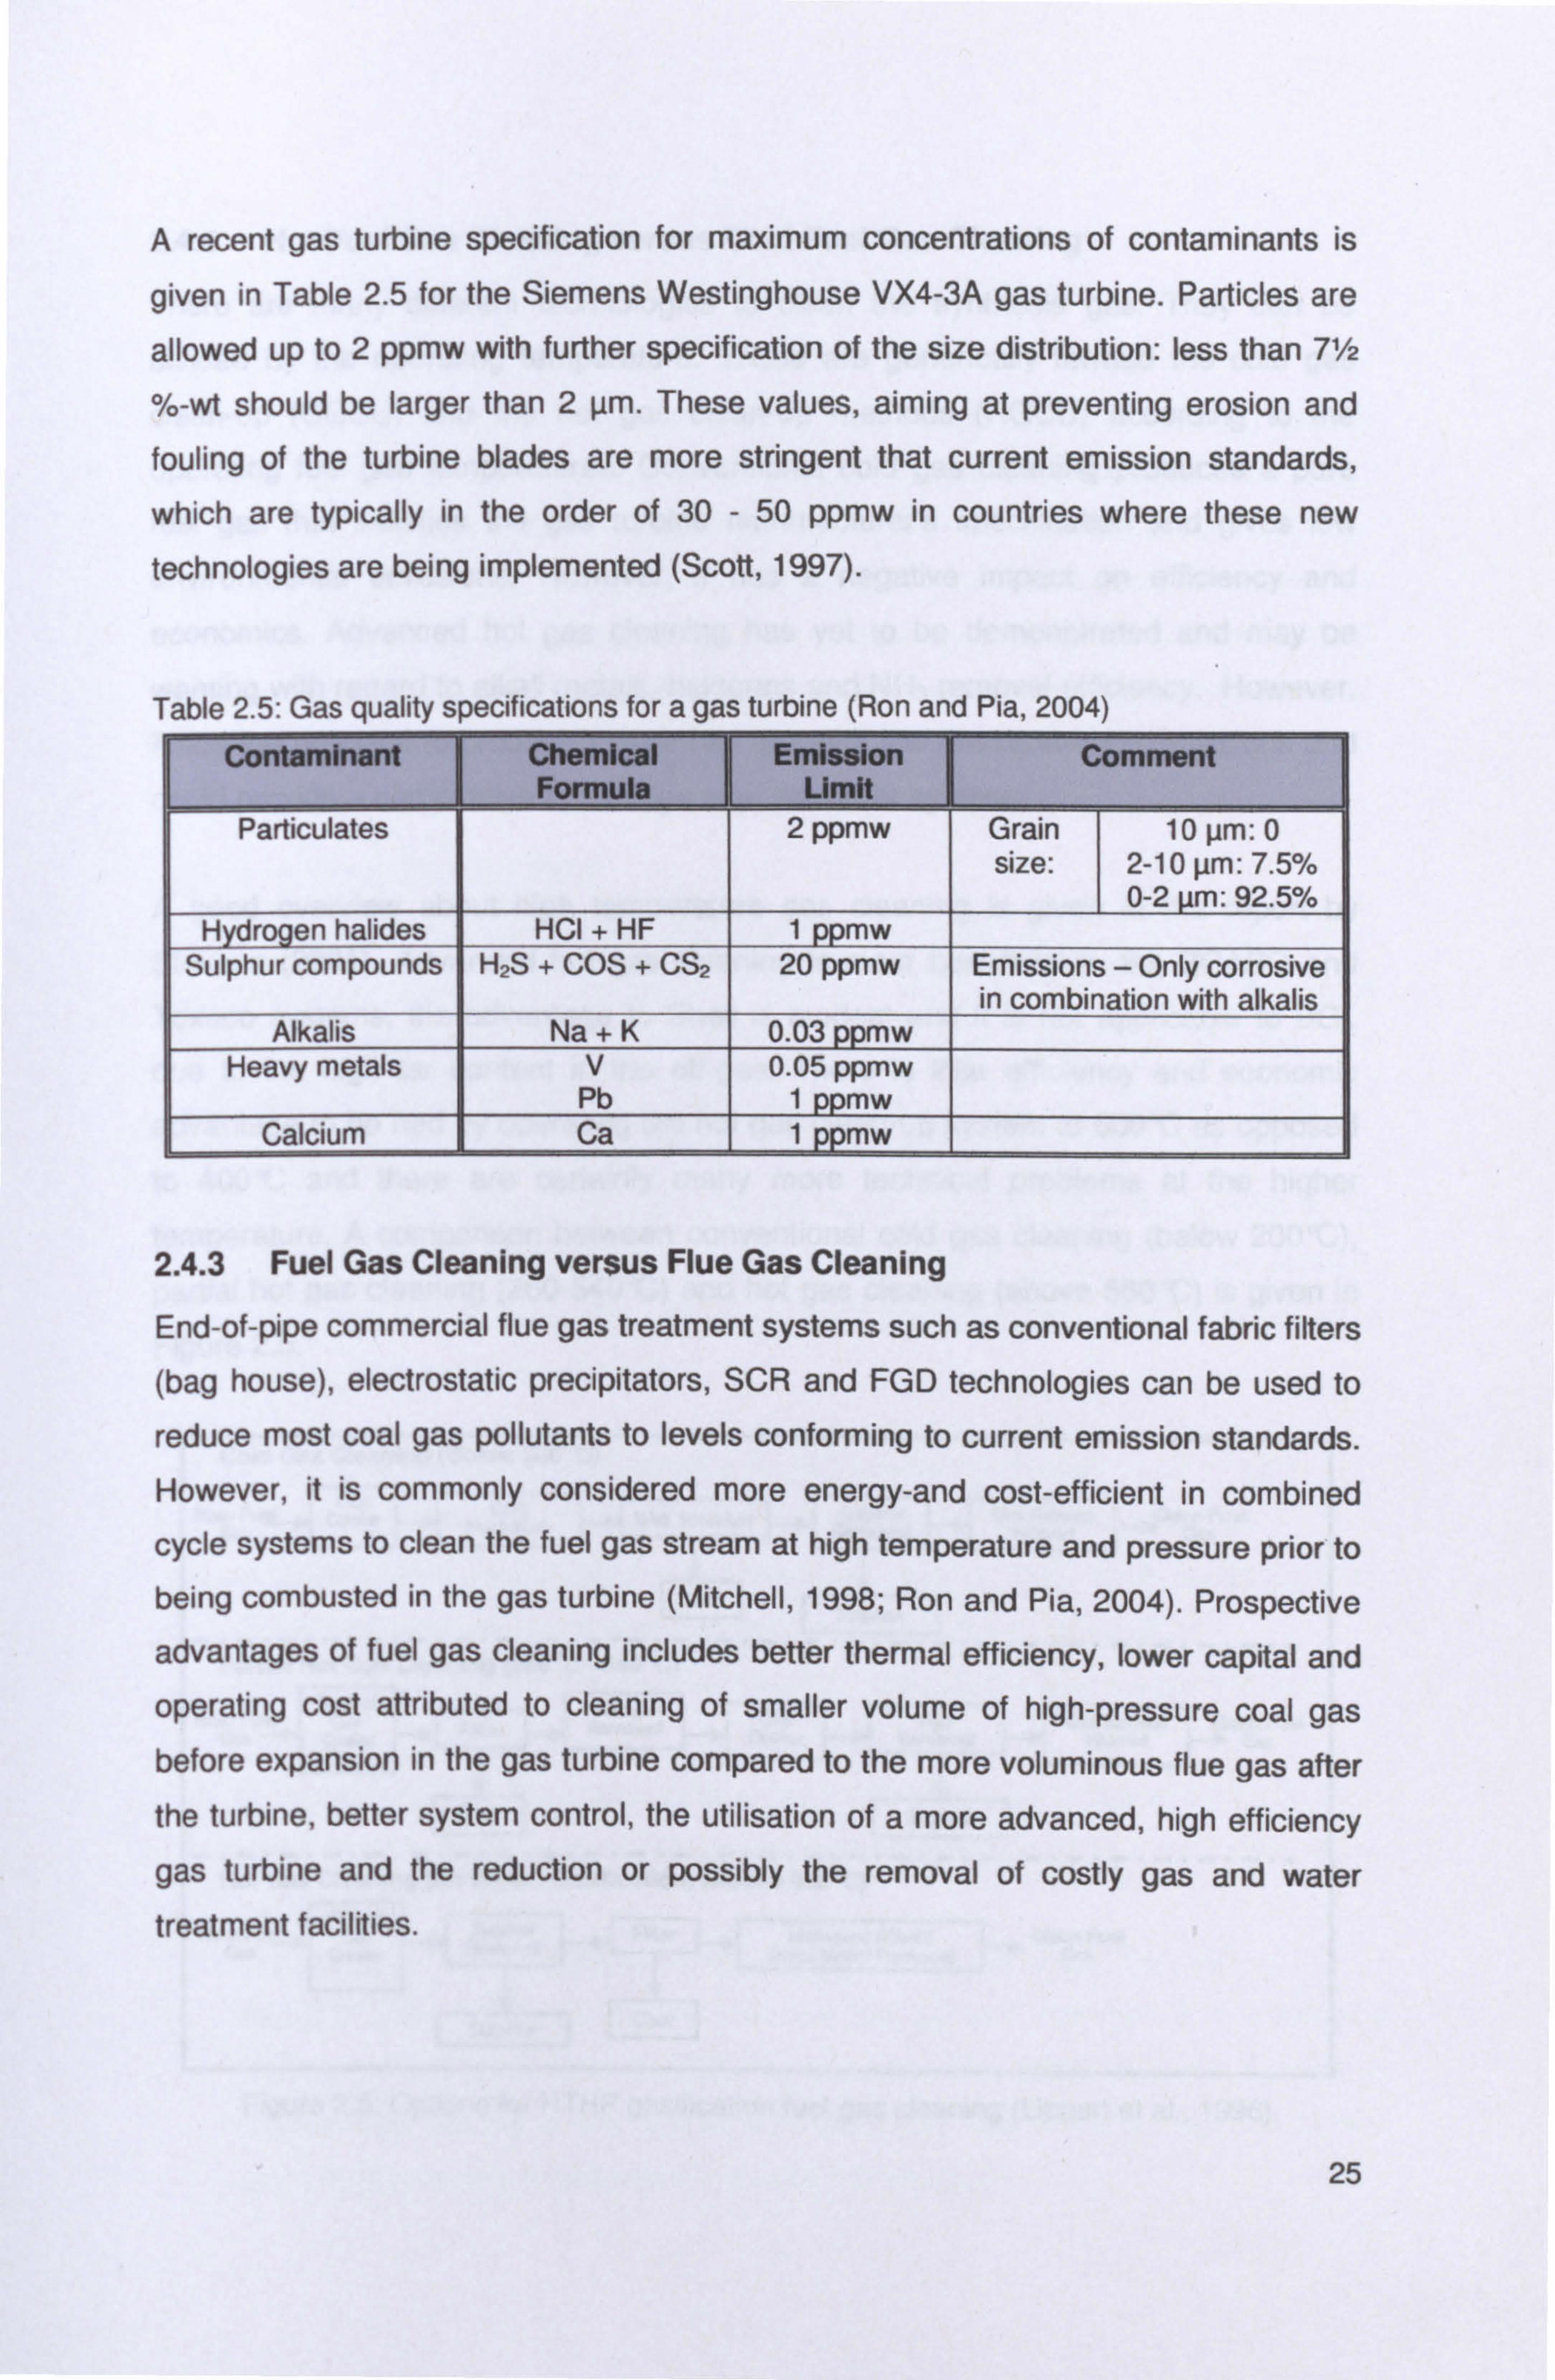
A recent gas turbine specification for maximum concentrations of contaminants is
given in Table 2.5 for the Siemens Westinghouse VX4-3A gas turbine. Particles are
allowed up to 2 ppmw with further specification of the size distribution: less than 71/2
%-wt should be larger than 2 µm. These values, aiming at preventing erosion and
fouling of the turbine blades are more stringent that current emission standards,
which are typically in the order of 30 - 50 ppmw in countries where these new
technologies are being implemented (Scott, 1997).
Table 2.5 Gas quality specifications for a gas turbine (Ron and Pia, 2004)
Contaminant Chemical Emission Comment Formula Limit
Particulates 2 ppmw Grain 10 pm: 0 size: 2-10 pm: 7.5%
0-2 m: 92.5% Hydrogen halides HCI + HF 1 mw
Sulphur compounds H2S + COS + CS2 20 ppmw Emissions - Only corrosive in combination with alkalis
Alkalis Na +K 0.03 mw Heavy metals V 0.05 ppmw
Pb 1 mw Calcium Ca 1 mw
2.4.3 Fuel Gas Cleaning versus Flue Gas Cleaning
End-of-pipe commercial flue gas treatment systems such as conventional fabric filters
(bag house), electrostatic precipitators, SCR and FGD technologies can be used to
reduce most coal gas pollutants to levels conforming to current emission standards. However, it is commonly considered more energy-and cost-efficient in combined cycle systems to clean the fuel gas stream at high temperature and pressure prior to being combusted in the gas turbine (Mitchell, 1998; Ron and Pia, 2004). Prospective
advantages of fuel gas cleaning includes better thermal efficiency, lower capital and operating cost attributed to cleaning of smaller volume of high-pressure coal gas before expansion in the gas turbine compared to the more voluminous flue gas after the turbine, better system control, the utilisation of a more advanced, high efficiency gas turbine and the reduction or possibly the removal of costly gas and water treatment facilities.
25
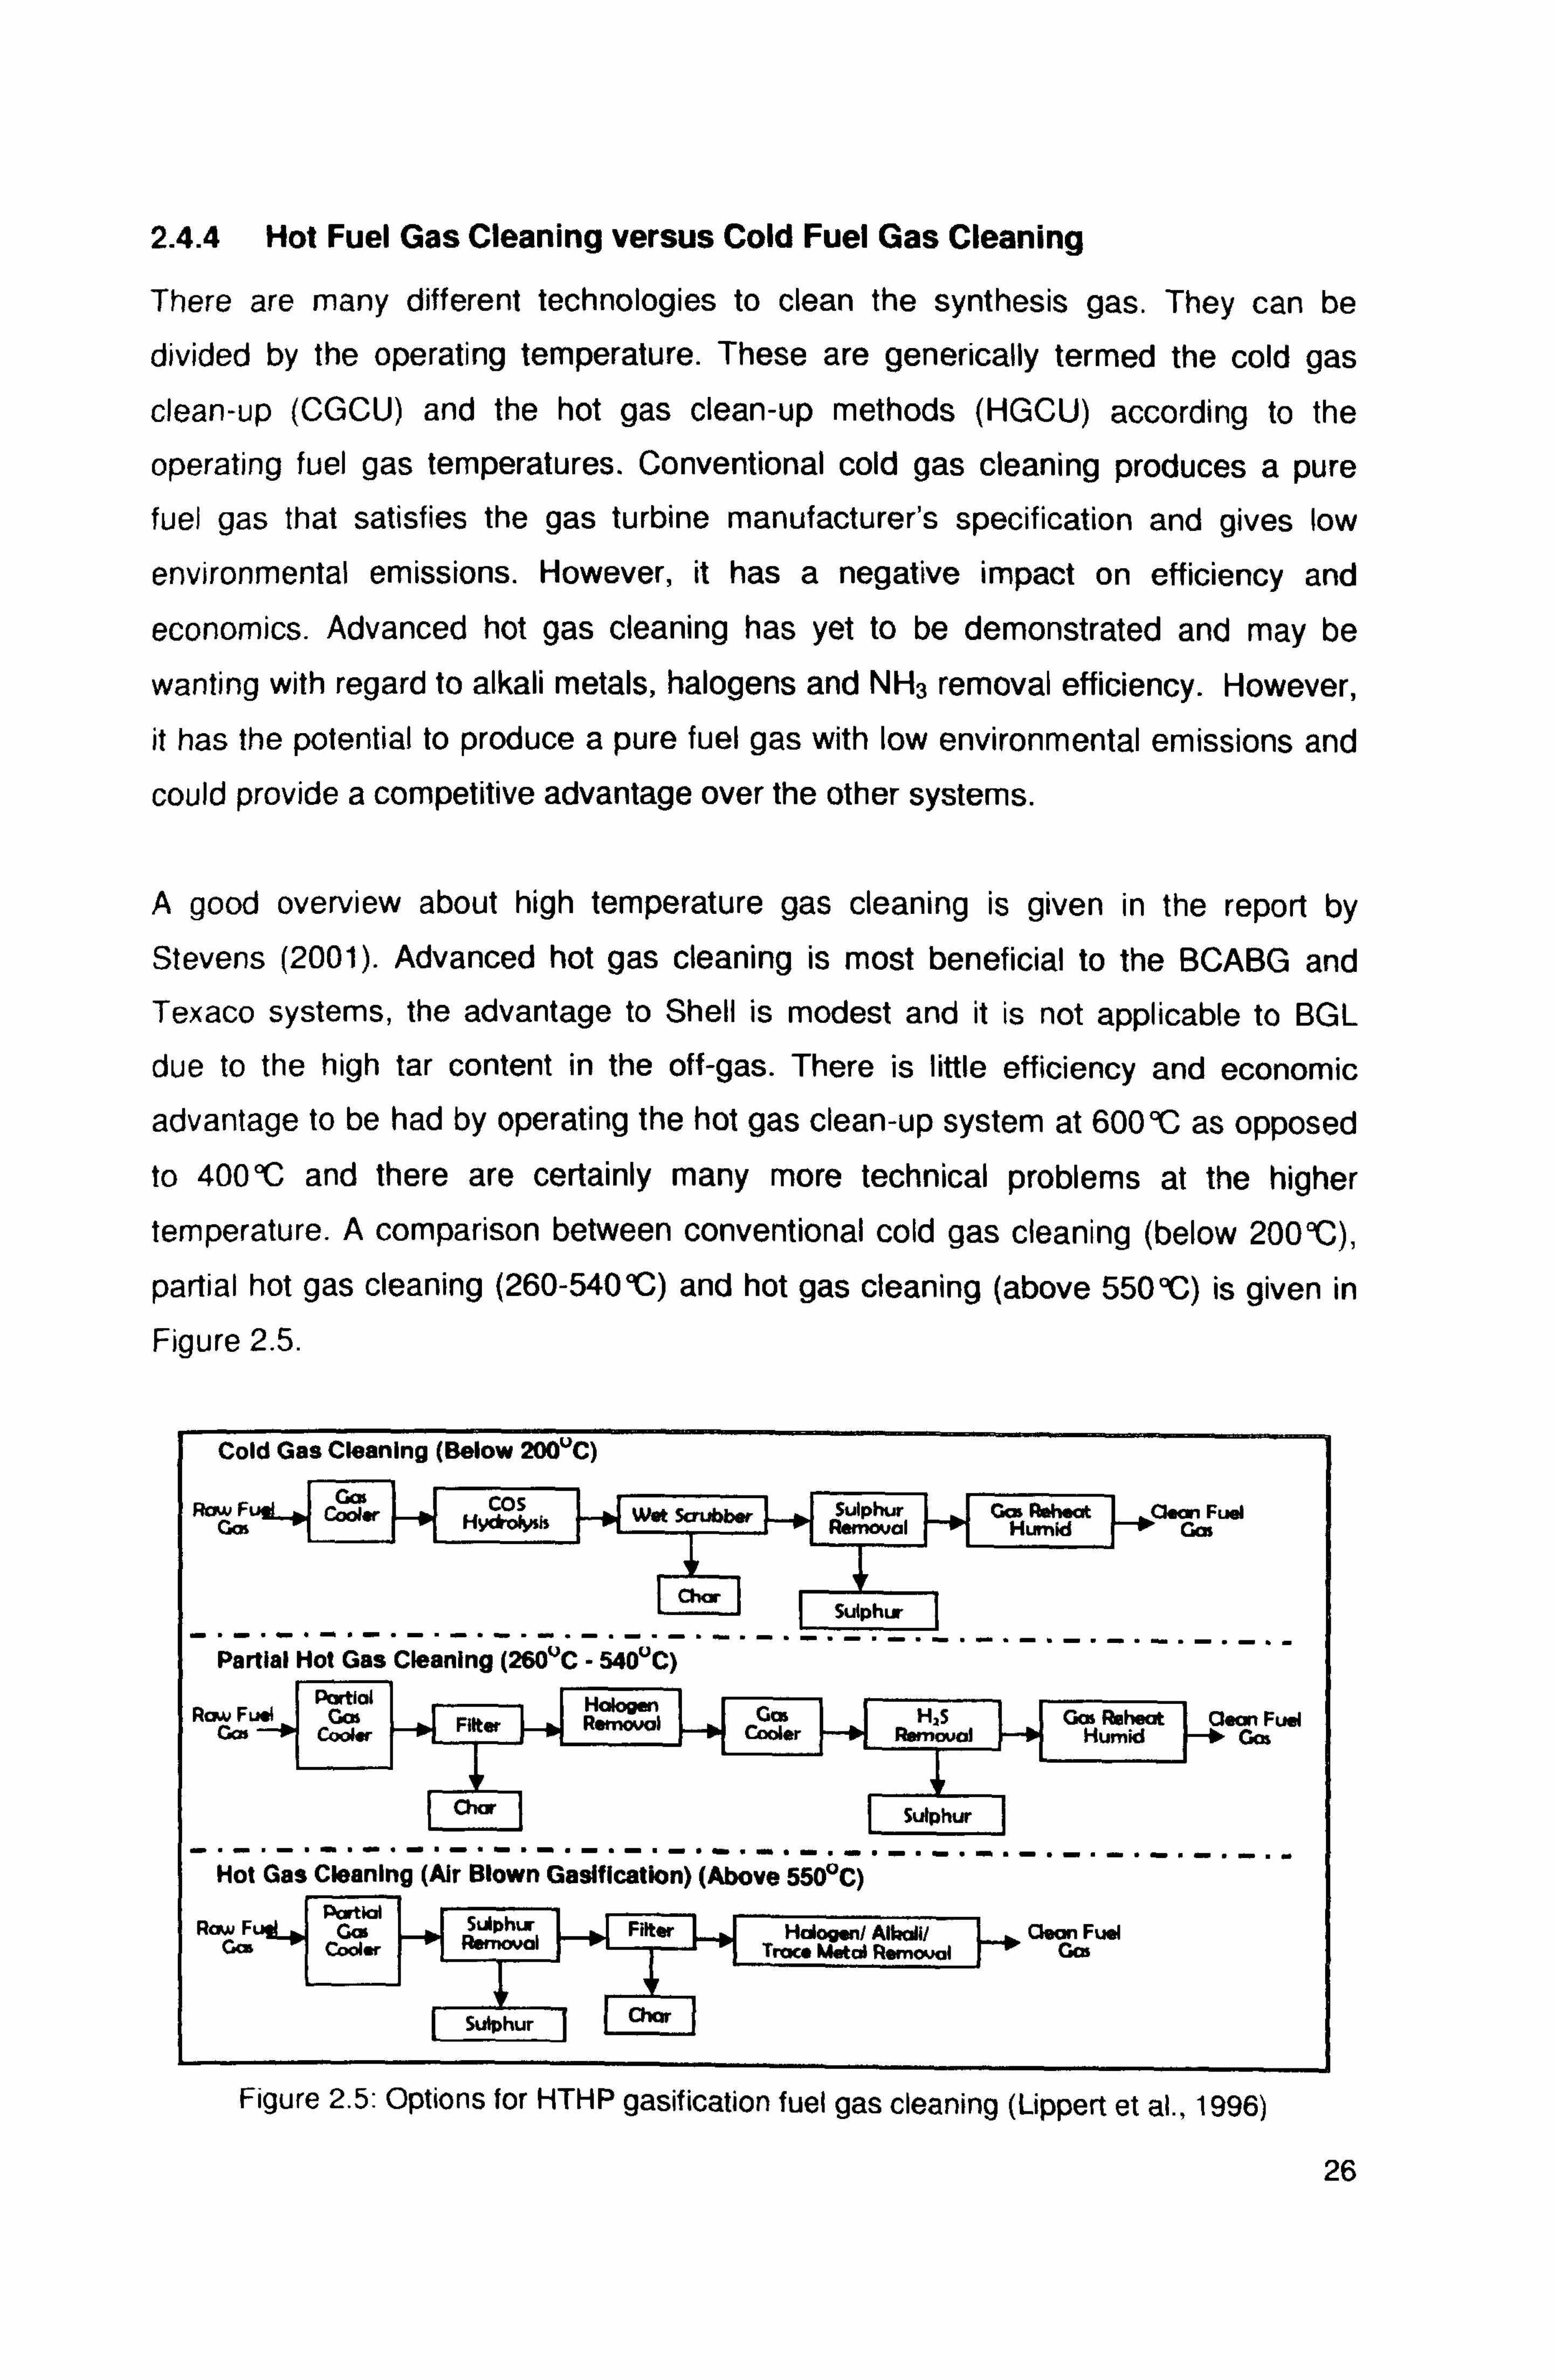
2.4.4 Hot Fuel Gas Cleaning versus Cold Fuel Gas Cleaning
There are many different technologies to clean the synthesis gas. They can be
divided by the operating temperature. These are generically termed the cold gas
clean-up (CGCU) and the hot gas clean-up methods (HGCU) according to the
operating fuel gas temperatures. Conventional cold gas cleaning produces a pure fuel gas that satisfies the gas turbine manufacturer's specification and gives low
environmental emissions. However, it has a negative impact on efficiency and
economics. Advanced hot gas cleaning has yet to be demonstrated and may be
wanting with regard to alkali metals, halogens and NH3 removal efficiency. However,
it has the potential to produce a pure fuel gas with low environmental emissions and
could provide a competitive advantage over the other systems.
A good overview about high temperature gas cleaning is given in the report by
Stevens (2001). Advanced hot gas cleaning is most beneficial to the BCABG and Texaco systems, the advantage to Shell is modest and it is not applicable to BGL
due to the high tar content in the off-gas. There is little efficiency and economic
advantage to be had by operating the hot gas clean-up system at 600°C as opposed
to 400°C and there are certainly many more technical problems at the higher
temperature. A comparison between conventional cold gas cleaning (below 200°C),
partial hot gas cleaning (260-5404C) and hot gas cleaning (above 550°C) is given in
Figure 2.5.
Cold Gas Cleaning (Below 200°C) [Raw
F COS Wet Scrubber Sulphur Gas Reheat paar Fuel Hyddysh Removal Humid Gas
I Cl. J sutpht.
Partial Hot Gas Cleaning (260°C 540°C) '_. _. _. _. _. _. _. -----
Partlol Row Fuel GM Hoiow Gas H, S Gas Reheat Clew Fuel
Gm Cooler Filter Removal Cooler Removal Humid Gas
°tL Sulphur
Hot Gas Cleaning (Air Blown Gasification) (Above 550°C) ..
Raw F Sulphur Gm Cdar Removal
Filter Trac* MMetd/ Rem
ioval Gas
Sulphur r
Figure 2.5: Options for HTHP gasification fuel gas cleaning (Lippert et al., 1996)
26
2.5 Identification and Characterisation of Air Pollutant Criteria
A range of pollutants are generated from coal-fired and coal co-fired power
generating plants and some are more specific to a particular technology. Historically,
attention has focused mainly on controlling emissions of SO2, NOX and particulates.
Numerous systems have been developed and applied for their control. Some control
specifically one type of pollutant, whereas others may integrate several control
systems, thus allowing for the control of two or more pollutants (e. g. combinations of
SO2, NOx and particulates) (lEA, 2003).
2.5.1 Sulphur Dioxide (SO2)
During high-temperature gasification of coal (or other solid fuels), most of the sulphur
constituent is released and converted to hydrogen sulphide (H2S), as well as a small
amount of carbonyl sulphide (COS), due to the reduced oxygen environment. The
concentration levels of these so called acid gases, in the raw syngas exiting the
gasifier, are almost entirely dependent on the levels of sulphur in the solid fuel (e. g.,
coal) (Pahl, 1983). These H2S and COS are mostly removed from the syngas in the
acid gas removal equipment prior to combustion or other forms of fuel conversion.
There are inherent advantages in removing syngas contaminants prior to utilisation of
the syngas. These advantages are:
* Removal prevents potential damage to the conversion devices, such as gas turbines, that result from contamination, corrosion, or erosion of materials;
* Relatively high concentration of H2S in syngas, versus much lower concentration
that would be found in the combustion flue gas, improves removal;
* High-pressure gasifier operation significantly reduces the gas volume requiring treatment; Conversion of H2S into elemental sulphur (or sulphuric acid) is technically much
easier and more economical than capture and conversion of SO2 into saleable by-
products; and
The acid gas removal equipment extracts from 95% to greater than 99% of the
H2S and COS, once hydrolysed, from the fuel gas and converts it to a saleable
sulphur or sulphuric acid (H2SO4) by-product. The small amount of residual
sulphur that remains in the syngas is converted to SO2 in the combustion turbine
and released to the atmosphere in the HRSG stack gas. 27

Other secondary sources of SO2 emissions in an IGCC plant will typically include the
sulphur recovery system's tail gas incinerator stack, auxiliary boilers (if applicable),
and the syngas flare during gasifier start-up and system upset conditions. These
secondary SO2 sources are typically significantly smaller than the HRSG stack
emissions.
2.5.2 Nitrogen Oxide (NO, )
The term "NOX" refers to the sum of the nitric oxide (NO) and nitrogen dioxide (NO2)
emissions from a combustion source. While most of the NO, produced during the
combustion of syngas is in the form of NO, it is subsequently oxidised to NO2 in the
atmosphere. NOx is formed in fossil combustion systems by two primary
mechanisms. "Fuel NO" is formed via the oxidation of chemically-bound nitrogen in
the fuel, and "thermal NO" is formed via the dissociation of molecular nitrogen and
oxygen to their atomic forms (at high temperatures) and subsequent recombination
into oxides of nitrogen. Unlike natural gas, coal contains chemically-bound nitrogen
that forms most of the NOX emissions when it is fired in a typical excess-oxygen
environment, such as a utility boiler.
Fuel NO typically contributes over 80% of the total NO, emissions in a coal-fired
combustion unit, and its formation is highly insensitive to the flame temperature.
Generally, thermal NO, increases exponentially with increases in flame temperature
and linearly with increases in residence time. The gasification process differs
significantly from combustion with respect to the impact of chemically bound nitrogen
in solid fuels, like coal. Gasification, because it operates with a deficiency of oxygen,
converts most of the fuel nitrogen into harmless nitrogen gas (N2). While a small
portion is converted to ammonia (NH3) and hydrogen cyanide (HCN), these water
soluble species are removed during fuel gas cooling and cleaning and are usually
converted to nitrogen in the sulphur recovery process. Therefore, the syngas
produced is virtually free of fuel bound nitrogen, and NOX formation is primarily the
result of thermal NO produced at the high temperatures in the turbine combustor.
The following relationships exist between turbine combustor operating conditions and
thermal NO,, production:
NO, increases strongly with fuel-to-air ratio or with firing temperature
NO, increases exponentially with combustor inlet air temperature
28

* NO, increases with the square root of the combustor inlet pressure NOX increases
with increasing residence time in the flame zone
NO, decreases ex-potentially with increasing water or steam injection or increasing specific humidity.
Therefore, by maintaining a low fuel-air ratio and adding a diluent (e. g., nitrogen from
the air separation unit or steam from the steam turbine), the flame temperature can
be lowered to significantly reduce thermal NO, formation. The gas turbines installed
in commercially operated IGCC plants have made use of this combustion based
control method to minimise NO, emissions.
2.5.3 Particulate Matter (PM)
While ash is released from the solid fuel during the gasification process, most
gasifiers release only a small portion as fly ash that becomes entrained with syngas. Not only does the gasification process provide an inherent capability to remove most
ash as slag or bottom ash, but the fly ash that is produced is concentrated in a
relatively small gas volume relative to solid fuel combustion processes, which further
assists its cost-effective collection. Both the Polk and Wabash River plants use a wet
scrubber to efficiently capture fine particulates that are entrained in the syngas.
Additional particulate removal occurs in the gas cooling operations and in the acid
gas removal systems. As a result, very low particulate emission levels are achieved. Other particulate matter emission sources include:
The sulphur recovery system tail gas incinerator;
The flare system used during cold start-up, shutdown, and during upset
conditions, when the combustion turbine may be unavailable; Mineral matter in the spray from the cooling towers (if applicable); and Coal and ash/slag handling and storage operations.
29
2.6 Summary: Future of Hot Fuel Gas Cleaning
The future of gasification is clearly impacted by changes in government policy.
Continuing convergence of oil, gas, and electric power marketing with deregulation
improves the potential for gasification. Increasing interest in improved energy
efficiency, reduced emissions, and increased recycle of wastes also helps
gasification. Electric power generation is the key market for gasification. Demand for
electricity is growing at a rate twice that of other end-use energy forms such as
natural gas and transportation fuels. Gasification will become more competitive in the
long term as the current dominance of NGCC will lessen as natural gas prices
increase. Gasification enables all feedstock to meet the same emission levels as
NGCC. Current pitch and petcoke gasification is a bridge to long-term coal
gasification. Technical trends, which help gasification, include improving gas turbines
and polygeneration. Each increase in combined-cycle efficiency directly reduces the
size and cost of the gasification facility required to fire the combined cycle. Advanced
intercooled, recuperated, reheat gas turbines have the potential of power-to-
cogeneration heat ratio that is an order of magnitude higher than possible with steam
turbines. Polygeneration is unique to gasification, and with deregulation this concept
will develop.
Gasification has strategic emission, efficiency, and economic flexibility for the future.
This research intends to investigate and demonstrate the hot gas cleanup option for
use in an integrated gasification combined cycle process. The goal is not to simply
meet current environmental emission standards with respects to contaminants gases
and particulate emissions, but also to adequately protect high-efficiency gas turbines
and to control contaminants and particulate emissions at a sufficient low level to meet
more stringent regulatory requirements anticipated in the future. Hot gas cleanup is
still under development and may not be available for commercial application
immediately. Summing up, hot gas cleaning will continue to play a major role in the
development of coal-based combined cycle power generation systems in the
foreseeable future. This research will contribute to how coal will continue to make a
major contribution to global energy supply in the 21s' century. Not only will the huge
reserve base of coal be needed, but technological advancement can ensure coal is
part of a cleaner energy future.
30
CHAPTER THREE
Review of Existing High Temperature Gas Cleaning Technologies
Gas cleaning systems for gasification-based power generation are needed to remove
dust, S-species, N-species (e. g. ammonia, cyanides, etc), halides and trace metals from
the gasifier fuel gases prior to their passage through the gas turbine and their
subsequent release. Conventional technologies to remove these pollutants are based on
wet gas cleaning systems, which have an adverse effect on cycle efficiency. The
development and introduction of HGCU technologies offers the potential of a lower cost
approach to pollutant control, leading to simpler cycle configurations with associated
efficiency advantages. This chapter reviews the available technologies for hot gas
desulphurisation and particulate clean-up. Emphasis is therefore given to the status of
regenerable metal oxide sorbents for the removal of hydrogen sulphide from fuel gas
under reducing conditions. This is followed by review on the various particulate control
technologies available and their potential for high temperature gas cleaning. The final
part of this chapter examines previous work on hot gas cleaning using liquid metals
which culminates with the proposed molten tin based fuel gas cleaning system that is of
interest in this research work.
3.1 Techniques and Development of Particulate Control in Hot Gas Clean-Up
3.1.1 Particulate Cleaning Technology
As part of the recent interest in new coal conversion techniques, there is an increased
interest in particulate removal at high temperature and high pressure (HTHP), for hot
gas cleaning. The main reasons for considering gas cleaning at HTHP conditions are:
Energy recovery from the gas stream (before use or emission), in particular:
In combined cycle applications involving a turbine where the turbine has to be
protected from erosion and corrosion, further:
ýa The smaller volume of gas cleaning equipment operating at high pressure may be
advantageous. 31

Particulates are defined here as solid-phase materials entrained in the raw product gas
stream as it exits the gasifier (Stevens, 2001). There are several major types of control
devices for removing particulate matter from exhaust gases before the gases are
emitted into the atmosphere. These include cyclones, wet scrubbers, electrostatic
precipitators, and baghouses. In recent years, such steps have been taken in many
industries. Nevertheless, no process can be made 100% efficient, and so there will
always be some air pollution emissions that must be controlled. The technological and
commercial status of hot gas particulate cleaning technology have been extensively
reviewed and discussed by Chang (2003); Ron and Pia (2004), Seville (1996,1997) and
Mitchell (1997).
3.1.1.1 Ceramic (Rigid) Barrier Filters
Ceramic barrier filters are the most advanced hot gas filtration technology system with
several systems going to commercialisation. They boast of high dust collection
efficiencies with only low pressure and temperature drops across the system (Chang,
2003), and the filtration efficiency is "usually extremely close to 100%" (Seville, 1997)
with the exception of substantially submicron dust or large filter medium granule or fibre
size. They provide a potential opportunity to produce a clean fuel gas while retaining the
sensible heat of the fuel gas. Stevens (2001) reported that these filters effectively
remove small-diameter particulates in range or 0.5 to 100 µm in diameter from the gas
stream. It can be designed to remove almost any size of particulates, including those in
the sub-micron range, but the pressure differential across the filter will increase as the
pore size decreases.
As a result, there are technical and economic constraints which effectively limit
particulate removal to about 0.5 pm in systems such as gasifiers that must handle large
gas volumes. Factors that limit the life of ceramic filter include reaction of alkali vapour
and/or steam with the amorphous binder phase, oxidation of non-oxide based ceramics,
as well as degradation due to thermal and mechanical shocks. Typical failures that have
occurred during operation include broken filter elements, deformed filters, reduced
permeability due to plugging of ceramic matrix pores by ash, and thermal degradation of
the ceramic binder (Huque et al., 1996). Other problems are formation of strongly bonded ash deposits and bridging of ash between candles and hot metal structures.
32
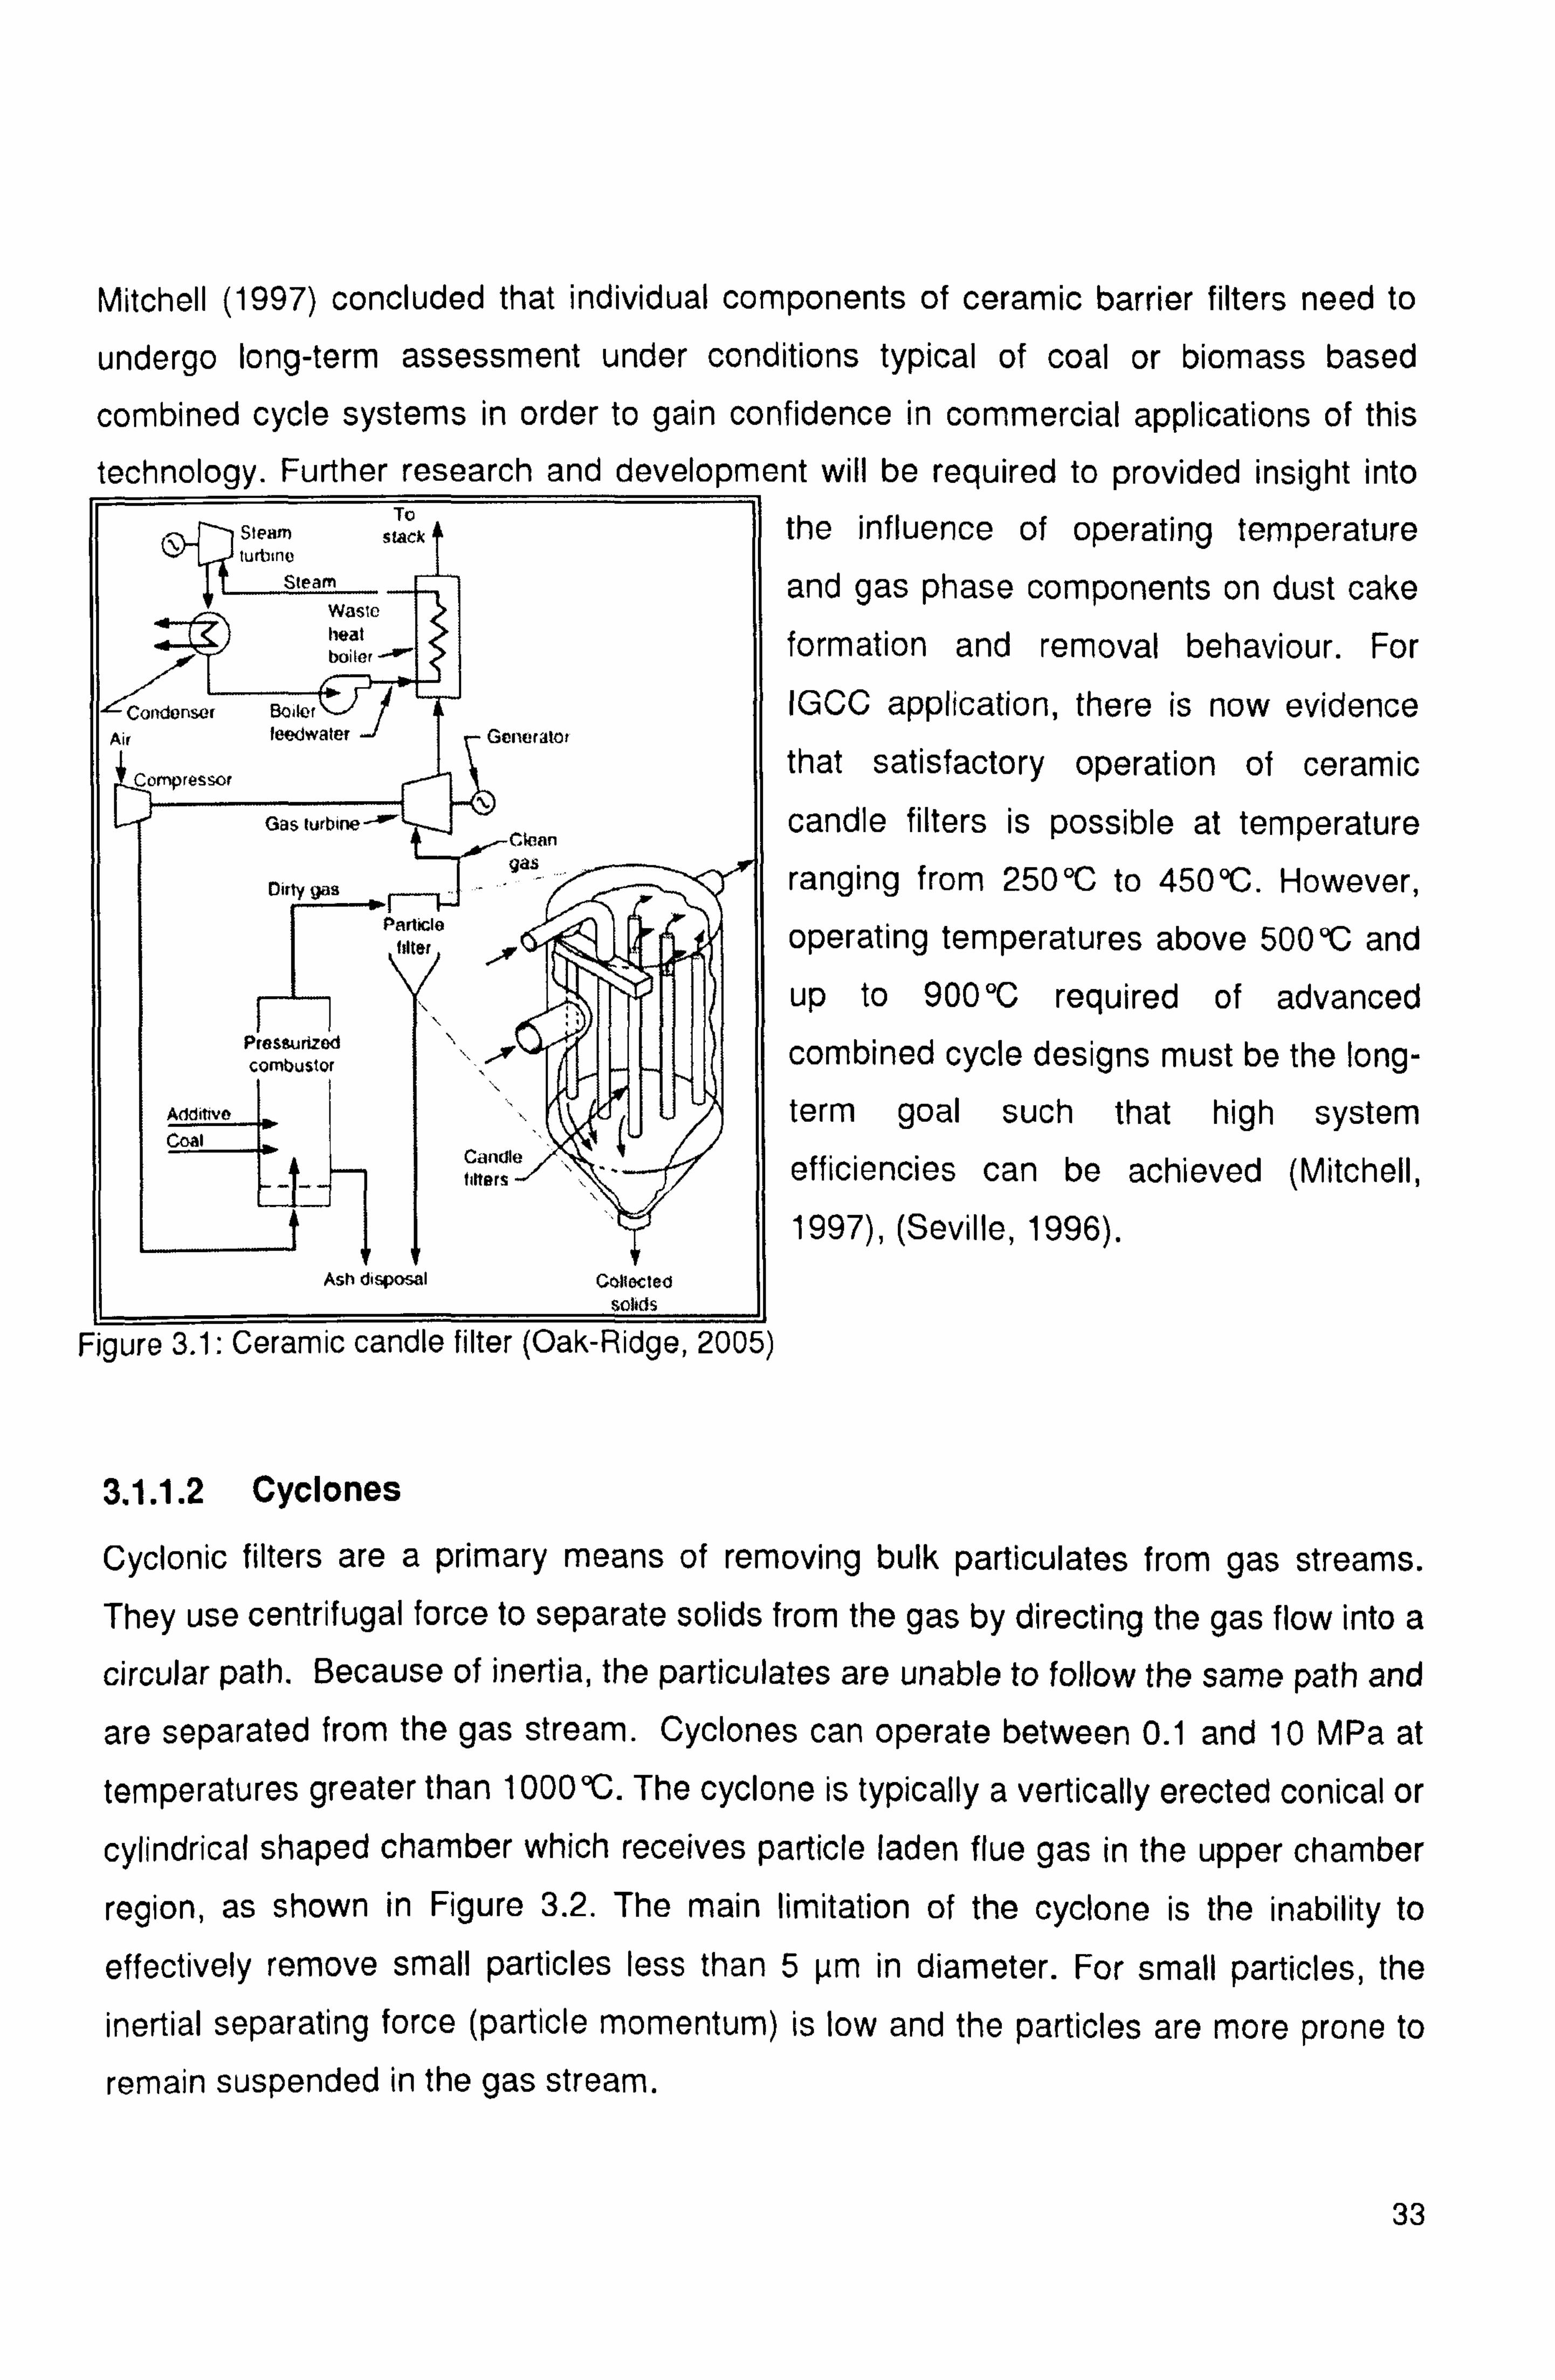
Mitchell (1997) concluded that individual components of ceramic barrier filters need to
undergo long-term assessment under conditions typical of coal or biomass based
combined cycle systems in order to gain confidence in commercial applications of this
technology. Further research and development will be required to provided insight into
I, -:: - Condensor Boiler
Air teedWatet -/ r Generator
Gas turbine-' Clean gas
Dirty gas _, ....
filter 4
r
Pressurized combustor
Candle titters
t
Ash disposal Collected
the influence of operating temperature
and gas phase components on dust cake formation and removal behaviour. For
IGCC application, there is now evidence that satisfactory operation of ceramic
candle filters is possible at temperature
ranging from 250°C to 450°C. However,
operating temperatures above 500°C and
up to 900 °C required of advanced
combined cycle designs must be the long-
term goal such that high system
efficiencies can be achieved (Mitchell,
1997), (Seville, 1996).
rigure s. i: Leidimu canuia inter tvdr-niuye, euuO)
3.1.1.2 Cyclones
Cyclonic filters are a primary means of removing bulk particulates from gas streams. They use centrifugal force to separate solids from the gas by directing the gas flow into a
circular path. Because of inertia, the particulates are unable to follow the same path and
are separated from the gas stream. Cyclones can operate between 0.1 and 10 MPa at
temperatures greater than 1000°C. The cyclone is typically a vertically erected conical or
cylindrical shaped chamber which receives particle laden flue gas in the upper chamber
region, as shown in Figure 3.2. The main limitation of the cyclone is the inability to
effectively remove small particles less than 5 pm in diameter. For small particles, the
inertial separating force (particle momentum) is low and the particles are more prone to
remain suspended in the gas stream.
33

Cyclone performance is affected by gas flow rate, since this affects the swirling velocity in the cyclone. Cyclone efficiency is relatively insensitive to dust loading, and in fact, the
efficiency can increase with higher loading due to particle interactions. Efficiency
increases with particle size, typically ranging from 5% for
0.5 pm particles to 50% for 3 pm particles. The cyclone
efficiency increases with particles size, density and gas
velocity, but decreases with increasing gas velocity and
cyclone diameter, hence it is unlikely to improve at high
temperatures and pressures (Clift, 1997); (Mitchell, 1997).
A number of novel cyclone designs have been developed,
however they have not been widely accepted because
despite being more costly and complex, their efficiency is
not higher than that of a well-designed conventional
cyclones (Seville, 1996)
Figure
3.1.1.3 Electrostatic Precipitators
Electrostatic precipitator (ESP) filters have also been used extensively in a variety of gas
cleaning operations (Noll and Peter-Castle, 1995), typically operated at atmospheric
pressure and temperatures ranging from 120 to 450°C, capable for collecting fine
particles (less than 2 p. m) with high collection efficiencies in excess of 99.5%. ESP are
available in a variety of designs and can operate in a dry or wet mode and in hot or cold
gas conditions (EPA, 1996). The particulates are charged and attracted to the earthed
electrode, separating them from the gas stream as shown in Figure 3.3. ESP efficiency increases with increasing plate area, increasing voltage and decreasing gas flow rate. Capture efficiency is dependent on specific collection area (SCA), operating voltage,
and particle characteristics. The main difficulty faced by ESPs in high temperature
operations is that the voltage difference between the corona onset and spark over (i. e.
when electrical field breaks down) has to be essentially maintained, but this difference
decreases with increasing temperatures. However, the voltage difference is increased at
higher pressures, indicating the possibility of high-temperature and high-pressure ESP
operation.
34
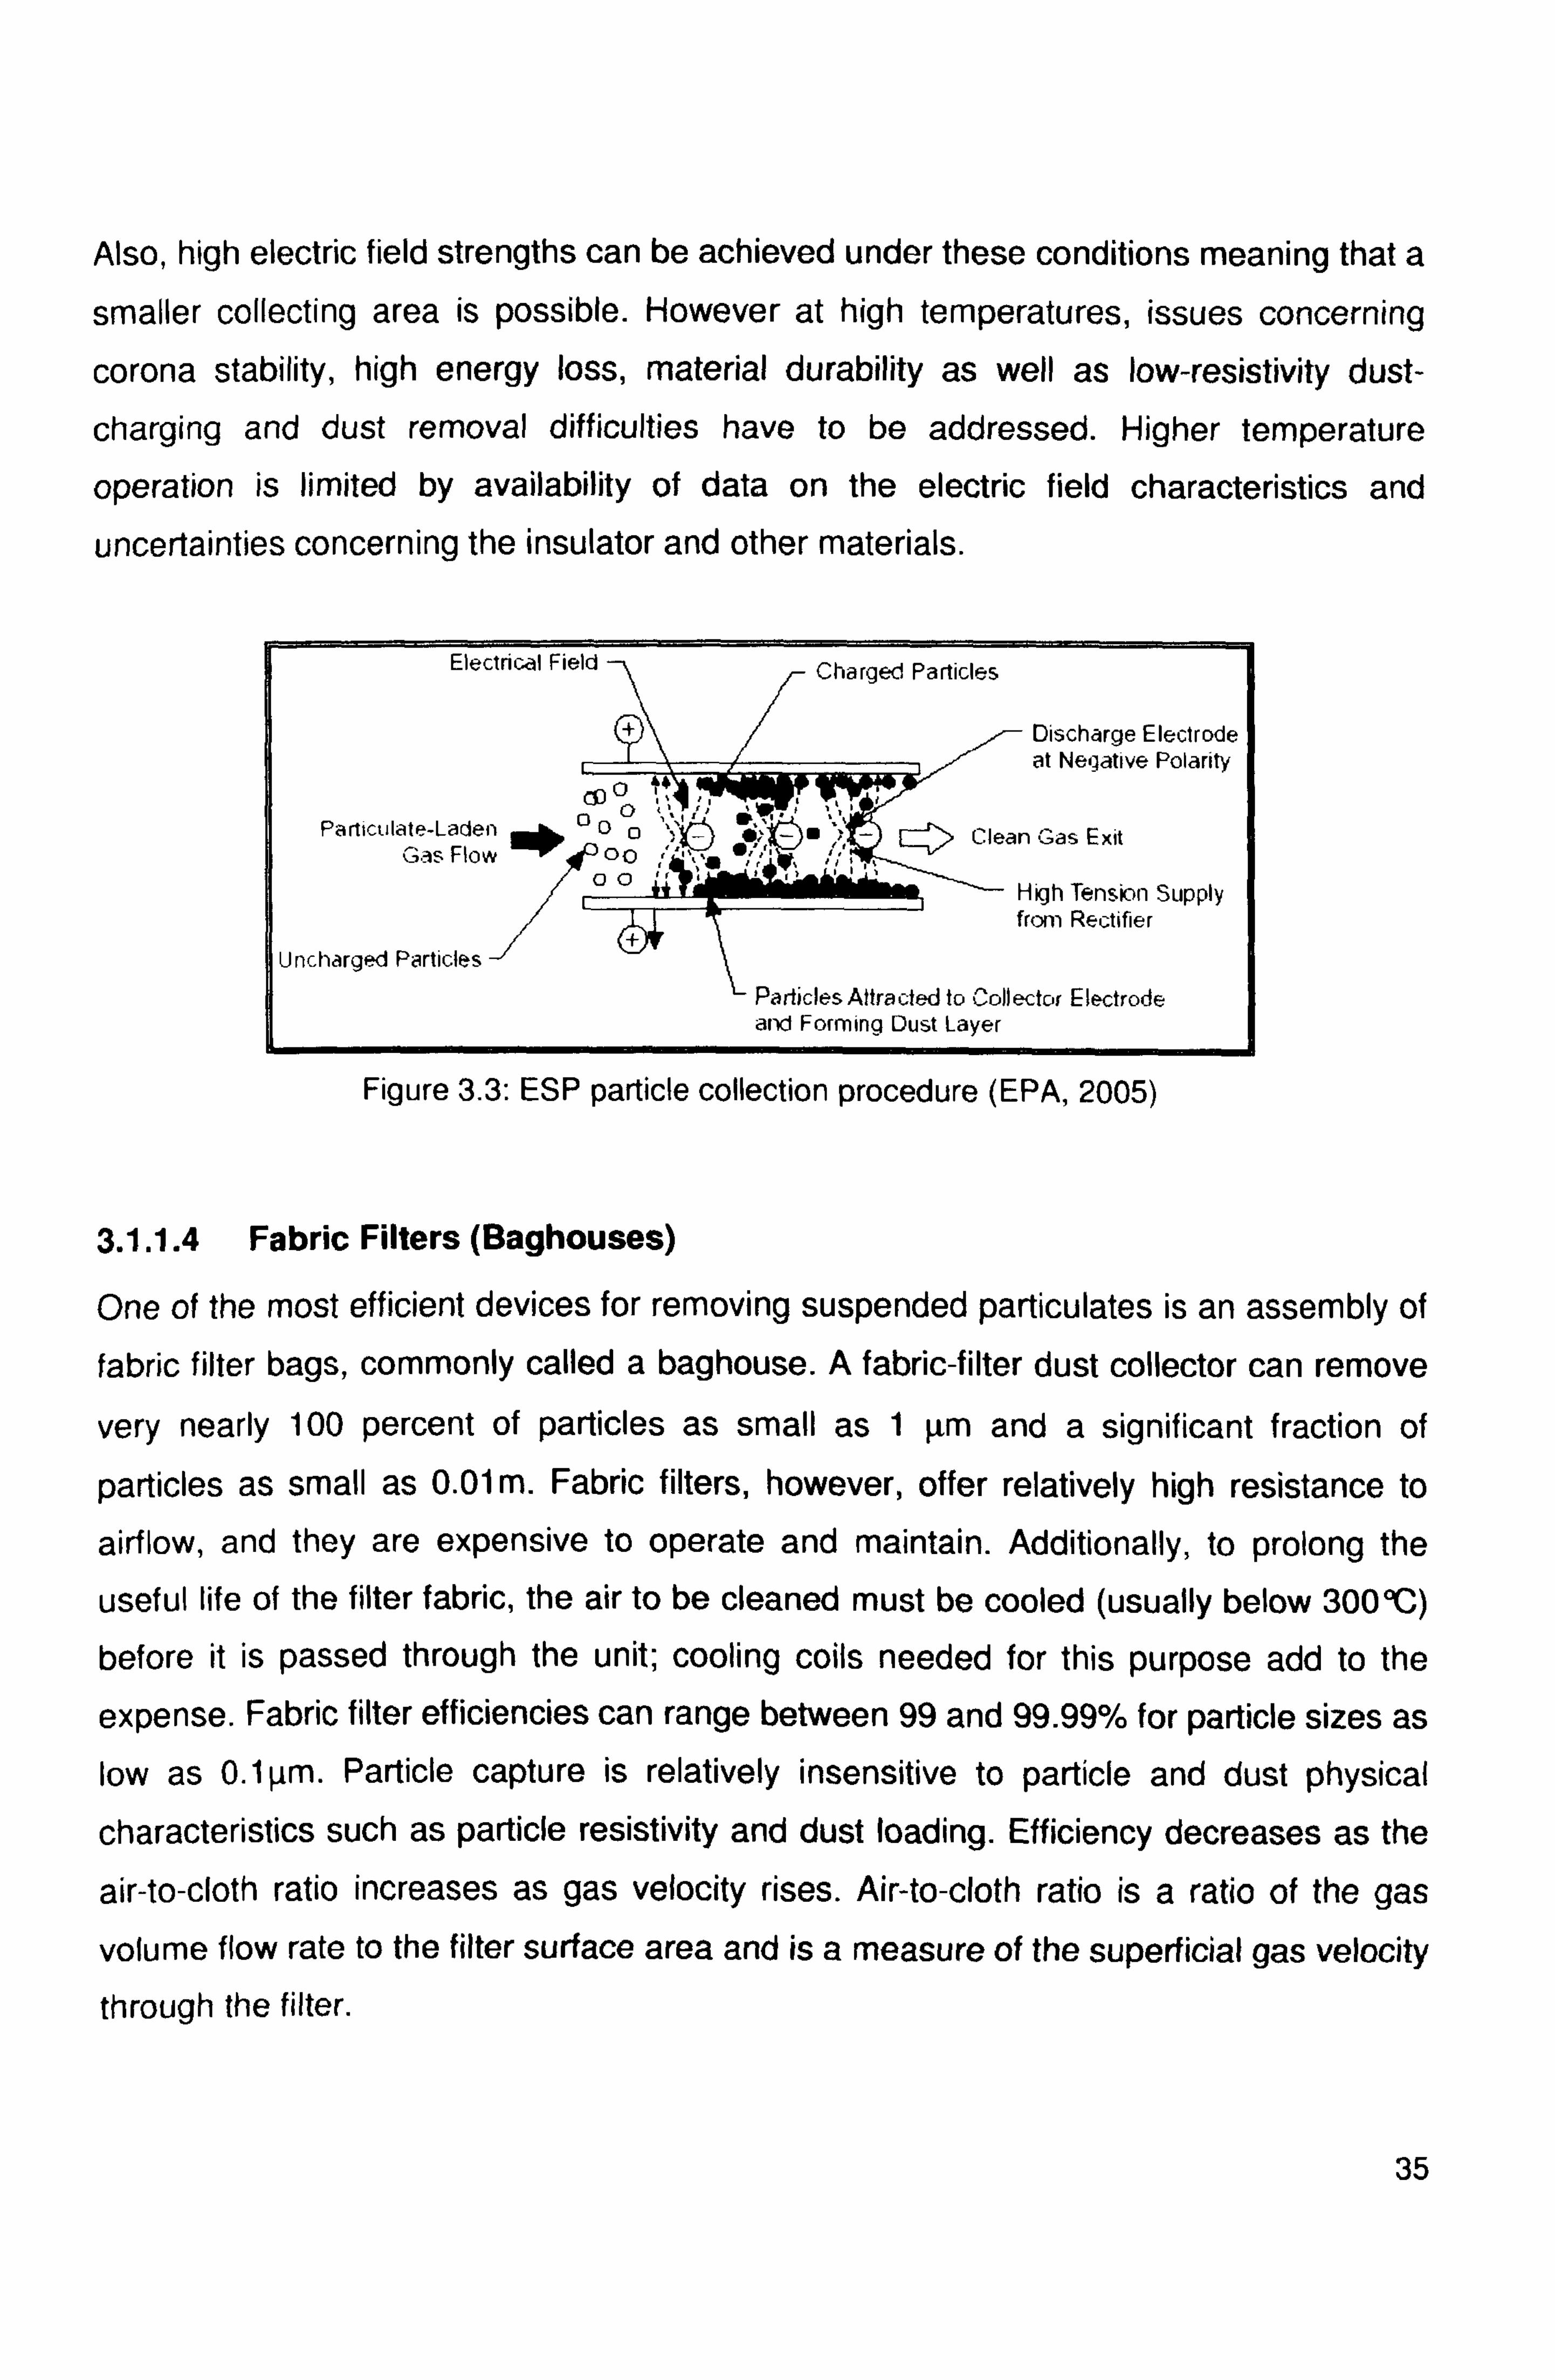
Also, high electric field strengths can be achieved under these conditions meaning that a
smaller collecting area is possible. However at high temperatures, issues concerning
corona stability, high energy loss, material durability as well as low-resistivity dust-
charging and dust removal difficulties have to be addressed. Higher temperature
operation is limited by availability of data on the electric field characteristics and
uncertainties concerning the insulator and other materials.
Electrical Field Charged Particles
Discharge Electrode at Negative Polarity
C5) C)
Particulate-Laden 00 0 o
Gas Fl w oo ;: ' >" Clean Gas Exit
o 00 High Tension Supply
from Rectifier
Uncharged Particles
Particles Attracted to Coll ector Electrode and Forming Dust Layer
Figure 3.3: ESP particle collection procedure (EPA, 2005)
3.1.1.4 Fabric Filters (Baghouses)
One of the most efficient devices for removing suspended particulates is an assembly of
fabric filter bags, commonly called a baghouse. A fabric-filter dust collector can remove
very nearly 100 percent of particles as small as 1 µm and a significant fraction of
particles as small as 0.01 m. Fabric filters, however, offer relatively high resistance to
airflow, and they are expensive to operate and maintain. Additionally, to prolong the
useful life of the filter fabric, the air to be cleaned must be cooled (usually below 300°'C)
before it is passed through the unit; cooling coils needed for this purpose add to the
expense. Fabric filter efficiencies can range between 99 and 99.99% for particle sizes as low as 0.1µm. Particle capture is relatively insensitive to particle and dust physical
characteristics such as particle resistivity and dust loading. Efficiency decreases as the
air-to-cloth ratio increases as gas velocity rises. Air-to-cloth ratio is a ratio of the gas
volume flow rate to the filter surface area and is a measure of the superficial gas velocity
through the filter.
35
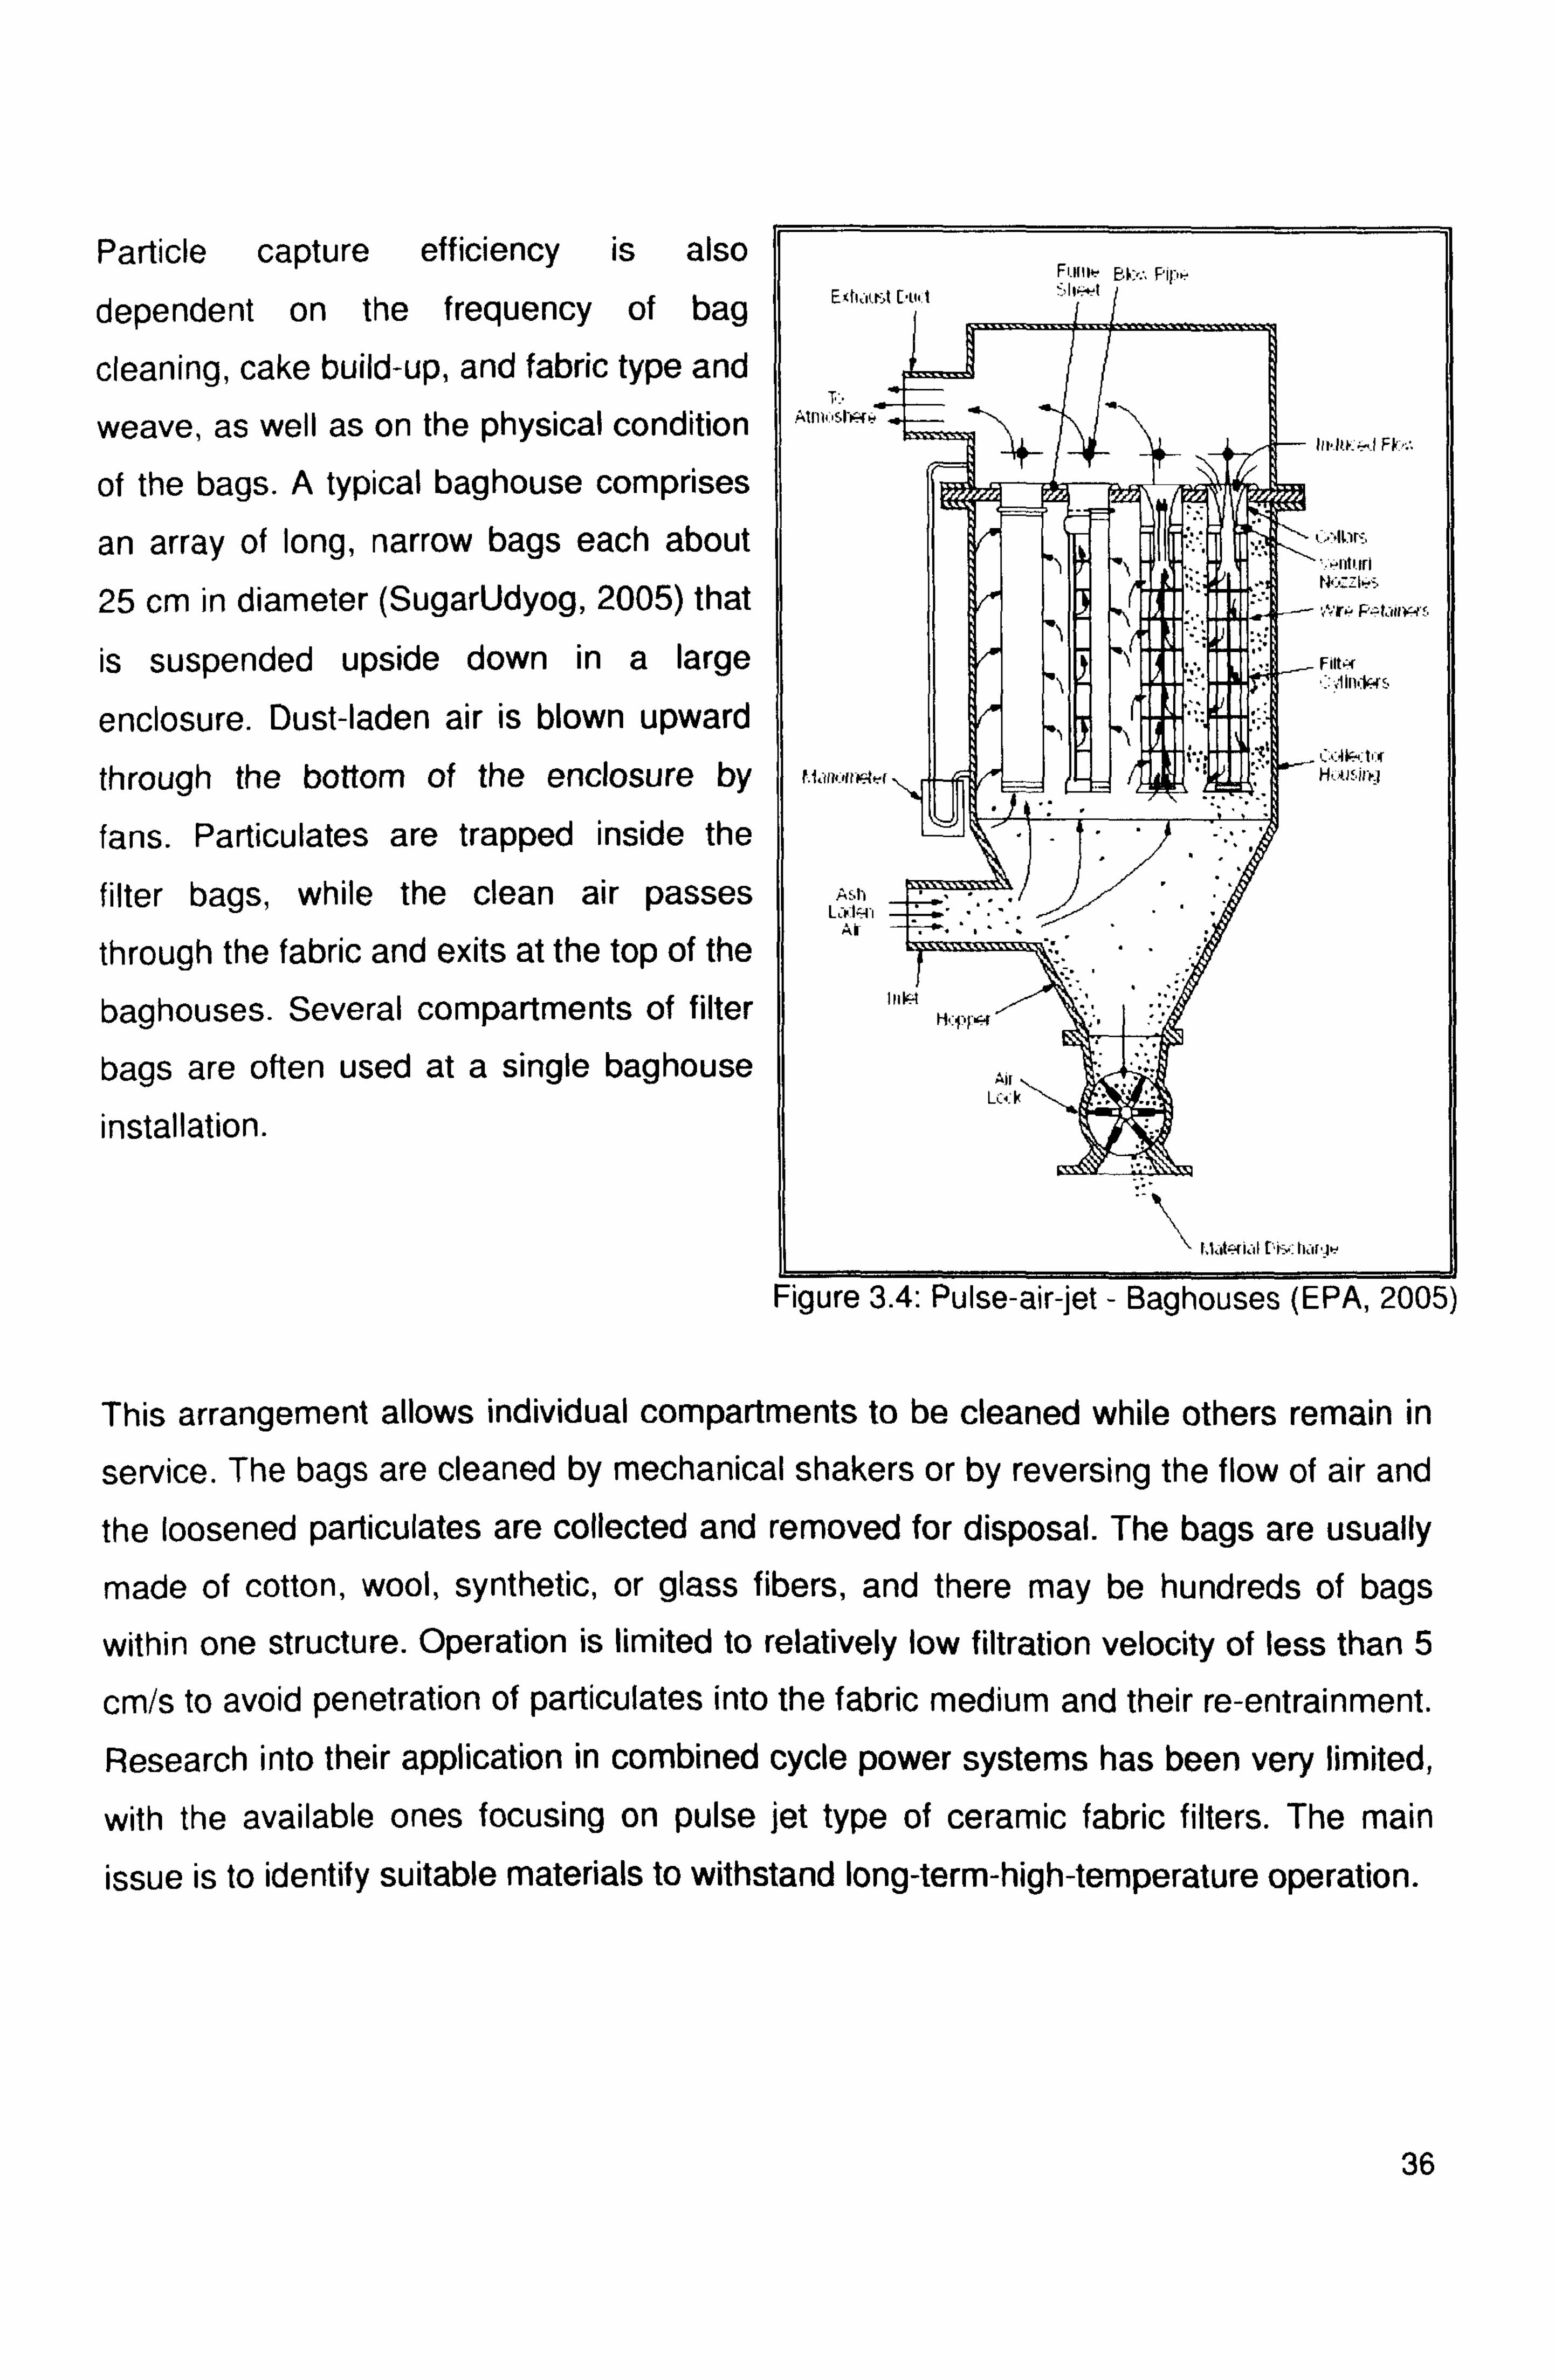
Particle capture efficiency is also
dependent on the frequency of bag
cleaning, cake build-up, and fabric type and
weave, as well as on the physical condition
of the bags. A typical baghouse comprises
an array of long, narrow bags each about
25 cm in diameter (SugarUdyog, 2005) that
is suspended upside down in a large
enclosure. Dust-laden air is blown upward
through the bottom of the enclosure by
fans. Particulates are trapped inside the
filter bags, while the clean air passes
through the fabric and exits at the top of the
baghouses. Several compartments of filter
bags are often used at a single baghouse
installation.
Fi. inlr gk:. pip, Slr«t ErhorrtDuht
T Atmi sl'rr»
InJte. KI Fb,,
IIi : ILir.
»nttrrl Hoz_I»s
} Filt"
} JIniW s
t. Ii(it lFter Hi usn tj
Ash
AY
HIM Hif? (ýf
ar
.
` P, tateri[ I Dim: har"ýý
Figure 3.4: Pulse-air-jet - Baghouses (EPA, 2005)
This arrangement allows individual compartments to be cleaned while others remain in
service. The bags are cleaned by mechanical shakers or by reversing the flow of air and
the loosened particulates are collected and removed for disposal. The bags are usually
made of cotton, wool, synthetic, or glass fibers, and there may be hundreds of bags
within one structure. Operation is limited to relatively low filtration velocity of less than 5
cm/s to avoid penetration of particulates into the fabric medium and their re-entrainment.
Research into their application in combined cycle power systems has been very limited,
with the available ones focusing on pulse jet type of ceramic fabric filters. The main
issue is to identify suitable materials to withstand long-term-high-temperature operation.
36

Some composite textile materials that are marketed for high temperature duty, quoted to
have an average operating temperature of 300°C with surges up to 350°C include
'Tefair' (PTFE/glass fibre) by DuPont and `Pyrotex' (mineral/ceramic/metal fibers) by
BMW (Chang, 2003). 3M's seamless filter bags woven from aluminium borosilicate
ceramic filter material `Nextel' are quoted as temperature-resistant up to 1150 °C for
continuous operation and up to 1370°C for short operation periods. However, the
development of SiC composite rigid candle filter by 3M seems to suggest that the bag
filter design is not a serious alternative for high temperature applications in combined
cycle power systems. At present, fabric filters do not provide the long-term performance
necessary for gas turbine protection in combined cycle applications (Mitchell, 1997),
(Seville, 1996).
3.1.1.5 Metallic Filters
Metallic filters based on stainless steel have been widely rejected for PFBC operations
mainly due to their susceptibility to severe hot corrosion in oxidising environments. However, the possibility remains for their application in gasification at temperatures
ranging from 350°C to 600°C under reducing conditions. The advantages of metallic
filters over ceramic filters include their high resistance to thermal and mechanical shock,
lower pressure drop resulting in reduced filtration area and lower capital costs, as well
as simpler sealing, fabrication, handling and installation (Anderson et al., 2003); (Grasa
et al., 2004). A study to test the long-term corrosion resistance of metal filters in a
gasification environment was performed recently by VVT in Finland. Pall's commercial
metal filter material comprising 316 and 310 stainless steel, Inconel 600 and Hastelloy X
were tested up to 800 hours in simulated gasification conditions with 300 ppmv H2S at 400 QC and 500 °C (Chang, 2003).
All materials showed good durability at 400°C, the slight corrosion being mainly due to
oxidation of chromium to chromium oxide (Cr203). At 500°C, the stainless steel filters
notably the 310 demonstrated good resistances, however the nickel-based filter of
Inconel and Hastelloy suffered severe sulphidation forming nickel sulphide (NH3S2),
blinding the filters. Pall is supplying their sintered stainless steel candle elements for the
IGCC project at Polk Power. Pall have developed seamless tube filters using a new
corrosion resistance metal alloy of iron aluminide (Fe3AI) which are claimed to be 37
exceptionally resistant to corrosion in high temperature, sulphurous environments. The
iron aluminide filters will be tested under gasification conditions as well as in an oxidising
gas stream. However, there continue to be concern over the ability of metallic filters to
endure high and low temperature excursions, as well as short term sulphur level
variations (Seville, 1996).
3.1.1.6 Granular Filters
Granular bed filtration was considered a leading hot gas cleaning technology in power
generation applications in the early 1980s. The filter consists of a bed of granular solids,
typically spherical and 1 to 3 mm in size. The main advantage of this filter is their
robustness as various mechanically, chemically and thermal resistant (above 1000 °C)
granular media can be used as collectors. There generic configurations: fixed or slowly
moving beds acting as surface filters, fixed or moving beds operating as depth filters and fluidised beds. The main collection mechanisms involved are inertial impaction and
agglomeration. Others include diffusion and interception, as well as gravitational,
electrostatic, magnetic and acoustic collection mechanisms. In principle, they can
operate at relatively high velocity and all the different designs are capable of relatively
high collection efficiencies. However in practice, commercial development has been
hindered by cake formation and particle retention difficulties, as well as severe attrition
of the collector medium at high temperatures and high velocities.
Commercial granular bed filters are available from the Combustion Power Company,
Westinghouse and Kawasaki Heavy Industries (Chang, 2003). In CPC's design, the
dust-laden gas travels counter-currently to a downward moving bed consisting of
relatively high-value 1 to 3 mm alumina (A1203) or 6 mm mullite (A1202. SiO2) spheres. CPC is currently testing an industrial-scale unit in Wilsonville, Alabama. At higher
temperatures problems arise due to sintering of the fine particles on the surface of the
granules which may lead to filter blinding at short distances from where the dusty gas
enters. The efficiency of a granular bed filter depends on the size distribution and shape
of the particles to be filtered. Granular beds are unlikely to succeed as a stand-alone
particulate filter but may be attractive as a multi-contaminant clean-up device for
simultaneous removal of gaseous contaminants and solid particulates (Seville, 1996),
(Mitchell, 1997). 38
3.1.1.7 Hybrid Systems
Hybrid particulate collection systems combine electrostatic precipitation with fabric
filtration to achieve high particulate removal efficiencies at low costs. Compact Hybrid
Particulate technology (COHPAC) provides a low cost option to upgrade the existing
aged or undersized ESPs and, when combined with activated carbon powder injection, a
possible means for mercury control. An Advanced Hybrid Particulate Collector (AHPC)
system can achieve 99.99% particulate collection efficiency for all particles sized from
0.01 to 50 pm (Ron and Pia, 2004), (Hrdlicka and Swanson, 2003). An AHPC system
requires less space and has lower capital cost compared with a conventional ESP or
baghouse, and can be designed for new installations as well as retrofits for existing
ESPs (Zhu, 2003). Electrostatic precipitators use electrodes to give particles an electric
charge that draws them to collection plates. The Advanced Hybrid system puts rows of
bag filters directly between the collection plates. The bags stop the particles that get by
the collectors and, periodically, inject air in reverse through the filters, dislodging built-up
particles and sending them back toward plates to be collected. This not only keeps the
bags clean, but also uses less energy drawing air. Reportedly air coming out of the plant
is cleaner than that going in, with respect to fine particulate.
3.1.2 Current Limitation
Various technologies have been proposed for hot gas particulate cleaning; however few
have undergone sufficient development for commercial application in combined cycle
power systems. Further development will be required to enable operating temperatures
above 500 QC and up to 900°C necessary to fully realise the advantages of gas cleaning
at high temperatures in advanced combined cycle designs.
39
3.2 Techniques and Development of Desulphurisation Processes in Hot Gas Clean-Up
Sulphur products in combustion not only pollute the environment, but also are
detrimental to combustion systems because of the corrosive action of their combustion
products (Kwon, 1998). In the gasification process, coal is reacted with steam and air or
oxygen to produce a medium to high calorific value fuel gas. The fuel gas can be
subsequently combusted in a gas/steam turbine combined cycle (IGCC). These IGCC-
based power generation options offer much higher thermodynamic cycle efficiencies that
promise to reduce all forms of pollutants released from a coal conversion process
through lower fuel consumption and the use of more energy efficient high pressure
and/or temperature unit operations for the removal of environmental pollutants.
3.2.1 Conventional Gas Cleaning Technology for Power Generation Plant
The conventional method of removing H2S and sulphur recovery involves a number of
steps including amine scrubbing at low temperature followed by amine regeneration
using steam to produce a concentrated H2S-containing gas. This concentrated H2S-
containing gas is then combusted to produced a gas with a H2S to sulphur dioxide (SO2)
ratio 2: 1 in a Claus furnace (Kwon and Gangwal, 2004). This is followed by up to three
stages of Claus reaction at a temperature of around 250 - 280°C over an alumina
catalyst to recover elemental sulphur:
2 H2S (g) + SO2 (g) H 3S (I) +2 H2O (3.1)
The Claus reaction is exothermic and equilibrium limited. To circumvent the equilibrium
limitation, the reaction is conducted in up to three reaction stages with interstage
cooling/sulphur condensation followed interstage re-heating. However, even with three
stages, the reaction is not complete due to thermodynamic limitation at 250 °C (Turk et
al., 2001). The Claus tail gas contains sulphur that must be further treated in an
expensive tail gas treatment plant (e. g., SCOT) before discharge. Thus, overall H2S
removal and sulphur recovery using this conventional sequence is extremely
cumbersome, equipment intensive, and expensive.
40

3.2.2 High-Temperature Sulphur Removal Using Sorbent Technology
* Disposal Sorbents (In-Situ Desulphurisation)
The disposable sorbents are mainly calcium-based materials, for instance dolomite
(CaCO3. MgCO3), lime (CaO) and limestone (CaCO3) which are cheap and abundantly
available. They are used in a once-through mode in the fluidised bed gasifier (as well as
in fluidised bed combustion systems), removing up to 90% (Mojtahedi et al., 1994) of
sulphur in the fuel. The sorbents can be incorporated in-bed., injected into the gas
stream, or directly contacted in an external reactor unit. This in-situ high-temperature
desulphurisation process is well-proven and involves the following reaction for H2S
removal under reducing conditions:
Sulphidation: CaO (s) + H2S (g) --- CaS (s) + H2O (g) (3.2)
Direct sulphidation: CaCO3 (s) + H2S (g) --- CaS (s) + CO2 (g) + H2O (g) (3.3)
Unstable CaS is formed which is then reacted with air forming the environmentally stable
CaSO4 (gypsum) to be disposed off with the gasifier bottom ash. There are several
disadvantages associated with the use of these disposable sorbents. Sintering and pore
plugging at high temperatures reduce calcium availability, inhibiting CaS stabilisation to
CaSO4 and necessitating a secondary oxidiser for complete conversion of CaS to
CaSO4. In-bed sulphur retention within the gasifier is limited by thermodynamics at low
temperatures.
Sulphur removal is 80 to 90% which is lower than the desirable level of 95 to 99% for
IGCC (Gangwal, 1995), necessitating post-bed H2S polishing to further reduce the
residual H2S. The resulting CaSO4 has no market value, requiring land filling which
incurs additional removal costs and may pose a problem where land is scarce. Although
H2S is the main sulphur component in the fuel gas and hence is the focus in the
literature regarding gas desulphurisation, similar sorbent sulphidation reactions to those
represented by equations 3.2 and 3.3 should apply to COS as well.
OFNýýFA ý
/Yj FFE qAy

* Regenerable Sorbents (Post-Bed Desulphurisation/Polishing)
A good sorbent will allow for a deep desulphurisation to ppm levels and have good
regeneration properties. This means the combination of a high affinity towards the
reaction with H2S and COS, as well as the formation of a sulphide which can be
converted back to the oxide through oxidation with air or dilute air. Next to the residual H2S and COS level, sorbent durability is the critical issue. The thermodynamics of the
reaction should be favourable enough to achieve the desired level of H2S and COS
removal (as much as 99% or more) (Gangwal et al., 1998), (Sanchez et al., 2005).
According to Elseviers and Vereist (1999), for economical operation, a good sorbent has
to maintain a large fraction of its desulphurisation properties for at least a hundred
sulphidation-regeneration cycles, requiring excellent sorbent stability. Over the last two
decades a number of studies have been reported on high-temperature H2S removal,
primarily using various transition metal oxides as regenerable sorbents. The sulphidation (absorption) and regeneration (desorption) reactions involving metal oxide sorbents can be represented by the following general equations:
Sulphidation: MYOX (s) + xH2S (g) --> MySX (s) + xH20 (g) (3.4)
Regeneration: MySX (s) + (3/2)XO2 (9) --> MyOX (s) + xSO2 (g) (3.5)
MySX (s) + 2xH2O -> MYO2x (s) + xH2S (g) + xH2 (g) (3.6)
Gangwal et at., (1998) reported that various oxides of materials such as activated
carbon (Bandosz, 1999), (Cal et at., 2000), ZnO (Sasaoka et al., 1992; Sasaoka et at., 1994; Slimane and Abbasian, 2000), Fe203 (Sasaoka et al., 2001), CuO (Abbasian and Slimane, 1998), Mn203 (Wakker and Gerritsen, 1993; Slimane and Hepworth, 1994a;
Slimane and Hepworth, 1994b; Slimane and Hepworth, 1995) and ZnFe2O4 (Pineda et
al., 1997) have been researched.
These oxides are sometimes mixed with secondary oxides such as silica, alumina,
titania and chromic which do not take part in the sulphidation reaction but instead give
additional mechanical support, stabilise the main metal oxides and minimise sorbent losses, as well as aid regeneration. Table 3.1 lists the main metal oxides used as
regenerable sorbents and their characteristics. The sorbent most intensively studied in
the 1980's was iron oxide, which yields equilibrium H2S concentrations in the few
42
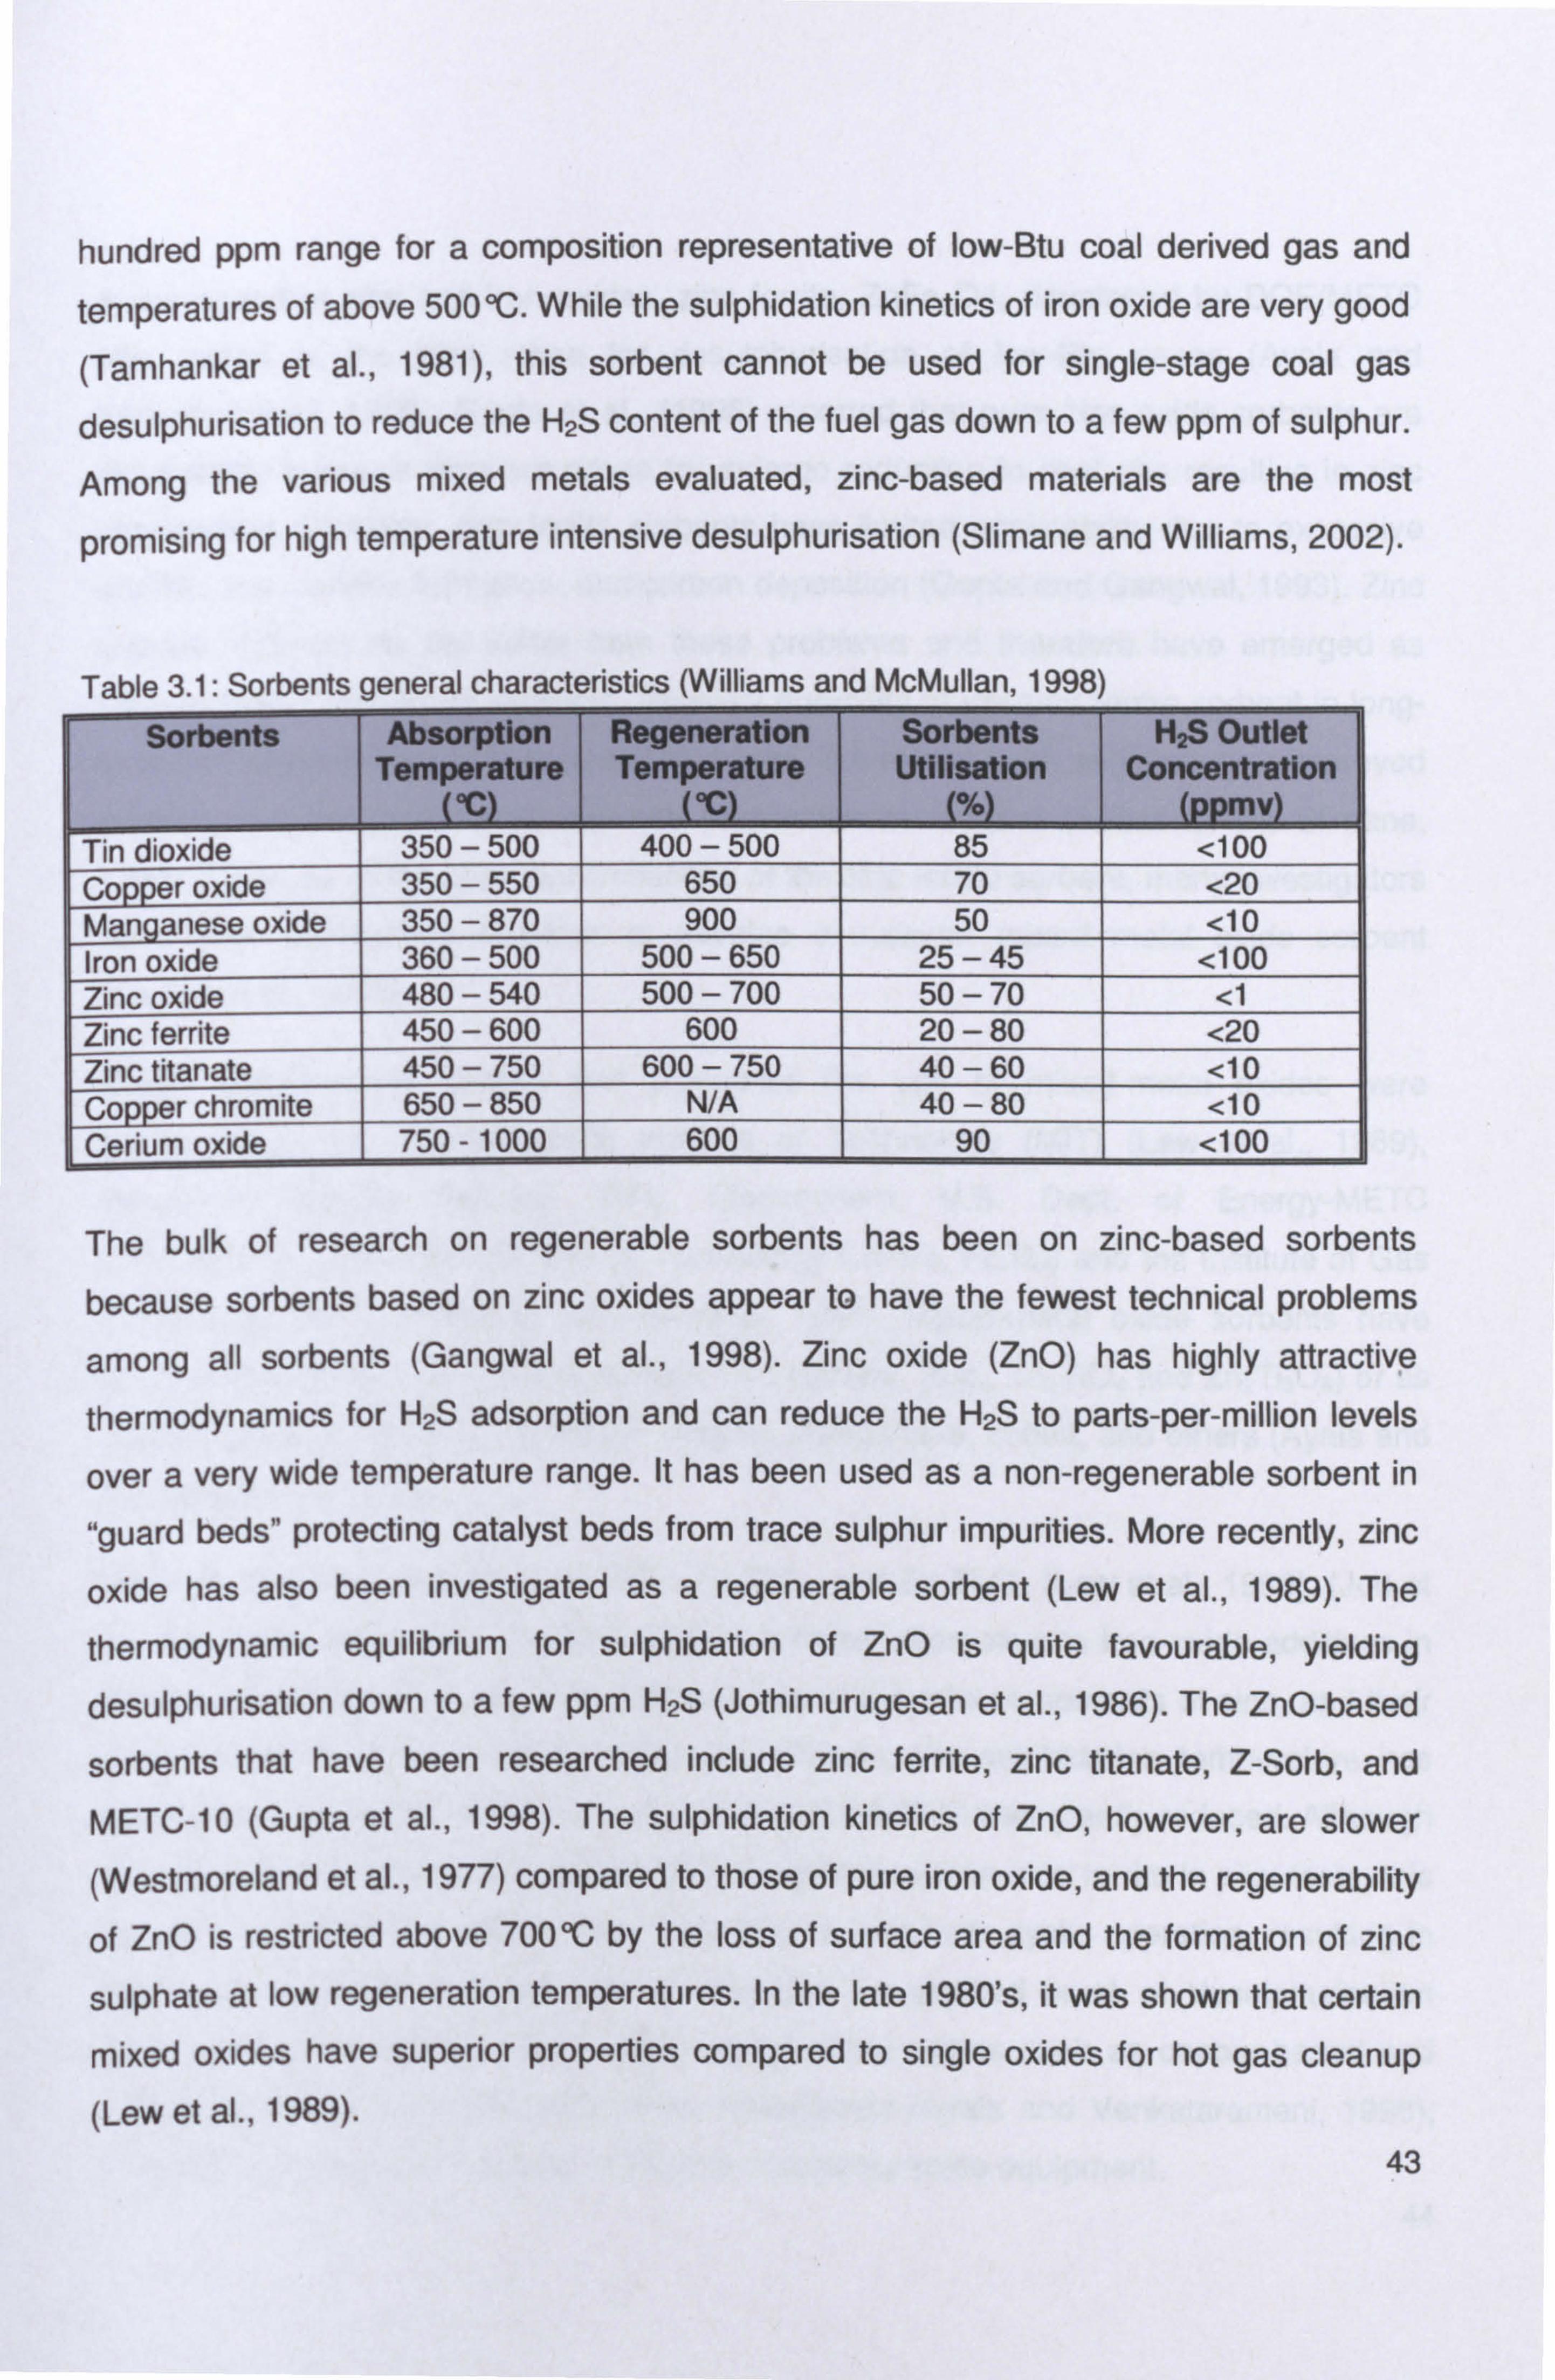
hundred ppm range for a composition representative of low-Btu coal derived gas and
temperatures of above 500°C. While the sulphidation kinetics of iron oxide are very good
(Tamhankar et al., 1981), this sorbent cannot be used for single-stage coal gas
desulphurisation to reduce the H2S content of the fuel gas down to a few ppm of sulphur.
Among the various mixed metals evaluated, zinc-based materials are the most
promising for high temperature intensive desulphurisation (Slimane and Williams, 2002).
Table 3.1: Sorbents general characteristics (Williams and McMullan, 1998)
Sorbents Absorption Temperature
°C
Regeneration Temperature
°C
Sorbents Utilisation
(%)
H2S Outlet Concentration
my Tin dioxide 350 - 500 400 - 500 85 <100 Copper oxide 350- 550 650 70 <20 Manganese oxide 350- 870 900 50 <10 Iron oxide 360- 500 500 -650 25 - 45 <100 Zinc oxide 480 -540 500- 700 50 - 70 <1 Zinc ferrite 450 - 600 600 20 - 80 <20 Zinc titanate 450 -750 600- 750 40 - 60 <10 Copper chromite 650 - 850 N/A 40 - 80 <10 Cerium oxide 750 - 1000 600 90 <100
The bulk of research on regenerable sorbents has been on zinc-based sorbents
because sorbents based on zinc oxides appear to have the fewest technical problems
among all sorbents (Gangwal et al., 1998). Zinc oxide (ZnO) has highly attractive
thermodynamics for H2S adsorption and can reduce the H2S to parts-per-million levels
over a very wide temperature range. It has been used as a non-regenerable sorbent in
"guard beds" protecting catalyst beds from trace sulphur impurities. More recently, zinc
oxide has also been investigated as a regenerable sorbent (Lew et al., 1989). The
thermodynamic equilibrium for sulphidation of ZnO is quite favourable, yielding desulphurisation down to a few ppm H2S (Jothimurugesan et al., 1986). The ZnO-based
sorbents that have been researched include zinc ferrite, zinc titanate, Z-Sorb, and
METC-10 (Gupta et al., 1998). The sulphidation kinetics of ZnO, however, are slower
(Westmoreland et at., 1977) compared to those of pure iron oxide, and the regenerability
of ZnO is restricted above 700°C by the loss of surface area and the formation of zinc
sulphate at low regeneration temperatures. In the late 1980's, it was shown that certain
mixed oxides have superior properties compared to single oxides for hot gas cleanup
(Lew et al., 1989).
43

A compound of zinc and iron oxides, zinc ferrite, ZnFe2O4, developed by DOE/METC
was tested at the pilot stage for desulphurisation of low-Btu gases (Ayala and
Venkataramani, 1998). Gupta et al., (1996) reported that pure zinc oxide sorbents are
not suitable because they are prone to undergo reduction in coal gas resulting in zinc
vaporisation. Similarly, zinc ferrite sorbents have limited applicability due to excessive
attrition, iron carbide formation, and carbon deposition (Gupta and Gangwal, 1993). Zinc
titanate sorbents do not suffer from these problems and therefore have emerged as
alternatives to zinc ferrite sorbents. Physical durability of the zinc ferrite sorbent in long-
term testing precluded further use at that time, but recent work suggests that improved
performance can be obtained with new preparation techniques (Abbasian and Slimane,
1998). Because of the apparent limitations of the zinc ferrite sorbent, many investigators
have been conducting research to develop a superior mixed metal oxide sorbent (Patrick et al., 1989).
Earlier experimental studies that pioneered the use of mixed-metal oxides were
performed at the Massachusetts Institute of Technology (MIT) (Lew et al., 1989),
Research Triangle Institute (RTI), Electrochem, U. S. Dept. of Energy-METC
(DOE/METC), (now Federal Energy Technology Centre, FETC) and the Institute of Gas
Technology (IGT) (Abbasian and Slimane, 1998). Mixed-metal oxide sorbents have
been studied in the past both as straight zinc titanate, (e. g., Zn2TiO4 and Zn2Ti3O8) or as
combinations of oxides of vanadium, copper, manganese, cobalt, and others (Ayala and
Venkataramani, 1998).
Work on zinc titanate such as ZnTiO3, Zn2TiO4, and Zn2Ti3O8 (Lew et al., 1989), (Jun et
al., 2001) has shown that titanium oxide is a better alternative to iron oxide additives in
terms of the higher stability of the titanate over the ferrite compounds of zinc, and their
similar sulphidation equilibrium. With zinc titanate, the sulphidation temperature has
been shown to extend to 700°C, and sintering of the ZnO was greatly reduced. Although
zinc titanate has also shown better attrition resistance than zinc ferrite in pilot tests, this
sorbent also suffers gradual loss of reactivity in long-term cyclic operation, resulting in
high fresh sorbent makeup rate to maintain the desired level of desulphurisation
(Abbasian and Slimane, 1998). Other mixed metal oxides such as copper-based and
cobalt-based sorbents have also been investigated (Ayala and Venkataramani, 1998);
however, the research has been limited to laboratory-scale equipment. 44
Although higher temperature application offers better overall process efficiency, the
stringent requirement for sulphur removal efficiency at temperatures above 538 °C limits
the choice of the sorbents to a few metal oxides (based on thermodynamic equilibrium),
that have been shown to have other limitations as described earlier. The thermodynamic
equilibrium of many metal oxides significantly improve as the temperature decreases,
making many metal oxide sorbents suitable for hot gas cleanup application in the
temperature range of 343-538 °C.
Although the initial chemical reactivities of the sorbents generally decrease with
decreasing temperature, the lower thermal stress incurred can lead to better sorbent
reactivity after a large number of cycles, reducing the sorbent replacement cost. In
general, the benefit to be gained by lower temperature application may outweigh the
slight loss of efficiency, resulting in lower overall cost of electricity. However, no
extensive study has been done on the development of advanced sorbents for the lower
temperature application. In order for a metal oxide to be considered suitable for high-
temperature desulphurisation, the material must exhibit desirable properties in the
following areas (Abbasian and Slimane, 1998):
* Rate of H2S absorption and low equilibrium H2S achievable in the gas phase
* Ease of regeneration of the sulphide species formed during absorption
* Likelihood of sulphate formation and ease of sulphate decomposition
* Metal/sorbent evaporation and temperature of incipient evaporation
* Formation of low-melting eutectic phases
* Reduction to metal during absorption due to highly reducing coal gases
* Interactions between active metal oxide, stabilisers, and support with other
components and contaminants in coal gas (e. g., H2, alkali metals, halogens)
" Sulphur loading of metal oxide and sulphur loading capacity limitations
* Disposal of spent sorbent metals and deleterious effects of volatilised sorbent metals
to other IGCC components (e. g., turbine)
* Cost of support and/or cost of active metal oxide
45
The feasibility of operating a moving-bed high-temperature desulphurisation system in
an economically competitive and technically feasible manner currently restricts its use to
a temperature between 400-750°C and pressures above 10 atmospheres during
absorption. Operation below 4000C does not take full advantage of higher system
efficiency compared to low-temperature cleanup systems, while operation above 750°C
requires a trade-off between more sophisticated material properties/higher capital costs
and reliability of process operation. Although this operation may expand in the future,
these current boundaries of operation are considered realistic (Abbasian and Slimane,
1998).
3.2.3 Current Limitation
From their reviews of existing hot gas desulphurisation technologies, Mitchell (1998) and Chang (2003) concluded that no fully commercialised desulphurisation sorbent is
available as yet, while Williams and McMullan (1998) documented that "the perfect
sorbents is still a long way from commercial reality". There are still issues to be resolved
regarding sorbents performance during long-term operation in different reactor systems. In particular, problems related to sorbent mechanical strength, chemical attrition
resistance, long-term durability and reactivity have yet to be fully addressed. According
to Turk et al., (2001), currently, the limitations of sorbent-based gas desulphurisation
processes may be summarised as follows:
Inability to reduce H2S concentration of syngas to sub-ppm (parts per million) levels
Relatively slow kinetics at temperatures below 427°C
* Relatively low sulphur capacity at low temperatures 204 to 427°C
* Poor regenerability at temperatures below 538 °C
3.3 Development of Hot Gas Desulphurisation & Particulate Cleaning by Liquid Metal
The concept of using liquid metals for gas desulphurisation dates back to the late 1970s
when Meissner (1976) first patented the concept of removing sulphur from hot reducing
gases using liquid lead. However since then, only few others have propounded the use
of liquid metals for gas cleaning. They were Meissner and Shora (1981); Schuermann
(1984); Reitz (1985); Hedden et al., (1986) and most recently, Warner (2000,2001). 46

3.3.1 Early Work - Gas Desulphurisation with Molten Lead
Meissner (1976) put forward the concept of using molten lead for sulphur removal from
hot reducing gases. Lead was selected as the reagent metal due to its relatively low
melting point of 327tC. In the proposed process, incoming hot gases containing
sulphurous compounds such as hydrogen sulphide are contacted with a slurry or
solution mixture of lead sulphide in molten lead in a refractory-lined clean-up chamber. In the clean-up chamber, a rotating wheel that is partially immersed in the melt disperse
the mixture into droplets in the gas phase, providing intimate contact with the sulphur
compounds in the incoming gases and breaking up the solid lead sulphide skin (if any)
on the surface of the melt. The sulphur content in the hot gases reacts with lead forming
lead sulphide. The slurry of unreacted molten lead and the formed lead sulphide is
withdrawn to a refractory-lined regeneration chamber. Regeneration is carried out by
electrolysis of the lead sulphide producing molten lead at the cathode and elemental
sulphur at the anode.
The regenerated lead together with any unconverted lead sulphide (in solution or slurry form) is recycled back to the clean-up chamber in a volume that is in excess of that
required to react with the predetermined sulphur content in the incoming hot gases and to at least form a pumpable mixture of molten lead and solid lead sulphide. The
elemental sulphur is removed as a volatilised gas from the regeneration chamber. Building on the earlier patent by Meissner (1976), Meissner and Shora (1981) proposed
a general process for a high temperature heat exchanger between a gas stream and either a molten metal or a molten salt. This is through generation of liquid droplets in a confined gas passageway giving high interphase contact surface area.
The droplet shower can be generated either by impellers or rotating disks partially immersed in a liquid pool, or using submerged gas jets, or with spray heads and nozzles. If required, simultaneous removal of undesired solid, liquid or gaseous components from the gas stream can also be provided for. Although Meissner (1976), Meissner & Shora (1981) patented a system for liquid metal based gas cleaning, there has been no documented evidence to suggest that their idea was explored and further
and put into actual practice.
47

3.3.2 Early Work - Gas Desulphurisation with Molten Tin
In the mid-1980s, the use of molten tin for sulphur removal was investigated by
researchers in Germany, Schuermann (1984); Reitz (1985) and Hedden et al., (1986),
and the latest investigation was done in 2003 by researchers in United Kingdom, Chang
(2003).
* Schuermann (1984)
Schuermann (1984) showed that it is thermodynamically possible to remove H2S with
molten tin and then demonstrated it experimentally. The possibility of combining sulphur
and dust removal in a spray scrubber was also suggested. The desulphurisation
reaction is as follows:
Sn (I) + H2S (g) ---) SnS (s) + H2 (g) (3.7)
The reaction is an exothermic process. The enthalpy of reaction varies from -90.5 to - 82.43 kJ/mol at temperatures 327 to 727°C. The equilibrium constant for the
heterogeneous reaction 3.7 is independent of pressure as follows:
Kp = PH2/PH2s (3.8)
Figure 3.5 depicts the dependency of the Gibbs free energy change of reaction OGR for
reaction (3.7) on the temperature T for varying partial pressure ratio pH2/PH2s. AGR tends
towards a negative value as either the temperature or partial pressure ratio decreases,
favouring reaction i. e. H2S absorption.
48

-60
-40
0 -20
T 2) 0 a) C a) a)
20 U)
CD 40
I Forward reaction favoured
IBackward reaction favoured 60 I
300 400 500 600 700 800
Temperature (°C)
Figure 3.5: Variation of Gibbs free energy for the desulphurisation reaction of tin by H2/H2S ratio and temperature (Schürmann, 1984)
Conversely as either the temperature or partial pressure ratio increases, OGR tends
towards a positive value, favouring the reverse reaction i. e. SnS decomposition.
Therefore either the H2S absorption or SnS decomposition is favoured depending on the
system temperature and gas composition. For a typical fuel gas composition of 30 vol. %
H2 and 0.5 vol. % H2S, temperatures of less than 527°C (800 K) have to be kept to
achieve H2S separation of greater than 90%.
A simple test was carried out to investigate the desulphurisation reaction 3.7.1000
ppmv H2S in N2 gas was bubbled through a small amount of molten tin held in a gas
washing bottle heated at constant temperature. It was found that as the temperature
rose from 400 to 800CC the degree of H2S separation increased from approximately 60%
to over 90%. According to Schuermann, the temperature dependence of the degree of
H2S separation could only be explained kinetically as complete conversion in all cases
could be expected from thermodynamic balance. The kinetic hindrance was probably
due to insufficient dispersion of gas bubbles through the molten tin at low temperatures.
This problem could be avoided by the dispersion of tin to fine droplets providing a large
area for interphase mass transfer.
lo PH,
lDo PH,
S
IWO
/0000 -------------- --------------' '-----'-'---_____---'-ry' ---"
-420 -550 7500C
49
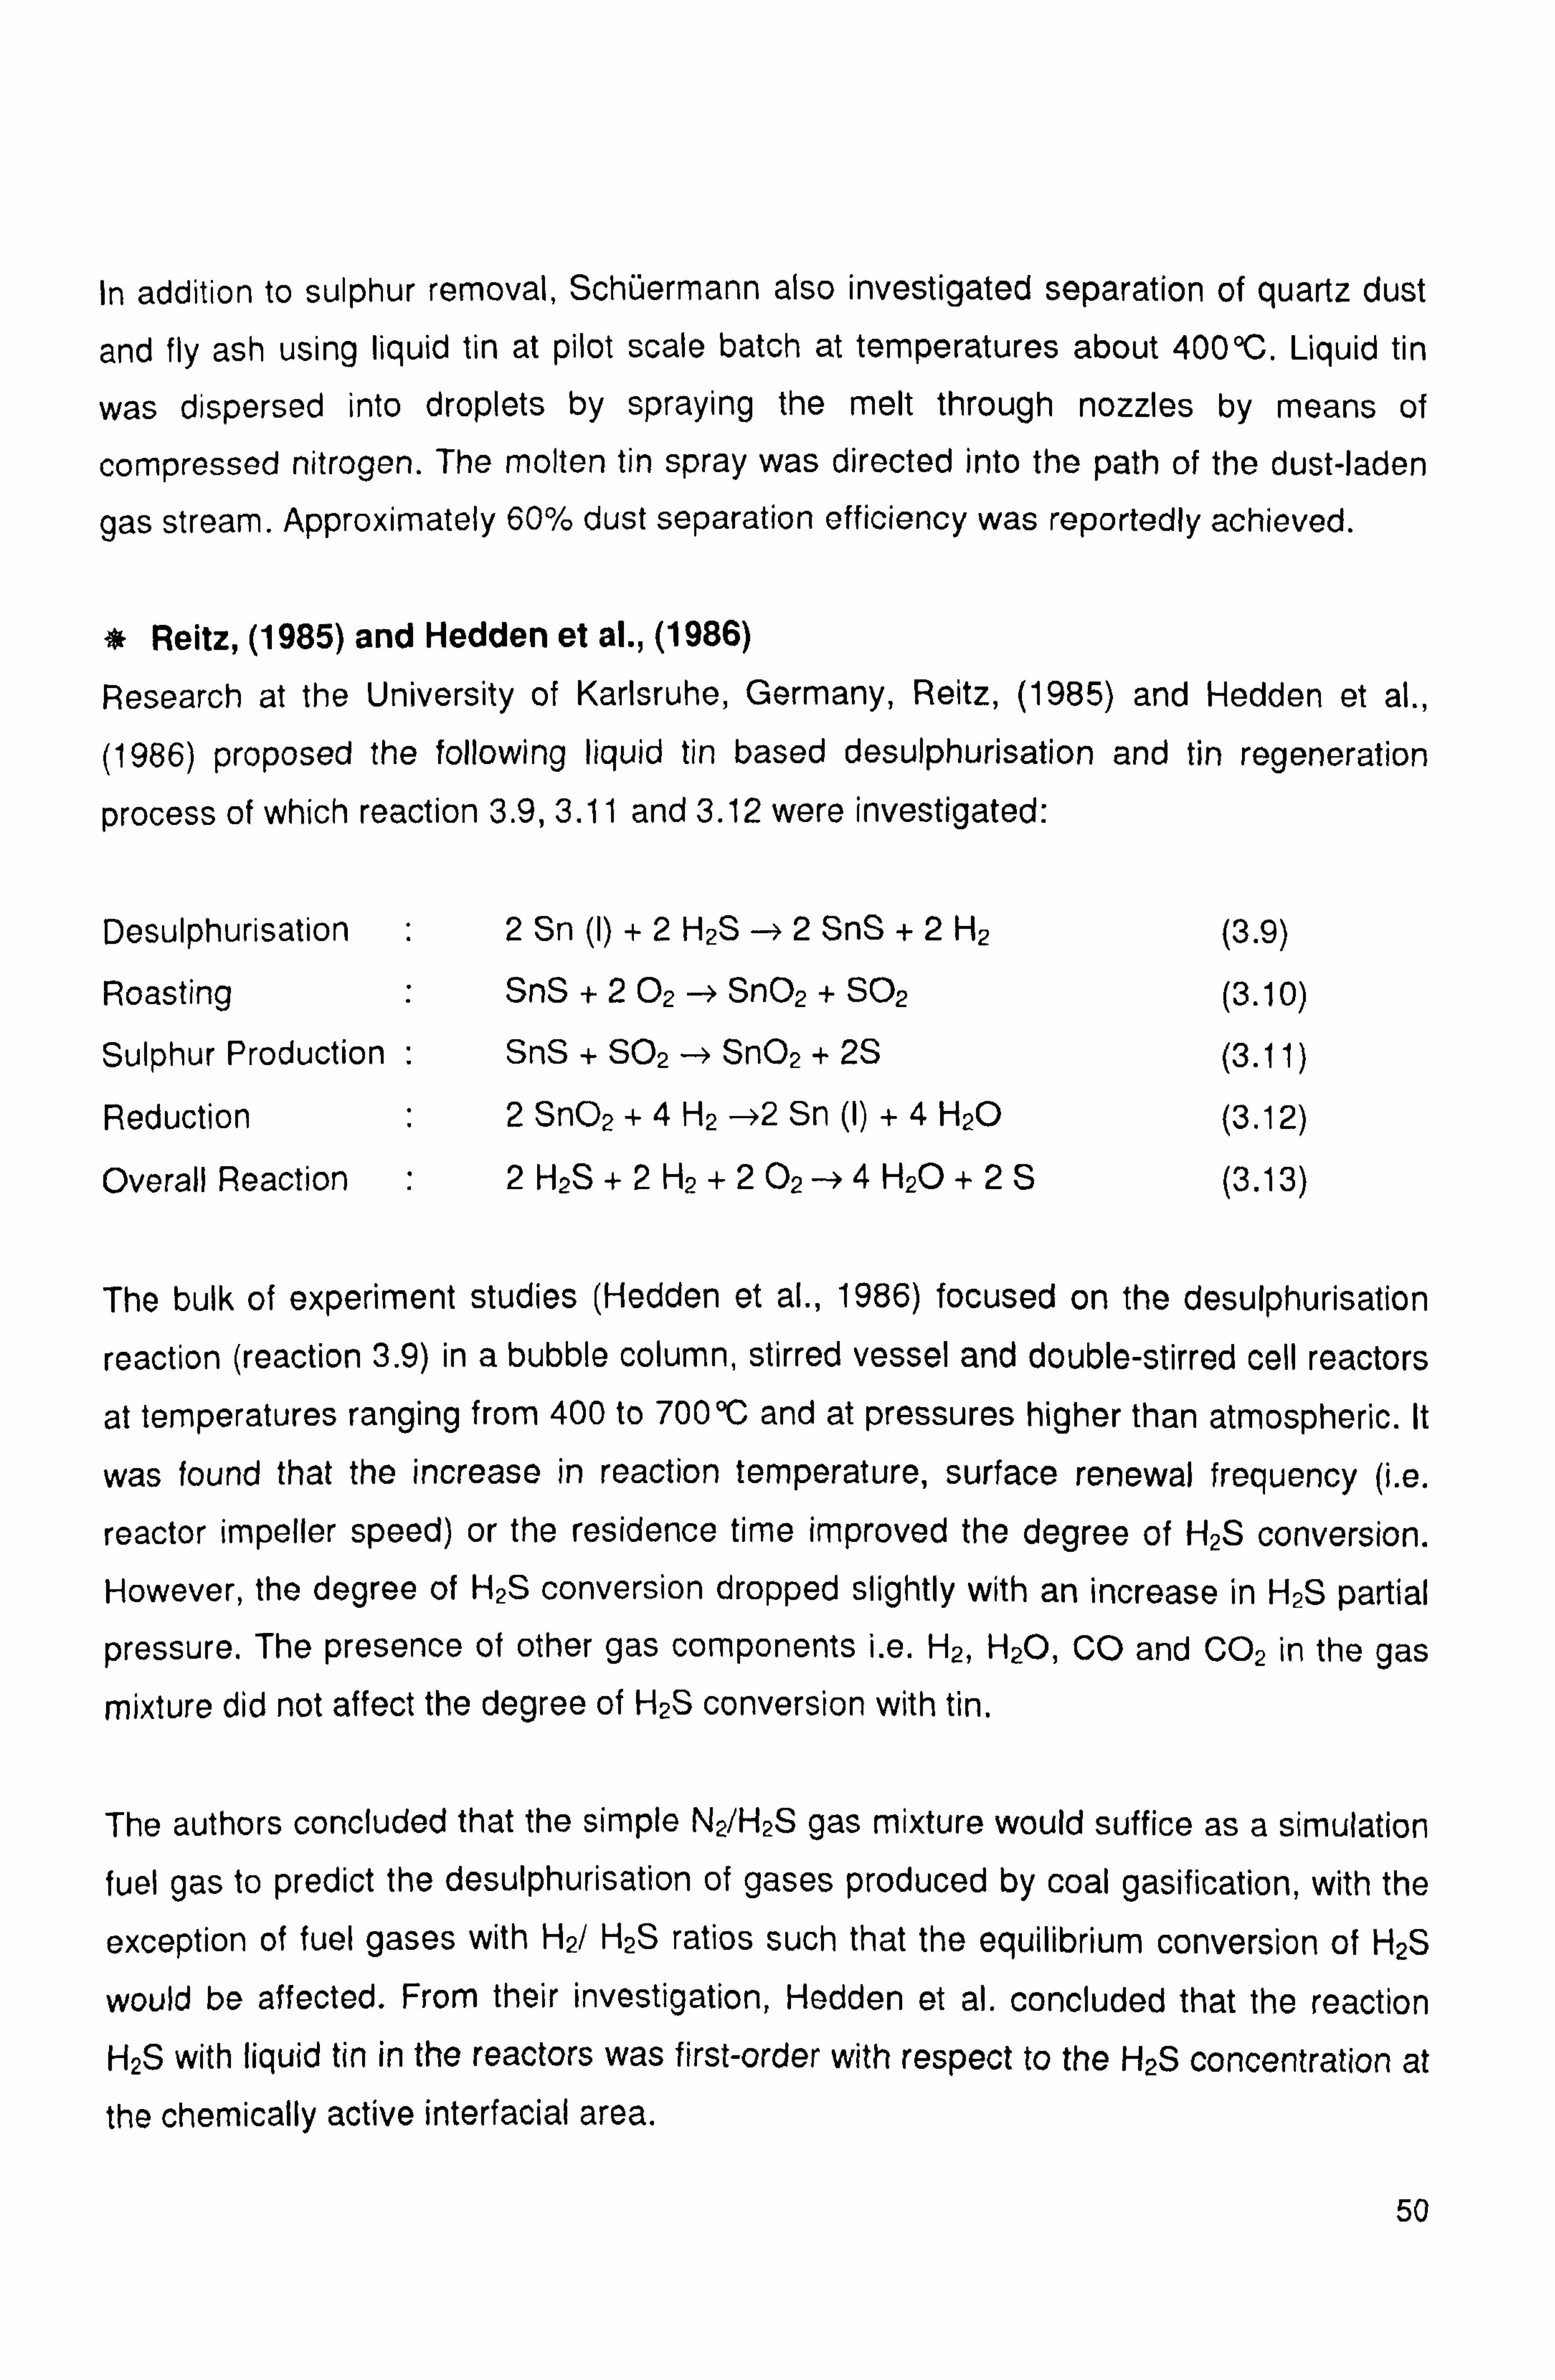
In addition to sulphur removal, Schuermann also investigated separation of quartz dust
and fly ash using liquid tin at pilot scale batch at temperatures about 400°C. Liquid tin
was dispersed into droplets by spraying the melt through nozzles by means of
compressed nitrogen. The molten tin spray was directed into the path of the dust-laden
gas stream. Approximately 60% dust separation efficiency was reportedly achieved.
* Reitz, (1985) and Hedden et al., (1986)
Research at the University of Karlsruhe, Germany, Reitz, (1985) and Hedden et al.,
(1986) proposed the following liquid tin based desulphurisation and tin regeneration
process of which reaction 3.9,3.11 and 3.12 were investigated:
Desulphurisation : 2 Sn (I) +2 H2S -- 2 SnS +2 H2 (3.9)
Roasting : SnS +2 02 - Sn02 + SO2 (3.10)
Sulphur Production : SnS + SO2 -a Sn02 + 2S (3.11)
Reduction : 2 Sn02 +4 H2 ->2 Sn (I) +4 H2O (3.12)
Overall Reaction 2 H2S +2 H2 +2 02 ---> 4 H2O +2S (3.13)
The bulk of experiment studies (Hedden et al., 1986) focused on the desulphurisation
reaction (reaction 3.9) in a bubble column, stirred vessel and double-stirred cell reactors at temperatures ranging from 400 to 700 °C and at pressures higher than atmospheric. It
was found that the increase in reaction temperature, surface renewal frequency (i. e.
reactor impeller speed) or the residence time improved the degree of H2S conversion. However, the degree of H2S conversion dropped slightly with an increase in H2S partial
pressure. The presence of other gas components i. e. H2, H2O, CO and CO2 in the gas
mixture did not affect the degree of H2S conversion with tin.
The authors concluded that the simple N2/H2S gas mixture would suffice as a simulation fuel gas to predict the desulphurisation of gases produced by coal gasification, with the
exception of fuel gases with H2/ H2S ratios such that the equilibrium conversion of H2S
would be affected. From their investigation, Hedden et al. concluded that the reaction
H2S with liquid tin in the reactors was first-order with respect to the H2S concentration at the chemically active interfacial area.
50
The effective interfacial area for reaction was found to be reduced by the formation of
solid tin sulphide film on the liquid tin surface, preventing further sulphide formation and
hindering desulphurisation. Hence, besides the system temperature and H2S
concentration, the desulphurisation reaction rate was also dependent on the interfacial
area sulphur renewal frequency. The sulphur production reaction (3.11) was investigated
(Hedden et al., 1986) in a fixed bed reactor at 500 to 800 °C. It was found that some of the
elemental sulphur produced from the reaction of SnS with SO2 accumulated on the solid
SnS/SnO2 surface forming polysulphides (SnS2, SnS3). Additional heating of the solid to
800°C in a N2 stream was necessary for complete recovery of the accumulated sulphur.
The reduction of Sn02 (3.12) was effected by H2 at 480 °C and CO at 540 °C. A gas
desulphurisation scheme was proposed by Hedden et al., (1986) based on the results
obtained from the individual reaction steps. After pre-cleaning in a cyclone, simultaneous
sulphur and fine dust removal from the hot fuel gas take place in a molten tin spray
scrubber at 500 °C and 20 bars. The unreacted molten tin containing solid tin sulphide
product and dust particles is removed from the scrubber, the solids scraped off and the
cleaned tin is transport back to the scrubber. The separated solid tin sulphide, SnS is
treated with 02 and SO2 in a rotary kiln at 800°C to form tin oxide, Sn02 and elementary
sulphur. The tin oxide is reduced by purified fuel gas (H2 or CO) in a second rotary kiln,
regenerating molten tin. However, there is no reported evidence to suggest that the
proposed process has actually been implemented. No subsequent documents were found
on the progress of this process.
* Chang et al., (2003)
Small-scale gasification of petroleum coke samples was carried out in an electrically
heated horizontal furnace using a steam/nitrogen mixture as the gasifying medium.
Gasification was performed with and without the presence of tin. The amounts of H2S
sampled from the product gas steam in both occasions were compared. There was
roughly 10 % reduction in the sampled H2S upon tin addition. The reduction was small as
any reaction involving the tin was limited by the small surface area of the tin available for
contact with the gas stream. At a temperature of about 1000°C, the molten tin reacted
with the product gas depositing a solid residue. However at a temperature in the region of
500°C (could be lower due to possible lower gas phase temperature), the kinetics were
too slow for similar reactions between the fuel gas and the molten tin to take place.
51

The solid residue was most likely a mixture of mainly Sn02 from the reaction of molten
tin with steam and CO2 with a small fraction of SnS contributed by the reaction of molten
tin with H2S. These small-scale gasification studies provided actual confirmation and
evidence of the possibility of sulphur removal by molten tin under gasification
environment. Previous work by Chang (2003) presents the results of cold test studies
conducted on a non-wetting flow packed bed scrubber and shows the application of
these data to the design of a small scale molten tin irrigated high temperature scrubber.
The system in the previous study incorporates a fixed bed rather than a moving-bed;
nevertheless the results will be useful to the subsequent development of a moving
packed bed scrubber. The objective of her research project was to perform studies on
an analogous room temperature packed bed scrubber operating under non-wetting
conditions, providing insight and understanding towards the development of a high
temperature packed bed gas scrubber irrigated by molten tin. A series of cold tests on a
Perspex model of the gas scrubber operating under non-wetting flow conditions
analogous to liquid metal flow were conducted at University of Sheffield, United
Kingdom. The results regarding the cold test studies have been well documented by
Chang (2003).
3.3.3 Gas Desulphurisation with Gaseous Metallic Zinc
At the University of Birmingham, Warner (1997) proposed the removal of sulphur from
fuel gases based on interaction between H2S and COS with gaseous metallic zinc
producing saleable, premium grade solid ZnS:
Zn (g) + H2S (g) -- ZnS (s) + H2 (g) (3.14)
99% or greater H2S and COS removal was claimed to be possible. The ZnS concentrate
can either be treated on-site by direct smelting (i. e. The Warner Zinc Process) to recover
the metallic zinc or it can be sold to a producer. The concentrate has a very small iron
content compared to natural ZnS, hence making it an ideal feedstock for the electrolytic
Zn industry which is facing heavy environmental pressures regarding the disposal of iron
impurities (known as jarosite residues) from Zn concentrates. The leaching of these
metal impurities into groundwater and the ecosystem is a matter of serious concern.
52

3.4 Current Proposal - Particulate Removal/Gas Desulphurisation with Molten Tin
This Chapter sets out the fundamental study of hot gas cleaning by molten tin
undertaken during the course of this research project.
3.4.1 Selection of Liquid Metal System
Three possible liquid metal systems were identified (Warner, 2000; Warner, 2001). They
were lead (Pb), bismuth-lead mixture (Bi-Pb) and tin (Sn). Lead is the most
thermodynamically efficient among the three. It is relatively cheap and is inert to
oxidation by fuel gas. Lead's melting point is 327°C. This can be lowered by adding Bi to
form a 55.5% Bi - 44.5% Pb eutectic with a melting point of 2700 which would make
system start-up and prolonged stand-by both easier and less energy-intensive. The Bi-
Pb is also not susceptible to oxidation by fuel gas. In this mixture, Bi acts as just an inert
diluent and by itself it is least effective among the other options in sulphur removal.
However, the use of either Pb or Bi-Pb is discouraged due to health hazards associated
with in-plant exposure to lead as well as its emissions to the environment.
Lead is a cumulative poison (ASM, 1984). Excessive lead intake either from air, food or
water can build up in the body, which leads to lead poisoning. Considering the health
risks associated with lead, tin is the remaining choice of the liquid metal system. Tin and
its inorganic compounds do not pose a health threat. Tin has a relatively low melting
point of 232°C and negligible vapour pressure at high temperature. This is a major
advantage over lead, bismuth and zinc which have relatively high vapour pressure,
hence they are easier to evaporate or sublime at high temperature causing massive
metal loss. The vapour pressures of these metals are compared in Table 3.2, tin being
the least volatile and zinc the most volatile. In addition, molten tin has relatively low
viscosity, hence giving easy flow and easy dispersion into small droplets on the packing
surface. Molten tin's viscosity is 1.41x10⁻³ kg/m. s at 400°C as compared to that of water
which is 1.13 x10⁻³ kg/m. s at 15°C.
53

Table 3.2: Vapour pressure comparison (ASM, 1981)
3.4.2 Gas Desulphurisation
Fuel gas is contacted counter currently with molten tin in a moving packed bed of
ceramic spheres (typically 100 to 150 mm in diameter). Gas desulphurisation is effected through direct absorption of H2S and COS in the fuel gas into molten tin:
H2S + Sn -* SnS +H2 COS +Sn-*SnS+CO
(3.15)
(3.16)
The reaction should proceed unimpeded as long as the dissolved sulphur in the molten
tin is maintained below the saturation level with respect to SnS. This prevents surface drossing by solid SnS formation which can hinder further reaction between the liquid tin
and the sulphurous gases as well as to avoid accretion problems which can block the
packed bed. This process differs from those employed by Schürmann (1984) and Hedden et al., (1986) in which sulphur is removed as solid tin sulphide at unity activity. According to Warner (2000), it can be shown that the degree of sulphur removal when
sulphur is removed as tin sulphide at unit activity is limited by thermodynamic
constraints. Indications of this are the limited degree of sulphur removal at high
temperature as noted by Schürmann (1984), and at high partial pressure ratio of H2 to H2S as identified by both Schürmann (1984) and Hedden et al., (1986). These
constraints are removed by maintaining a very low activity of dissolved sulphur in the
molten tin, ensuring effective sulphur removal.
54
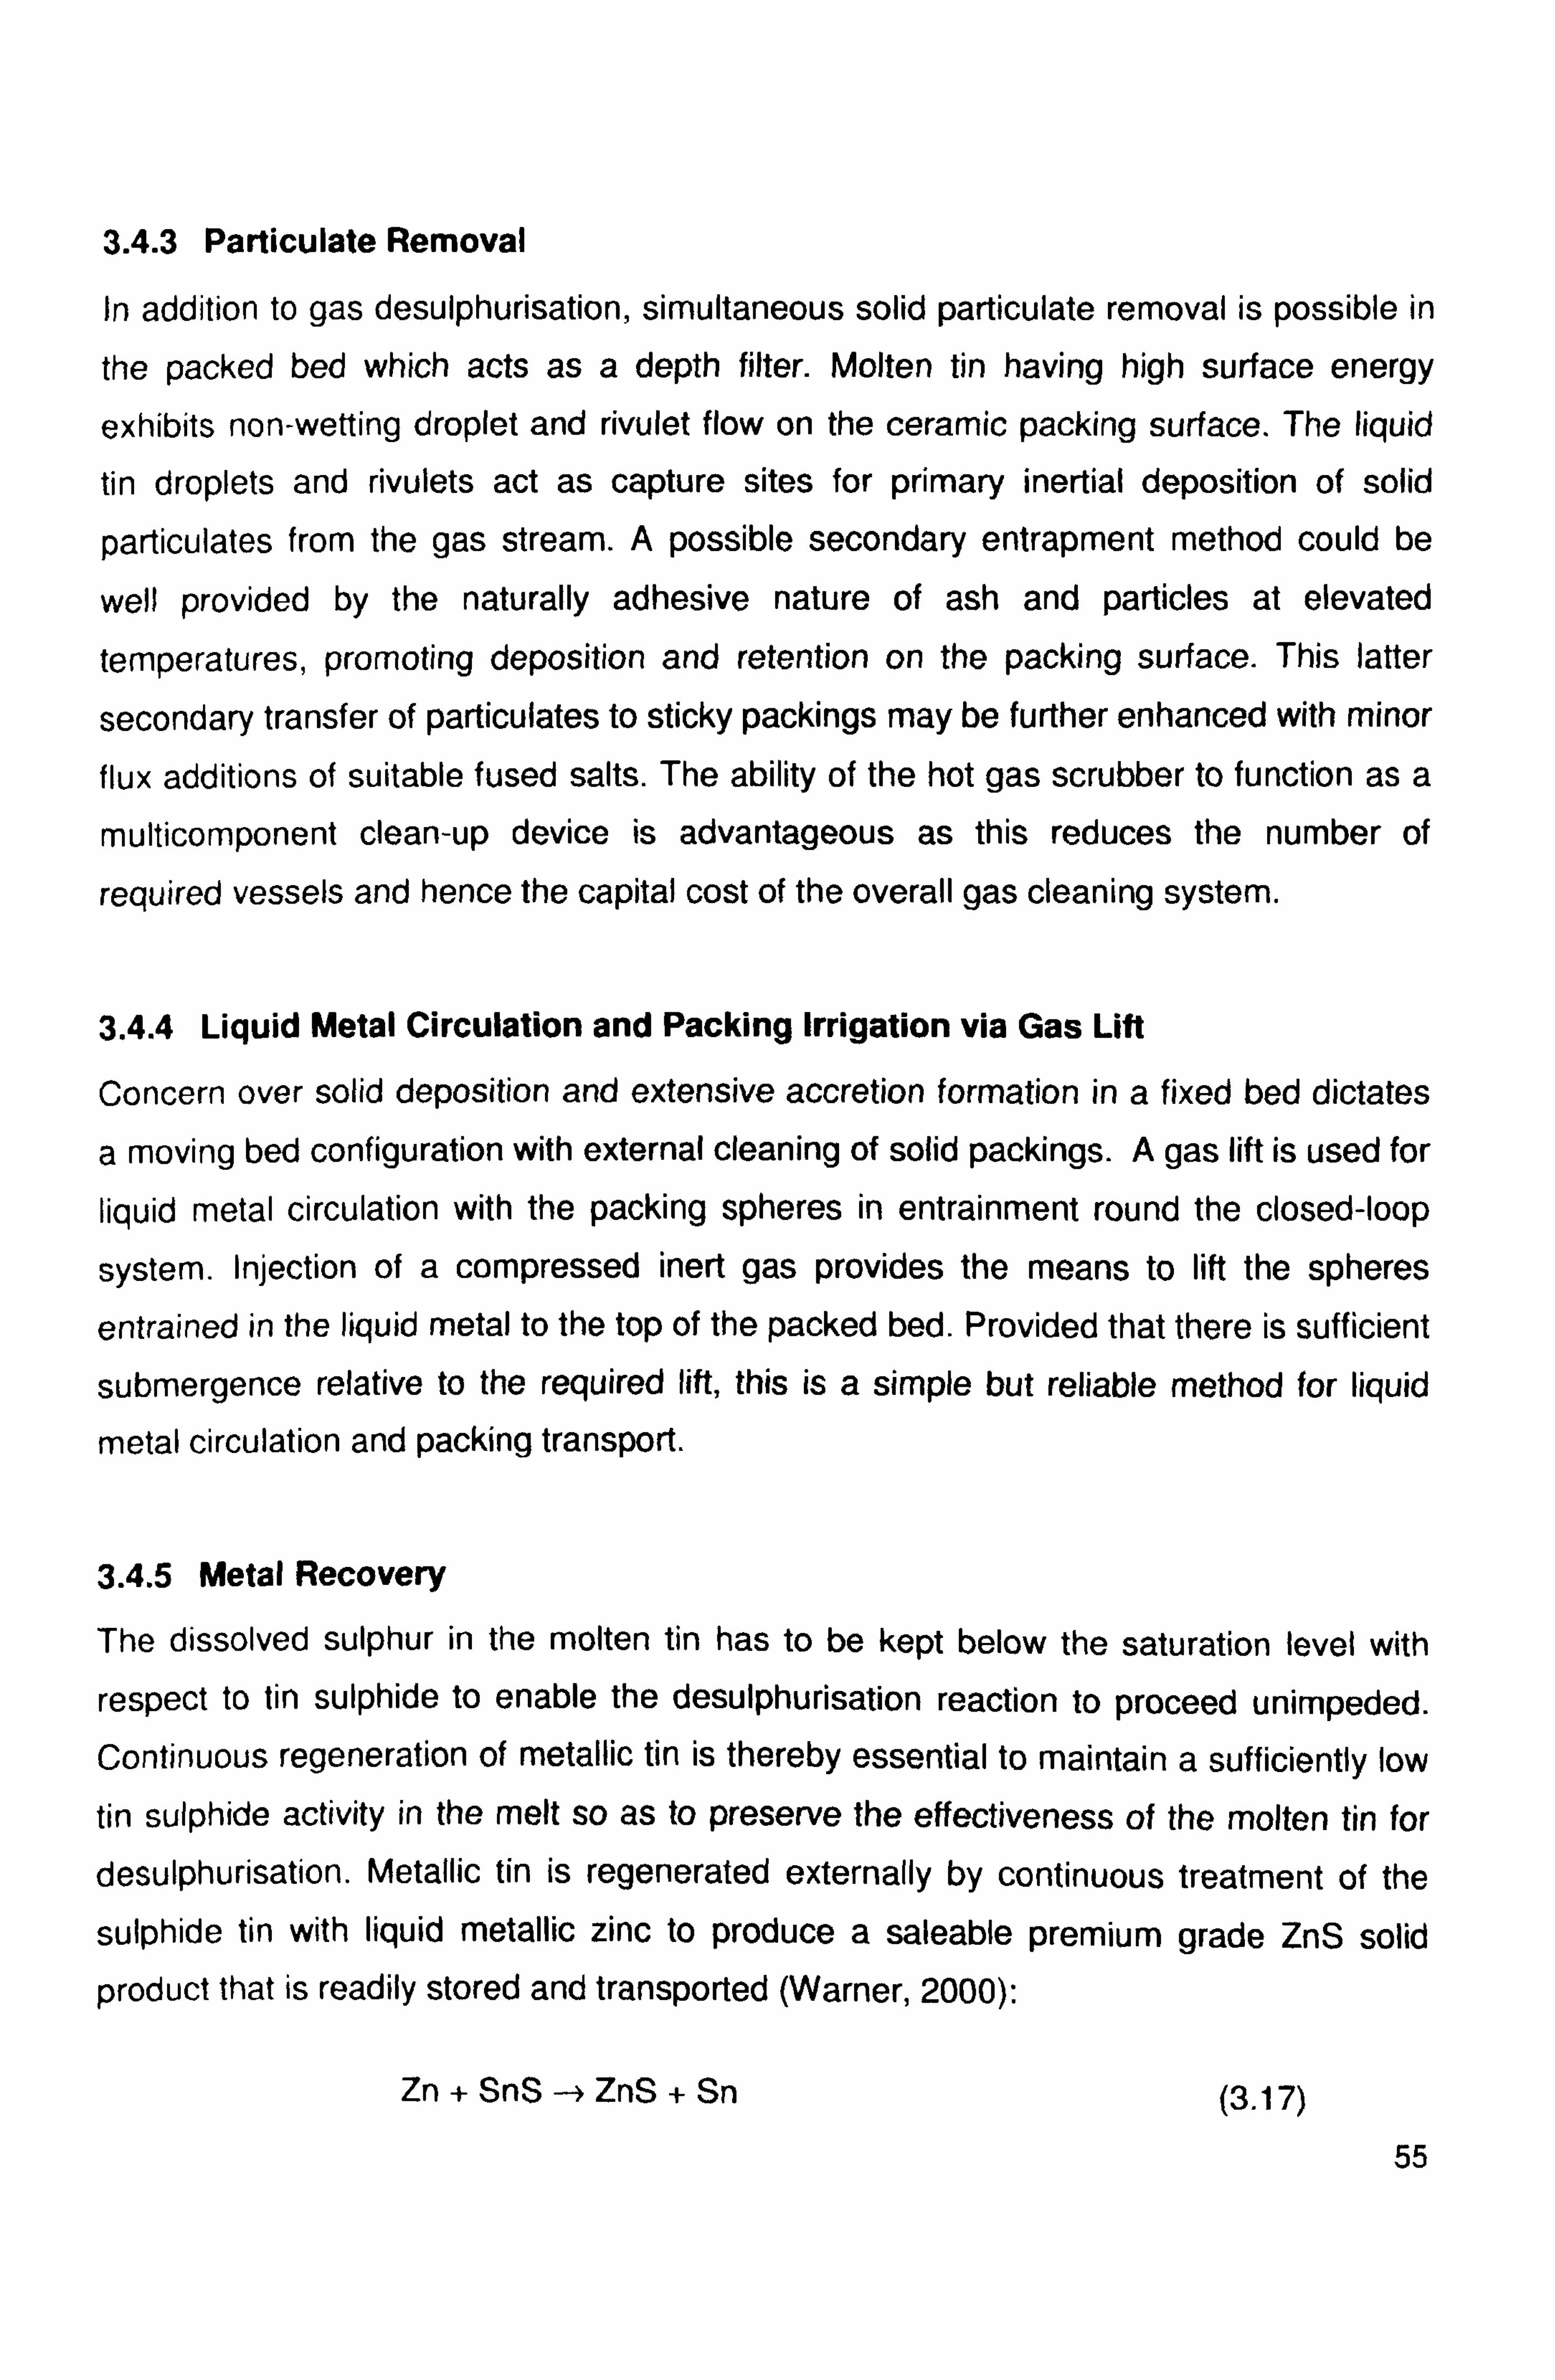
3.4.3 Particulate Removal
In addition to gas desulphurisation, simultaneous solid particulate removal is possible in
the packed bed which acts as a depth filter. Molten tin having high surface energy
exhibits non-wetting droplet and rivulet flow on the ceramic packing surface. The liquid
tin droplets and rivulets act as capture sites for primary inertial deposition of solid
particulates from the gas stream. A possible secondary entrapment method could be
well provided by the naturally adhesive nature of ash and particles at elevated
temperatures, promoting deposition and retention on the packing surface. This latter
secondary transfer of particulates to sticky packings may be further enhanced with minor
flux additions of suitable fused salts. The ability of the hot gas scrubber to function as a
multicomponent clean-up device is advantageous as this reduces the number of
required vessels and hence the capital cost of the overall gas cleaning system.
3.4.4 Liquid Metal Circulation and Packing Irrigation via Gas Lift
Concern over solid deposition and extensive accretion formation in a fixed bed dictates
a moving bed configuration with external cleaning of solid packings. A gas lift is used for
liquid metal circulation with the packing spheres in entrainment round the closed-loop
system. Injection of a compressed inert gas provides the means to lift the spheres
entrained in the liquid metal to the top of the packed bed. Provided that there is sufficient
submergence relative to the required lift, this is a simple but reliable method for liquid
metal circulation and packing transport.
3.4.5 Metal Recovery
The dissolved sulphur in the molten tin has to be kept below the saturation level with
respect to tin sulphide to enable the desulphurisation reaction to proceed unimpeded. Continuous regeneration of metallic tin is thereby essential to maintain a sufficiently low
tin sulphide activity in the melt so as to preserve the effectiveness of the molten tin for
desulphurisation. Metallic tin is regenerated externally by continuous treatment of the
sulphide tin with liquid metallic zinc to produce a saleable premium grade ZnS solid
product that is readily stored and transported (Warner, 2000):
Zn + SnS -) ZnS + Sn (3.17)
55
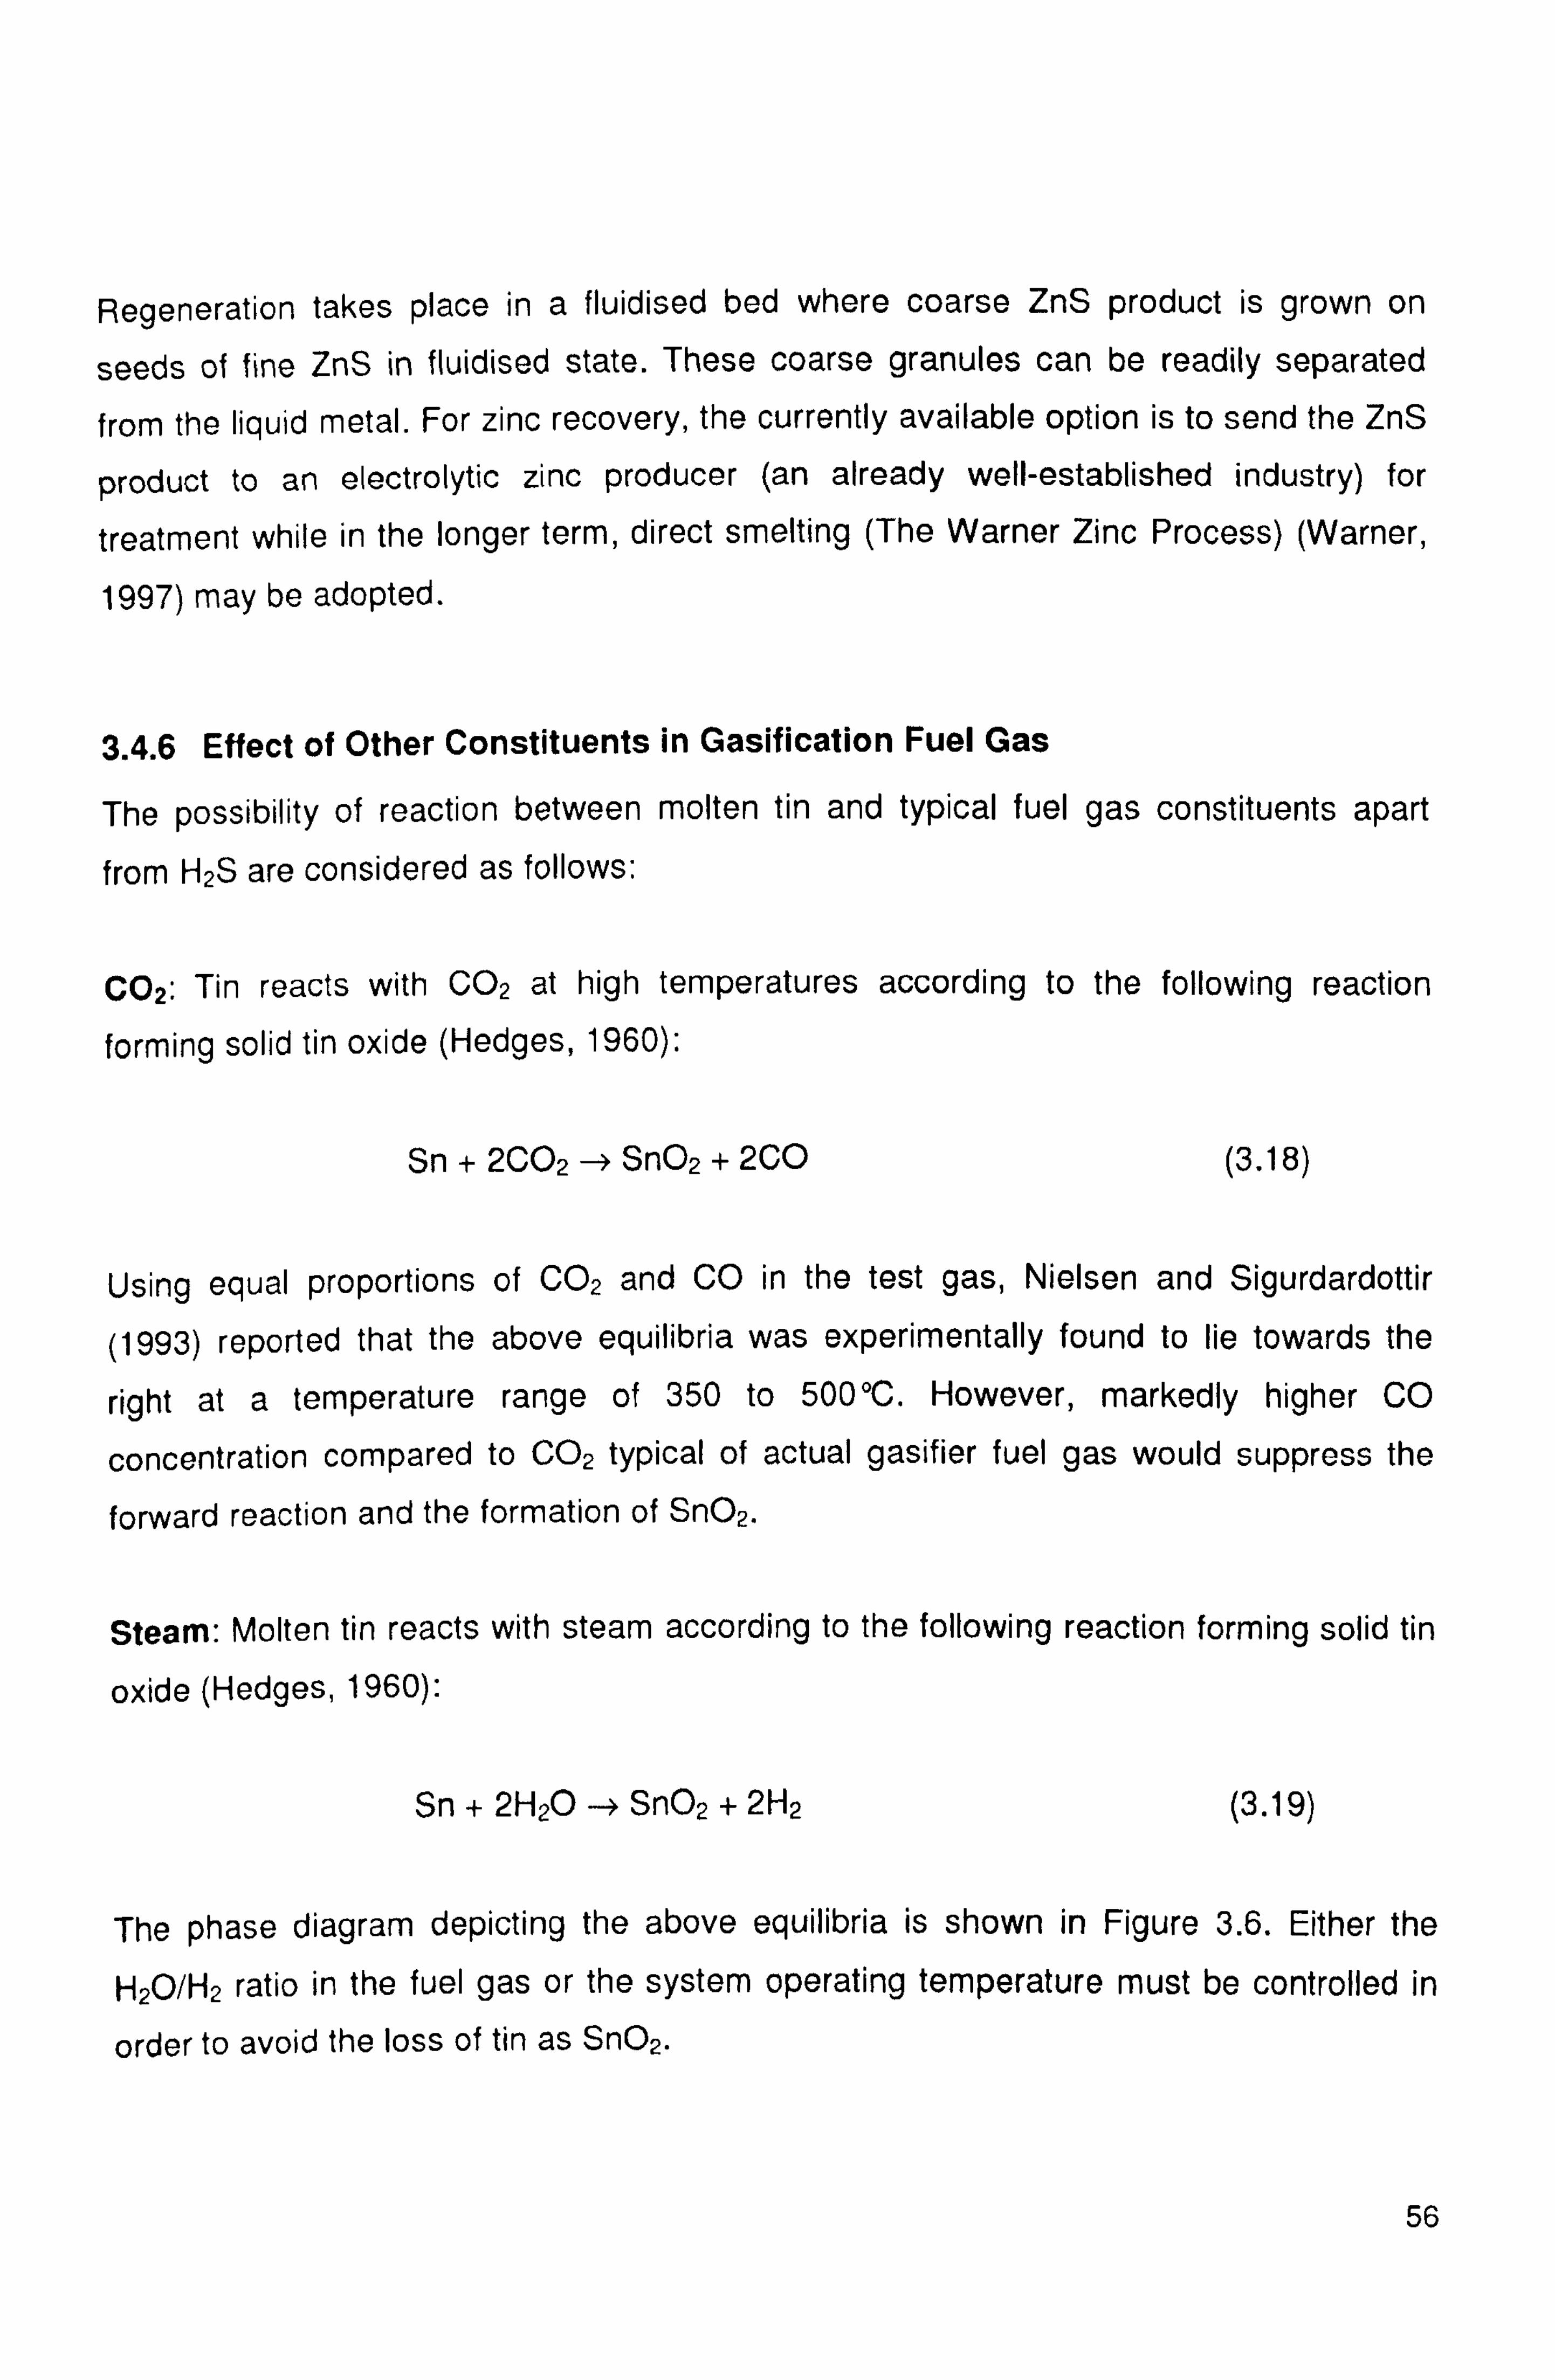
Regeneration takes place in a fluidised bed where coarse ZnS product is grown on
seeds of fine ZnS in fluidised state. These coarse granules can be readily separated
from the liquid metal. For zinc recovery, the currently available option is to send the ZnS
product to an electrolytic zinc producer (an already well-established industry) for
treatment while in the longer term, direct smelting (The Warner Zinc Process) (Warner,
1997) may be adopted.
3.4.6 Effect of Other Constituents in Gasification Fuel Gas
The possibility of reaction between molten tin and typical fuel gas constituents apart
from H2S are considered as follows:
C02: Tin reacts with CO2 at high temperatures according to the following reaction
forming solid tin oxide (Hedges, 1960):
Sn + 2CO2 -p Sn02 + 2CO (3.18)
Using equal proportions of CO2 and CO in the test gas, Nielsen and Sigurdardottir
(1993) reported that the above equilibria was experimentally found to lie towards the
right at a temperature range of 350 to 500 °C. However, markedly higher CO
concentration compared to C02 typical of actual gasifier fuel gas would suppress the
forward reaction and the formation of Sn02.
Steam: Molten tin reacts with steam according to the following reaction forming solid tin
oxide (Hedges, 1960):
Sn + 2H20 -4 Sn02 + 2H2 (3.19)
The phase diagram depicting the above equilibria is shown in Figure 3.6. Either the
H20/H2 ratio in the fuel gas or the system operating temperature must be controlled in
order to avoid the loss of tin as Sn02.
56
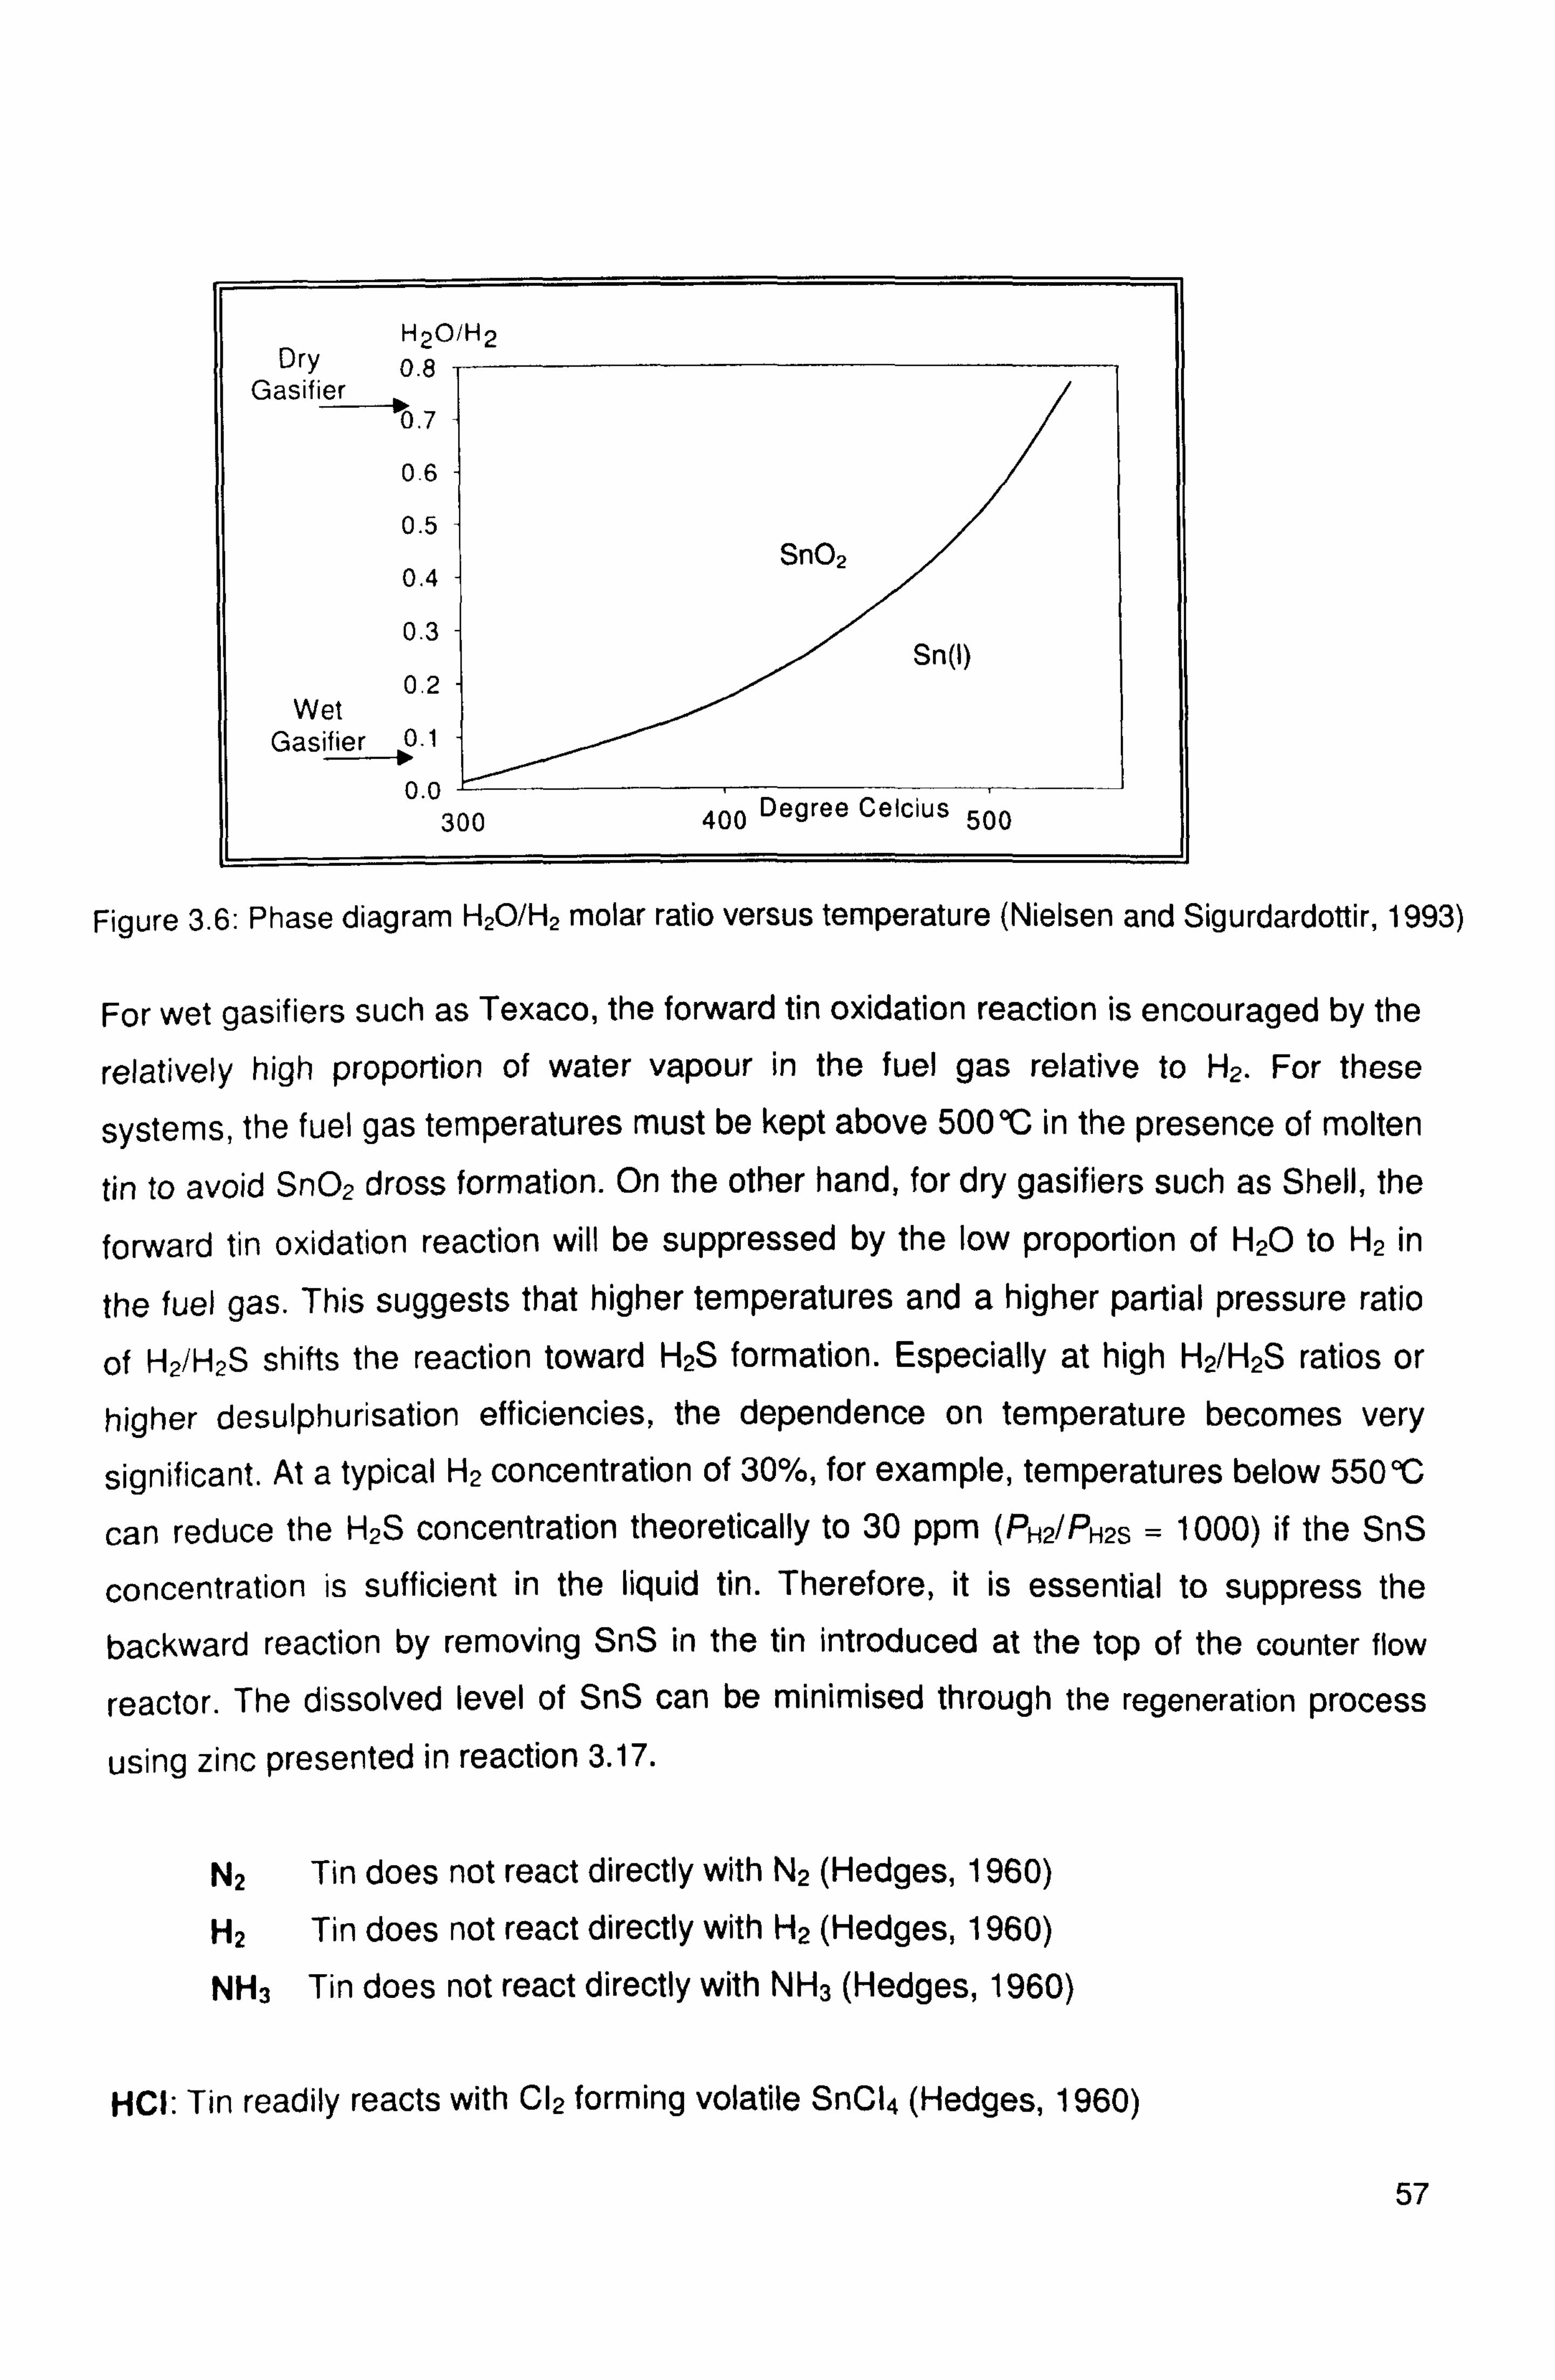
H20/H2 Dry 0.8
Gasifier --ý0.7
0.6
0.5 Sn02
0.4
0.3 Sn(I)
0.2 Wet
Gasifier 01 > 0.0
300 400 Degree Celcius 500
Figure 3.6: Phase diagram H20/H2 molar ratio versus temperature (Nielsen and Sigurdardottir, 1993)
For wet gasifiers such as Texaco, the forward tin oxidation reaction is encouraged by the
relatively high proportion of water vapour in the fuel gas relative to H2. For these
systems, the fuel gas temperatures must be kept above 500°C in the presence of molten
tin to avoid Sn02 dross formation. On the other hand, for dry gasifiers such as Shell, the
forward tin oxidation reaction will be suppressed by the low proportion of H20 to H2 in
the fuel gas. This suggests that higher temperatures and a higher partial pressure ratio
of H2/H2S shifts the reaction toward H2S formation. Especially at high H2/H2S ratios or
higher desulphurisation efficiencies, the dependence on temperature becomes very
significant. At a typical H2 concentration of 30%, for example, temperatures below 550°C
can reduce the 1-12S concentration theoretically to 30 ppm (PH2/PH2S = 1000) if the SnS
concentration is sufficient in the liquid tin. Therefore, it is essential to suppress the
backward reaction by removing SnS in the tin introduced at the top of the counter flow
reactor. The dissolved level of SnS can be minimised through the regeneration process
using zinc presented in reaction 3.17.
N2 Tin does not react directly with N2 (Hedges, 1960)
H2 Tin does not react directly with H2 (Hedges, 1960)
NH3 Tin does not react directly with NH3 (Hedges, 1960)
HCI: Tin readily reacts with C12 forming volatile SnCl4 (Hedges, 1960)
57

Although there is no information regarding the reaction between tin with HCI i. e. the
main form of chlorine in gasifier fuel gas, it is possible that the reaction, if any, may take
the following form:
Sn + 4HCI ---> SnCI4 + 2H2 (3.20)
However the very high H2 to HCI ratio in the fuel gas would suppress the forward
reaction, and therefore the reaction of HCI with molten tin is highly unlikely.
Trace heavy metals: Molten tin can potentially reduce arsenic, lead and mercury down
to very low limits (Warner, 2001). It is worth noting that contrary to Hedges (1960) and Hedden et at., (1986) reported that the presence of H2, H2O, CO and C02 did not affect
the degree of H2S conversion with tin in tests conducted in a small scale reactor at 400
to 700 °C.
3.5 Defining the Research Scope-Investigation of a Packed Bed Scrubber
A fresh and radical approach may provide the key to overcome the inherent limitations of
current regenerable metal oxide sorbents employed in hot gas desulphurisation.
Warner's (2000,2001) proposed liquid metal scrubber is one such innovative way
forward in hot gas cleaning, processing not only sulphur removal capability but the
potential for particulate control as well. The aim of this research project is to perform
studies of hot gas cleaning using a pilot unit of the high temperature gas scrubbing by
liquid. Liquid tin introduced at the top of the packed bed disintegrates into discrete
droplets and rivulets flowing downwards by gravity, countercurrently to an upward
nitrogen gas flow. Laboratory hot experiments would concentrate on the particulate
removal and gas absorption performance of the packed bed column. The regeneration
of tin sulphide by metallic zinc is also of interest in this investigation. It is pointed out
herein that the system in the current study incorporated a fixed bed rather than a moving
bed as the proposed liquid metal scrubber. Accordingly, the gas lift studies are limited to
liquid circulation and are not extended to packing transport. Nevertheless, the findings
will undoubtedly be useful in advancing towards an actual moving packed bed scrubber.
58

CHAPTER FOUR
Packed Bed Wet Scrubber for Hot Fuel Gas Cleaning - Theory
This chapter reviews the fundamentals and theories governing the design and
operation of the packed bed wet scrubber used in this project. The theory of packed
columns regarding hot gas cleaning has been extensively reviewed by Chang (2003).
The major parts of a packed column are first considered followed by the operation of
the packed bed scrubber system along with important design criteria. The operating
variables affecting wet scrubber operation are then explored, encompassing the
pressure drop, liquid-to-gas ratio, gas velocity, as well as the collection efficiency of
packed bed scrubbers for particles and gases.
4.1 Gas-Solid Separation (Particulate Cleaning)
The term gas-solid separation used herein refers to the removal of solid particles from a gas stream. Three main processes are involved in the separation of solid
particles from a gas:
* Particle transport from the gas onto a collector surface and its retention on the
collector * Removal of the retained particles from the collector surface * Solids disposal from the gas cleaning equipment
4.1.1 Particle Collection
Wet scrubbers capture relatively small dust particles with large liquid droplets. In
most wet scrubbing systems, the droplets produced are generally larger than 50 pm
(typically in the 150 to 500 gm). For example, particles produced by mechanical
means (crush or grind) tend to be large (above 10 gm); whereas, particles produced
from combustion or a chemical reaction will have a substantial portion of small (less
than 5 pm) and sub pm -sized particles. The most critical sized particles are those in
the 0.1 to 0.5 pm range because they are the most difficult for wet scrubbers to
collect. The first phase of gas-solid separation during which solid particles carried by
the gas stream are brought into contact with the collector surface is termed the
'collection' or 'capture' process. There are several mechanical collection processes
as shown in Table 4.
59
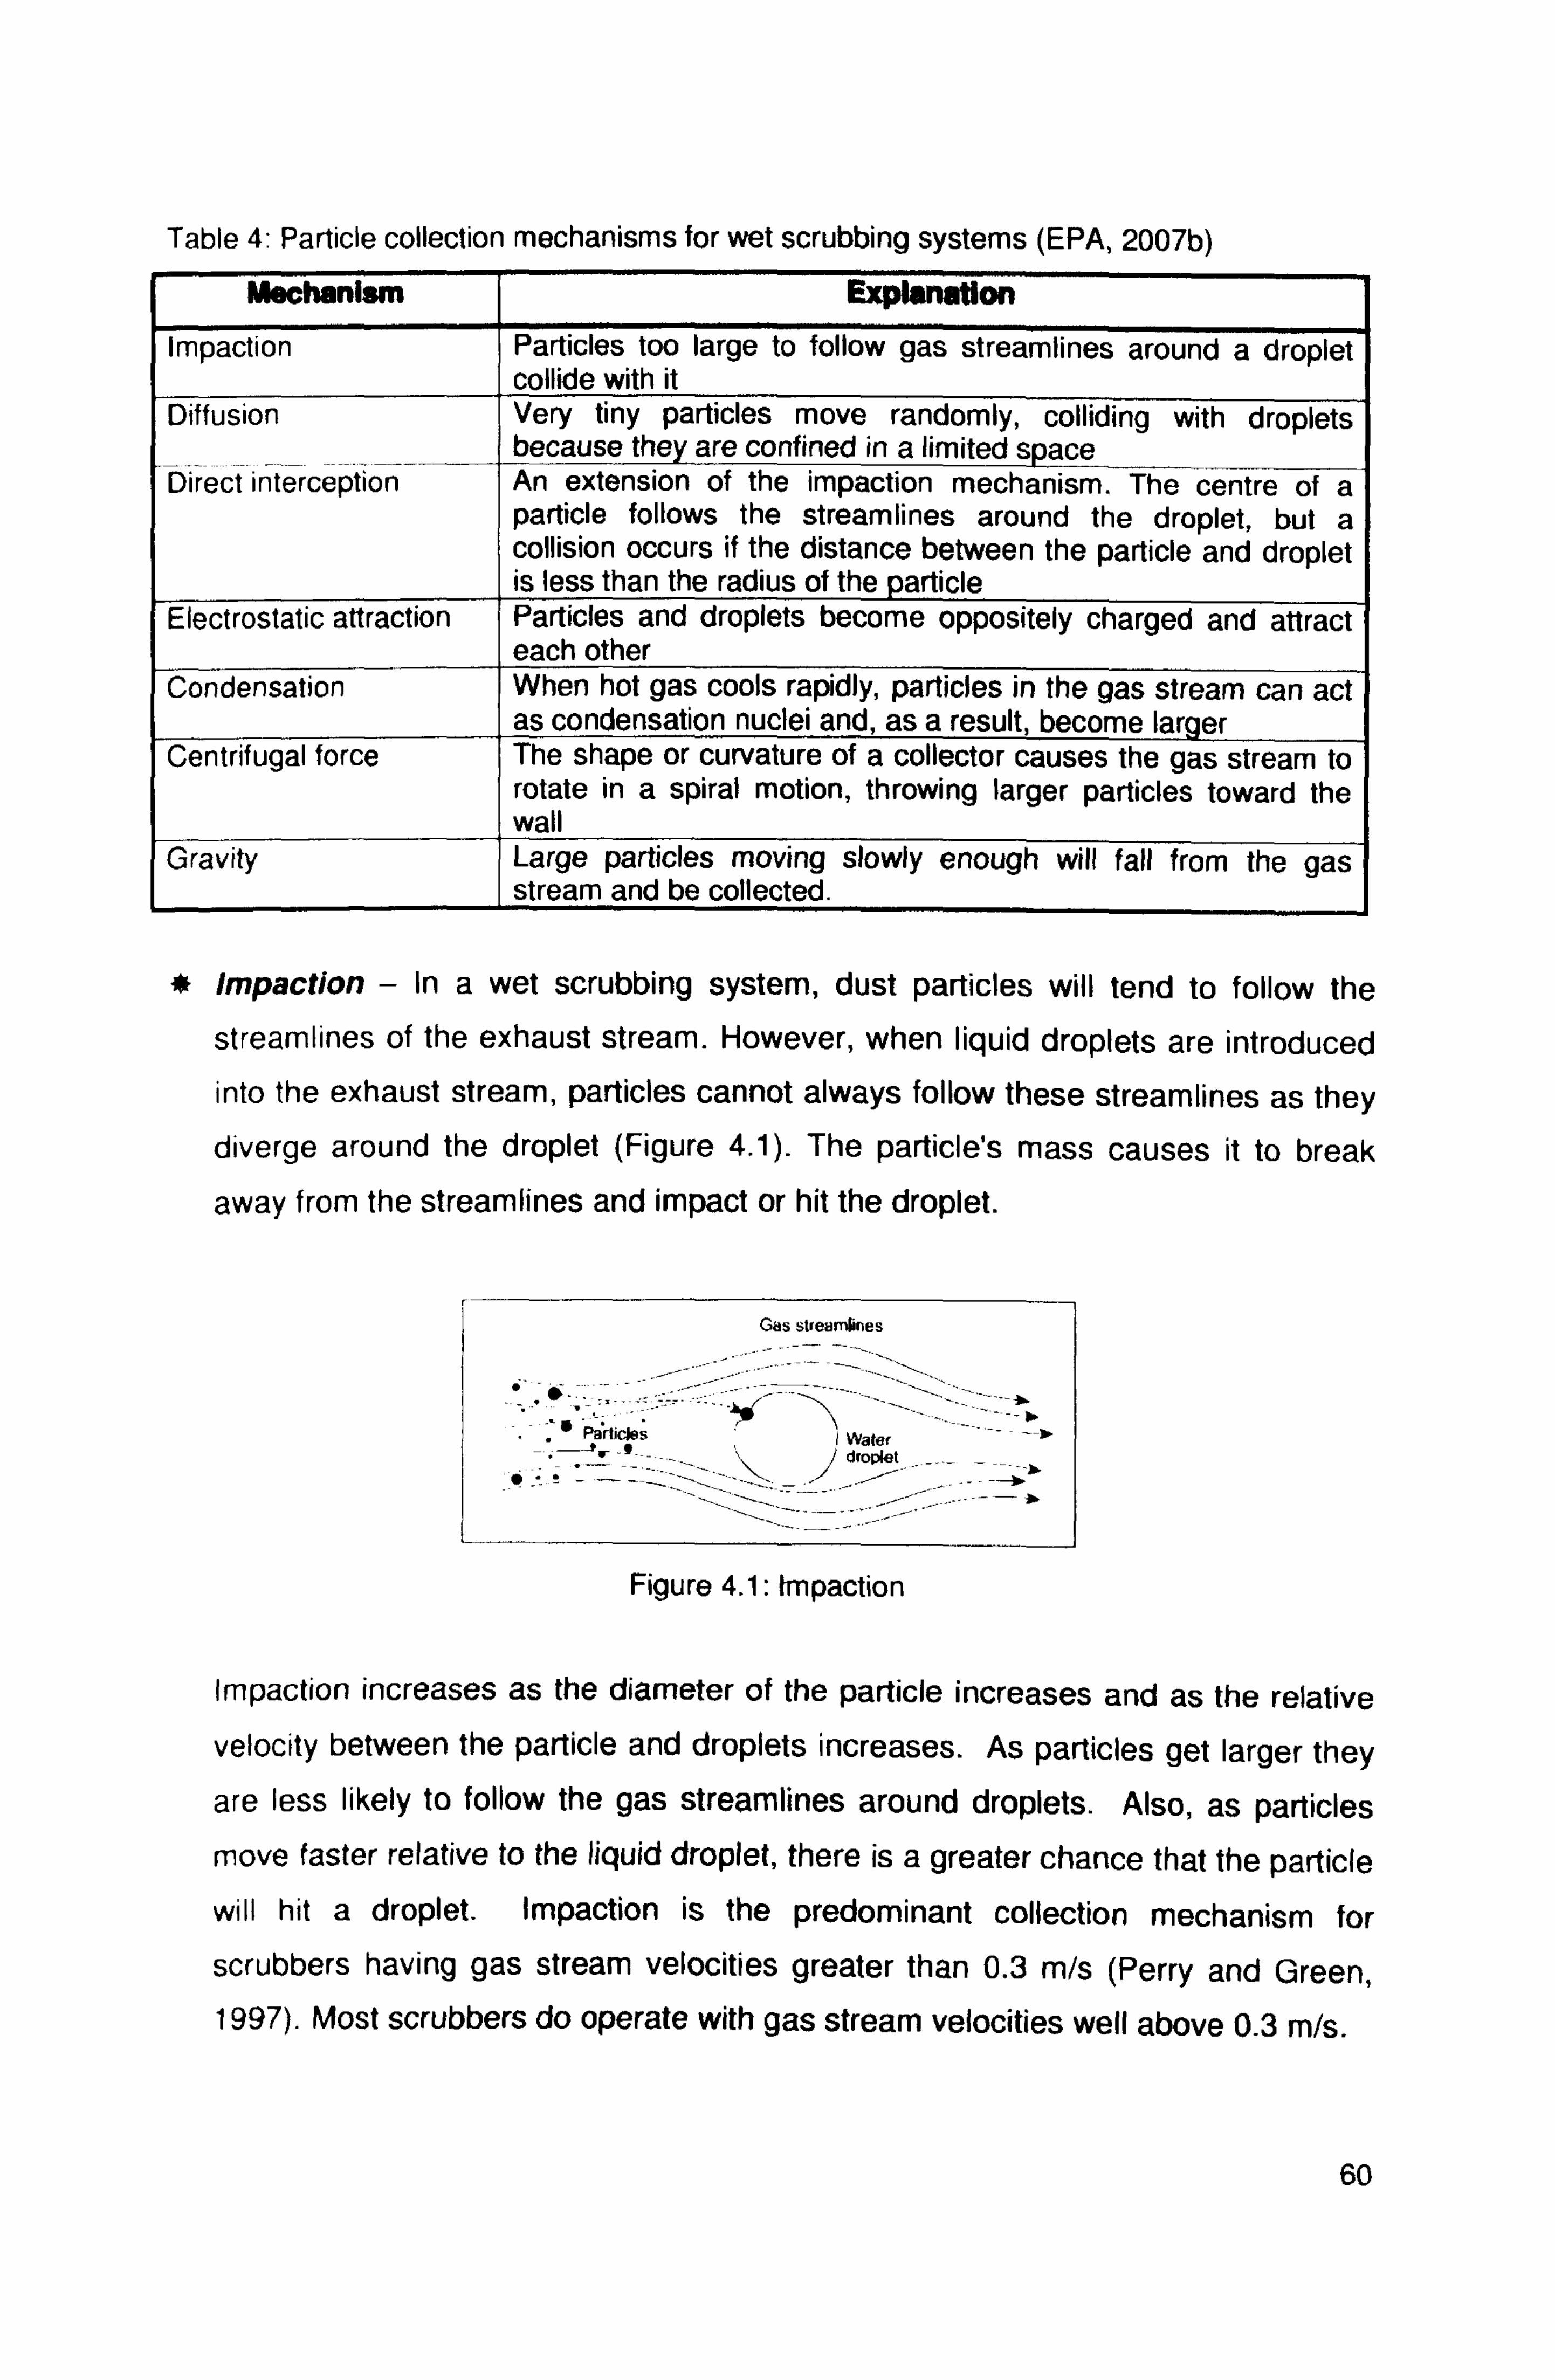
Table 4: Particle collection mechanisms for wet scrubbing systems (EPA, 2007b)
Mechanism Explanation
Impaction Particles too large to follow gas streamlines around a droplet collide with it
Diffusion Very tiny particles move randomly, colliding with droplets because they are confined in a limited space
Direct interception An extension of the impaction mechanism. The centre of a particle follows the streamlines around the droplet, but a collision occurs if the distance between the particle and droplet is less than the radius of the particle
Electrostatic attraction Particles and droplets become oppositely charged and attract each other
Condensation When hot gas cools rapidly, particles in the gas stream can act as condensation nuclei and, as a result, become larger
Centrifugal force The shape or curvature of a collector causes the gas stream to rotate in a spiral motion, throwing larger particles toward the wall
Gravity Large particles moving slowly enough will fall from the gas stream and be collected.
Impaction - In a wet scrubbing system, dust particles will tend to follow the
streamlines of the exhaust stream. However, when liquid droplets are introduced
into the exhaust stream, particles cannot always follow these streamlines as they
diverge around the droplet (Figure 4.1). The particle's mass causes it to break
away from the streamlines and impact or hit the droplet.
Gas streamlines
-. -i Particles -
..
I Water -- - --s - -ýý -f / droplet
Figure 4.1: Impaction
Impaction increases as the diameter of the particle increases and as the relative
velocity between the particle and droplets increases. As particles get larger they
are less likely to follow the gas streamlines around droplets. Also, as particles
move faster relative to the liquid droplet, there is a greater chance that the particle
will hit a droplet. Impaction is the predominant collection mechanism for
scrubbers having gas stream velocities greater than 0.3 m/s (Perry and Green,
1997). Most scrubbers do operate with gas stream velocities well above 0.3 m/s.
60

Therefore, at these velocities, particles having diameters greater than 1.0 pm are
collected by this mechanism. Impaction also increases as the size of the liquid
droplet decreases because the presence of more droplets within the vessel
increases the possibility that particles will impact on the droplets.
Diffusion - Very small particles (less than 0.1 pm in diameter) experience
random movement in an exhaust stream. These particles are so tiny that they are
bumped by gas molecules as they move in the exhaust stream. This bumping, or
bombardment, causes them to first move one way and then another in a random
manner, or to diffuse, through the gas. This irregular motion can cause the
particles to collide with a droplet and be collected (Figure 4.2). Because of this,
diffusion is the primary collection mechanism in wet scrubbers for particles
smaller than 0.1 µm.
Gas streamlines
Parti es Water
'` '/ droplet
Figure 4.2: Diffusion
The rate of diffusion depends on the following:
* The relative velocity between the particle and droplet
The particle diameter
The liquid-droplet diameter.
For both impaction and diffusion, collection efficiency increases with an increase
in relative velocity (liquid- or gas-pressure input) and a decrease in liquid-droplet
size. However, collection by diffusion increases as particle size decreases. This
mechanism enables certain scrubbers to effectively remove the very tiny particles
(less than 0.1 µm). In the particle size range of approximately 0.1 to 1.0 µm,
neither of these two collection mechanisms (impaction or diffusion) dominates.
61

Other Collection Mechanisms - In recent years, some scrubber manufacturers
have utilised other collection mechanisms such as electrostatic attraction and
condensation to enhance particle collection without increasing power
consumption. In electrostatic attraction, particles are captured by first inducing a
charge on them. Then, the charged particles are either attracted to each other,
forming larger, easier-to-collect particles, or they are collected on a surface.
Condensation of water vapour on particles promotes collection by adding mass to
the particles. Other mechanisms such as gravity, centrifugal force, and direct
interception slightly affect particle collection.
4.1.2 Particle Rebound or Retention
The 'capture' by the aforementioned mechanisms for a dust particle on the collector
surface is not the only deciding factor in ensuring its removal from the gas stream. A
dust particle that collides with the collector surface may either rebound and re-entrain
back into the gas stream or alternatively it will be retained and thereby removed from
the gas. As a result, dust retention is always less than dust collection. Whether
particle 'rebound' or 'retention' takes place depends on the relative strengths of the
energy of the impacting particle and the detachment energy required to separate the
particles from the collector surface (Coury et at., 1987). The total energy of the
impacting particles is a summation of its kinetic energy (includes effects due to long-
range electrostatic force and fluid drag force) and energy due to short-range Van der
Waals forces.
The detachment energy arises from adhesion forces due to Van der Waals
interaction, electrostatic and surface tension capillary effects that tend to hold the
dust particle against the collector surface, all of which are dependent on the
properties of the collector surface and the dust particle itself. Therefore any effects
that tend to raise the detachment energy or lower the particle's approaching energy
will favour adhesion upon impact. An example of the latter is plastic deformation on
collision due to the presence of liquid or adsorbed/condensed films or soft layers on
either the dust or collector surface that dissipates that particle's energy. In addition,
although capture due to inertial impaction increases as particle inertia increases, the
tendency for rebound increases as well and this may eventually dominate.
62
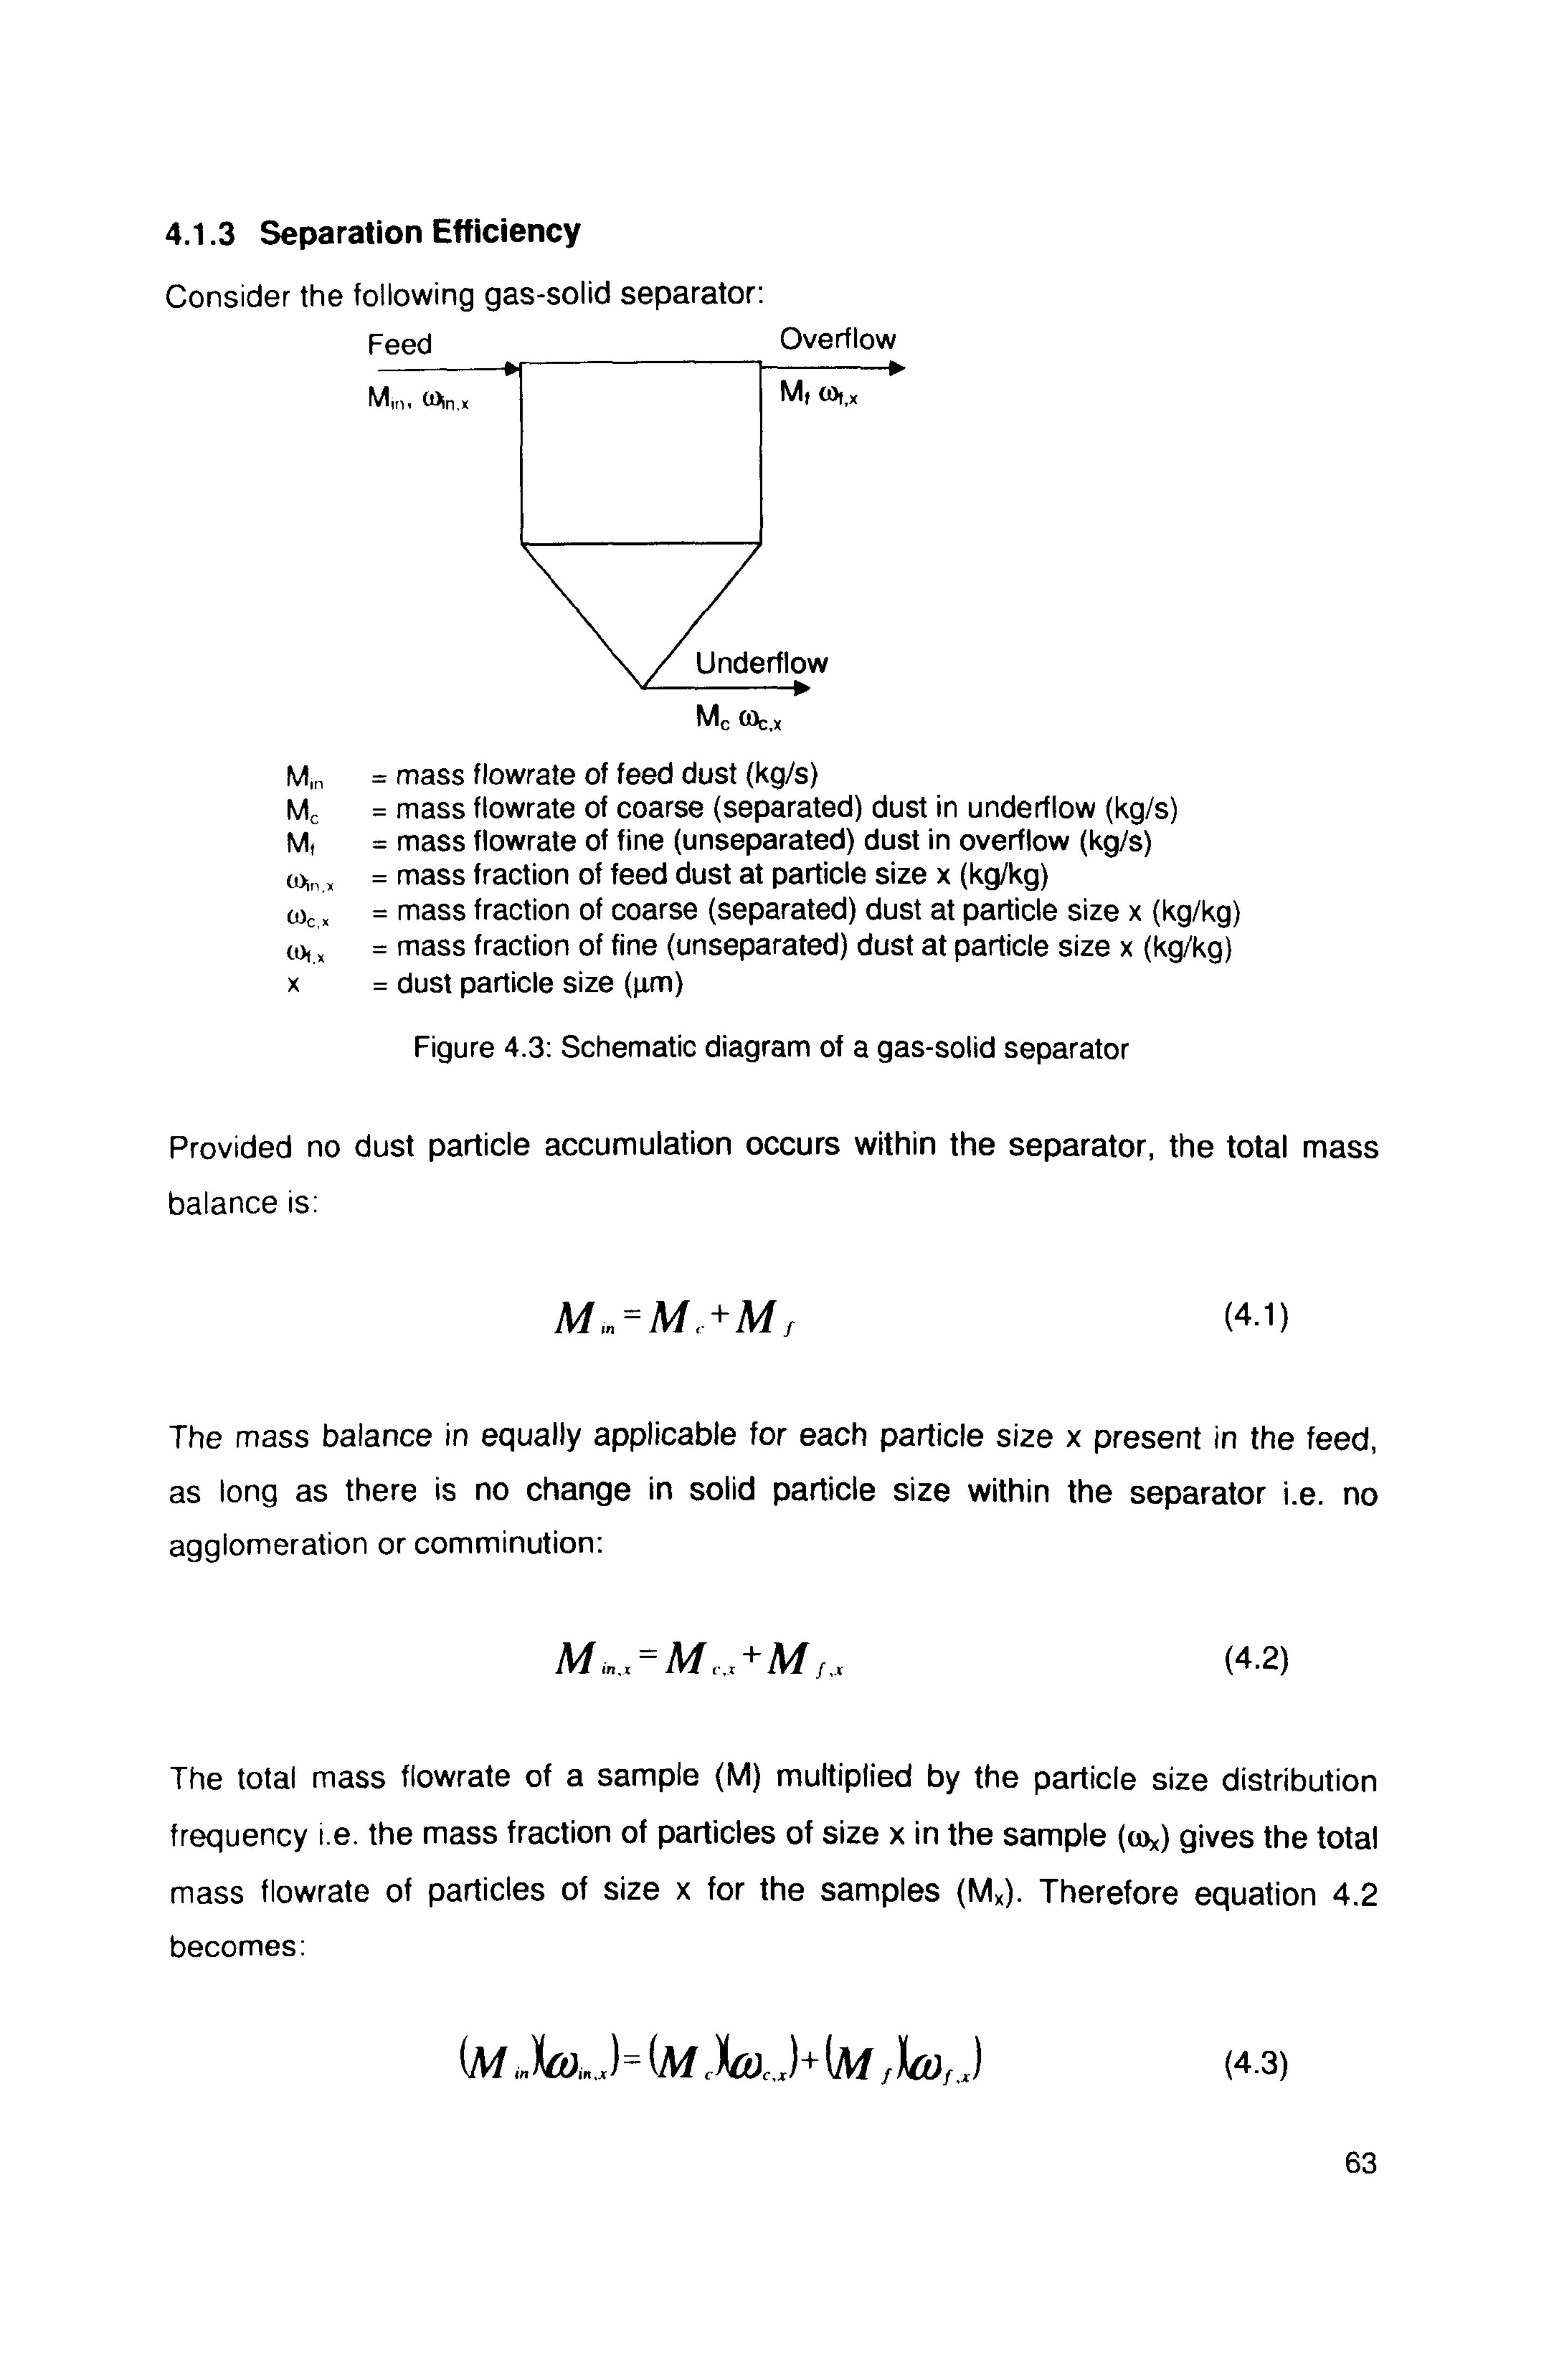
4.1.3 Separation Efficiency
Consider the following gas-solid separator:
Mc wc, x
M" = mass flowrate of feed dust (kg/s) M, = mass flowrate of coarse (separated) dust in underflow (kg/s) M, = mass flowrate of fine (unseparated) dust in overflow (kg/s) uh� = mass fraction of feed dust at particle size x (kg/kg) wý x= mass fraction of coarse (separated) dust at particle size x (kg/kg) qý = mass fraction of fine (unseparated) dust at particle size x (kg/kg) x= dust particle size (gm)
Figure 4.3: Schematic diagram of a gas-solid separator
Provided no dust particle accumulation occurs within the separator, the total mass
balance is:
M; n=M,. +Mf (4.1)
The mass balance in equally applicable for each particle size x present in the feed,
as long as there is no change in solid particle size within the separator i. e. no
agglomeration or comminution:
M; R. x = M`_=+M f. x (4.2)
The total mass flowrate of a sample (M) multiplied by the particle size distribution
frequency i. e. the mass fraction of particles of size x in the sample (o)') gives the total
mass flowrate of particles of size x for the samples (MX). Therefore equation 4.2
becomes:
(i
inxwin. x)
w
c)(Wc.. [)+(m f'�` f, x) (4.3)
63
Feed Overflow

4.1.3.1 Total Efficiency, ET and Number of Transfer Units, Nt
The total or overall efficiency ET is defined as the ratio of mass of all particles
separated to the total mass of solid fed into the separator. Hence
E7 =M` or ET=ý-Mf (4.4) M. Min
Therefore equation 4.3 can be re-expressed as:
CÜ,,,. r=E'r(a),, )+(1-E'r)tCÜj..
r) (4.5)
The total efficiency ET is largely dependent on the size distribution of the feed
material and hence is unsuitable as a general criterion of efficiency for gas-solid
separation equipment. Efficiency is generally an exponential function of the process
variables for most types of collecting devices and therefore is an insensitive function for correlation purpose in the high efficiency range. In this case, the penetration (1- ET) is generally preferable. Even better is the number of transfer units Nt:
I (Chang, 2003) N, =1 nl, ET (4.6)
E, = 1-exp(-N) (Chang, 2003) (4.7)
4.1.3.2 Grade Efficiency, G(x)
Generally for most gas-solid separators, the separation efficiency is dependent on particle size, which brings about the application of grade efficiency G(x). The
gravimetric grade efficiency G(x) is defined as the mass separation efficiency for
specific particle size x:
G(. c) = M,.
ý (4.8)
Using the same argument as that in obtaining equation 4.3
G( . v) _ (4.9)
From the definition of total efficiency ET from equation 4.4:
G(. r1= Er ý` ` (4.10)
64
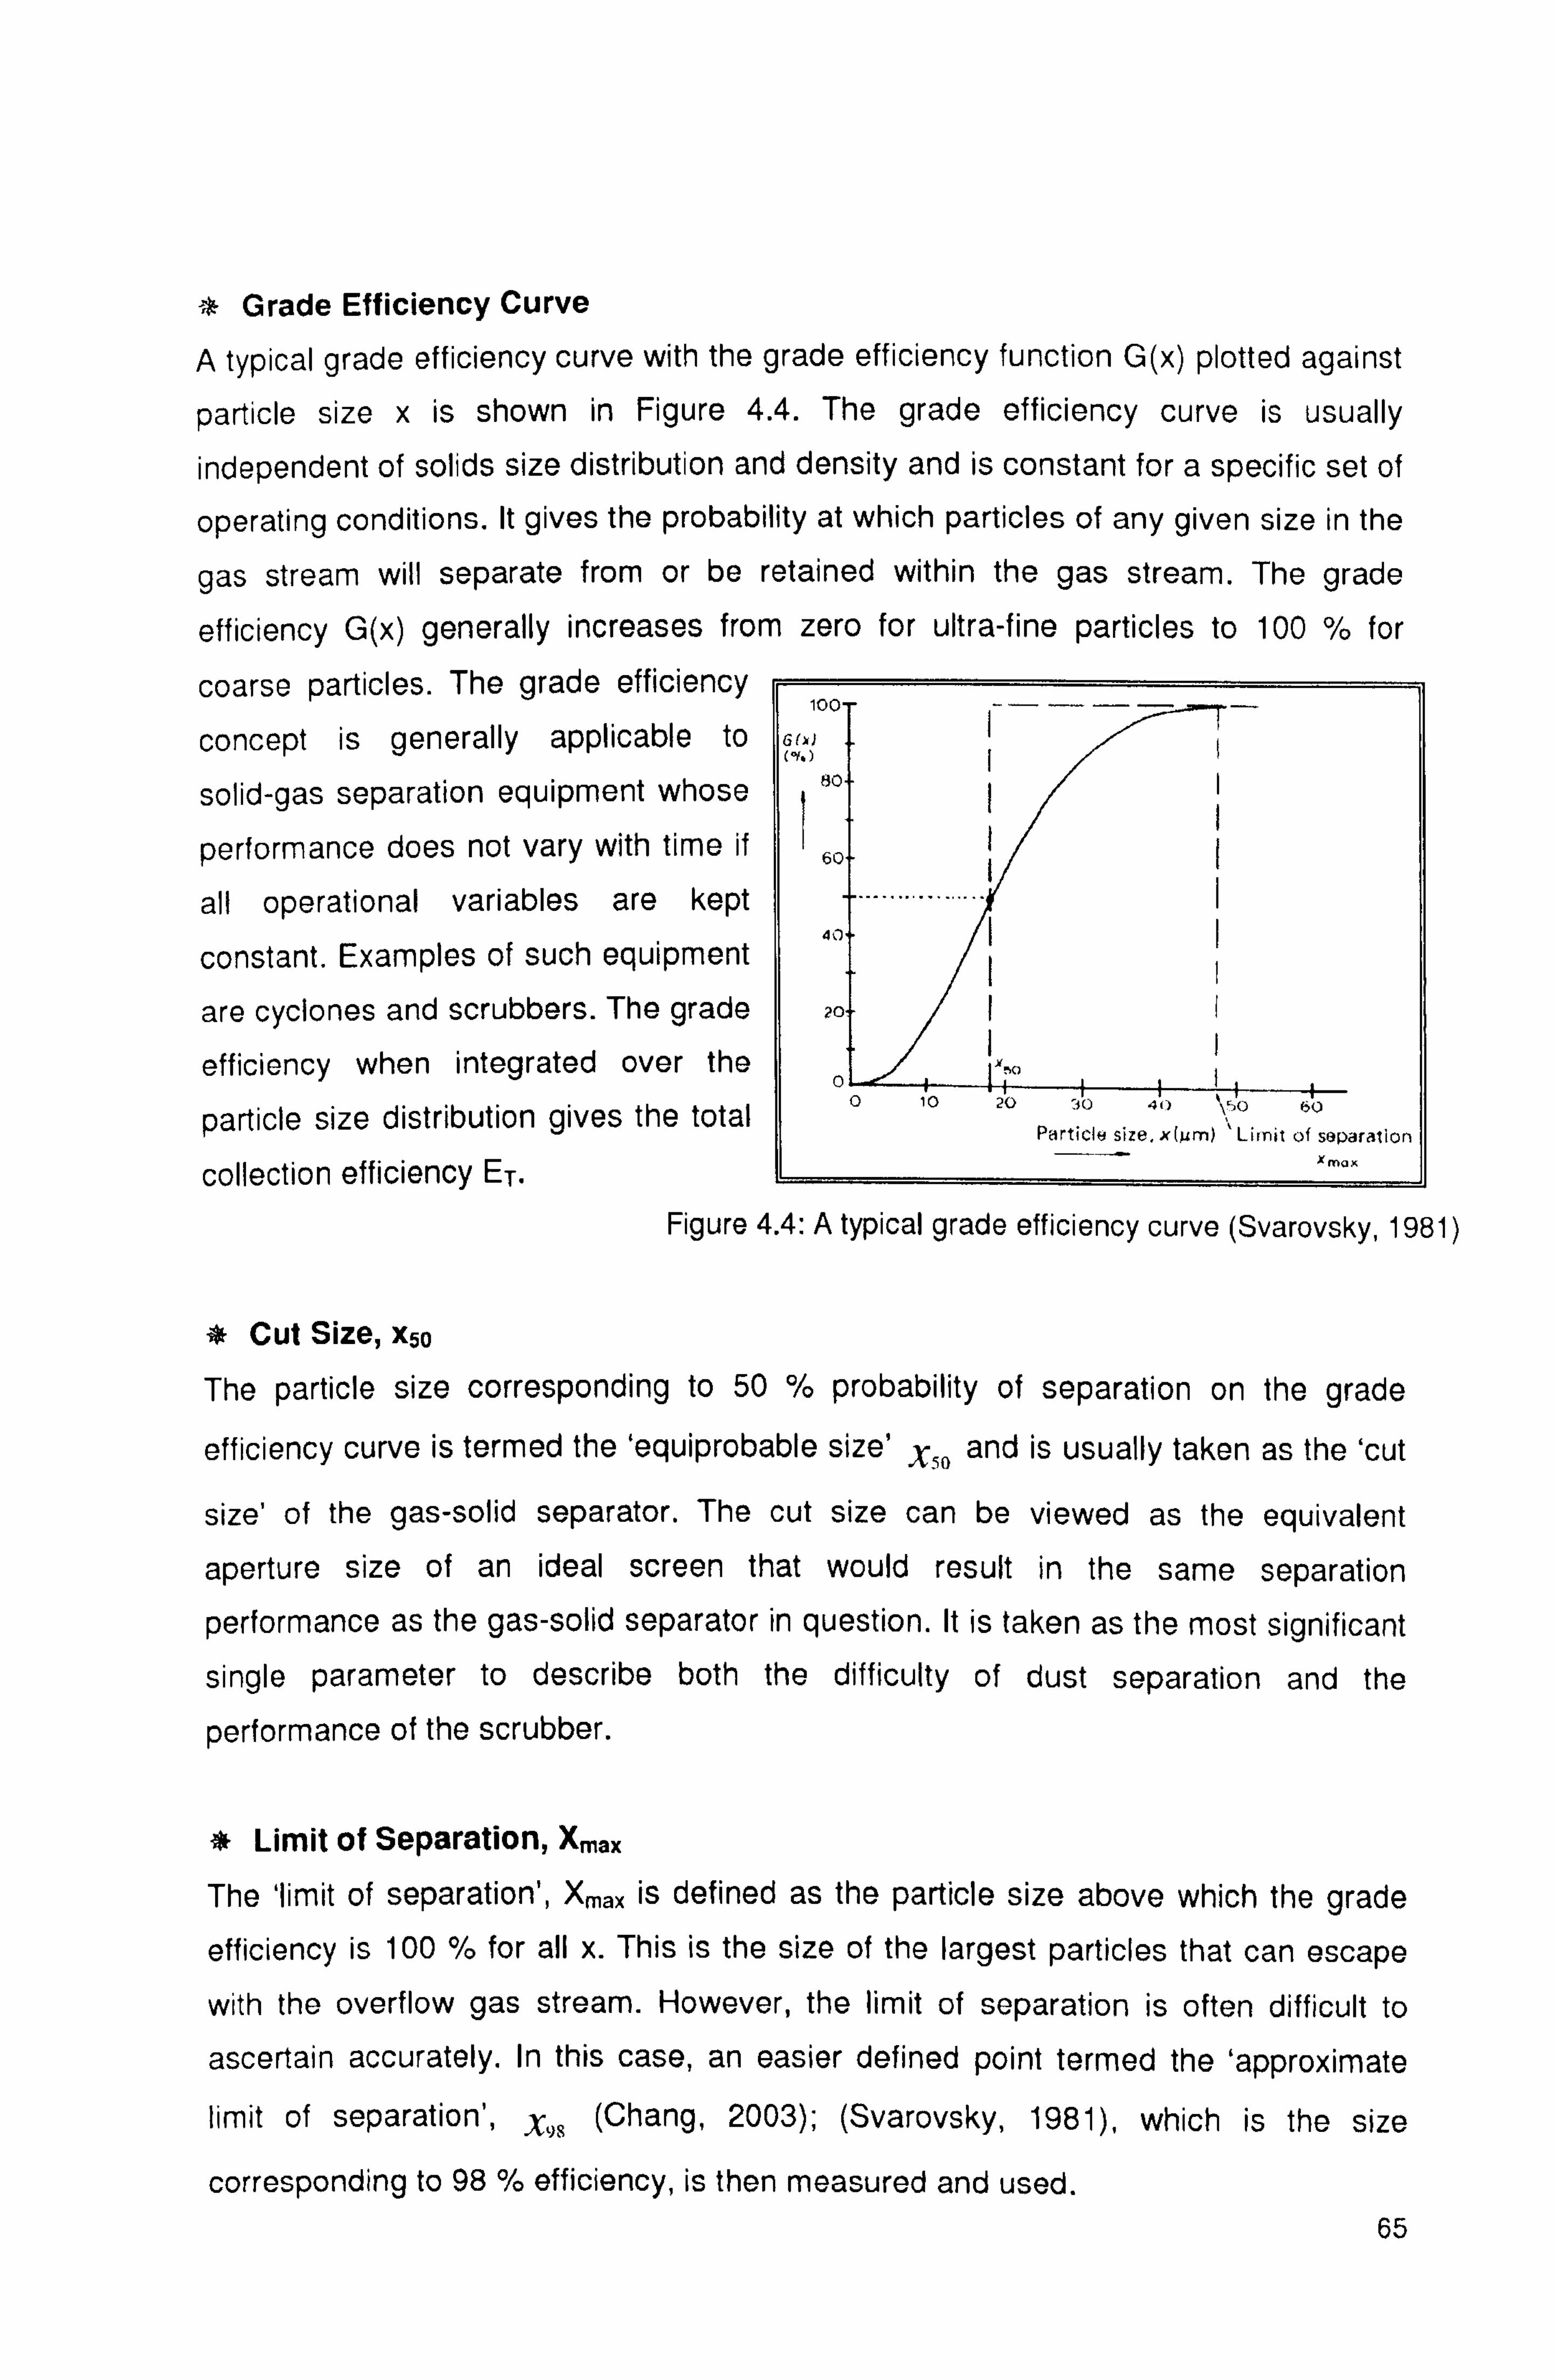
* Grade Efficiency Curve
A typical grade efficiency curve with the grade efficiency function G(x) plotted against
particle size x is shown in Figure 4.4. The grade efficiency curve is usually
independent of solids size distribution and density and is constant for a specific set of
operating conditions. It gives the probability at which particles of any given size in the
gas stream will separate from or be retained within the gas stream. The grade
efficiency G(x) generally increases from zero for ultra-fine particles to 100 % for
coarse particles. The grade efficiency too I- -----
concept is generally applicable to qw solid-gas separation equipment whose 80
performance does not vary with time if 16°
all operational variables are kept ............
constant. Examples of such equipment 40
are cyclones and scrubbers. The grade zo
efficiency when integrated over the 00 10 zo 30 40 \so 60
particle size distribution gives the total Particle size, x(um) Limit of separation
collection efficiency ET. '"°
Figure 4.4: A typical grade efficiency curve (Svarovsky, 1981)
* Cut Size, xso The particle size corresponding to 50 % probability of separation on the grade
efficiency curve is termed the `equiprobable size' x50 and is usually taken as the 'cut
size' of the gas-solid separator. The cut size can be viewed as the equivalent
aperture size of an ideal screen that would result in the same separation
performance as the gas-solid separator in question. It is taken as the most significant
single parameter to describe both the difficulty of dust separation and the
performance of the scrubber.
* Limit of Separation, Xmax
The 'limit of separation', Xmax is defined as the particle size above which the grade
efficiency is 100 % for all x. This is the size of the largest particles that can escape
with the overflow gas stream. However, the limit of separation is often difficult to
ascertain accurately. In this case, an easier defined point termed the 'approximate
limit of separation', x, (Chang, 2003); (Svarovsky, 1981), which is the size
corresponding to 98 % efficiency, is then measured and used. 65

4.1.3.3 Factors Affecting Separation Efficiency
The grade efficiency curve is a function of the following factors:
* Gas flowrate
Gas viscosity
Solids density
* Solid particle shape
* Gas moisture content (affects dispersion of particles in the gas)
* Solids feed concentration (large influence at higher concentrations)
* Specific water consumption (for wet scrubbers)
4.1.3.4 Packed Bed Scrubber
The scrubber of interest herein is the massive packing scrubber (or simply called the
packed bed scrubber in this study) i. e. columns packed with various packing
elements usually used for mass transfer. The packing breaks down the liquid flow
into a film with high surface area. Packing elements are generally too large to serve
as effective collectors except for very large dust particles. In the collection of fine
particles, the packings serve mainly to promote fluid turbulence, enhancing particle
deposition on liquid films or droplets.
The main collection mechanism is inertial deposition, with some contribution from
diffusion for sufficiently small dust particles. Packed bed scrubbers are efficient for
separating particles of 10 µm or larger (Strigle, 1994). Smaller packing gives better
scrubber efficiencies. Unlike in mass transfer, packing shape is relatively unimportant
for gas-solid separation; hence minimal pressure drop is the main selection criterion.
Packing elements are subject to plugging, but are removable for cleaning.
At high solid loadings, large packing elements should be used to prevent blockage by
the solids; higher liquid rates should also be employed to flush off the deposited
solids. In a countercurrent packed bed scrubber, the power supply to the system (as
reflected in the bed pressure drop) is limited by flooding of the column, hence
restricting the achievable separation efficiency.
66
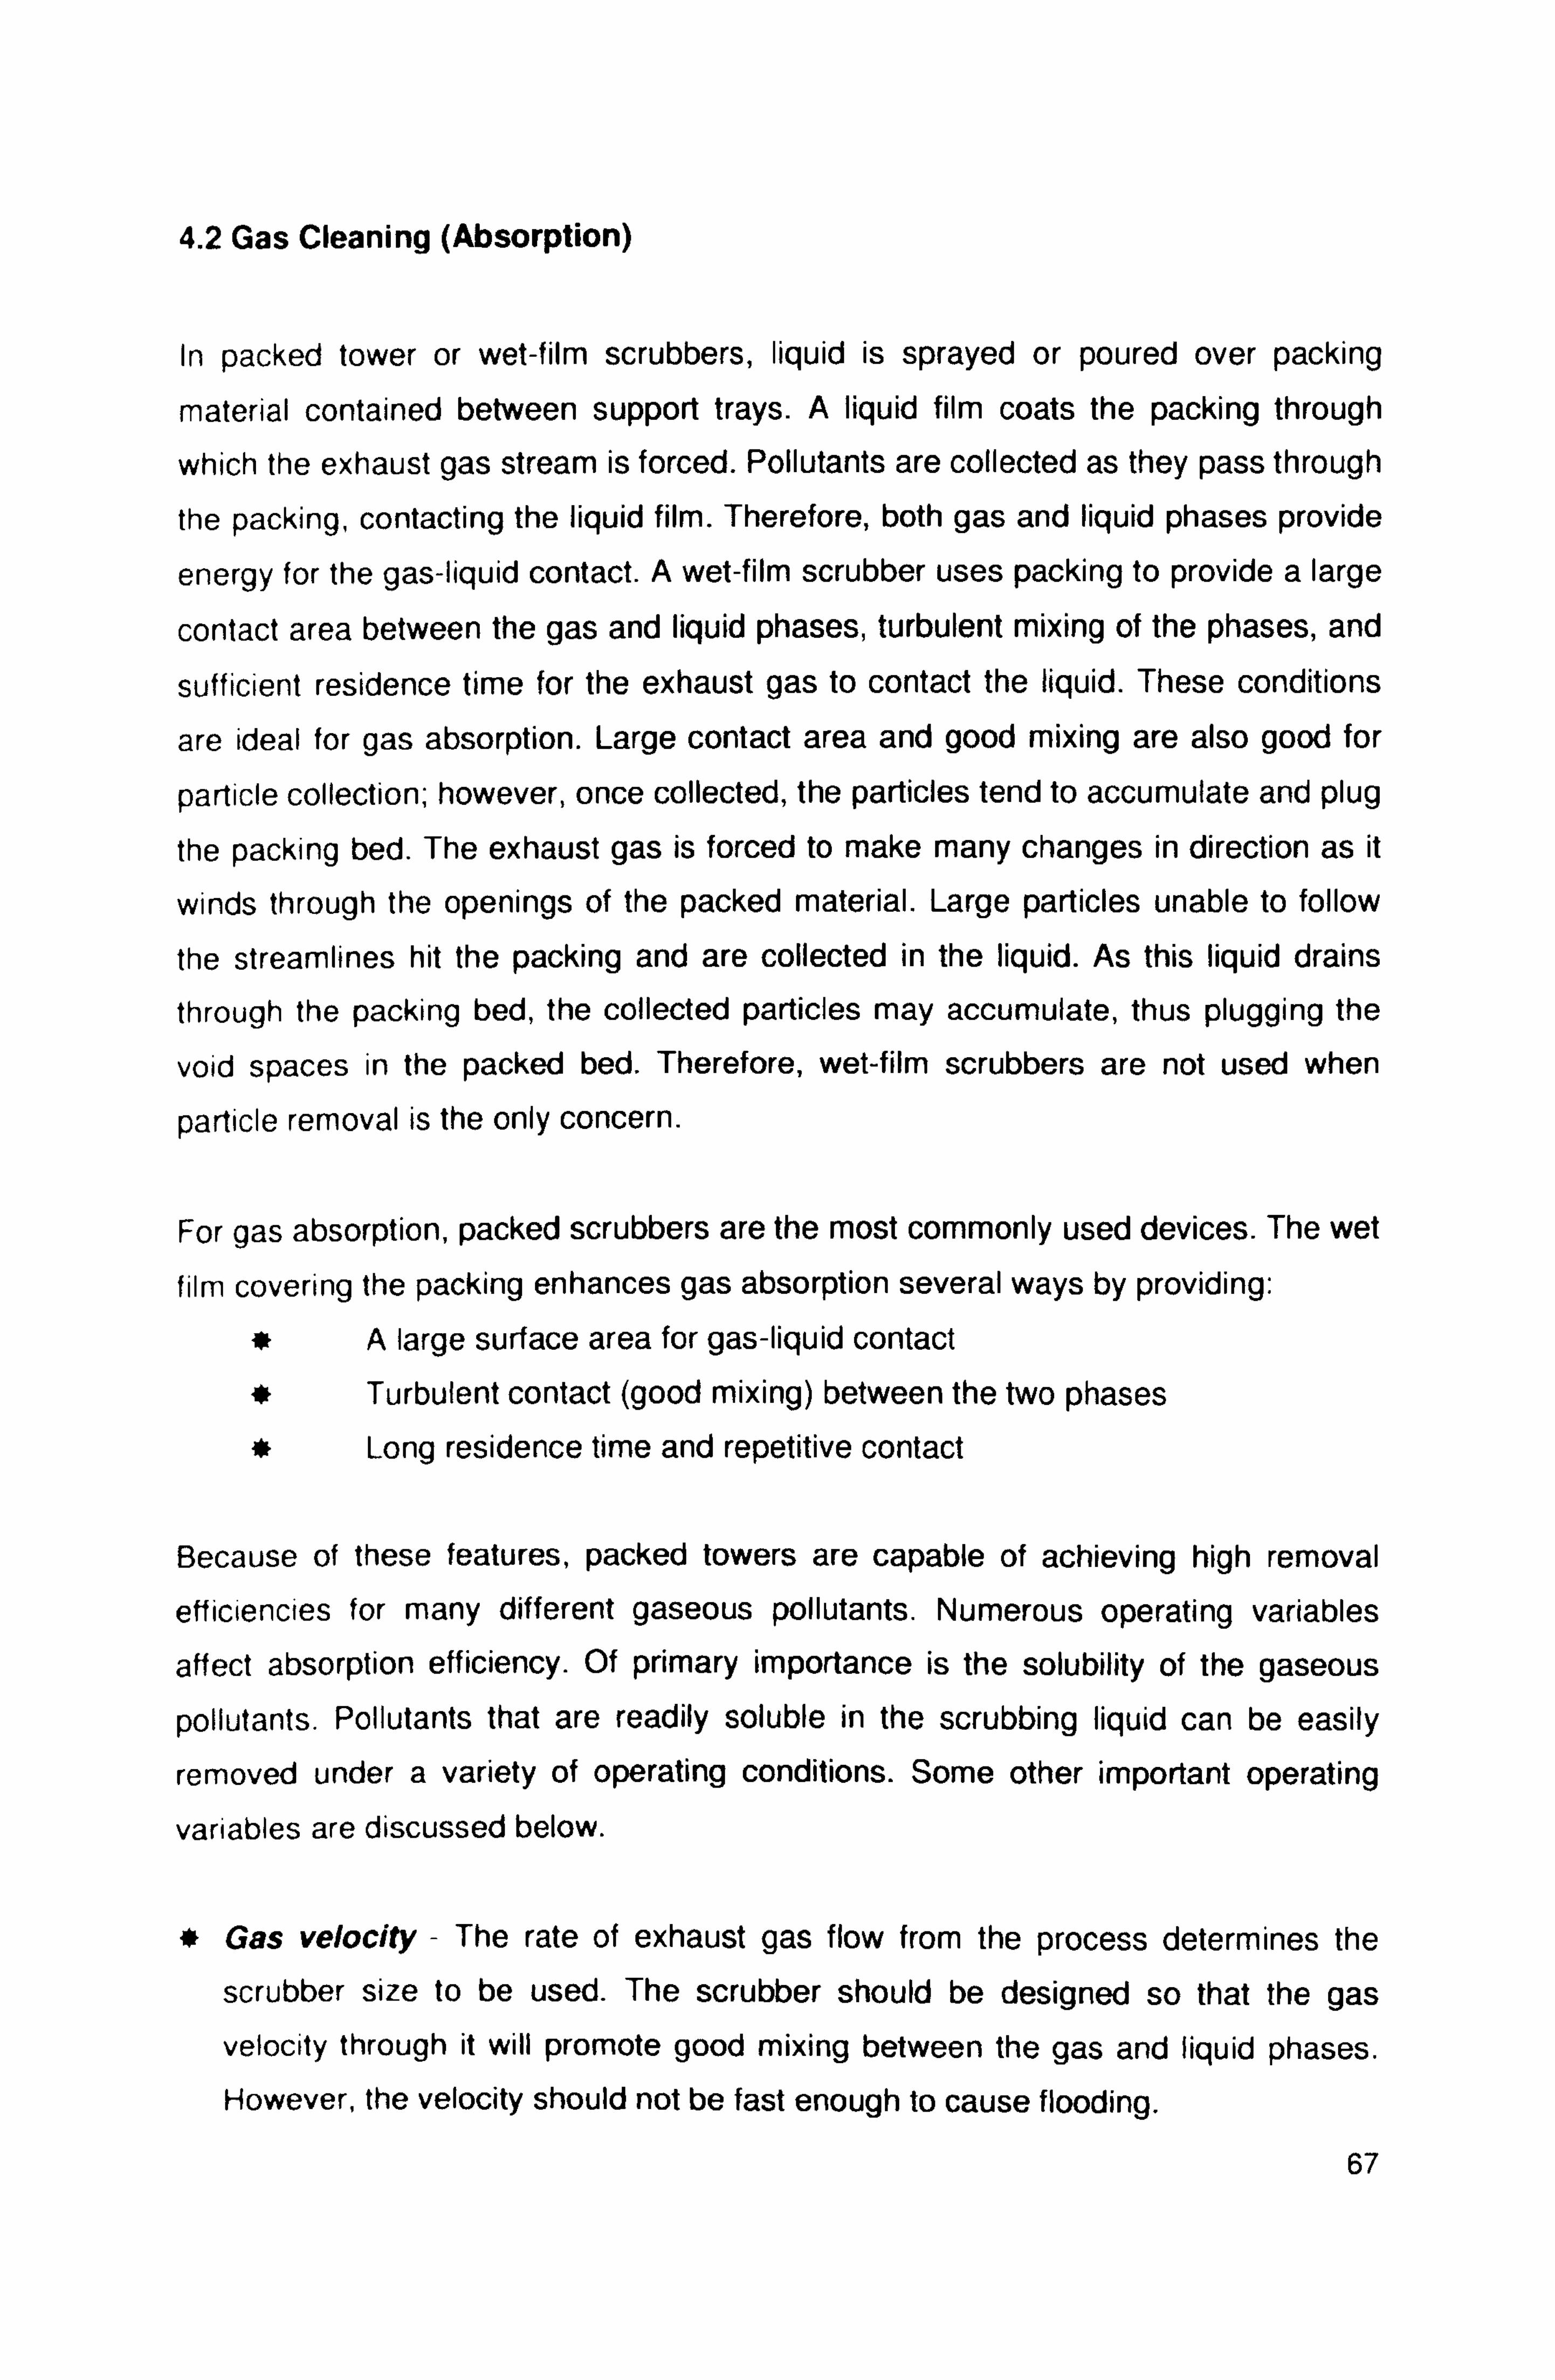
4.2 Gas Cleaning (Absorption)
In packed tower or wet-film scrubbers, liquid is sprayed or poured over packing
material contained between support trays. A liquid film coats the packing through
which the exhaust gas stream is forced. Pollutants are collected as they pass through
the packing, contacting the liquid film. Therefore, both gas and liquid phases provide
energy for the gas-liquid contact. A wet-film scrubber uses packing to provide a large
contact area between the gas and liquid phases, turbulent mixing of the phases, and
sufficient residence time for the exhaust gas to contact the liquid. These conditions
are ideal for gas absorption. Large contact area and good mixing are also good for
particle collection; however, once collected, the particles tend to accumulate and plug
the packing bed. The exhaust gas is forced to make many changes in direction as it
winds through the openings of the packed material. Large particles unable to follow
the streamlines hit the packing and are collected in the liquid. As this liquid drains
through the packing bed, the collected particles may accumulate, thus plugging the
void spaces in the packed bed. Therefore, wet-film scrubbers are not used when
particle removal is the only concern.
For gas absorption, packed scrubbers are the most commonly used devices. The wet
film covering the packing enhances gas absorption several ways by providing: A large surface area for gas-liquid contact
Turbulent contact (good mixing) between the two phases
Long residence time and repetitive contact
Because of these features, packed towers are capable of achieving high removal
efficiencies for many different gaseous pollutants. Numerous operating variables
affect absorption efficiency. Of primary importance is the solubility of the gaseous
pollutants. Pollutants that are readily soluble in the scrubbing liquid can be easily
removed under a variety of operating conditions. Some other important operating
variables are discussed below.
Gas velocity - The rate of exhaust gas flow from the process determines the
scrubber size to be used. The scrubber should be designed so that the gas
velocity through it will promote good mixing between the gas and liquid phases. However, the velocity should not be fast enough to cause flooding.
67

Liquid-injection rate - Generally, removal efficiency is increased by an increase
in the liquid-injection rate to the vessel. The amount of liquid that can be injected
is limited by the dimensions of the scrubber. Increasing liquid-injection rates will
also increase the operating costs. The optimum amount of liquid injected is based
on the exhaust gas flow rate.
Packing size - Smaller packing sizes offer a larger surface area, thus enhancing
absorption. However, smaller packing fits more tightly, which decreases the open
area between packing, thus increasing the pressure drop across the packing bed.
Packing height - As packing height increases, total surface area and residence
time increase, enhancing absorption. However, more packing necessitates a
larger absorption system, which increases capital cost.
4.2.1 Absorption Equipment
Gas absorbers and reactive scrubbers are flexible devices that are very dependable
and effective. Figure 4.5 shows examples of the variety of commercial equipment
used for gas absorption with or without chemical reaction. The selection of the
particular scrubber configuration required for a given control problem is not simple.
Almost any type of scrubber will be effective if the pollutants are easily absorbed. In
these cases, local costs and availability dictate the type of scrubber.
4.2.2 Packed Tower
Packed bed are used for continuous, counter current or co-current contact of liquid
and gases in absorption operations. A counter current packed bed usually consists of
a cylindrical column equipped with gas inlet and distributing space at the bottom,
while a liquid inlet and distributor at the top, and liquid and gas outlet at the bottom
and top, respectively. The column is packed with inert solids called packing which
provide relatively large surface area per unit volume. In order to be useful, absorption
packing should have large efficiency area, low mass, strong materials of
construction, large free cross section when dumped, chemical inertness, small liquid
hold-up, and low cost. There are many types of packing; some of them are made of
coke, wood, rocks, ceramics, metals, or plastics.
68
(a) Pad: eed columns
czW" Liquid ICT3
DA- i -: I
Gas (d) Staged contactor
L'gkid
Gt%
(b) Bubble wp column
Liquid
(e) Spray scrubber (0 Semibabch aontacbor
Figure 4.5: Equipment used commercially for gas absorption (McCabe et al., 1993)
4.2.3 Gas-Liquid Equilibrium Considerations
Under a specific condition of temperature and pressure in a gas absorption
operation, the solute molecules are transferred from the gas phase to the liquid
phase across the gas-liquid interfacial surface. Some solute molecules escape back
into the gas phase, the rate being proportional to their concentration in the liquid. As
the concentration of the solute in the liquid increases, its rate of return to the gas
phase increases as well. In due course, the rate at which the solute enters the liquid
equals its rate of return to the gas phase. Simultaneously, each phase achieves
uniform concentration through diffusion. A dynamic equilibrium is achieved whereby
the net transfer of solute between the phases is zero and the concentration in each
phase becomes constant. Hence for a gas-liquid system not in equilibrium, interphase diffusion of the components will take place to eventually bring the system
to an equilibrium state. At equilibrium, no net diffusion of components exists between
the phases. For ideal solutions, the gas-liquid equilibrium is described by Raoult's
Law (McCabe et al., 1993):
Gas liquid
(c) Spray column
Gas
Gas Batch liquid
69

PA PA XA (4.11)
Where PA* = Equilibrium partial pressure of component A in gas phase (Pa) PA° = Vapour pressure of pure A at the same temperature and pressure (Pa) XA = Mole fraction of component A in liquid phase (mol/mol)
Raoult's Law is generally true only for large values of xA. For slightly soluble gases
forming low concentrations of solute in the liquid phase (low xA) i. e. resulting in only
simple solutions with negligible gas-liquid molecules interaction, Henry's Law applies:
(McCabe et al., 1993)
PA=H x. 4 Where H= Henry's Law constant (Pa)
(4.12)
The value of H increases with liquid phase temperature but is relatively independent
of pressure. Henry's Law generally describes the equilibrium relationship for dilute
concentration of most gases. The partial pressure of component A in the gas phase
is proportional to its concentration (McCabe et al., 1993):
PA YAP (4.13)
Where yA = Mole fraction of component A in gas phase (mol/mol) P= Total pressure (Pa)
Combining equations 4.12 and 4.13, the gas phase mole fraction at equilibrium with
the liquid phase y* is:
HxA y^P P
(4.14)
Absorption will take place as long as the solute partial pressure in the gas phase PA is higher than the solute vapour pressure above the liquid phase PA*. Another way to
describe vapour-liquid equilibrium is by the use of the vapour-liquid equilibrium
constant, Kor alternatively m (McCabe et al., 1993):
M XA (4.15)
70
4.2.4 Physical Absorption
4.2.4.1 Mass Transfer Across A Phase Boundary
Several theories have been put forward to describe the conditions at the phase
boundary during mass transfer of a solute from the gas phase to the liquid phase.
Whitman (1923) put forward the Two-Film Theory treating the mass transfer
resistance in each phase as a thin film next to the interface. Steady-state molecular
diffusion mass transfer occurs across these films whilst bulk fluid turbulence dies out
at the interface. Higbie (1935) propounded the Penetration Theory which assumes
that fluid eddies bring fresh materials to the interface and unsteady-state molecular
mass transfer into the eddies takes place for a fixed period of time at the freshly
exposed surface before the next mixing starts again. Danckwerts (1951) extended
the Penetration Theory, resulting in the Surface-Renewal Theory. Whereas the
former assumes the same exposure times and averages the varying degrees of
penetrations. Toor and Marchello (1958) described the Film-Penetration Theory in
which the Film and Penetration Theories were shown to be limiting cases of this more
general model.
4.2.4.2 The Two-Film Theory
The Two-Film Theory by Whitman (1923) is extensively used as it gives expressions
that are easily applicable to generally available experimental data. In a gas
absorption process, the Two-Film Theory assumes that the bulk gas phase is
separated from the bulk liquid phase by a thin gas film adjacent to a thin liquid film.
Completely mixed turbulent flow exists in both the bulk gas and the bulk liquid phase.
Mass transport is by convection currents such that no concentration gradient is
present in the bulk phases. The convection currents die out in the vicinity of the thin
fluid films. Laminar flow exists in both the gas and liquid films and a solute
concentration gradient exists across both films. Resistance to mass transfer is
considered to entirely lie in these two films in which mass transport is totally by
molecule diffusion. The solute concentration in the gas film at the interface is at
equilibrium with the solute concentration in the liquid film at the interface. No
resistance to mass transfer exists across the interface. Figure 4.6 illustrates the Two-
Film Theory. Solute A diffuses from the gas phase to the liquid phase. The partial
pressure of solute A in the main body of the gas is pA and this falls to pA; at the gas-
liquid interface. 71
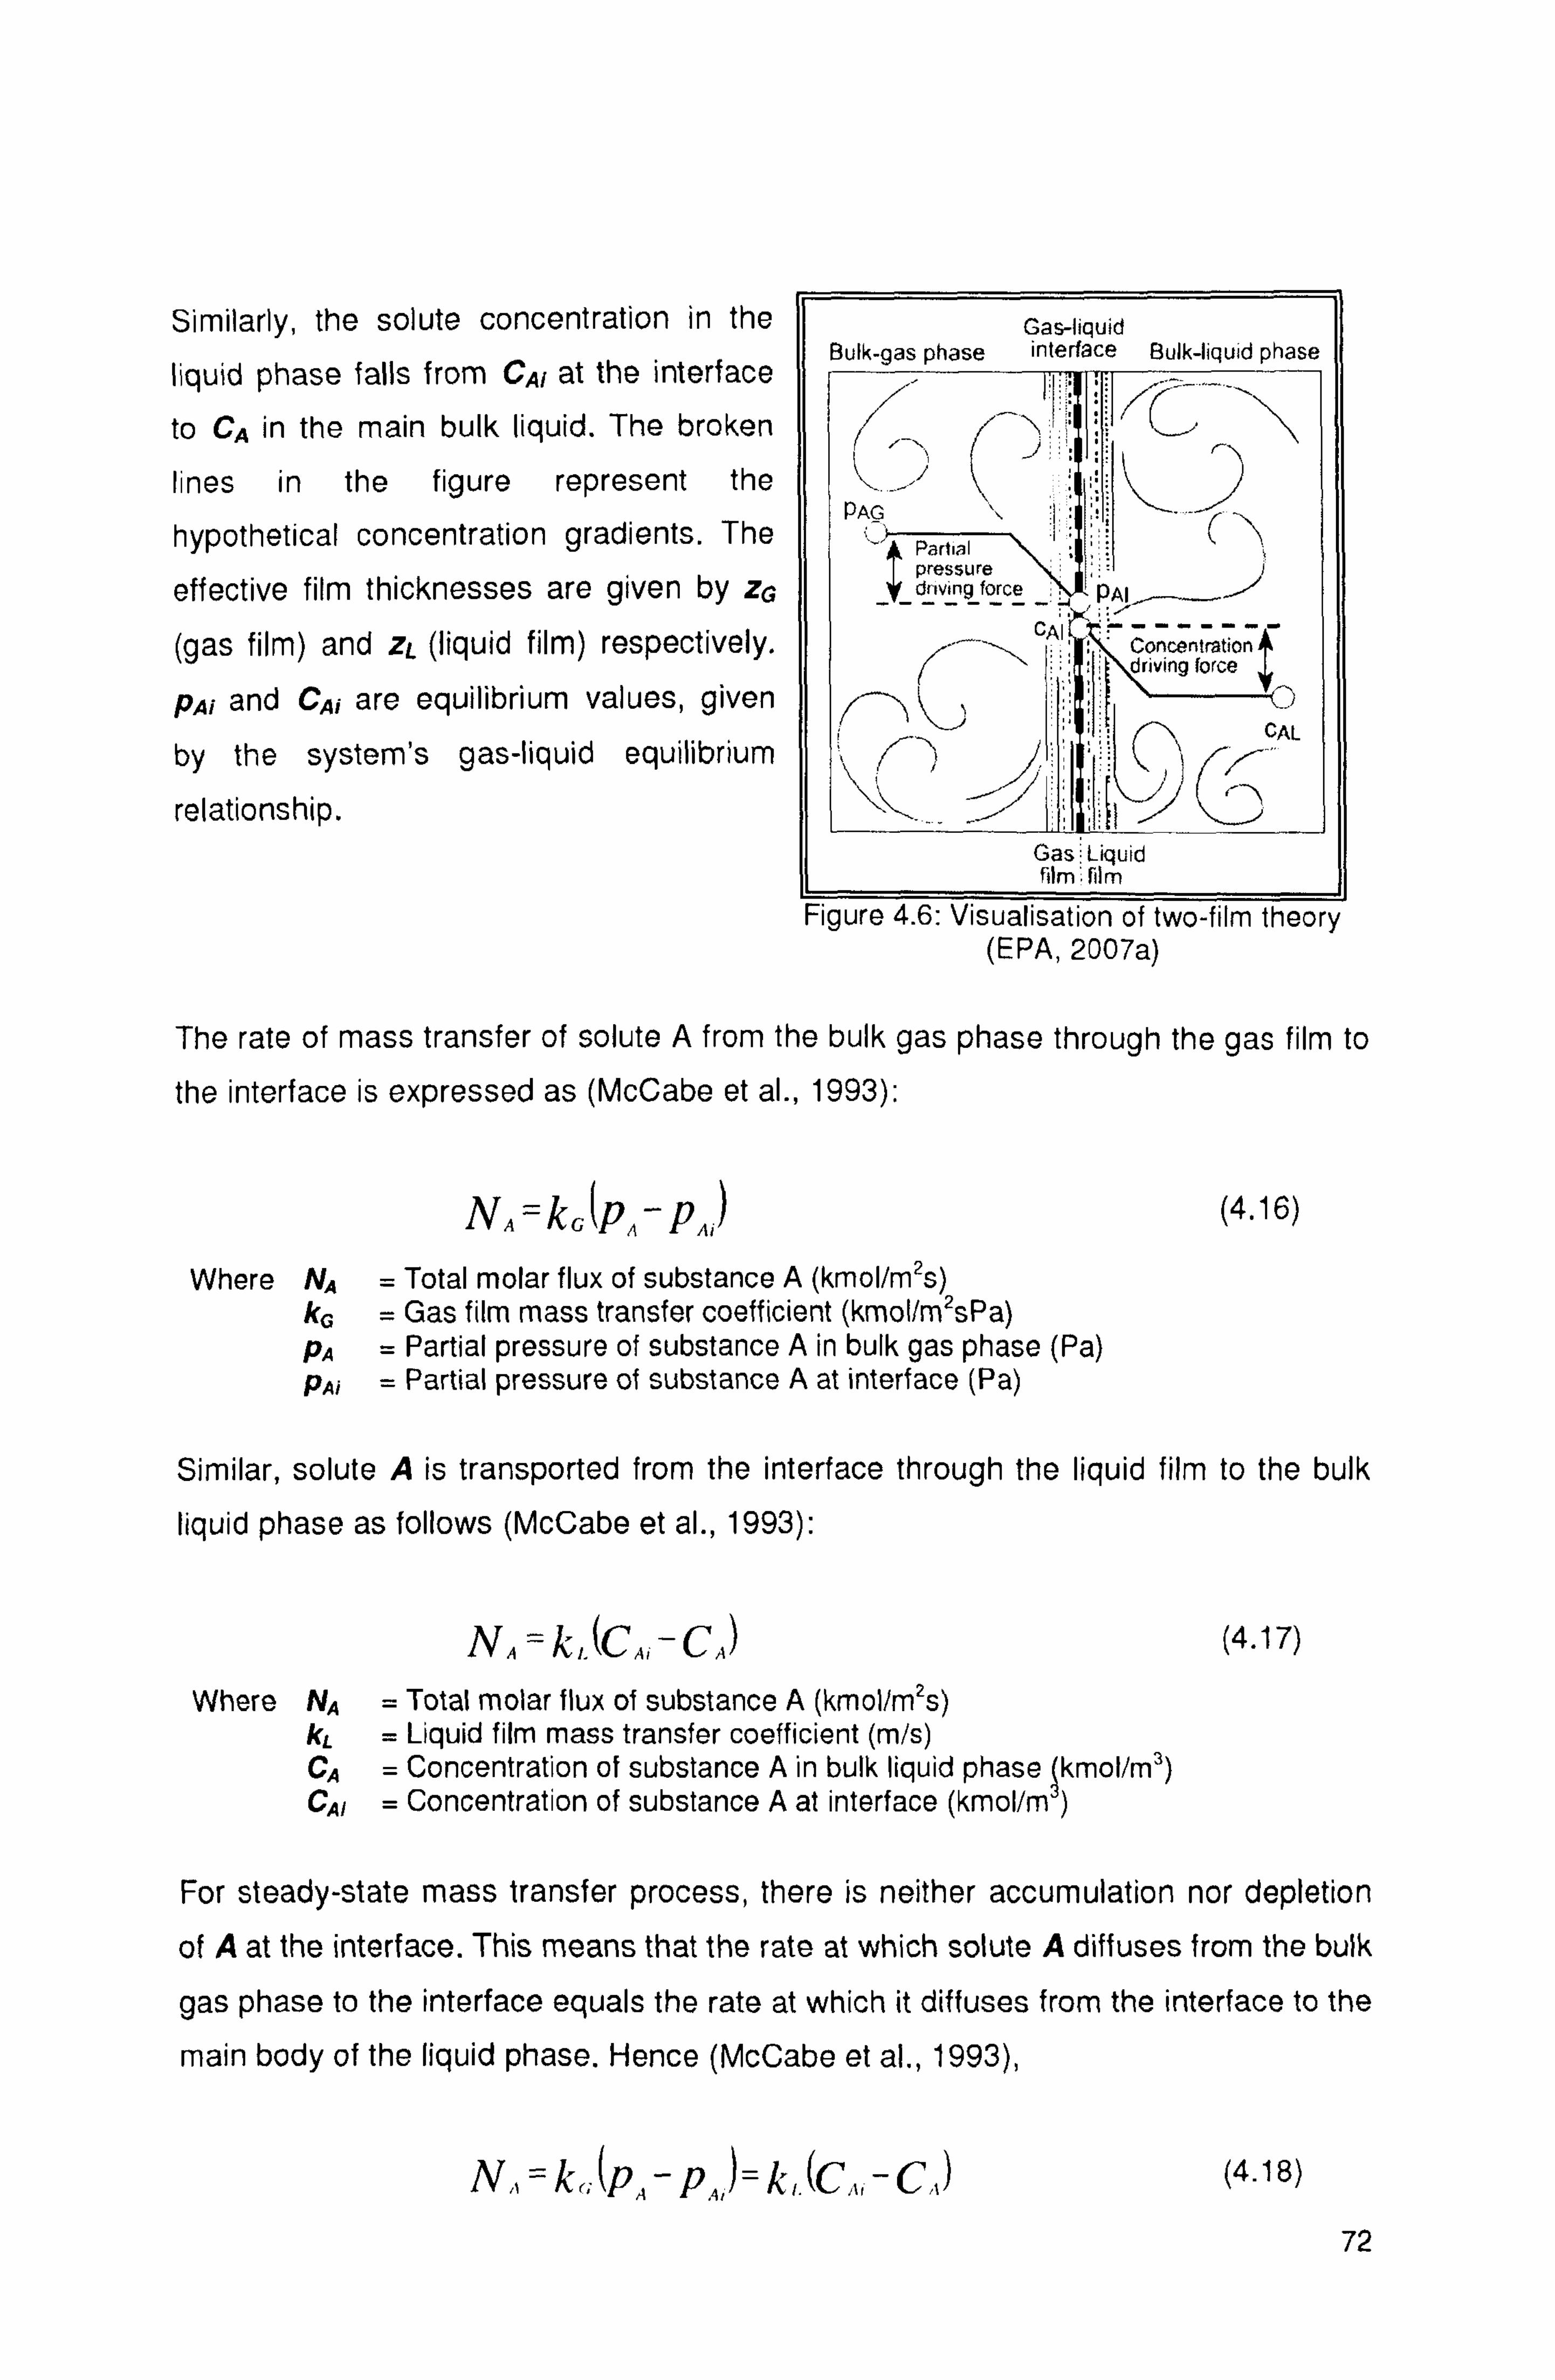
Similarly, the solute concentration in the
liquid phase falls from CAr at the interface
to CA in the main bulk liquid. The broken
lines in the figure represent the
hypothetical concentration gradients. The
effective film thicknesses are given by zG
(gas film) and zL (liquid film) respectively.
pA; and CA; are equilibrium values, given
by the system's gas-liquid equilibrium
relationship.
Gas-liquid Bulk-gas phase interface Bulk-liquid phase
PAG
Partial pressure
-driving force pAlý-_/
BAI Concentration driving force
CAL
Gas; Liquid film, film
Figure 4.6: Visualisation of two-film theory (EPA, 2007a)
The rate of mass transfer of solute A from the bulk gas phase through the gas film to
the interface is expressed as (McCabe et al., 1993):
NA = kG (pA - PA) (4.16) Where NA = Total molar flux of substance A (kmol/m2s)
kG = Gas film mass transfer coefficient (kmol/mzsPa) PA = Partial pressure of substance A in bulk gas phase (Pa) PA; = Partial pressure of substance A at interface (Pa)
Similar, solute A is transported from the interface through the liquid film to the bulk
liquid phase as follows (McCabe et al., 1993):
NA = k,. (CA, -CA) (4.17)
Where NA = Total molar flux of substance A (kmol/m2s) kL = Liquid film mass transfer coefficient (m/s) CA = Concentration of substance A in bulk liquid phase ýkmol/m3) CAI = Concentration of substance A at interface (kmol/m )
For steady-state mass transfer process, there is neither accumulation nor depletion
of A at the interface. This means that the rate at which solute A diffuses from the bulk
gas phase to the interface equals the rate at which it diffuses from the interface to the
main body of the liquid phase. Hence (McCabe et al., 1993),
N,, = k(; (PA - PA, ) = k1. ýC,,; - C, J (4.18)
72

kL =
`PA- PA,
(4.19) k(: C
For dilute liquid concentration, k= D'
(4.20) L
Zl. Where DL = Liquid phase diffusivity (m2/s)
zL = Liquid film thickness (m)
4.2.4.3 Overall and Film Mass Transfer Coefficients
In most experimental determinations of mass transfer rate, it is not ordinarily possible to obtain direct measurements of the interface concentrations and hence the film
mass transfer coefficients (kG, kL). Instead the resulting rates of mass transfer can be
expressed in terms of overall mass transfer coefficients which can be derived from
solute concentrations in the bulk fluids (McCabe et al., 1993):
NA= KG(PA-PA)= KL(C, -CA) (4.21)
Where KG = Overall gas phase mass transfer coefficient (kmol/m2sPa) KL = Overall liquid phase mass transfer coefficient (m/s) PA = Partial pressure of A in equilibrium with concentration CA in liquid
phase (Pa) CA* = Concentration of A in liquid phase in equilibrium with partial
pressure ca in gas phase (kmol/m3)
For dilute solutions, Henry's Law applies (H in Pa. m3/kmol) (McCabe et al., 1993):
pA=H CA (4.22)
It can be shown that when the solution obeys Henry's Law, the relationship between
the overall mass transfer coefficients with the film coefficients is in the form of additional resistance as follows (McCabe et al., 1993):
11+H (4.23) KG kG kL
and I=H (4.24)
KG K,. For equations 4.23 and 4.24 to be valid, there must be no variation in H over the
equilibrium. There has to be negligible interfacial resistance and the two film
coefficients must be independent of one another.
73

The mass transfer equations can be expressed in terms of mol fractions as follows
assuming that the total concentrations in the liquid phase remain constant:
N,, =k,, (YA - ,. %,
) =K,,. (yA- A
(4.25)
NA =k1 (xA; - XA= K,. (xA-xA) (4.26)
Where xA, yA = Mol fraction of soluble component A in liquid and gas phase respectively (mol/mol)
XA, ya = Equilibrium mol fraction (mol/mol) k'G, k'L, = Mass transfer coefficients in terms of mol fractions K'G, K'L (kmol/m2s)
If the equilibrium curves relating the solute concentration in the gas phase to the solute concentration in the liquid phase at equilibrium has a slope m (mol/mol), then:
11m
Ký kG k,.
K ,. k, m k, and
1=m
KG K,,
The relationship between the mass transfer resistances are as follows:
Resistance in gas film
Total resistance, both, film
Resistance in liquid film
Total resistance, both, film
_ Ilk,; Ilk', 1/KG 1/K'G
_ 1/kL 'lk'L I/KL 'K'L
(4.27)
(4.28)
(4.29)
(4.30)
(4.31)
4.2.4.4 Gas Film or Liquid Film Controlled Processes
If m is small such that at equilibrium only a small solute concentration in the gas will
provide a very large solute concentration in the liquid (i. e. very soluble solute in
liquid), the liquid film resistance m/k'L in equation 4.27 becomes minor compared to
or with that of the gas film 1/k'G. The rate of mass transfer is said to be gas film
controlled. In the extreme,
74

i/Kc - '/kG or (y, - Y,, ) ý (y,, -y A,
>
(4.32)
(4.33)
In this case, the mass transfer rate is best improved by reducing the gas film
resistance as fairly large changes in k'L will not affect k'G significantly. Conversely,
where values of m are large (i. e. solute relatively insoluble in the liquid), the gas film
resistance 1/mk'G in equation 4.28 becomes negligible relative to that of the liquid
film 1/k'L. The rate of mass transfer is then considered to be liquid film controlled.
Ultimately,
I/Kc ' l/kc (4.34)
(4 (x: -XA (XAi - XA) . 35)
Under such conditions, the rate of mass transfer is best improved by reducing the liquid film resistance, i. e. increasing k'L.
4.2.4.5 The Transfer Unit in Gas Absorption
It is necessary to account for changes in the gas-liquid interfacial area which is not
normally directly measured in mass transfer experiments. The interfacial area is
allowed for by the use of the volumetric coefficients K Ga, K'La, k'Ga and k'La
(kmol/m3s) where 'a' is the interfacial area per unit volume of column (m2Jm3). Figure
4.7 illustrates a gas absorption column through which the gas flows through the
column at a flowrate of G' (kmol/m2s) countercurrently to the down flowing liquid at a
flowrate of L' (kmol/m`s). It is assumed herein that
the amount of solute transferred is small, hence
only dilute solutions are formed and concentration
changes in the column are small. This is such that
K'Ga, as well as the gas and liquid molar flowrates
G' and L' are constant throughout the column. With these assumptions, the height of the packed bed Z (m) required to provide a change in gas
concentration from ys (mol/mol) at the bottom to
yr (mol/mol) at the top is given by:
G' L' yT ýý XT
y+dy x+dx z
yx
G' I L,
Vg Cg
Figure 4.7: Countercurrent gas absorption column
75

(4.36) J"Z dz=z=HOGxN,, G G
[a][5
, dy
The concept of the transfer unit was first put forward by Chilton and Colburn (1934). Similar equations can be written involving the overall liquid transfer coefficient as well as for the individual film coefficients, assuming that dilute solutions are formed and that concentration changes are small (McCabe et al., 1993):
Z= HOL X Not. LJ
(4.37) K,. a X� x_x
z=H, XN, = Gfy, dy
y, - (4.38)
KG(I Yr ýY
Z=H, xNL- (4.39)
Where Hoy = Height of an overall liquid phase transfer unit (m) H0, HL = Height of a gas and liquid film transfer unit respectively (m) NOL = Number of overall liquid phase transfer units NG, NL = Number of gas film and liquid film transfer unit respectively
For dilute solutions, the operating line and equilibrium line are straight. Conducting a
material balance the lower section of the column in Figure 4.7, the operating line:
L(xß-, Y)=G'(Y8-Y) or yß-v= L, (x1-r) (4.40)
The equilibrium line: y= nnx+c (4.41)
Where m is the slope of the equilibrium line and c the y-axis intercept. For dilute
solutions the number of overall gas transfer units is (McCabe et al., 1993):
_ VB-YT
*= v" v
Y _N
Y=? h V-Y 1, (4.42)
in
(V
i (_y
(Y-Y)im is the logarithmic mean of the driving forces at the ends of the column, (y-y')6
and (y-y)r" The height of an overall transfer unit is the height of a packed section
necessary to achieve a change in concentration equal to the average driving force in
that section, this average driving force being (y-y'),,,. Therefore the rate of mass
transfer taking place in the column is as follows:
76
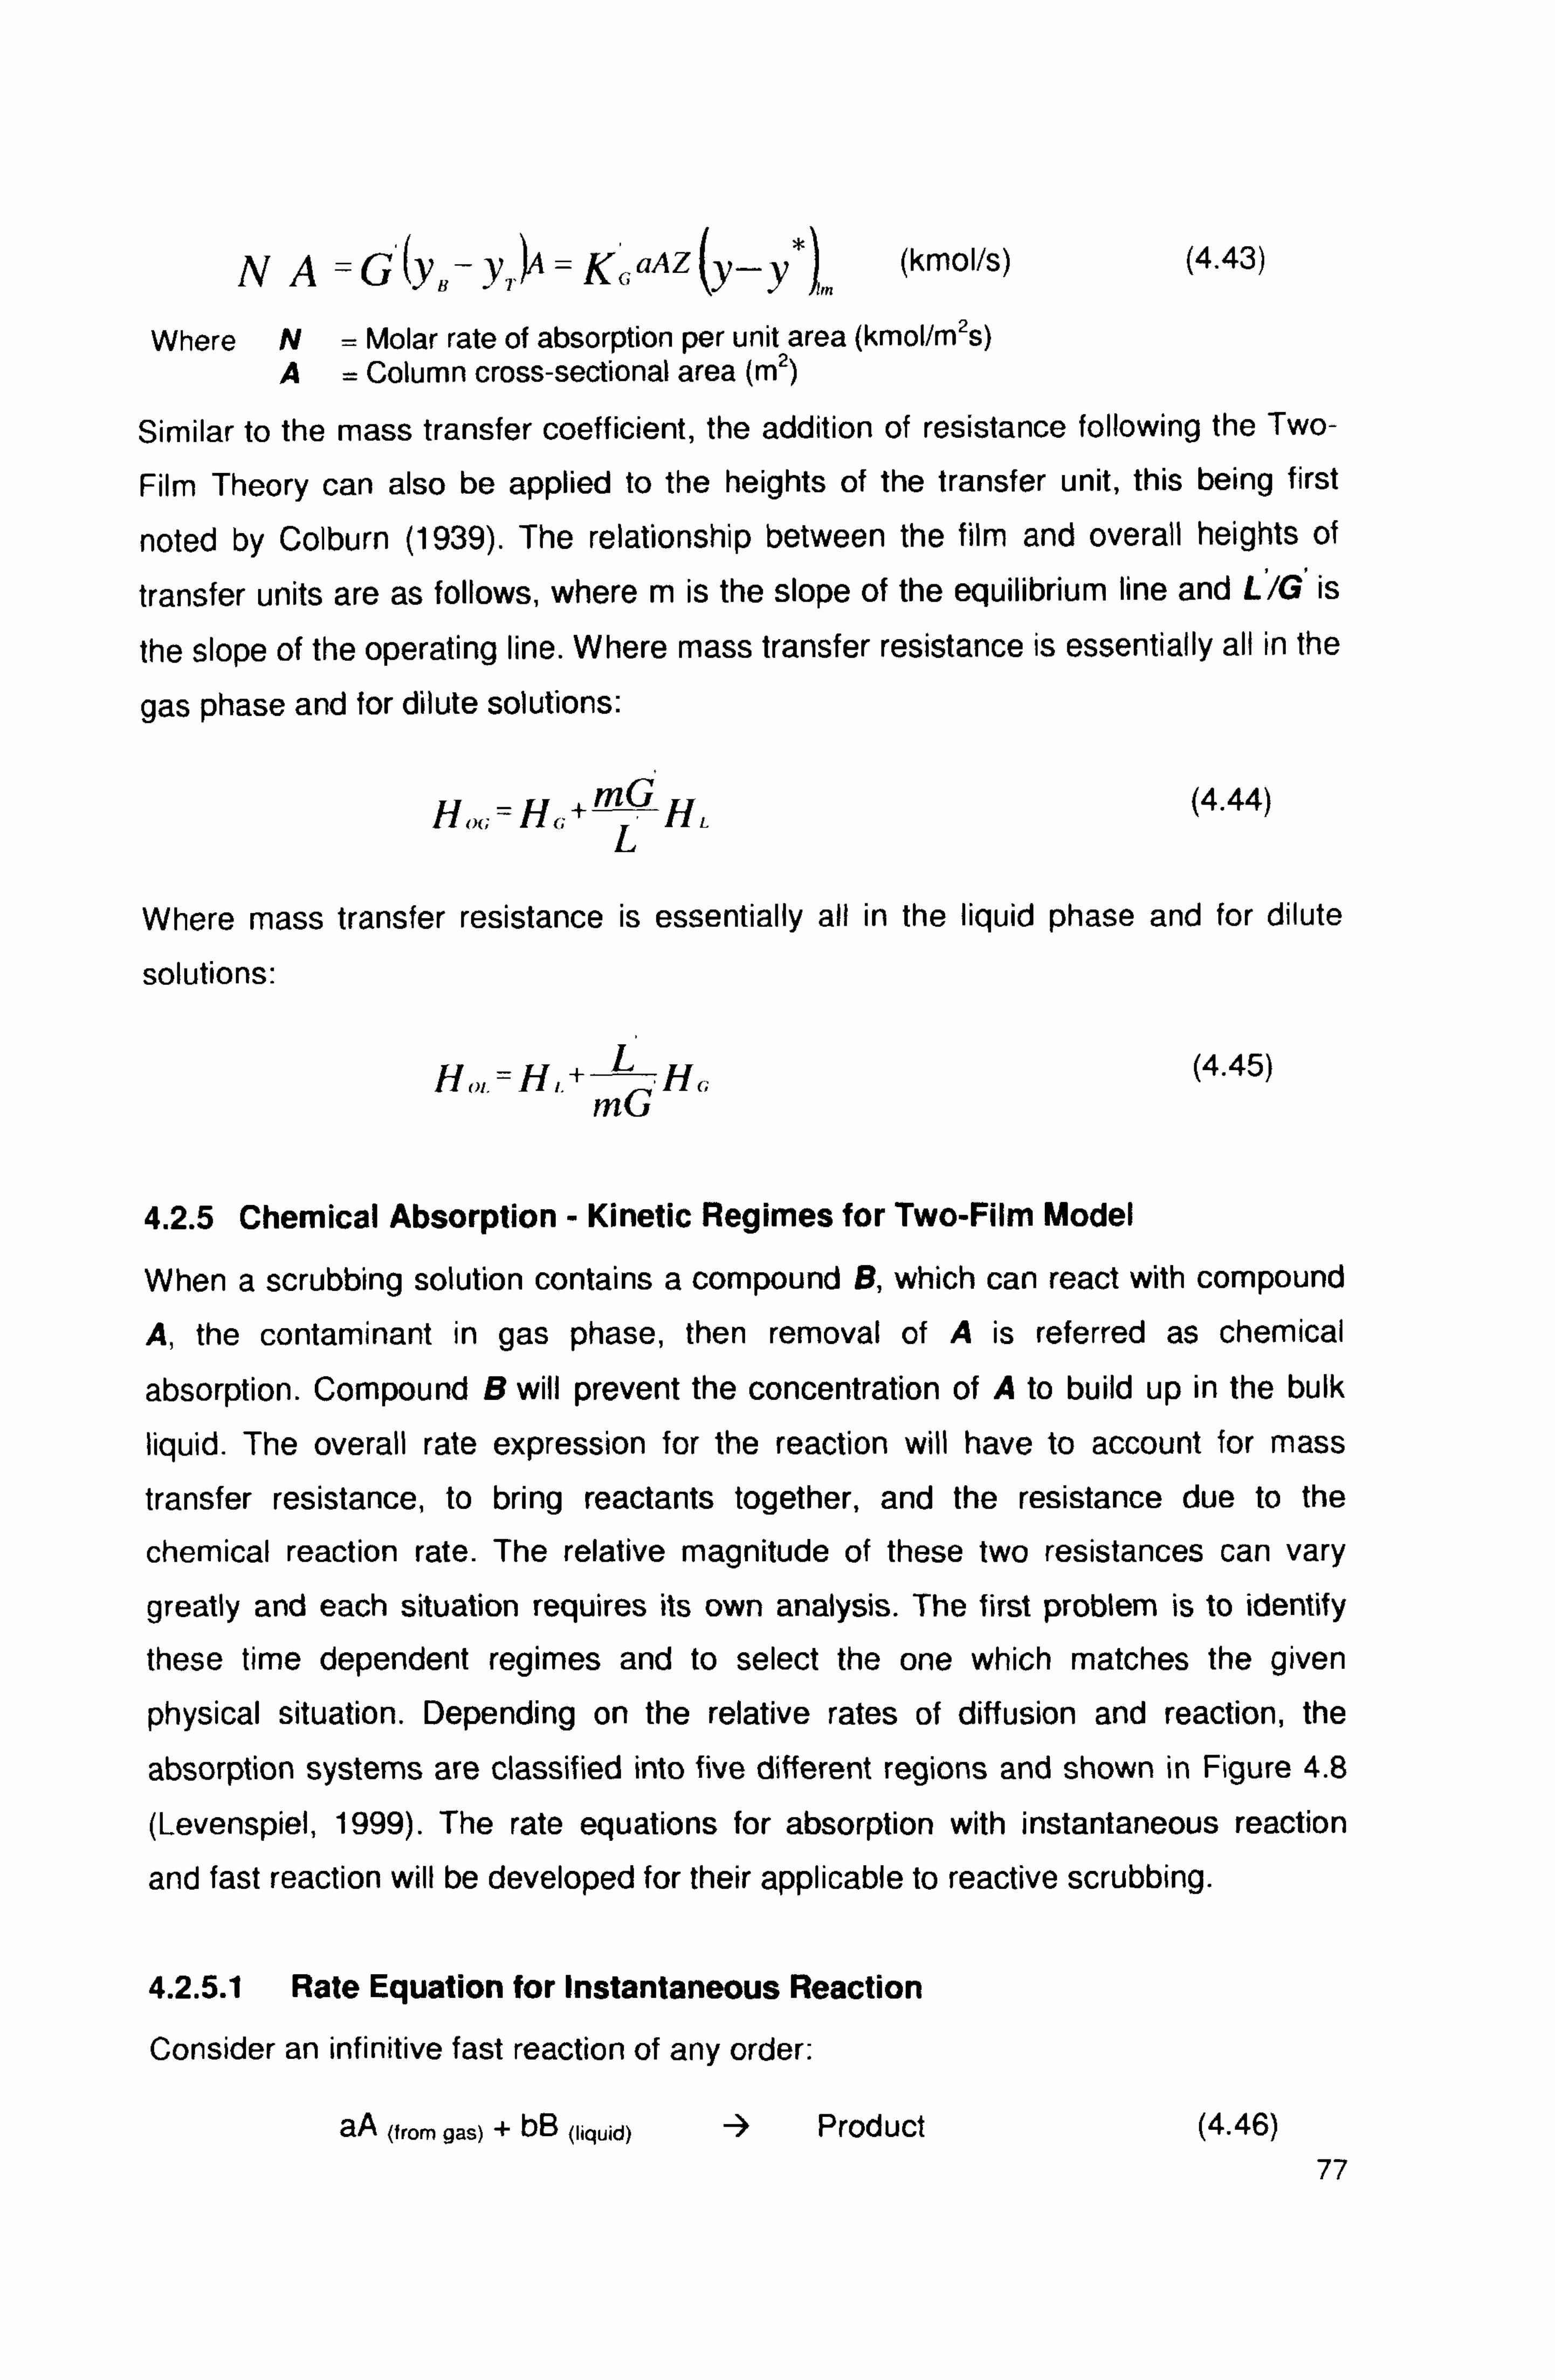
NA= G(y1- y,. ý
= KG' aAZ (y-y*),
n (kmol/s) (4.43)
Where N= Molar rate of absorption per unit area (kmol/m2s) A= Column cross-sectional area (m)
Similar to the mass transfer coefficient, the addition of resistance following the Two-
Film Theory can also be applied to the heights of the transfer unit, this being first
noted by Colburn (1939). The relationship between the film and overall heights of
transfer units are as follows, where m is the slope of the equilibrium line and L/G is
the slope of the operating line. Where mass transfer resistance is essentially all in the
gas phase and for dilute solutions:
HL HL (4.44)
Where mass transfer resistance is essentially all in the liquid phase and for dilute
solutions:
H0,. -H,. + G H, (4.45)
4.2.5 Chemical Absorption - Kinetic Regimes for Two-Film Model
When a scrubbing solution contains a compound B, which can react with compound
A, the contaminant in gas phase, then removal of A is referred as chemical
absorption. Compound B will prevent the concentration of A to build up in the bulk
liquid. The overall rate expression for the reaction will have to account for mass
transfer resistance, to bring reactants together, and the resistance due to the
chemical reaction rate. The relative magnitude of these two resistances can vary
greatly and each situation requires its own analysis. The first problem is to identify
these time dependent regimes and to select the one which matches the given
physical situation. Depending on the relative rates of diffusion and reaction, the
absorption systems are classified into five different regions and shown in Figure 4.8
(Levenspiel, 1999). The rate equations for absorption with instantaneous reaction
and fast reaction will be developed for their applicable to reactive scrubbing.
4.2.5.1 Rate Equation for Instantaneous Reaction
Consider an infinitive fast reaction of any order:
aA (from gas) + bB (liquid) 3 Product (4.46) 77

If CB is not too large, the situation is illustrated in Figure 4.9. At steady state, the flow
rate of B towards the reaction zone will be b times the flow rate of A towards the reaction zone. Thus, the rate of disappearance of A and B are given by (Levenspiel,
1999) :
_-_rß _kýý(P, -P,; ) -k,,, (C,,; -0)
xý, -r^ -b x�-x
(4.47)
Where r" is the rate of disappearance per unit interface area, kAg and kAl are the mass transfer coefficients in gas and liquid phases. At the interface, the relationship between PA and CA is given by Henry's Law constant for gas liquid systems. Thus
PAi = HA CA, (4.48)
c 0 0°
N
_N T
N
E d
w
C O
Jp
d
N
T d
E w
Gas Liquid I Reaction film film
plane
PA Ca
Reaction zone
PA Cy
©
PA CB
OO CA
Gas Liquid High film film
Co
Reaction PA plane
Reaction
°/
zone Cg
High and constant
PA
Cg
High and constant PA Ii
CA ®
Phase interface
Any value PA Co
GI CA
PA Any value
C8
Cq
Gas Liquid
Reaction only in film
In film and main body
1
Reaction only in main body
of liquid
Figure 4.8: Interfacial behaviour for the liquid phase reaction (Levenspiel, 1999)
78

Gas liquid_�, j film film
pA. --- Reaction I t (zone
C1a j
PAi Main body
j CAI Main body
of gas S of liquid
t
--1 x i4-- ý
Figure 4.9: Concentration of reactants as visualised by two film theory (Levenspiel, 1999)
Since the movement of material within the film is visualised to occur by diffusion
alone, the transfer coefficients for A and B are related by (Levenspiel, 1999):
D�/ kar
= /x.
_ Dn,
(4.49)
kß, DR, D,,, x
Eliminating the unknown in Equations 4.47,4.48 and 4.49, we obtain:
DB, C, +
PA IdN,,
= kAl
= DA, b HA
_ (4.50)
S dt kß, 1- +1 HAkA., kA,
For the special case of negligible gas phase resistance, KA9 is infinitive, and PA = Pa;.
Equations 4.50 reduce to:
4.51 -rý=ka,
CA; 1+ DB, Ce
b DA, CA;
Comparing Equation 4.51 with the expression for the maximum rate of mass transfer,
or
-r,, = kAlCA; (4.52)
79

It is found that the term in brackets represents the increase in rate of absorption of A
resulting from adding reactant B to the liquid. Thus an enhancement factor is defined
as (Levenspiel, 1999):
Rate reaction E= Rate for mass transfer (4.53)
For the case of infinitely fast reaction rate and no gas phase resistance (Levenspiel,
1999)
-rA = kA, CA, E (4.54)
where, E =1+ D"` C"
(4.55) b DA, CA; for the special case of high CB (Levenspiel, 1999), or if
kA, ý bß
CH/ (4.56)
then this condition requires that the reaction zone move to and remain at the
interface. When this happens, the resistance of the gas phase controls, and the rate is not affected by any further increase in concentration of B. Equations 4.49 simplifies
to:
d _ _1 n
-_kp (4.57) j"a -, di Ax n
Note that the reaction rate constant does not enter into Equations 4.49 or 4.56,
showing that the rate is completely mass transfer controlled. Also, even though the
resistance of liquid film may normally control, when CB is raised sufficiently, then the
resistance always shifts to gas phase control.
4.2.5.2 Rate Equation for Fast Reaction
For a second order reaction between A and B (Levenspiel, 1999):
d_ 1 -i", a, -V dt
n -k CACII (4.58)
In the gas and liquid films (Levenspiel, 1999)
-rA=kAg(PA-PA; )=kA? CA; E (4.59)
80
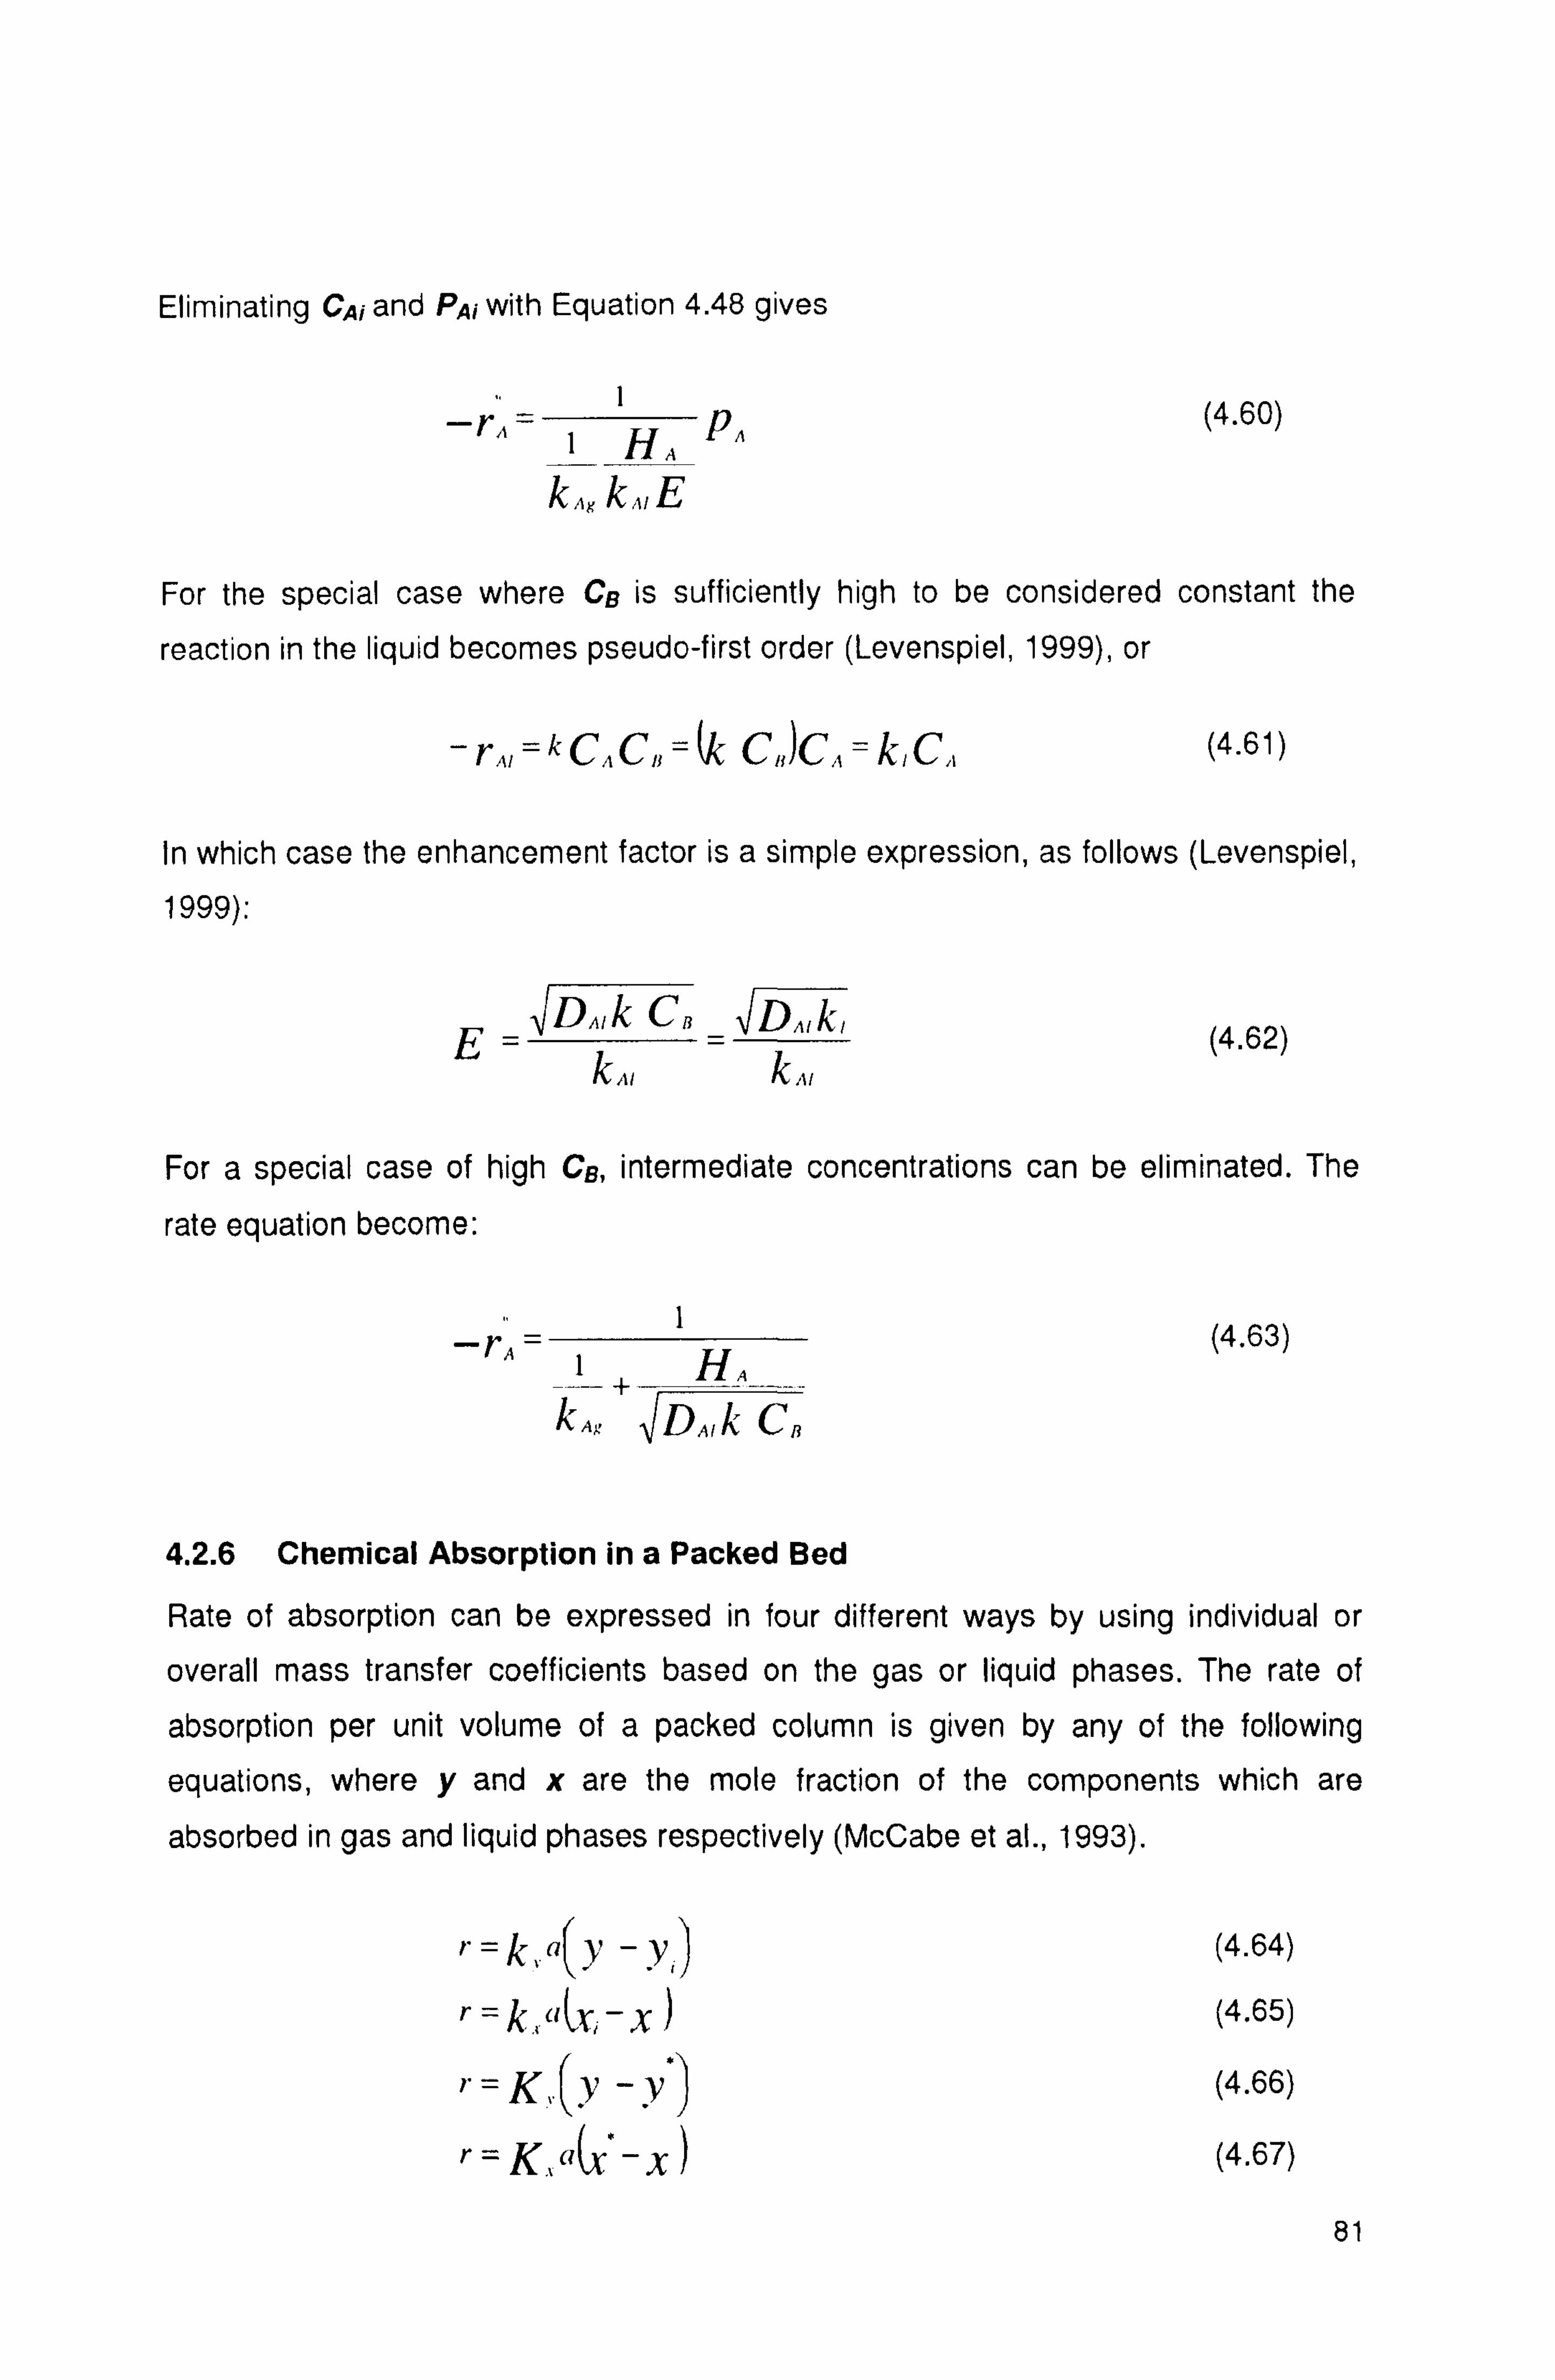
Eliminating CA; and PA; with Equation 4.48 gives
1 (4.60) -rý =1 HA PA
kA, kA, E
For the special case where CB is sufficiently high to be considered constant the
reaction in the liquid becomes pseudo-first order (Levenspiel, 1999), or
rAI -kCACB, -(k CJCA=k, C, (4.61)
In which case the enhancement factor is a simple expression, as follows (Levenspiel,
1999):
E_ Dnrk Cn
_ DA, k,
(4.62) L k,,,
For a special case of high CB, intermediate concentrations can be eliminated. The
rate equation become:
_1 (4.63) -r A1 HA
kAg DAIk Cß
4.2.6 Chemical Absorption in a Packed Bed
Rate of absorption can be expressed in four different ways by using individual or
overall mass transfer coefficients based on the gas or liquid phases. The rate of
absorption per unit volume of a packed column is given by any of the following
equations, where y and x are the mole fraction of the components which are
absorbed in gas and liquid phases respectively (McCabe et al., 1993).
"_k, a(y -y) (4.64)
r =k. +`r(X, -x) (4.65)
= K, (Y - y") (4.66)
r=K., a(*-X) (4.67)
81
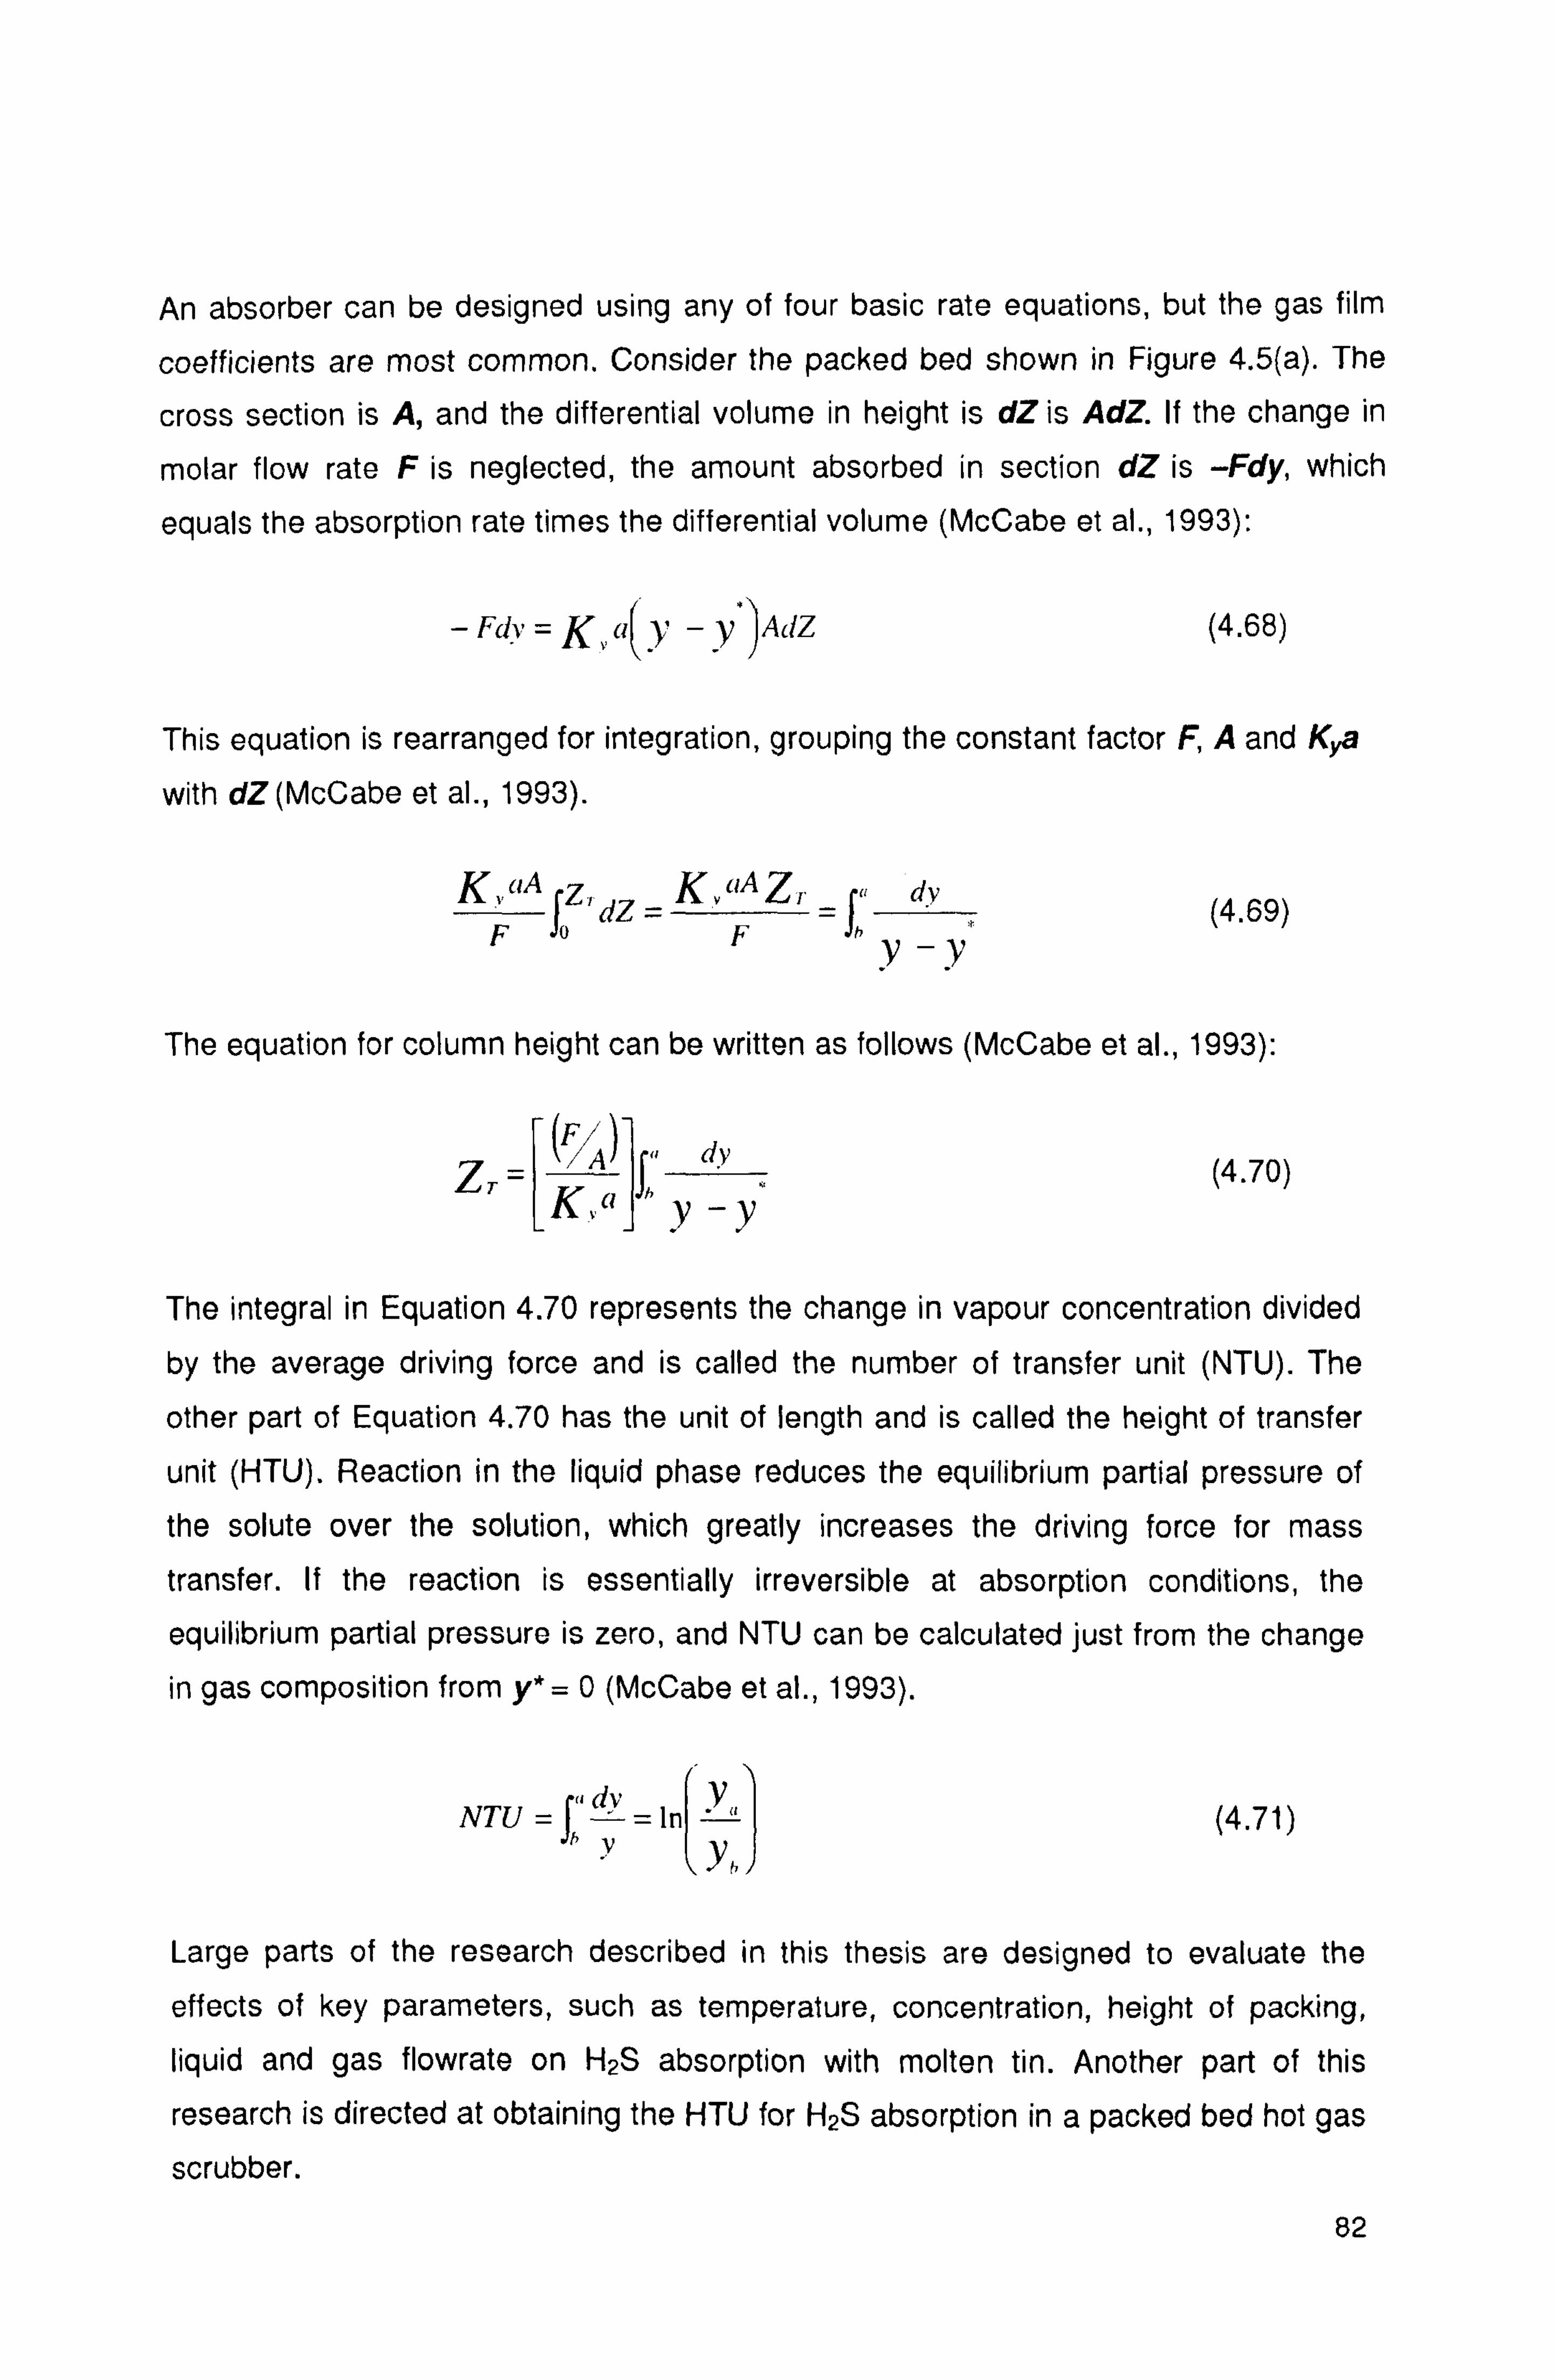
An absorber can be designed using any of four basic rate equations, but the gas film
coefficients are most common. Consider the packed bed shown in Figure 4.5(a). The
cross section is A, and the differential volume in height is dZ is AdZ. If the change in
molar flow rate F is neglected, the amount absorbed in section dZ is -Fdy, which
equals the absorption rate times the differential volume (McCabe et al., 1993):
- Fdv =K a(y -y )Ac1Z (4.68)
This equation is rearranged for integration, grouping the constant factor F, A and Kya
with dZ (McCabe et al., 1993).
KFCIA fZ, dZ =K cF Zr
= fns dY (4.69) y-y
The equation for column height can be written as follows (McCabe et al., 1993):
ZT =
/A) f
K, a yy (4.70)
The integral in Equation 4.70 represents the change in vapour concentration divided
by the average driving force and is called the number of transfer unit (NTU). The
other part of Equation 4.70 has the unit of length and is called the height of transfer
unit (HTU). Reaction in the liquid phase reduces the equilibrium partial pressure of
the solute over the solution, which greatly increases the driving force for mass
transfer. If the reaction is essentially irreversible at absorption conditions, the
equilibrium partial pressure is zero, and NTU can be calculated just from the change
in gas composition from y*= 0 (McCabe et al., 1993).
NTU = .rd
=1n y"
h'' Yh (4.71)
Large parts of the research described in this thesis are designed to evaluate the
effects of key parameters, such as temperature, concentration, height of packing, liquid and gas flowrate on H2S absorption with molten tin. Another part of this
research is directed at obtaining the HTU for H2S absorption in a packed bed hot gas scrubber.
82

CHAPTER FIVE
Experimental Programme
This chapter presents the experimental set up and the associated design
modification work which was undertaken during the course of this research. Details of the experimental setup and operational procedures for various experiments are also discussed in this chapter. The description of the scrubber system originally designed
by Chang (2003) is also presented.
5.1 Original Design of Hot Gas Scrubbing System (Chang, 2003)
The selection of the materials of construction is first discussed. The design of the
main gas scrubber unit which includes the column and its packing, liquid distributor
and the column injector are also presented in this chapter. This is followed by the
design of the gas lift for molten tin transport. Other aspects include provisions for
loading and removal of tin from the scrubber, tin level indicators, system heating and insulation, temperature measurement and control as well as system operating
parameters.
5.1.1 Main Gas Scrubber Unit
5.1.1.1 Materials of Construction
The packed bed scrubber was constructed from austenitic stainless steel Type 316
(16-18% Cr, 10-14% Ni, 2% Mn, 1% Si, 0.08% C, 0.045%P and 0.03% S). This type
of stainless steel is one of the materials which has been tested up to 800 hours in
Finland (Chang, 2003). It has been used to test the long-term corrosion resistance of
commercial metal filters under a simulated gasification environment with 300 ppmv H2S at 400°C and 500°C and a good corrosion resistance was demonstrated
(Mitchell, 1997). However there remains the issue of stainless steel corrosion by
molten tin, with the dissolution of some of the nickel content into the liquid metal. As
each test run involving the irrigation of molten tin through the scrubber is anticipated to be relatively short in duration (typically less than 30 minutes); the degree of molten tin's contamination by dissolved nickel from the steel is expected to be minimal.
83
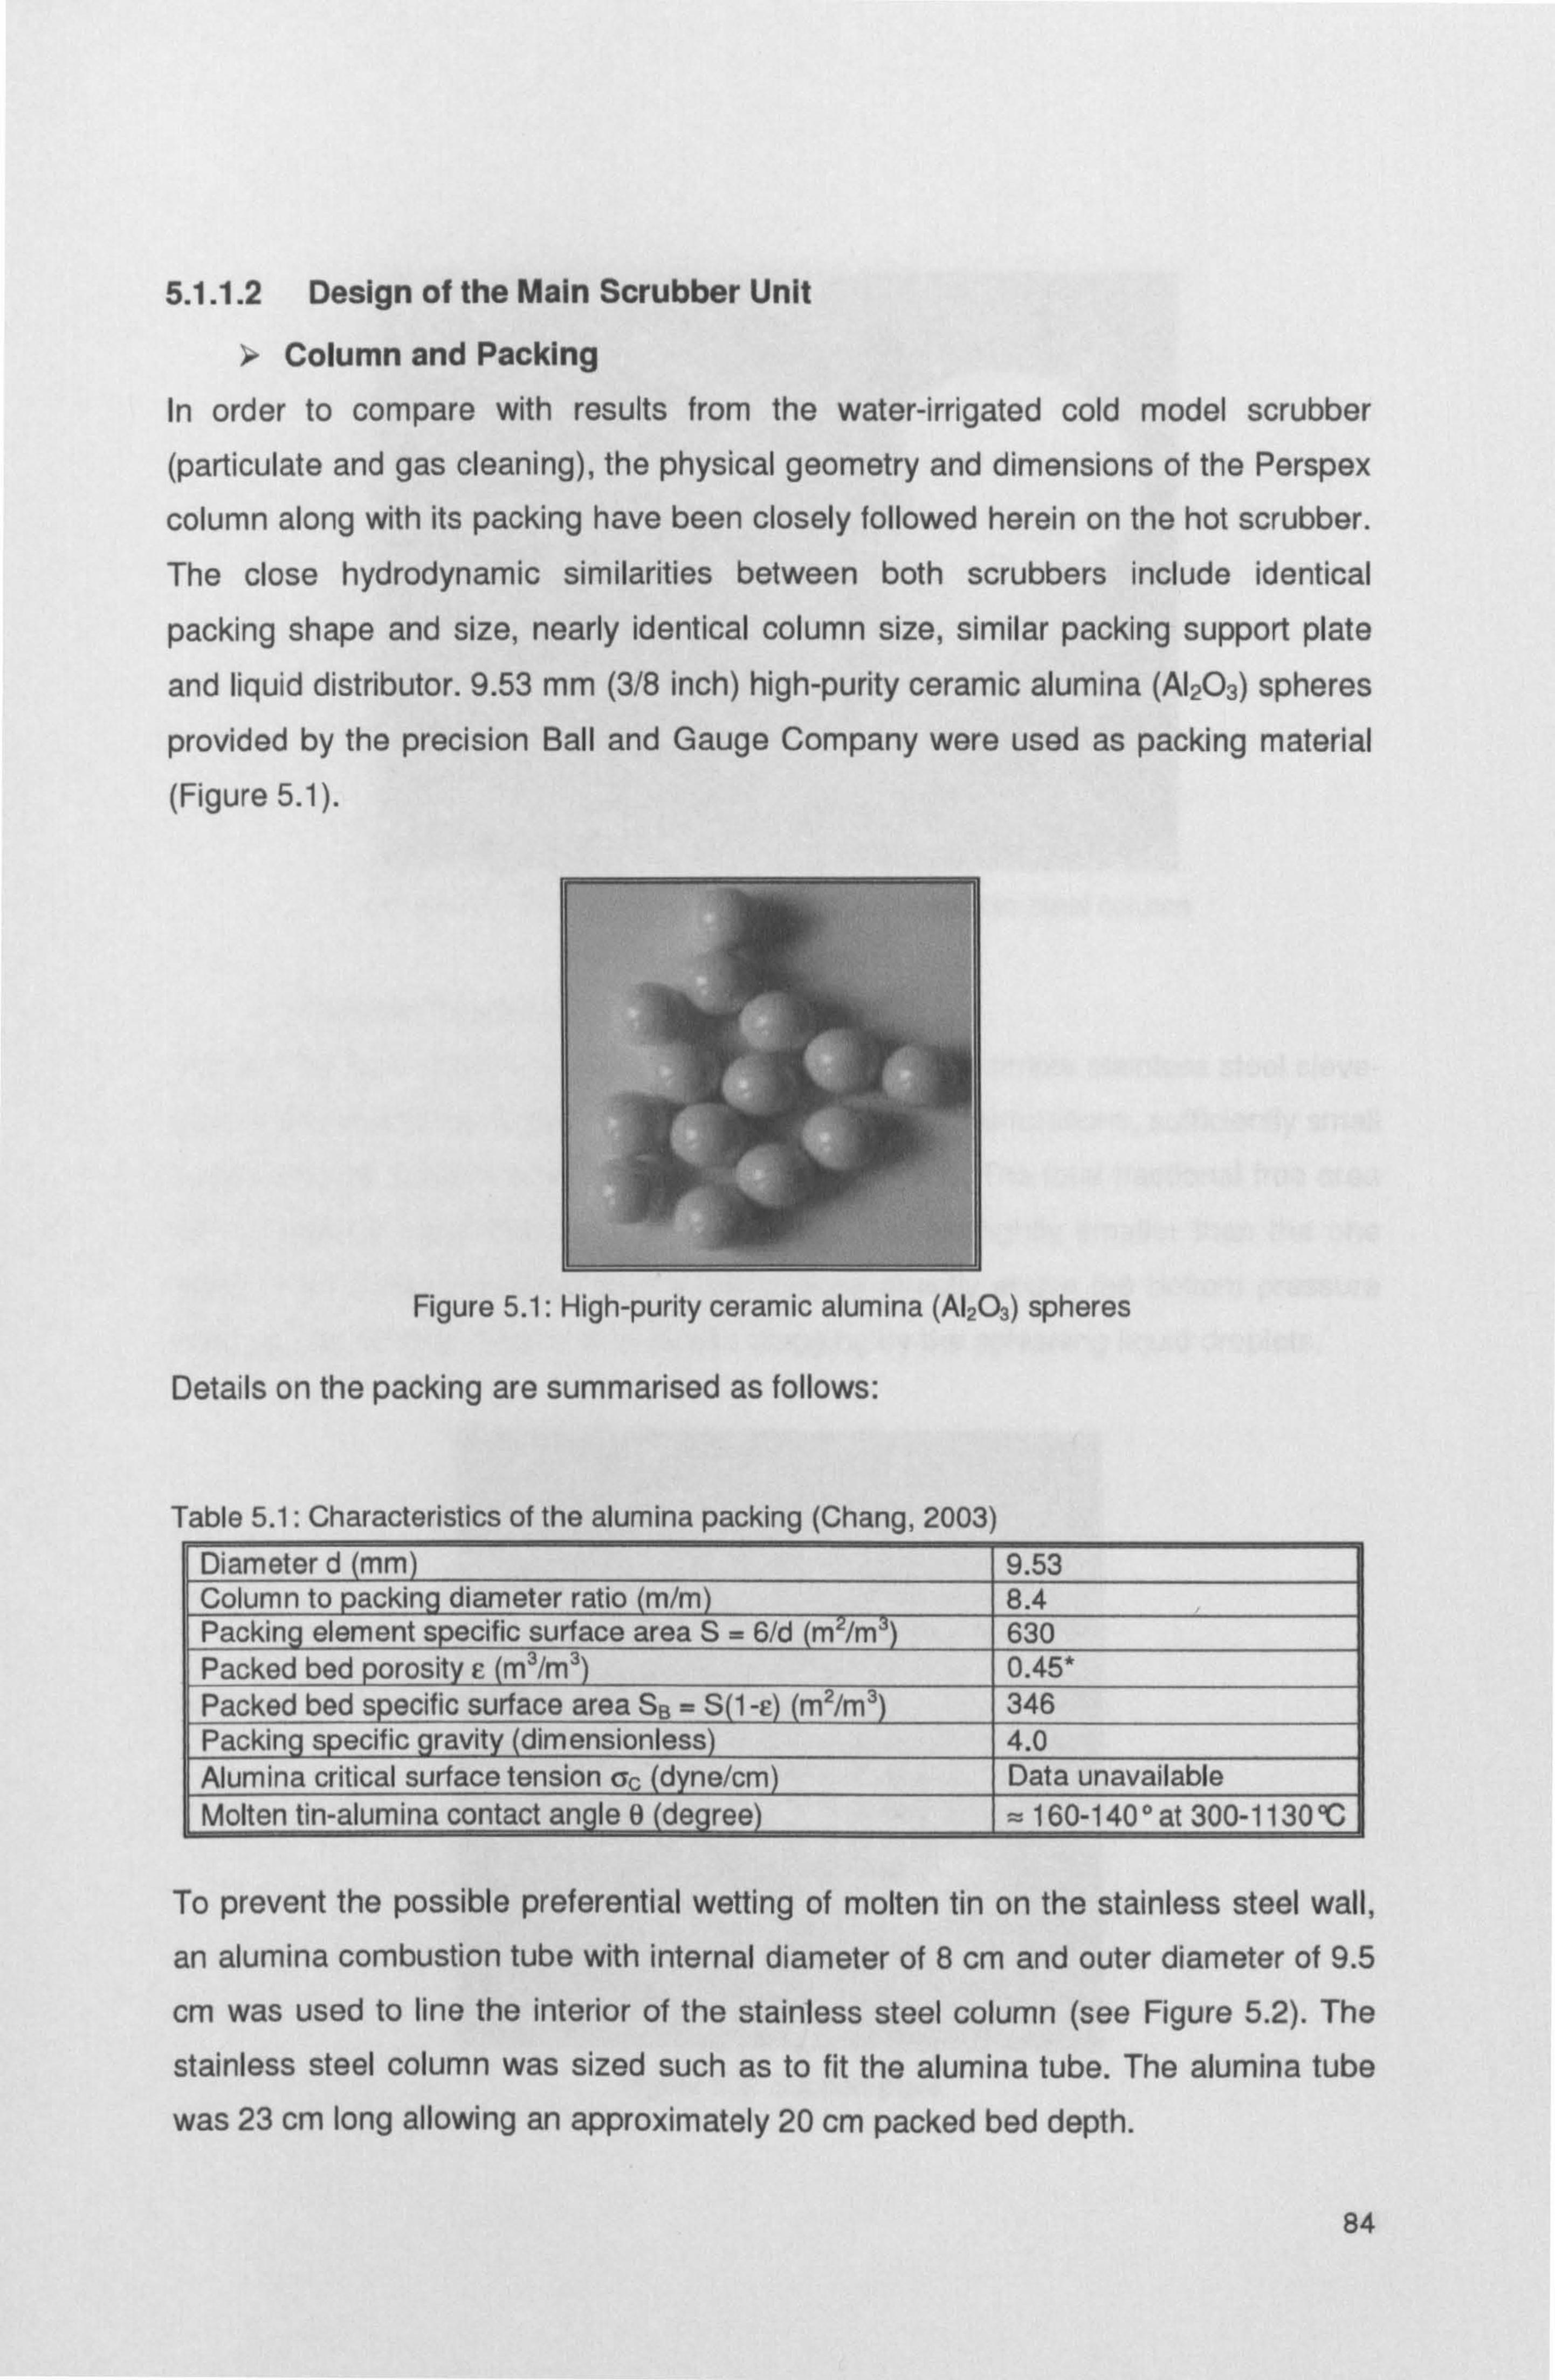
5.1.1.2 Design of the Main Scrubber Unit
Column and Packing
In order to compare with results from the water-irrigated cold model scrubber
(particulate and gas cleaning), the physical geometry and dimensions of the Perspex
column along with its packing have been closely followed herein on the hot scrubber.
The close hydrodynamic similarities between both scrubbers include identical
packing shape and size, nearly identical column size, similar packing support plate
and liquid distributor. 9.53 mm (3/8 inch) high-purity ceramic alumina (A1203) spheres
provided by the precision Ball and Gauge Company were used as packing material
(Figure 5.1).
Figure 5.1: High-purity ceramic alumina (A1203) spheres
Details on the packing are summarised as follows:
Table 5.1: Characteristics of the alumina packing (Chang, 2003) Diameter d (mm) 9.53 Column to packing diameter ratio m/m 8.4 Packing element specific surface area S= 6/d (M2/M3) 630 Packed bed porosity E m3/m3 0.45* Packed bed specific surface area SB = SO -Em2/m3 346 Packing specific gravity (dimensionless) 4.0 Alumina critical surface tension ßc (dyne/cm) Data unavailable Molten tin-alumina contact angle 0 (degree) = 160-140° at 300-1130 °C
To prevent the possible preferential wetting of molten tin on the stainless steel wall,
an alumina combustion tube with internal diameter of 8 cm and outer diameter of 9.5
cm was used to line the interior of the stainless steel column (see Figure 5.2). The
stainless steel column was sized such as to fit the alumina tube. The alumina tube
was 23 cm long allowing an approximately 20 cm packed bed depth.
84

Packing Support Plate
The packed bed of alumina spheres was supported on a simple stainless steel sieve- type of packing support plate with evenly-spaced 5 mm perforations, sufficiently small to prevent the spheres from falling through (Figure 5.3). The total fractional free area
of the packing support plate was about 0.48. This is slightly smaller than the one
used in the Perspex column as the perforations directly above the bottom pressure tapping was omitted. This is to minimise plugging by the splashing liquid droplets.
"iiii" "ii"iii"
"0000000,0" iiriiiliirii 000000000000 "0000, =0000.
iwiWiiii** w#i*iiiii"
"il0iOi" A
Aida- Figure 5.3: Support plate
85
Figure 5.2: Alumina combustion tube and stainless steel column
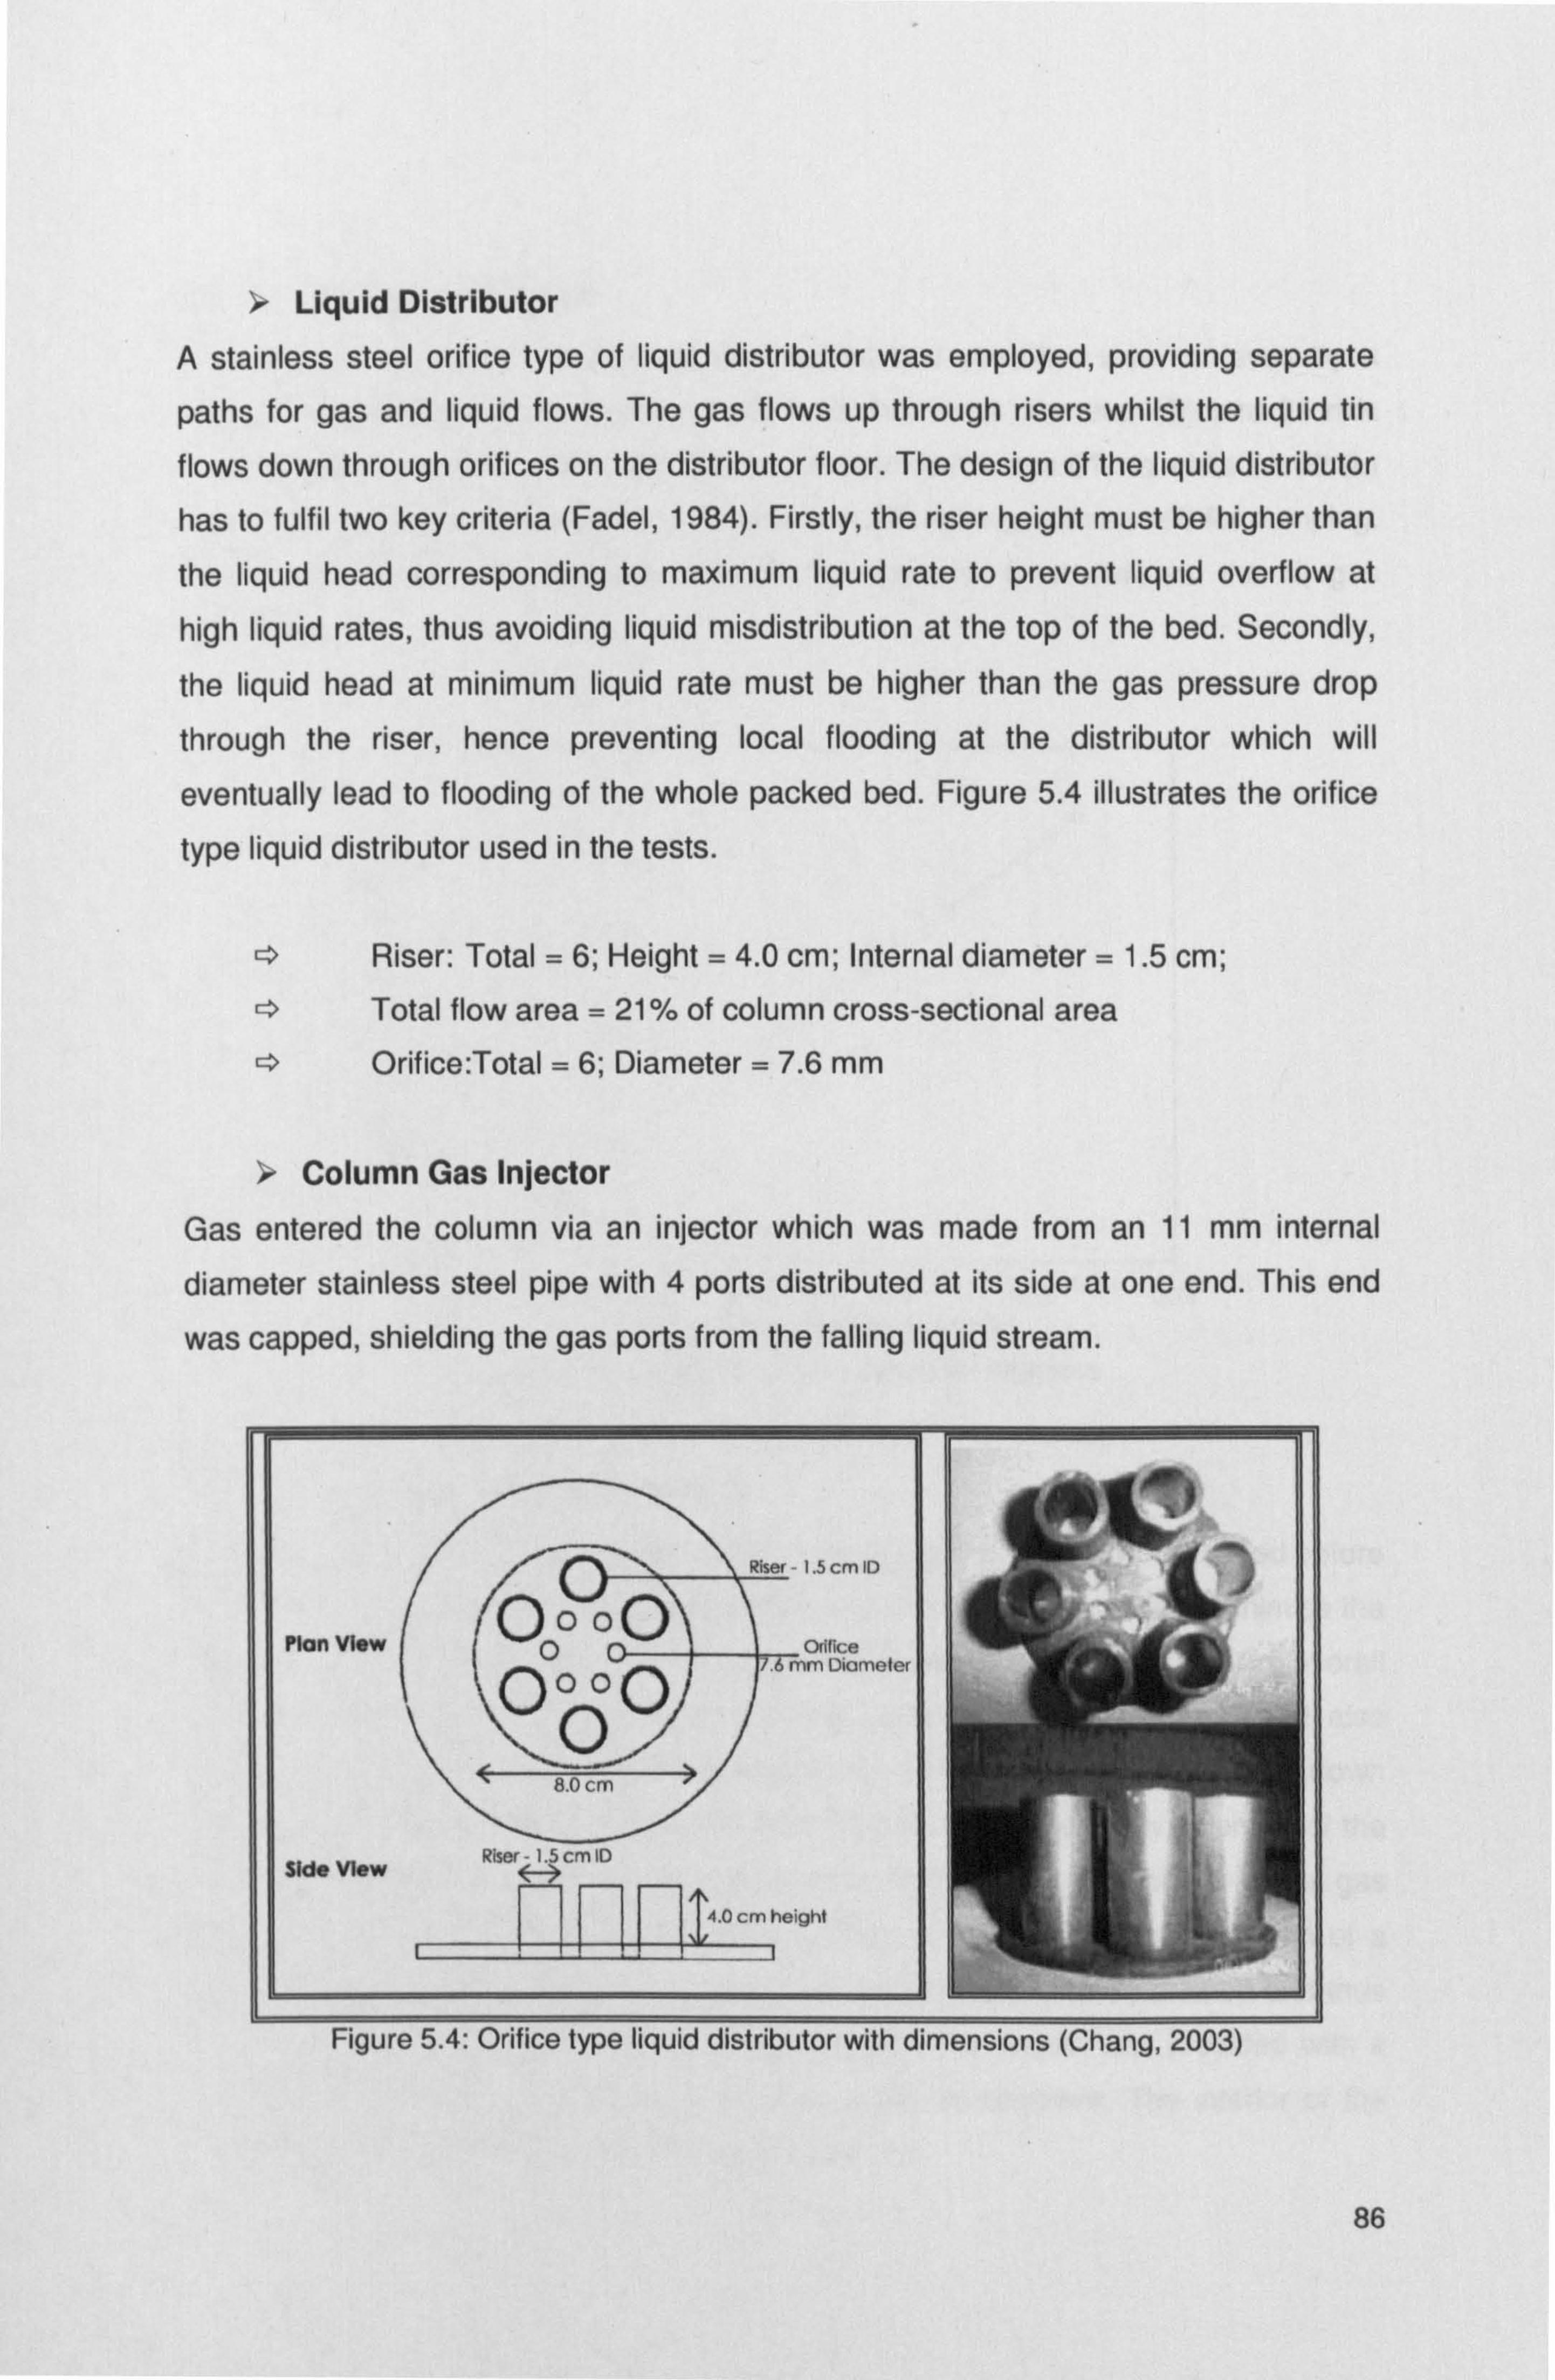
¢ Liquid Distributor A stainless steel orifice type of liquid distributor was employed, providing separate
paths for gas and liquid flows. The gas flows up through risers whilst the liquid tin
flows down through orifices on the distributor floor. The design of the liquid distributor
has to fulfil two key criteria (Fadel, 1984). Firstly, the riser height must be higher than
the liquid head corresponding to maximum liquid rate to prevent liquid overflow at
high liquid rates, thus avoiding liquid misdistribution at the top of the bed. Secondly,
the liquid head at minimum liquid rate must be higher than the gas pressure drop
through the riser, hence preventing local flooding at the distributor which will
eventually lead to flooding of the whole packed bed. Figure 5.4 illustrates the orifice
type liquid distributor used in the tests.
Riser: Total = 6; Height = 4.0 cm; Internal diameter = 1.5 cm; Total flow area = 21 % of column cross-sectional area Orifice: Total = 6; Diameter = 7.6 mm
Column Gas Injector Gas entered the column via an injector which was made from an 11 mm internal
diameter stainless steel pipe with 4 ports distributed at its side at one end. This end
was capped, shielding the gas ports from the falling liquid stream.
Riser- 1.5 cm ID
O0 0O
Plan View 0 orifice OOOO7.6 mm Diameter
O )I 8.0 cm I
Side View Riser - 1.5 cm ID
4.0 cm height
Figure 5.4: Oritice type liquid distributor with dimensions (Chang, 2003)
86
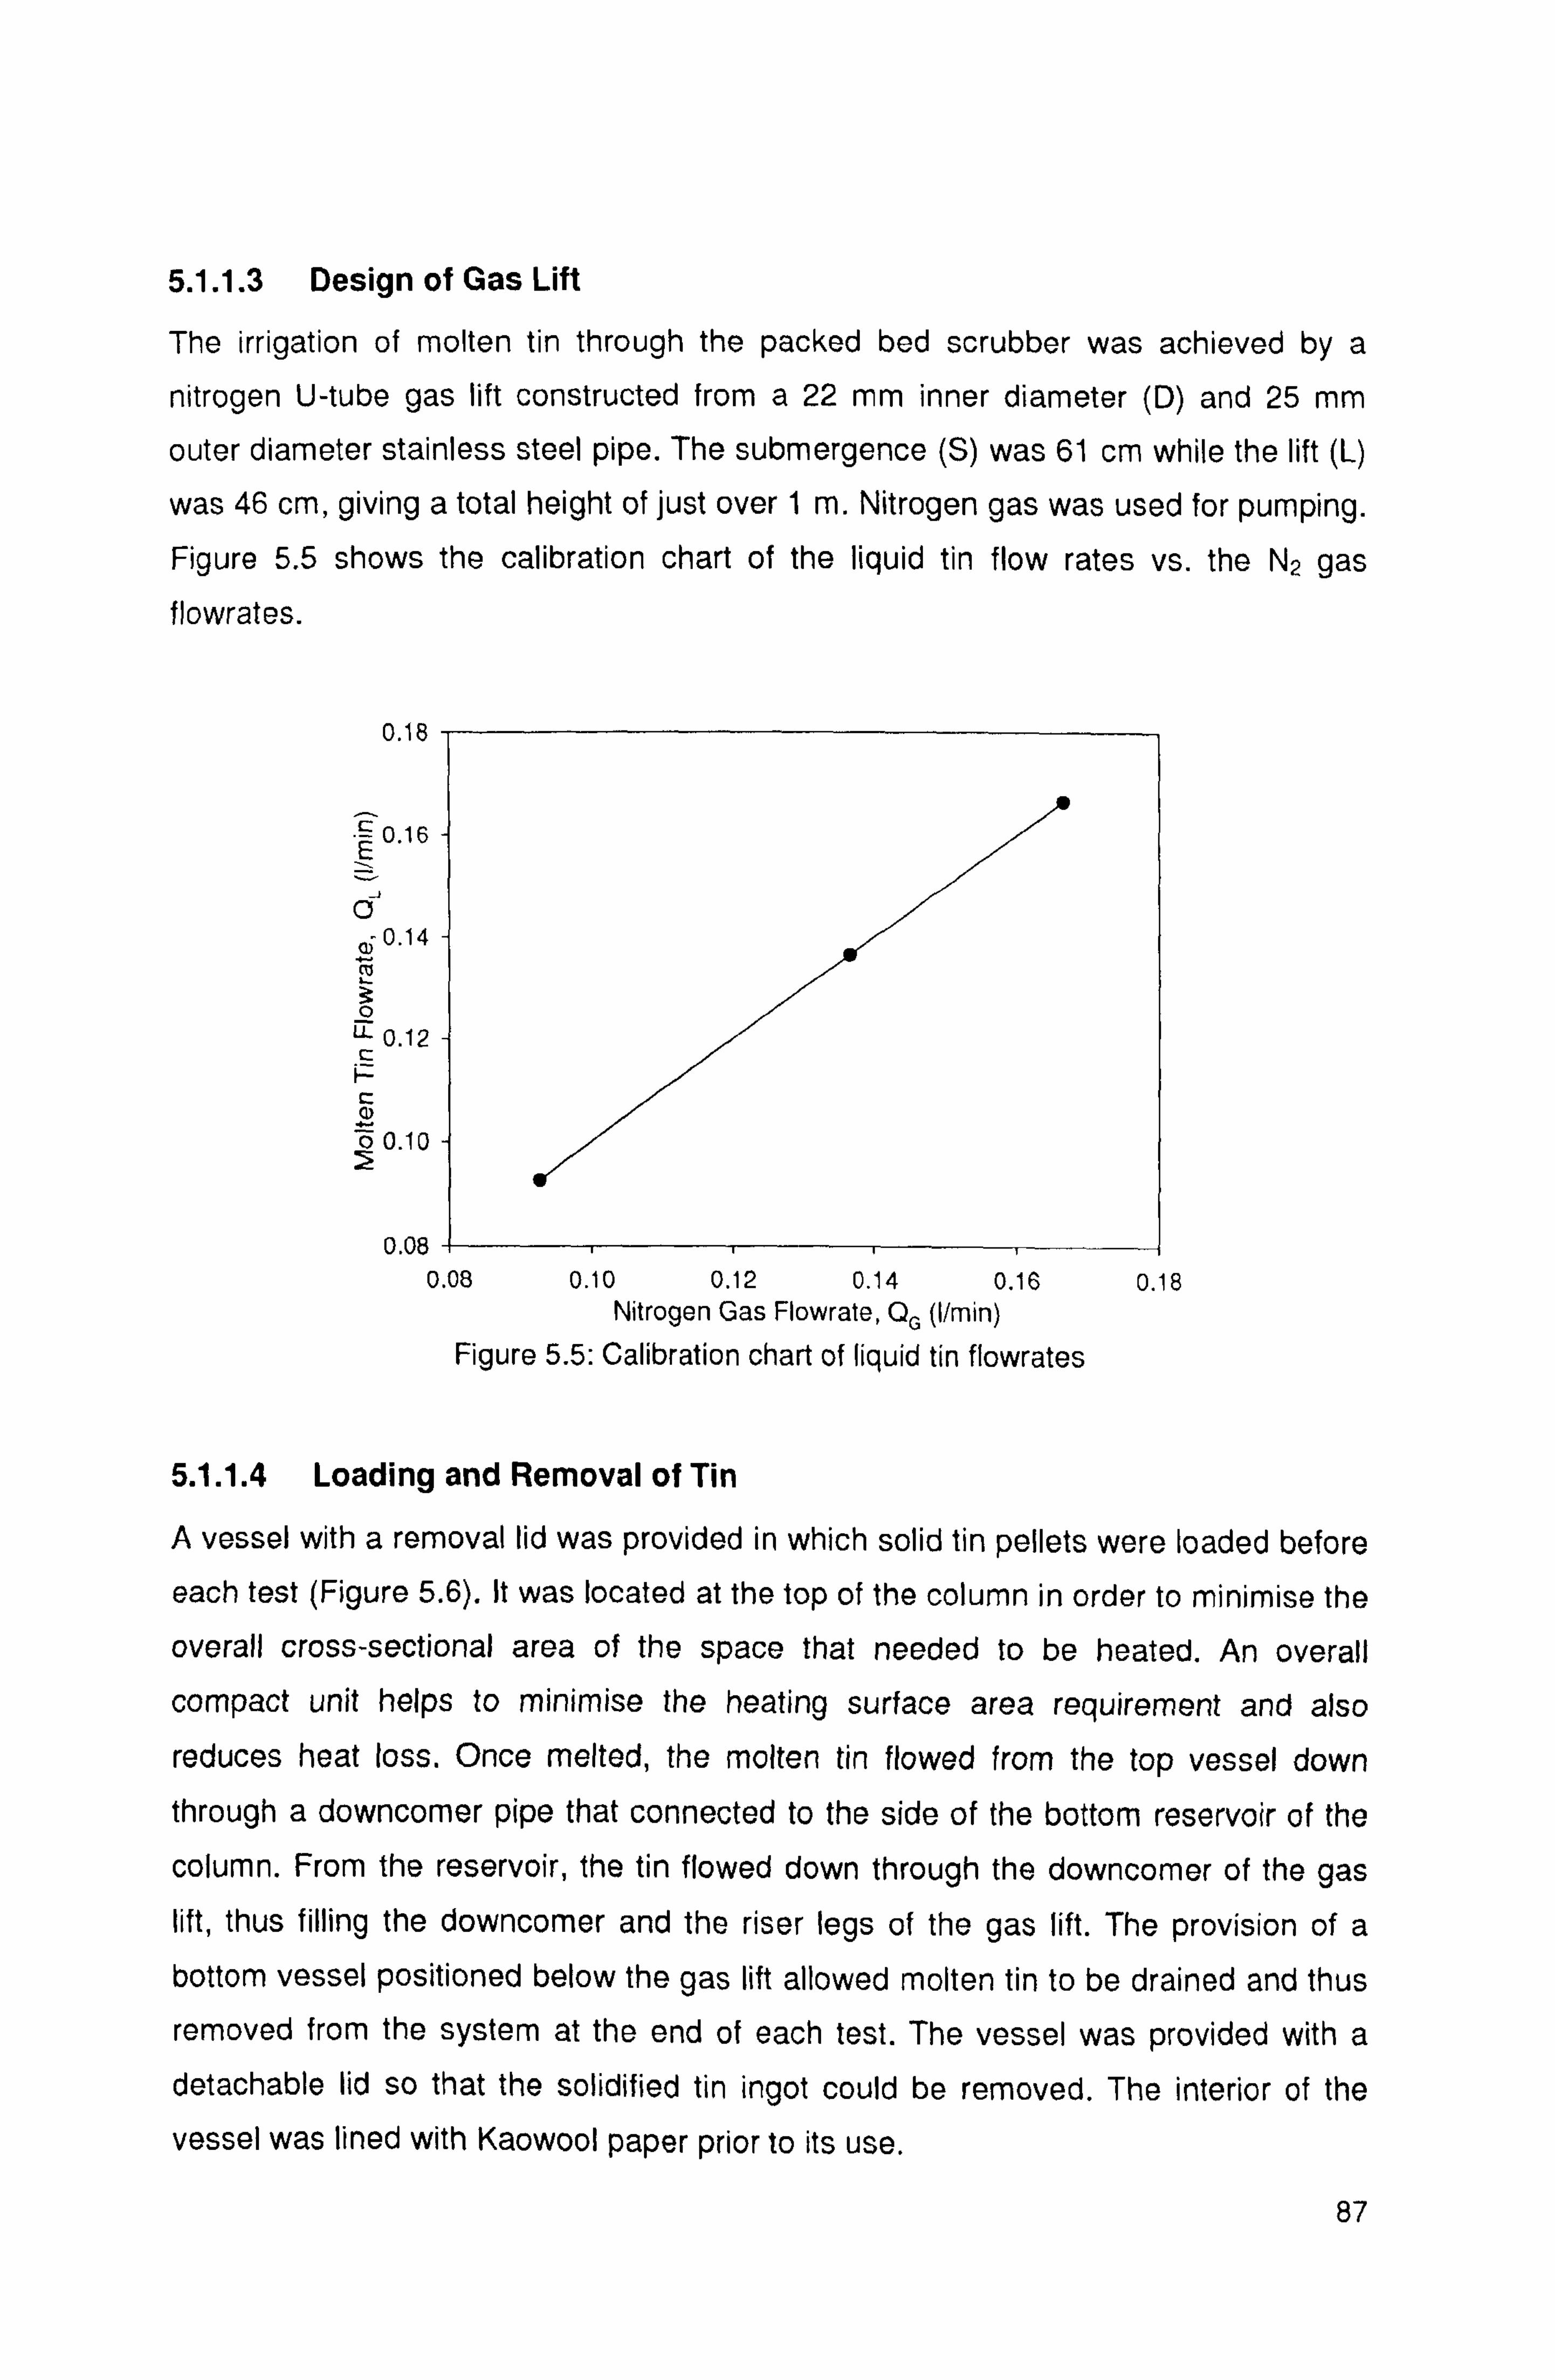
5.1.1.3 Design of Gas Lift
The irrigation of molten tin through the packed bed scrubber was achieved by a
nitrogen U-tube gas lift constructed from a 22 mm inner diameter (D) and 25 mm
outer diameter stainless steel pipe. The submergence (S) was 61 cm while the lift (L)
was 46 cm, giving a total height of just over 1 m. Nitrogen gas was used for pumping. Figure 5.5 shows the calibration chart of the liquid tin flow rates vs. the N2 gas
flowrates.
0.18
0.16
O
6 0.14 ro
0 0.12
H
N ö 0.10
0.08 (
0.08 0.10 0.12 0.14 0.16 Nitrogen Gas Flowrate, OG (1/min)
Figure 5.5: Calibration chart of liquid tin flowrates
5.1.1.4 Loading and Removal of Tin
0.18
A vessel with a removal lid was provided in which solid tin pellets were loaded before
each test (Figure 5.6). It was located at the top of the column in order to minimise the
overall cross-sectional area of the space that needed to be heated. An overall
compact unit helps to minimise the heating surface area requirement and also
reduces heat toss. Once melted, the molten tin flowed from the top vessel down
through a downcomer pipe that connected to the side of the bottom reservoir of the
column. From the reservoir, the tin flowed down through the downcomer of the gas lift, thus filling the downcomer and the riser legs of the gas lift. The provision of a bottom vessel positioned below the gas lift allowed molten tin to be drained and thus
removed from the system at the end of each test. The vessel was provided with a detachable lid so that the solidified tin ingot could be removed. The interior of the
vessel was lined with Kaowool paper prior to its use.
87

Earlier tests using small amounts of tin strips showed that molten tin when solidified fused onto the wall of a bare stainless steel crucible, but the solid tin ingot was easily
removed when the crucible was lined with Kaowool paper.
5.1.1.5 Tin Level Indicator
Level sensors were incorporated to indicate the molten tin level in the column
reservoir. These were stainless steel probes hanging from the top of the reservoir. The probes were inserted through small ceramic alumina pieces which were attached to the top of the reservoir. The ceramic pieces enable connection of the probes to
external wires whilst insulating the probes from contacting the metal body of the
column. The wires were connected to an electronic system controller. When the
molten tin in the reservoir rises sufficiently high such that it touches the tip of the hanging probe, an electrical contact is made between the system controller, the tin
and the metal rig. Since both the control panel and the metal rig were earthed, a
complete electrical circuit was achieved; hence an electrical signal was produced and displayed on the control panel showing the tin level in the column reservoir. Three
stainless steel probes were used with varying lengths to provide low (L1 =2 cm),
moderate (L2 =3 cm) and high (L3 =4 cm) level indicators of the molten tin in the
reservoir.
88

5.1.1.6 Gas Supply
The N2 gas to both the main column and the gas lift was supplied from separate gas
cylinders. For particulate cleaning studies only a N2 tank was used. For
desulphurisation studies, the syngas was modeled as N2 containing H2S at various
concentrations. As tin is fairly reactive, it can also react with other gas components in
actual syngas. The effects of H2 and other gases are discussed in Chapter 6. The
N2/simulated syngas entered the column via an injector. The gas was preheated by a
series of three in-line gas heaters. K-type thermocouples with an inconel sheath and
magnesium oxide insulation were used for temperature measurement. H2S in the
outlet stream was analysed using an on-line gas chromatograph (ABB PGC2000)
every 5-10 minutes. The GC was calibrated using span gas with H2S concentration of
4000 ppm ±5%.
5.1.1.7 System Heating and Insulation
Six semi-cylindrical ceramic radiant heaters model CRWS-1215/240-A (3400 watts,
240 volts) supplied by Omega® were used to heat the scrubber. The radiant heater
was made from low mass, vacuum formed ceramic fibre with helically wound iron-
chrome-aluminium wire elements embedded into the fibre. It provides the
convenience of combined heating elements and insulation in a single unit. Each
heater was 12 inches in length, 19 inches in external diameter and 15 inches in
internal diameter. The six semi-cylindrical radiant heaters were stacked on top of
each other, forming a compact semi-cylindrical compartment in which the column,
gas lift, top and bottom vessels were fitted. The main gas that entered the base of the
column was preheated by a series of three in-line gas heaters model AHP-7562 (750
watts, 240 volts) with a heated length of 14 cm each, supplied by Omega®. The
nitrogen gas to the gas lift was preheated by a single in-line gas heater model AHP-
5052 (400 watts, 240 volts) with a heated length of 11 cm supplied also by Omega®.
Kaowool boards and blankets were used for system insulation. The front of the semi-
cylindrical heated compartment was covered by Kaowool boards. The interior of the
heated compartment was partitioned by Kaowool blankets in the top and bottom
sections to help retain the heat.
89
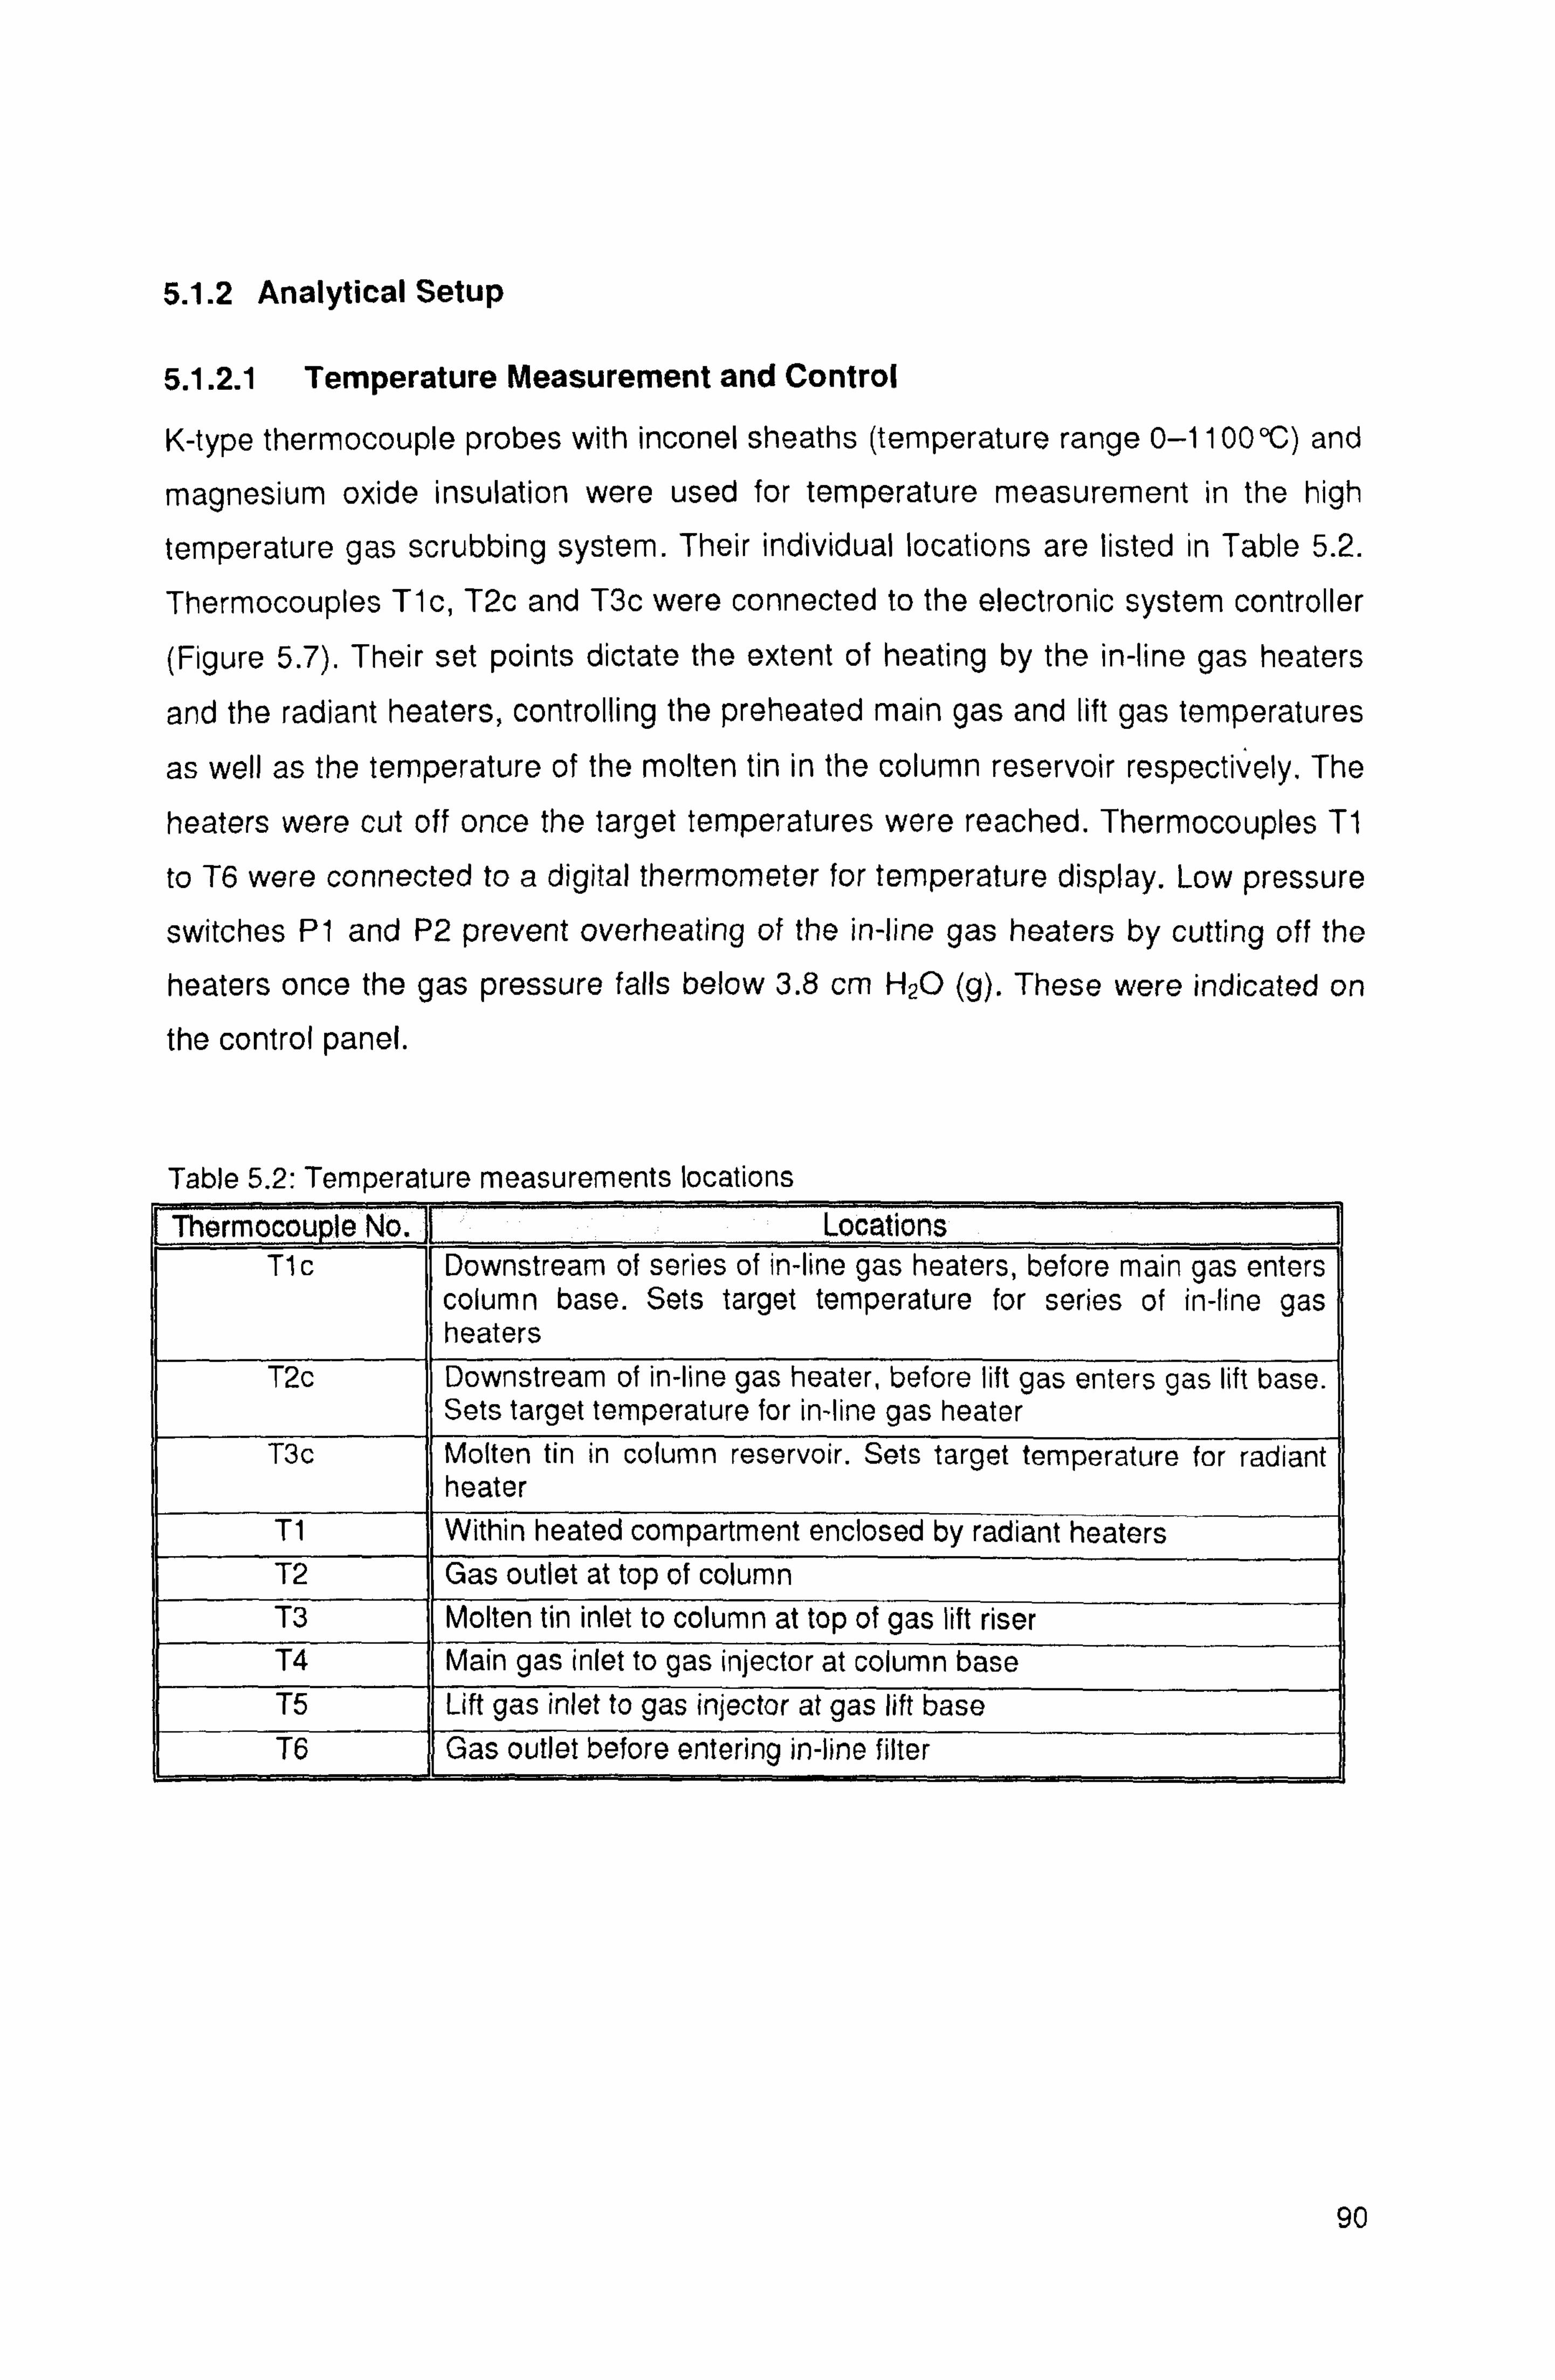
5.1.2 Analytical Setup
5.1.2.1 Temperature Measurement and Control
K-type thermocouple probes with inconel sheaths (temperature range 0-1100°C) and
magnesium oxide insulation were used for temperature measurement in the high
temperature gas scrubbing system. Their individual locations are listed in Table 5.2.
Thermocouples T1c, T2c and T3c were connected to the electronic system controller
(Figure 5.7). Their set points dictate the extent of heating by the in-line gas heaters
and the radiant heaters, controlling the preheated main gas and lift gas temperatures
as well as the temperature of the molten tin in the column reservoir respectively. The
heaters were cut off once the target temperatures were reached. Thermocouples T1
to T6 were connected to a digital thermometer for temperature display. Low pressure
switches P1 and P2 prevent overheating of the in-line gas heaters by cutting off the
heaters once the gas pressure falls below 3.8 cm H2O (g). These were indicated on
the control panel.
Table 5.2: Temperature measurements locations
Thermocouple No. Locations T1 c Downstream of series of in-line gas heaters, before main gas enters
column base. Sets target temperature for series of in-line gas heaters
T2c Downstream of in-line gas heater, before lift gas enters gas lift base. Sets target temperature for in-line gas heater
T3c Molten tin in column reservoir. Sets target temperature for radiant heater
T1 Within heated compartment enclosed by radiant heaters T2 Gas outlet at top of column T3 Molten tin inlet to column at top of gas lift riser T4 Main gas inlet to gas injector at column base T5 Lift gas inlet to gas injector at gas lift base T6 Gas outlet before entering in-line filter
90

5.1.2.2 Gas Analyser
For particulate cleaning studies, an oxygen analyser (Figure 5.8) was used to
continuously monitor the level of oxygen concentration in the packed bed scrubber. It
is also important to ensure that the system is totally run in inert atmosphere within the
scrubber to prevent tin oxidation during the experimental work. For hot gas desulphurisation studies, an online process gas chromatograph analyser (ABB-
PGC2000) was used to continuously monitor the concentration of the H2S at the top
of the scrubber.
91
Figure 5.7: Electronic system controller
Figure 5.8: Oxygen gas analyser
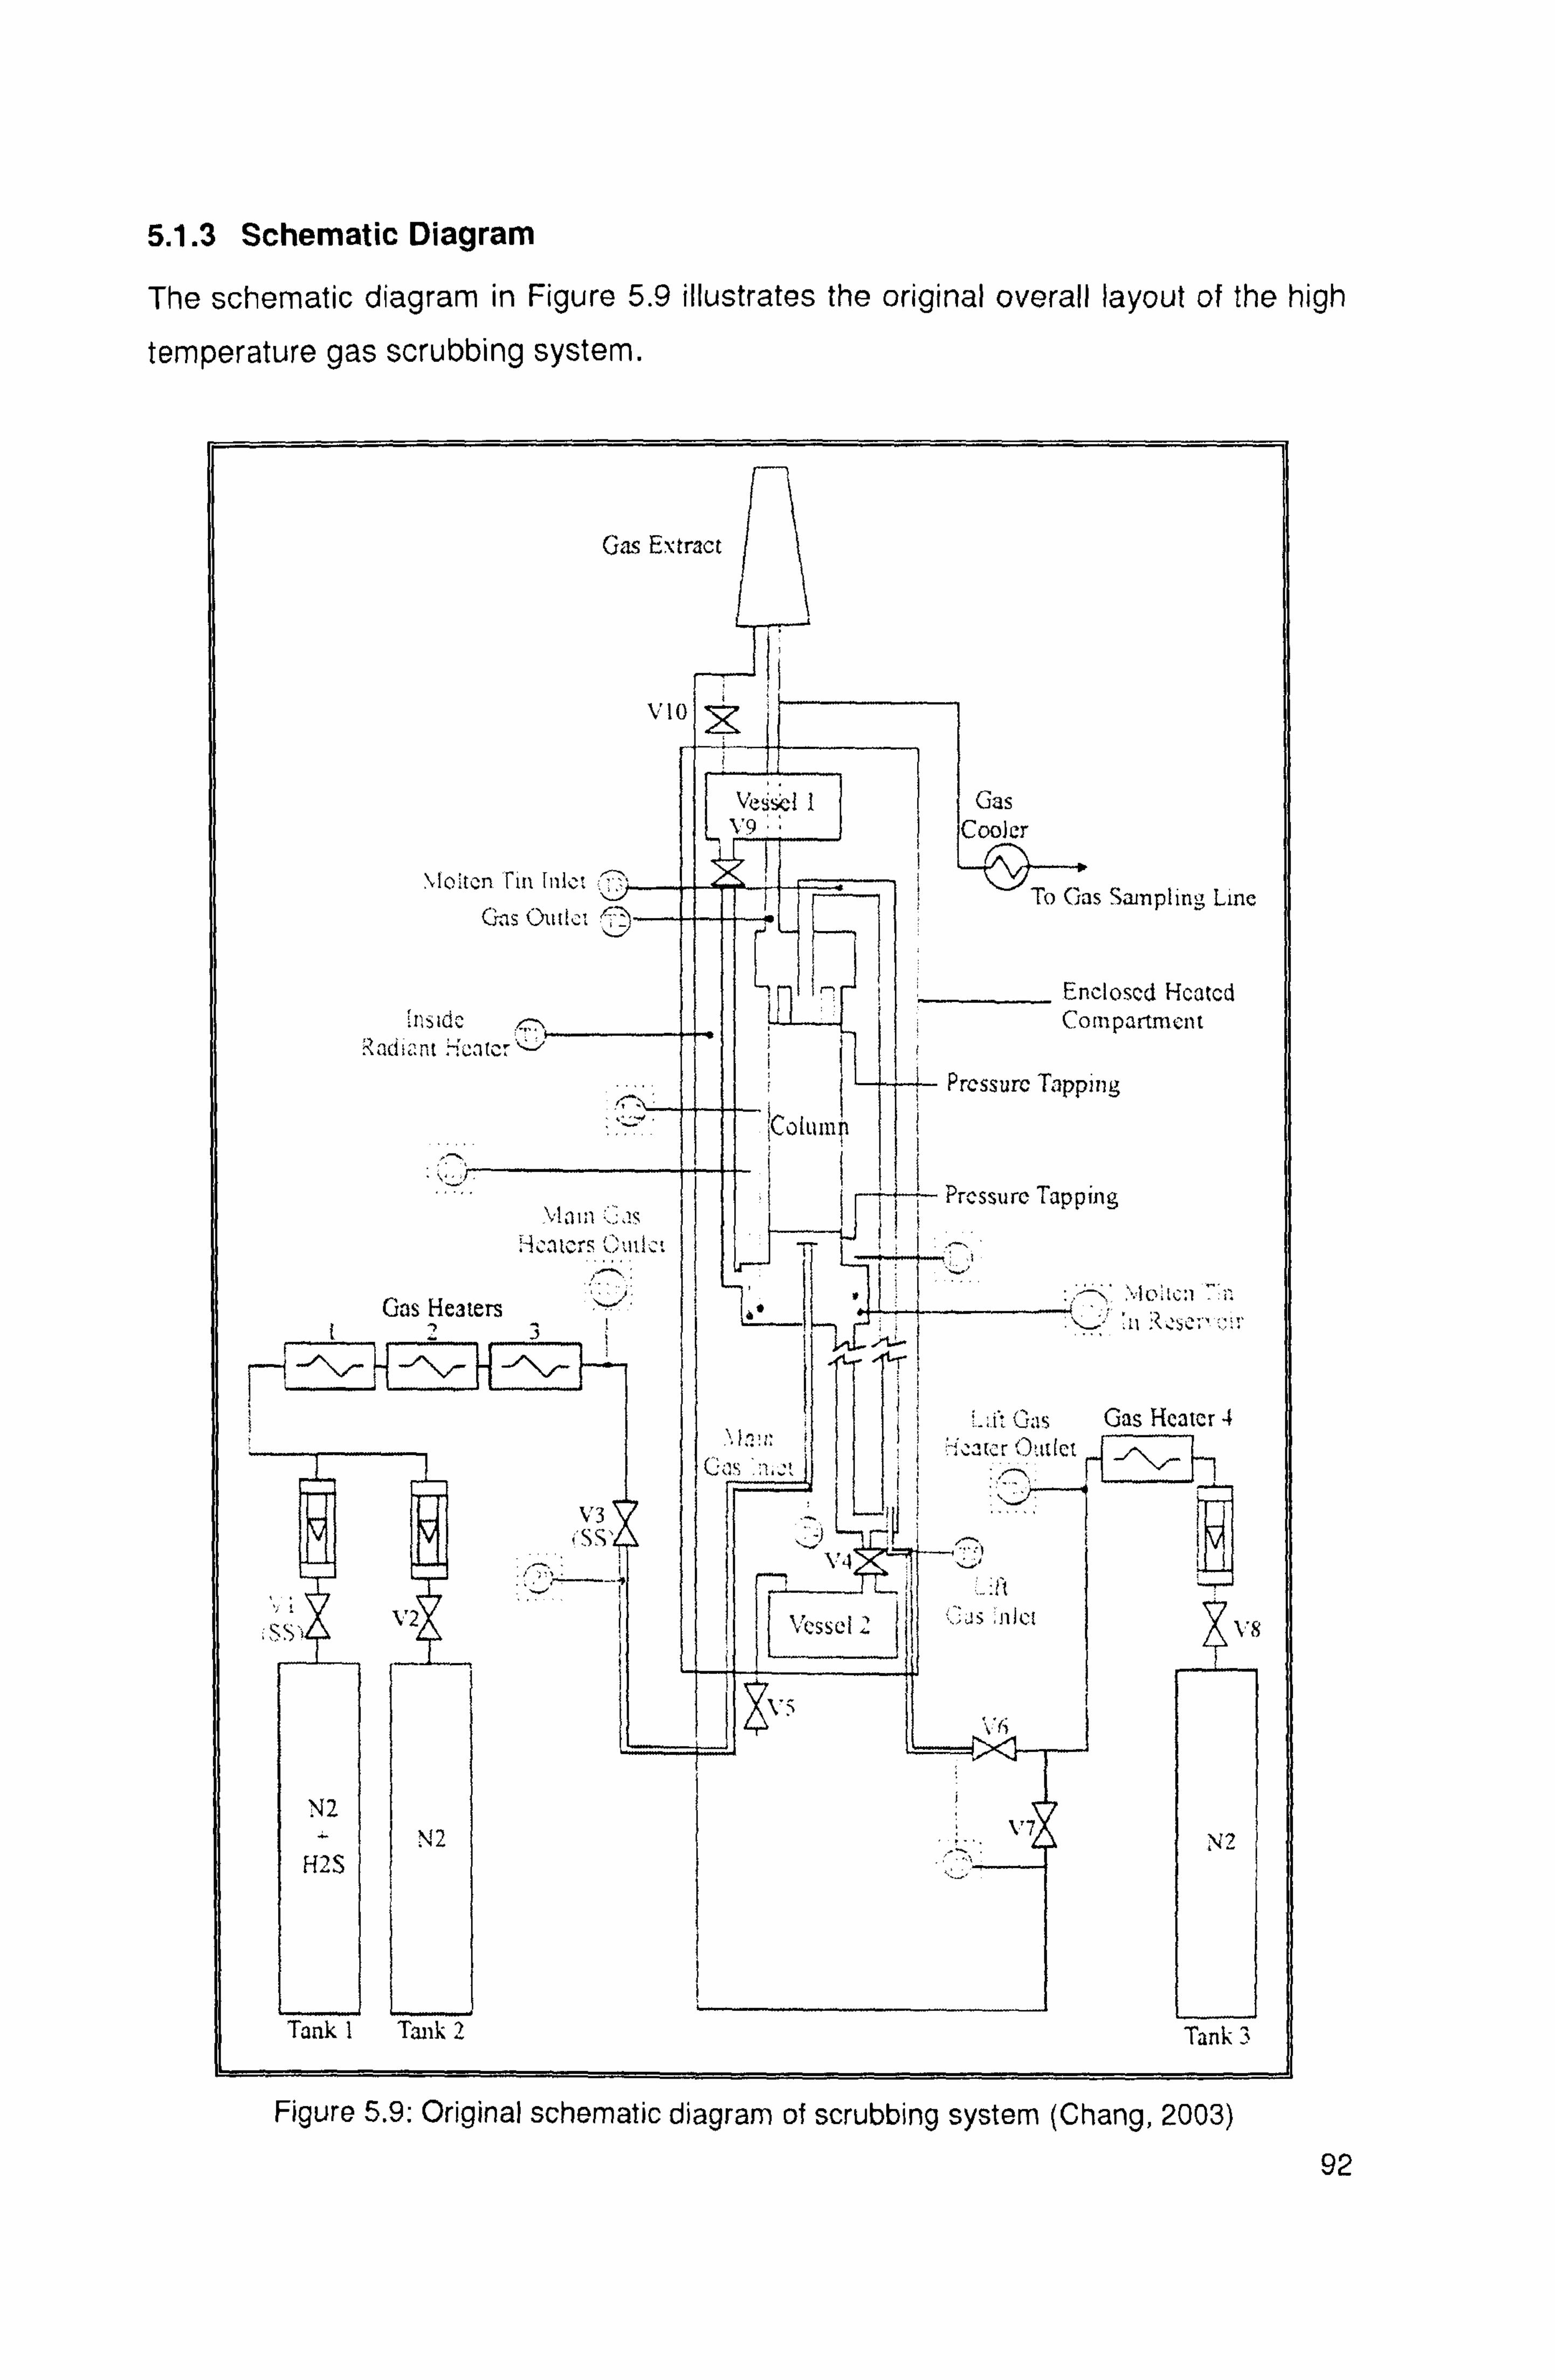
5.1.3 Schematic Diagram
The schematic diagram in Figure 5.9 illustrates the original overall layout of the high
temperature gas scrubbing system.
Gas Extract
vto
Vessel1 Gas 9 Cooler
\Ioitcn rin [Whet ; To Cias Sampling Line Gas Oahe; J
Enclosed Hcatcd insid Compartment
Radiant iCato- Pressure Tapping
Pressure Tapping
Hýatý tý atlc:
Gas Heaters a" ! 23 1ý yL. l
it Gas Gas Heater 4 f, ,- ater Outlet
V3 IP SS,
va Ii
t2 II 'S") vessel .,, let `. H
N2 \2 V7 V?
H2S
Tank I Tank 2 Tank 3
Figure 5.9: Original schematic diagram of scrubbing system (Chang, 2003)
92

5.2 Modification of the Original Experimental Design
Previously, this equipment was designed to study only the desuiphurisation process
using liquid tin (Chang, 2003). In this research work, the existing equipment was
modified in order to study the desulphurisation process and to investigate the
process of particle cleaning. The aim of the design modification was also to ensure
that the tin successfully circulates through the gas lift using nitrogen gas. The
following sections present the modification and additional work on the rig.
5.2.1 Packing Support Plate
A packing support plate (Figure 5.3) was used in the system in the earlier tests. It
was found that this plate was not able to function as expected due to plugging on the
surface of the plate (Figure 5.10). In order to rectify the problem, a net support plate
was designed and placed at the bottom of the column as shown in Figure 5.11.
5.2.2 Gas Heaters
The position of the main heaters (heater 1,2 and 3) were changed from vertical to
horizontal position due to operational problems as recommended by the supplier (RS-Components, 1996).
93
Figure 5.10: Packing Support Plate Figure 5.11: Packing Support Net
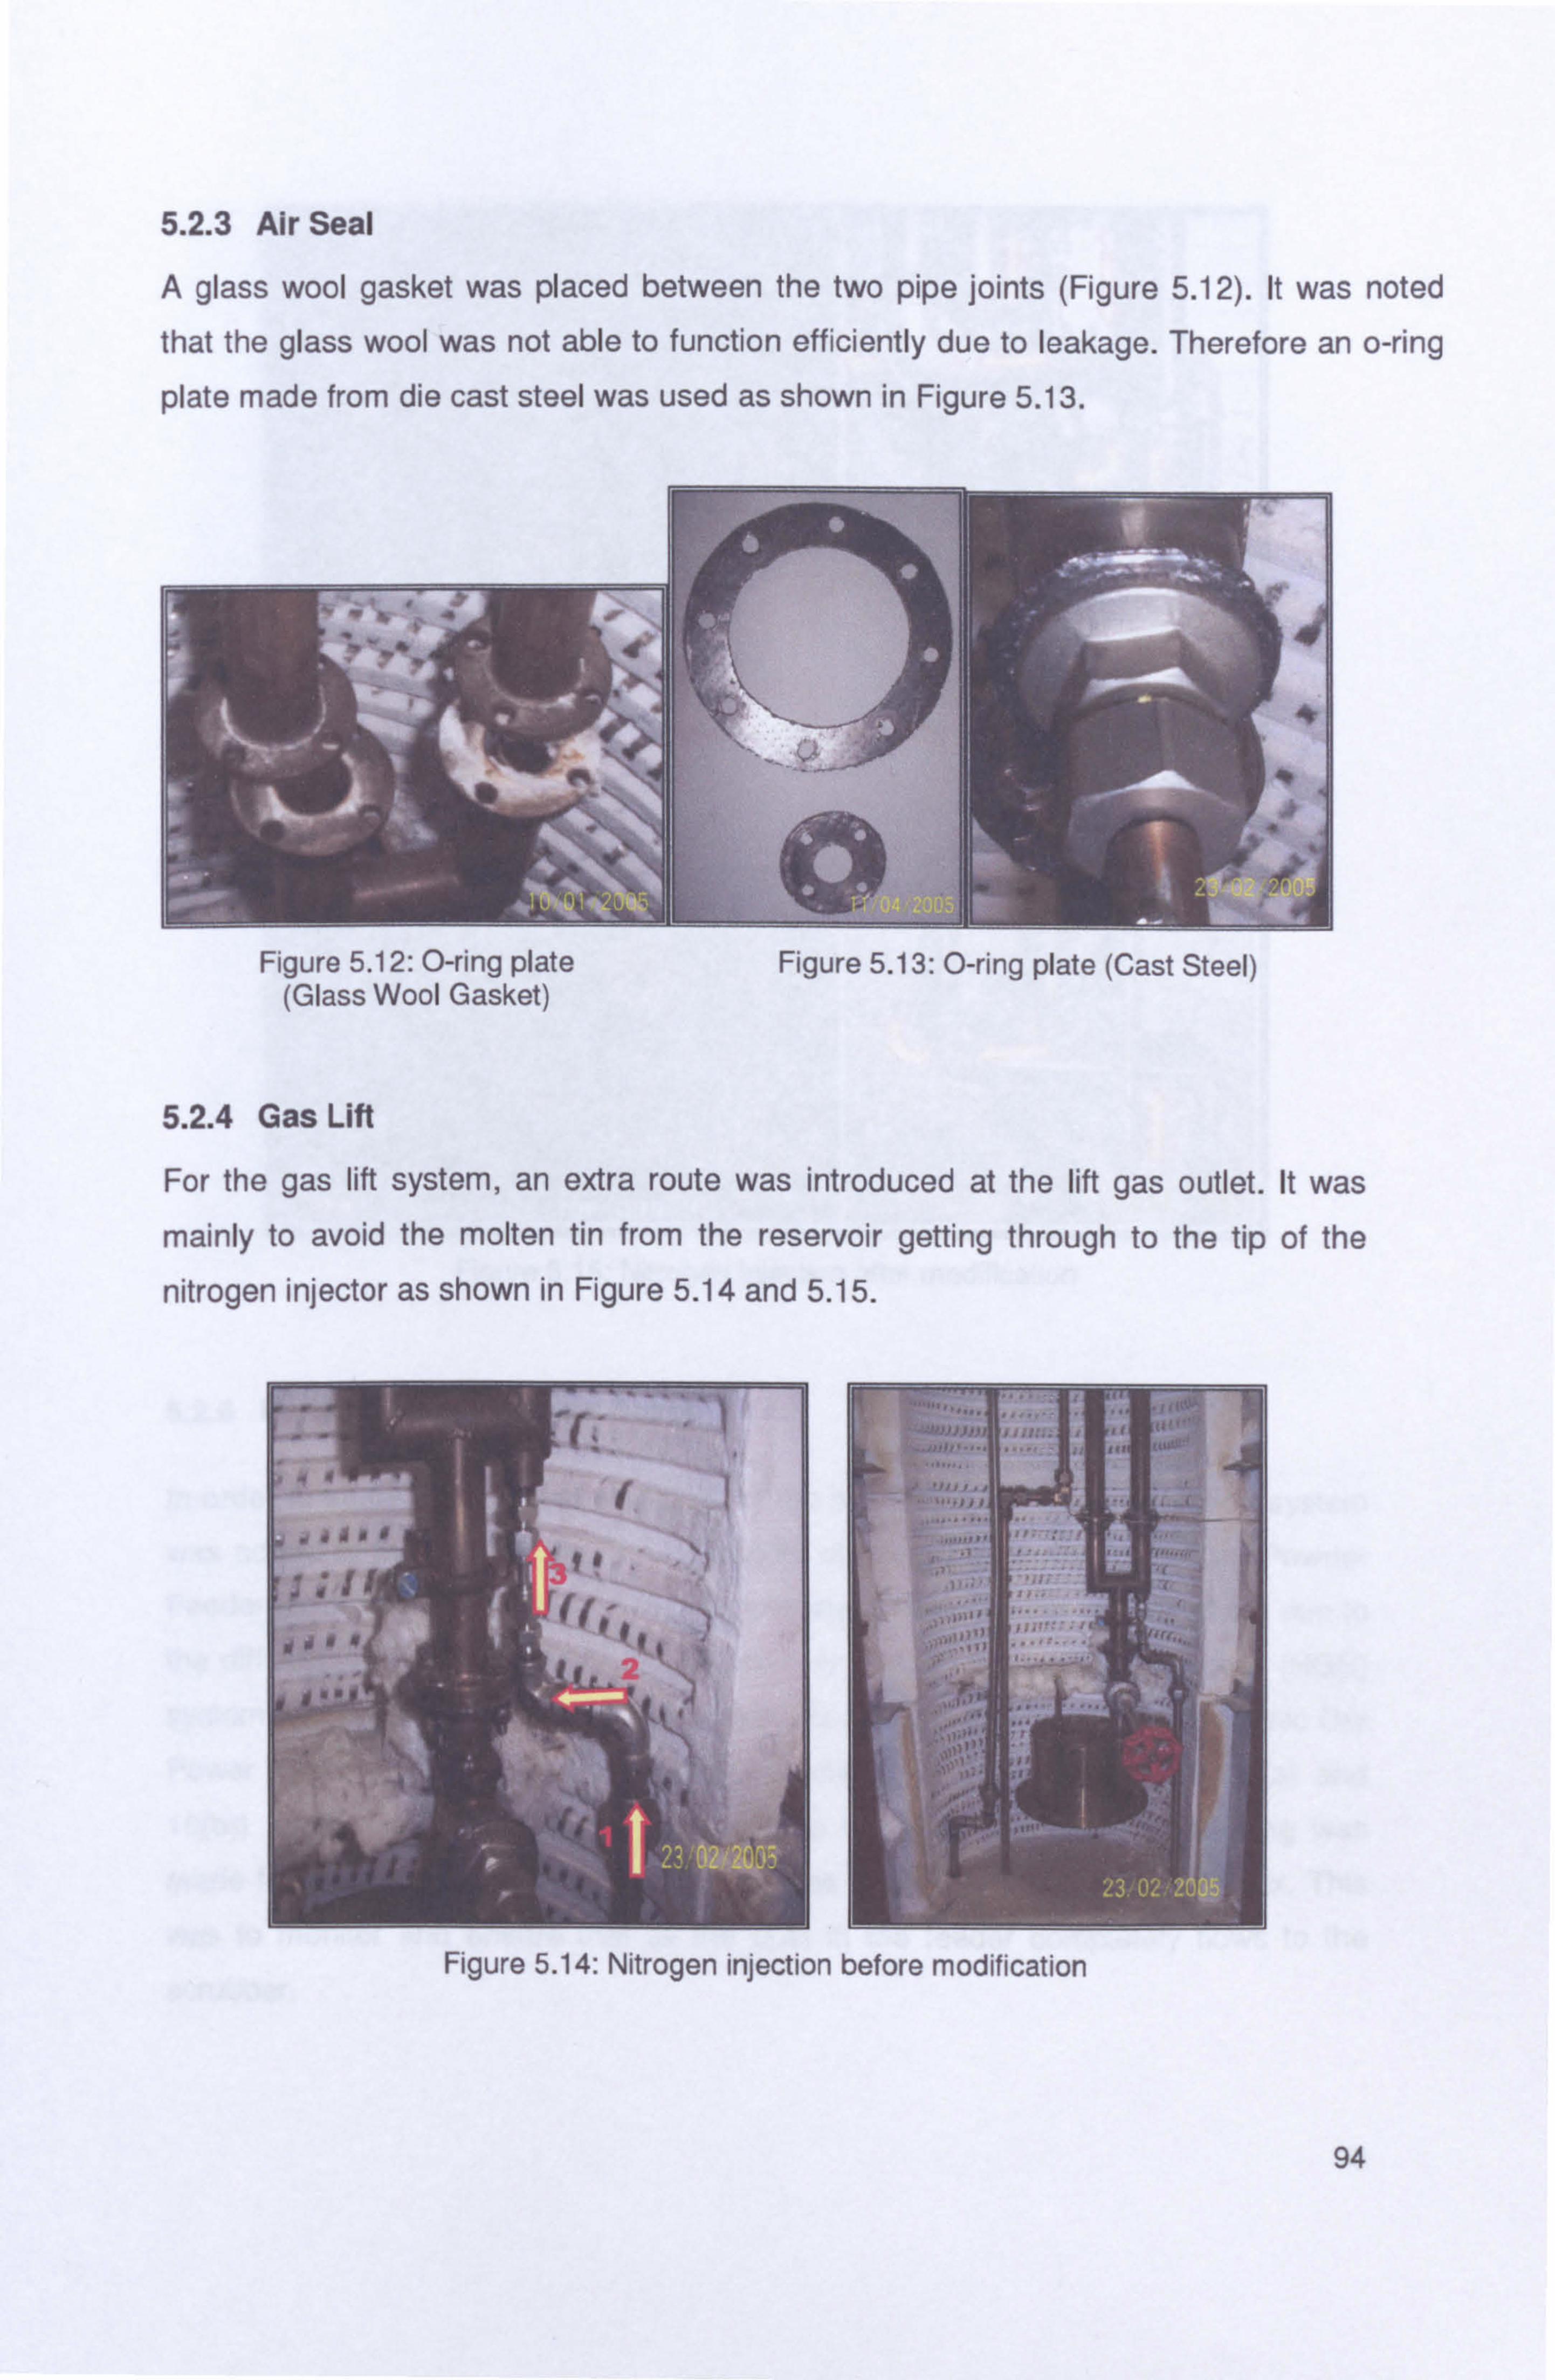
5.2.3 Air Seal
A glass wool gasket was placed between the two pipe joints (Figure 5.12). It was noted that the glass wool was not able to function efficiently due to leakage. Therefore an o-ring
plate made from die cast steel was used as shown in Figure 5.13.
5.2.4 Gas Lift
For the gas lift system, an extra route was introduced at the lift gas outlet. It was
mainly to avoid the molten tin from the reservoir getting through to the tip of the
nitrogen injector as shown in Figure 5.14 and 5.15.
"1 I.
3 ýý
Figure 5.14: Nitrogen injection before modification
94
Figure 5.12: O-ring plate Figure 5.13: O-ring plate (Cast Steel) (Glass Wool Gasket)
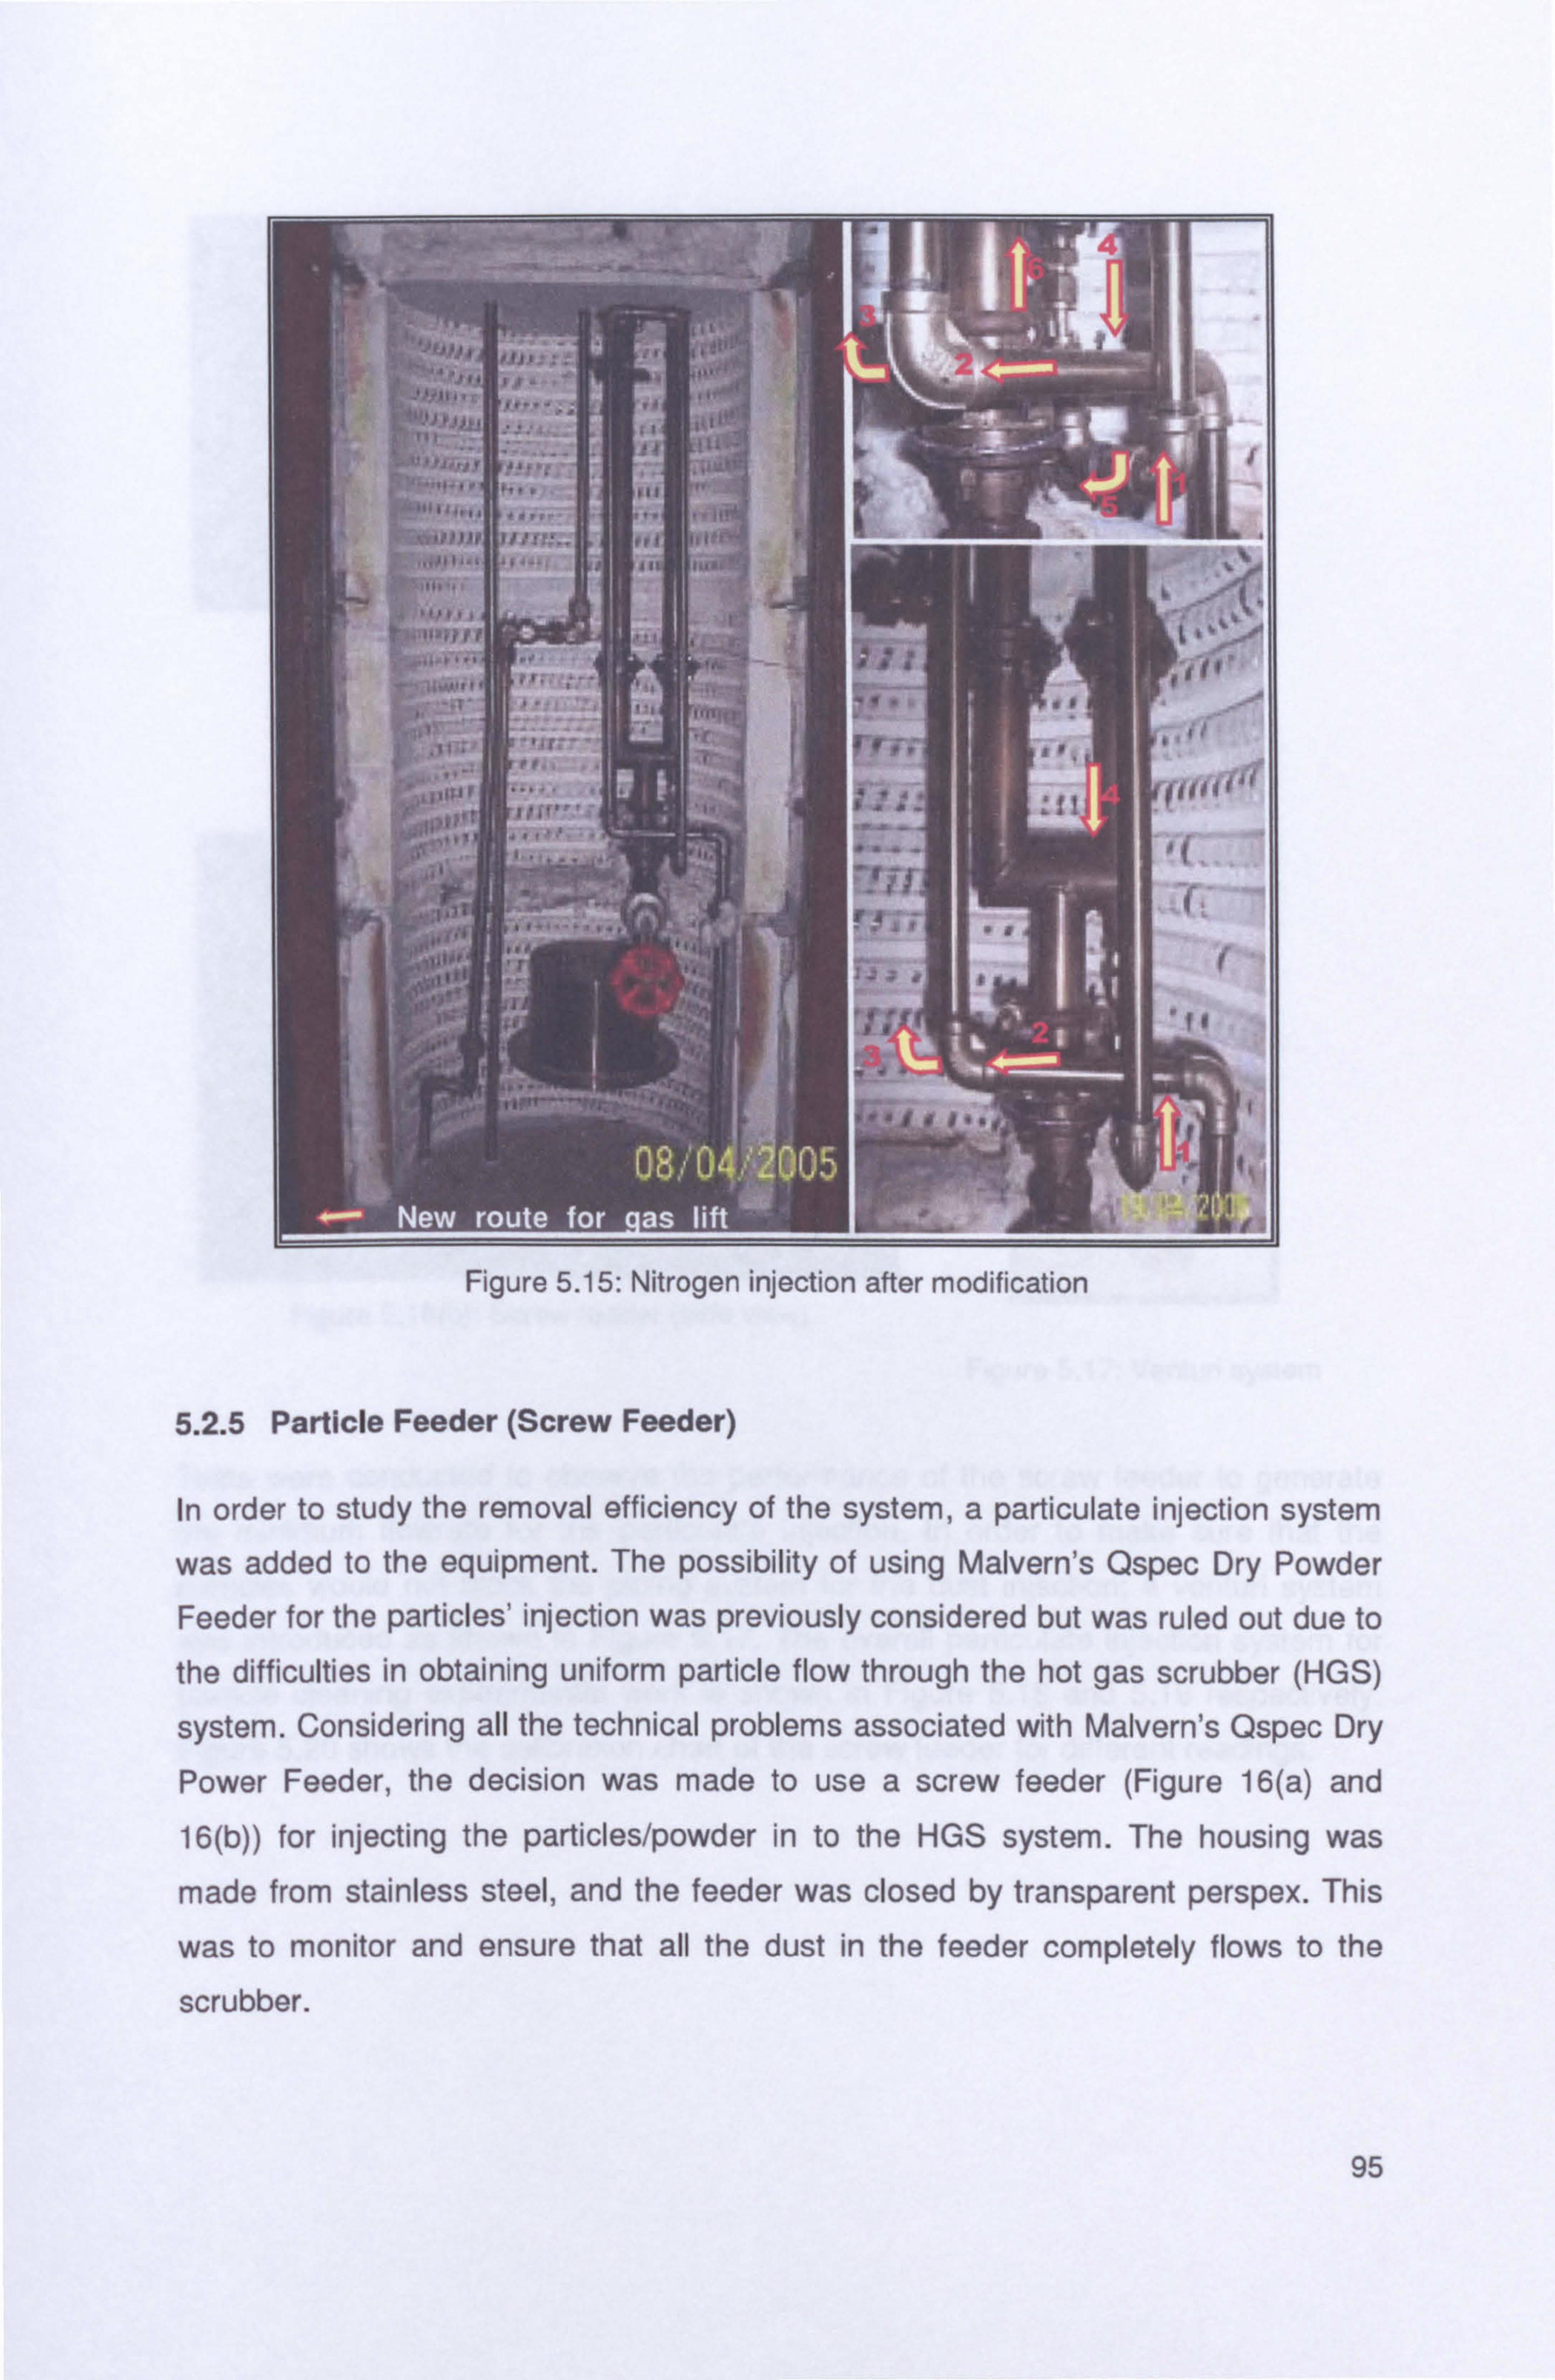
ri
FIJI Z Iii
! S
.
'111J r, rJ1 .. _ ". r. ý. 1i ,, r 11 1
.
"JU...
w Y
p' IIW. Yf l ,
iYY y
.. 1
f , qtr Ylf/
e .ý
{
3 ,
1 r Inn--. -_, eý.. , ",
s.. L 1r 11+ / ýý
a. /Id -qas
I!
Figure 5.15: Nitrogen injection after modification
5.2.5 Particle Feeder (Screw Feeder)
In order to study the removal efficiency of the system, a particulate injection system
was added to the equipment. The possibility of using Malvern's Qspec Dry Powder
Feeder for the particles' injection was previously considered but was ruled out due to
the difficulties in obtaining uniform particle flow through the hot gas scrubber (HGS)
system. Considering all the technical problems associated with Malvern's Qspec Dry
Power Feeder, the decision was made to use a screw feeder (Figure 16(a) and 16(b)) for injecting the particles/powder in to the HGS system. The housing was
made from stainless steel, and the feeder was closed by transparent perspex. This
was to monitor and ensure that all the dust in the feeder completely flows to the
scrubber.
95

Figure 5.16(a): Screw feeder (top view) Dust Inlet
Go.
Figure 5.17: Venturi system
Tests were conducted to observe the performance of the screw feeder to generate
the minimum flowrate for the particulate injection. In order to make sure that the
particles would not block the piping system for the dust injection; a venturi system
was introduced as shown in Figure 5.17. The overall particulate injection system for
particle cleaning experimental work is shown in Figure 5.18 and 5.19 respectively.
Figure 5.20 shows the calibration chart of the screw feeder for different readings.
96
Figure 5.16(b): Screw feeder (side view)
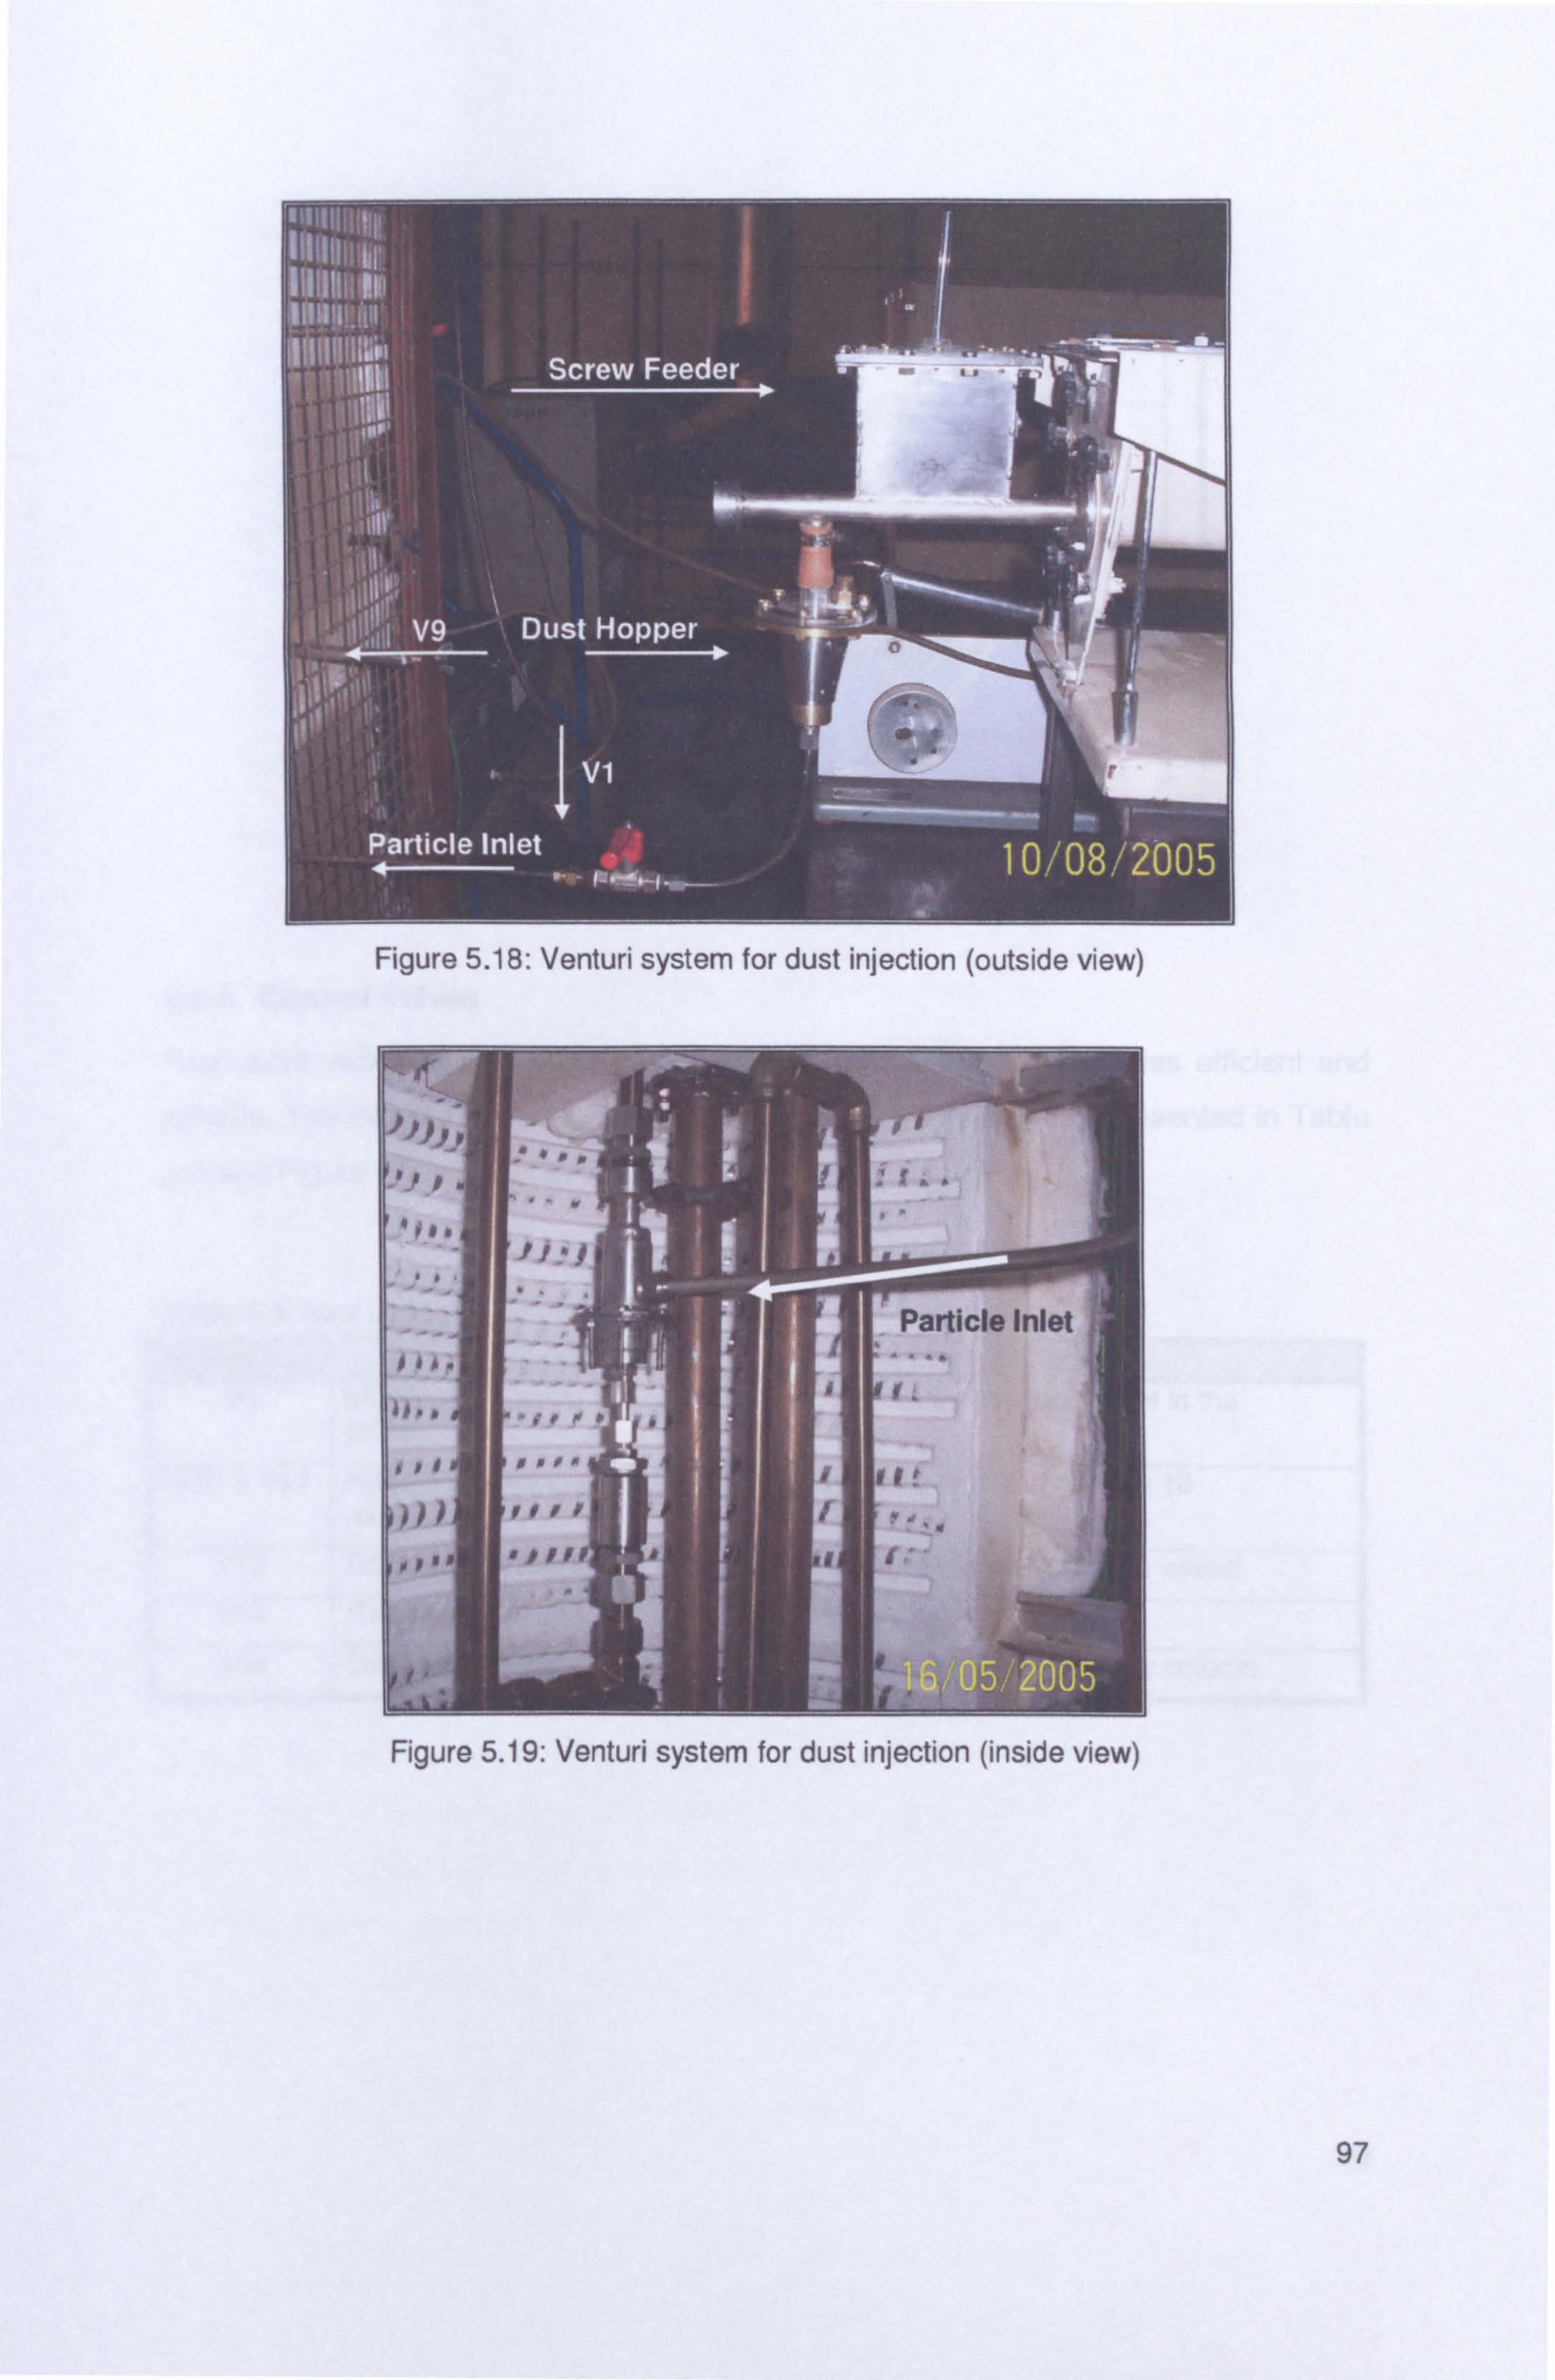
97
Figure 5.18: Venturi system for dust injection (outside view)
Figure 5.19: Venturi system for dust injection (inside view)

12
110
E 0 8
0 6
0
4 zE 0 d
2
0
y=3.0007x - 1.4693 R2 = 0.9959
012 Scale 345
Figure 5.20: Calibration chart of screw feeder
5.2.6 Control Valves
Four extra valves were added to the system to make sure that it was efficient and reliable. The information on location and function of each valve is presented in Table
5.3 and Figure 5.21 respectively.
Table 5.3: New control valves locations
Valve No. Location Function V9 Molten tin outlet to the gas lift
limbs To monitor the liquid level in the reservoir
V10 & V11 Have been renamed and formally known as valve 9 and Valve 10 respectively
V12 Gas outlet at the top of vessel 1 To purge all air at the top vessel V13 Gas outlet before entering in-line filter
V14 Gas outlet to gas extract To purge all air inside the column
98
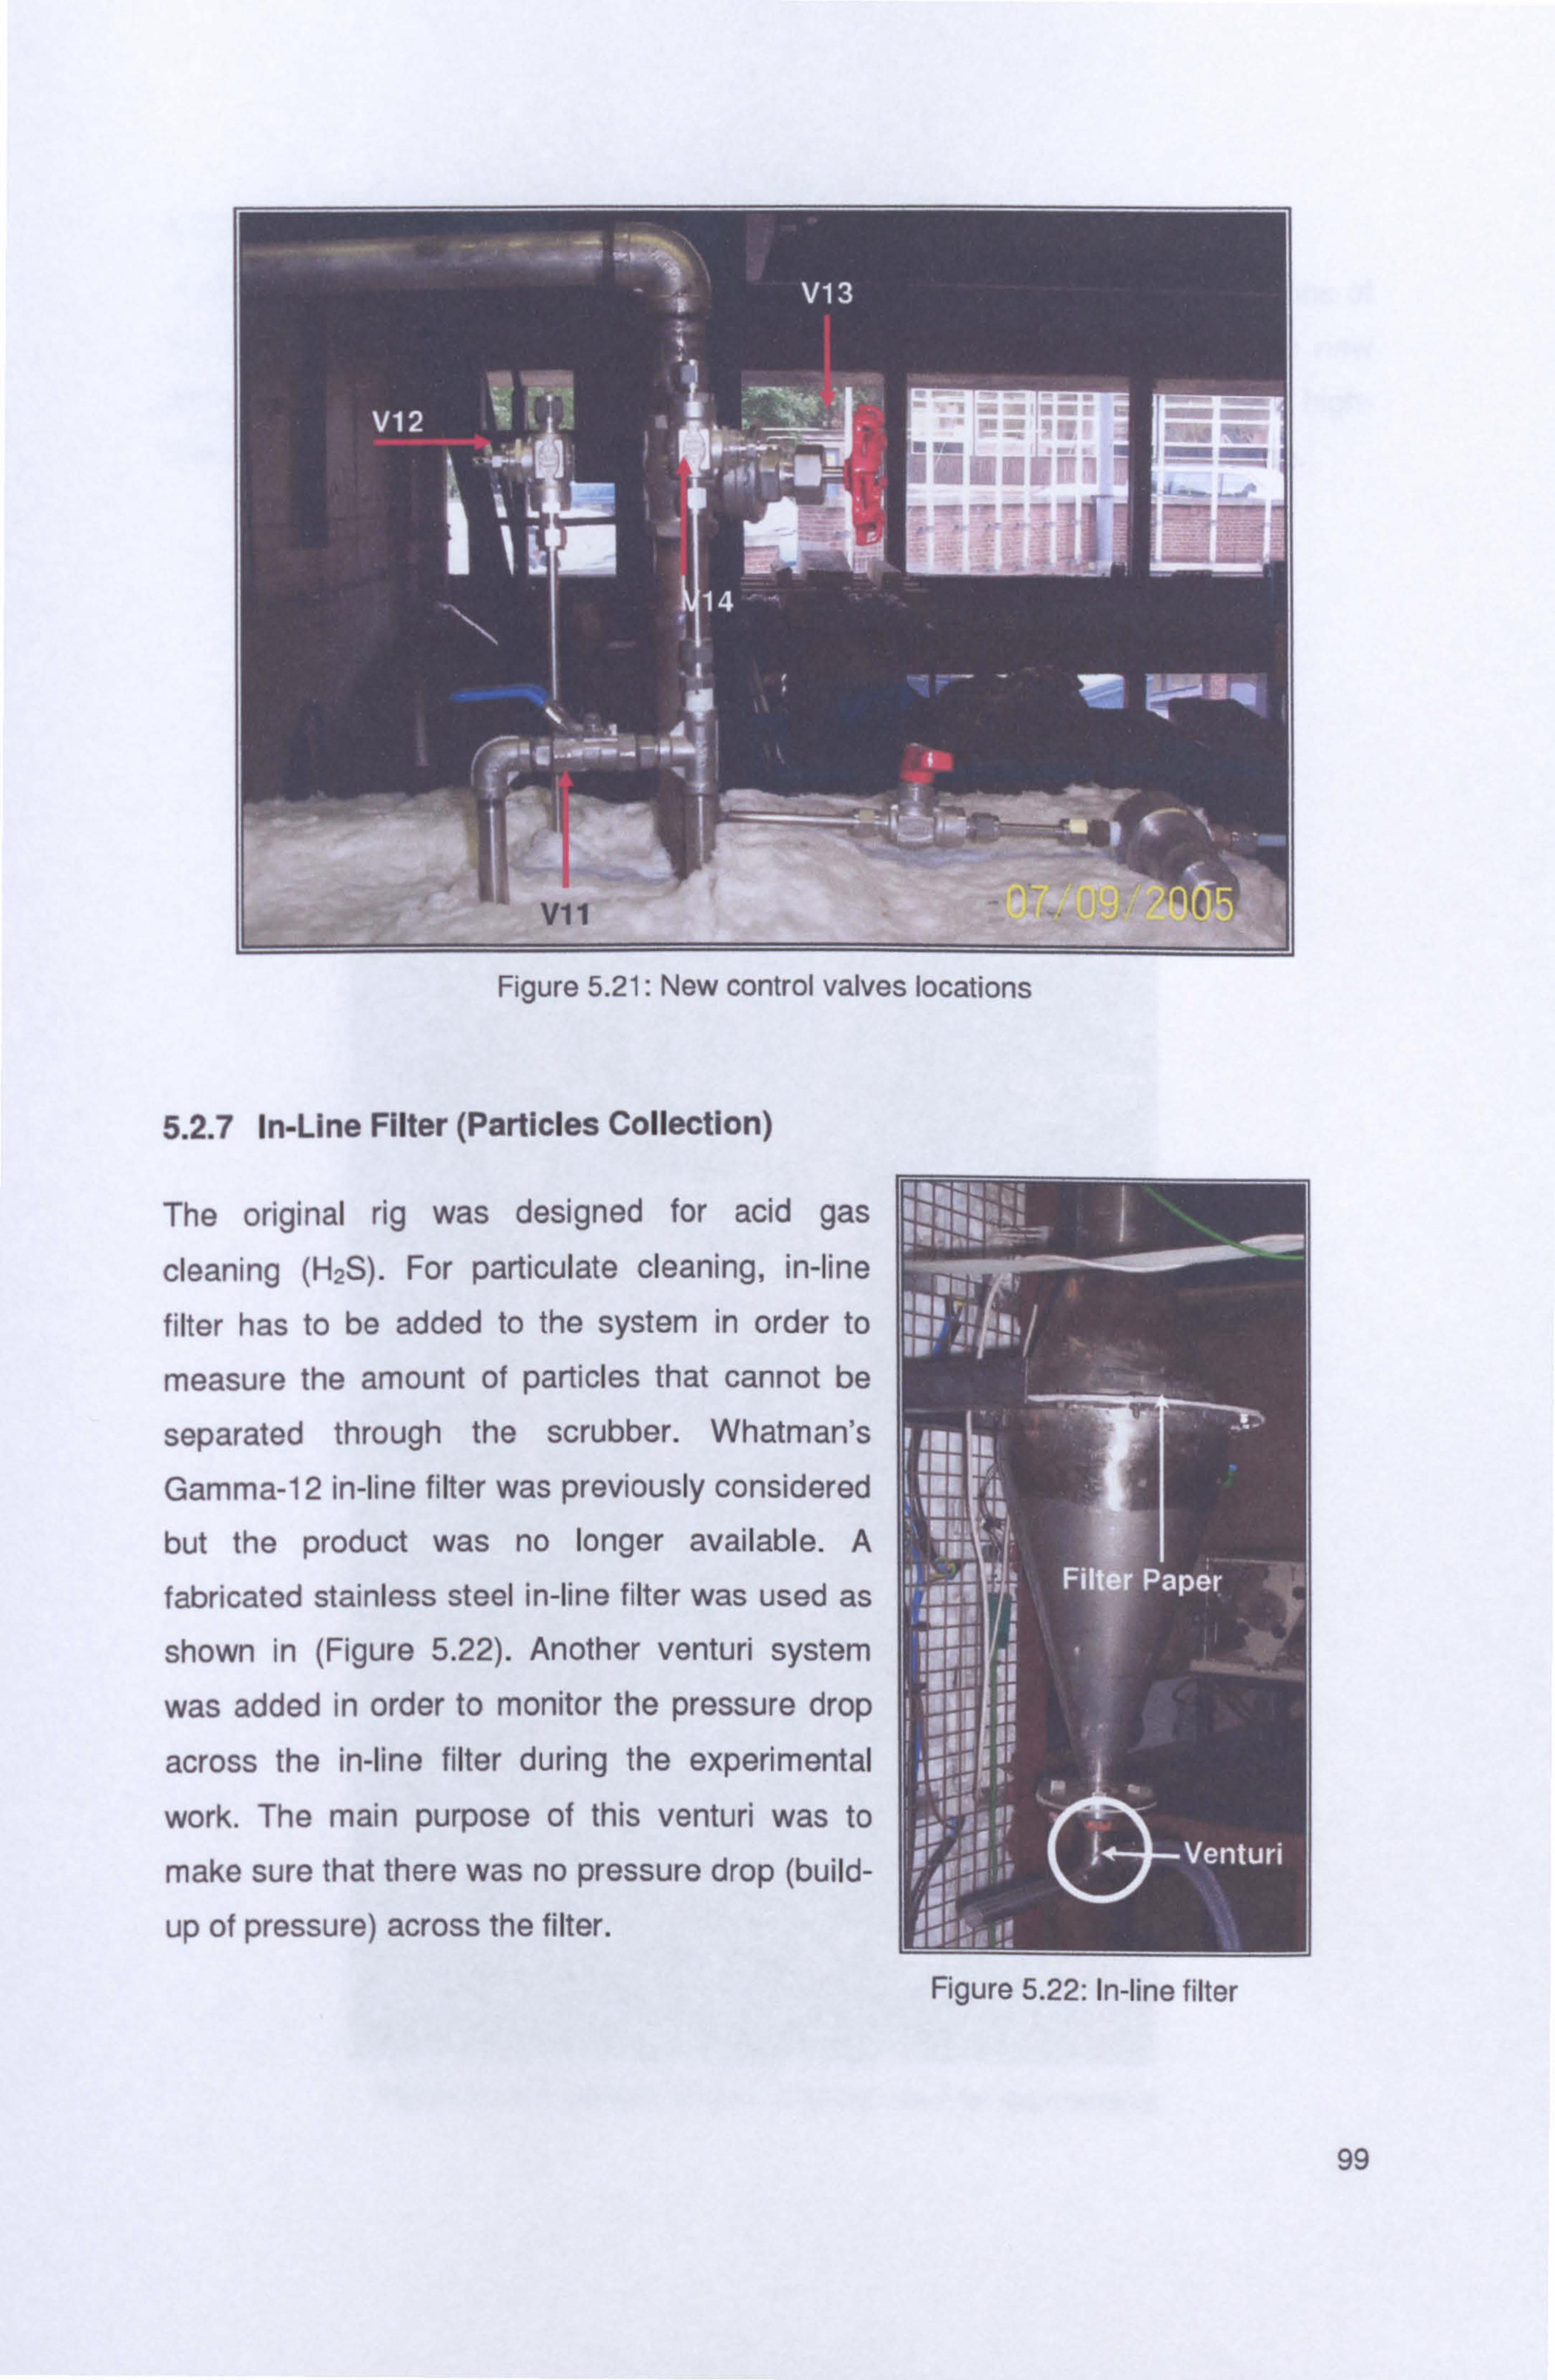
5.2.7 In-Line Filter (Particles Collection)
The original rig was designed for acid gas
cleaning (H2S). For particulate cleaning, in-line
filter has to be added to the system in order to
measure the amount of particles that cannot be
separated through the scrubber. Whatman's
Gamma-12 in-line filter was previously considered but the product was no longer available. A
fabricated stainless steel in-line filter was used as
shown in (Figure 5.22). Another venturi system
was added in order to monitor the pressure drop
across the in-line filter during the experimental
work. The main purpose of this venturi was to
make sure that there was no pressure drop (build-
up of pressure) across the filter.
99
Figure 5.21: New control valves locations
Figure 5.22: In-line filter

5.2.8 Final Modified Design
A photograph of the new scrubbing system is shown in Figures 5.23. Dimensions of
the column, gas lift, top and bottom vessels are shown in Figure 5.24. The new
schematic diagrams in Figure 5.25 and 5.26 respectively, illustrate the overall high-
temperature gas scrubbing system for particulate and acid gases (H2S) cleaning.
100
Figure 5.23: Modified hot gas scrubber used for experiments

Removable Lid
10 cm IH UTInLodlng m ID
Vessel
mm ID
111cm ID
4 cm IH
22 mm IC
23 cm 1H 8 cm ID Column
3.3 cmiH
Level Sensor: / 2,3 and 4 cm from reservoir base
Main Gas Injectör 11 mm ID
ID = Internal Diameter IH = Internal Height
--- -------------------------------- ----------
6 cm IH
Gas Riser on Liquid Distributor
Lift, L Pressure Tappings 46 cm
Column Reservoir /14cmID
8 cm IH ------------------------------------------
Approximated Tin Level
Additional Valve (Valve 9)
Downcomer and Riser of Gas Lift 22 mm ID
Removable Lid 11
14 cm ID l0cmIH
Tin Removal Vessel
Submergence, S 61 cm
Tip of Nitrogen Injector
ogen Injector 5 mm ID
Figure 5.24: Dimensions of the hot gas scrubber with an additional valve
101
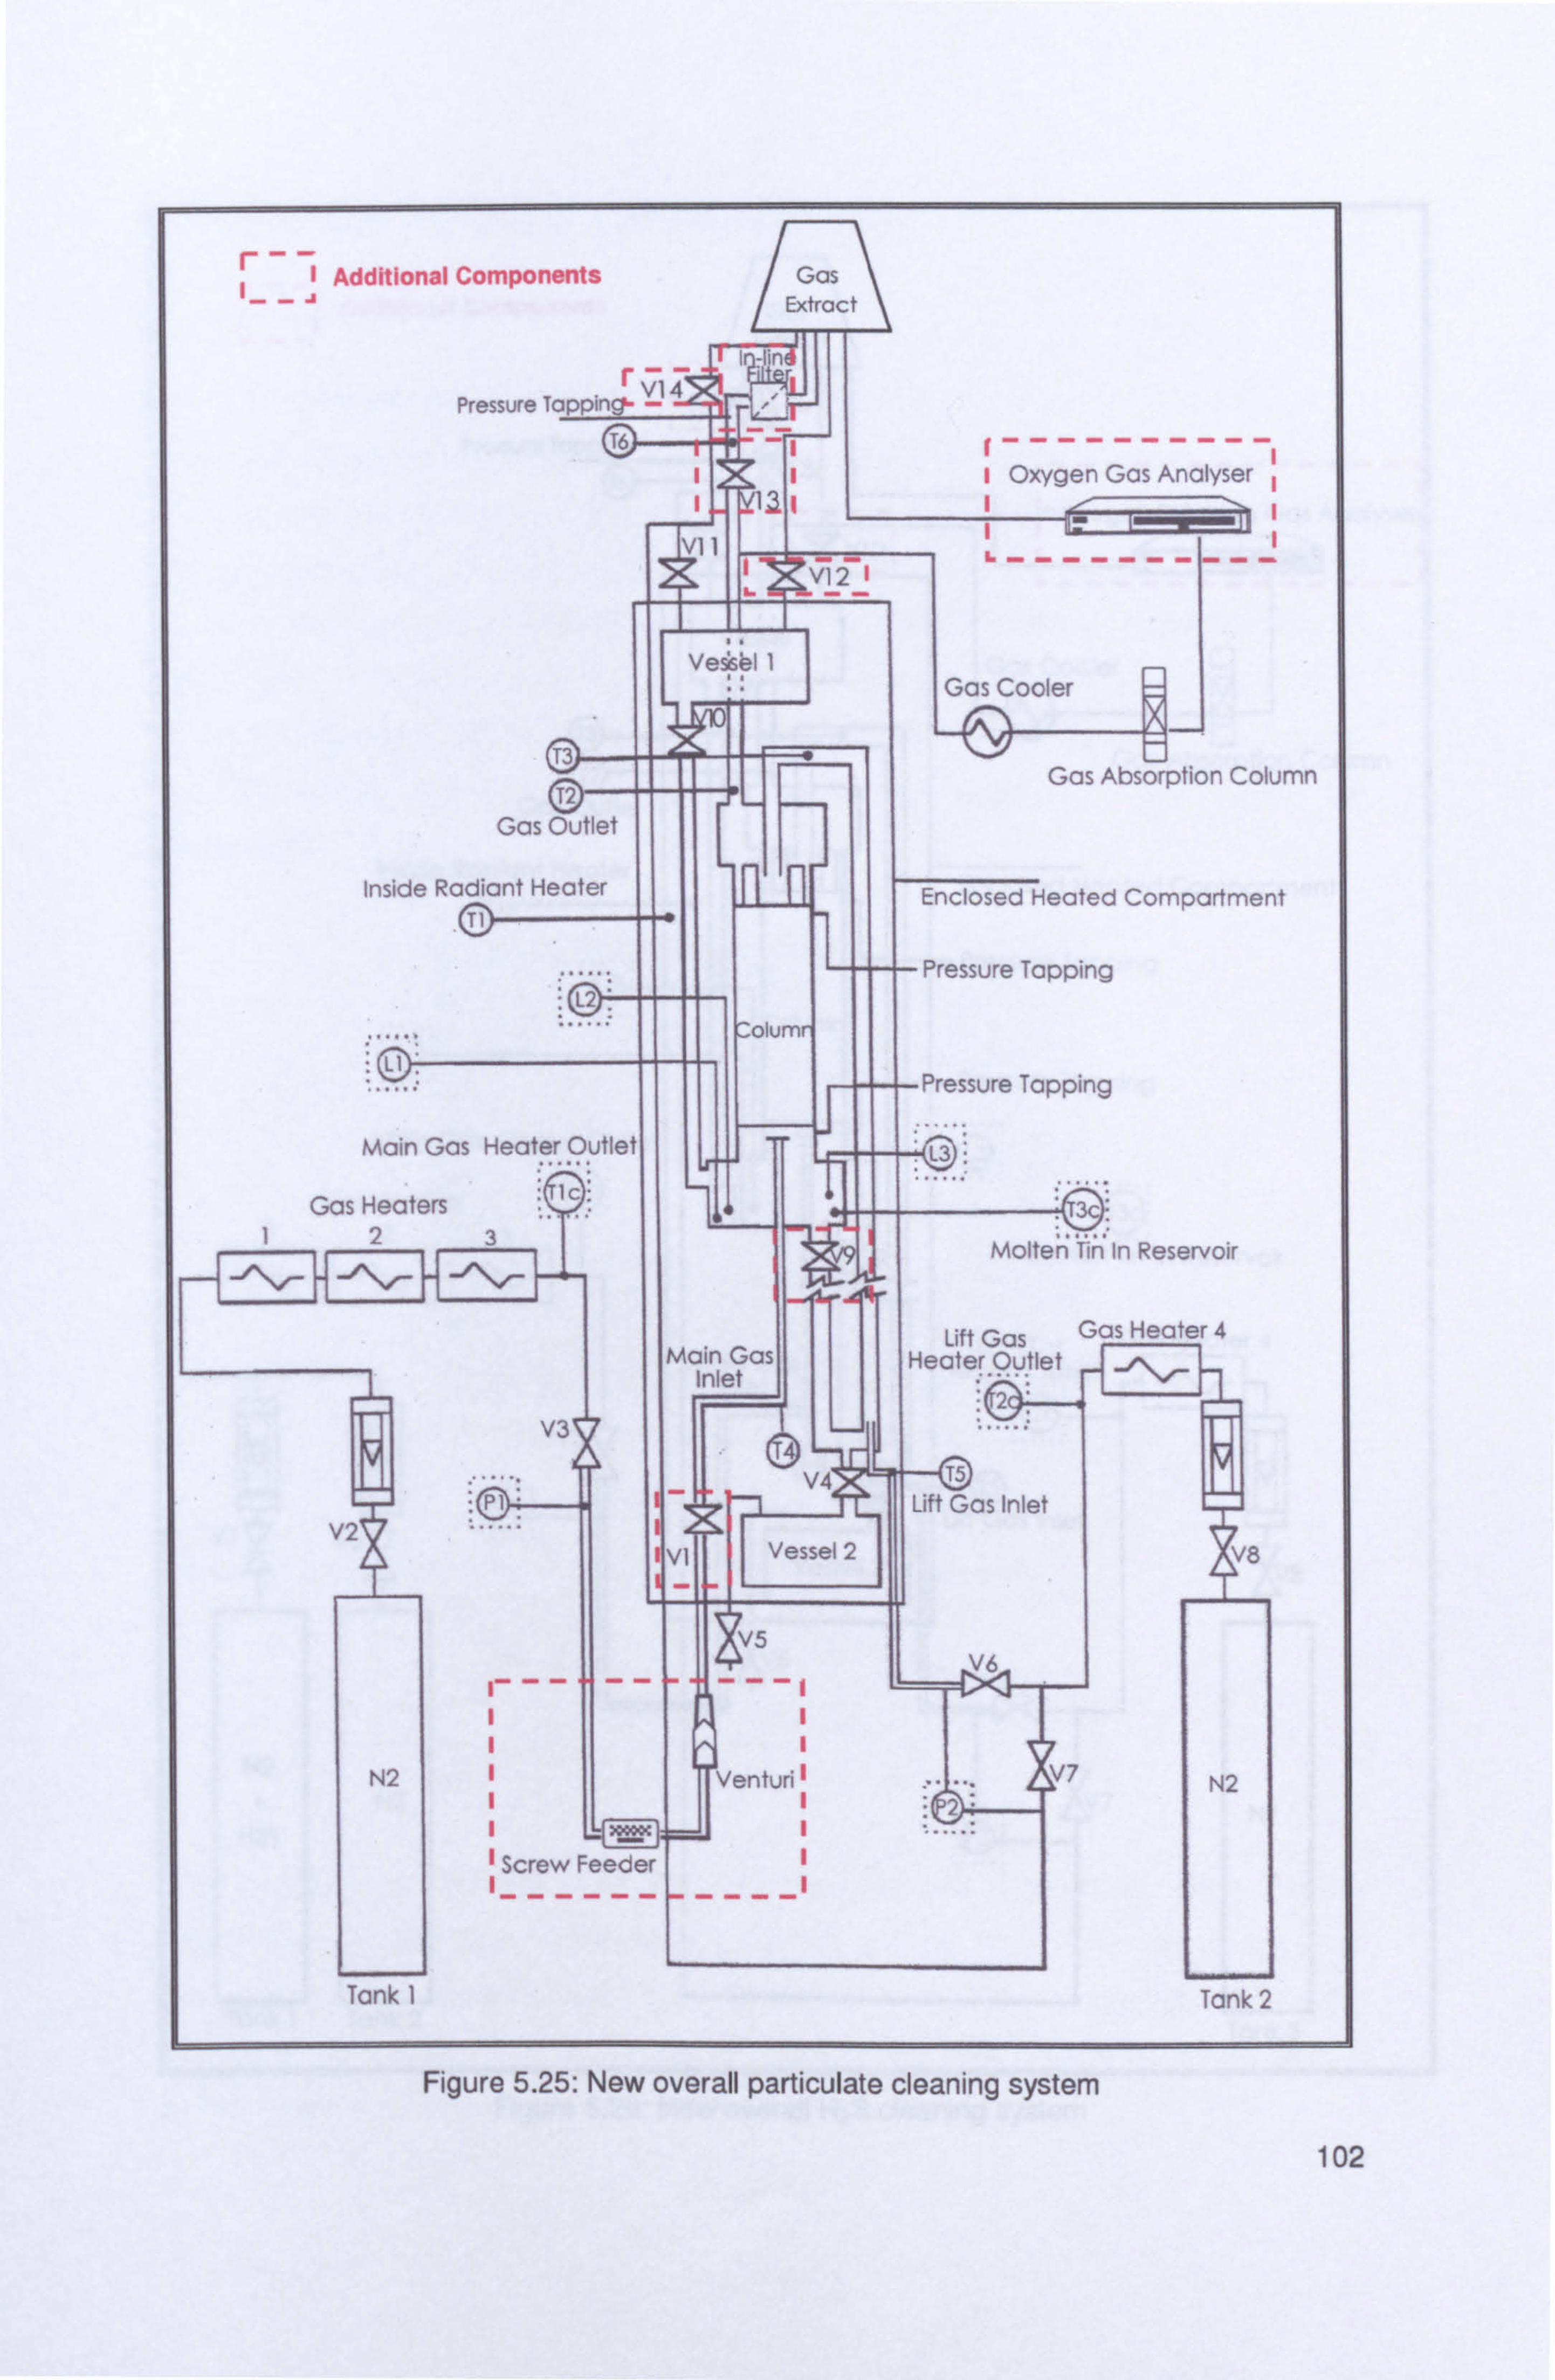
102
Figure 5.25: New overall particulate cleaning system
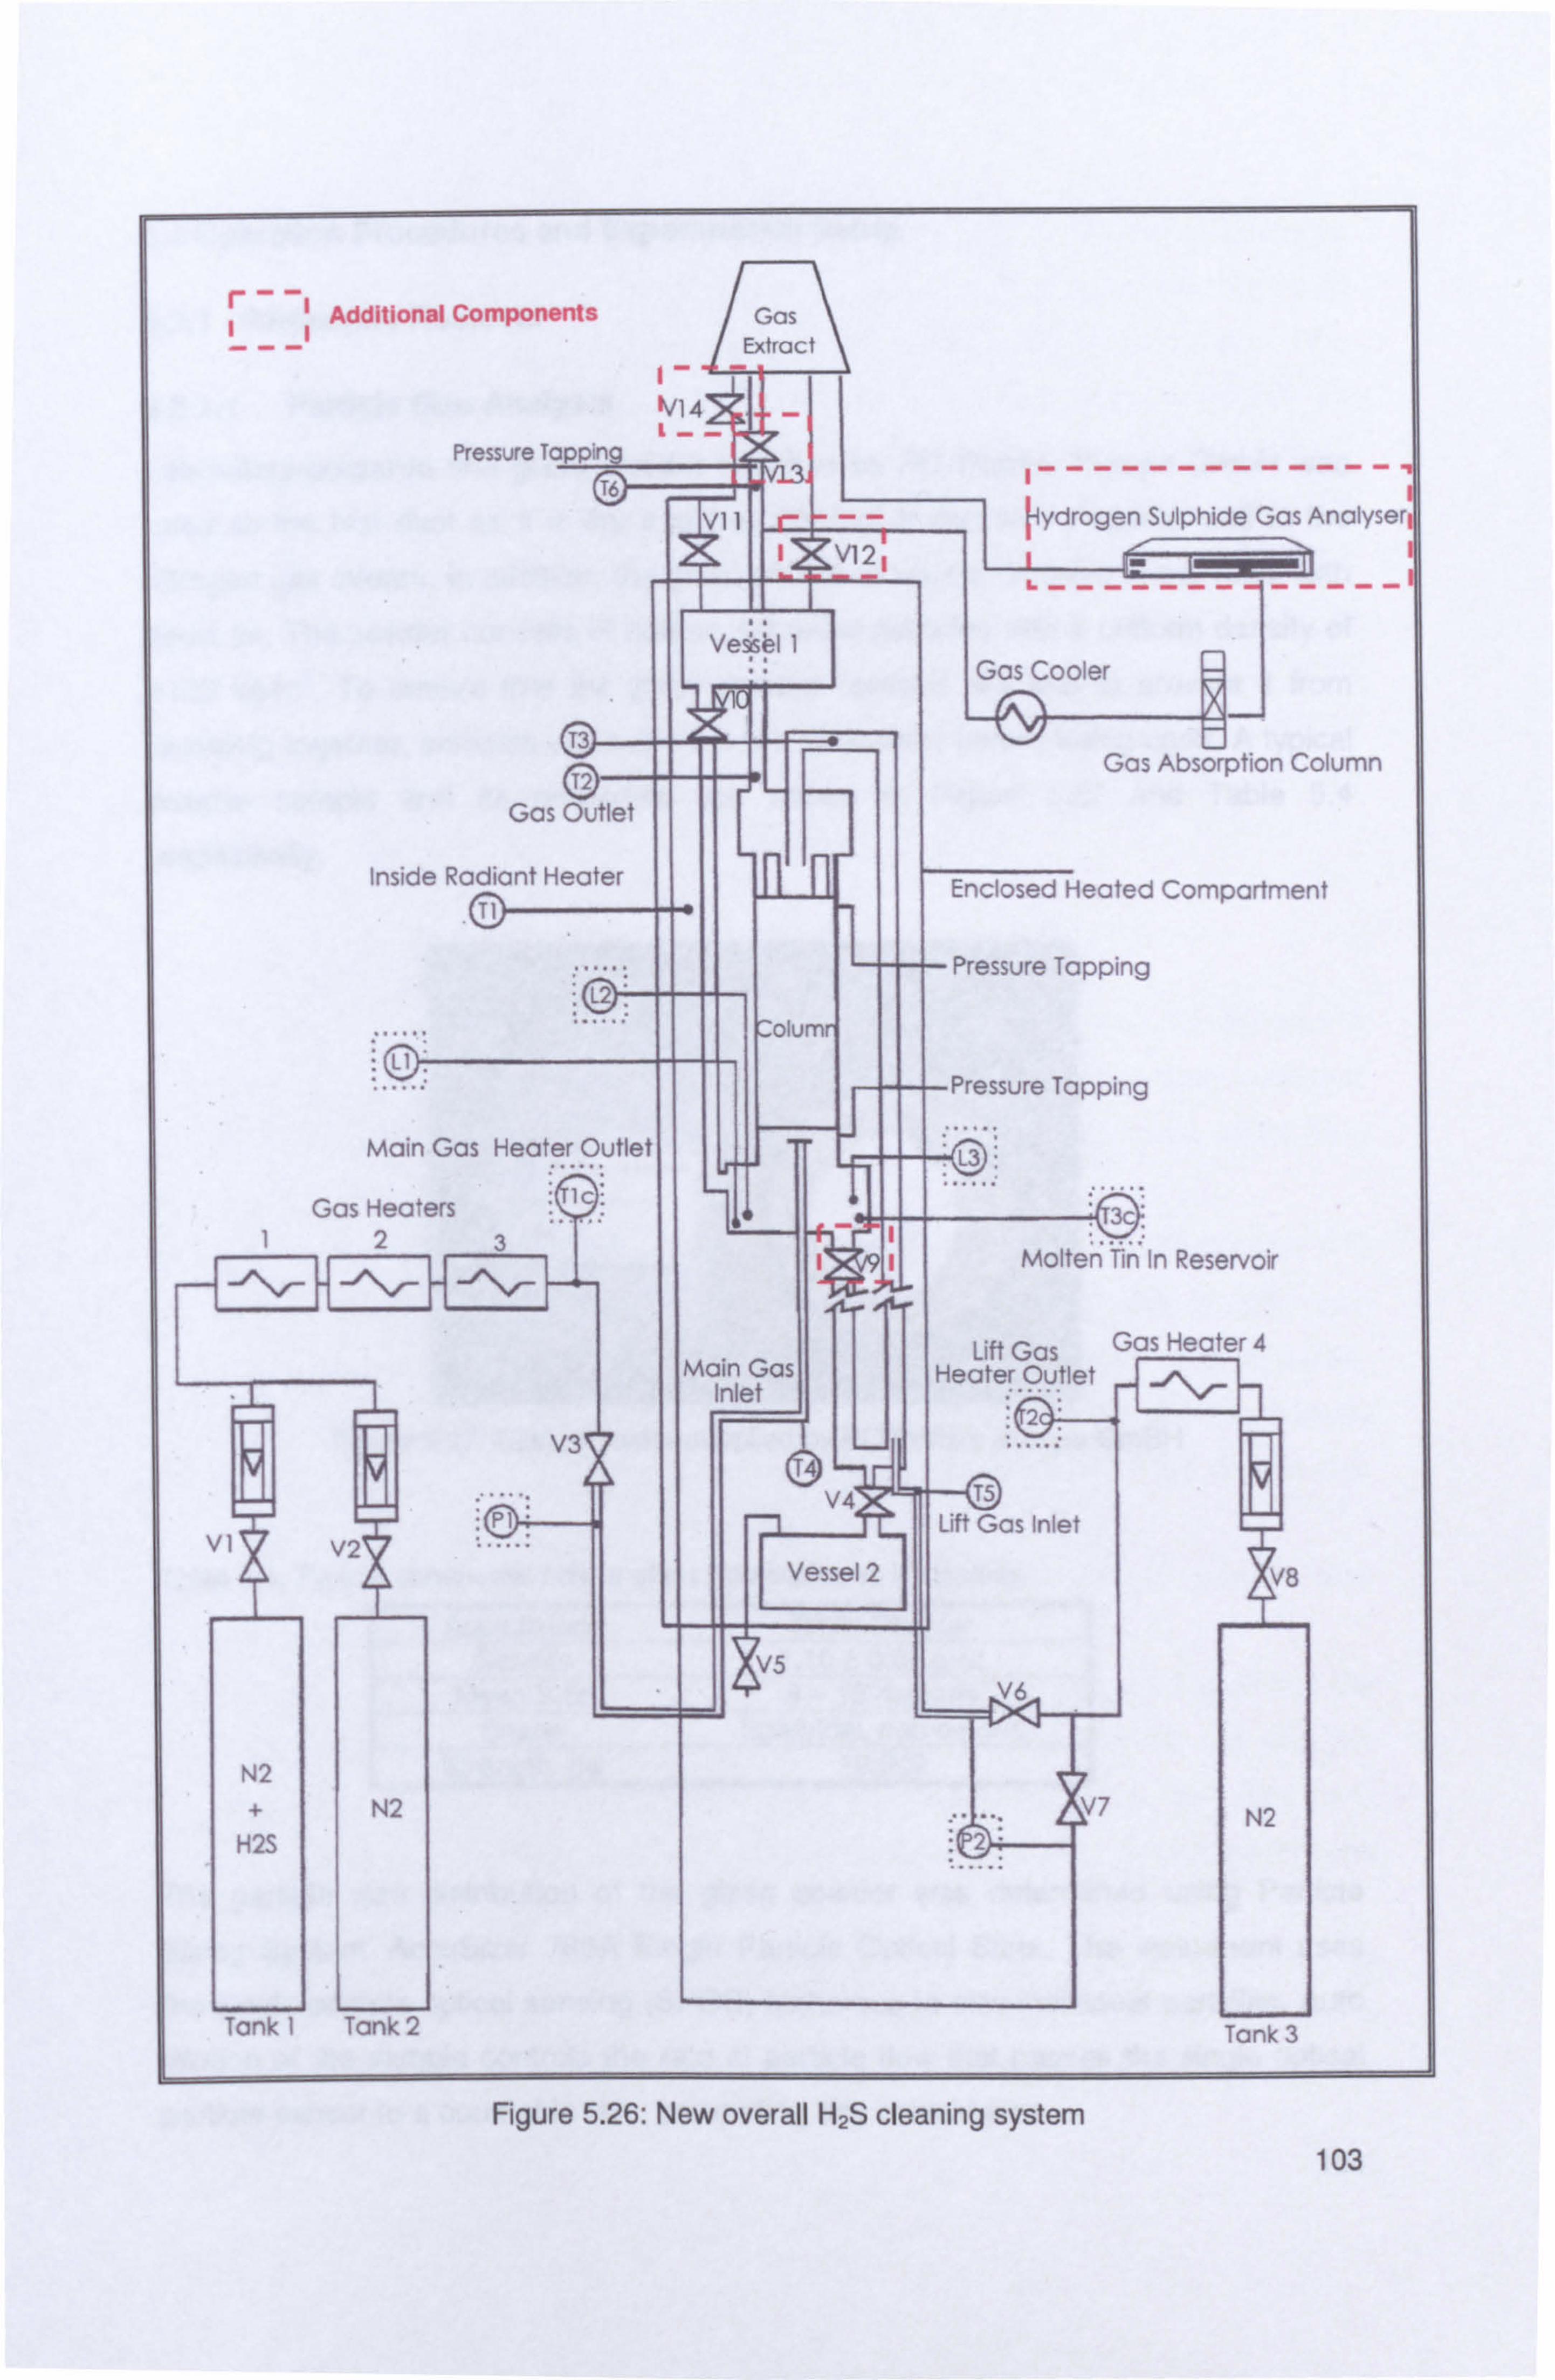
r Additional Components i Gas
--- Extract i- - Nl 4
Pressure Tapping
i
Vessel 1
Gas Outle
Inside Radiant Heater TI
L2
L1 ;
Main Gas Heater Outlet
Gas Heaters :ý
123
Main Gas Inlet
V3
V1 V9 '
N2
+ N2 H2S
I------------- L,, YdIogen Sulphide Gas Analyser
A21 -------- ------
Gas Cooler
Gas Absorption Column
Vessel 2
5
Tank 1 Tank 2 Tank 3
Figure 5.26: New overall H2S cleaning system
Enclosed Heated Compartment
Pressure Tapping
-Pressure Tapping
L3 ;
3c ..
Molten Tin In Reservoir
Lift Gas Gas Heater 4 Heater Outlet
_ýý 2
TS
Lift Gas Inlet
LY N2
103
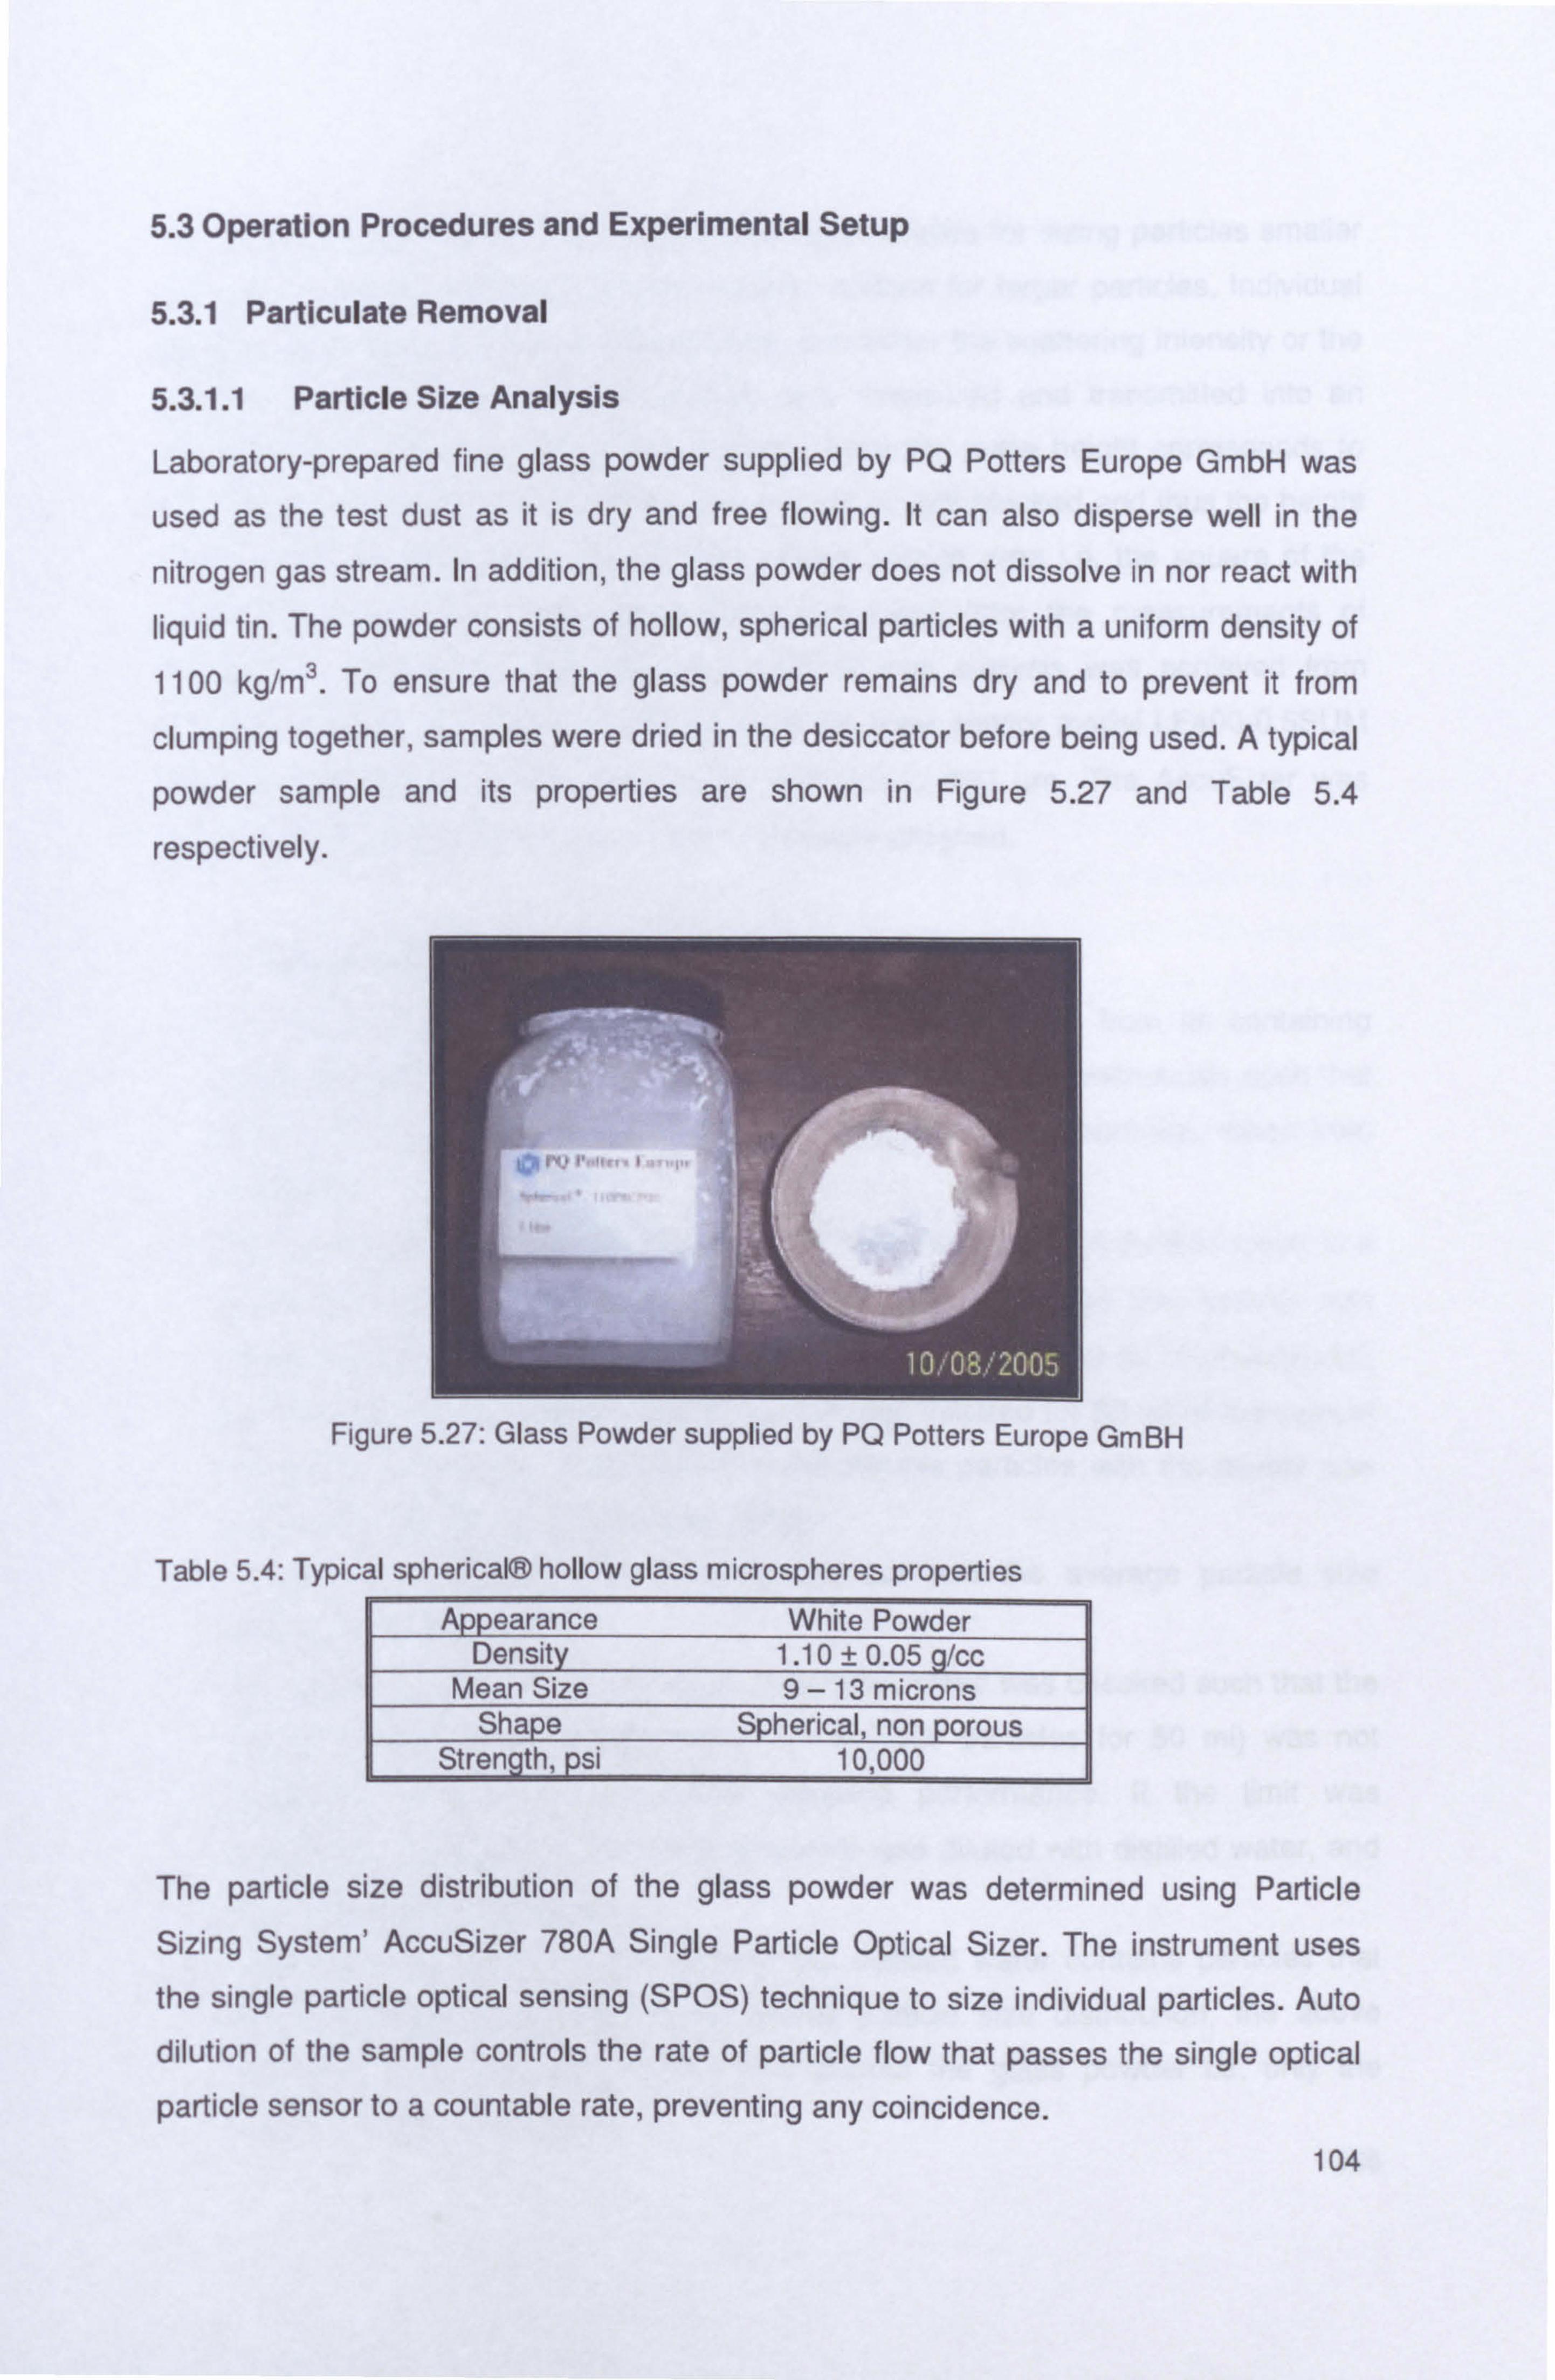
5.3 Operation Procedures and Experimental Setup
5.3.1 Particulate Removal
5.3.1.1 Particle Size Analysis
Laboratory-prepared fine glass powder supplied by PQ Potters Europe GmbH was
used as the test dust as it is dry and free flowing. It can also disperse well in the
nitrogen gas stream. In addition, the glass powder does not dissolve in nor react with liquid tin. The powder consists of hollow, spherical particles with a uniform density of 1100 kg/m3. To ensure that the glass powder remains dry and to prevent it from
clumping together, samples were dried in the desiccator before being used. A typical
powder sample and its properties are shown in Figure 5.27 and Table 5.4
respectively.
Figure 5.27: Glass Powder supplied by PQ Potters Europe GmBH
Table 5.4: Typical spherical@ hollow glass microspheres properties Appearance White Powder
Density 1.10 ± 0.05 /cc Mean Size 9- 13 microns
Shape Spherical, non porous Strength, psi 10,000
The particle size distribution of the glass powder was determined using Particle
Sizing System' AccuSizer 780A Single Particle Optical Sizer. The instrument uses the single particle optical sensing (SPOS) technique to size individual particles. Auto
dilution of the sample controls the rate of particle flow that passes the single optical
particle sensor to a countable rate, preventing any coincidence. 104
The optical particle sensor uses light scattering principles for sizing particles smaller
that several microns and the light obscuration method for larger particles. Individual
particles were passed through a laser beam and either the scattering intensity or the
amount of light blocked by each particle was measured and transmitted into an
electrical pulse. For the former, the scattered intensity pulse height corresponds to
the particles' diameter. For the latter, the amount of light blocked and thus the height
of the pulse corresponds to the particles' cross section area i. e. the square of the
particle diameter. Size distributions were generated from the measurements of
thousands of particles. High-resolution particle size analysis was achieved from
individual particle sizing. The AccuSizer uses the laser sensor model LE400-0.5SUM
having a detectable particle size range from 0.5 to 490 µm. The AccuSizer was
controlled via the windows-based CW770 software program.
* Experimental Procedures
� To ensure a representative sampling of the glass powder from its containing bottle, the bottle was gently rolled, changing its orientation continuously such that
large and fine particles were mixed thoroughly. A small amount was taken from
the bottle.
� The sample of glass powder was mixed with and dispersed in distilled water in a
small container. Using a pipette (10 - 100 il), 100 p1 of this sample was
transferred into the AccuSizer dilution chamber containing 60 ml of ultra-filtered, distilled water as the diluent. Sampling was then initiated for 50 ml of the sample
suspension at a rate 1 ml/s. Mixing of the sample particles with the diluent was
effected by means of a mechanical agitator.
�A total of 3 sampling runs were carried out and the average particle size distribution obtained.
� For each sampling, the total number of particles sized was checked such that the
maximum limit of 9000 particles/ml (i. e. 450,000 particles for 50 ml) was not
exceeded for optimum AccuSizer sampling performance. If the limit was
exceeded, the sample in the small container was diluted with distilled water, and
the sampling was repeated.
� Background check: To check whether the distilled water contains particles that
can contribute significantly to the overall particle size distribution, the above
procedure was repeated but this time without the glass powder i. e. only the
distilled water was sampled. 105

5.3.1.2 Determination of Total Efficiency
* Experimental Setup
The schematic diagram in Figure 5.25 illustrates the overall hot gas scrubbing system for particulate cleaning. The glass powder was fed into the nitrogen gas supply line
using a screw feeder as discussed in section 5.2.5. Isokinetic sampling of the outlet
nitrogen stream was carried out using a fabricated in-line filter as illustrated in Figure
5.22 in section 5.2.7. This filter paper was selected for use due to several compelling
reasons: it is a resin-bound glass microfibre paper filter that gives exceptionally high
particle retention and high loading capacity. Also the disposable filter papers are
easily changed in seconds. Filter paper grade GF-A with 1.0 µm particle retention
capability was selected for use. The outlet air stream was filtered to determine
gravimetrically the mass of test dust unseparated by the packed bed scrubber. The
mass of separated dust when divided by the total mass of test dust fed into the
column over the period of the experiment gave the total efficiency of particulate removal.
* Operating Parameters
The key test parameters in this study were gas and tin flowrates. The ranges of test
conditions are summarised in Table 5.5. The gas flow rates ranged from 0.245 to 0.581 kg/m2s (gas superficial velocity: 0.490 to 1.161 m/s) with a liquid (tin) flow rate of 2.148,3.165 or 3.860 kg/m2s (liquid superficial velocity: 3.07x10⁻⁴ , 4.53x10"4 or 5.52x10-` m/s). The operating temperatures were set at 350°C and 400°C.
106
Figure 5.28: Sample in screw feeder
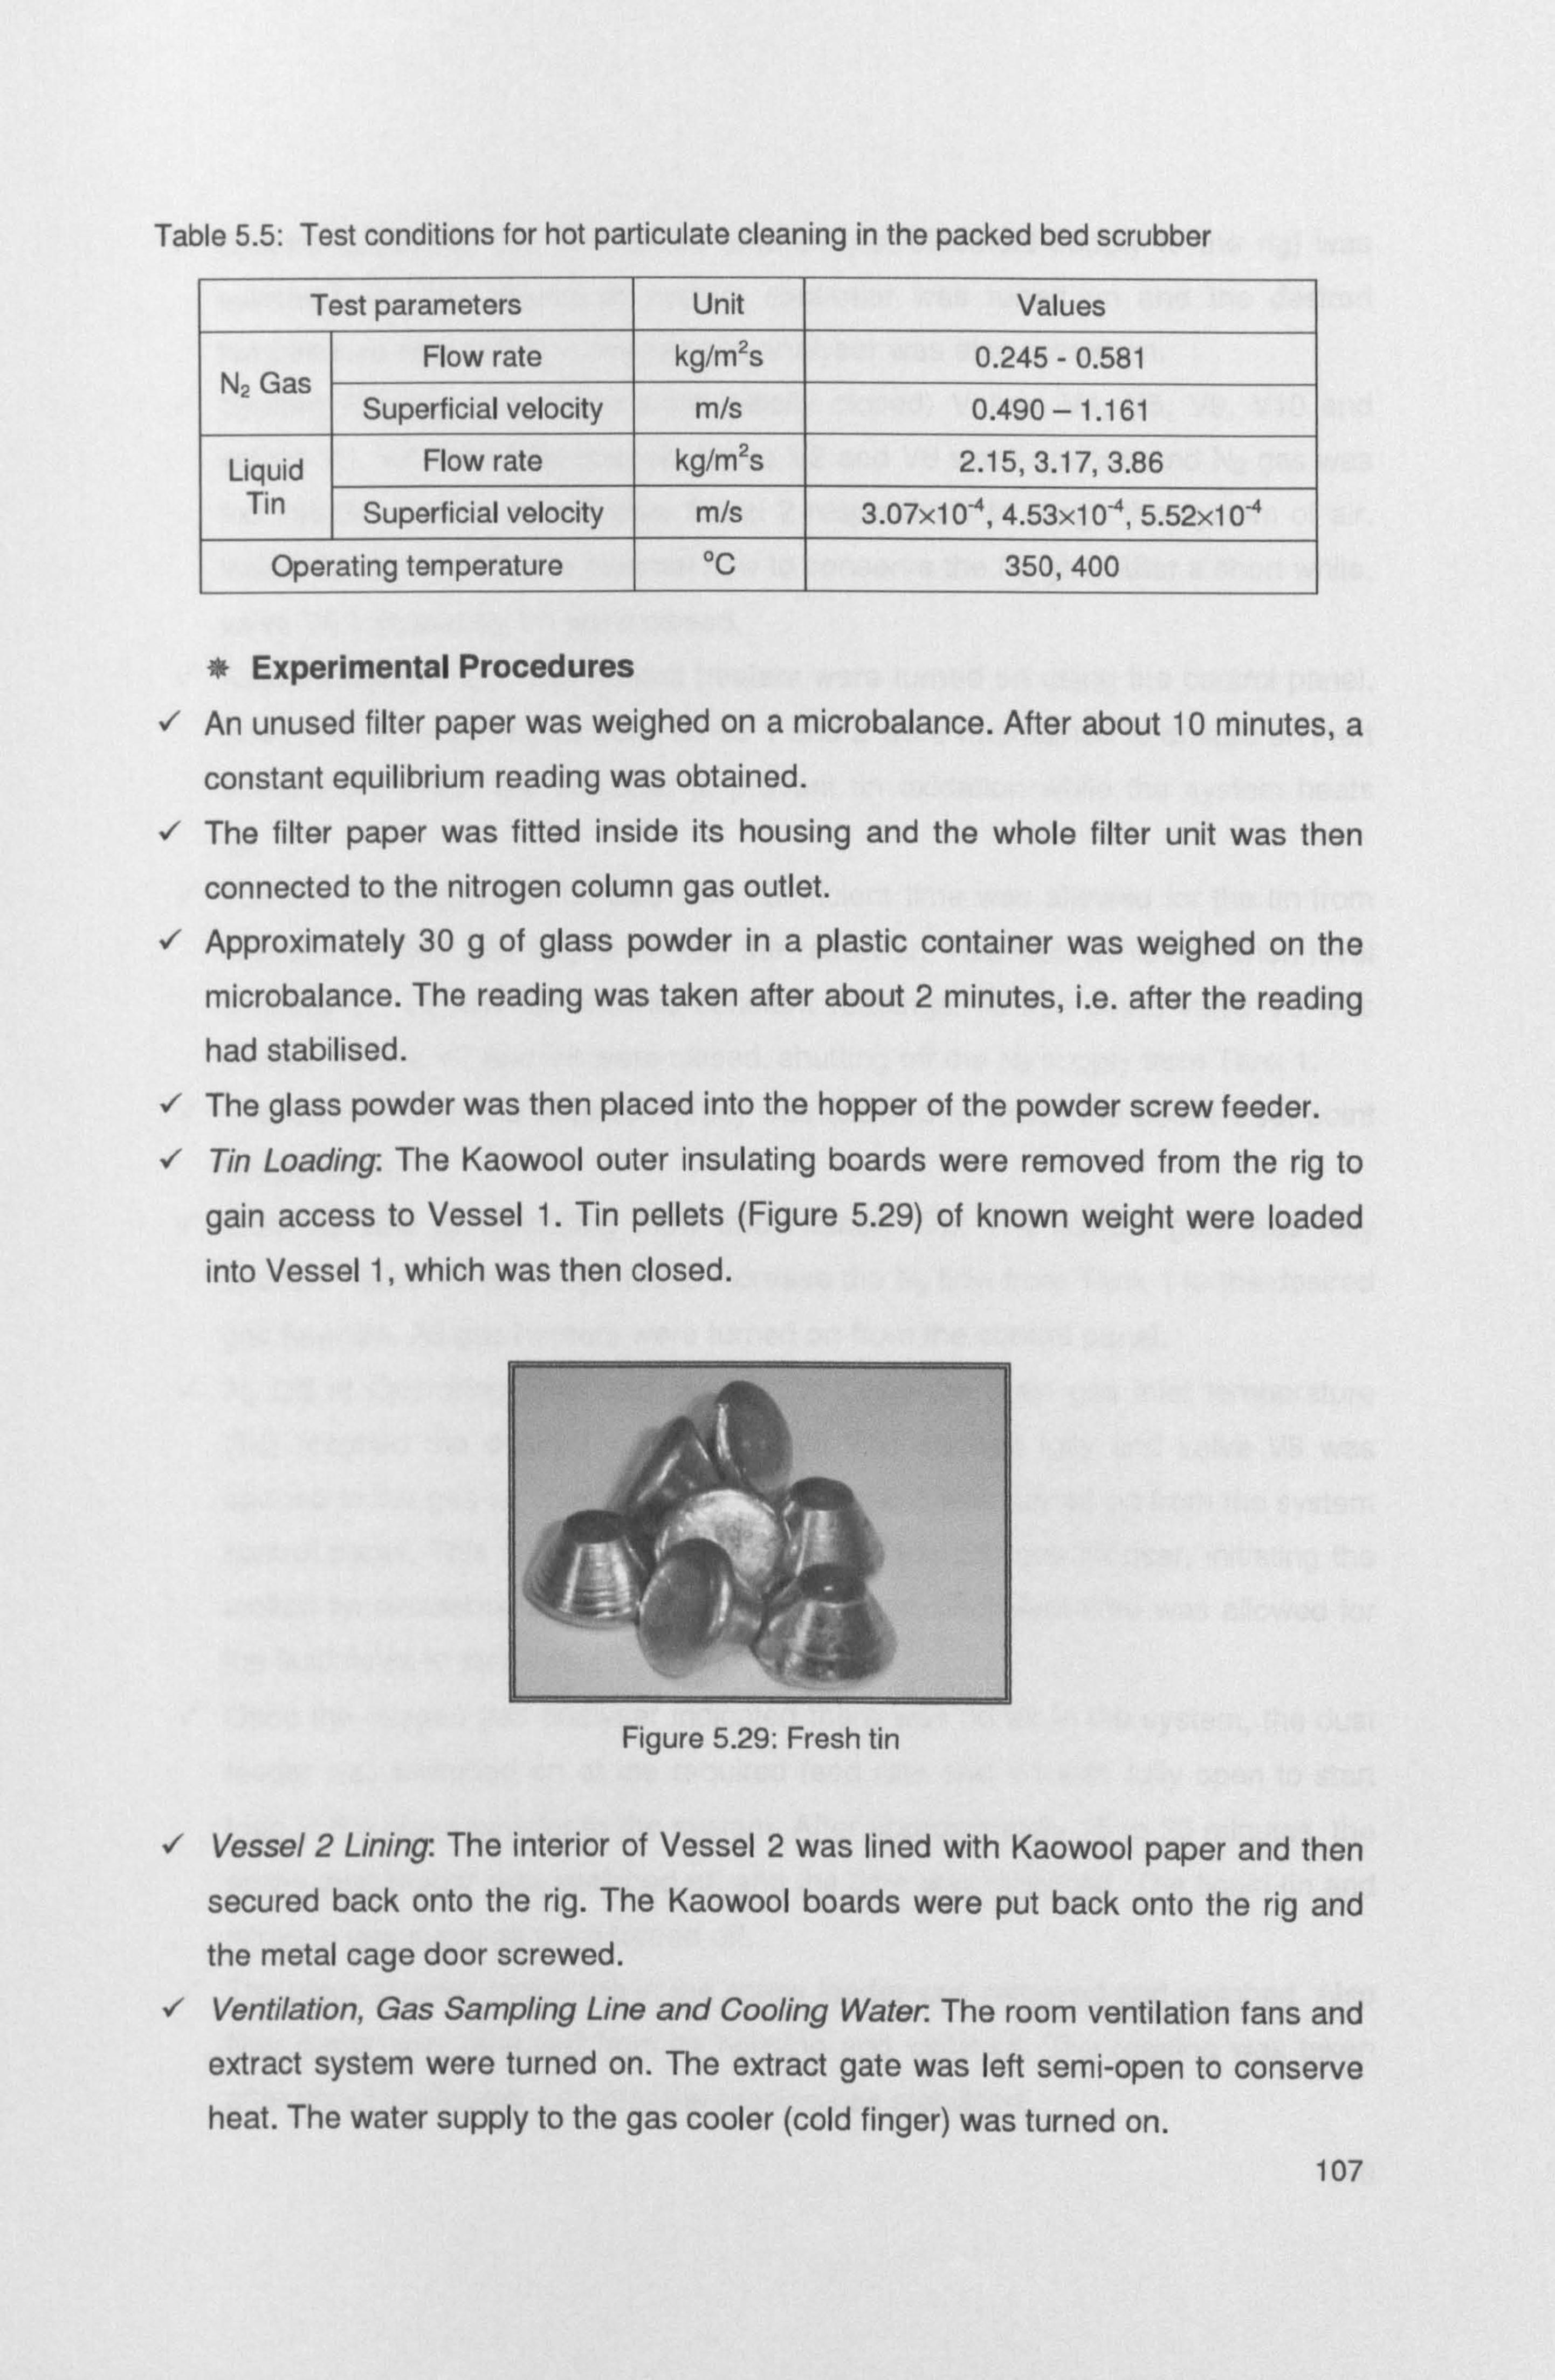
Table 5.5: Test conditions for hot particulate cleaning in the packed bed scrubber
Test parameters Unit Values
G N Flow rate kg/m2s 0.245 - 0.581
as 2 Superficial velocity m/s 0.490 - 1.161
Liquid Flow rate kg/m2s 2.15,3.17,3.86 Tin Superficial velocity m/s 3.07x10-4,4.53x10-`, 5.52x10⁻⁴
Operating temperature °C 350,400
* Experimental Procedures
� An unused filter paper was weighed on a microbalance. After about 10 minutes, a
constant equilibrium reading was obtained. � The filter paper was fitted inside its housing and the whole filter unit was then
connected to the nitrogen column gas outlet. � Approximately 30 g of glass powder in a plastic container was weighed on the
microbalance. The reading was taken after about 2 minutes, i. e. after the reading had stabilised.
� The glass powder was then placed into the hopper of the powder screw feeder.
� Tin Loading: The Kaowool outer insulating boards were removed from the rig to
gain access to Vessel 1. Tin pellets (Figure 5.29) of known weight were loaded
into Vessel 1, which was then closed.
Figure 5.29: Fresh tin
� Vessel 2 Lining: The interior of Vessel 2 was lined with Kaowool paper and then
secured back onto the rig. The Kaowool boards were put back onto the rig and the metal cage door screwed.
� Ventilation, Gas Sampling Line and Cooling Water. The room ventilation fans and extract system were turned on. The extract gate was left semi-open to conserve heat. The water supply to the gas cooler (cold finger) was turned on.
107
� System Controller On: The circuit breaker (i. e. electrical supply to the rig) was
switched on. The electronic system controller was tuned on and the desired
temperature was set. The oxygen gas analyser was also turned on.
� System Purging: (All valves were initially closed) Valves V4, V5, V9, V10 and
valves V3, V7 were fully opened. Valve V2 and V8 were opened and N2 gas was
fed into the system from Tanks 1 and 2 respectively to purge the system of air.
Valve V2 was adjusted to minimal flow to conserve the N2 gas. After a short while,
valve V5 followed by V4 were closed.
� Radiant Heaters On: The radiant heaters were turned on using the control panel.
The minimal N2 gas flows from Tanks 1 and 2 were maintained to ensure an inert
atmosphere within the scrubber to prevent tin oxidation while the system heats
up.
� Full Tin Drainage and Full Gas Flow. Sufficient time was allowed for the tin from
vessel 1 to melt and fully drain into the reservoir. This was achieved when level
sensors L1, L2 and L3 showed constant readings. At this point, valve V9 was
closed. Valves V7 and V8 were closed, shutting off the N2 supply from Tank 1.
� The molten tin in the reservoir (T3c) was allowed to reach the desired set point temperature.
� Main N2 Gas at Operating Flow and Heaters On: The extract gate was fully
opened. Valve V2 was adjusted to increase the N2 flow from Tank 1 to the desired
gas flowrate. All gas heaters were turned on from the control panel. � N2 Lift at Operating Flow and Heater On: Once the main gas inlet temperature
(T4) reached the desired value, valve V6 was opened fully and valve V8 was
opened to the gas lift operating flow. Gas heater 4 was turned on from the system
control panel. This allows N2 gas from Tank 2 into the gas lift riser, initiating the
molten tin circulation through the packed column. Sufficient time was allowed for
the fluid flows to stabilise.
� Once the oxygen gas analyser indicated there was no air in the system, the dust
feeder was switched on at the required feed rate and V1 was fully open to start feed in the glass powder to the system. After approximately 15 to 20 minutes, the
screw dust feeder was switched off and the time was recorded. The liquid tin and
nitrogen gas supplies were turned off. � The glass powder remaining in the screw feeder was removed and weighed. Also
filter paper was removed from its housing and weighed. The reading was taken
after about 2 minutes, i. e. after the reading has stabilised.
108

5.3.1.3 Determination of Grade Efficiency
The test dust exiting the packed bed scrubber was collected in an impinger (Figure
5.30) with water as the collecting medium. The particle size distribution of the
resulting dust suspension was then determined. This data when used together with the total efficiency determined earlier at the same fluid flowrate and dust loading, and
the inlet dust particle size distribution gave the grade efficiency.
* Experimental Setup
The experimental setup was essentially the same as that used to determine the total
efficiency with the exception of the dust impinger and a valve in place of the in-line
filter. The dust-laden nitrogen gas that exited the scrubber entered the impinger via
an inlet pipe submerged in about 500 ml of distilled water at a level of about 10 cm. Solid particles entrained in the nitrogen gas stream were removed by direct
impingement into water. The clean nitrogen gas then exited the impinger via an outlet
pipe. In general as column pressure drop increases, the efficiency of dust separation increases. It was therefore essential that the column pressure drop (whilst using the
impinger) was the same as that when the in-line filter was used at the same
operating fluid flowrates. This ensured that the dust collected in the impinger would be representative of the dust collected on the filter at the same operating fluid
flowrates.
Dutt-laden air ira ean from scrubber
l cm ID stainless gecl tubes
qcm cm ID
column
lO cm aaoer leý'cl +
Figure 5.30: Dust impinger
109
Experimental Procedures
Q Dust Collection into The Impinger
In this experimental work, the dust exiting the scrubber was collected for only one
value of operating fluid and liquid tin flowrates. The pressure drop of the column
under steady-state operation at these fluid flowrates was first measured with the in-
line filter at the nitrogen gas exit line (Figure 5.31).
� Approximately 30 g of glass powder in a plastic container was weighed on the
microbalance. The reading was taken after about 2 minutes, i. e. after the reading
had stabilised. The contents of the plastic container containing the glass powder
were then placed into the hopper of the screw feeder.
� The impinger containing about 500 ml of distilled water was put in place as shown
in Figure 5.30. The nitrogen gas supply was turned on at the desired flowrate
followed by the liquid tin supply. About 4 to 6 minutes were allowed for steady-
state condition to be achieved. The column pressure drop was then measured
with a manometer. The valve downstream of the impinger was adjusted until the
same column pressure drop was obtained as when the in-line filter was used at
the same fluid flowrates. Once this was achieved, the pressure tapping was
blocked off. � The screw feeder was switched on at the required feed rate. The start time was
recorded.
After approximately 15 to 20 minutes, the dust feeder was switched off. The liquid
tin and nitrogen gas supplies were turned off. � The screw feeder containing the remaining glass powder was removed from the
hopper and weighed. The reading was taken after about 2 minutes, i. e. after the
reading had stabilised. � The impinger containing the dust suspension was removed for particle size
distribution analysis.
110
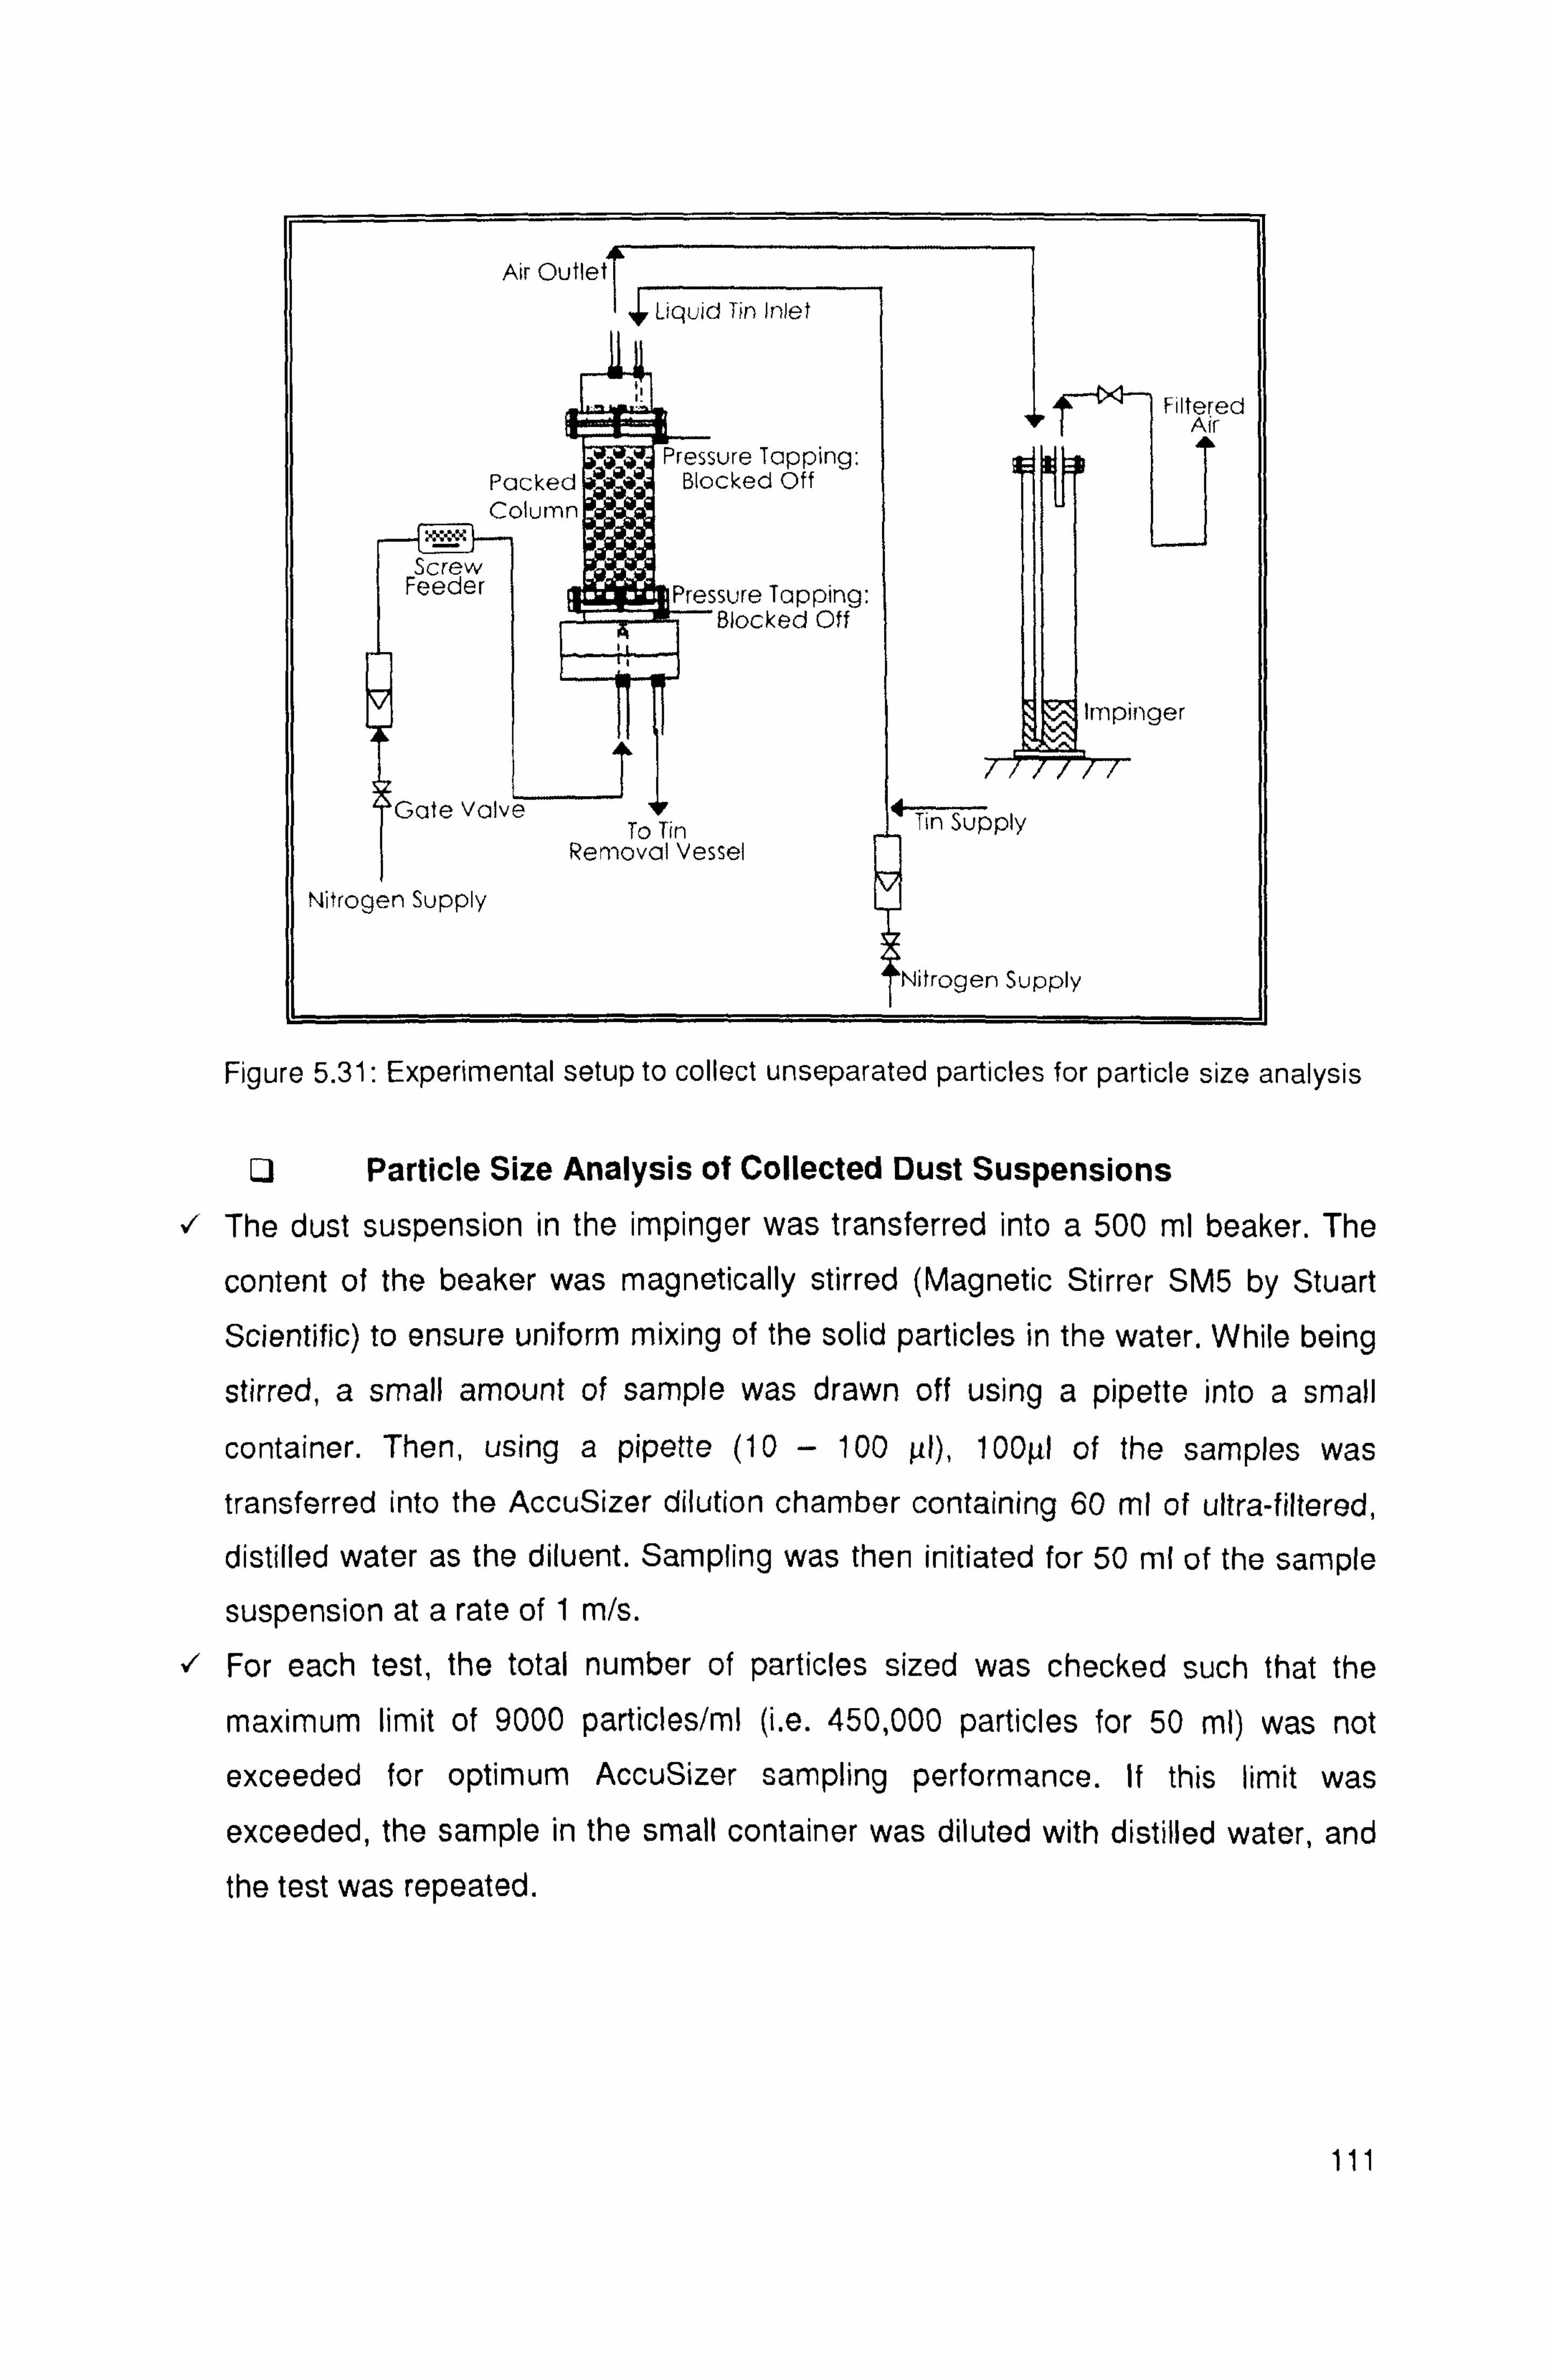
Air Outlet Liquid Tin Inlet
Filtered Air
Pressure Tapping: Packed °aaýq Blocked Off Column
x, tL+t Screw eeder Pressure Tapping:
Blocked Off
Impinger
Tý 7777-
ate valve To Tin Tin Supply
Removal Vessel
Nitrogen Supply
trogen Supply
Figure 5.31: Experimental setup to collect unseparated particles for particle size analysis
Q Particle Size Analysis of Collected Dust Suspensions
� The dust suspension in the impinger was transferred into a 500 ml beaker. The
content of the beaker was magnetically stirred (Magnetic Stirrer SM5 by Stuart
Scientific) to ensure uniform mixing of the solid particles in the water. While being
stirred, a small amount of sample was drawn off using a pipette into a small
container. Then, using a pipette (10 - 100 µI), 100µI of the samples was
transferred into the AccuSizer dilution chamber containing 60 ml of ultra-filtered, distilled water as the diluent. Sampling was then initiated for 50 ml of the sample
suspension at a rate of 1 m/s. � For each test, the total number of particles sized was checked such that the
maximum limit of 9000 particles/ml (i. e. 450,000 particles for 50 ml) was not
exceeded for optimum AccuSizer sampling performance. If this limit was
exceeded, the sample in the small container was diluted with distilled water, and the test was repeated.

5.3.2 Desulphurisation
The following section describes the experimental setup, operating parameters and
experimental procedures for gas absorption tests in the scrubber. The schematic
diagram in Figure 5.26 illustrates the overall hot gas scrubbing system for the
desulphurisation process.
5.3.2.1 Experimental Setup
Hydrogen sulphide (H2S) from a gas cylinder was mixed with nitrogen gas to provide
an inlet gas concentration of 950 ppm H2S into the column. As the gas mixture rose through the column, H2S was absorbed into the counter-current flow of molten tin.
The gas concentration at the top of the packed bed was measured by an H2S gas
analyser via a stainless steel sampling tube positioned with its open end slightly
above the packed bed. The gas that exited from the top of the column was directed
into a gas separator.
5.3.2.2 Operating Parameters
The key test parameters in this study were gas flow rate, tin flow rate, inlet H2S
concentration, bed height and temperatures. The ranges of test conditions are
summarised in Table 5.6. The gas flow rates ranged from 0.245 to 0.581 kg/m2s (gas
superficial velocity: 0.490 to 1.161 m/s) with a liquid (tin) flow rate of 2.148,3.165 or
3.860 kg/m2s (liquid superficial velocity: 3.07x10-4,4.53x10-4 or 5.52x10"4 m/s). The
inlet H2S concentration in N2 was varied from 300 to 2000 ppm (reference case: 1000
ppm). The height of packing was also varied from 20cm (reference case) to 10 cm
and 0 cm (empty column). While the operating temperature was fixed at 400°C as the
reference condition for variation of other test parameters, its effect was assessed at
300,350 and 390 °C. Operating temperatures are anticipated to be at least 400 °C
due to kinetics limitations at lower temperatures as identified from the preliminary
gasification test (Chang, 2003), (Schürmann, 1984). As the test gas is a mixture of
H2S in nitrogen, there is no serious concern over Sn02 formation. However if a
simulated fuel gas with a high water vapour content is used, the scrubber will be
operated at a temperature above 500 °C to avoid Sn02 dross formation.
112
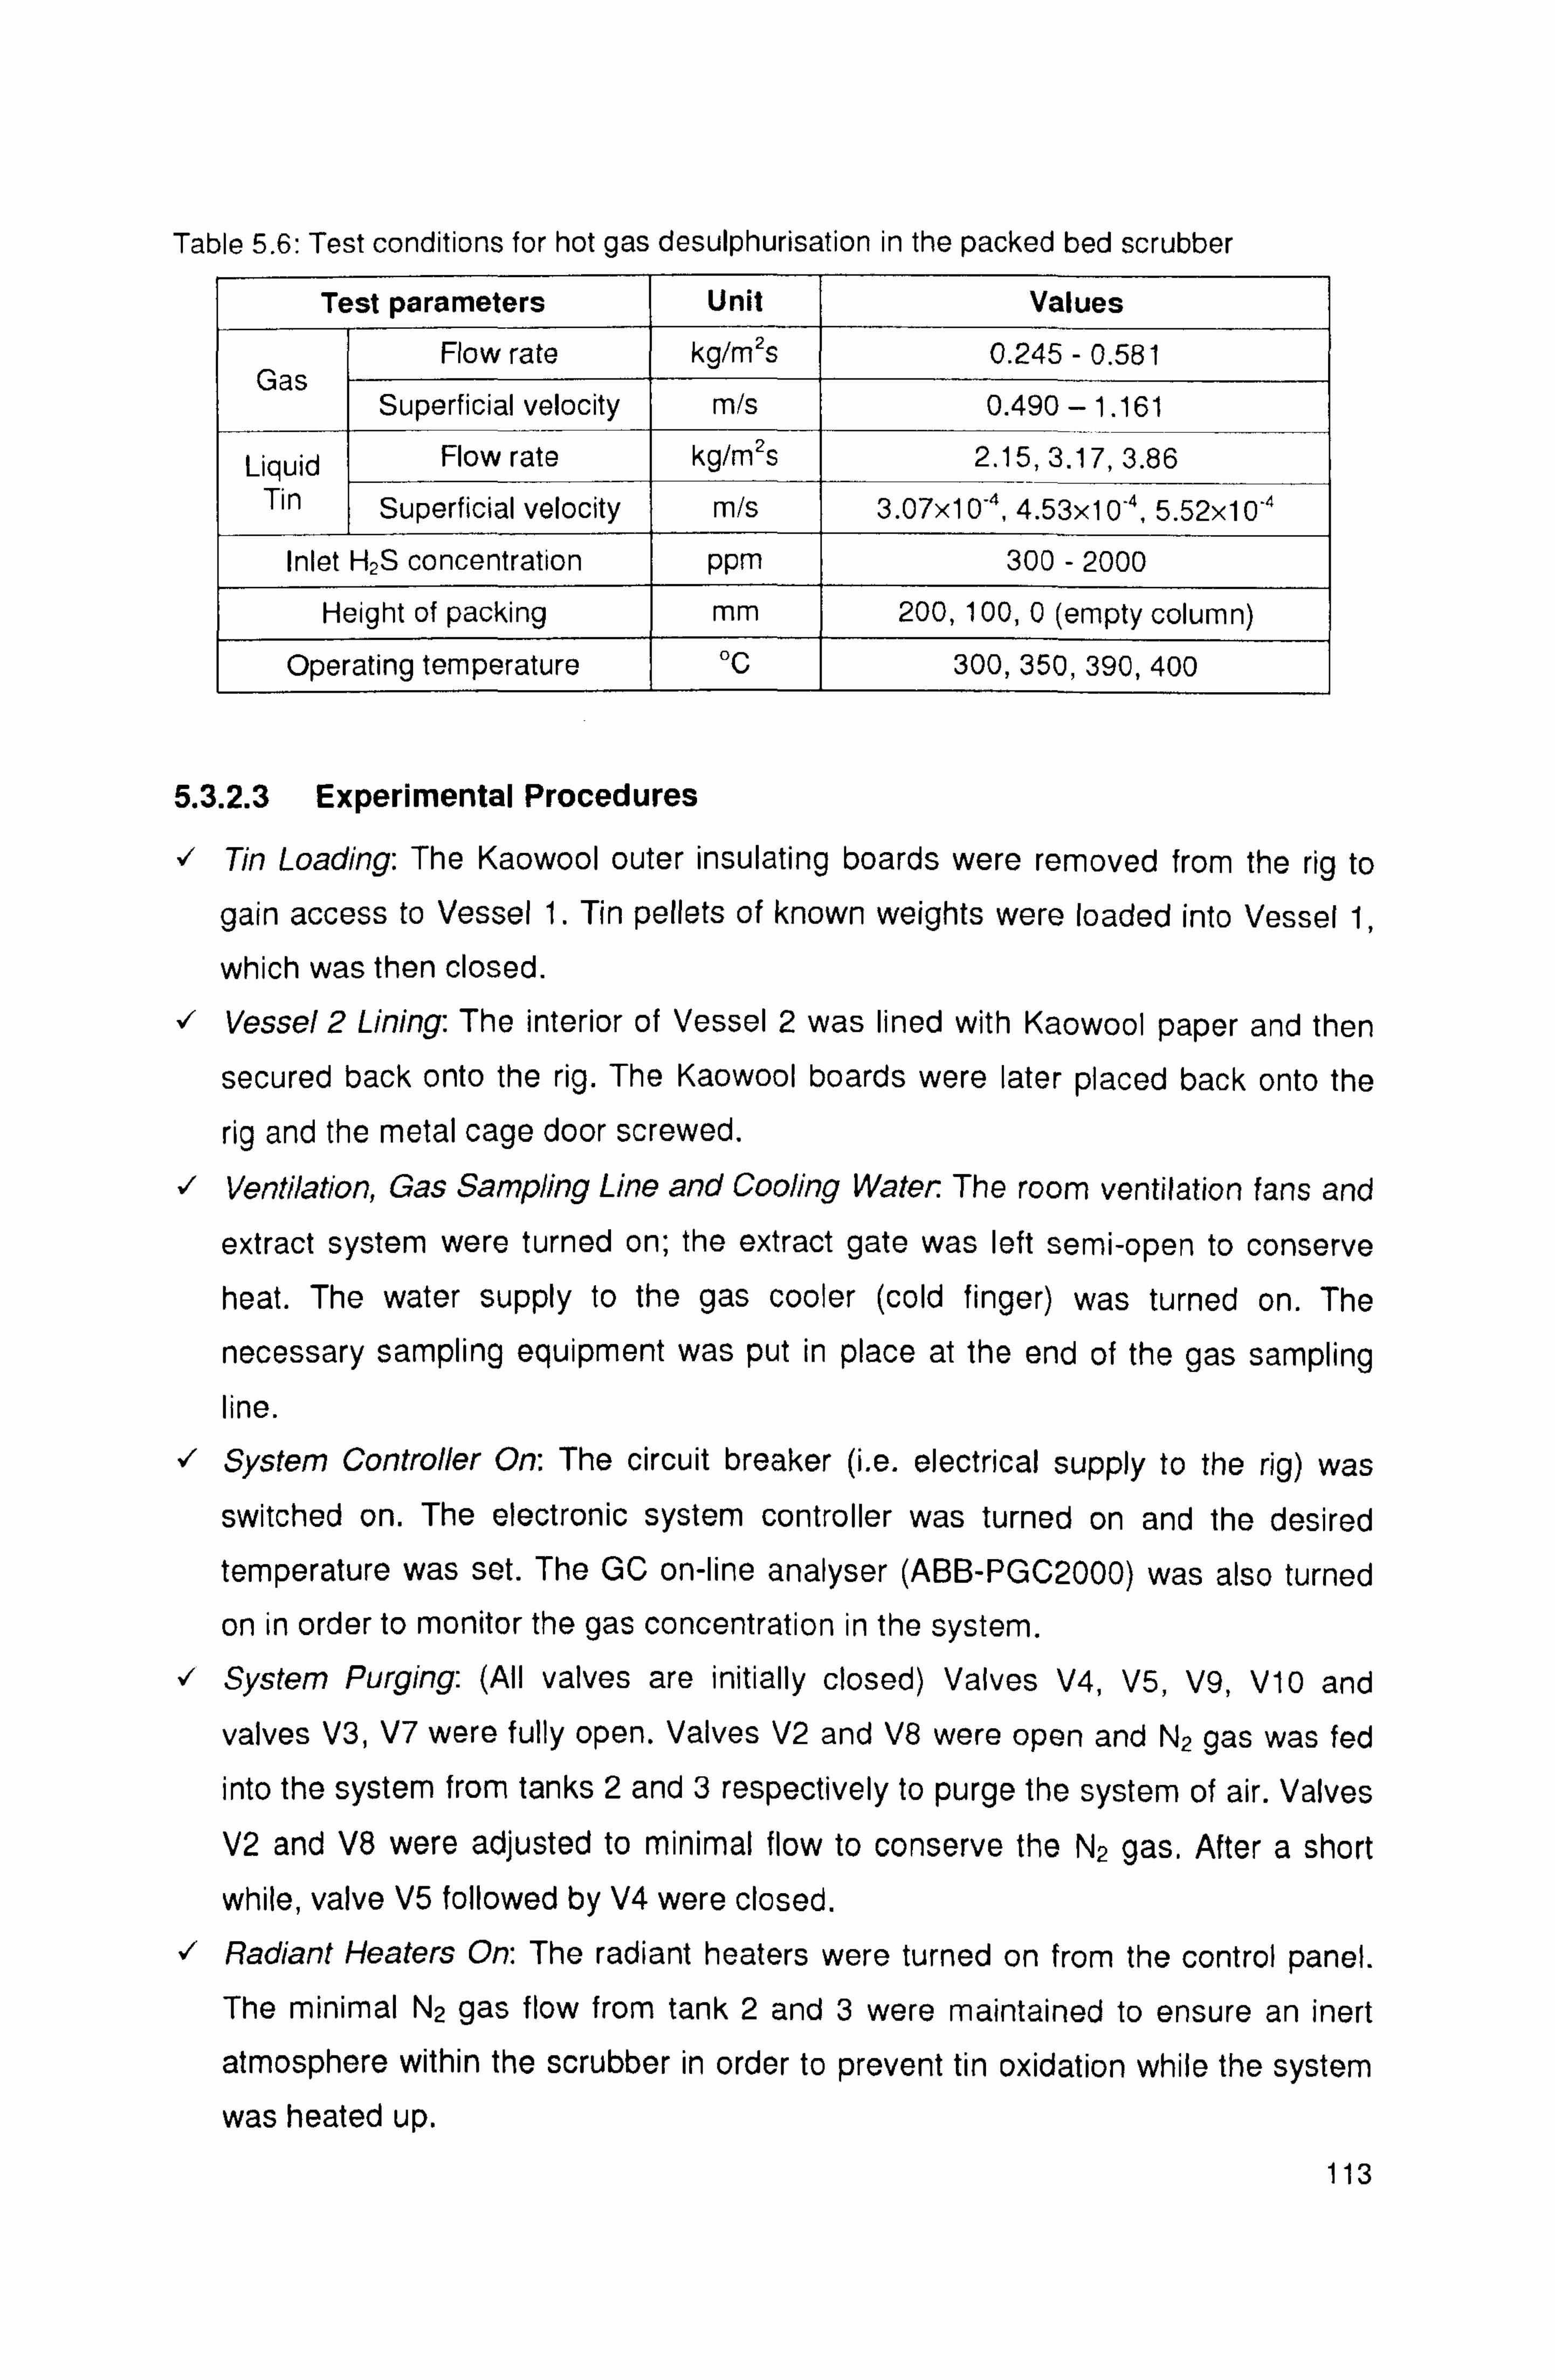
Table 5.6: Test conditions for hot gas desulphurisation in the packed bed scrubber
Test parameters Unit Values
Flow rate kg/m2s 0.245 - 0.581 Gas
Superficial velocity m/s 0.490 - 1.161
Liquid Flow rate kg/m2s 2.15,3.17,3.86 Tin Superficial velocity m/s 3.07x10"4,4.53x10-4,5.52x10-4
Inlet H2S concentration ppm 300 - 2000
Height of packing mm 200,100,0 (empty column)
Operating temperature °C 300,350,390,400
5.3.2.3 Experimental Procedures
� Tin Loading: The Kaowool outer insulating boards were removed from the rig to
gain access to Vessel 1. Tin pellets of known weights were loaded into Vessel 1,
which was then closed.
� Vessel 2 Lining: The interior of Vessel 2 was lined with Kaowool paper and then
secured back onto the rig. The Kaowool boards were later placed back onto the
rig and the metal cage door screwed.
� Ventilation, Gas Sampling Line and Cooling Water. The room ventilation fans and
extract system were turned on; the extract gate was left semi-open to conserve heat. The water supply to the gas cooler (cold finger) was turned on. The
necessary sampling equipment was put in place at the end of the gas sampling line.
� System Controller On: The circuit breaker (i. e. electrical supply to the rig) was
switched on. The electronic system controller was turned on and the desired
temperature was set. The GC on-line analyser (ABB-PGC2000) was also turned
on in order to monitor the gas concentration in the system.
� System Purging: (All valves are initially closed) Valves V4, V5, V9, V10 and
valves V3, V7 were fully open. Valves V2 and V8 were open and N2 gas was fed
into the system from tanks 2 and 3 respectively to purge the system of air. Valves
V2 and V8 were adjusted to minimal flow to conserve the N2 gas. After a short
while, valve V5 followed by V4 were closed.
� Radiant Heaters On: The radiant heaters were turned on from the control panel. The minimal N2 gas flow from tank 2 and 3 were maintained to ensure an inert
atmosphere within the scrubber in order to prevent tin oxidation while the system
was heated up.
113
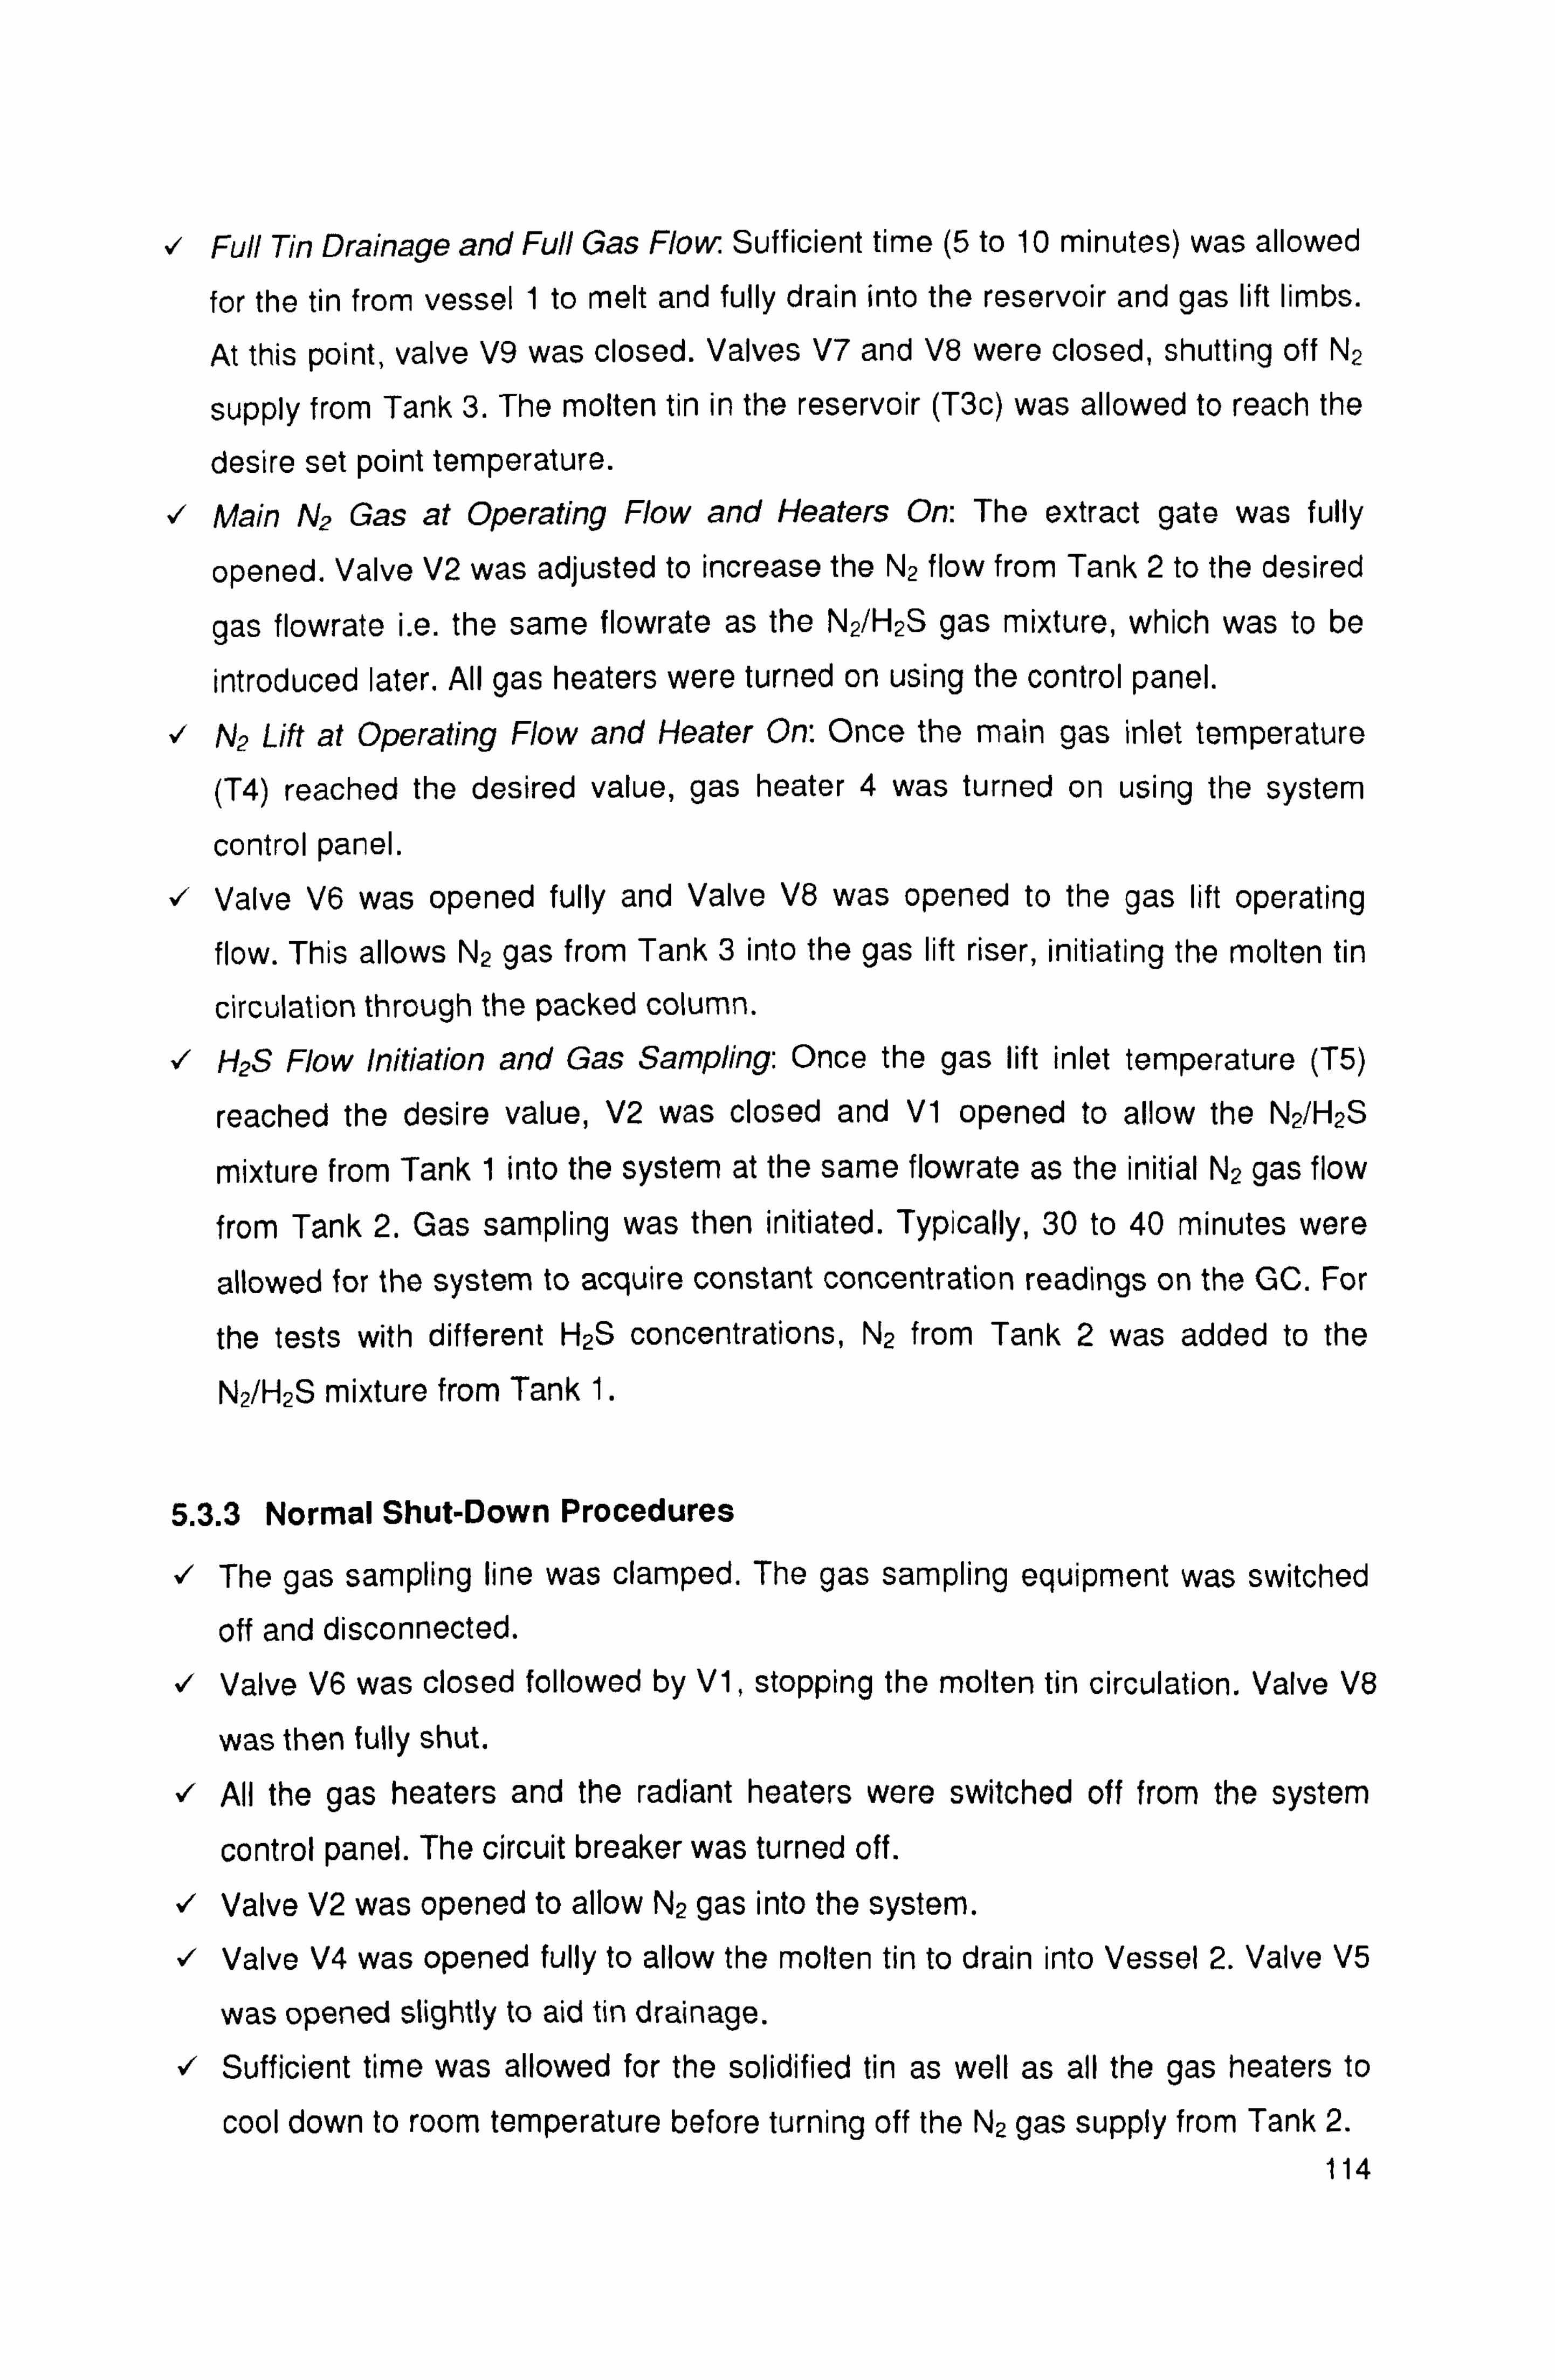
� Full Tin Drainage and Full Gas Flow: Sufficient time (5 to 10 minutes) was allowed
for the tin from vessel 1 to melt and fully drain into the reservoir and gas lift limbs.
At this point, valve V9 was closed. Valves V7 and V8 were closed, shutting off N2
supply from Tank 3. The molten tin in the reservoir (T3c) was allowed to reach the
desire set point temperature.
� Main N2 Gas at Operating Flow and Heaters On: The extract gate was fully
opened. Valve V2 was adjusted to increase the N2 flow from Tank 2 to the desired
gas flowrate i. e. the same flowrate as the N2/H2S gas mixture, which was to be
introduced later. All gas heaters were turned on using the control panel.
� N2 Lift at Operating Flow and Heater On: Once the main gas inlet temperature
(T4) reached the desired value, gas heater 4 was turned on using the system
control panel. � Valve V6 was opened fully and Valve V8 was opened to the gas lift operating
flow. This allows N2 gas from Tank 3 into the gas lift riser, initiating the molten tin
circulation through the packed column.
� H2S Flow Initiation and Gas Sampling: Once the gas lift inlet temperature (T5)
reached the desire value, V2 was closed and V1 opened to allow the N2/H2S
mixture from Tank 1 into the system at the same flowrate as the initial N2 gas flow
from Tank 2. Gas sampling was then initiated. Typically, 30 to 40 minutes were
allowed for the system to acquire constant concentration readings on the GC. For
the tests with different H2S concentrations, N2 from Tank 2 was added to the
N2/H2S mixture from Tank 1.
5.3.3 Normal Shut-Down Procedures
� The gas sampling line was clamped. The gas sampling equipment was switched
off and disconnected.
� Valve V6 was closed followed by V1, stopping the molten tin circulation. Valve V8
was then fully shut. � All the gas heaters and the radiant heaters were switched off from the system
control panel. The circuit breaker was turned off. � Valve V2 was opened to allow N2 gas into the system. � Valve V4 was opened fully to allow the molten tin to drain into Vessel 2. Valve V5
was opened slightly to aid tin drainage.
� Sufficient time was allowed for the solidified tin as well as all the gas heaters to
cool down to room temperature before turning off the N2 gas supply from Tank 2.
114
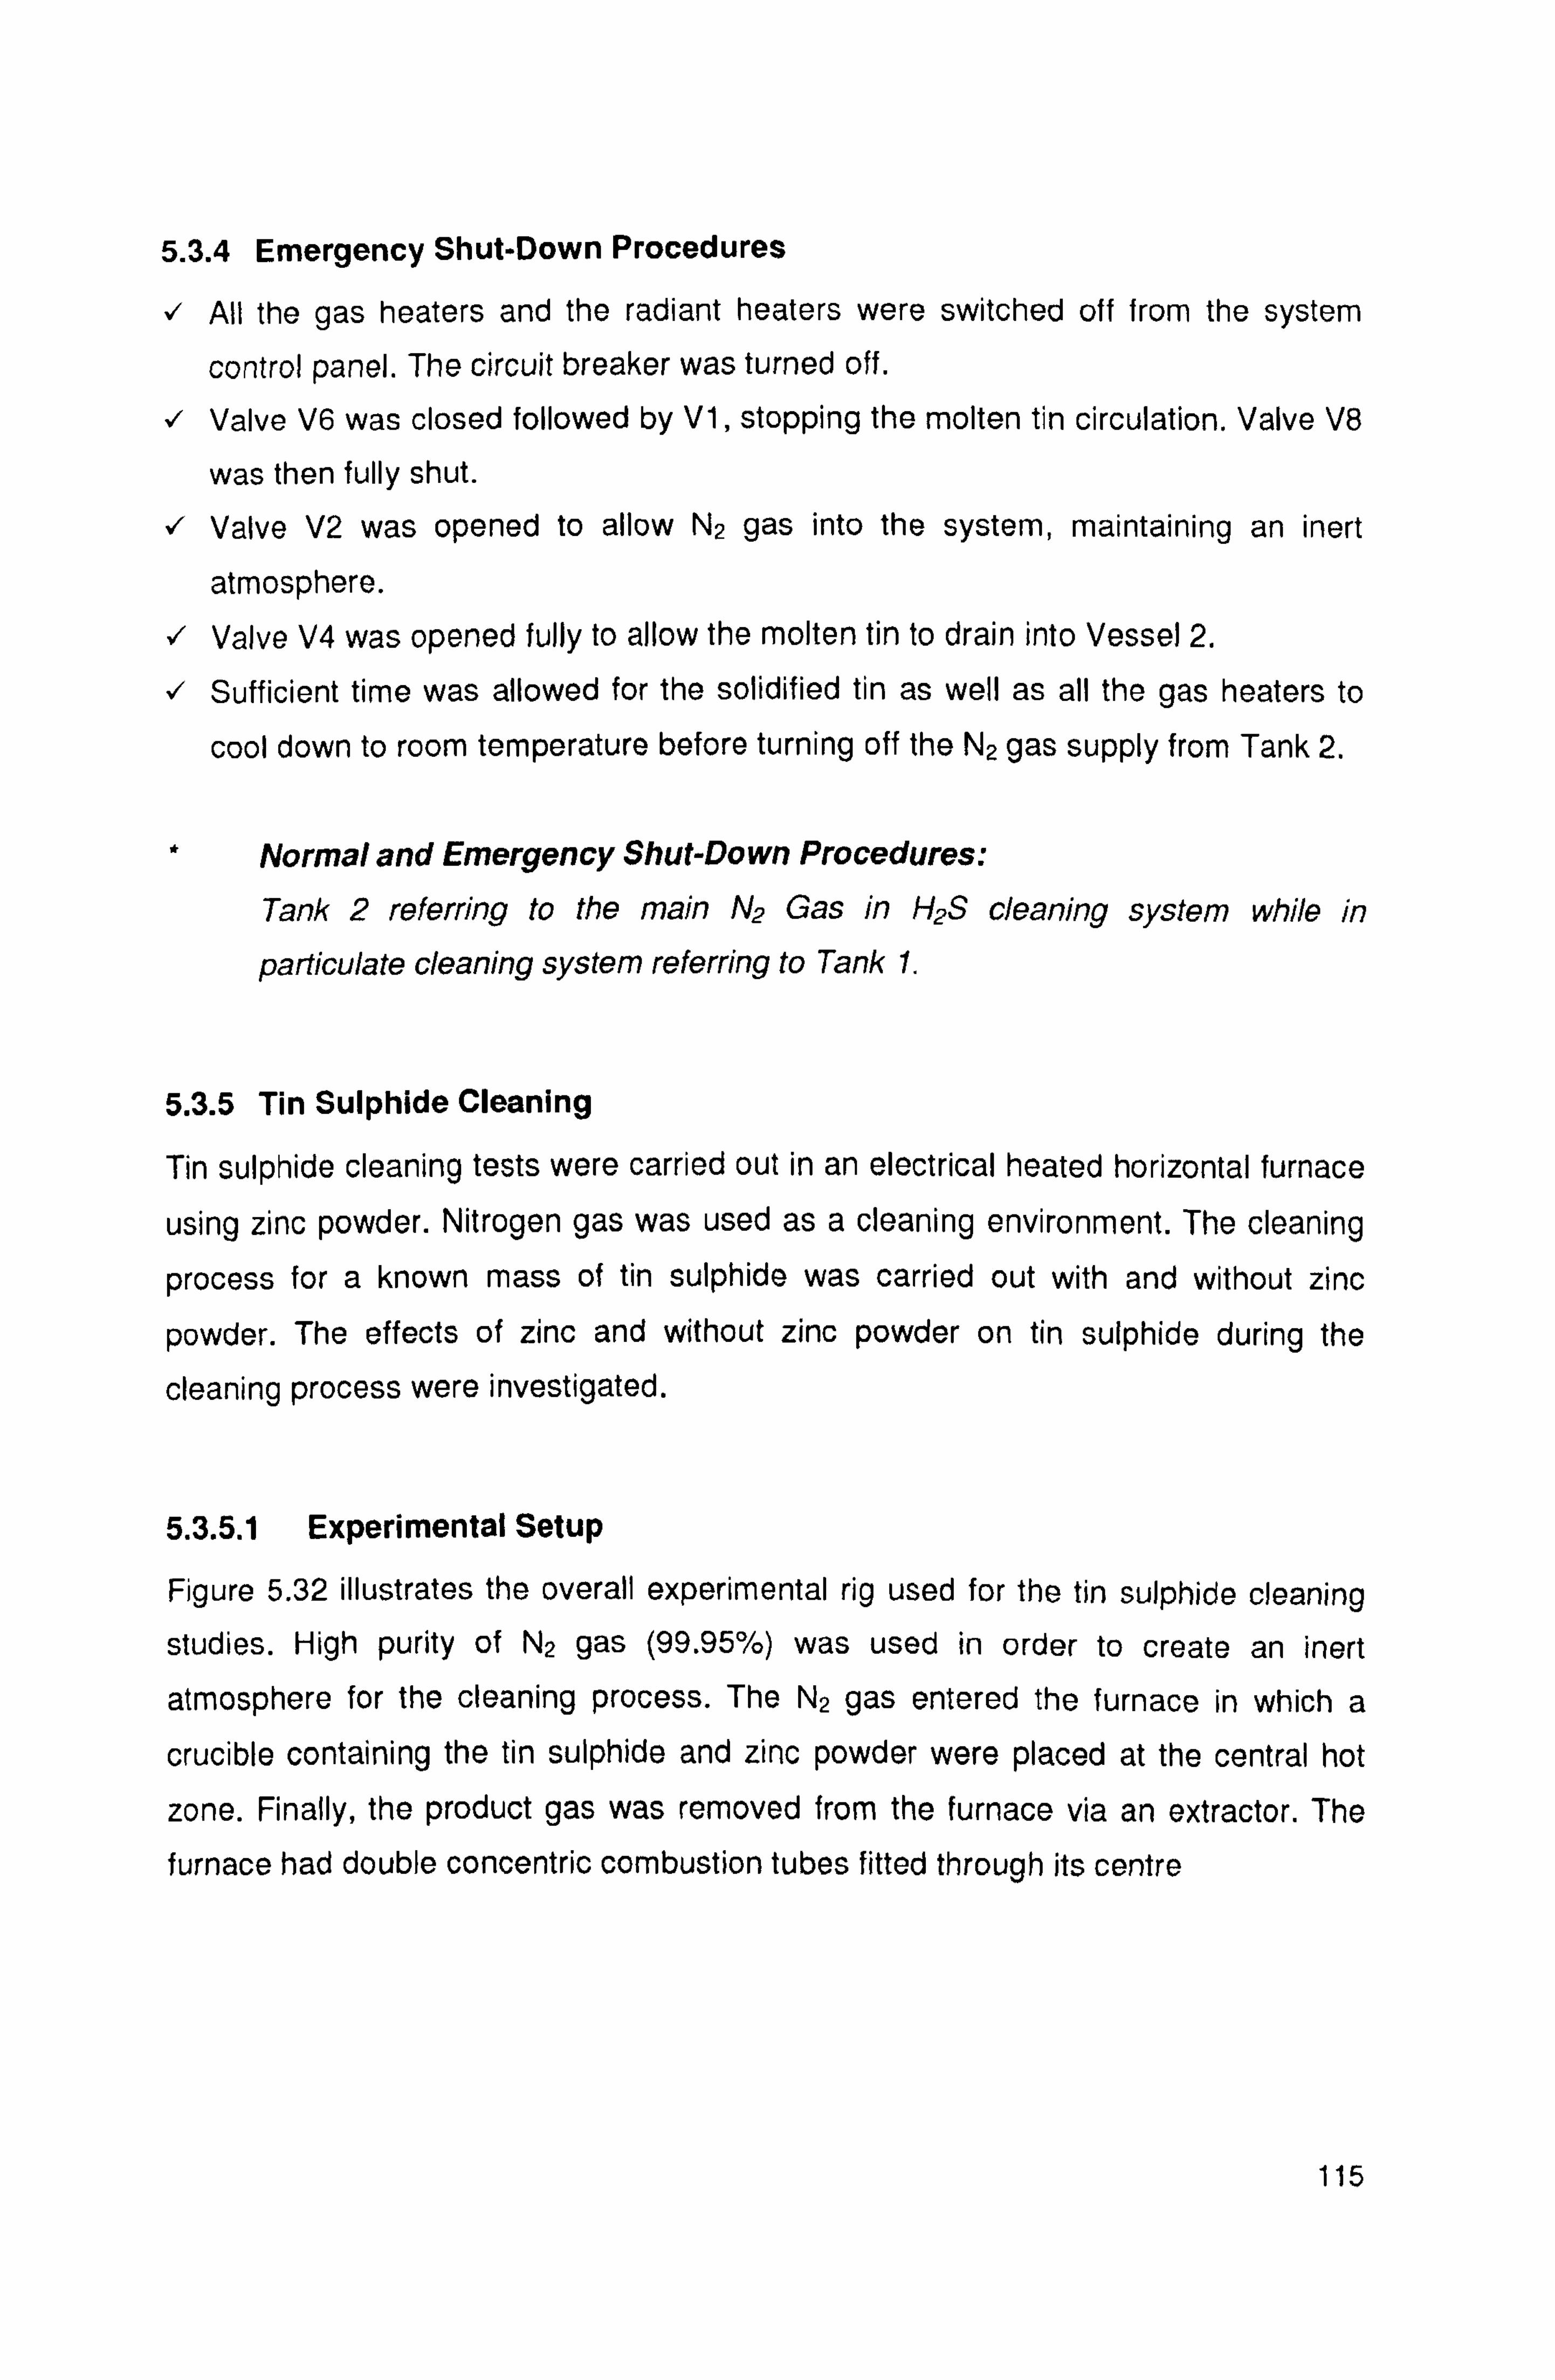
5.3.4 Emergency Shut-Down Procedures
� All the gas heaters and the radiant heaters were switched off from the system
control panel. The circuit breaker was turned off.
� Valve V6 was closed followed by V1, stopping the molten tin circulation. Valve V8
was then fully shut.
� Valve V2 was opened to allow N2 gas into the system, maintaining an inert
atmosphere. � Valve V4 was opened fully to allow the molten tin to drain into Vessel 2.
� Sufficient time was allowed for the solidified tin as well as all the gas heaters to
cool down to room temperature before turning off the N2 gas supply from Tank 2.
Normal and Emergency Shut-Down Procedures:
Tank 2 referring to the main N2 Gas in H2S cleaning system while in
particulate cleaning system referring to Tank 1.
5.3.5 Tin Sulphide Cleaning
Tin sulphide cleaning tests were carried out in an electrical heated horizontal furnace
using zinc powder. Nitrogen gas was used as a cleaning environment. The cleaning
process for a known mass of tin sulphide was carried out with and without zinc
powder. The effects of zinc and without zinc powder on tin sulphide during the
cleaning process were investigated.
5.3.5.1 Experimental Setup
Figure 5.32 illustrates the overall experimental rig used for the tin sulphide cleaning
studies. High purity of N2 gas (99.95%) was used in order to create an inert
atmosphere for the cleaning process. The N2 gas entered the furnace in which a
crucible containing the tin sulphide and zinc powder were placed at the central hot
zone. Finally, the product gas was removed from the furnace via an extractor. The
furnace had double concentric combustion tubes fitted through its centre
115
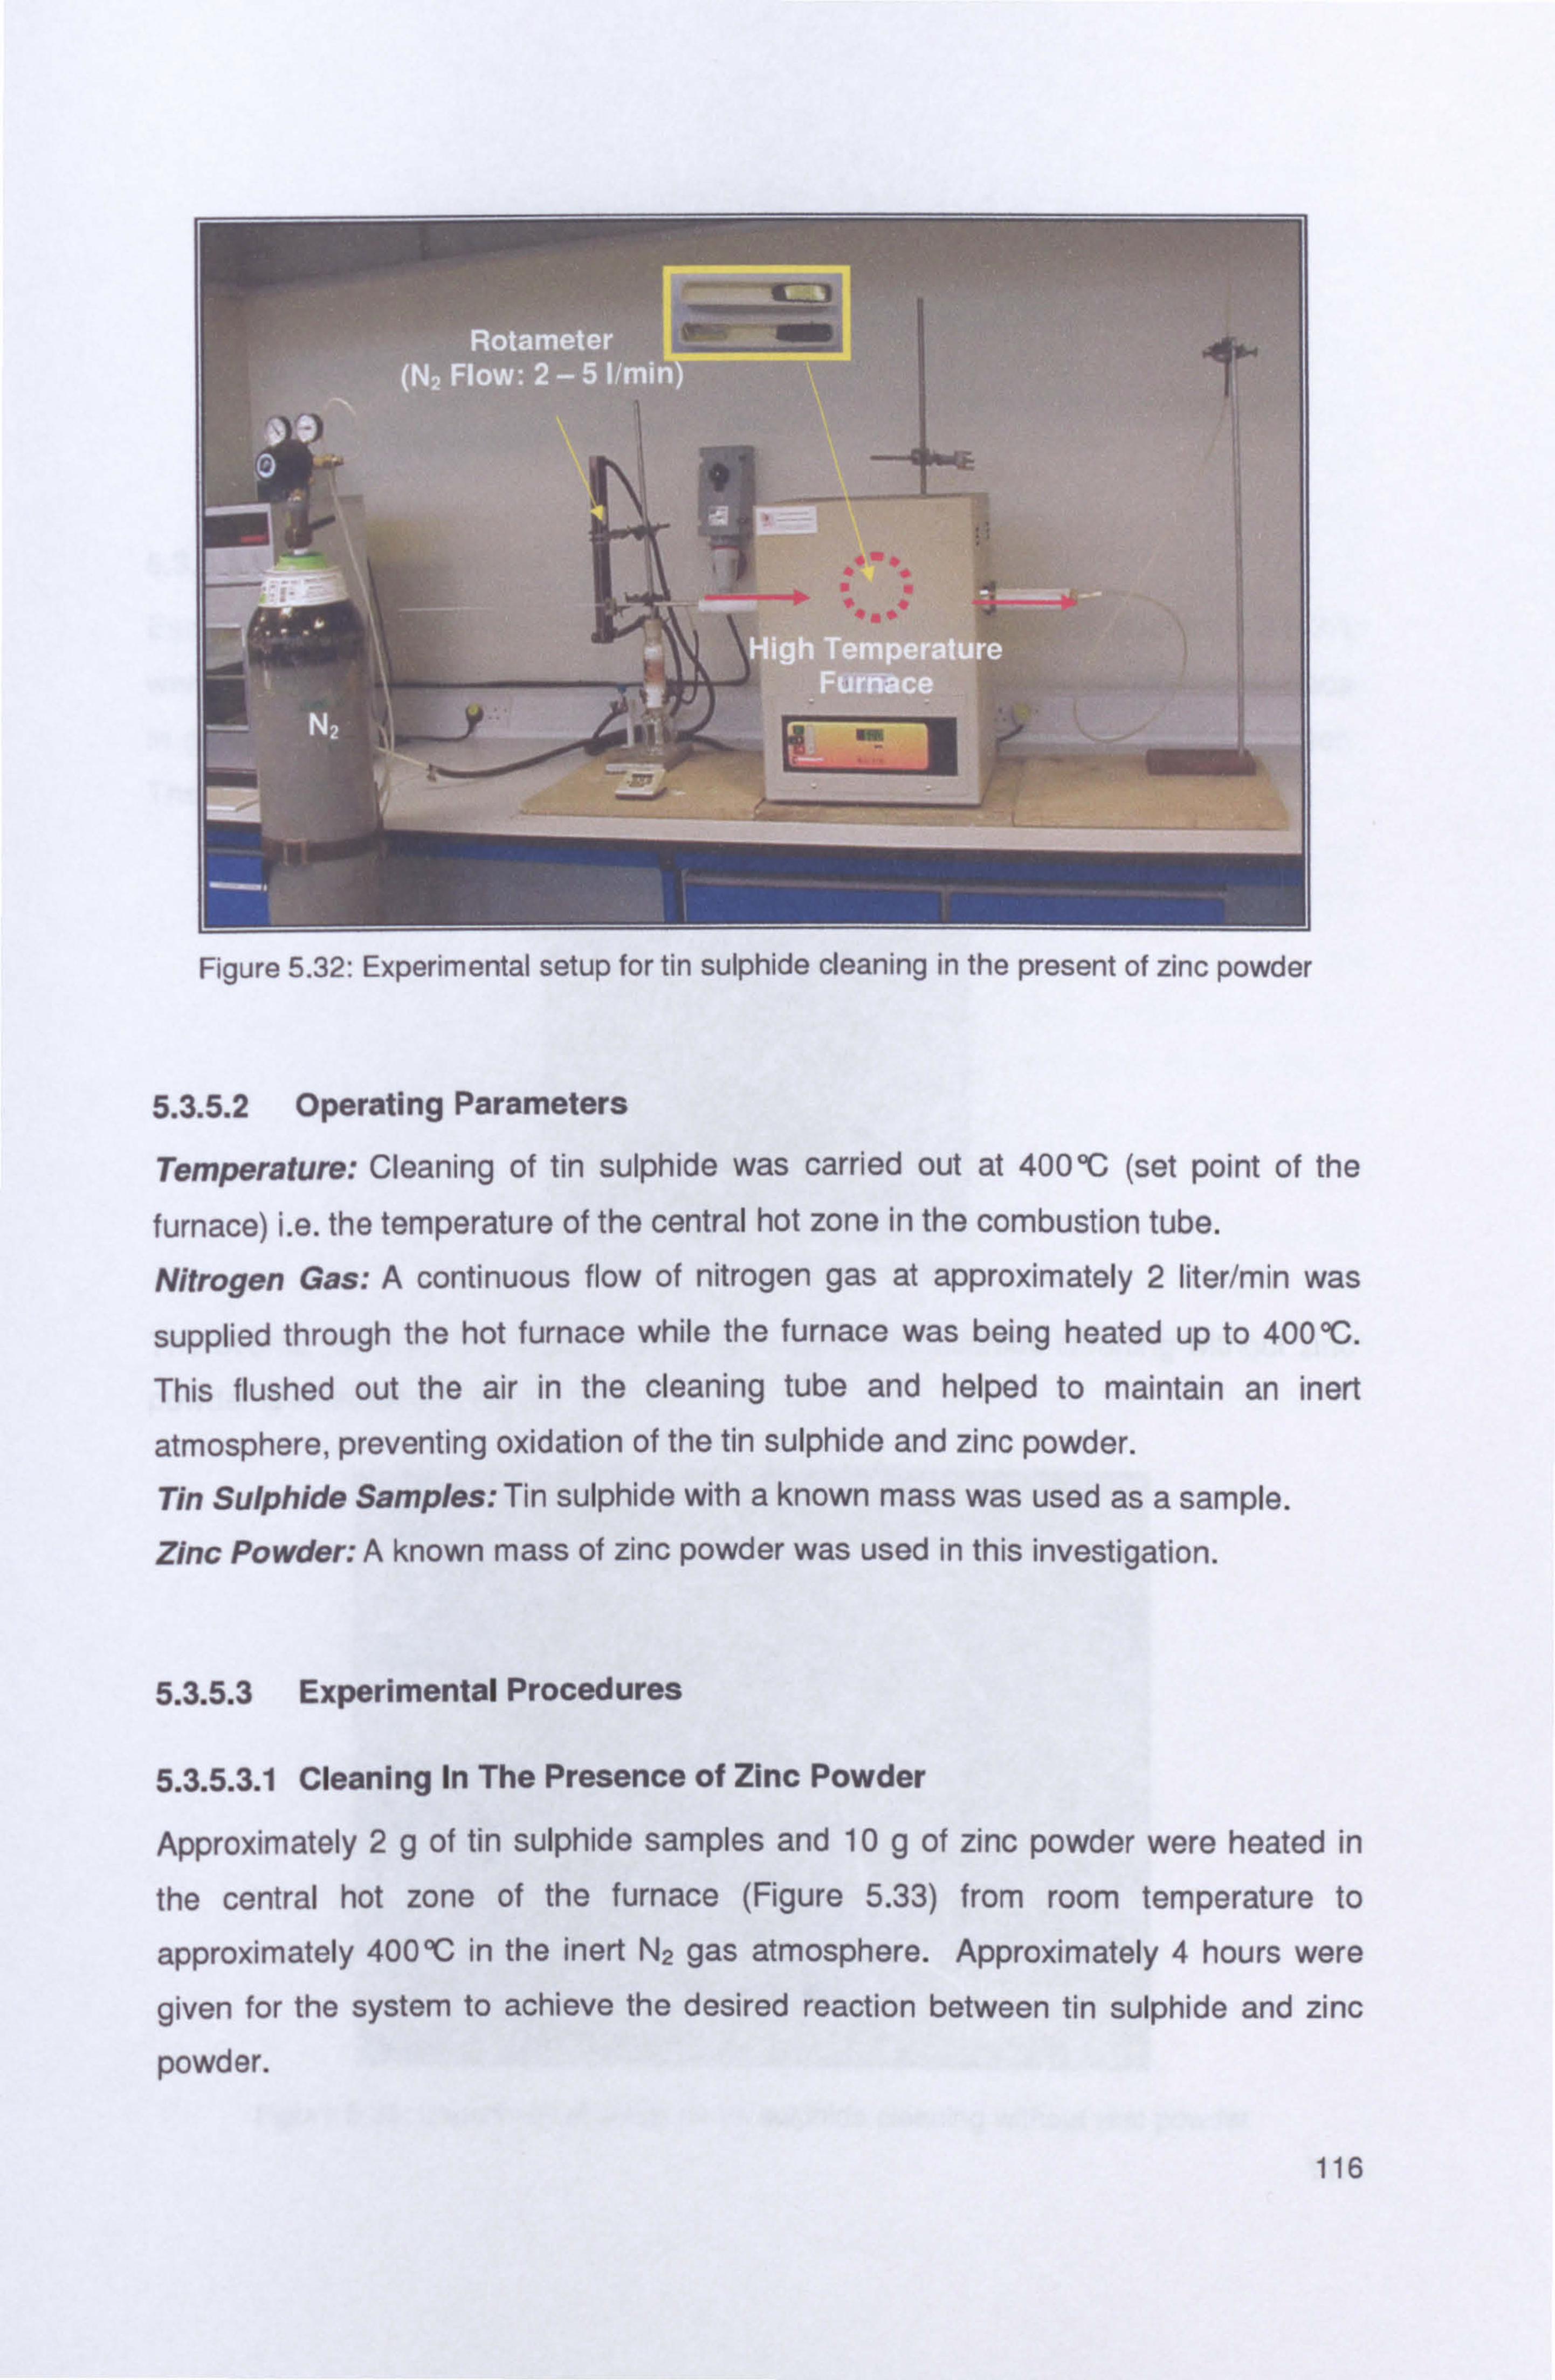
7r r, _Flotameter
low, --1
Figure 5.32: Experimental setup for tin sulphide cleaning in the present of zinc powder
5.3.5.2 Operating Parameters
Temperature: Cleaning of tin sulphide was carried out at 400°C (set point of the
furnace) i. e. the temperature of the central hot zone in the combustion tube.
Nitrogen Gas: A continuous flow of nitrogen gas at approximately 2 liter/min was
supplied through the hot furnace while the furnace was being heated up to 4000C.
This flushed out the air in the cleaning tube and helped to maintain an inert
atmosphere, preventing oxidation of the tin sulphide and zinc powder. Tin Sulphide Samples: Tin sulphide with a known mass was used as a sample. Zinc Powder: A known mass of zinc powder was used in this investigation.
5.3.5.3 Experimental Procedures
5.3.5.3.1 Cleaning In The Presence of Zinc Powder
Approximately 2g of tin sulphide samples and 10 g of zinc powder were heated in
the central hot zone of the furnace (Figure 5.33) from room temperature to
approximately 400°C in the inert N2 gas atmosphere. Approximately 4 hours were
given for the system to achieve the desired reaction between tin sulphide and zinc
powder.
116

Zinc Powder,
Figure 5.33: Tin sulphide and zinc powder in a crucible
5.3.5.3.2 Cleaning Without Zinc Powder
Essentially the same experimental procedures as that outlined in Section 5.3.5.3.1
were adopted herein. The only difference was that the experimental work took place in glass flask as shown in Figure 5.34. The flask was heated by an electric heater.
The tin sulphide sample was weighed before and after each test run.
The overall setup for the experimental rig used for tin sulphide cleaning without zinc powder is illustrated in Figure 5.35.
Figure 5.35: Experimental setup for tin sulphide cleaning without zinc powder 117
Figure 5.34: Tin sulphide in a flask
5.4 Summary
The main objective of this experimental programme was to study the particulates
removal and gas absorption performance of the packed bed hot gas scrubber using
molten tin. Previously, this equipment was designed to study only the
desulphurisation process. But, in this research work, the existing equipment has
been modified in order to investigate the process of particulate cleaning. Various
parts of the equipment have been modified such as the packing support plate, gas
heaters, air seal and gas lift. For particulate removal tests, an additional system was
added to the original design i. e. particle feeder. It consisted of a screw feeder and a
venturi system. An on-line filter was also added to the system to determine the total
efficiency of particle removal. The key test parameters in particle removal tests were
gas and tin flowrates. The operating temperatures were set at 350°C and 400°C
respectively. The key test parameters in the desulphurisation tests were gas flow
rate, tin flow rate, inlet H2S concentration, bed height and temperatures. The
operating temperature was fixed at 400°C as the reference condition for variation of
other test parameters, but its effect was also assessed at 300,350 and 390°C.
Required operating temperatures were anticipated to be at least 400°C due to
kinetics limitations at lower temperatures as identified from the preliminary
gasification test (Chang, 2003), (Schürmann, 1984). Towards the end of this
experimental work, tin sulphide cleaning tests were performed to investigate the
effects of zinc and without zinc powder on tin sulphide during the cleaning processes. The results are presented in Chapter 6.
118
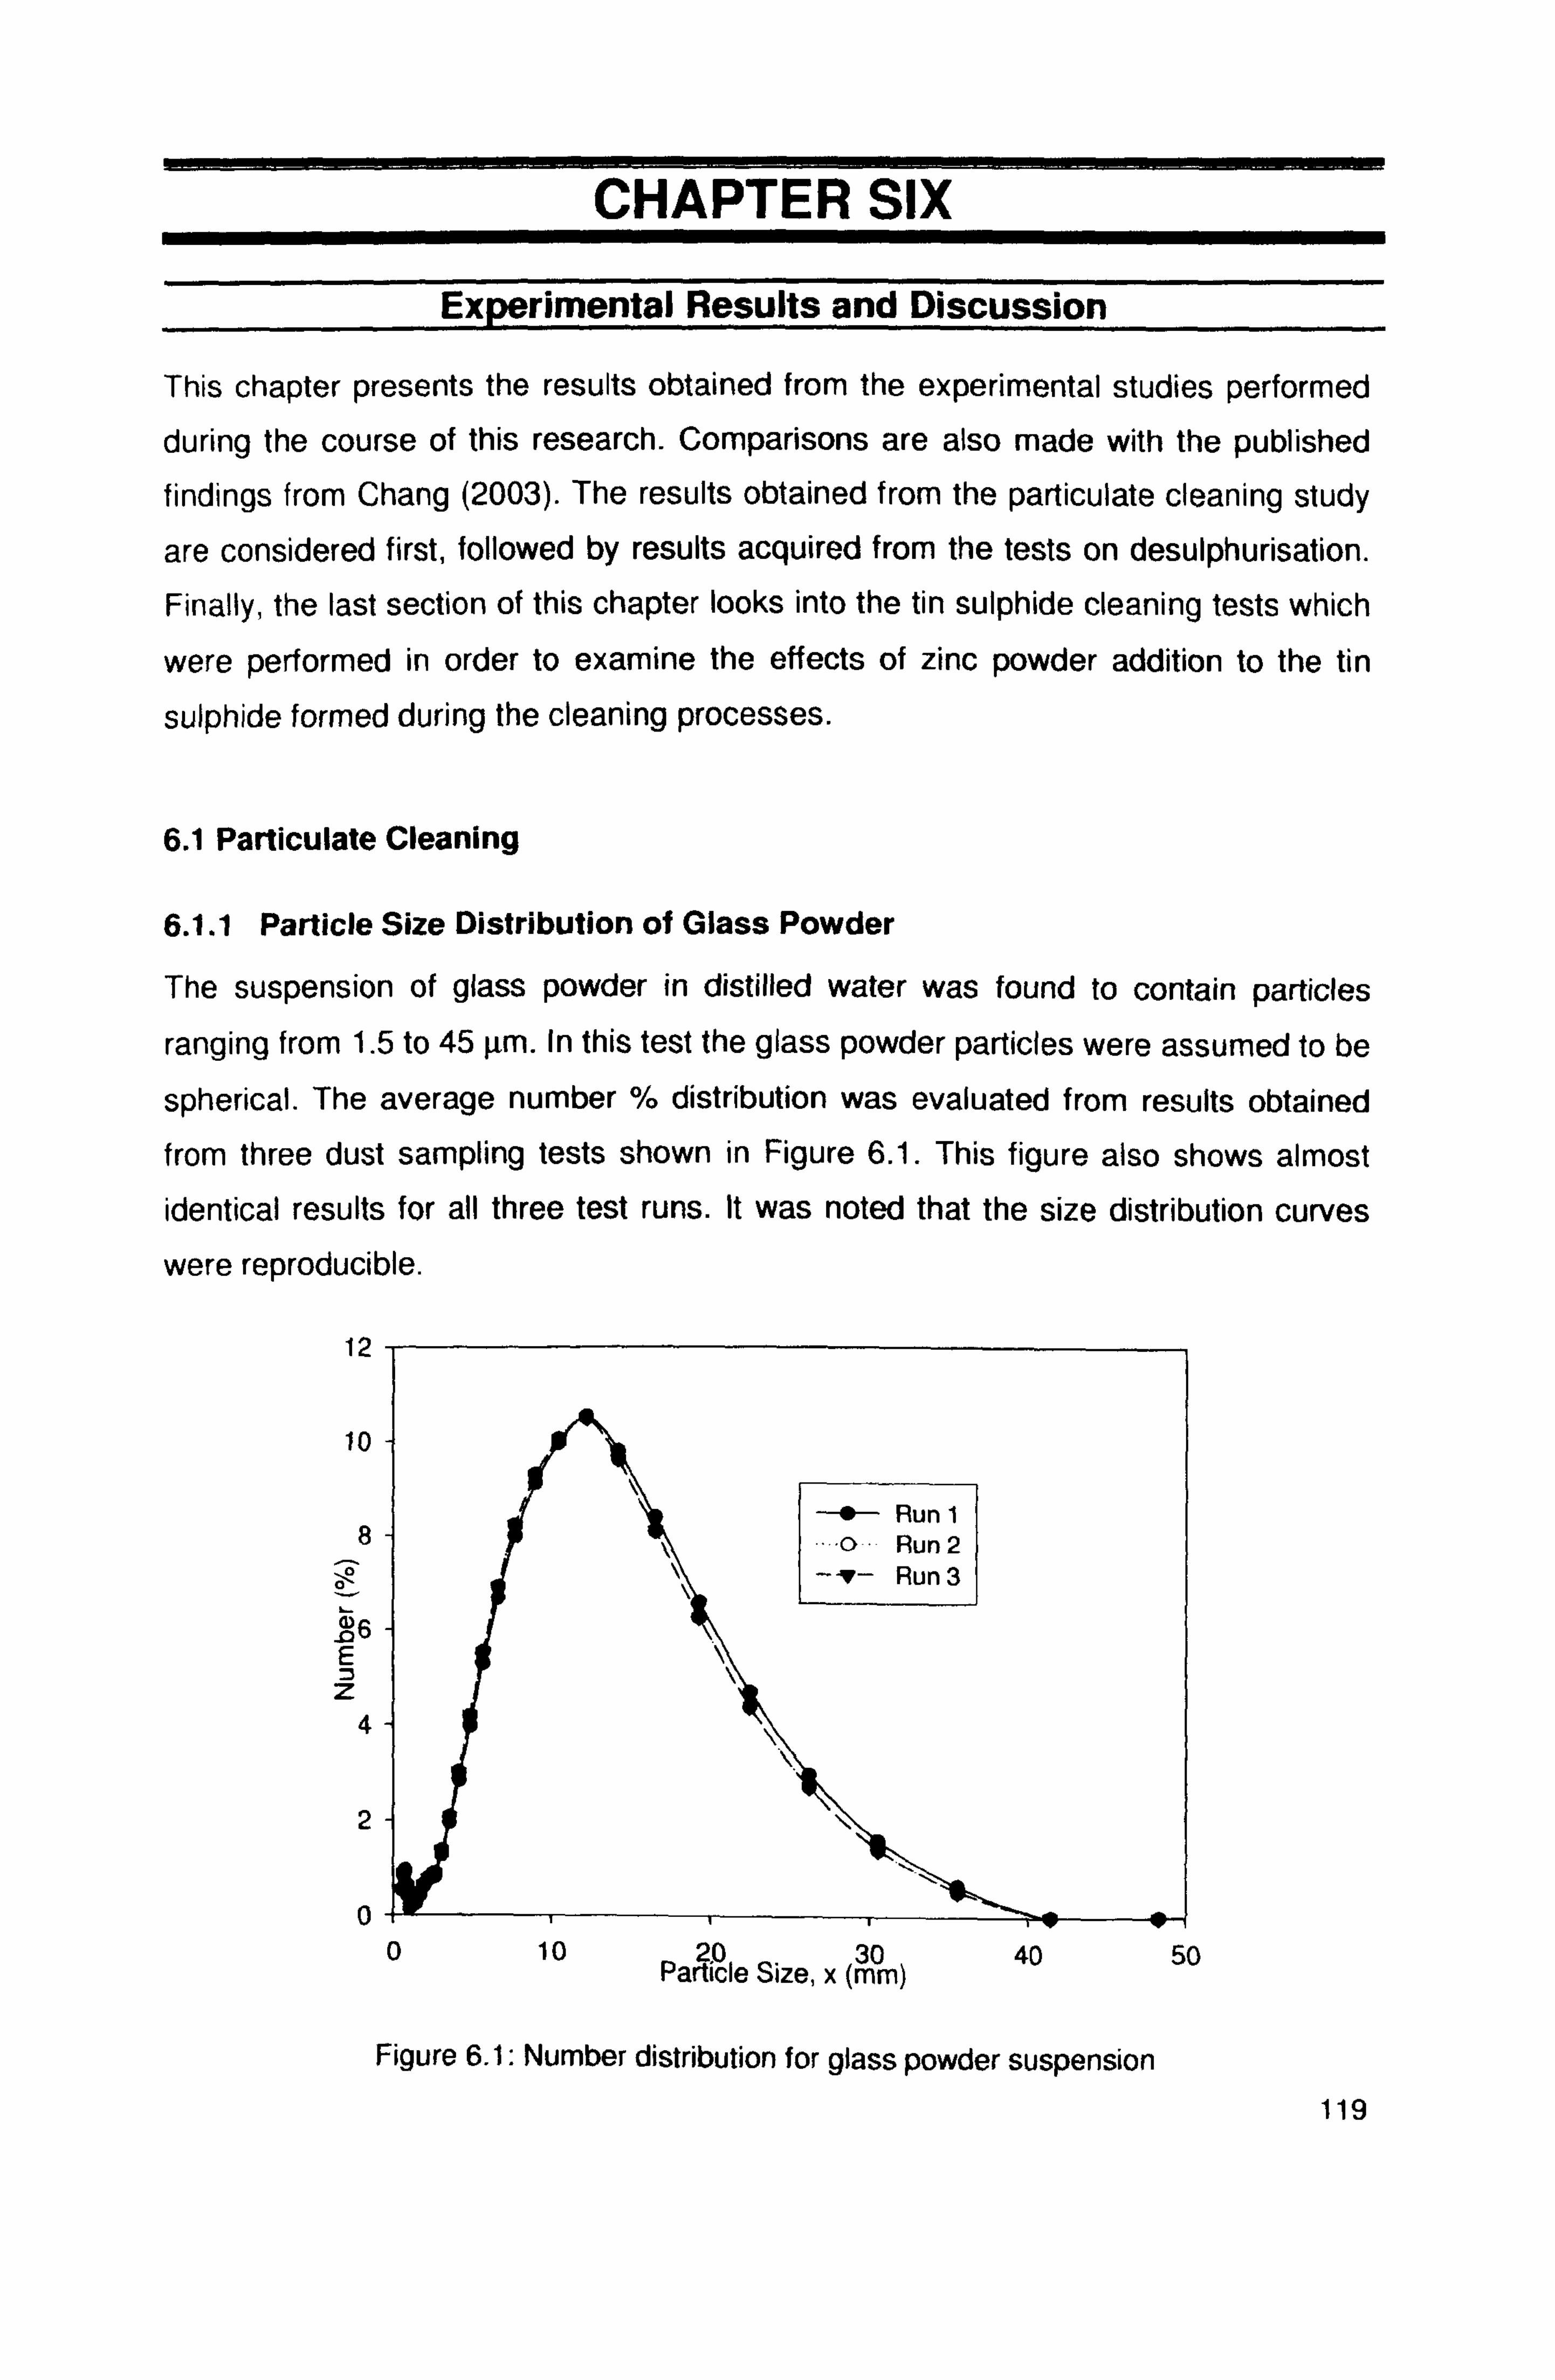
CHAPTER SIX
Experimental Results and Discussion
This chapter presents the results obtained from the experimental studies performed during the course of this research. Comparisons are also made with the published findings from Chang (2003). The results obtained from the particulate cleaning study
are considered first, followed by results acquired from the tests on desulphurisation.
Finally, the last section of this chapter looks into the tin sulphide cleaning tests which
were performed in order to examine the effects of zinc powder addition to the tin
sulphide formed during the cleaning processes.
6.1 Particulate Cleaning
6.1.1 Particle Size Distribution of Glass Powder
The suspension of glass powder in distilled water was found to contain particles
ranging from 1.5 to 45 gm. In this test the glass powder particles were assumed to be
spherical. The average number % distribution was evaluated from results obtained from three dust sampling tests shown in Figure 6.1. This figure also shows almost identical results for all three test runs. It was noted that the size distribution curves
were reproducible.
12
10
8
6 E z
4
2
0
f Run 1 o Run2
-1- Run 3
0 10 Particle Size, x (mm)
40 50
Figure 6.1: Number distribution for glass powder suspension 119
6.1.2 Experimental Observation
Due to the complex operational characteristics of this hot gas scrubber, several trial
runs were carried out before the best start-up procedure was determined. One of the
main problems was the solidification of tin especially in valves V4, V9 and V10 after
each experiment. Prior to running any experiment, any solid tin had to be cleaned
and removed from the valves to prevent blockage. For safety reasons this
experimental work could not be performed outside working hours. This therefore
introduced a time constraint whereby each experimental run was limited to a
maximum of 8 hours. The heat-up of the system was relatively slow and thus it took
approximately 6 hours to reach stable conditions. However, after 6 hours the bed
temperature was only around 400°C and this was only just high enough for the most
crucial part of the gasification process. Therefore, all the experiments especially for
desulphurisation were conducted at 400°C for about 30mins.
This experimental work was carried out using nitrogen gas for tin circulation at high
temperature (350 - 400CC) while the inlet particles were at the ambient temperature
of 159C. The dust particle feed rate was derived from the N2 flow rate under different
scrubber operating temperatures of 350°'C and 400°C. Solidification of liquid tin from
high temperature onto the cool surface of glass particles resulted in solid tin build-up
on the surface of glass particles. Inertial deposition was expected to be the main
particle collection mechanism whilst Brownian diffusional capture was negligible as
the dust particle size was greater than 1.5 gm. Interaction and coalescence of bed
materials with the glass particles were considered to be the primary source of
agglomeration in the packed bed scrubber. The second source is the accumulation of
glass particles and solid tin mixture (Si-Sn). Precipitation of the solid tin mixture deposited inside the column will block the flow and disrupt the circulation. Figure 6.2 is an image of the alumina combustion tube after 3 runs with some accumulation of the Si-Sn mixture. Subsequent test runs showed an increase in agglomerated Si-Sn
mixture (Figure 6.3). The reason being that smaller particles tend to coagulate and as the particles grow in size, they will attach to other larger particles. Moreover, the
solidification of tin enhances the increase in the agglomerated mixture.
120
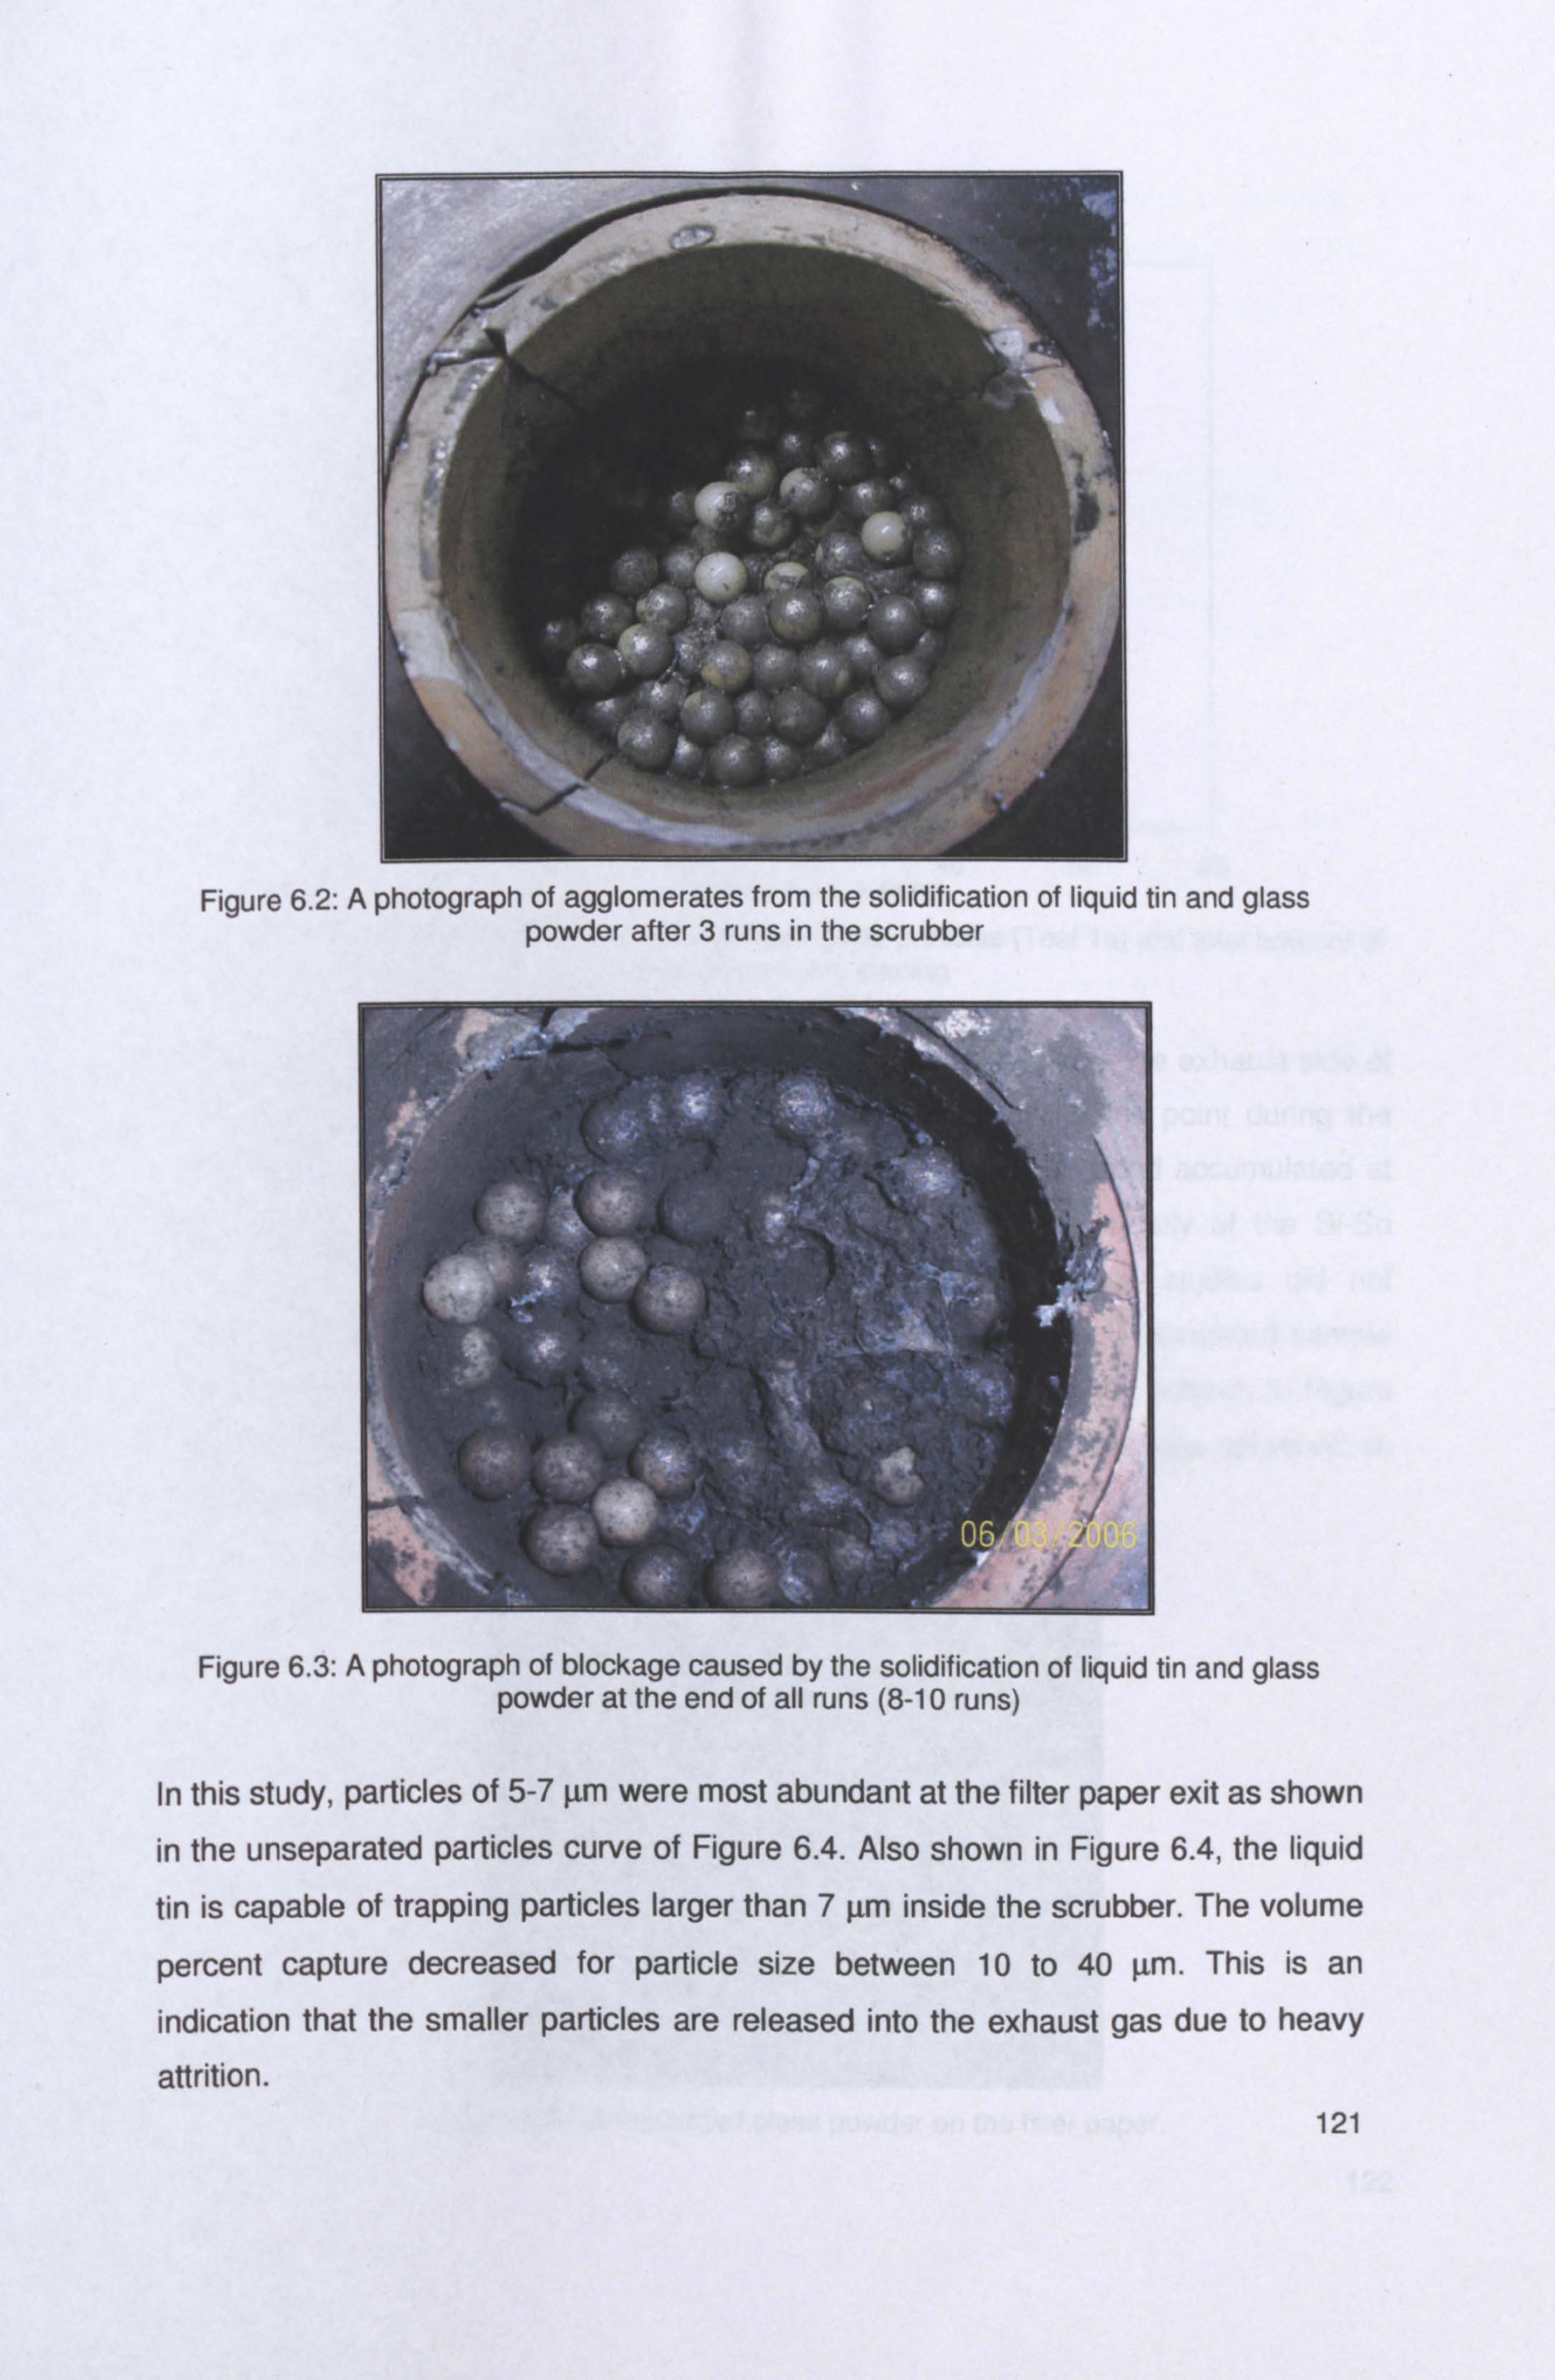
Figure 6.2: A photograph of agglomerates from the solidification of liquid tin and glass powder after 3 runs in the scrubber
Figure 6.3: A photograph of blockage caused by the solidification of liquid tin and glass powder at the end of all runs (8-10 runs)
In this study, particles of 5-7 µm were most abundant at the filter paper exit as shown in the unseparated particles curve of Figure 6.4. Also shown in Figure 6.4, the liquid
tin is capable of trapping particles larger than 7 µm inside the scrubber. The volume
percent capture decreased for particle size between 10 to 40 gm. This is an
indication that the smaller particles are released into the exhaust gas due to heavy
attrition. 121
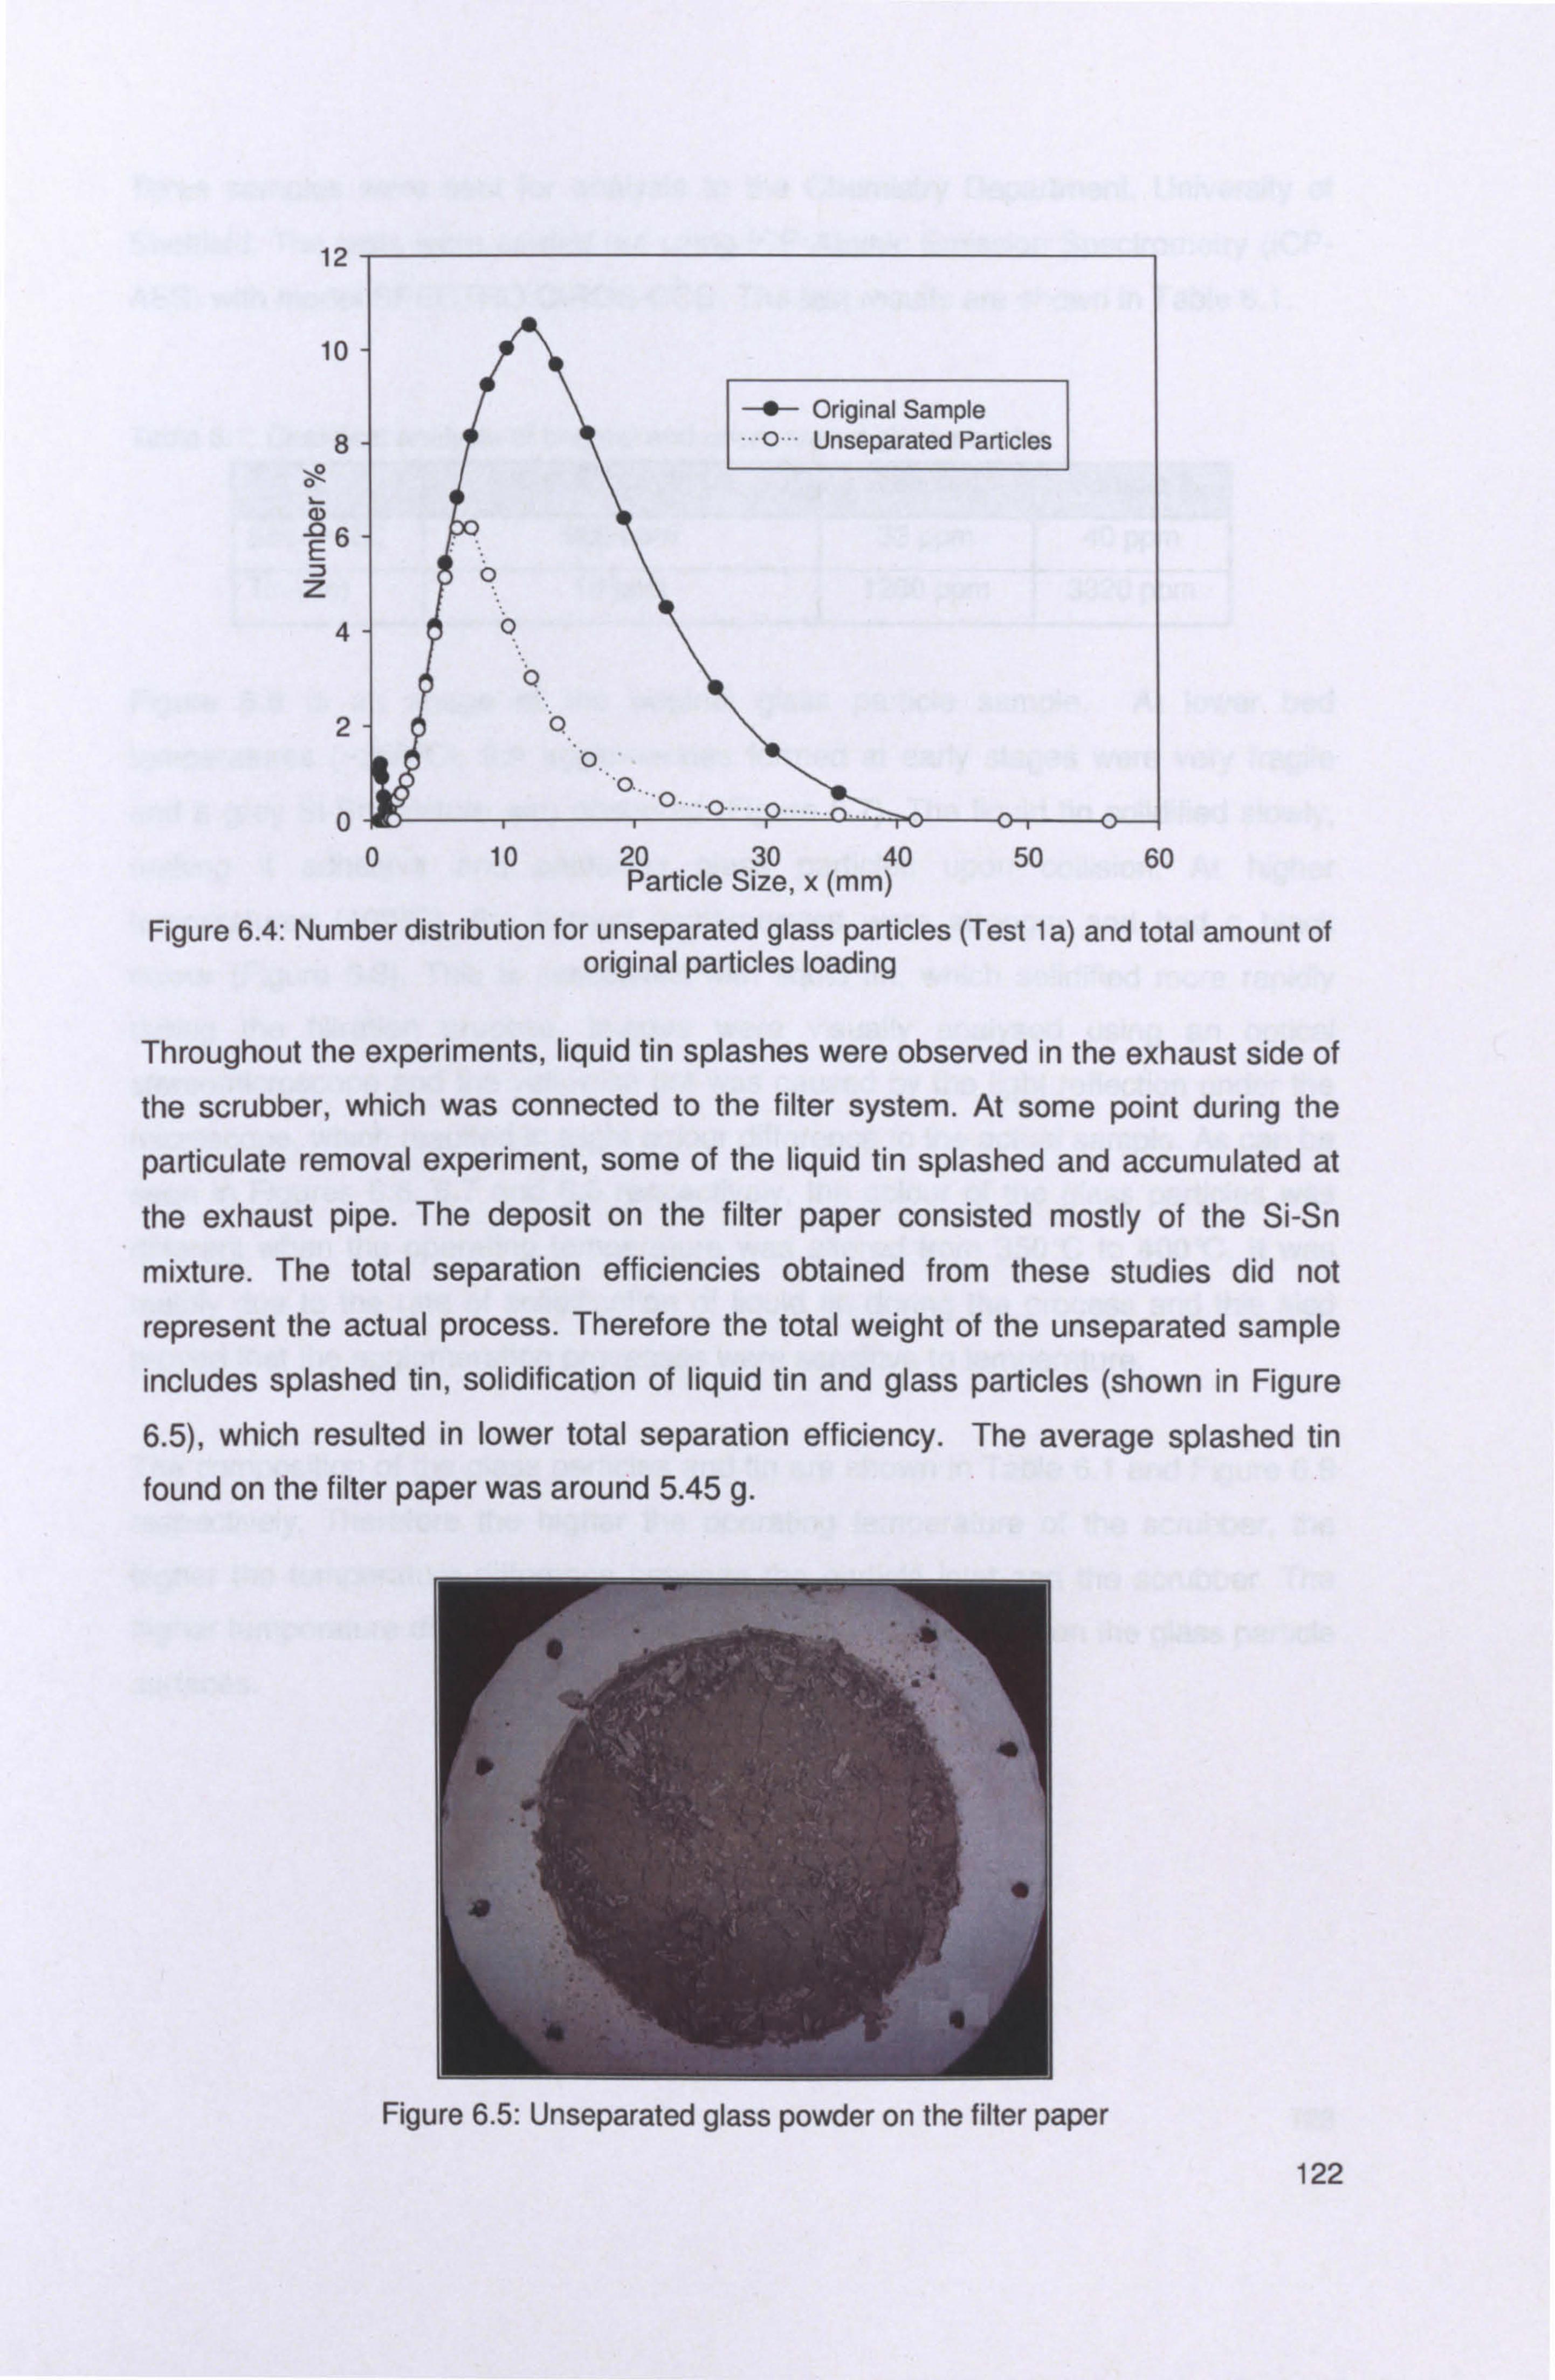
12
10
8
m -06 E Z
4
2
0
Original Sample o Unseparated Particles
ö
Q
.Q
0 10 20 30 40 50 60 Particle Size, x (mm)
Figure 6.4: Number distribution for unseparated glass particles (Test 1 a) and total amount of original particles loading
Throughout the experiments, liquid tin splashes were observed in the exhaust side of the scrubber, which was connected to the filter system. At some point during the
particulate removal experiment, some of the liquid tin splashed and accumulated at the exhaust pipe. The deposit on the filter paper consisted mostly of the Si-Sn
mixture. The total separation efficiencies obtained from these studies did not
represent the actual process. Therefore the total weight of the unseparated sample includes splashed tin, solidification of liquid tin and glass particles (shown in Figure
6.5), which resulted in lower total separation efficiency. The average splashed tin found on the filter paper was around 5.45 g.
Figure 6.5: Unseparated glass powder on the filter paper
122
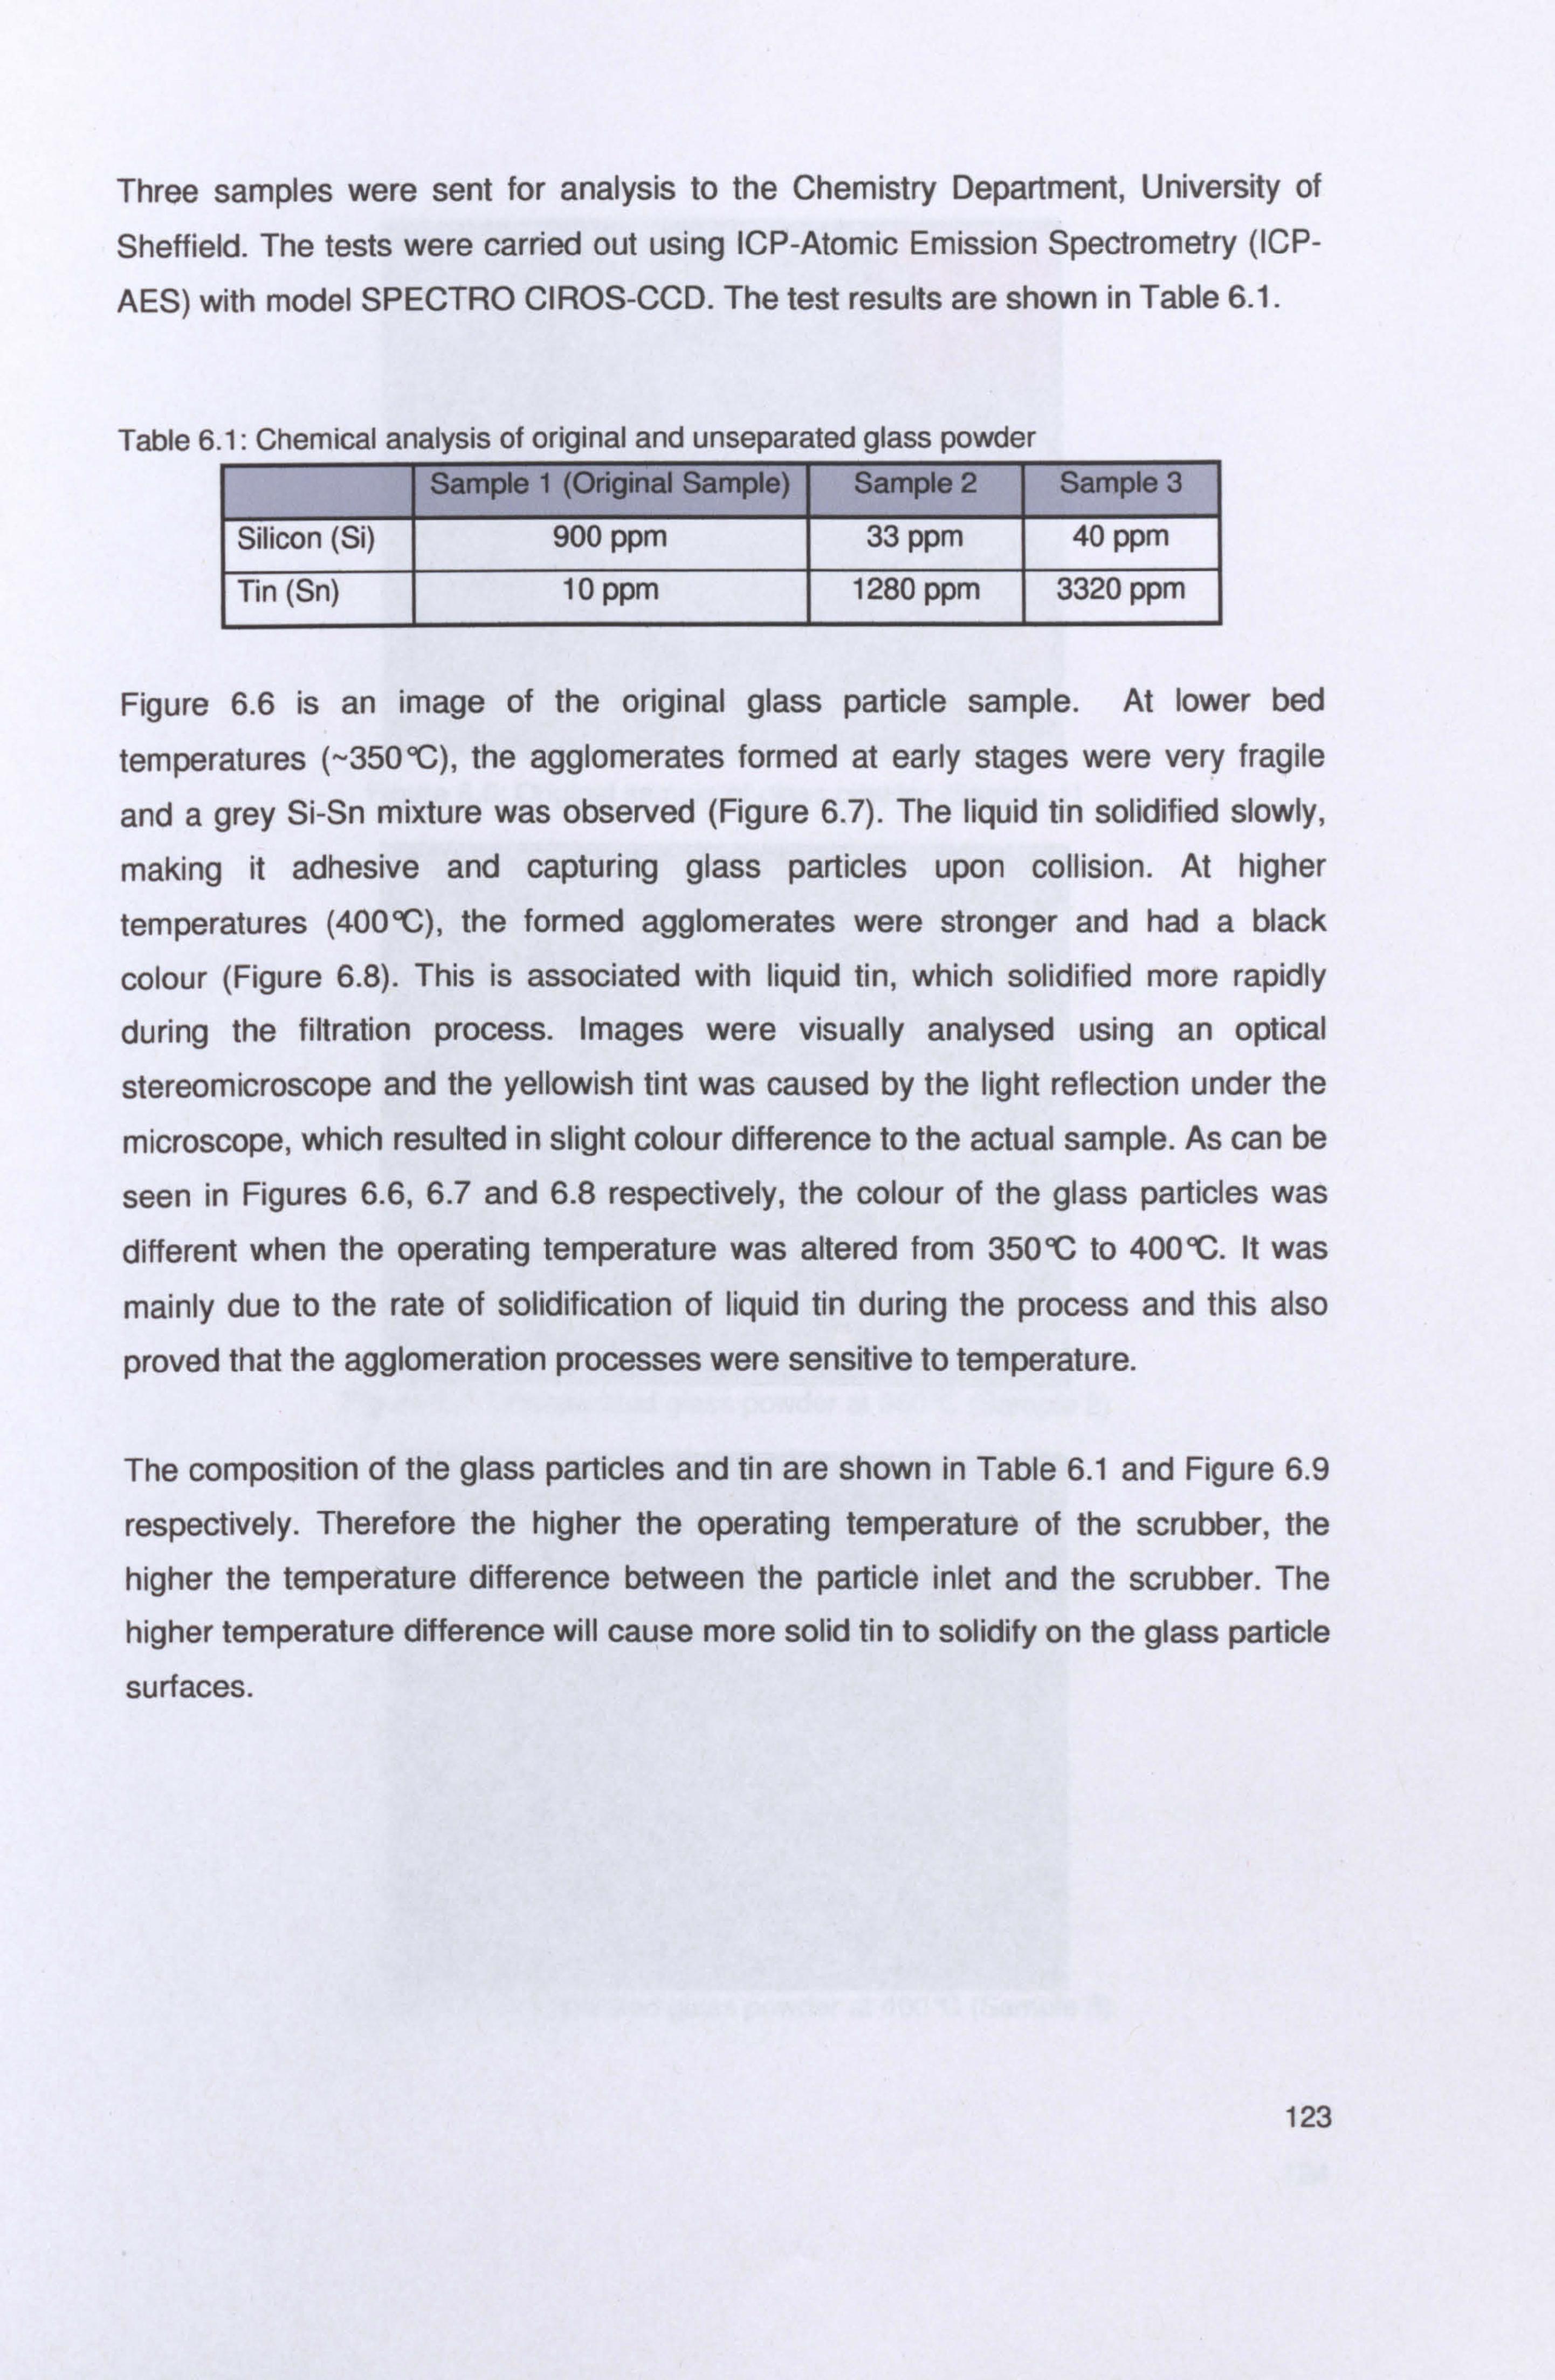
Three samples were sent for analysis to the Chemistry Department, University of
Sheffield. The tests were carried out using ICP-Atomic Emission Spectrometry (ICP-
AES) with model SPECTRO CIROS-CCD. The test results are shown in Table 6.1.
Table 6.1: Chemical analysis of original and unseparated glass powder Sample 1 (Original Sample) Sample 2 Sample 3
Silicon (Si) 900 ppm 33 ppm 40 ppm
Tin (Sn) 10 ppm 1280 ppm 3320 ppm
Figure 6.6 is an image of the original glass particle sample. At lower bed
temperatures (-350°C), the agglomerates formed at early stages were very fragile
and a grey Si-Sn mixture was observed (Figure 6.7). The liquid tin solidified slowly,
making it adhesive and capturing glass particles upon collision. At higher
temperatures (400°CC), the formed agglomerates were stronger and had a black
colour (Figure 6.8). This is associated with liquid tin, which solidified more rapidly
during the filtration process. Images were visually analysed using an optical
stereomicroscope and the yellowish tint was caused by the light reflection under the
microscope, which resulted in slight colour difference to the actual sample. As can be
seen in Figures 6.6,6.7 and 6.8 respectively, the colour of the glass particles was
different when the operating temperature was altered from 350°C to 400°C. It was
mainly due to the rate of solidification of liquid tin during the process and this also
proved that the agglomeration processes were sensitive to temperature.
The composition of the glass particles and tin are shown in Table 6.1 and Figure 6.9
respectively. Therefore the higher the operating temperature of the scrubber, the
higher the temperature difference between the particle inlet and the scrubber. The
higher temperature difference will cause more solid tin to solidify on the glass particle
surfaces.
123
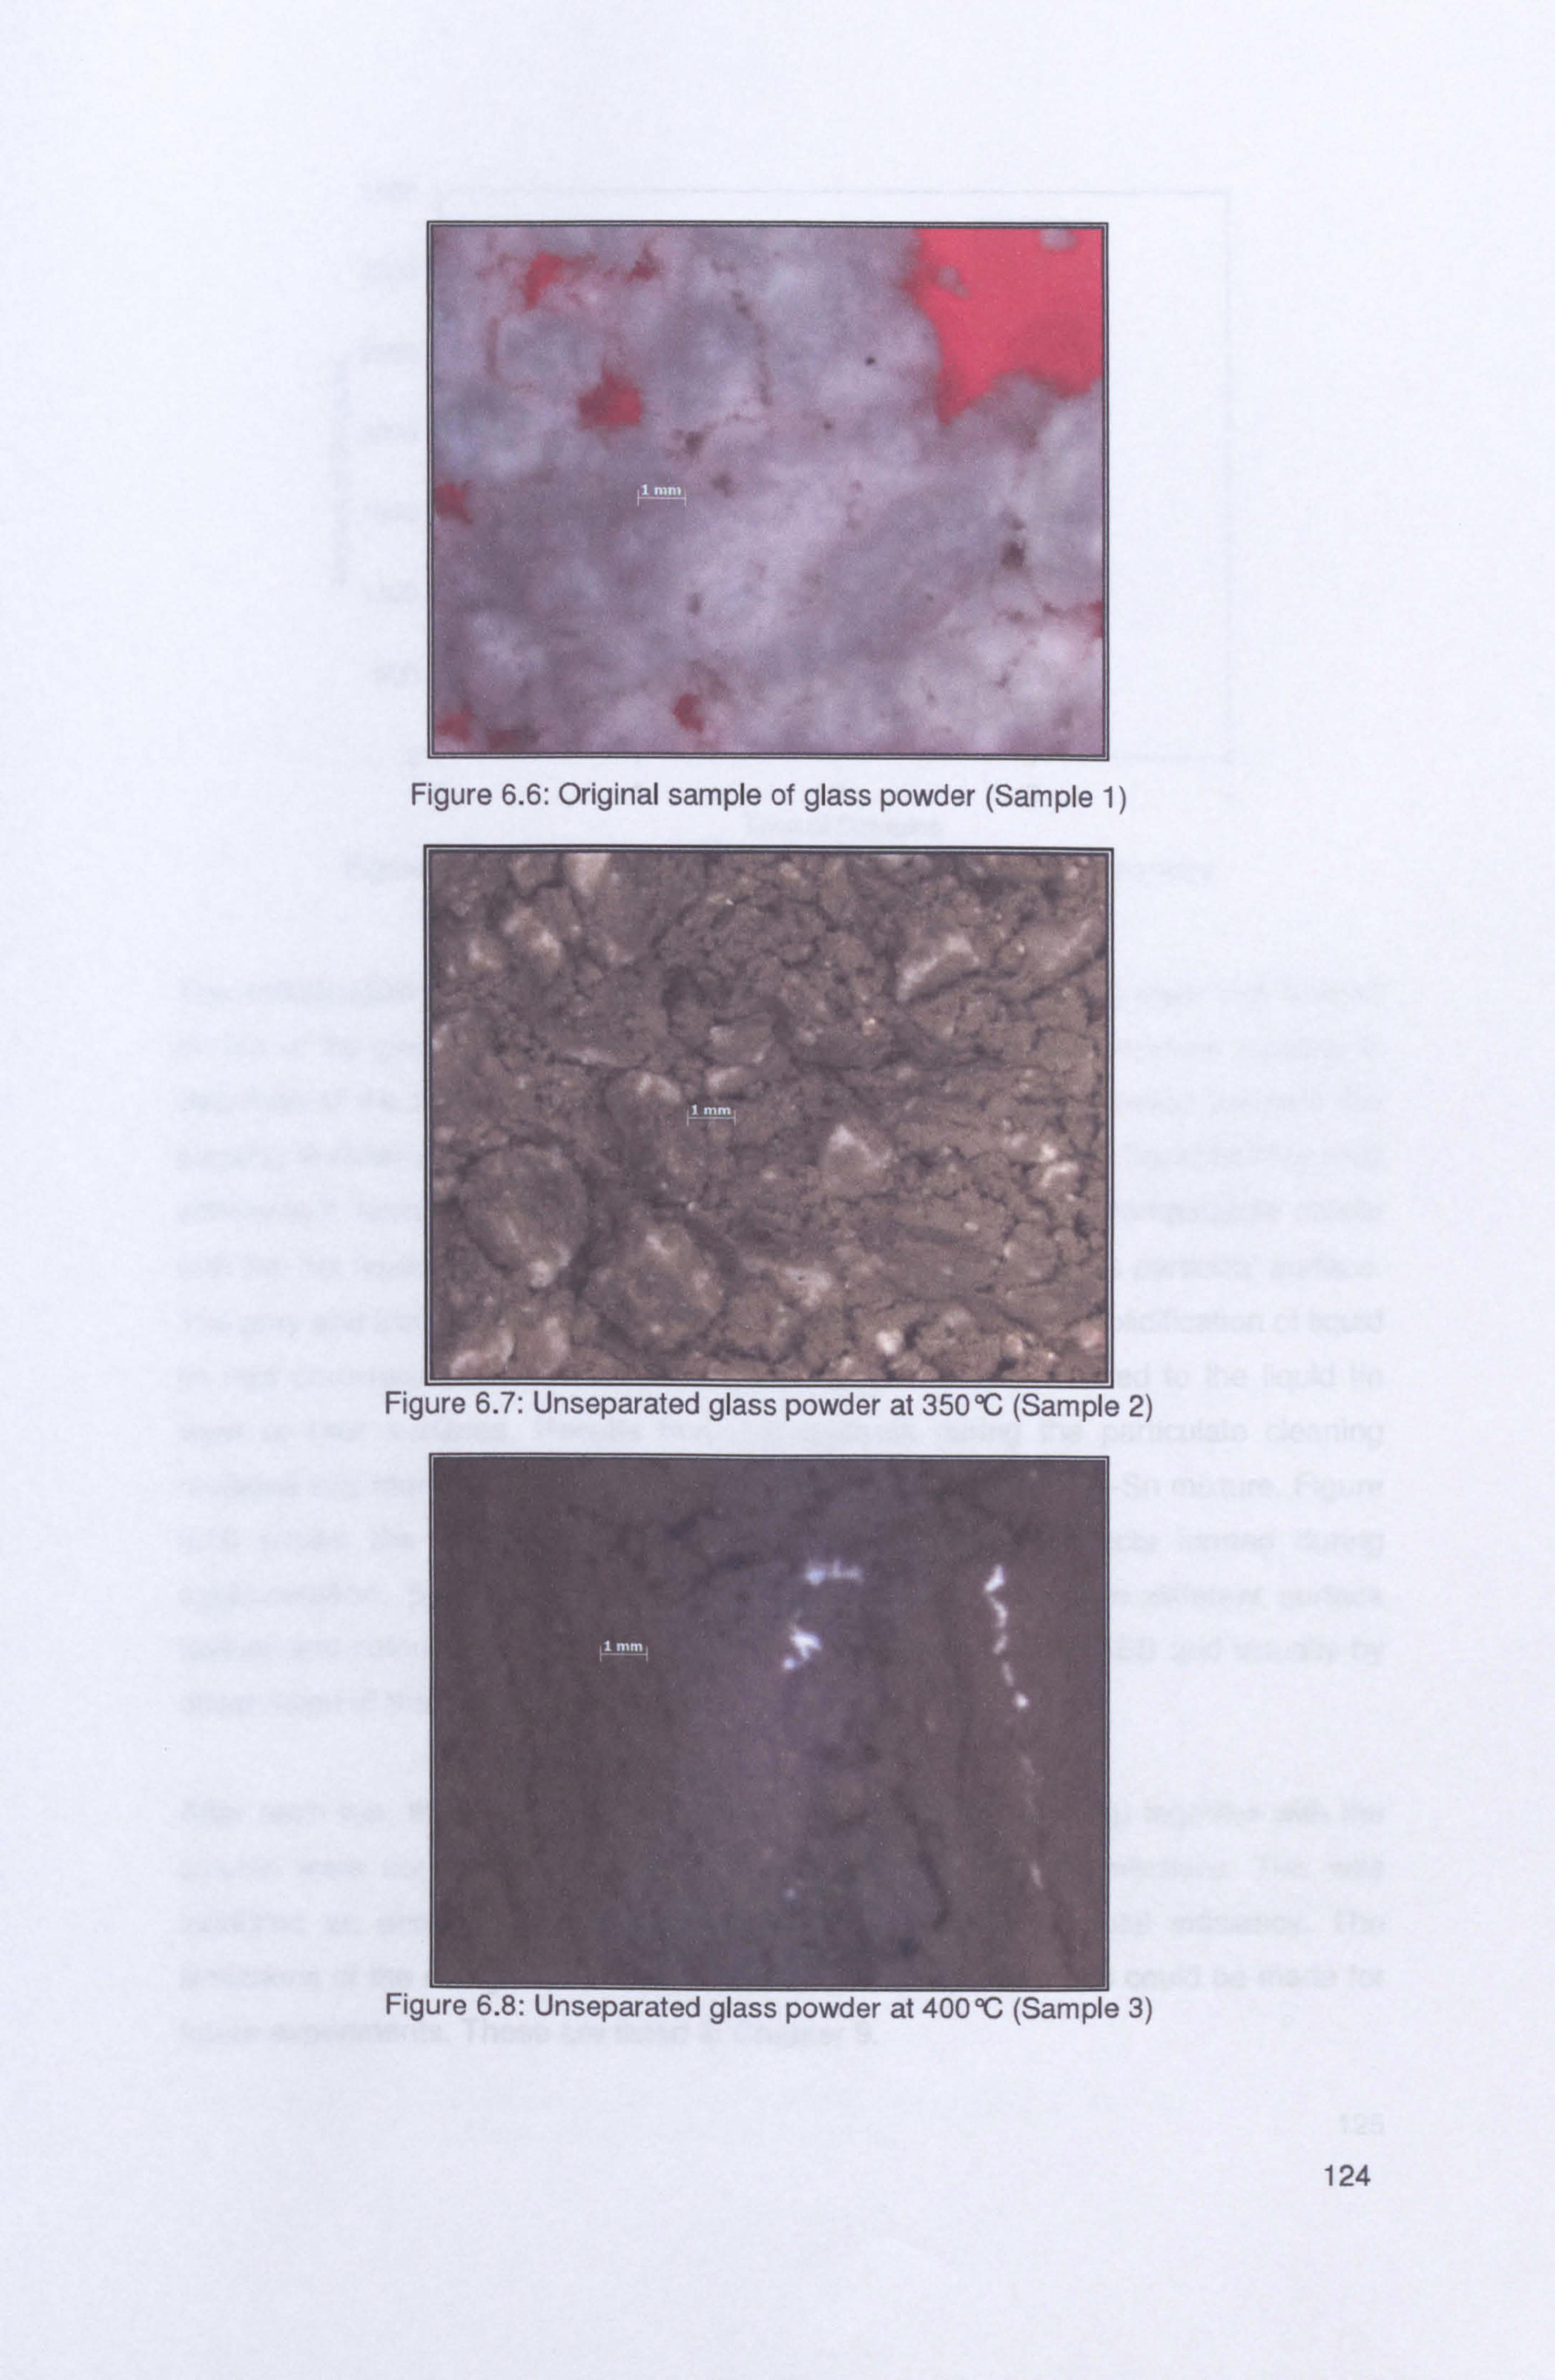
Fig 2)
Figure 6.8: Unseparated glass powder at 400°C (Sample 3)
124
Figure 6.6: Original sample of glass powder (Sample 1)

3500
3000
E 2500 a c 2000 U) ö
1500 0 E <1000
0
O Sn
500
01234 Type of Samples
Figure 6.9: Chemical analysis using Atomic Emission Spectrometry - Full element analysis
The solidification of Sn compounds was observed when a coating layer was formed
on top of the glass particle surfaces. The formation of the Sn-Si mixture resulted in
decrease of the total efficiency. The appearance of the agglomeration between the
packing is shown in Figure 6.10. When glass particles collide with liquid tin they may
adhere to it, forming agglomerates. When glass particles at lower temperature collide
with the hot liquid tin, the liquid tin will solidify and cover the glass particles' surface.
The grey and black colours of the mixture provide evidence that solidification of liquid
tin had occurred. In these tests, the glass particles either adhered to the liquid tin
layer or their surfaces. Results from the analysis during the particulate cleaning
revealed that there were agglomerated products, which were a Si-Sn mixture. Figure
6.10 shows the image of glass particles and solid tin products formed during
agglomeration. Samples from both operating temperatures gave different surface
texture and colour. The presence of Sn was confirmed by ICP-AES and visually by
observation of the deposit on the filter paper.
After each run, the high-purity ceramic alumina spheres (packing) together with the
column were not cleaned due to time constraint and design limitations. This was identified as another contributing factor, which affected the total efficiency. The
limitations of the design were identified and further improvements could be made for
future experiments. These are listed in Chapter 9.
125

Figure 6.10: Accumulation of glass particles and solid tin in the packing material
6.1.3 Total Efficiency of Particulate Removal
There are essentially three material streams containing the dust particles pertaining
to the gas scrubber: the feed nitrogen gas stream containing the challenging dust
particles, the outlet nitrogen gas stream carrying the unseparated or penetrating dust
particles, and the outlet liquid tin stream that washes out the separated dust particles.
There is also an accumulation of dust particles within the packed bed that is not
washed out by the liquid tin. The material balance around the scrubber is as follows:
(6.1) `Lº1
jcoin,
x) `LPL ,Xw , s)+ (lº1 f6j')
Min (kg/s) corresponds to the dust in the feed air stream; Mc (kg/s) corresponds to the
sum of dust in the outlet liquid tin stream as well as the dust retained within the
packed bed. Mf (kg/s) corresponds to the dust in the exiting nitrogen gas stream. (OX is the mass fraction of particles at size x. The total efficiency ET is defined by the
following equation based on the mass flowrates of the feed dust Min (kg/s) and the
unseparated dust in the exit nitrogen gas stream Mf (kg/s).
ET=i-Mf (4.4)
Herein, the total efficiency of the scrubber is determined gravimetrically as follows:
ET 1- nut (6.2)
Min `V L
Where Mo, t = Mass of unseparated dust in exit air retained on filter (g) M1 = Mass of dust fed into scrubber (g)
126
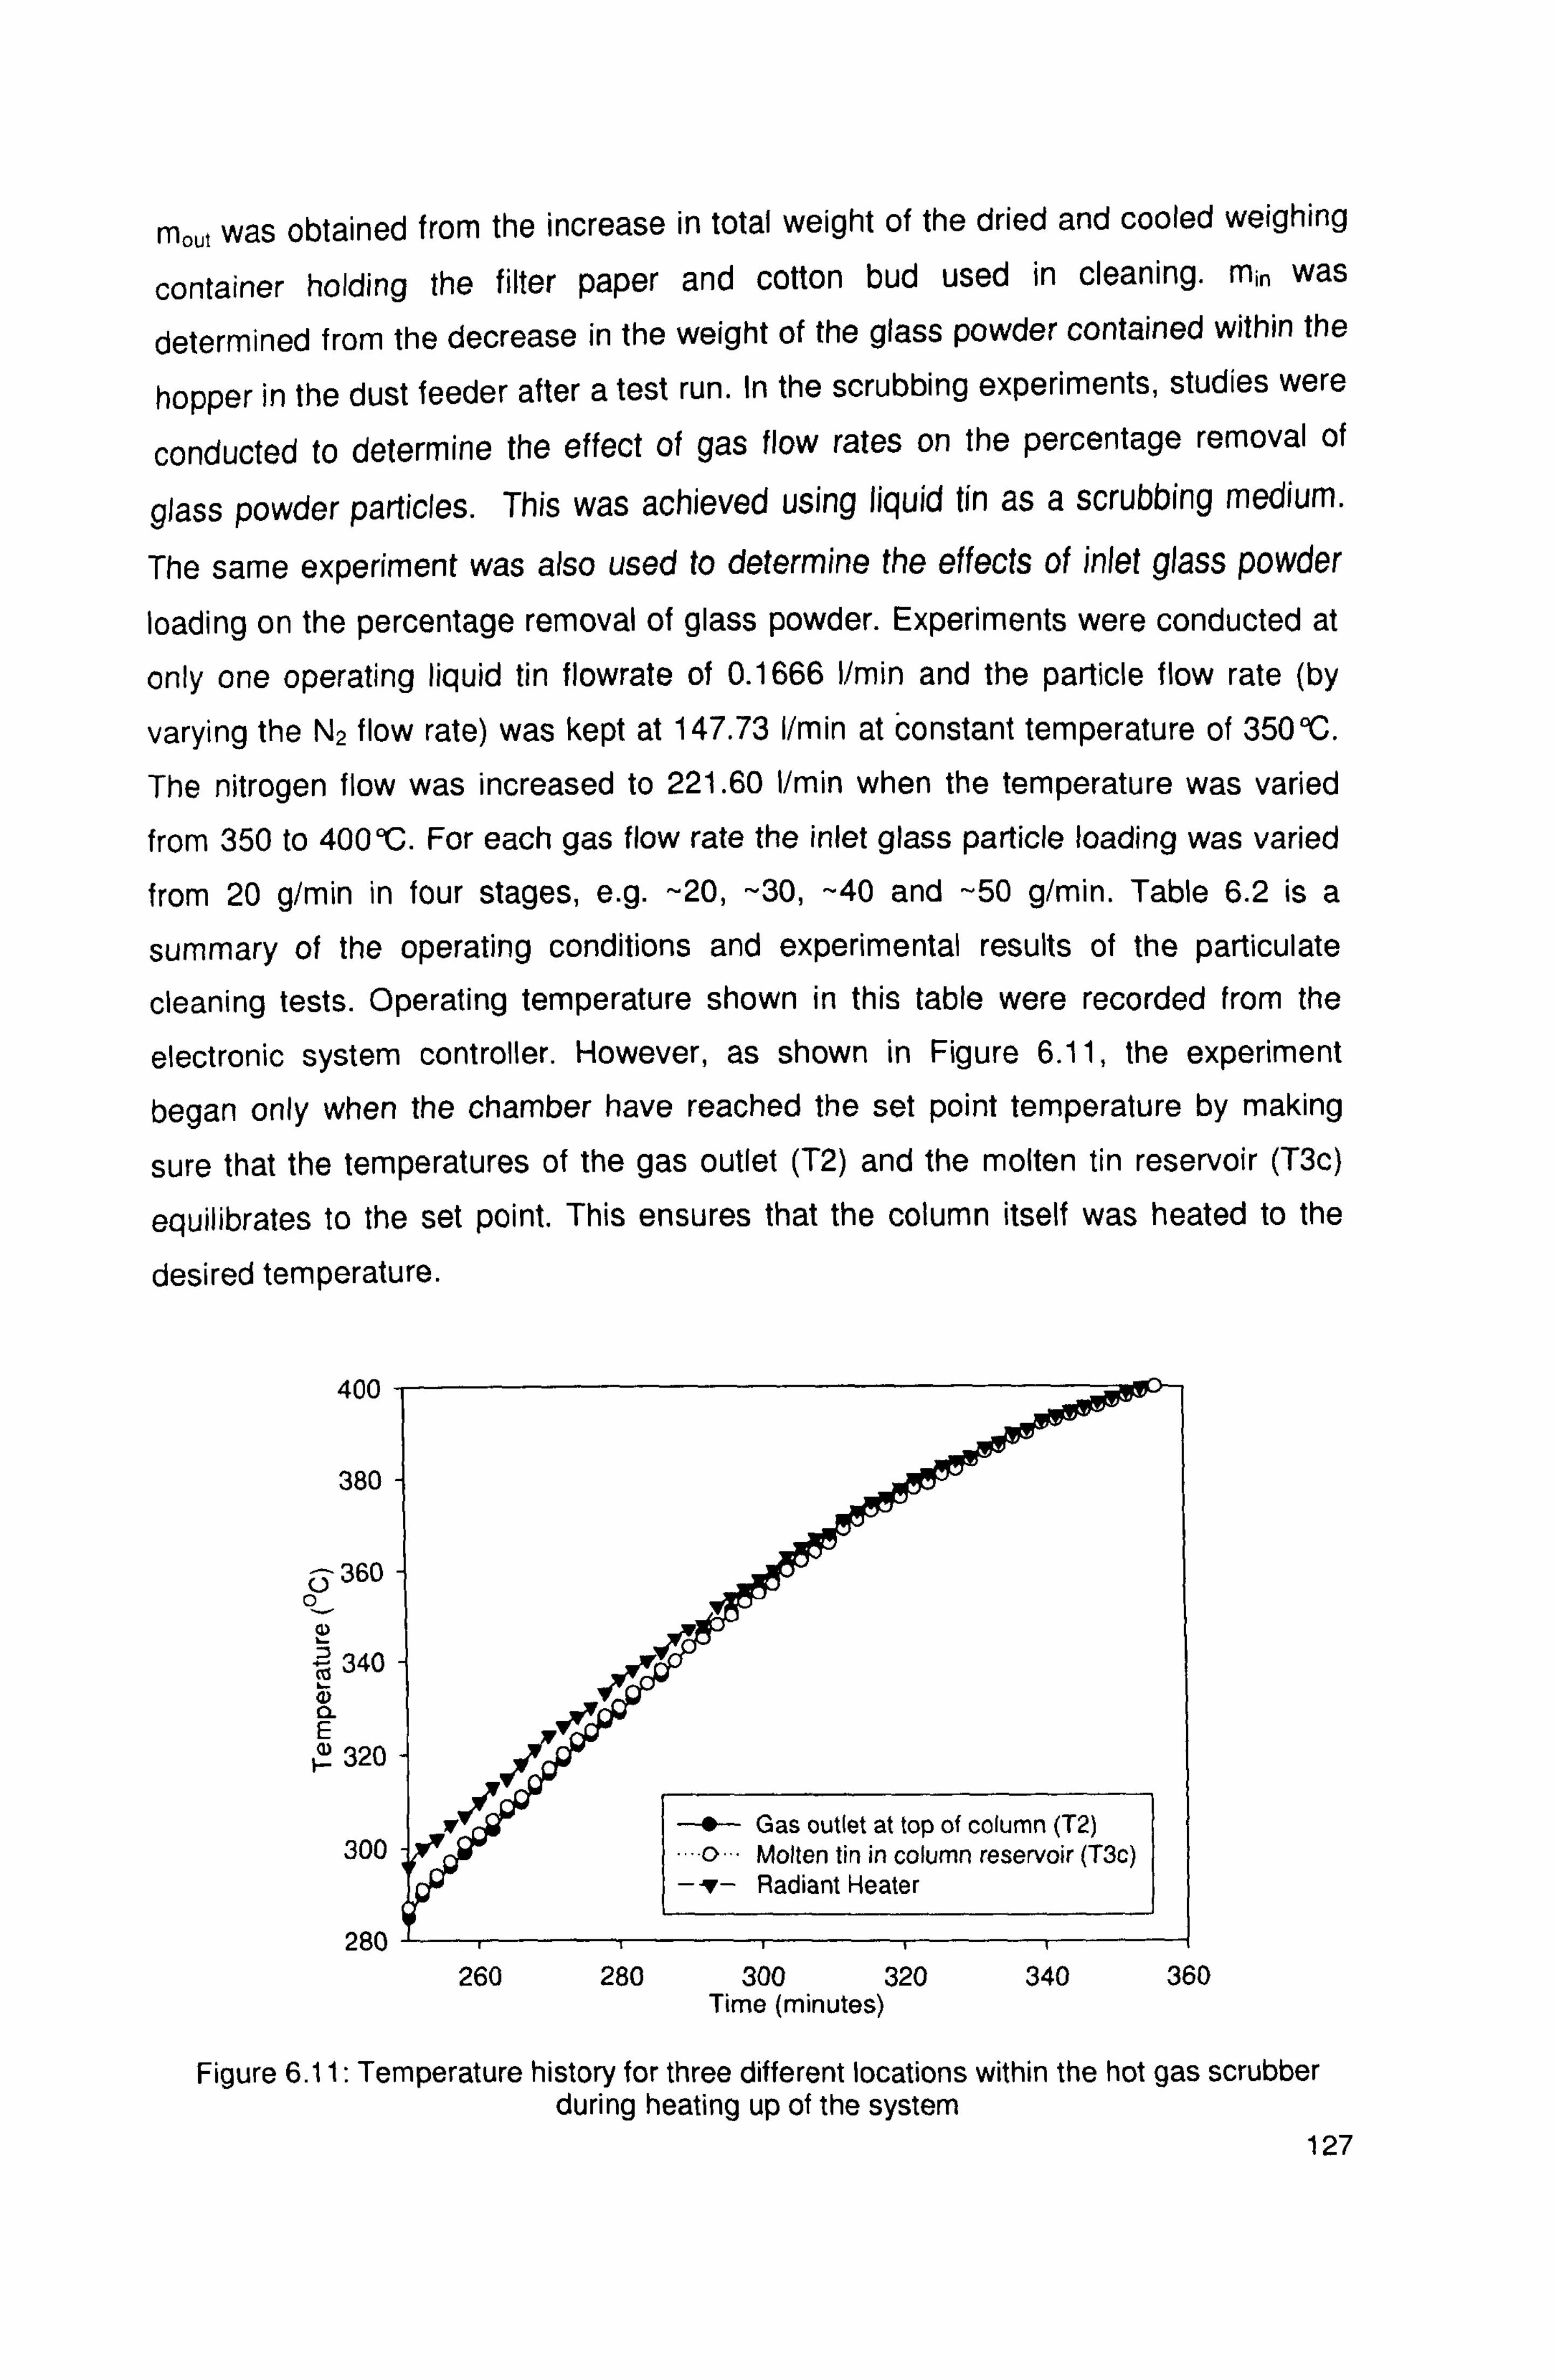
mo, t was obtained from the increase in total weight of the dried and cooled weighing
container holding the filter paper and cotton bud used in cleaning. Min was
determined from the decrease in the weight of the glass powder contained within the
hopper in the dust feeder after a test run. In the scrubbing experiments, studies were
conducted to determine the effect of gas flow rates on the percentage removal of
glass powder particles. This was achieved using liquid tin as a scrubbing medium.
The same experiment was also used to determine the effects of inlet glass powder
loading on the percentage removal of glass powder. Experiments were conducted at
only one operating liquid tin flowrate of 0.1666 I/min and the particle flow rate (by
varying the N2 flow rate) was kept at 147.73 I/min at constant temperature of 350°C.
The nitrogen flow was increased to 221.60 I/min when the temperature was varied
from 350 to 400°C. For each gas flow rate the inlet glass particle loading was varied
from 20 g/min in four stages, e. g. -20, -30, -40 and -50 g/min. Table 6.2 is a
summary of the operating conditions and experimental results of the particulate
cleaning tests. Operating temperature shown in this table were recorded from the
electronic system controller. However, as shown in Figure 6.11, the experiment
began only when the chamber have reached the set point temperature by making
sure that the temperatures of the gas outlet (T2) and the molten tin reservoir (T3c)
equilibrates to the set point. This ensures that the column itself was heated to the
desired temperature.
400
& 360
380
o_ 1:::
300
280
-- a- Gas outlet at top of column (T2) 0" Molten tin in column reservoir (T3c)
-1- Radiant Heater
260 280 300 320 340 360 Time (minutes)
Figure 6.11: Temperature history for three different locations within the hot gas scrubber during heating up of the system
127

Table 6.2: Experimental data for particulate cleaning Test No.
Operating Temperature
(CC)
Liquid Tin OL
(liter/min)
N2 GAG
(1/min)
Dust Inlet (9)
Dust Outlet
(g)
Splashed Tin (g)
(Average)
Total Efficiency ET (v °7%)
1a 350 0.1666 221.60 20.27 5.41 5.45 98.80 1b 350 0.1666 221.60 31.42 9.93 5.45 82.13 1c 350 0.1666 221.60 40.56 14.58 5.45 73.67 1d 350 0.1666 221.60 50.13 19.57 5.45 68.11
2a 350 0.1666 147.73 20.61 6.31 5.45 93.05 2b 350 0.1666 147.73 31.06 11.34 5.45 76.42
2c 350 0.1666 147.73 41.37 18.41 5.45 63.64 2d 350 0.1666 147.73 51.28 24.34 5.45 58.67 3a 400 0.1666 221.60 20.96 49.62 5.45 67.09 3b 400 0.1666 221.60 32.73 99.49 5.45 -76.81 3c 400 0.1666 221.60 39.26 125.56 5.45 -127.58 3d 400 0.1666 221.60 51.08 190.95 5.45 -203.86
6.1.3.1 Effect of Fluid Flowrates and Solid Loading
The liquid tin-irrigated packed bed scrubber demonstrated particulate removal
performance with total separation efficiencies ranging from 60 to 98%. These values
were taken only after the effect of splashed liquid tin on the filter paper was
considered. Comparisons between results from Chang (2003) on total efficiency ETota,
with various inlets loading of glass particles, and various operating and flow variables for the scrubber are shown in Figure 6.12. The total efficiency decreases as the inlet
dust flow rate increases. This low efficiency is due to the agglomeration of glass
particles and solid tin in the scrubber, which were described in the previous section. Several factors were identified which could account for differences observed between
results obtained by Chang (2003) and the results from this experiment. When the filtration started, the particles were captured by the bed material of the scrubber, and subsequently the attrition of the particles occurred. As time passes, the accumulation of particles increases, so a strong elutriation of finer particles occurs in the bed. This
phenomenon appears at various gas and liquid flow rates. The elutriation of the
captured particles affected the removal efficiency and the high collection efficiency
was limited when a strong elutriation occurred. Figure 6.12 also shows the effects of
solid loading, and as shown in this figure the increase in glass particle loading
decreases the percentage removal of the glass particles. Higher inlet loading hinders
particle collection in the packed bed column. This is because of the higher particle- particle interaction. It gives agglomeration of Si-Sn mixture and the packing itself.
128
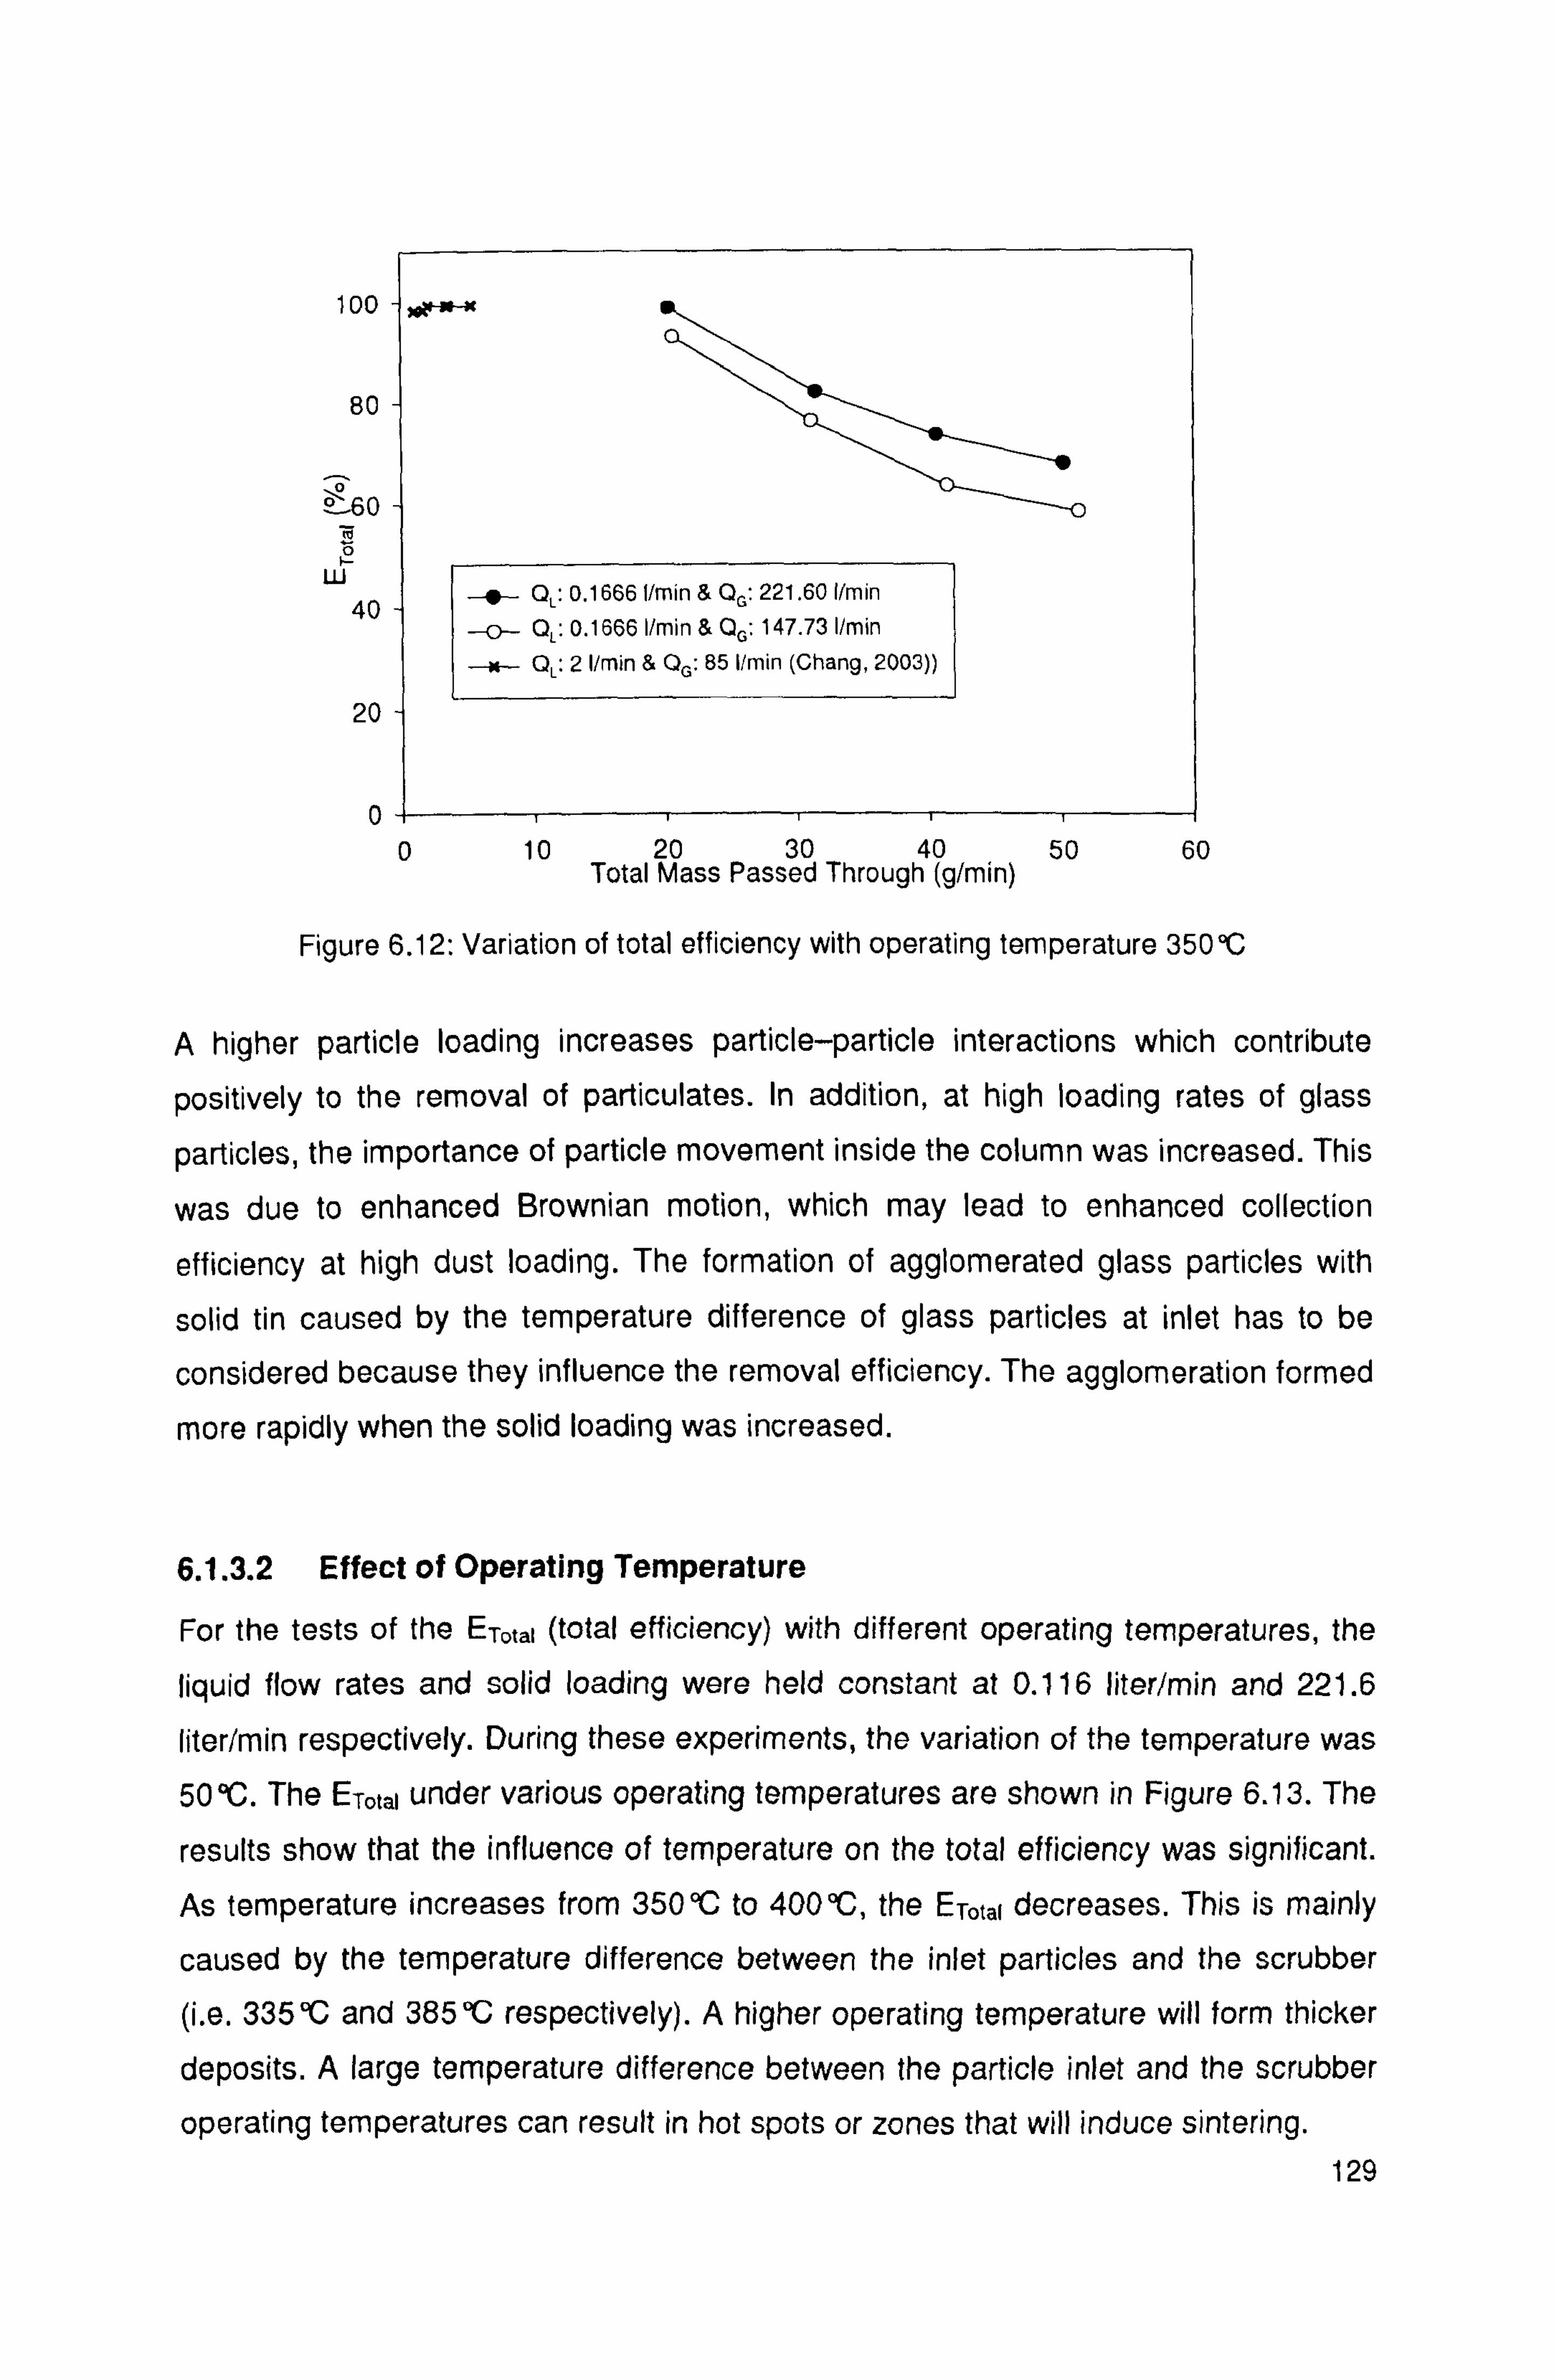
100
80
0 60 F 2
W
40
20
0
. -f- QL: 0.1666 I/min & QG: 221.601/min
--o-- QL: 0.1666 I/min & QG: 147.73 I/min
" QL: 2 I/min & QG: 65 I/min (Chang, 2003))
0 10 20 30 40 50 60 Total Mass Passed Through (g/min)
Figure 6.12: Variation of total efficiency with operating temperature 350°C
A higher particle loading increases particle-particle interactions which contribute
positively to the removal of particulates. In addition, at high loading rates of glass
particles, the importance of particle movement inside the column was increased. This
was due to enhanced Brownian motion, which may lead to enhanced collection
efficiency at high dust loading. The formation of agglomerated glass particles with
solid tin caused by the temperature difference of glass particles at inlet has to be
considered because they influence the removal efficiency. The agglomeration formed
more rapidly when the solid loading was increased.
6.1.3.2 Effect of Operating Temperature
For the tests of the ETota, (total efficiency) with different operating temperatures, the
liquid flow rates and solid loading were held constant at 0.116 liter/min and 221.6
liter/min respectively. During these experiments, the variation of the temperature was
500C. The ETotal under various operating temperatures are shown in Figure 6.13. The
results show that the influence of temperature on the total efficiency was significant. As temperature increases from 3500C to 4000C, the ETotai decreases. This is mainly
caused by the temperature difference between the inlet particles and the scrubber (i. e. 335 °C and 385 °C respectively). A higher operating temperature will form thicker
deposits. A large temperature difference between the particle inlet and the scrubber
operating temperatures can result in hot spots or zones that will induce sintering. 129
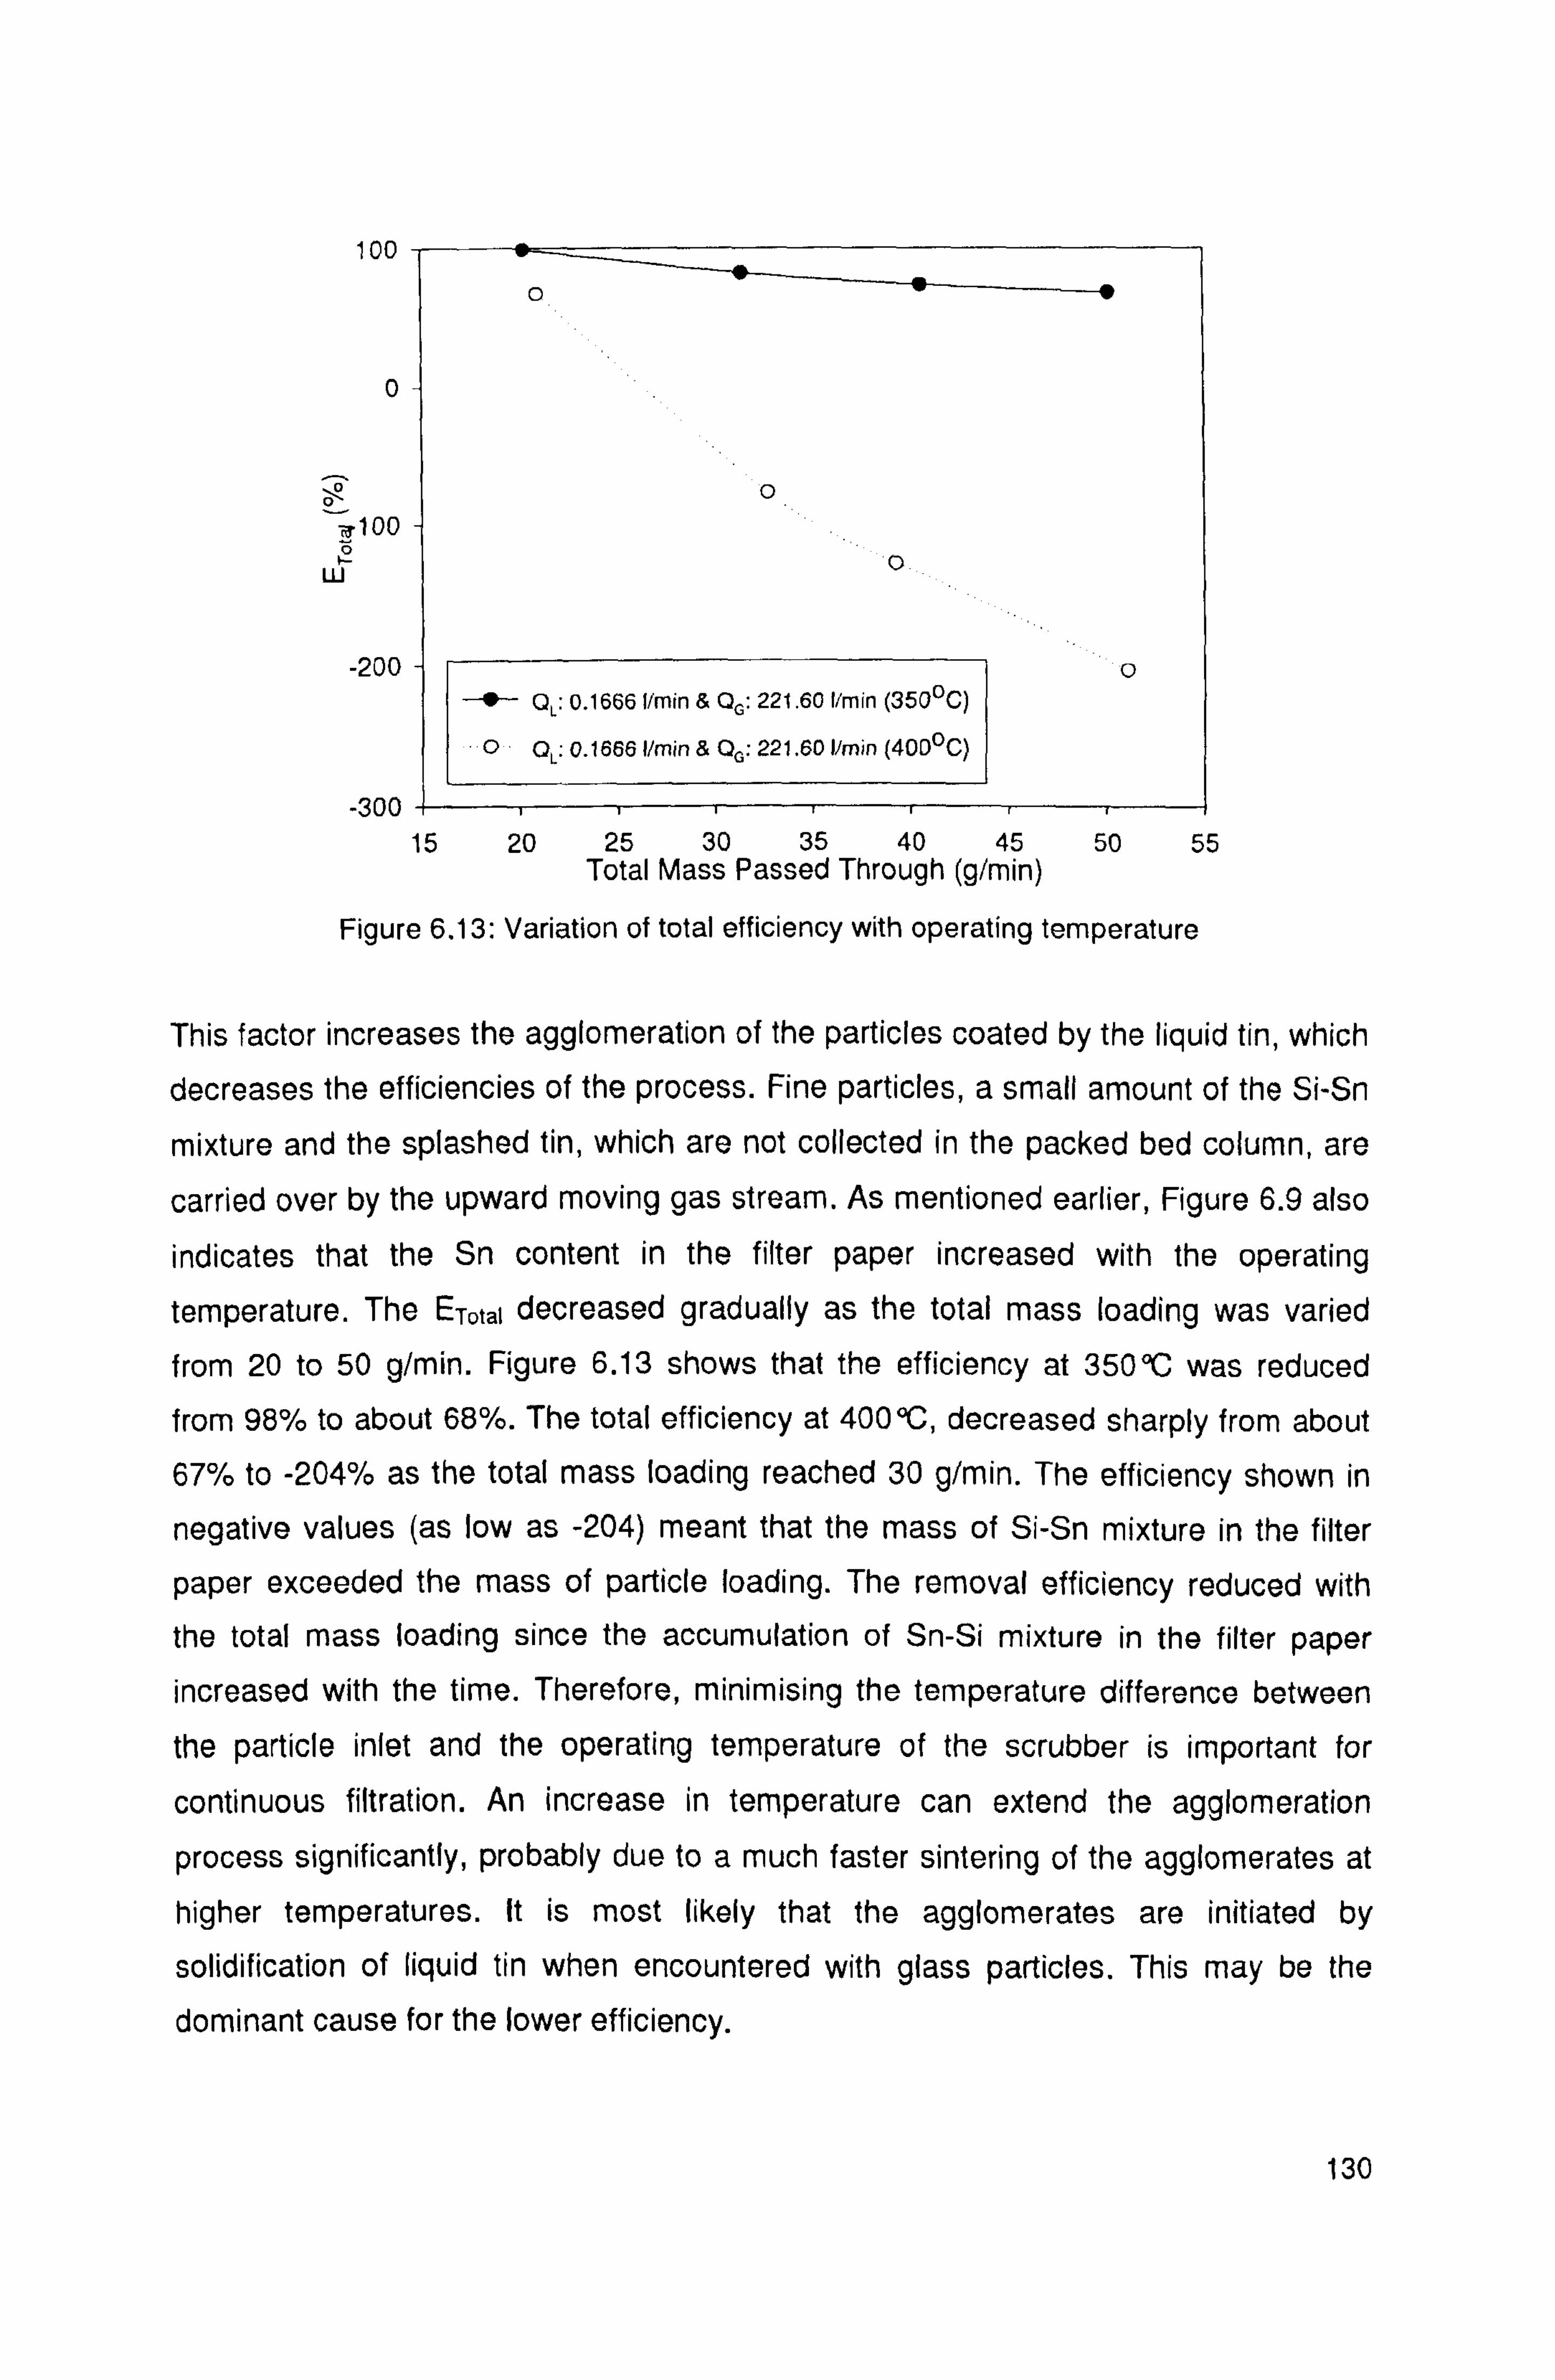
100
0
0
X100 s w
-200
-300
0
0
0 t QL: 0.16661/min & QG: 221.60 Vmin (3500C)
00L: 0.1666 I/min & QG: 221.60 I/min (400OC)
15 20 25 30 35 40 45 50 55 Total Mass Passed Through (g/min)
Figure 6.13: Variation of total efficiency with operating temperature
This factor increases the agglomeration of the particles coated by the liquid tin, which decreases the efficiencies of the process. Fine particles, a small amount of the Si-Sn
mixture and the splashed tin, which are not collected in the packed bed column, are
carried over by the upward moving gas stream. As mentioned earlier, Figure 6.9 also
indicates that the Sn content in the filter paper increased with the operating
temperature. The ETotai decreased gradually as the total mass loading was varied
from 20 to 50 g/min. Figure 6.13 shows that the efficiency at 350°C was reduced
from 98% to about 68%. The total efficiency at 4001C, decreased sharply from about
67% to -204% as the total mass loading reached 30 g/min. The efficiency shown in
negative values (as low as -204) meant that the mass of Si-Sn mixture in the filter
paper exceeded the mass of particle loading. The removal efficiency reduced with
the total mass loading since the accumulation of Sn-Si mixture in the filter paper
increased with the time. Therefore, minimising the temperature difference between
the particle inlet and the operating temperature of the scrubber is important for
continuous filtration. An increase in temperature can extend the agglomeration
process significantly, probably due to a much faster sintering of the agglomerates at
higher temperatures. It is most likely that the agglomerates are initiated by
solidification of liquid tin when encountered with glass particles. This may be the
dominant cause for the lower efficiency.
130
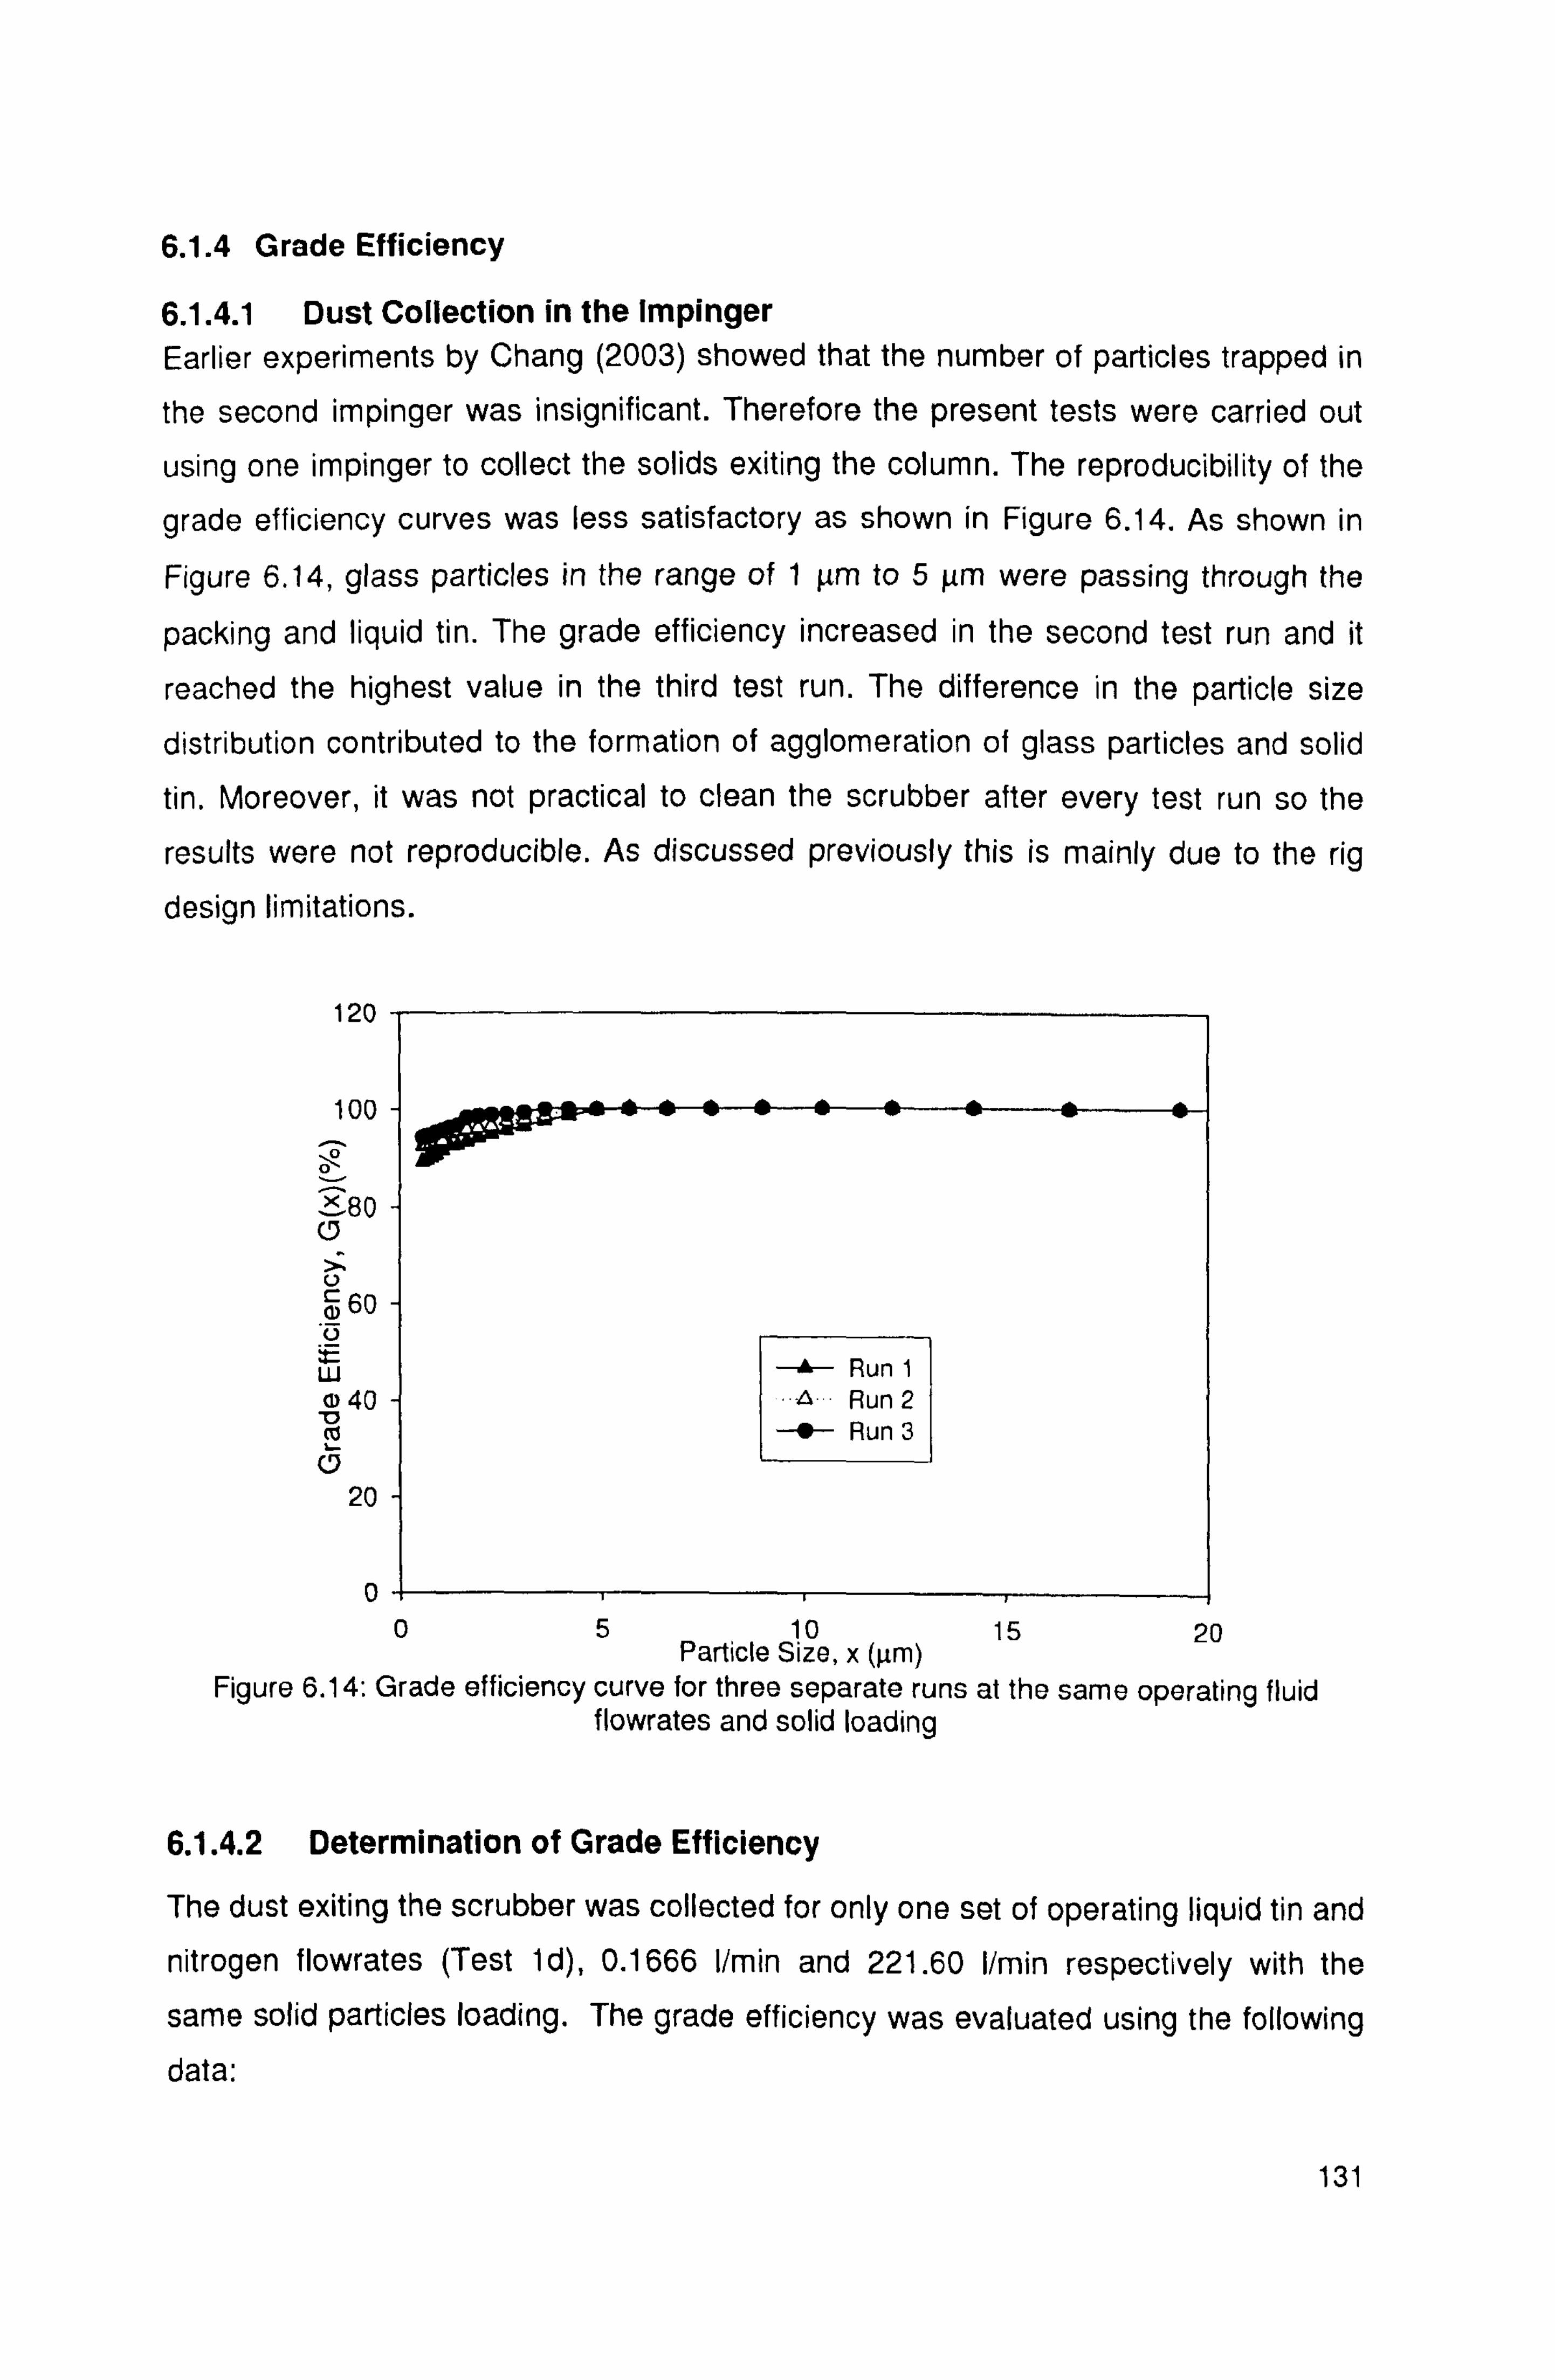
6.1.4 Grade Efficiency
6.1.4.1 Dust Collection in the Impinger Earlier experiments by Chang (2003) showed that the number of particles trapped in
the second impinger was insignificant. Therefore the present tests were carried out
using one impinger to collect the solids exiting the column. The reproducibility of the
grade efficiency curves was less satisfactory as shown in Figure 6.14. As shown in
Figure 6.14, glass particles in the range of 1 µm to 5µm were passing through the
packing and liquid tin. The grade efficiency increased in the second test run and it
reached the highest value in the third test run. The difference in the particle size
distribution contributed to the formation of agglomeration of glass particles and solid
tin. Moreover, it was not practical to clean the scrubber after every test run so the
results were not reproducible. As discussed previously this is mainly due to the rig
design limitations.
120
100
0 -80 a
v 60
ý
W aý 40 co 0
20
0
Run 1 Run 2
-0- Run 3
05 10 Particle Size, x (µm)
15 20
Figure 6.14: Grade efficiency curve for three separate runs at the same operating fluid flowrates and solid loading
6.1.4.2 Determination of Grade Efficiency
The dust exiting the scrubber was collected for only one set of operating liquid tin and
nitrogen flowrates (Test 1d), 0.1666 1/min and 221.60 I/min respectively with the
same solid particles loading. The grade efficiency was evaluated using the following
data:
131

� Particle size distribution of dust at inlet (i. e. the original glass powder)
� Particle size distribution of dust at outlet (i. e. collected in the impinger)
The grade efficiency was calculated using the following equation:
G (x)=1 A -ET)C/(6.3) w,,..,
Where = Mass fraction of dust fed into scrubber at particle size x woU, x=
Mass fraction of unseparated dust in exit nitrogen gas retained in impinger at particle size x
The comparison of grade efficiency was not carried out since it was not possible to
reproduce the results at the same operating conditions. This was due to the
formation of agglomerates in the column. This is because the particles collected in
the impinger cannot represent the same total collection efficiency ET corresponding to the same liquid flow rates and inlet solid loading. In Figure 6.15, the grade
efficiency curves show that glass particles larger than about 5 pm can be separated
at efficiencies greater than 98°I°.
120
100
0 v80 C7 U
60
W 40 g
cb C3
20
0
--; -- Qu: 0.1666 Vmin & QG: 221.60 I/min
o QL: 0.1666 1/min & Q0: 147.73 I/min
05 10 15 20 Particle Size, x (µm)
Figure 6.15: Grade efficiency curve for three separate runs at the same operating fluids flowrates and solid loading (Test 1d and 2d)
132
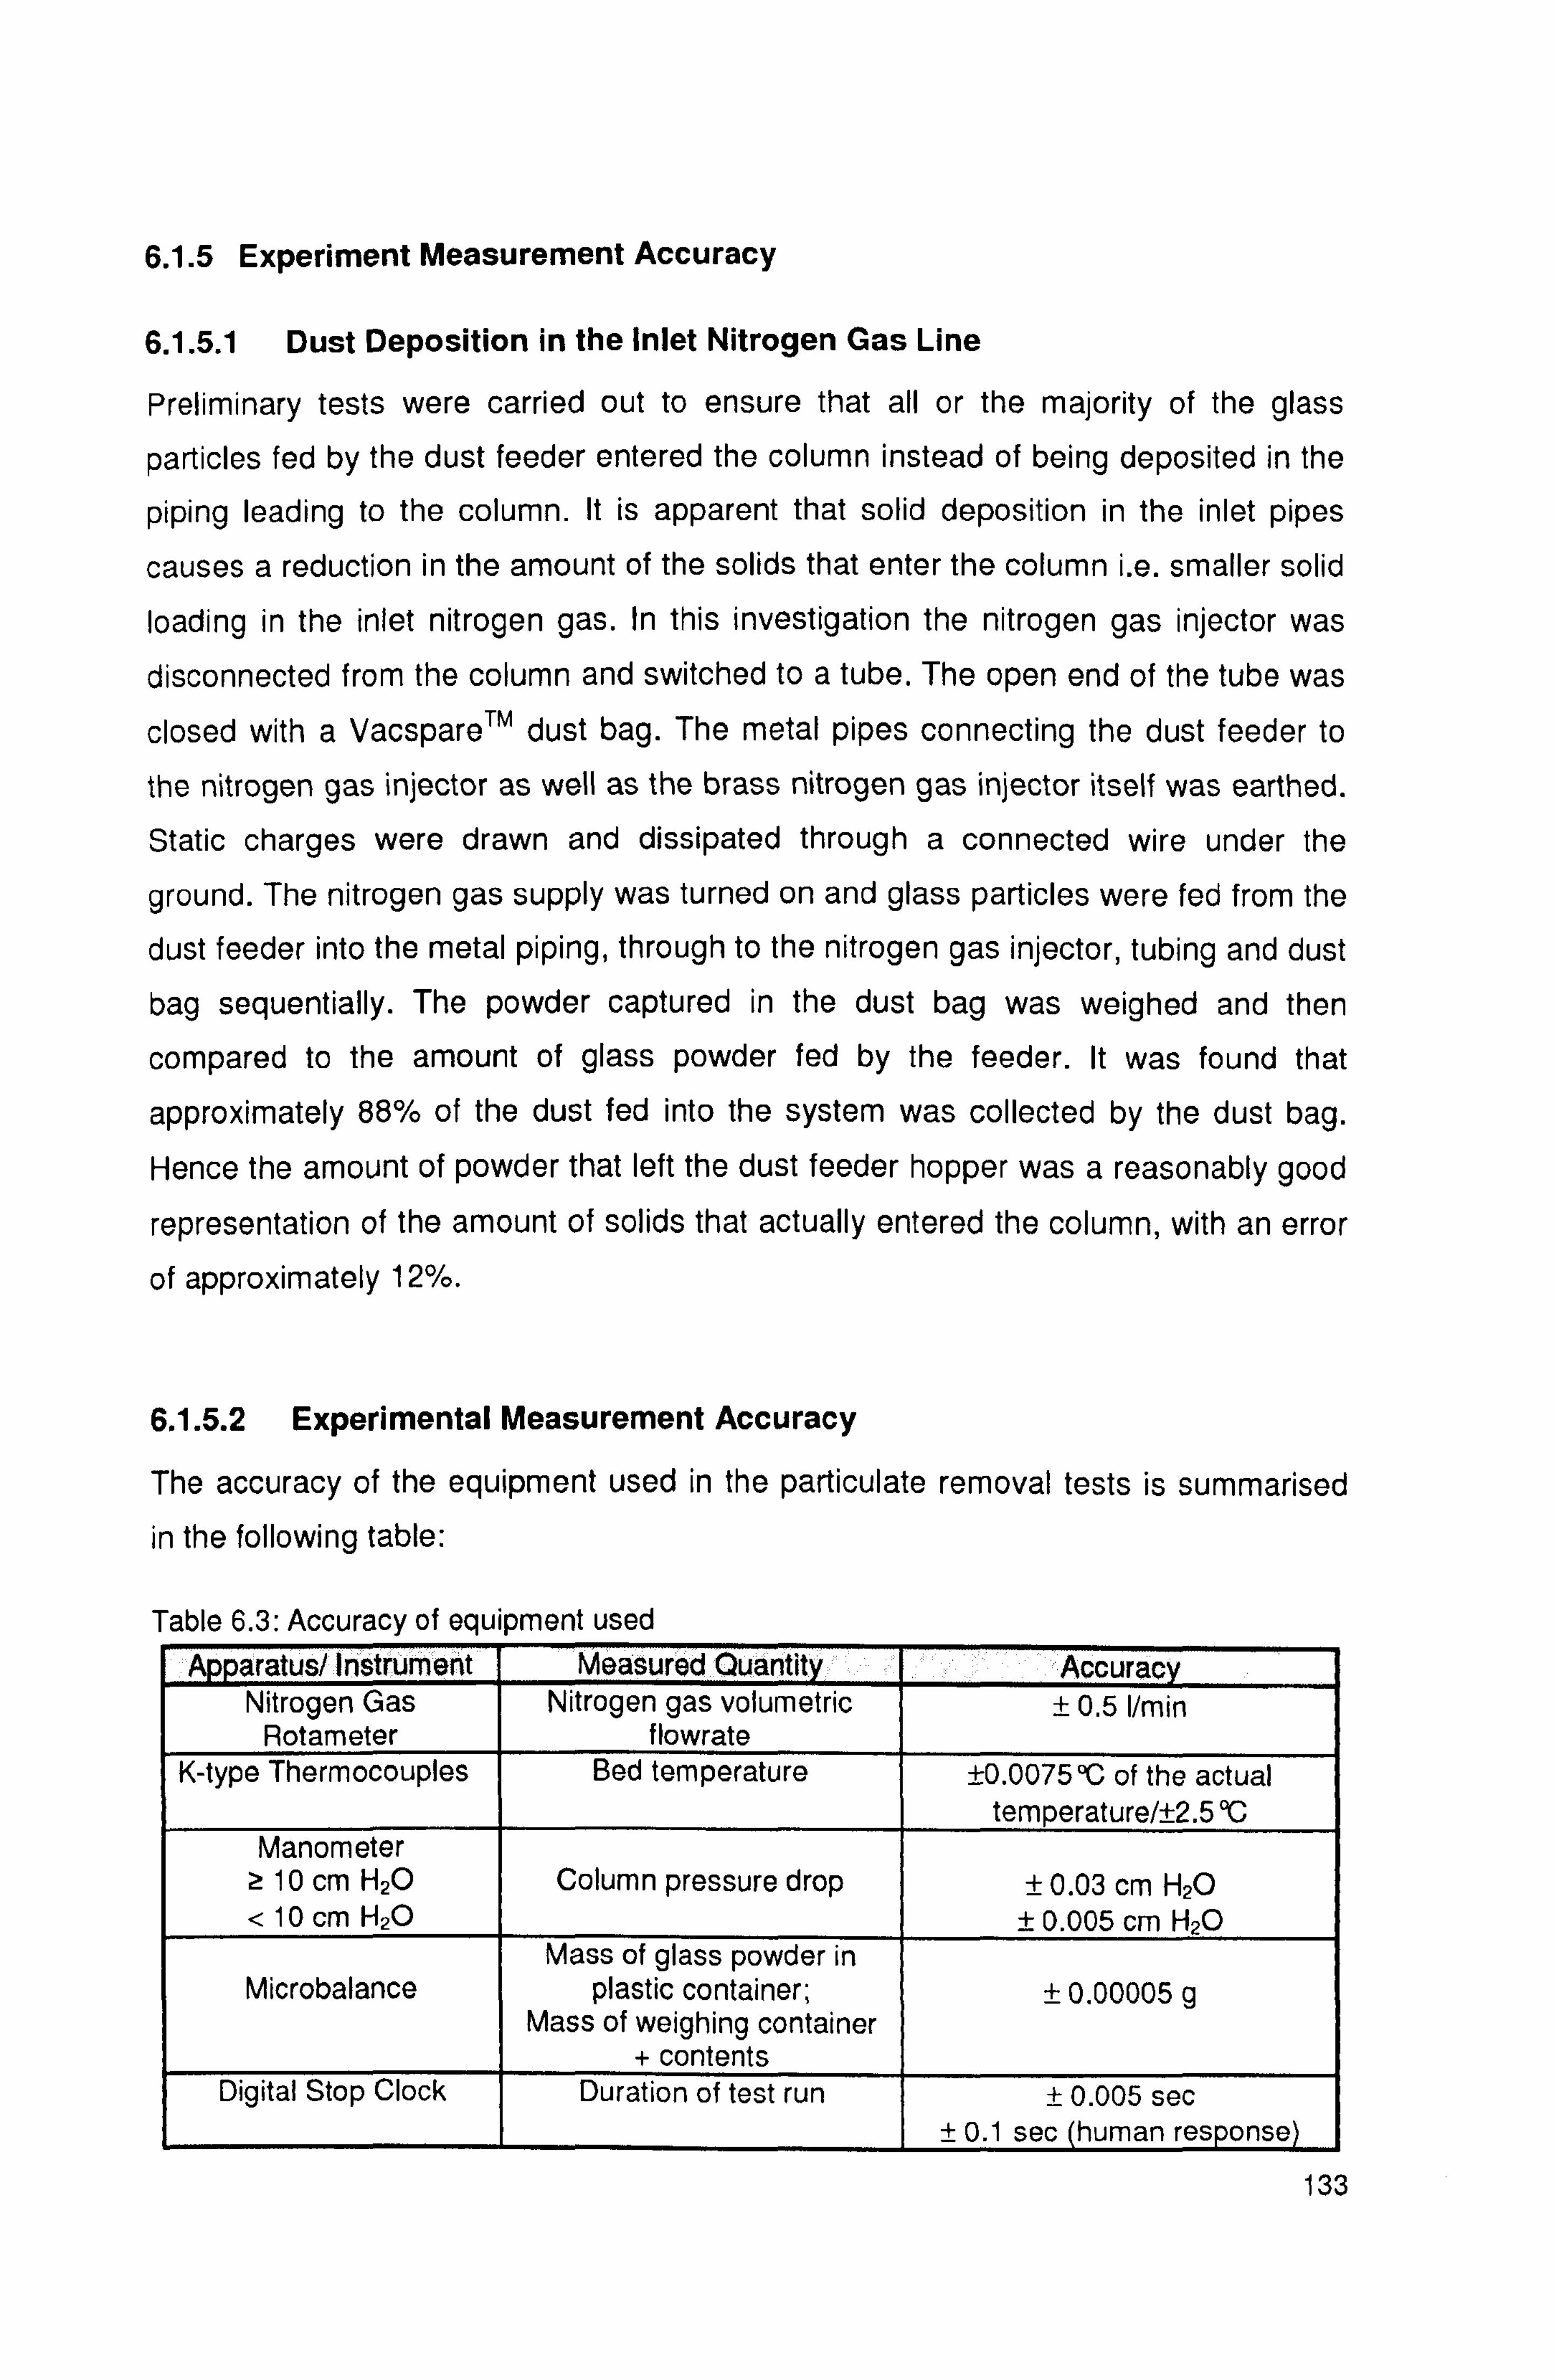
6.1.5 Experiment Measurement Accuracy
6.1.5.1 Dust Deposition in the Inlet Nitrogen Gas Line
Preliminary tests were carried out to ensure that all or the majority of the glass
particles fed by the dust feeder entered the column instead of being deposited in the
piping leading to the column. It is apparent that solid deposition in the inlet pipes
causes a reduction in the amount of the solids that enter the column i. e. smaller solid
loading in the inlet nitrogen gas. In this investigation the nitrogen gas injector was
disconnected from the column and switched to a tube. The open end of the tube was
closed with a VacspareTM dust bag. The metal pipes connecting the dust feeder to
the nitrogen gas injector as well as the brass nitrogen gas injector itself was earthed.
Static charges were drawn and dissipated through a connected wire under the
ground. The nitrogen gas supply was turned on and glass particles were fed from the
dust feeder into the metal piping, through to the nitrogen gas injector, tubing and dust
bag sequentially. The powder captured in the dust bag was weighed and then
compared to the amount of glass powder fed by the feeder. It was found that
approximately 88% of the dust fed into the system was collected by the dust bag.
Hence the amount of powder that left the dust feeder hopper was a reasonably good
representation of the amount of solids that actually entered the column, with an error
of approximately 12%.
6.1.5.2 Experimental Measurement Accuracy
The accuracy of the equipment used in the particulate removal tests is summarised in the following table:
Table 6.3: Accuracy of equipment used Apparatus/ Instrument Measured Quantity Accuracy
Nitrogen Gas Nitrogen gas volumetric ± 0.5 I/min Rotameter flowrate
K-type Thermocouples Bed temperature ±0.0075°C of the actual temperature/±2.5 °C
Manometer z 10 cm H2O Column pressure drop ± 0.03 cm H2O < 10 cm H2O ± 0.005 cm H2O
Mass of glass powder in Microbalance plastic container; ± 0.00005 g
Mass of weighing container + contents
Digital Stop Clock Duration of test run ± 0.005 sec ± 0.1 sec (human response)
133
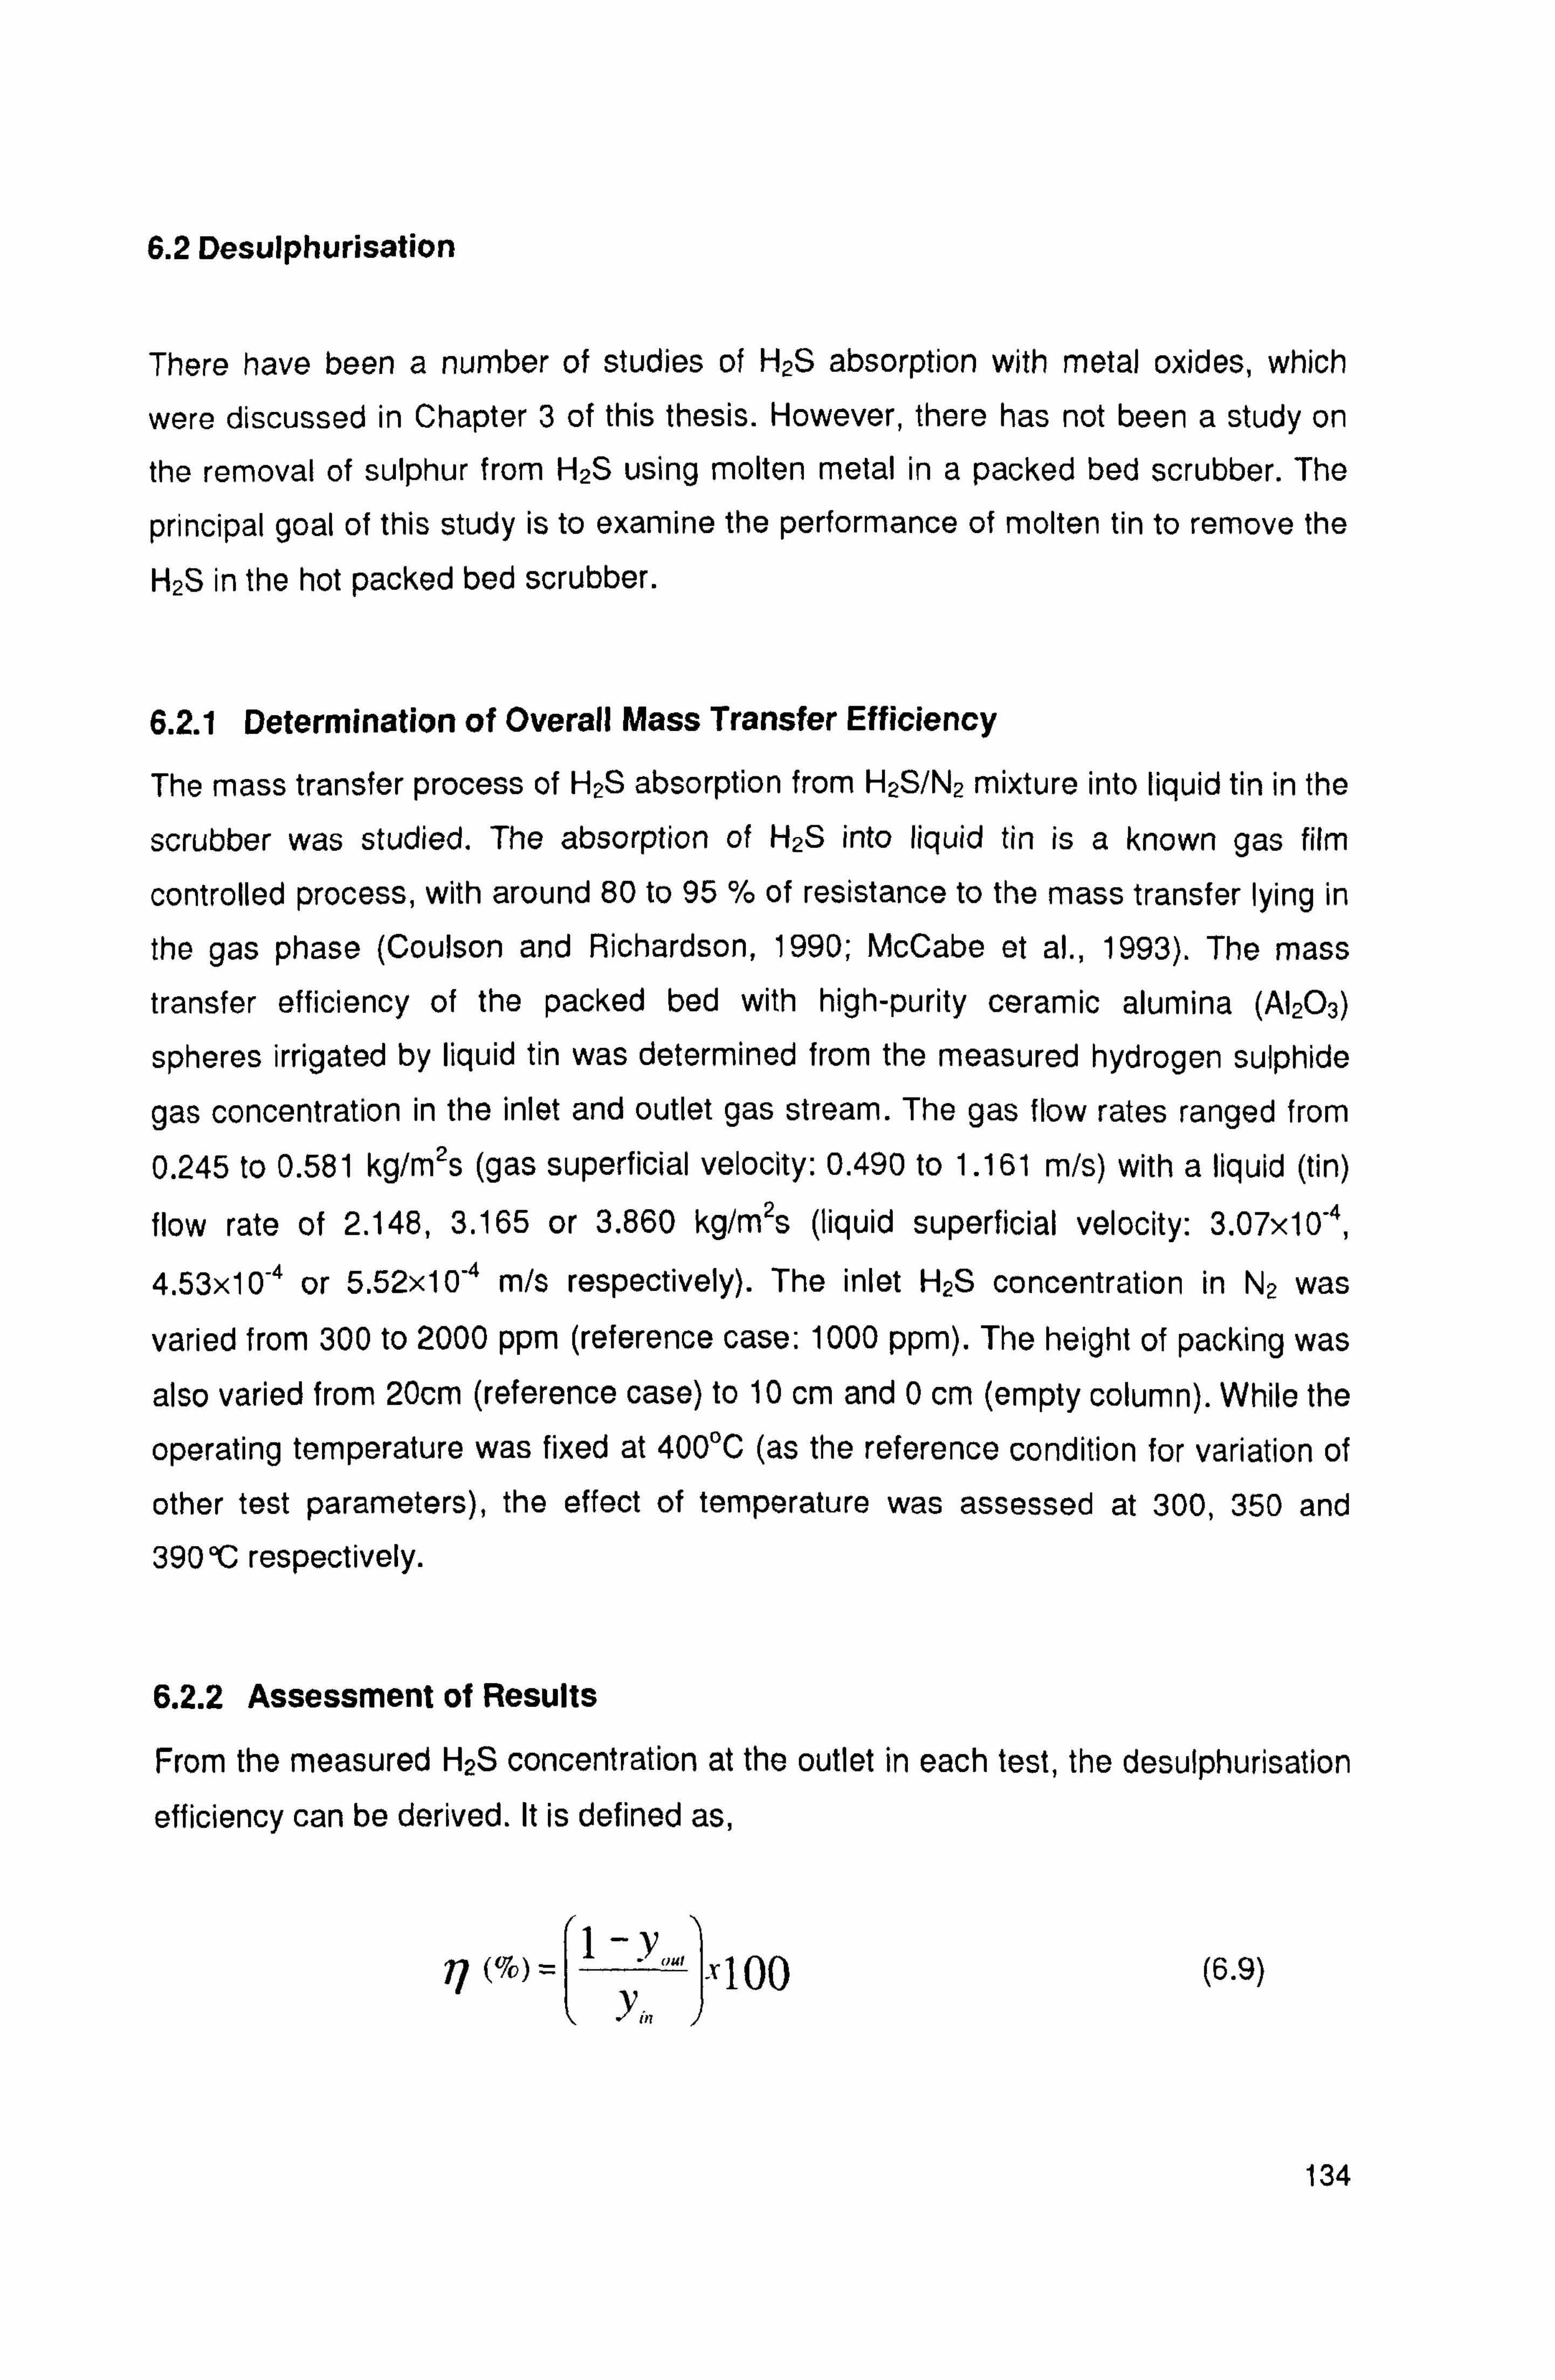
6.2 Desulphurisation
There have been a number of studies of H2S absorption with metal oxides, which
were discussed in Chapter 3 of this thesis. However, there has not been a study on
the removal of sulphur from H2S using molten metal in a packed bed scrubber. The
principal goal of this study is to examine the performance of molten tin to remove the
H2S in the hot packed bed scrubber.
6.2.1 Determination of Overall Mass Transfer Efficiency
The mass transfer process of H2S absorption from H2S/N2 mixture into liquid tin in the
scrubber was studied. The absorption of H2S into liquid tin is a known gas film
controlled process, with around 80 to 95 % of resistance to the mass transfer lying in
the gas phase (Coulson and Richardson, 1990; McCabe et al., 1993). The mass
transfer efficiency of the packed bed with high-purity ceramic alumina (A1203)
spheres irrigated by liquid tin was determined from the measured hydrogen sulphide
gas concentration in the inlet and outlet gas stream. The gas flow rates ranged from
0.245 to 0.581 kg/m2s (gas superficial velocity: 0.490 to 1.161 m/s) with a liquid (tin)
flow rate of 2.148,3.165 or 3.860 kg/m2s (liquid superficial velocity: 3.07x10"4,
4.53x10⁻⁴ or 5.52x10"4 m/s respectively). The inlet H2S concentration in N2 was
varied from 300 to 2000 ppm (reference case: 1000 ppm). The height of packing was
also varied from 20cm (reference case) to 10 cm and 0 cm (empty column). While the
operating temperature was fixed at 400°C (as the reference condition for variation of
other test parameters), the effect of temperature was assessed at 300,350 and 390 °C respectively.
6.2.2 Assessment of Results
From the measured H2S concentration at the outlet in each test, the desulphurisation
efficiency can be derived. It is defined as,
/(%)= 1-Y',
. x100 (6.9) Yin
134
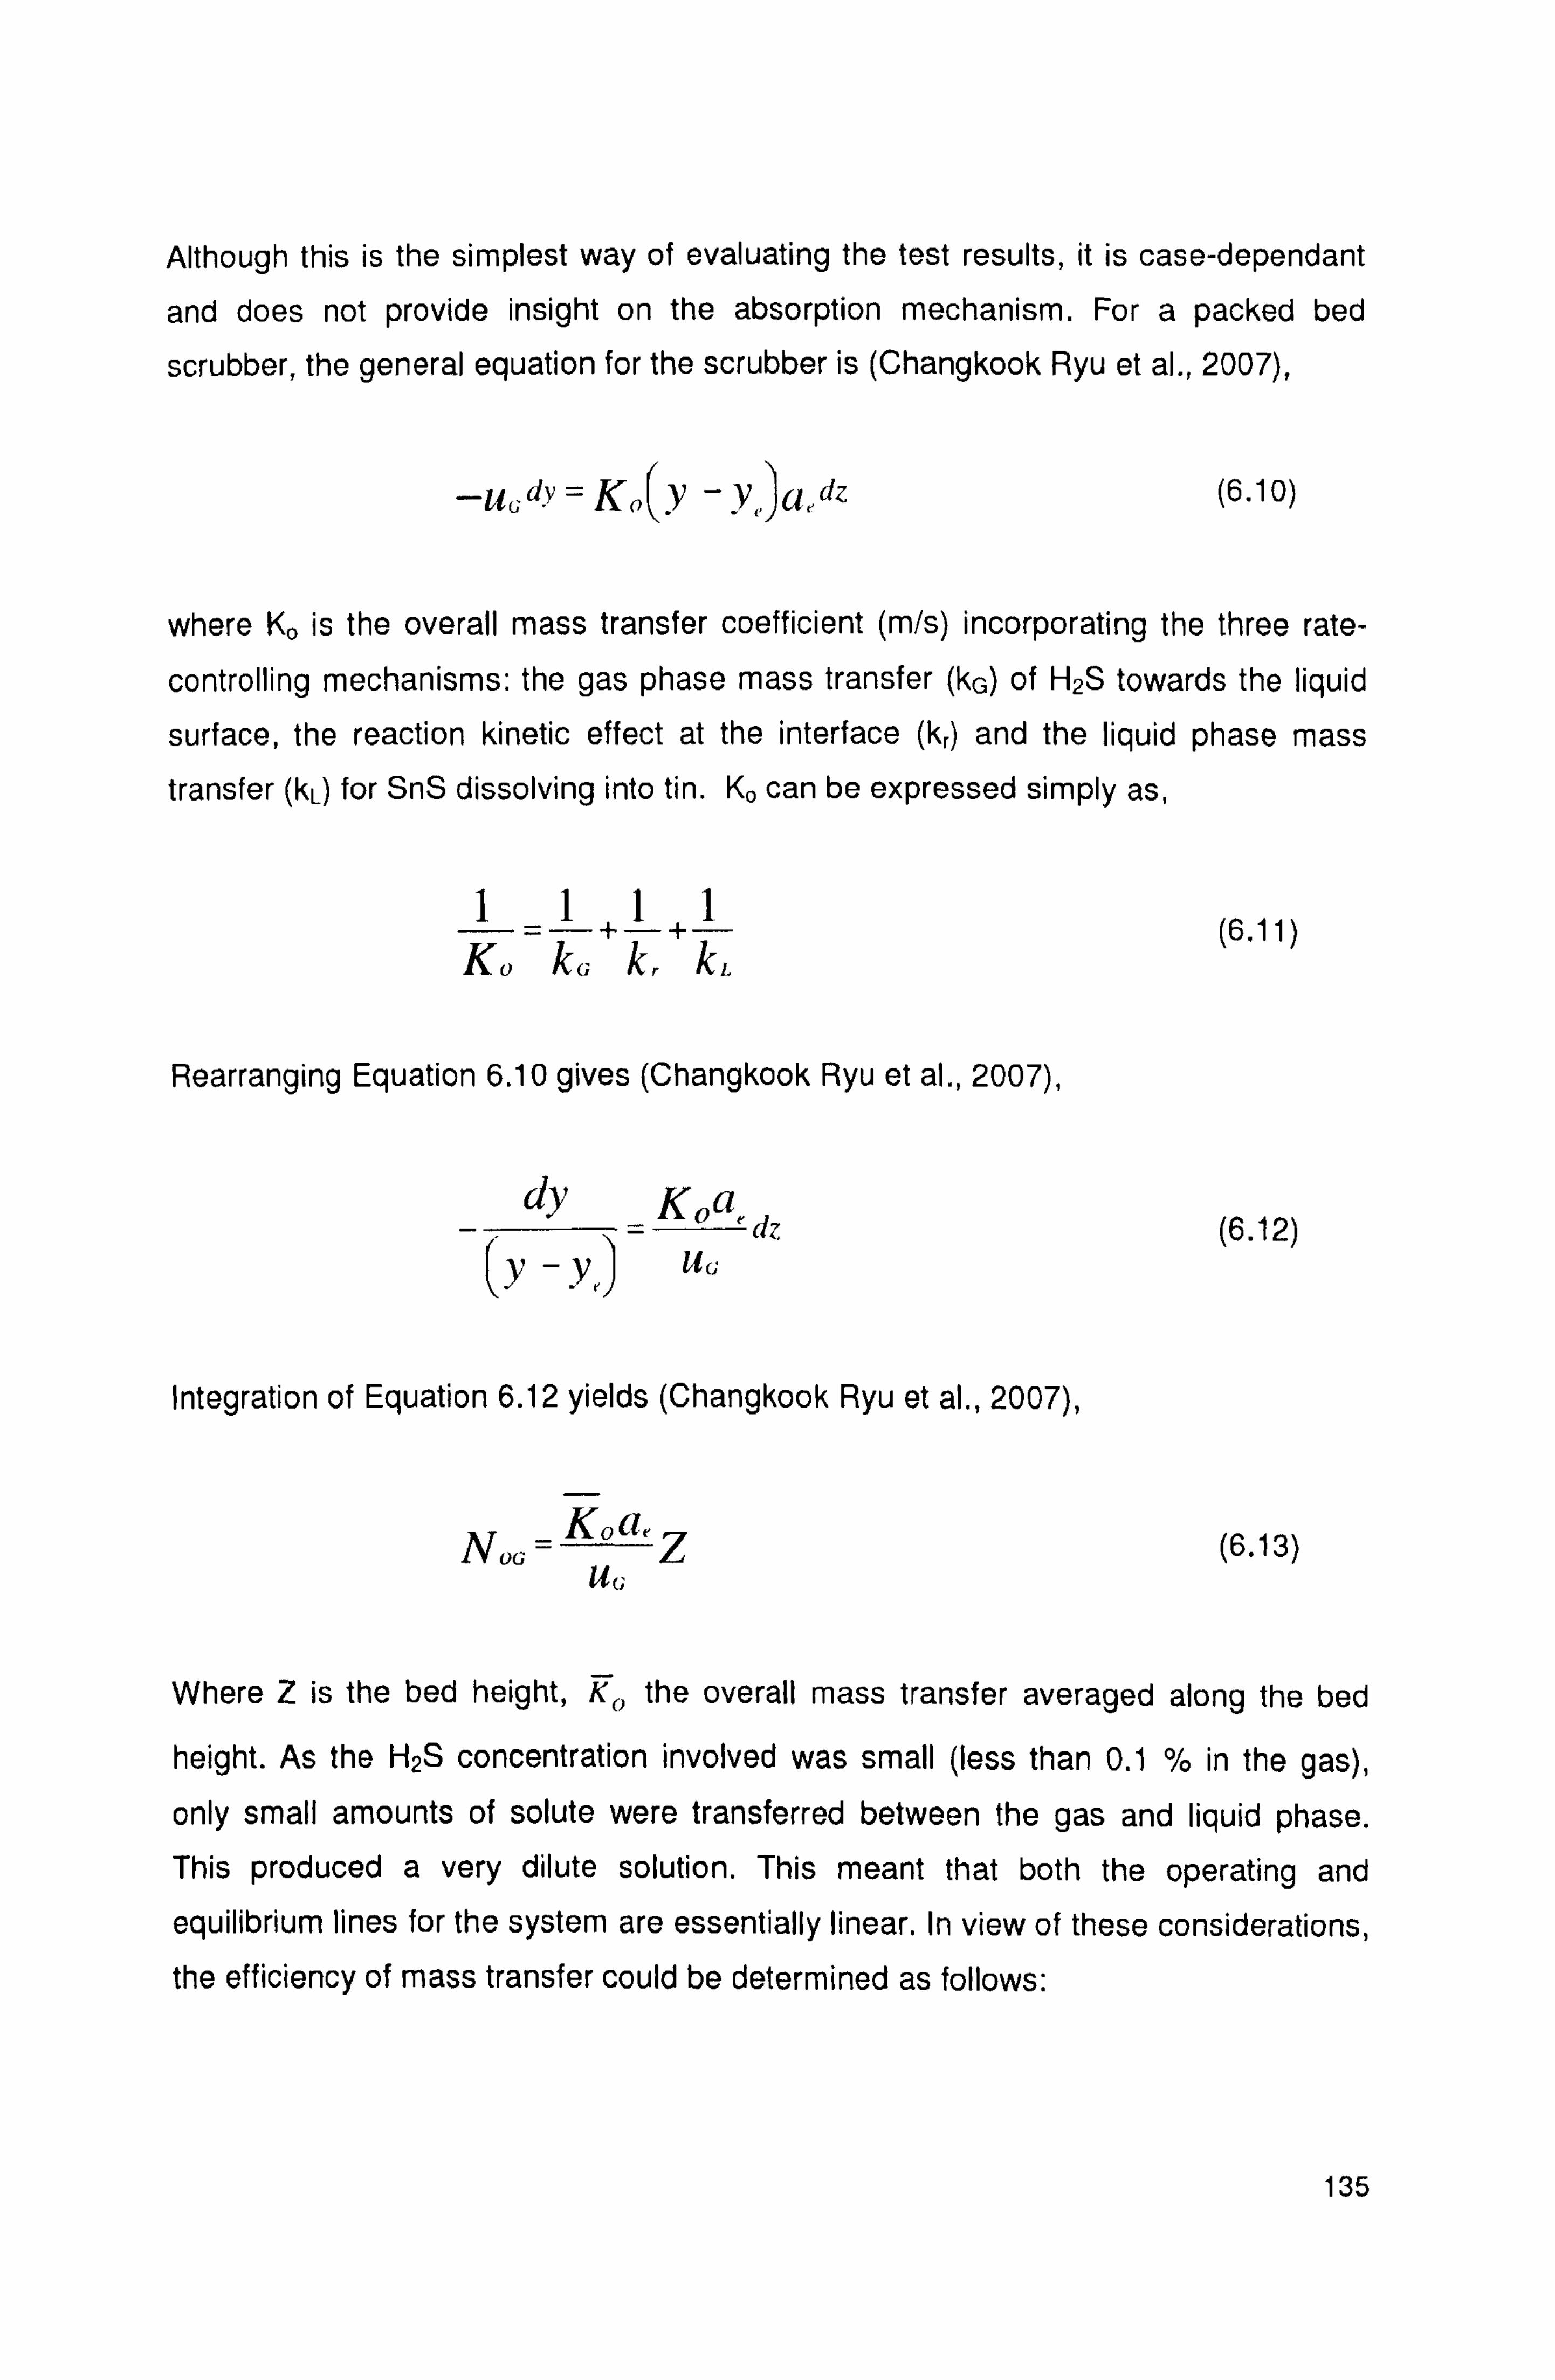
Although this is the simplest way of evaluating the test results, it is case-dependant
and does not provide insight on the absorption mechanism. For a packed bed
scrubber, the general equation for the scrubber is (Changkook Ryu et al., 2007),
-Llcdv = Ko(y - y,, )a, dz (6.10)
where Ko is the overall mass transfer coefficient (m/s) incorporating the three rate-
controlling mechanisms: the gas phase mass transfer (kG) of H2S towards the liquid
surface, the reaction kinetic effect at the interface (kr) and the liquid phase mass
transfer (kL) for SnS dissolving into tin. Ko can be expressed simply as,
1_1 +1
1 (6.11) K0 kG k, kL
Rearranging Equation 6.10 gives (Changkook Ryu et al., 2007),
-
dy =
KOa« dz (6.12)
(y-y) it,
Integration of Equation 6.12 yields (Changkook Ryu et al., 2007),
NOG _ K,, a, Z (6.13)
uG
Where Z is the bed height, K(, the overall mass transfer averaged along the bed
height. As the H2S concentration involved was small (less than 0.1 % in the gas),
only small amounts of solute were transferred between the gas and liquid phase. This produced a very dilute solution. This meant that both the operating and equilibrium lines for the system are essentially linear. In view of these considerations, the efficiency of mass transfer could be determined as follows:
135
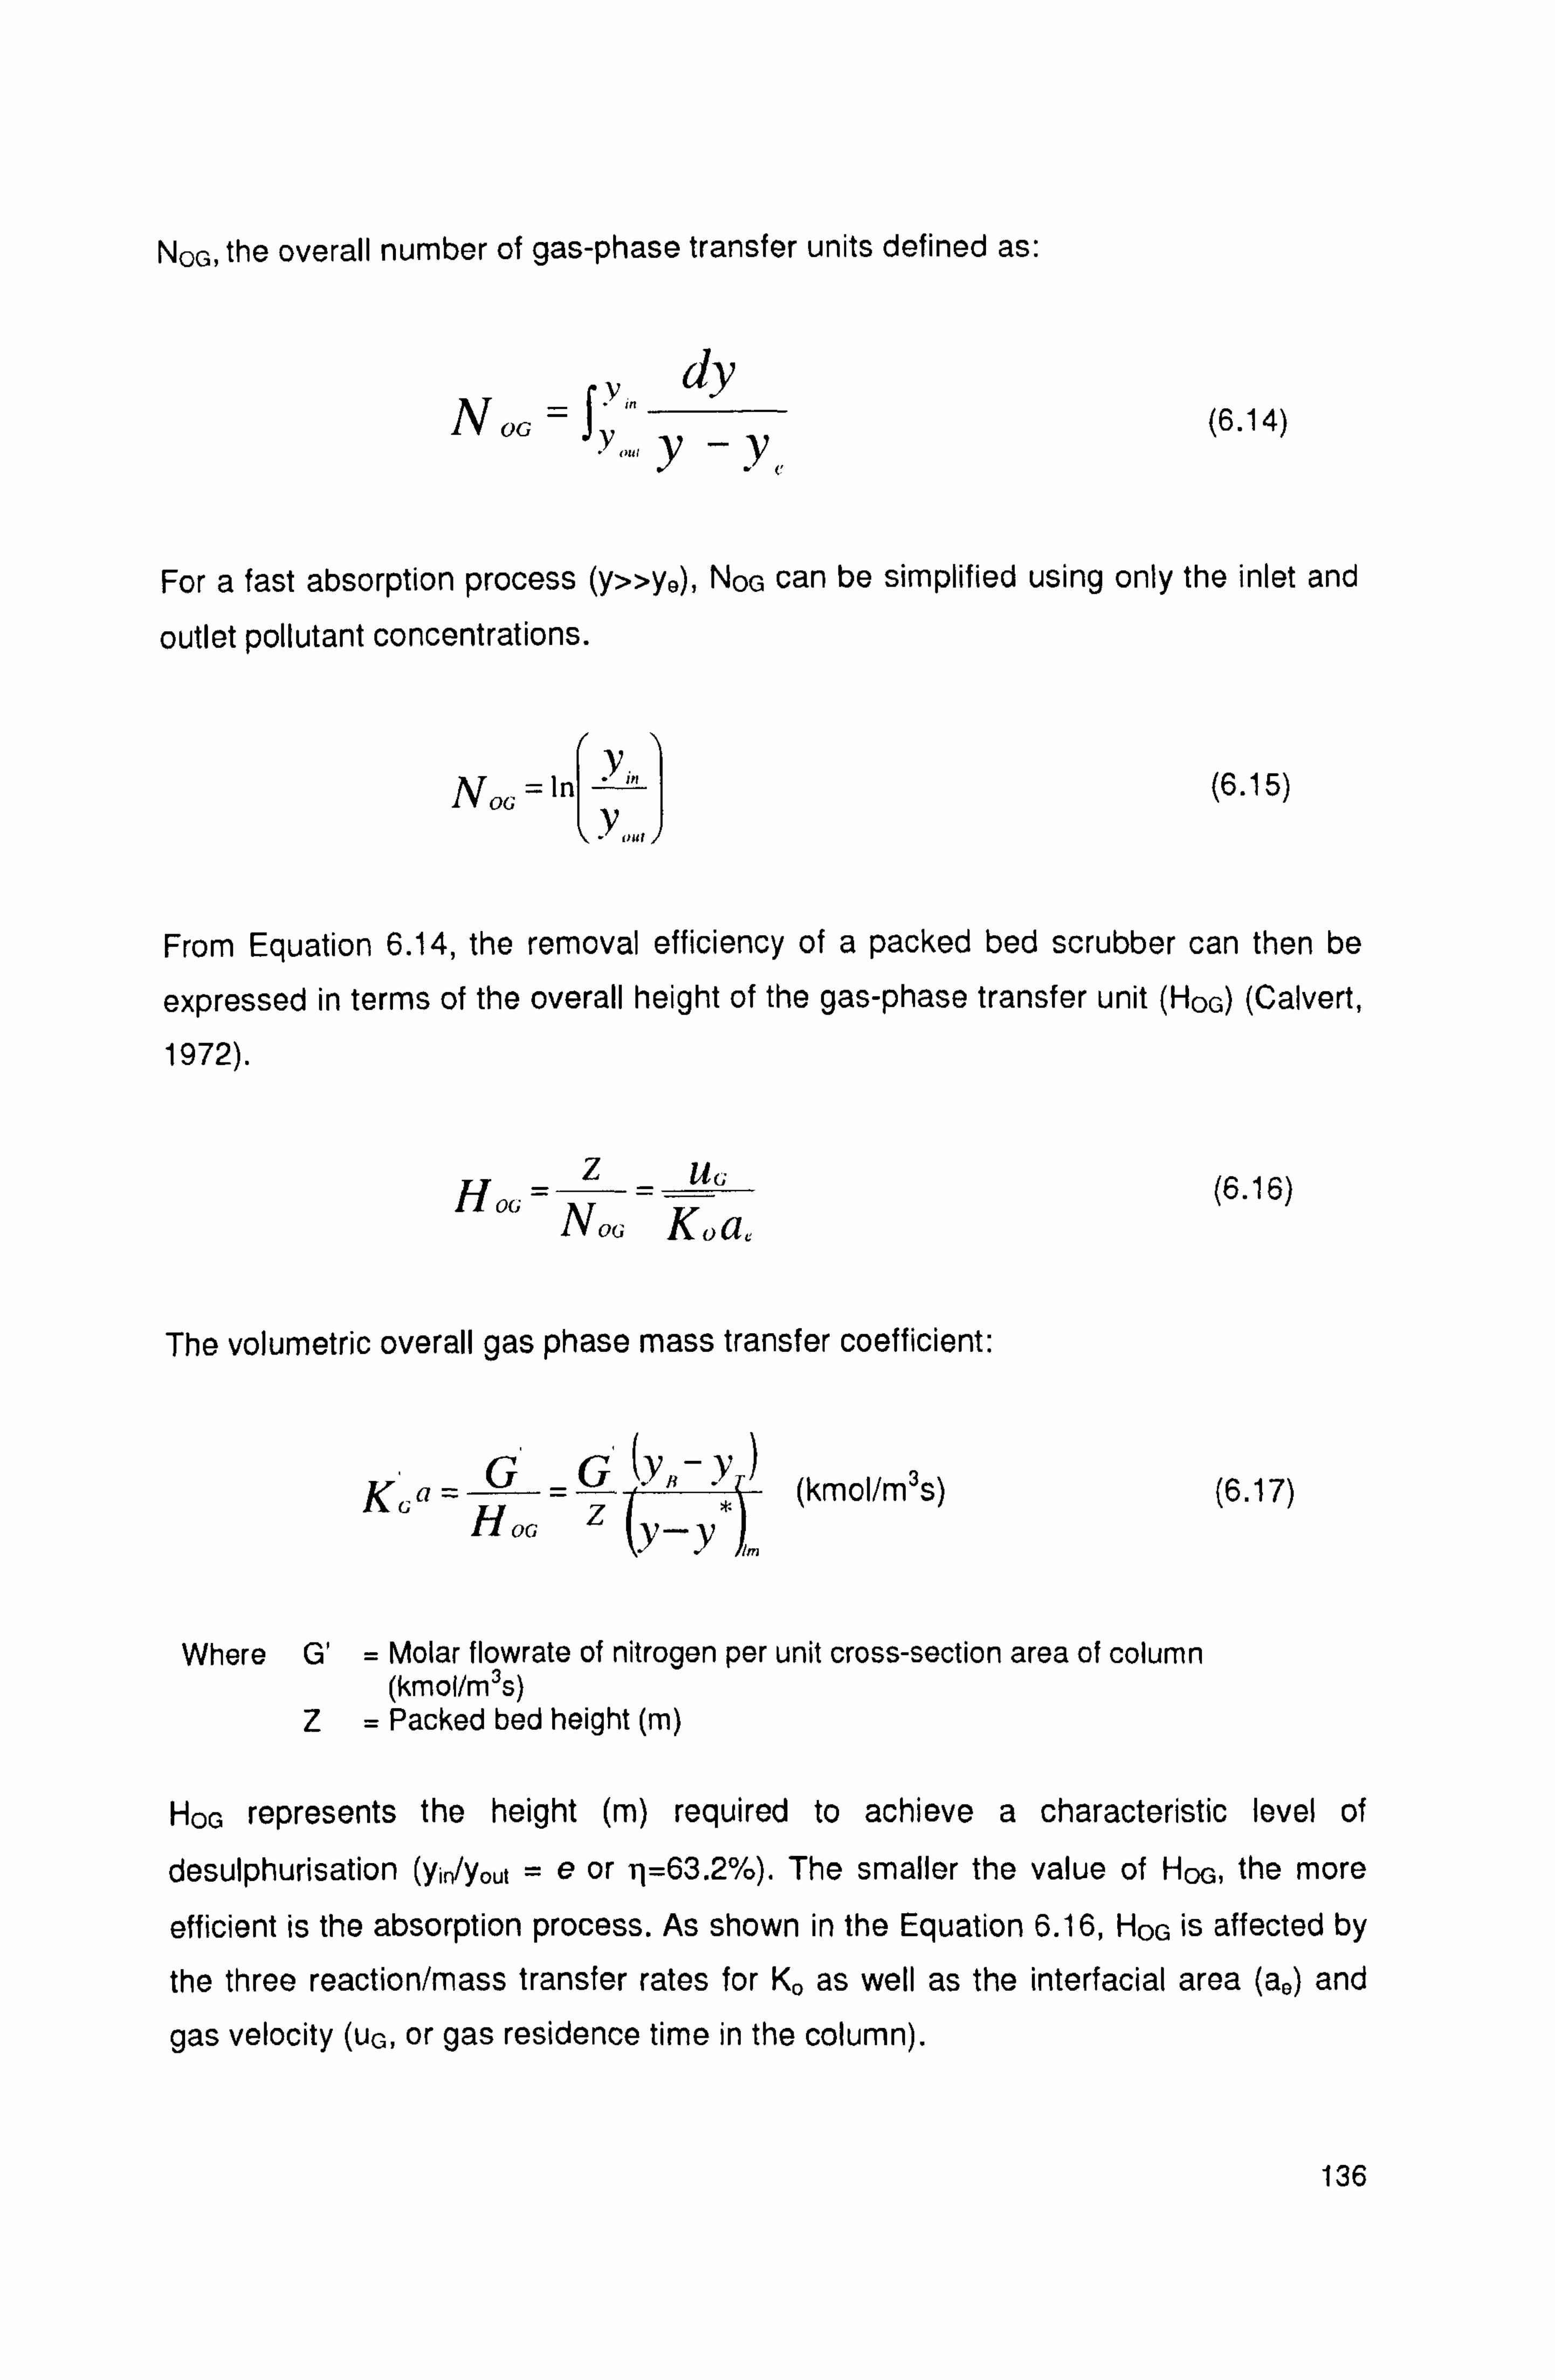
NOG, the overall number of gas-phase transfer units defined as:
v dy NOG - ,
ýy: ý (6.14)
y- For a fast absorption process (y»ye), NOG can be simplified using only the inlet and
outlet pollutant concentrations.
_ In y;,,
(6.15) Noy - y.,,,.
From Equation 6.14, the removal efficiency of a packed bed scrubber can then be
expressed in terms of the overall height of the gas-phase transfer unit (HOG) (Calvert,
1972).
Z uG (6.16) Hoy - NOG K0a.
The volumetric overall gas phase mass transfer coefficient:
G_ G' (Y B- YT) Ký a=-Z (kmol/m3s) (6.17)
HOG y-y ,m Where G' = Molar flowrate of nitrogen per unit cross-section area of column
(kmoi/m3s) Z= Packed bed height (m)
HOG represents the height (m) required to achieve a characteristic level of
desulphurisation (yi,, /yout =e or q=63.2%). The smaller the value of HOG, the more
efficient is the absorption process. As shown in the Equation 6.16, HOG is affected by
the three reaction/mass transfer rates for Kp as well as the interfacial area (a0) and
gas velocity (UG, or gas residence time in the column).
136
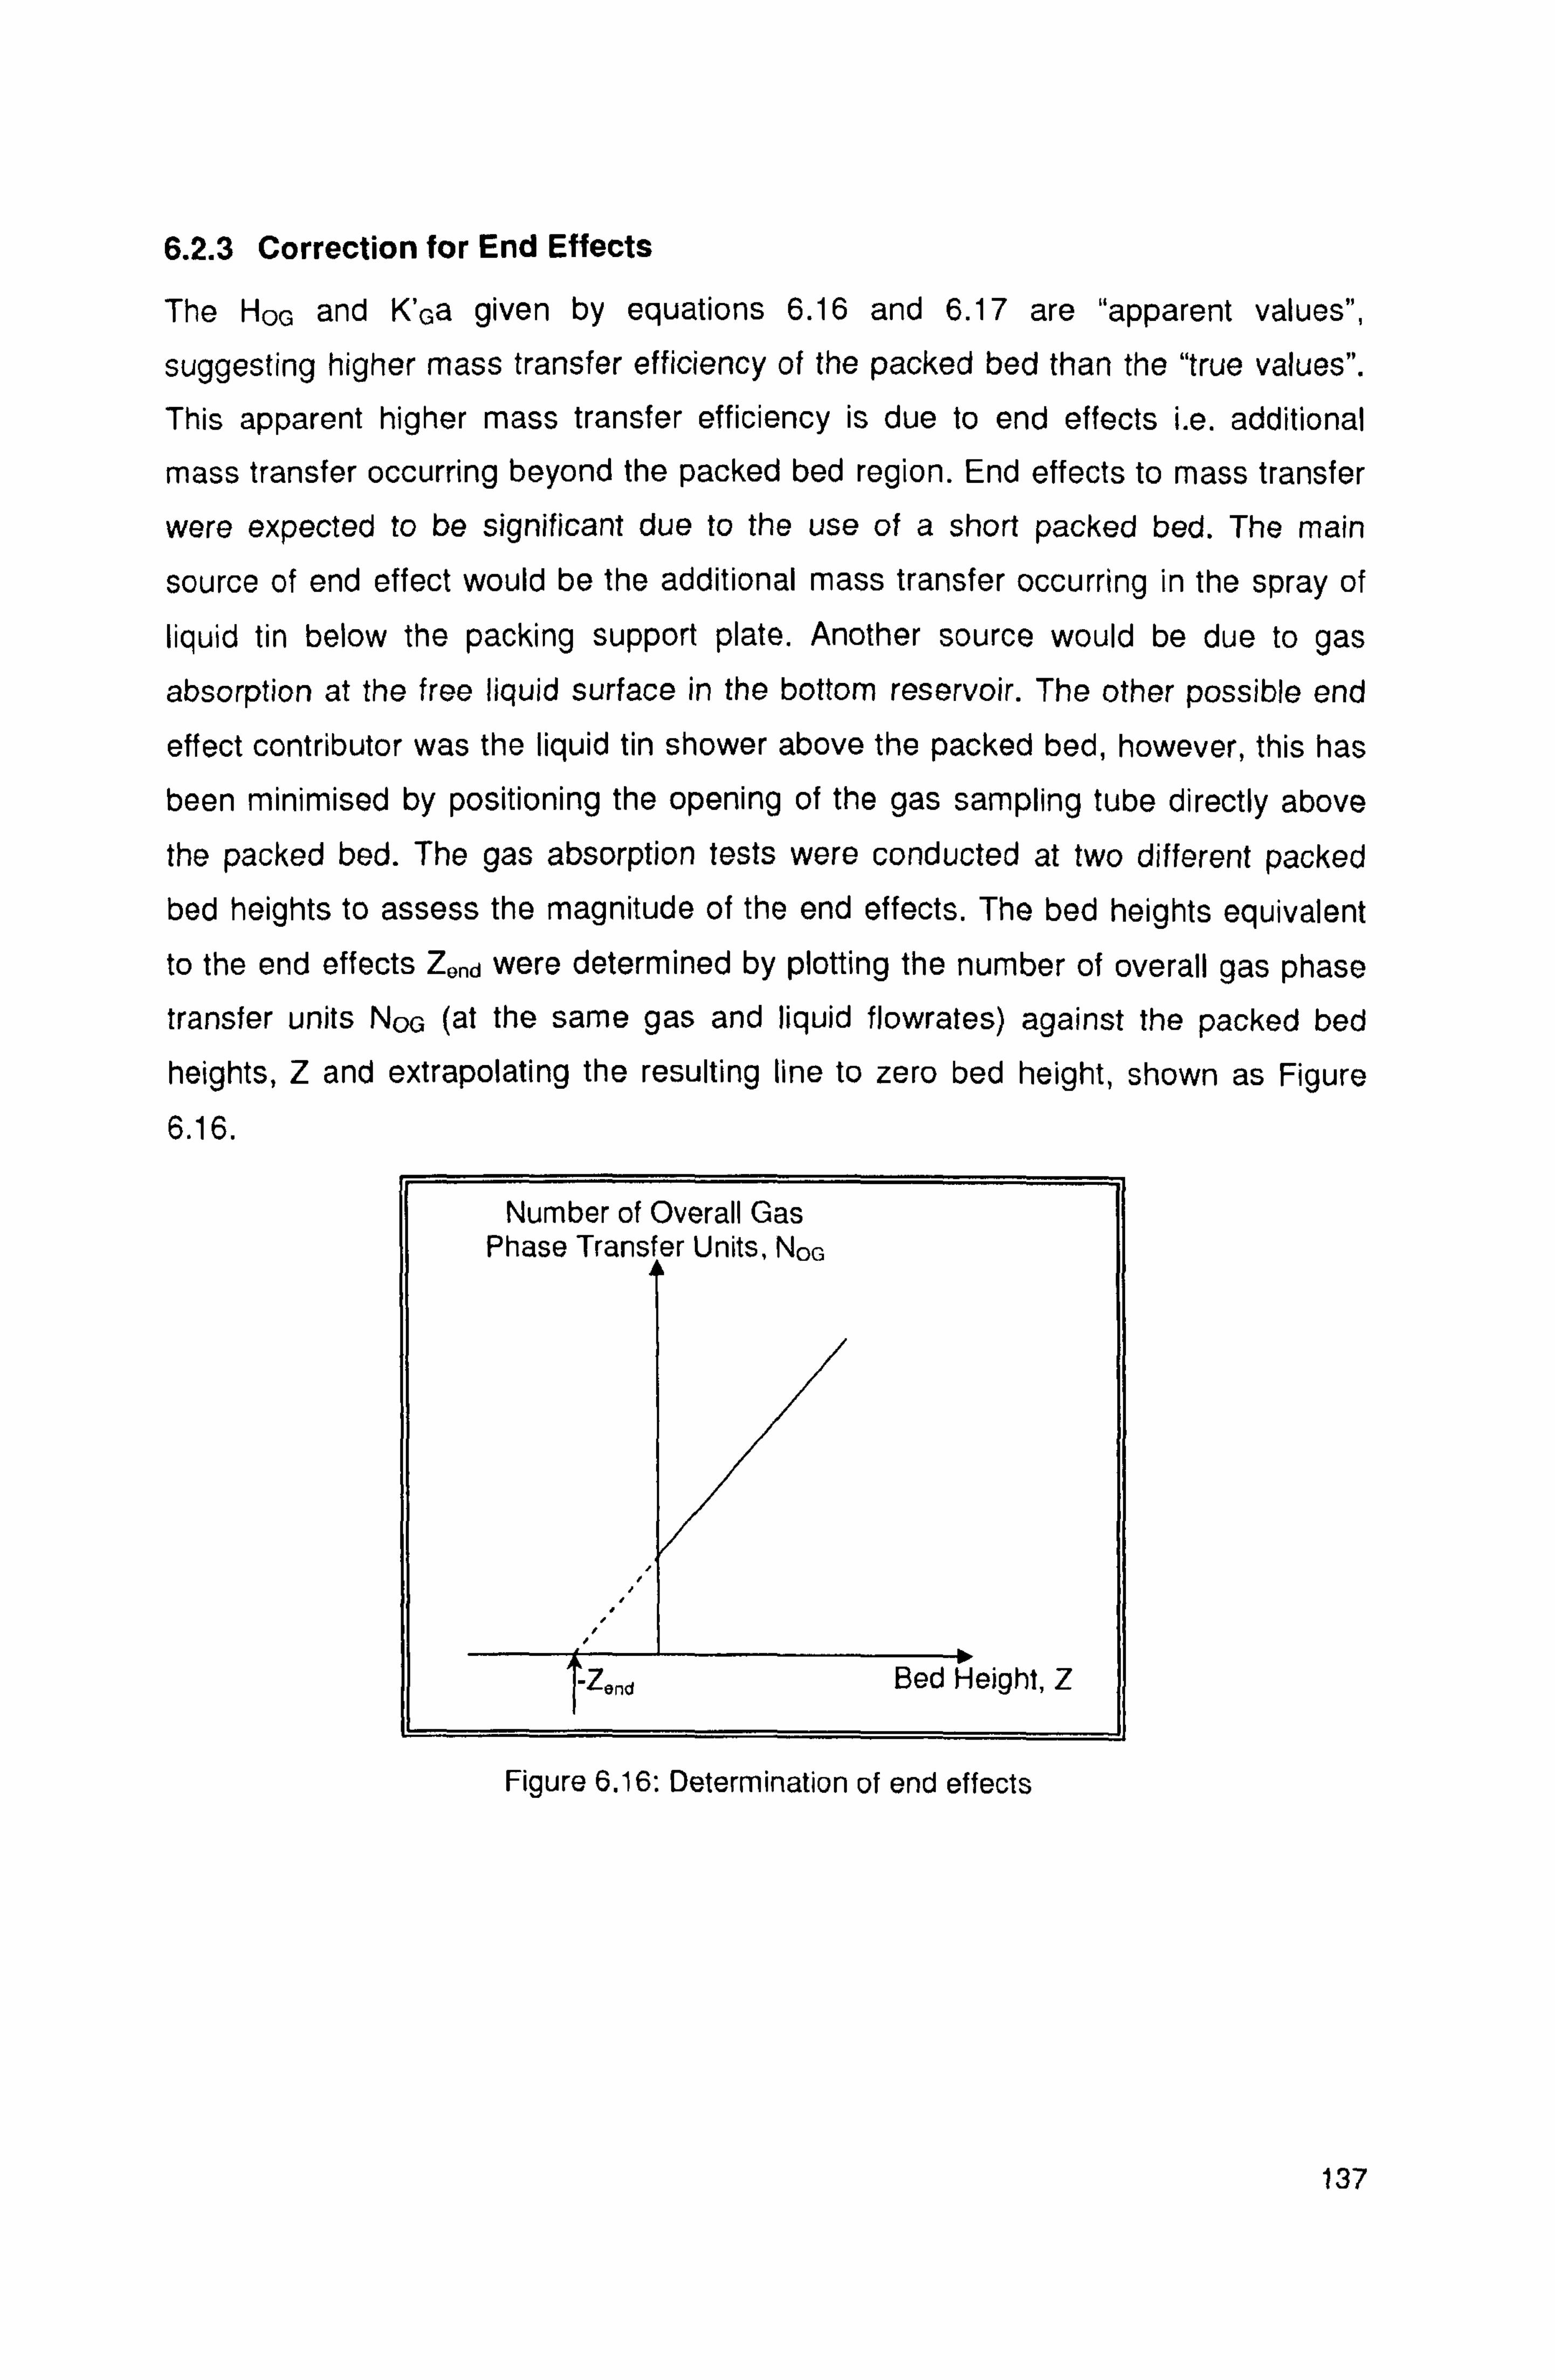
6.2.3 Correction for End Effects
The HOG and K'Ga given by equations 6.16 and 6.17 are "apparent values",
suggesting higher mass transfer efficiency of the packed bed than the "true values".
This apparent higher mass transfer efficiency is due to end effects i. e. additional
mass transfer occurring beyond the packed bed region. End effects to mass transfer
were expected to be significant due to the use of a short packed bed. The main
source of end effect would be the additional mass transfer occurring in the spray of
liquid tin below the packing support plate. Another source would be due to gas
absorption at the free liquid surface in the bottom reservoir. The other possible end
effect contributor was the liquid tin shower above the packed bed, however, this has
been minimised by positioning the opening of the gas sampling tube directly above
the packed bed. The gas absorption tests were conducted at two different packed
bed heights to assess the magnitude of the end effects. The bed heights equivalent
to the end effects Zend were determined by plotting the number of overall gas phase
transfer units N00 (at the same gas and liquid flowrates) against the packed bed
heights, Z and extrapolating the resulting line to zero bed height, shown as Figure
6.16.
137
Figure 6.16: Determination of end effects
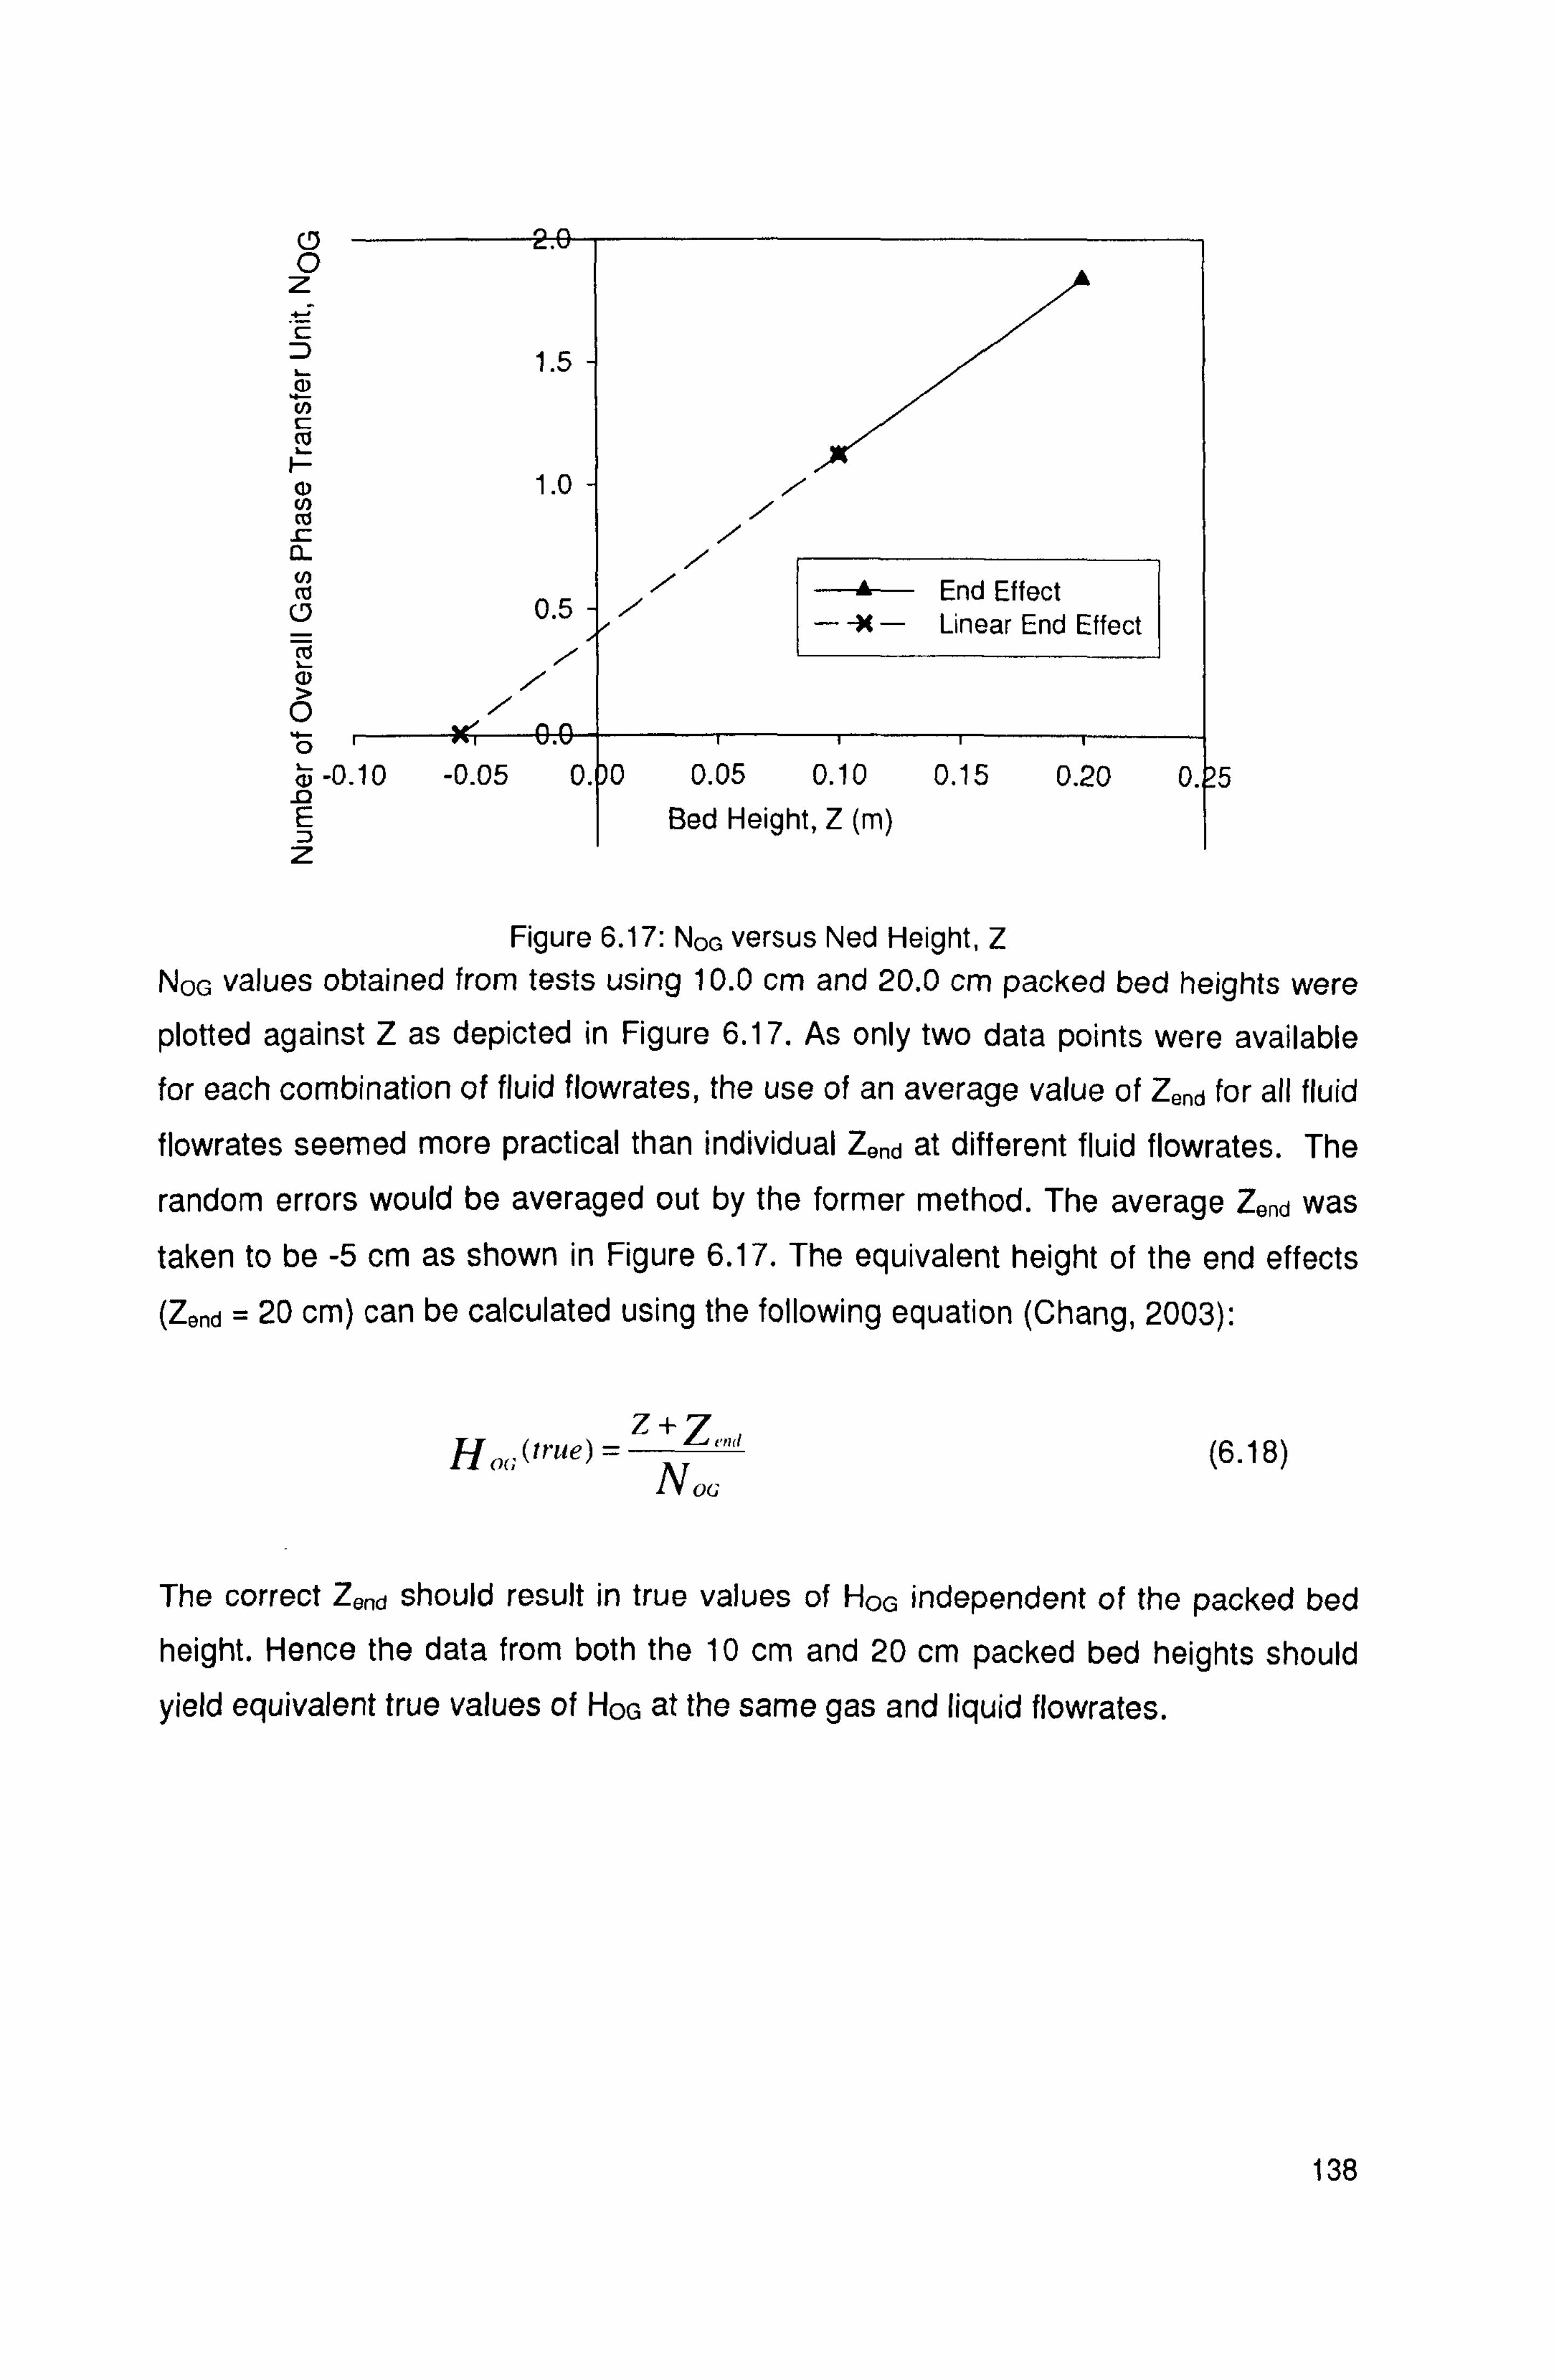
0 2.0 0
z
.E 1.5
in
cV
N 1.0 /
d/
Ca 0.5 End Effect
- -X - Linear End Effect /
0/
w -0.10 -0.05 0.0 0.05 0.10 0.15 0.20 0. E Bed Height, Z (m)
z
Figure 6.17: NOG versus Ned Height, Z NOG values obtained from tests using 10.0 cm and 20.0 cm packed bed heights were
plotted against Z as depicted in Figure 6.17. As only two data points were available for each combination of fluid flowrates, the use of an average value of Zend for all fluid
flowrates seemed more practical than individual ZOfd at different fluid flowrates. The
random errors would be averaged out by the former method. The average Zend was taken to be -5 cm as shown in Figure 6.17. The equivalent height of the end effects (ZOnd = 20 cm) can be calculated using the following equation (Chang, 2003):
Hoc (true) =Z +Z<°""
(6.18) NOG
The correct Zend should result in true values of Hoc, independent of the packed bed height. Hence the data from both the 10 cm and 20 cm packed bed heights should
yield equivalent true values of HOG at the same gas and liquid flowrates.
138

6.2.4 Blank Test and Test Duration
Figure 6.18 shows the histories of H2S concentration including a blank test, vs test
duration for the desulphurisation process. In the graph, t=0 min is when H2S was introduced into the column. In the blank test (operation at 400°C without tin
circulation) at 983 ppm inlet H2S concentration, the outlet concentration (960 ppm)
matched the inlet value within the accuracy of the GC (calibrated using standard gas
at 4000 ppm (5%). It took 20 min to reach a steady concentration due to the time
required for the gas to achieve complete mixing in the reactor and also for the gas
retention time in the sampling line to the GC. The two tests for different test durations
at 2000 ppm inlet H2S concentration showed that the tests were repeatable and the
outlet H2S concentration was not affected by the test duration up to 90 min. Although
the removal efficiency will be affected by the test duration in the long term, the tin has
sufficient sulphur capacity not to be affected by a few hours of tests. The sulphur
concentration in the tin after 90 min of test was less than 1% by weight. Therefore,
the concentrations at t=30 min were used to evaluate the results.
1000
800 E CL a
6 600 (U
d U 0400 U
N I
200
0
-0- 2000 ppm -f- 2000 ppm (90 Minutes) --s- 983 ppm, Blank Test
0 20 40 60 80 Operation Time (min)
Figure 6.18: History of H2S concentration for the test duration (mG = 0.258 kg/(m2s); rTk 3.860 kg/(m2s) except for the blank test; T= 400 °C)
139
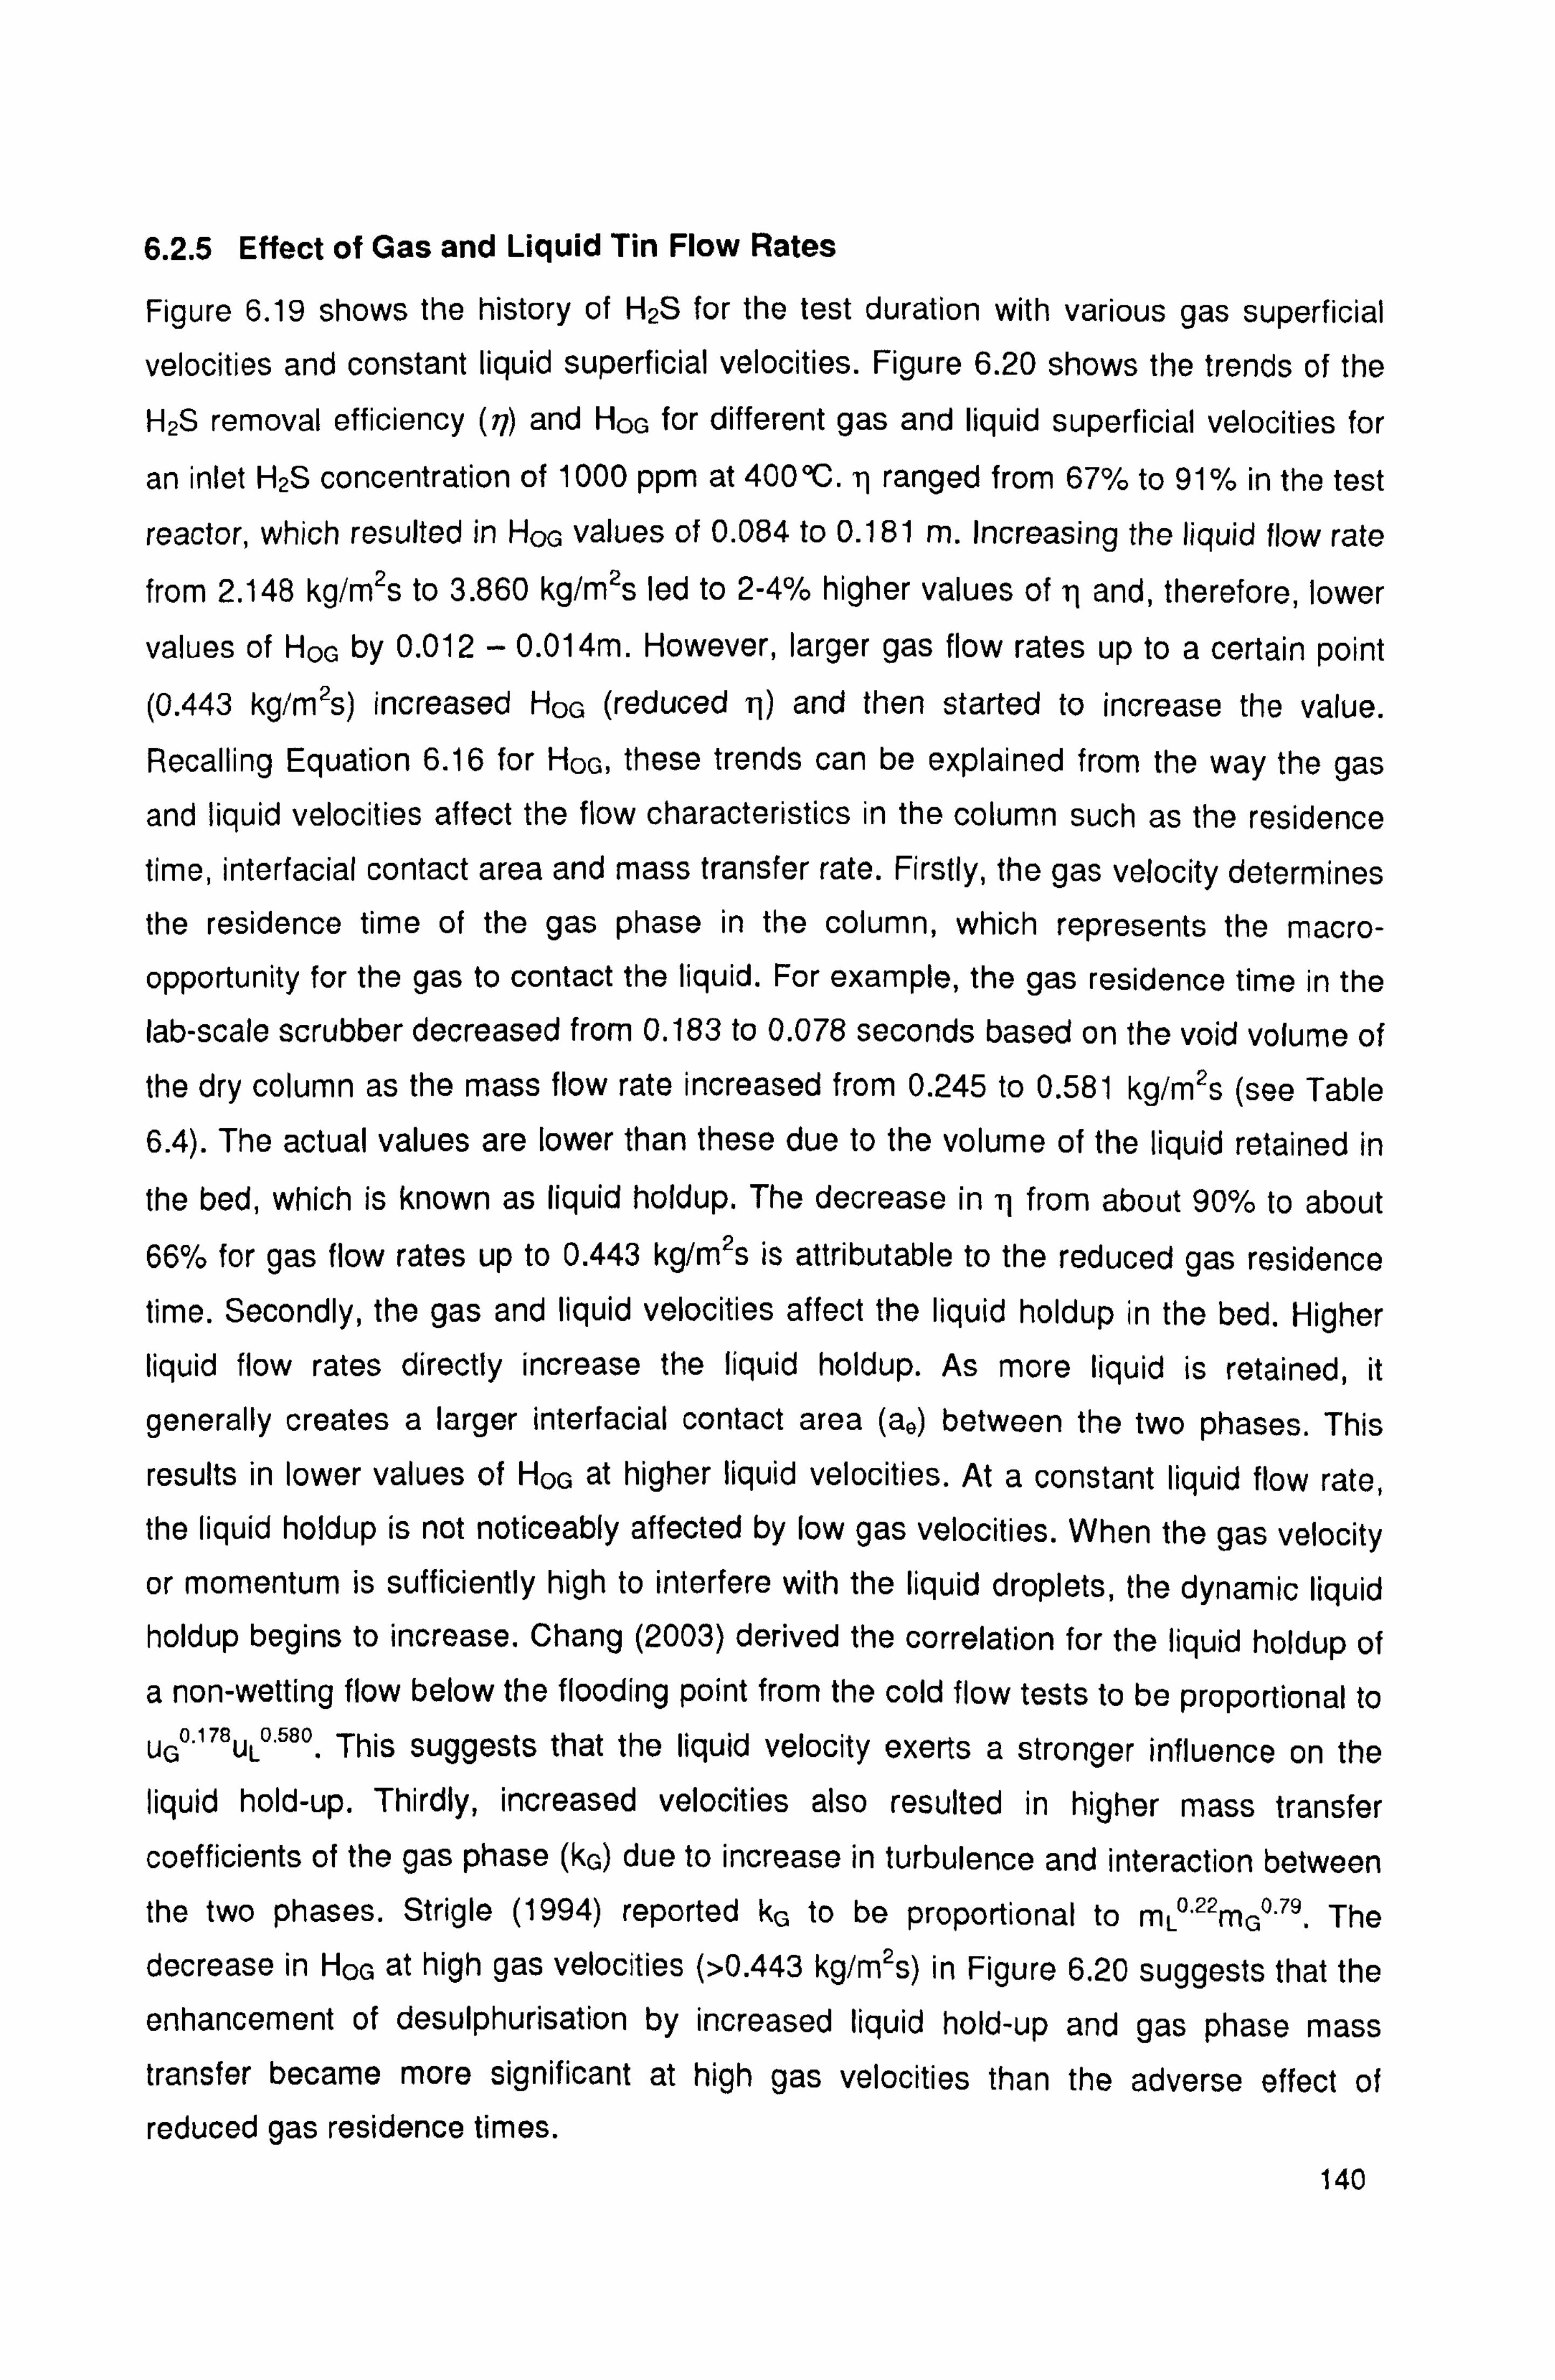
6.2.5 Effect of Gas and Liquid Tin Flow Rates
Figure 6.19 shows the history of H2S for the test duration with various gas superficial
velocities and constant liquid superficial velocities. Figure 6.20 shows the trends of the
H2S removal efficiency ('7) and HOG for different gas and liquid superficial velocities for
an inlet H2S concentration of 1000 ppm at 400°C. q ranged from 67% to 91% in the test
reactor, which resulted in HOG values of 0.084 to 0.181 m. Increasing the liquid flow rate from 2.148 kg/m2s to 3.860 kg/m2s led to 2-4% higher values of il and, therefore, lower
values of HOG by 0.012 - 0.014m. However, larger gas flow rates up to a certain point (0.443 kg/m2s) increased HOG (reduced TI) and then started to increase the value. Recalling Equation 6.16 for HOG, these trends can be explained from the way the gas and liquid velocities affect the flow characteristics in the column such as the residence time, interfacial contact area and mass transfer rate. Firstly, the gas velocity determines
the residence time of the gas phase in the column, which represents the macro- opportunity for the gas to contact the liquid. For example, the gas residence time in the lab-scale scrubber decreased from 0.183 to 0.078 seconds based on the void volume of the dry column as the mass flow rate increased from 0.245 to 0.581 kg/m2s (see Table 6.4). The actual values are lower than these due to the volume of the liquid retained in
the bed, which is known as liquid holdup. The decrease in from about 90% to about
66% for gas flow rates up to 0.443 kg/m2s is attributable to the reduced gas residence
time. Secondly, the gas and liquid velocities affect the liquid holdup in the bed. Higher
liquid flow rates directly increase the liquid holdup. As more liquid is retained, it
generally creates a larger interfacial contact area (a0) between the two phases. This
results in lower values of HOG at higher liquid velocities. At a constant liquid flow rate, the liquid holdup is not noticeably affected by low gas velocities. When the gas velocity
or momentum is sufficiently high to interfere with the liquid droplets, the dynamic liquid
holdup begins to increase. Chang (2003) derived the correlation for the liquid holdup of
a non-wetting flow below the flooding point from the cold flow tests to be proportional to
uG0.178UL . 581) This suggests that the liquid velocity exerts a stronger influence on the liquid hold-up. Thirdly, increased velocities also resulted in higher mass transfer
coefficients of the gas phase (kG) due to increase in turbulence and interaction between
the two phases. Strigle (1994) reported kG to be proportional to mL "22mG0.79. The
decrease in HOG at high gas velocities (>0.443 kg/m2s) in Figure 6.20 suggests that the
enhancement of desulphurisation by increased liquid hold-up and gas phase mass transfer became more significant at high gas velocities than the adverse effect of
reduced gas residence times. 140
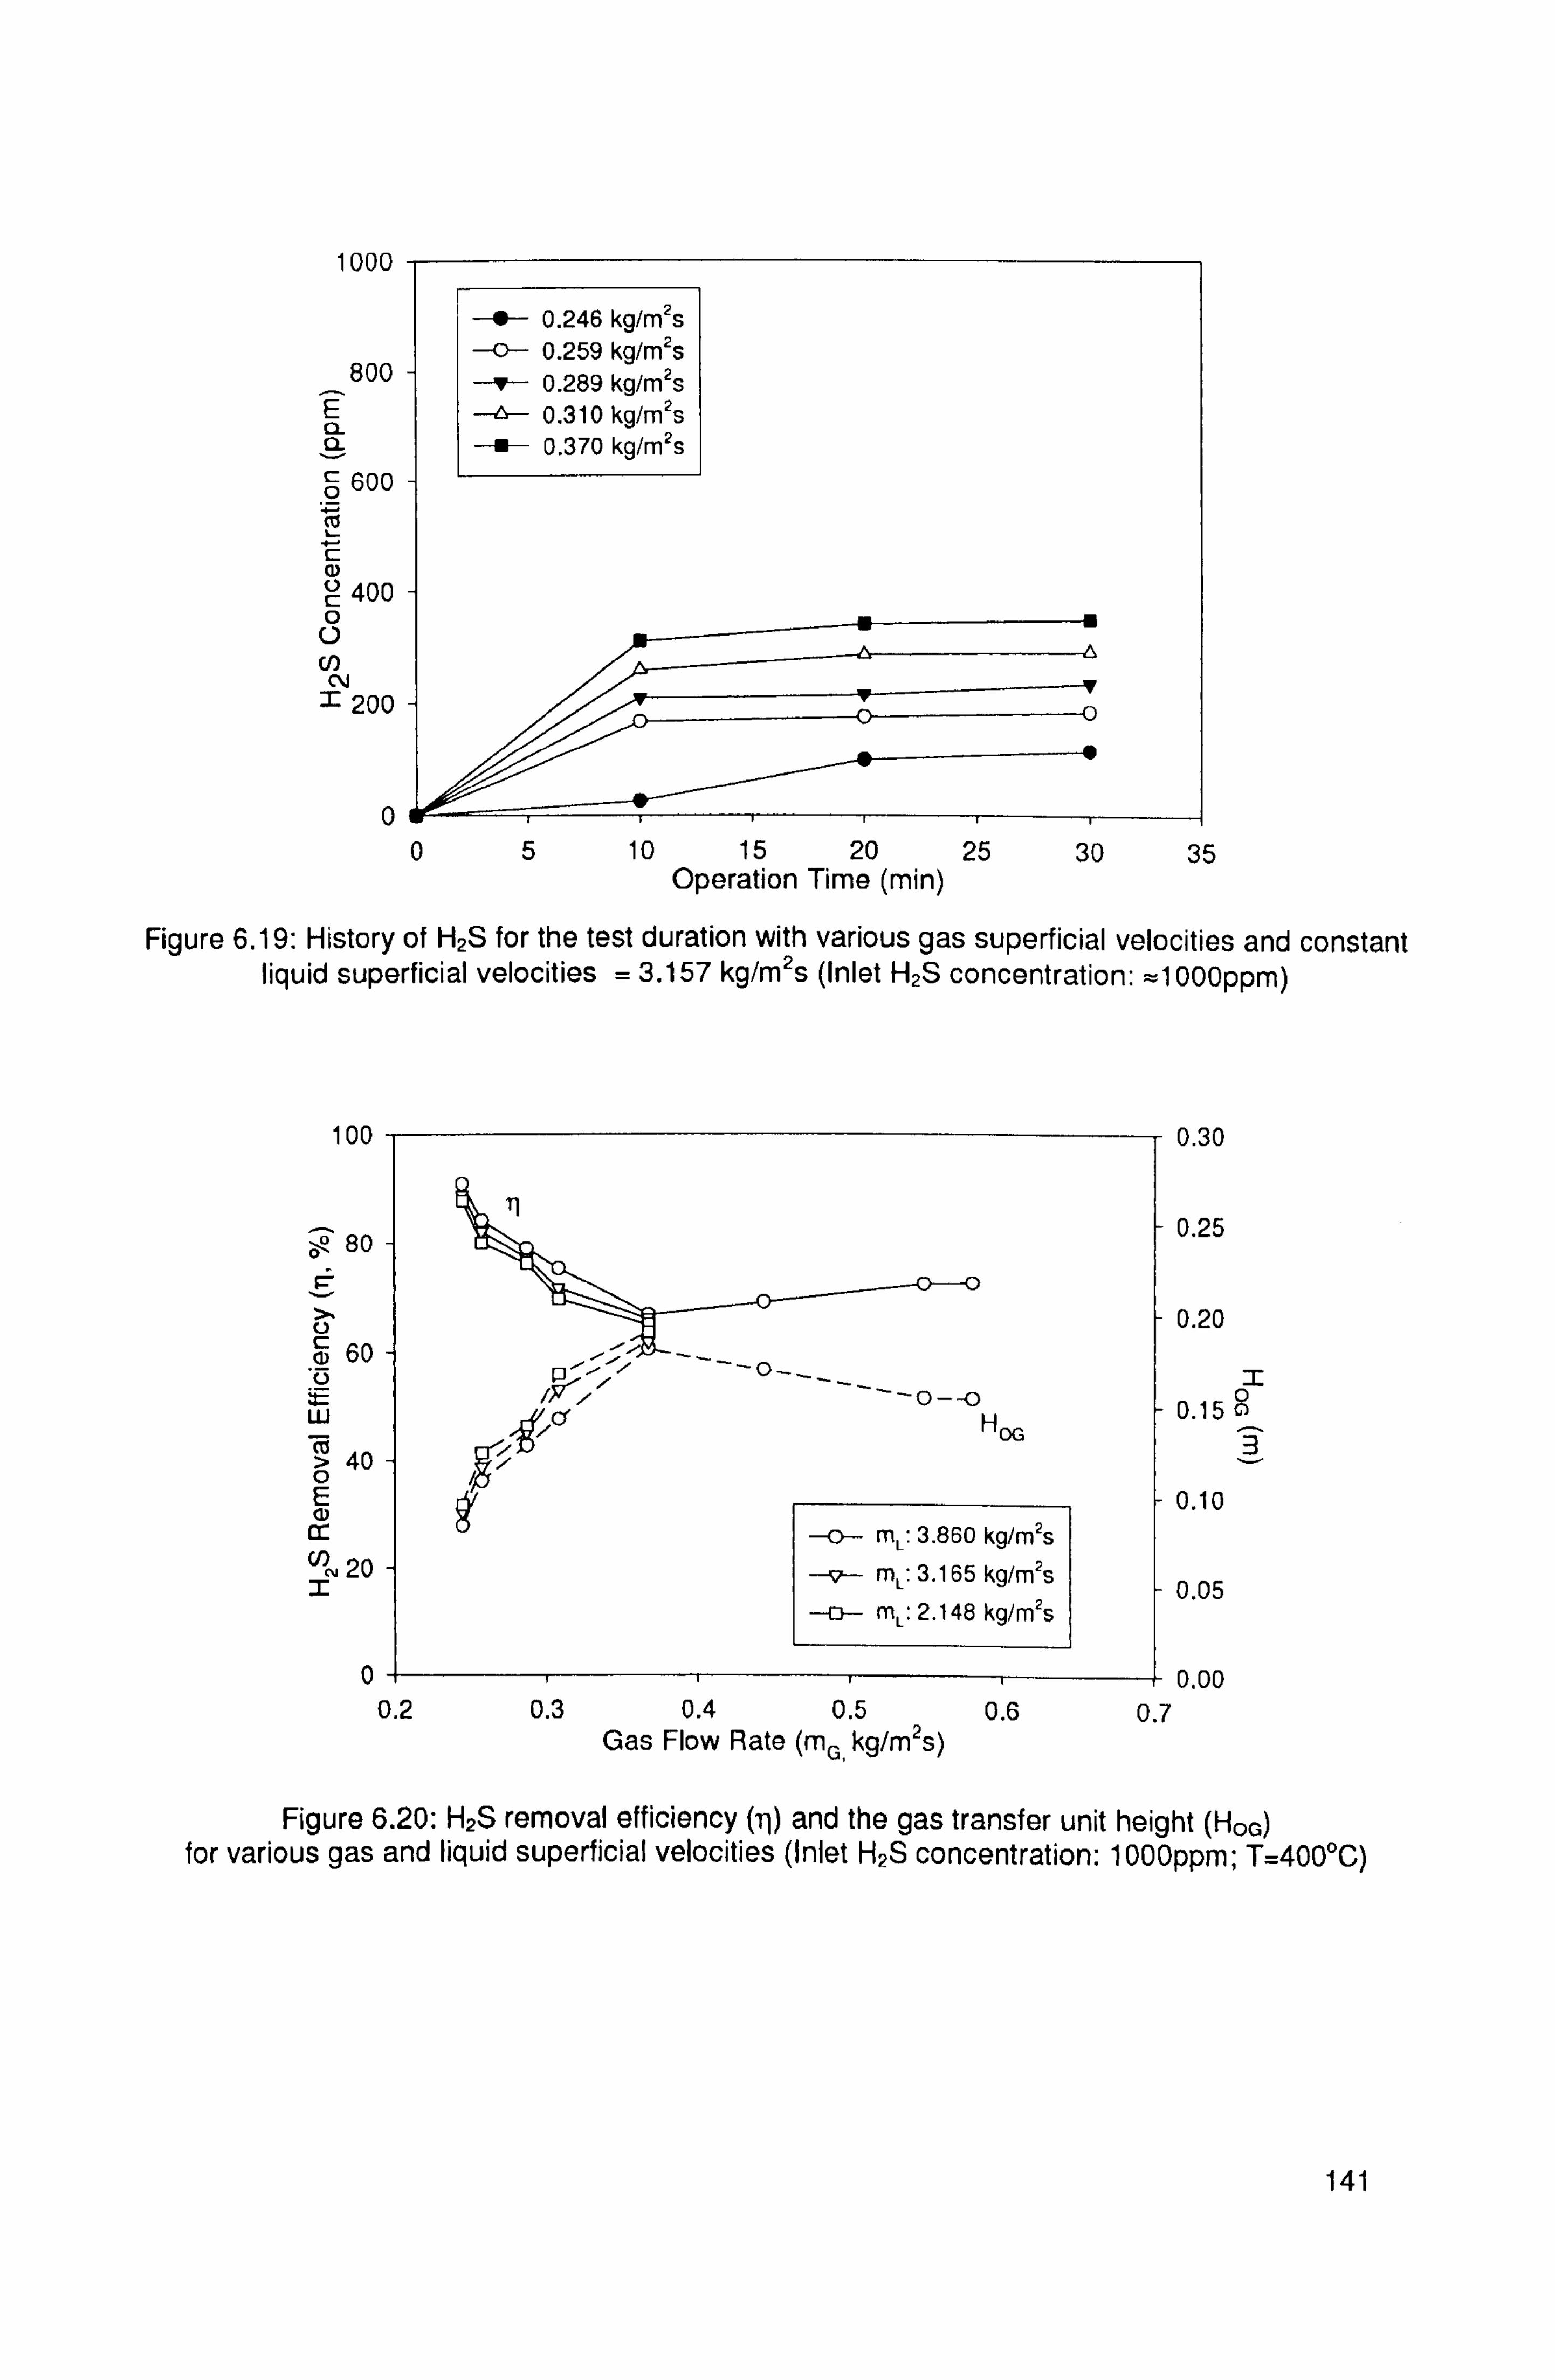
1000
E n a ö 600
tC
--f- 0.246 kg/mzs
-0-- 0.259 kg/mzs -p-- 0.289 kg/m2s
-ý 0.310 kg/m2s
-B- 0.370 kg/m2s
800
C a) C 400 0 0
Cl) N
7-200
0 05 10 15 20 25 30 35
Operation Time (min)
Figure 6.19: History of H2S for the test duration with various gas superficial velocities and constant liquid superficial velocities = 3.157 kg/m2s (Inlet H2S concentration: =1000ppm)
100
2 80
P- U
60
W > 40 0 E a) cr
20
T1
ior Hoc
C mL: 3.860 kg/mzs
-v--- mL: 3.165 kg/mZs
-a- mL: 2.148 kg/m's
0- 0.2 0.3 0.4 0.5 0.6
Gas Flow Rate (mG kg/m2s)
0.30
0.25
0.20
I 0.15 8
B
0.10
0.05
0.00 0.7
Figure 6.20: H2S removal efficiency (i') and the gas transfer unit height (Hoc) for various gas and liquid superficial velocities (Inlet H2S concentration: 1000ppm; T=400°C)
141
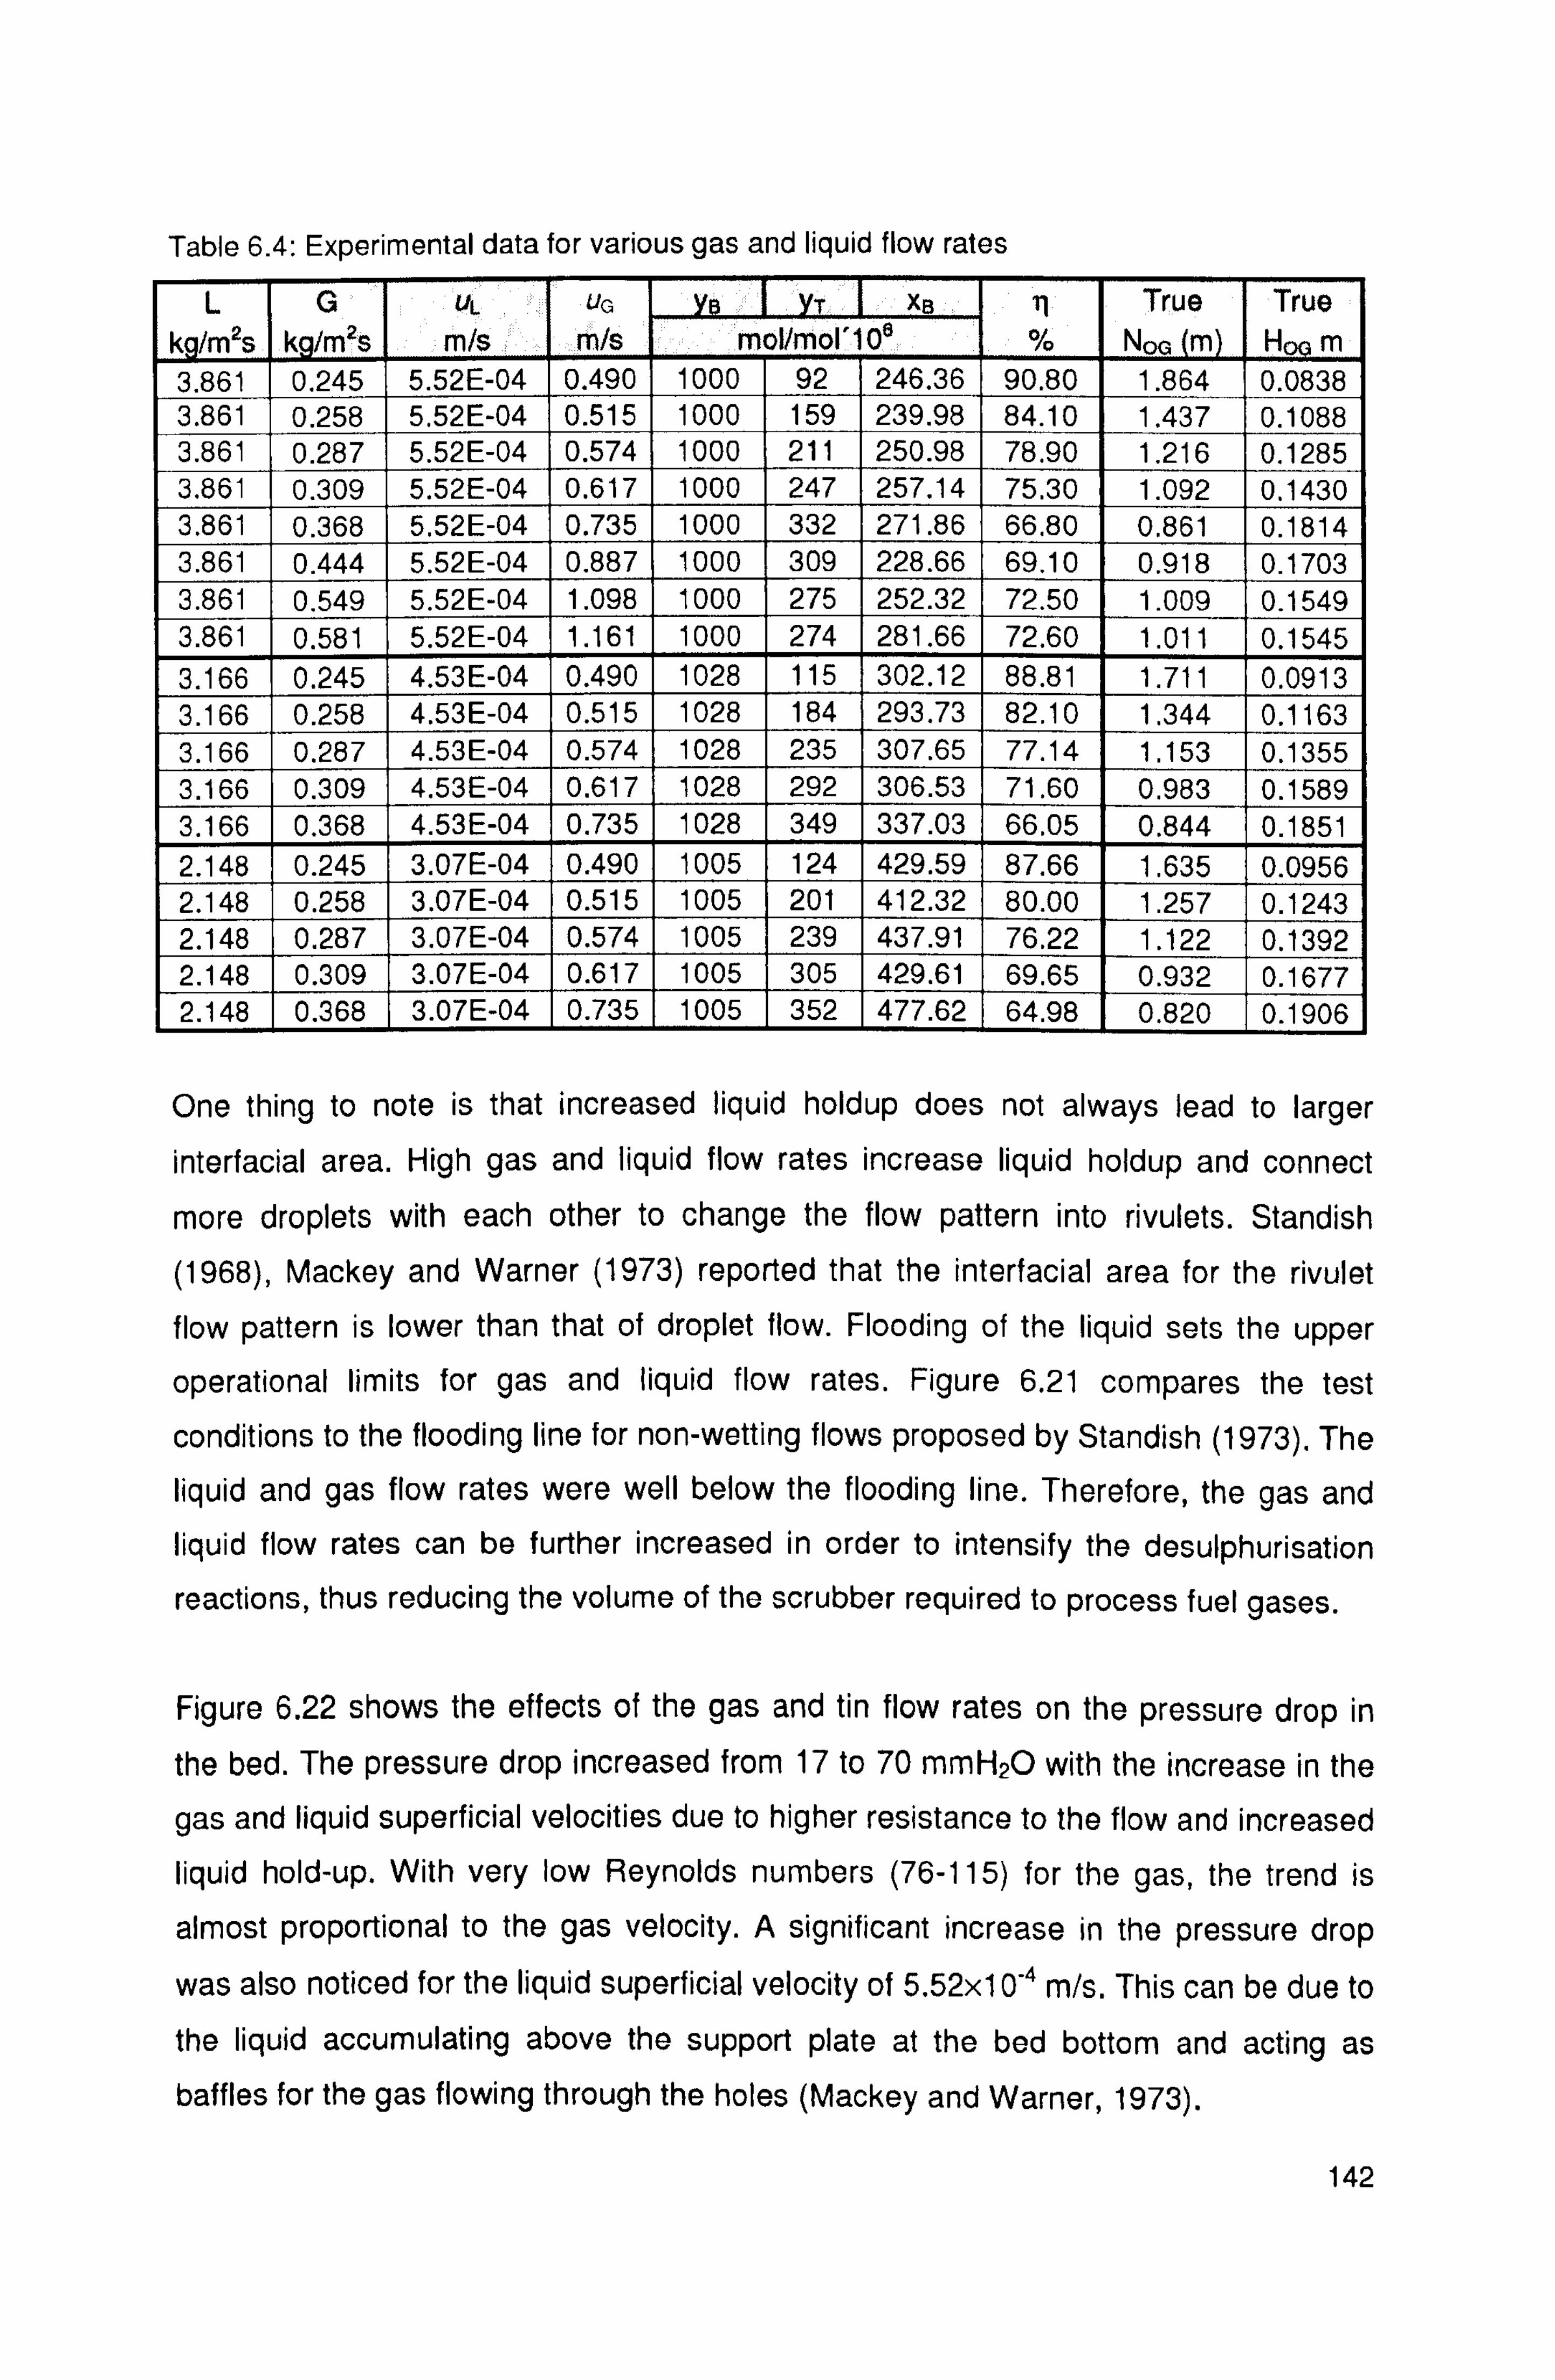
Table 6.4: Experimental data for various gas and liquid flow rates
L G UL uG XB 11 True True k /m2s k /mas rn/s m/s mol/mol'1 06 % N00 m Hm 3.861 0.245 5.52E-04 0.490 1000 92 246.36 90.80 1.864 0.0838 3.861 0.258 5.52E-04 0.515 1000 159 239.98 84.10 1.437 0.1088 3.8 11 0.287 5.52E-04 0.574 1000 211 250.98 78.90 1.216 0.1285 3.861 0.309 5.52E-04 0.617 1000 247 257.14 75.30 1.092 0.1430 3.861 0.368 5.52E-04 0.735 1000 332 271.86 66.80 0.861 0.1814 3.861 0.444 5.52E-04 0.887 1000 309 228.66 69.10 0.918 0.1703 3.861 0.549 5.52E-04 1.098 1000 275 252.32 72.50 1.009 0.1549 3.861 0.581 5.52E-04 1.161 1000 274 281.66 72.60 1.011 0.1545 3.166 0.245 4.53E-04 0.490 1028 115 302.12 88.81 1.711 0.0913 3.166 0.258 4.53E-04 0.515 1028 184 293.73 82.10 1.344 0.1163 3.166 0.287 4.53E-04 0.574 1028 235 307.65 77.14 1.153 0.1355 3.166 0.309 4.53E-04 0.617 1028 292 306.53 71.60 0.983 0.1589 3.166 0.368 4.53E-04 0.735 1028 349 337.03 66.05 0.844 0.1851 2.148 0.245 3.07E-04 0.490 1005 124 429.59 87.66 1.635 0.0956 2.148 0.258 3.07E-04 0.515 1005 201 412.32 80.00 1.257 0.1243 2.148 0.287 3.07E-04 0.574 1005 239 437.91 76.22 1.122 0.1392 2.148 0.309 3.07E-04 0.617 1005 305 429.61 69.65 0.932 0.1677 2.148 0.368 3.07E-04 0.735 1005 352 477.62 64.98 0.820 0.1906
One thing to note is that increased liquid holdup does not always lead to larger
interfacial area. High gas and liquid flow rates increase liquid holdup and connect
more droplets with each other to change the flow pattern into rivulets. Standish
(1968), Mackey and Warner (1973) reported that the interfacial area for the rivulet
flow pattern is lower than that of droplet flow. Flooding of the liquid sets the upper
operational limits for gas and liquid flow rates. Figure 6.21 compares the test
conditions to the flooding line for non-wetting flows proposed by Standish (1973). The
liquid and gas flow rates were well below the flooding line. Therefore, the gas and liquid flow rates can be further increased in order to intensify the desulphurisation
reactions, thus reducing the volume of the scrubber required to process fuel gases.
Figure 6.22 shows the effects of the gas and tin flow rates on the pressure drop in
the bed. The pressure drop increased from 17 to 70 mmH2O with the increase in the
gas and liquid superficial velocities due to higher resistance to the flow and increased
liquid hold-up. With very low Reynolds numbers (76-115) for the gas, the trend is
almost proportional to the gas velocity. A significant increase in the pressure drop
was also noticed for the liquid superficial velocity of 5.52x10"4 m/s. This can be due to
the liquid accumulating above the support plate at the bed bottom and acting as baffles for the gas flowing through the holes (Mackey and Warner, 1973).
142
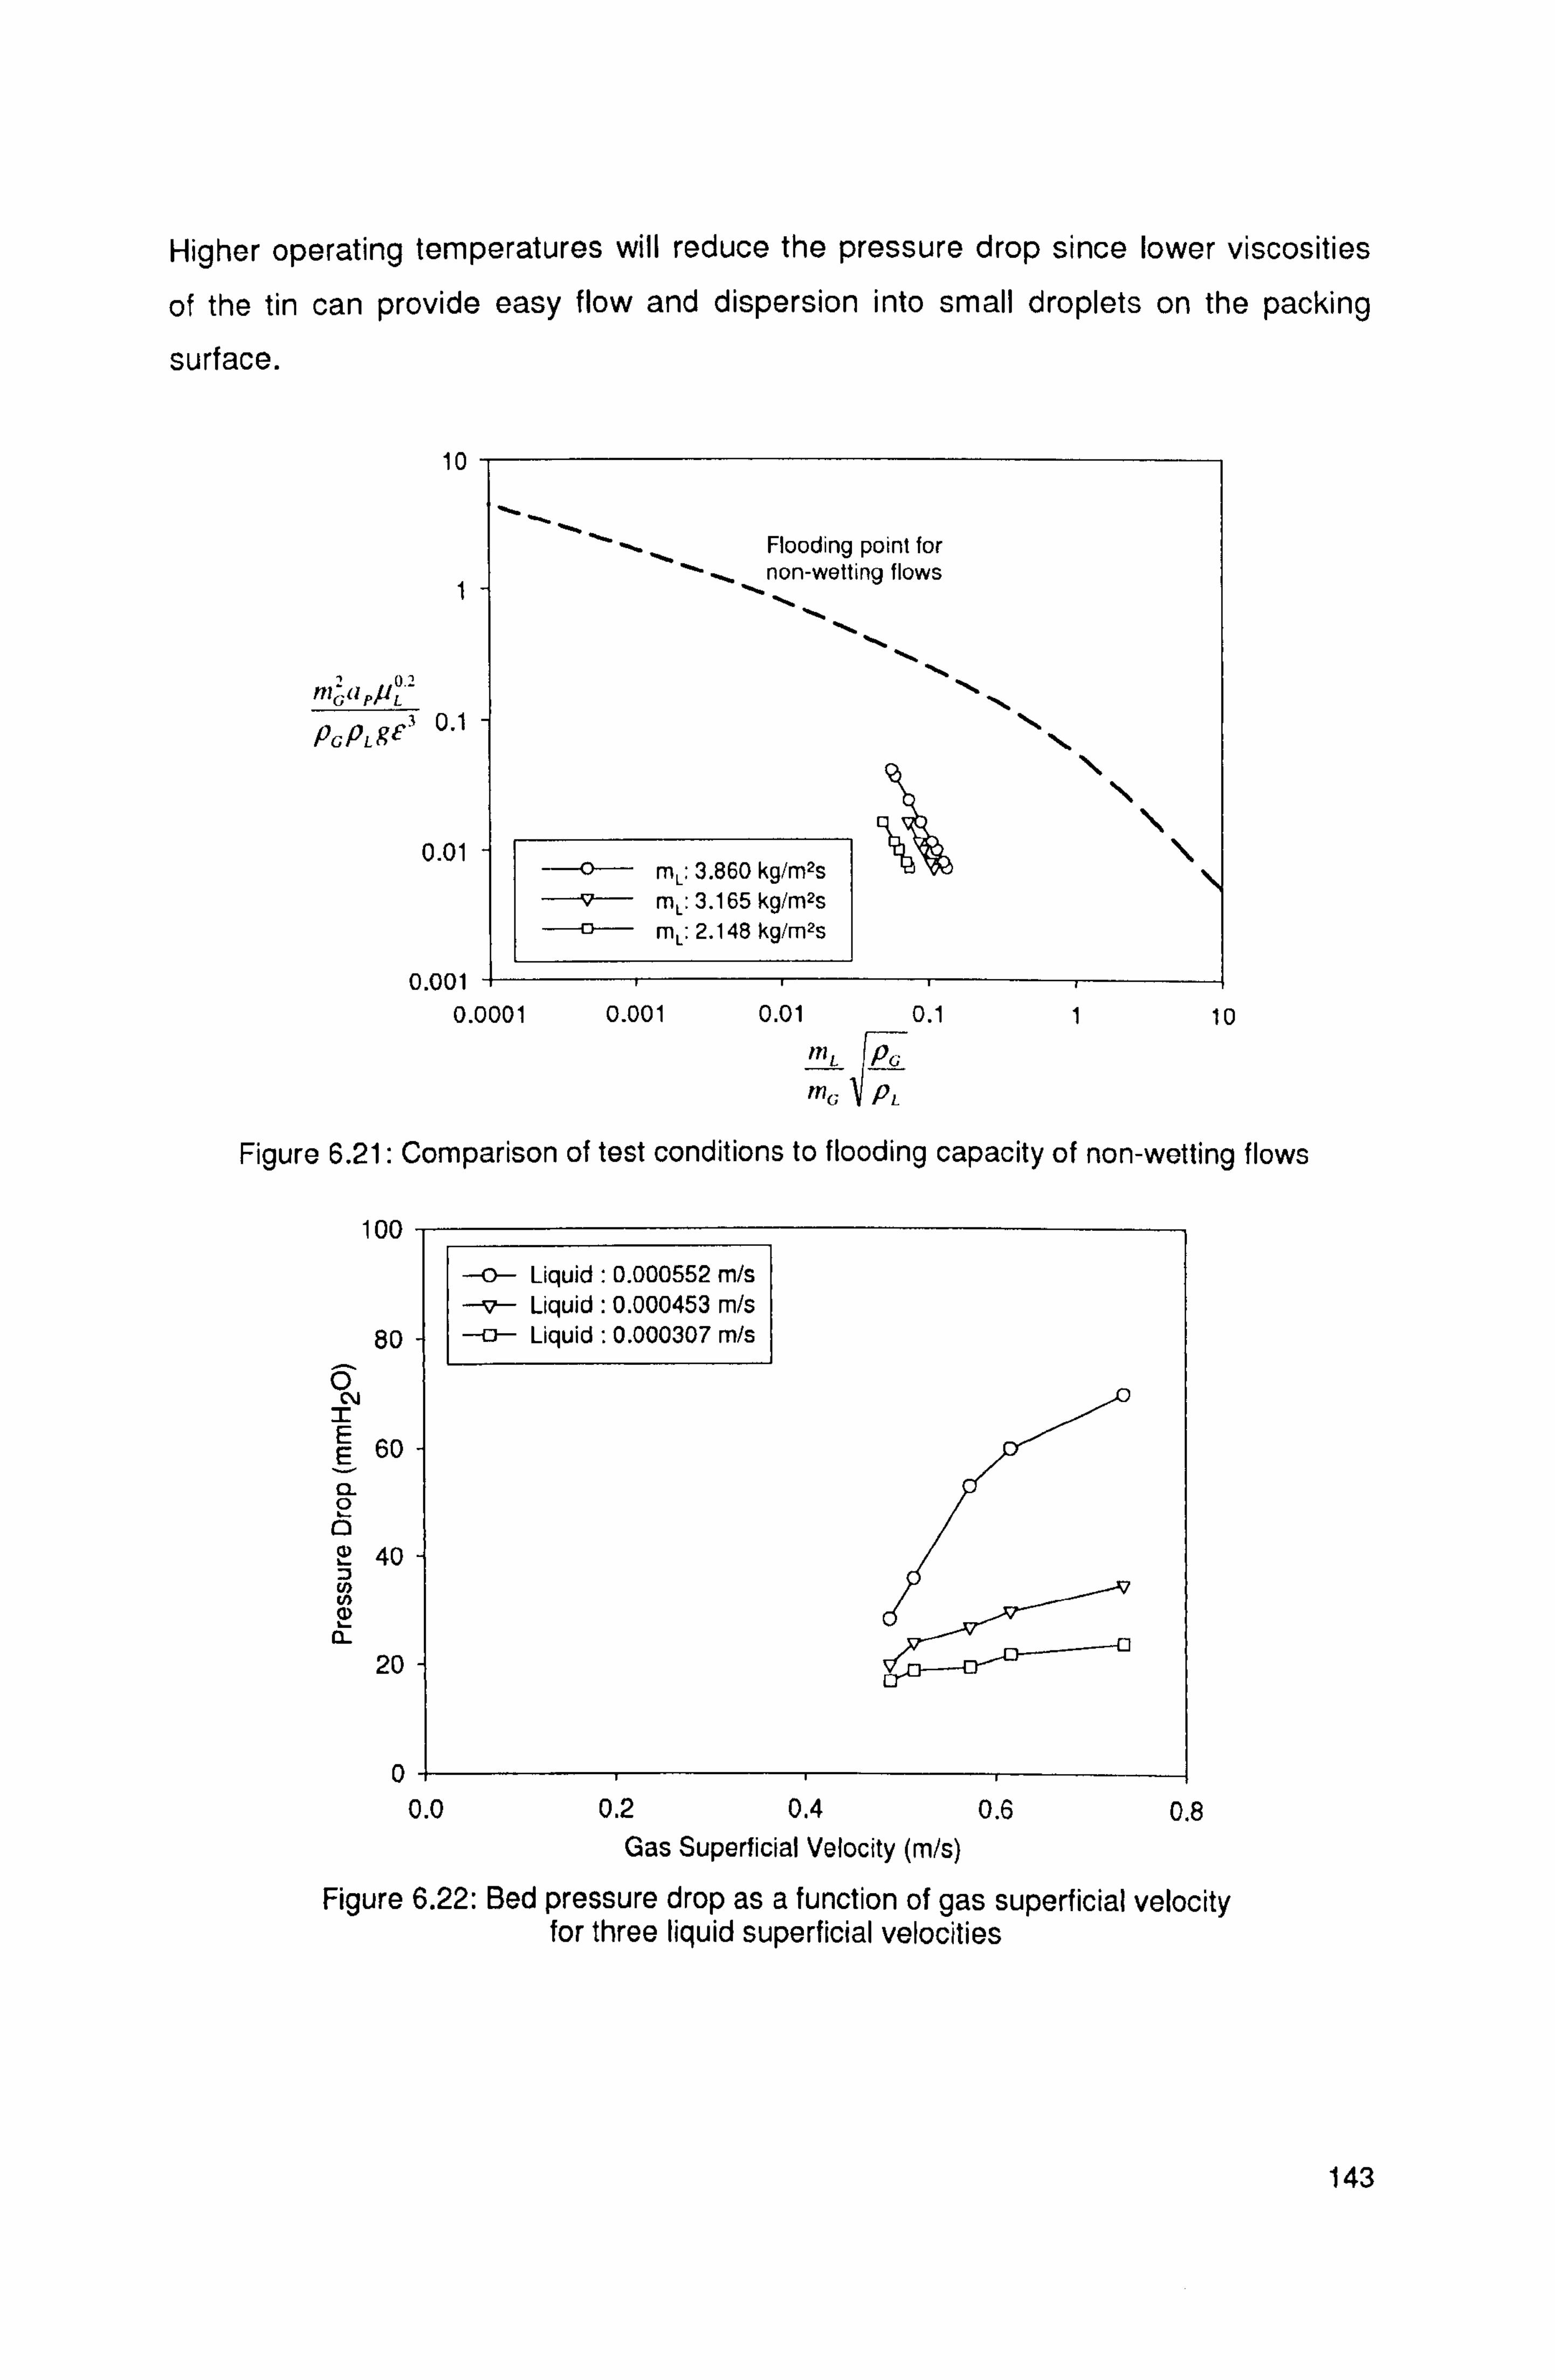
Higher operating temperatures will reduce the pressure drop since lower viscosities
of the tin can provide easy flow and dispersion into small droplets on the packing
surface.
10
I
o. 2 mGnPýL
PGPLge' 0.1
0.01
0.001
Flooding point for
_. non-wetting flows
0.0001 0.001 0.01 0.1 1 10 mý Pc;
me PL
Figure 6.21: Comparison of test conditions to flooding capacity of non-wetting flows
100
80
0 N 2 E 60 CL 0 D
2 40
N t/) N
IL
20
-0- Liquid : 0.000552 m/s -r Liquid : 0.000453 m/s -o- Liquid : 0.000307 m/s
0i 0.0 0.2 0.4 0.6 0.8
Gas Superficial Velocity (m/s)
Figure 6.22: Bed pressure drop as a function of gas superficial velocity for three liquid superficial velocities
gzý, -ýý
143

6.2.6 Effect of H2S Concentration
Figure 6.23 shows the History of H2S for the test duration with various gas inlet
concentrations. The desulphurisation efficiencies for various H2S concentration at the inlet are shown in Figure 6.24. The gas and tin flow rates were fixed at 0.258 and 3.860 kg/m2s, respectively, at 400°C. The increase in the inlet concentration of H2S
from 300 to 2000 ppm gradually reduced the removal efficiency from 95.9 to 71.5%
(see Table 6.5). Recalling Equation 6.16, this is due to the change in Ko while the gas
velocity and interfacial surface area are identical.
K° is determined by kG, kr and kL. kG is constant in this set of tests and is expected to
be faster than the other rates. Hedden (1986) postulated from the tests in a double-
stirred reactor that the reaction of H2S with Sn is of first order with kr of 0.012 to 0.020
m/s at 500°C. If the reaction is of first order, then HOG is determined mostly by kL, i. e., limited mass transfer rate of SnS in tin. In other words, how quickly the liquid surface
can be refreshed by dissolving SnS into tin becomes an important rate-controlling factor for increased amount of S (SnS) due to higher H2S concentrations.
1000
800
E CL a ö 600
0 c 400 0 U
_N 200
0
" 2000 ppm 0 1700 ppm
--fi -- 1300 ppm --- 1000 ppm -f- 502 ppm - -F)-- - 300 ppm
0
05 10 15 20 25 30 Operation Time (min)
Figure 6.23: History of H2S for the test duration with various gas inlet concentrations (liquid superficial velocity & gas superficial velocity constant)
144
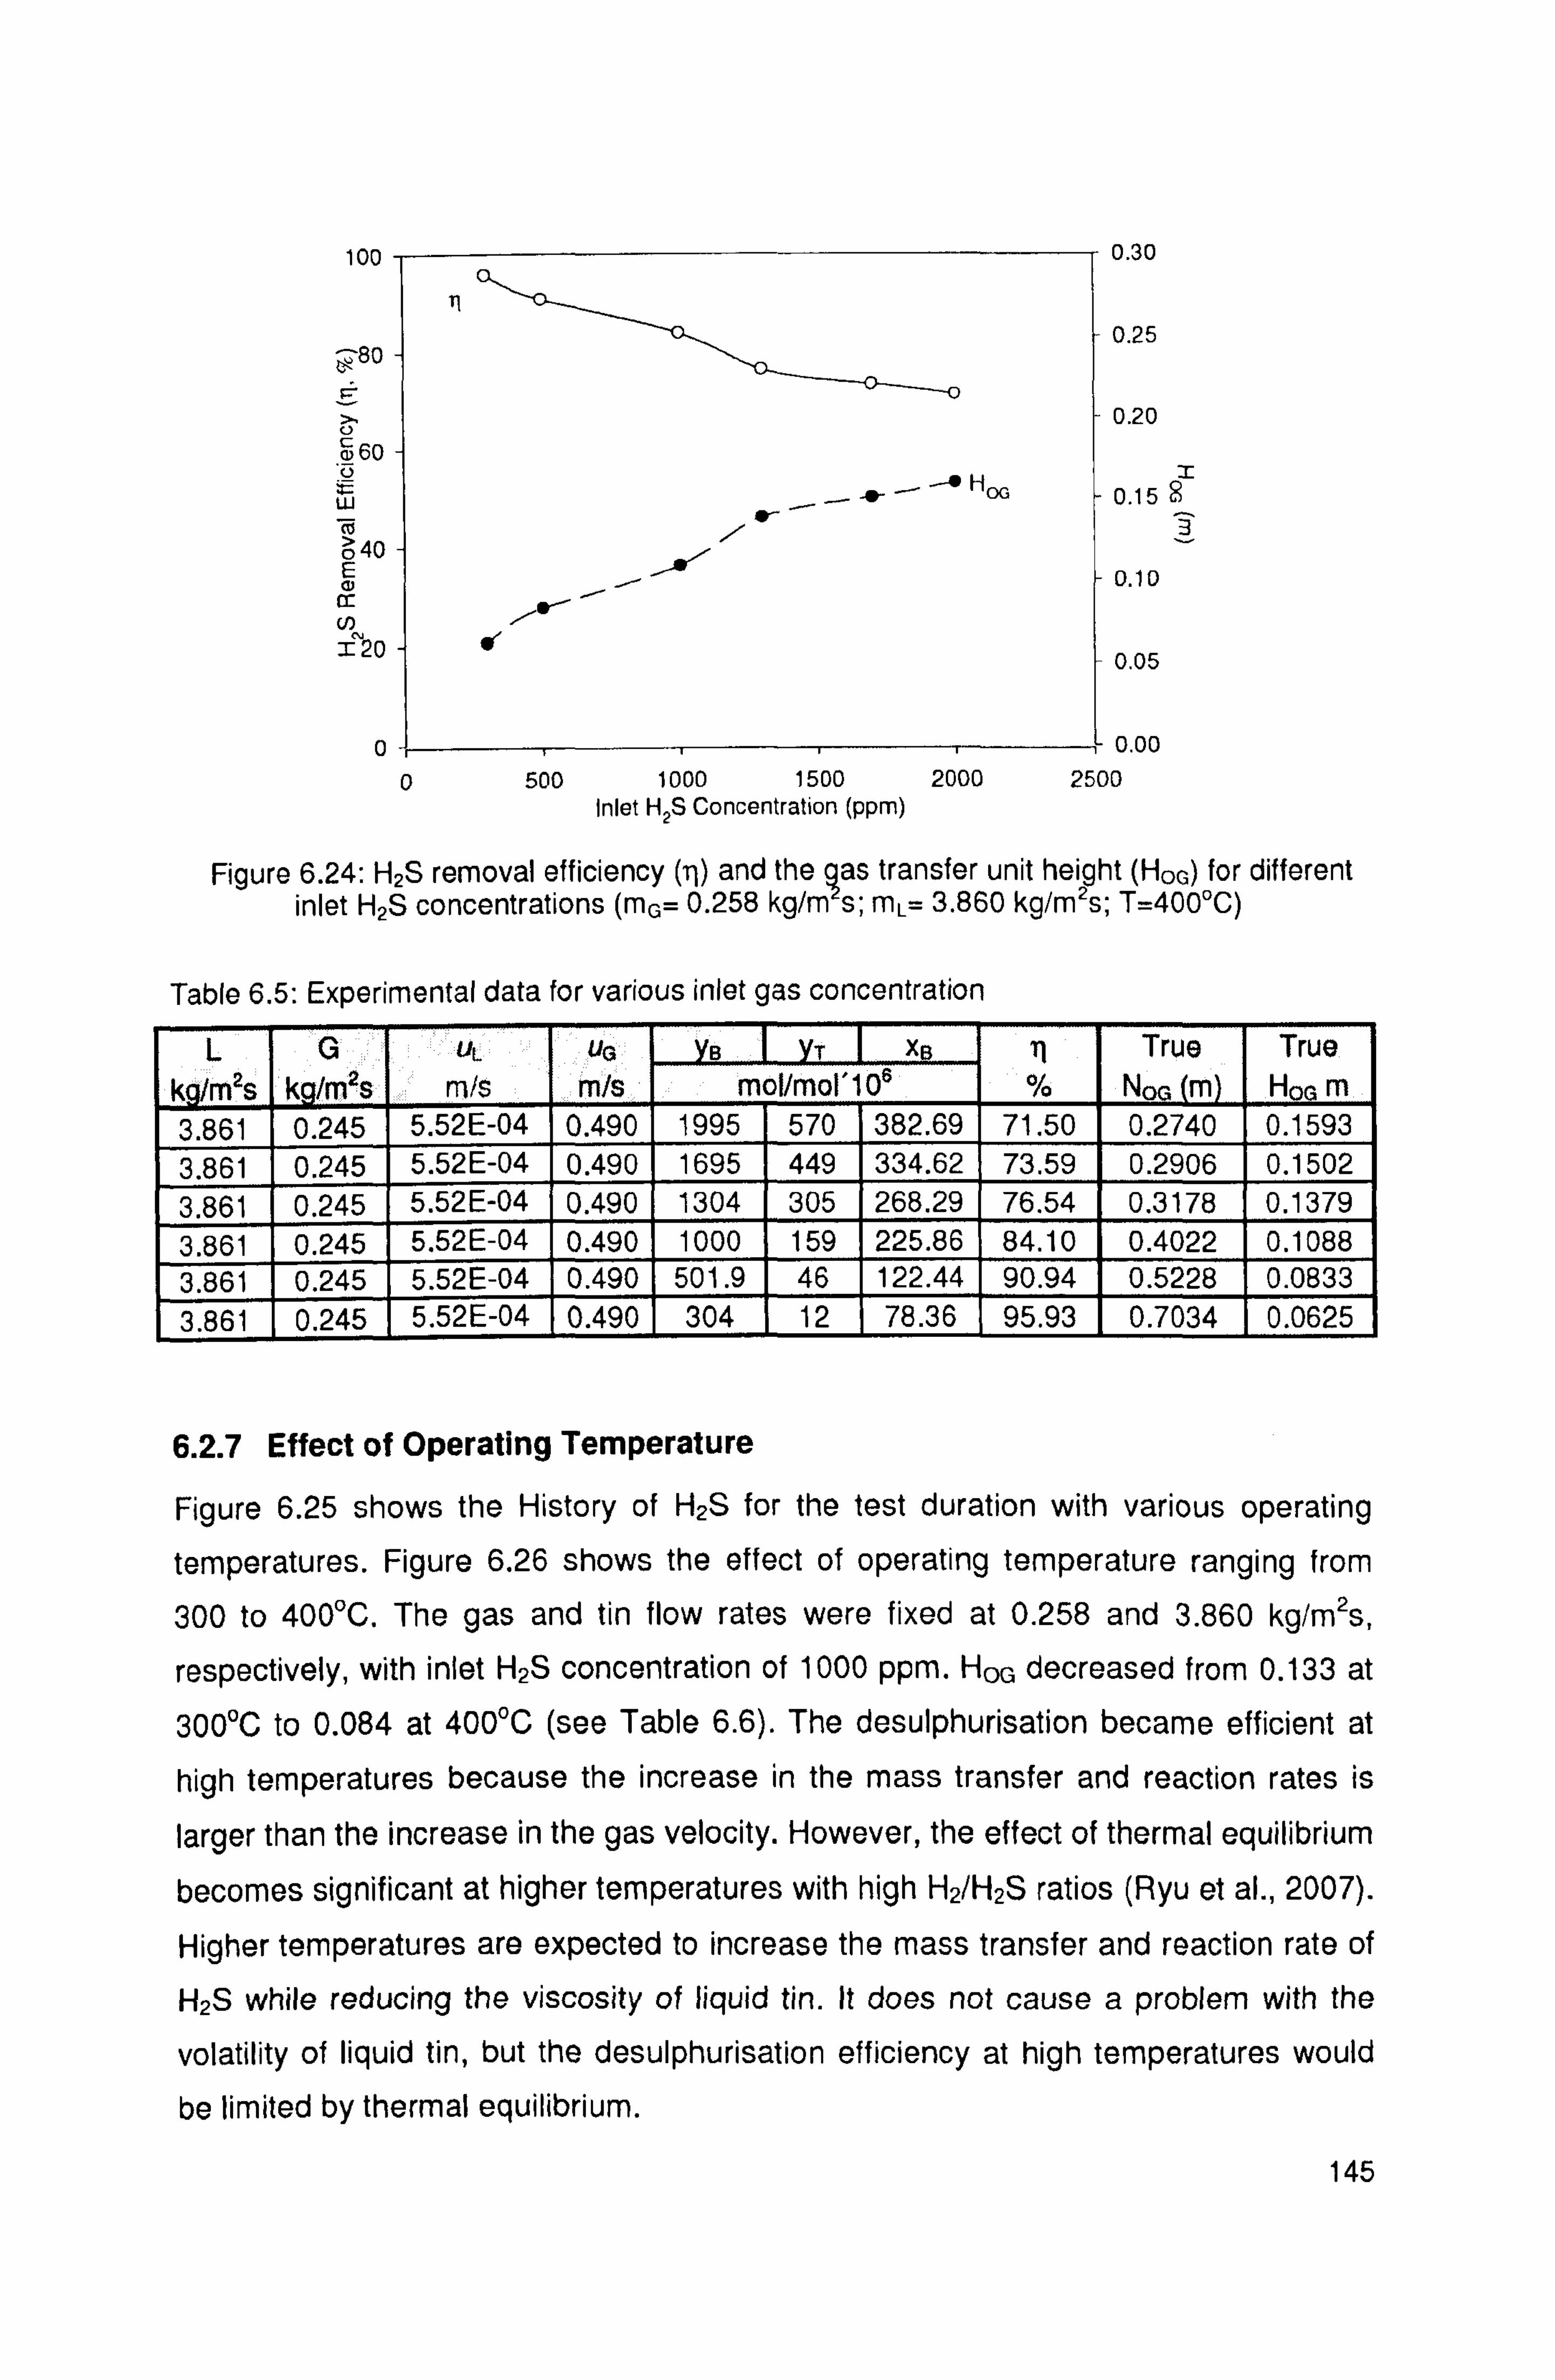
100
F80
pr
aý60 w W 75
6 40 E d cl,
=20
-+ HOG
/-r'
r
0 0 500 1000 1500 2000
Inlet H2S Concentration (ppm)
0.30
0.25
0.20
2 0.15 8
3
0.10
0.05
- 0.00
2500
Figure 6.24: H2S removal efficiency (i) and the as transfer unit height (HOG) for different inlet H2S concentrations (mG= 0.258 kg/m s; mL= 3.860 kg/m2s; T=400°C)
Table 6.5: Experimental data for various inlet gas concentration
L G UL U6 B r XB TI True True k /m2s k /mzs m/s m/s mol/mol 106 % NOG rn HOG m 3.861 0.245 5.52E-04 0.490 1995 570 382.69 71.50 0.2740 0.1593 3.861 0.245 5.52E-04 0.490 1695 449 334.62 73.59 0.2906 0.1502 3.861 0.245 5.52E-04 0.490 1304 305 268.29 76.54 0.3178 0.1379 3.861 0.245 5.52E-04 0.490 1000 159 225.86 84.10 0.4022 0.1088 3.861 0.245 5.52E-04 0.490 501.9 46 122.44 90.94 0.5228 0.0833 3.861 0.245 5.52E-04 0.490 304 12 78.36 95.93 0.7034 0.0625
6.2.7 Effect of Operating Temperature
Figure 6.25 shows the History of H2S for the test duration with various operating
temperatures. Figure 6.26 shows the effect of operating temperature ranging from
300 to 400°C. The gas and tin flow rates were fixed at 0.258 and 3.860 kg/m2s,
respectively, with inlet H2S concentration of 1000 ppm. Hoc, decreased from 0.133 at
NOT to 0.084 at 400°C (see Table 6.6). The desulphurisation became efficient at
high temperatures because the increase in the mass transfer and reaction rates is
larger than the increase in the gas velocity. However, the effect of thermal equilibrium
becomes significant at higher temperatures with high H2/H2S ratios (Ryu et al., 2007).
Higher temperatures are expected to increase the mass transfer and reaction rate of
H2S while reducing the viscosity of liquid tin. It does not cause a problem with the
volatility of liquid tin, but the desulphurisation efficiency at high temperatures would
be limited by thermal equilibrium.
145
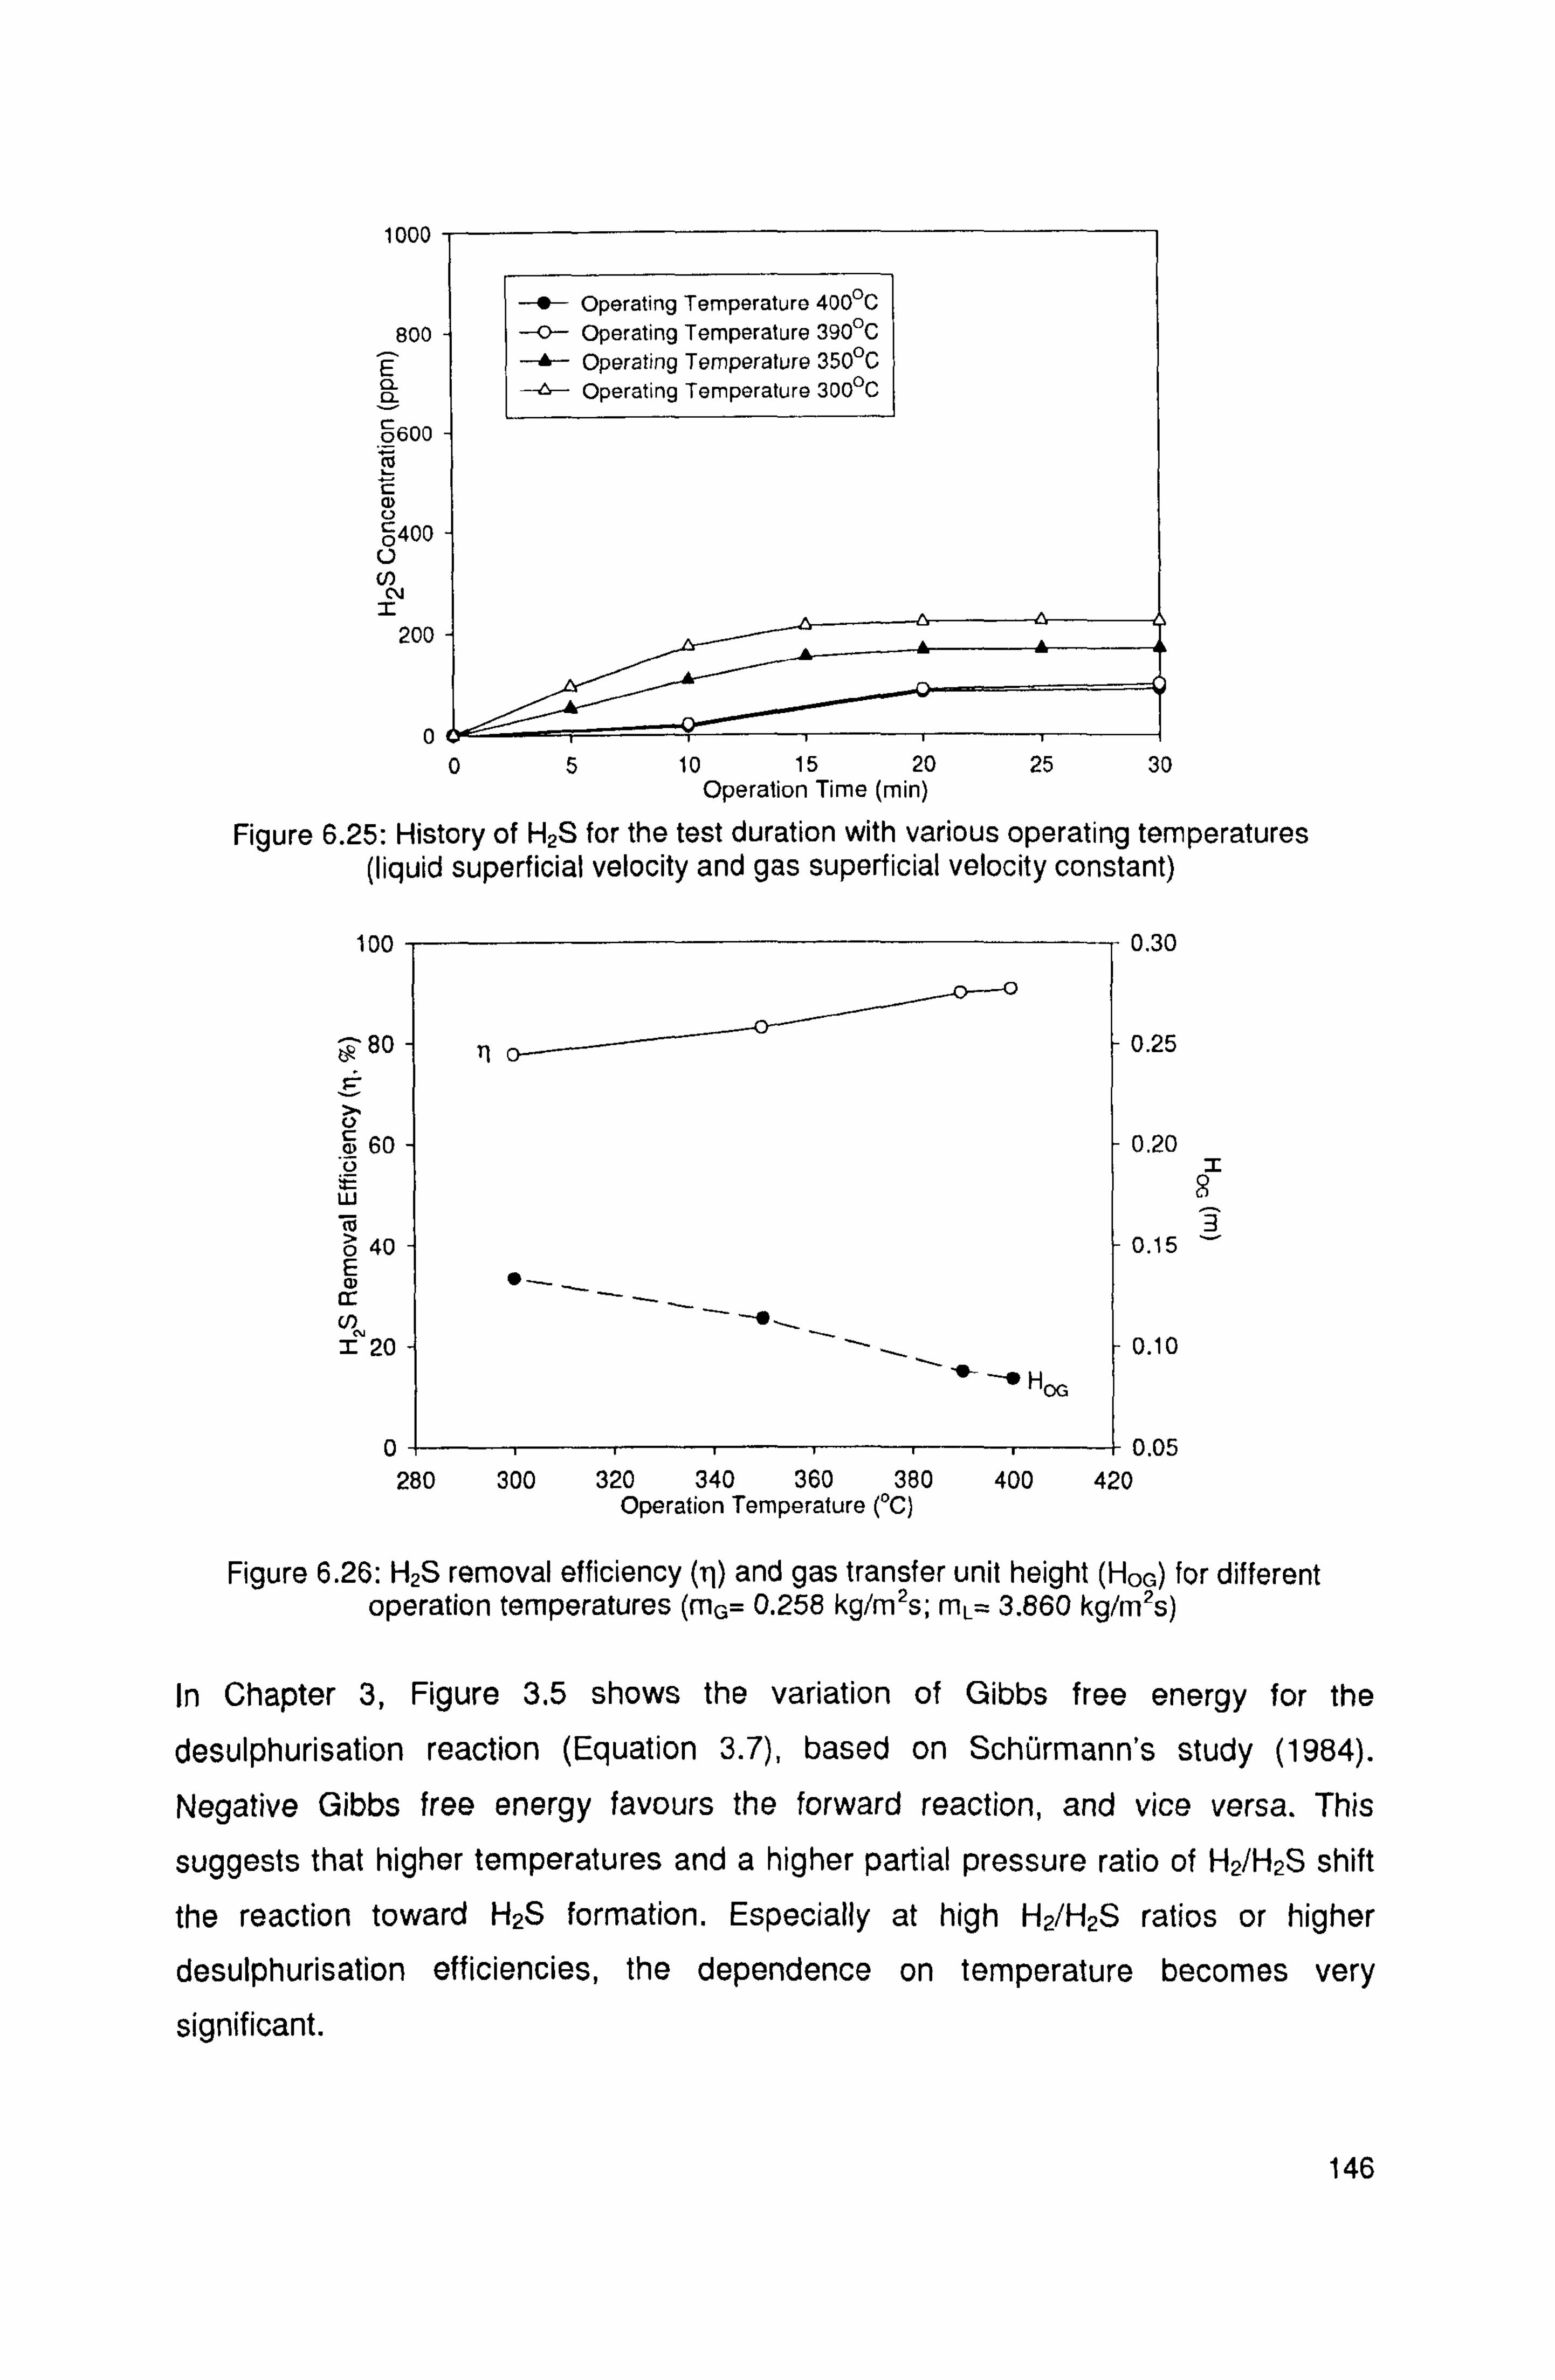
1000
800 E Q-
0600
cz
--*- Operating Temperature 400°C
--0- Operating Temperature 390°C
-s- Operating Temperature 350°C Operating Temperature 300°C
C a) 0400 U
N S
200
o- 05 10 15 20 25 30
Operation Time (min)
Figure 6.25: History of H2S for the test duration with various operating temperatures (liquid superficial velocity and gas superficial velocity constant)
100
F80
T U
60
W ro ö 40 E a,
z 20
0 4- 280
11
-+ H
300 320 340 360 380 400 Operation Temperature (°C)
0.30
0.25
0.20
3 0.15
0.10
0.05 420
Figure 6.26: H2S removal efficiency (r1) and gas transfer unit height (HOG) for different operation temperatures (m0= 0.258 kg/m2s; ML= 3.860 kg/m2s)
In Chapter 3, Figure 3.5 shows the variation of Gibbs free energy for the
desulphurisation reaction (Equation 3.7), based on Schürmann's study (1984).
Negative Gibbs free energy favours the forward reaction, and vice versa. This
suggests that higher temperatures and a higher partial pressure ratio of H2/H2S shift
the reaction toward H2S formation. Especially at high H2/H2S ratios or higher
desulphurisation efficiencies, the dependence on temperature becomes very
significant.
146
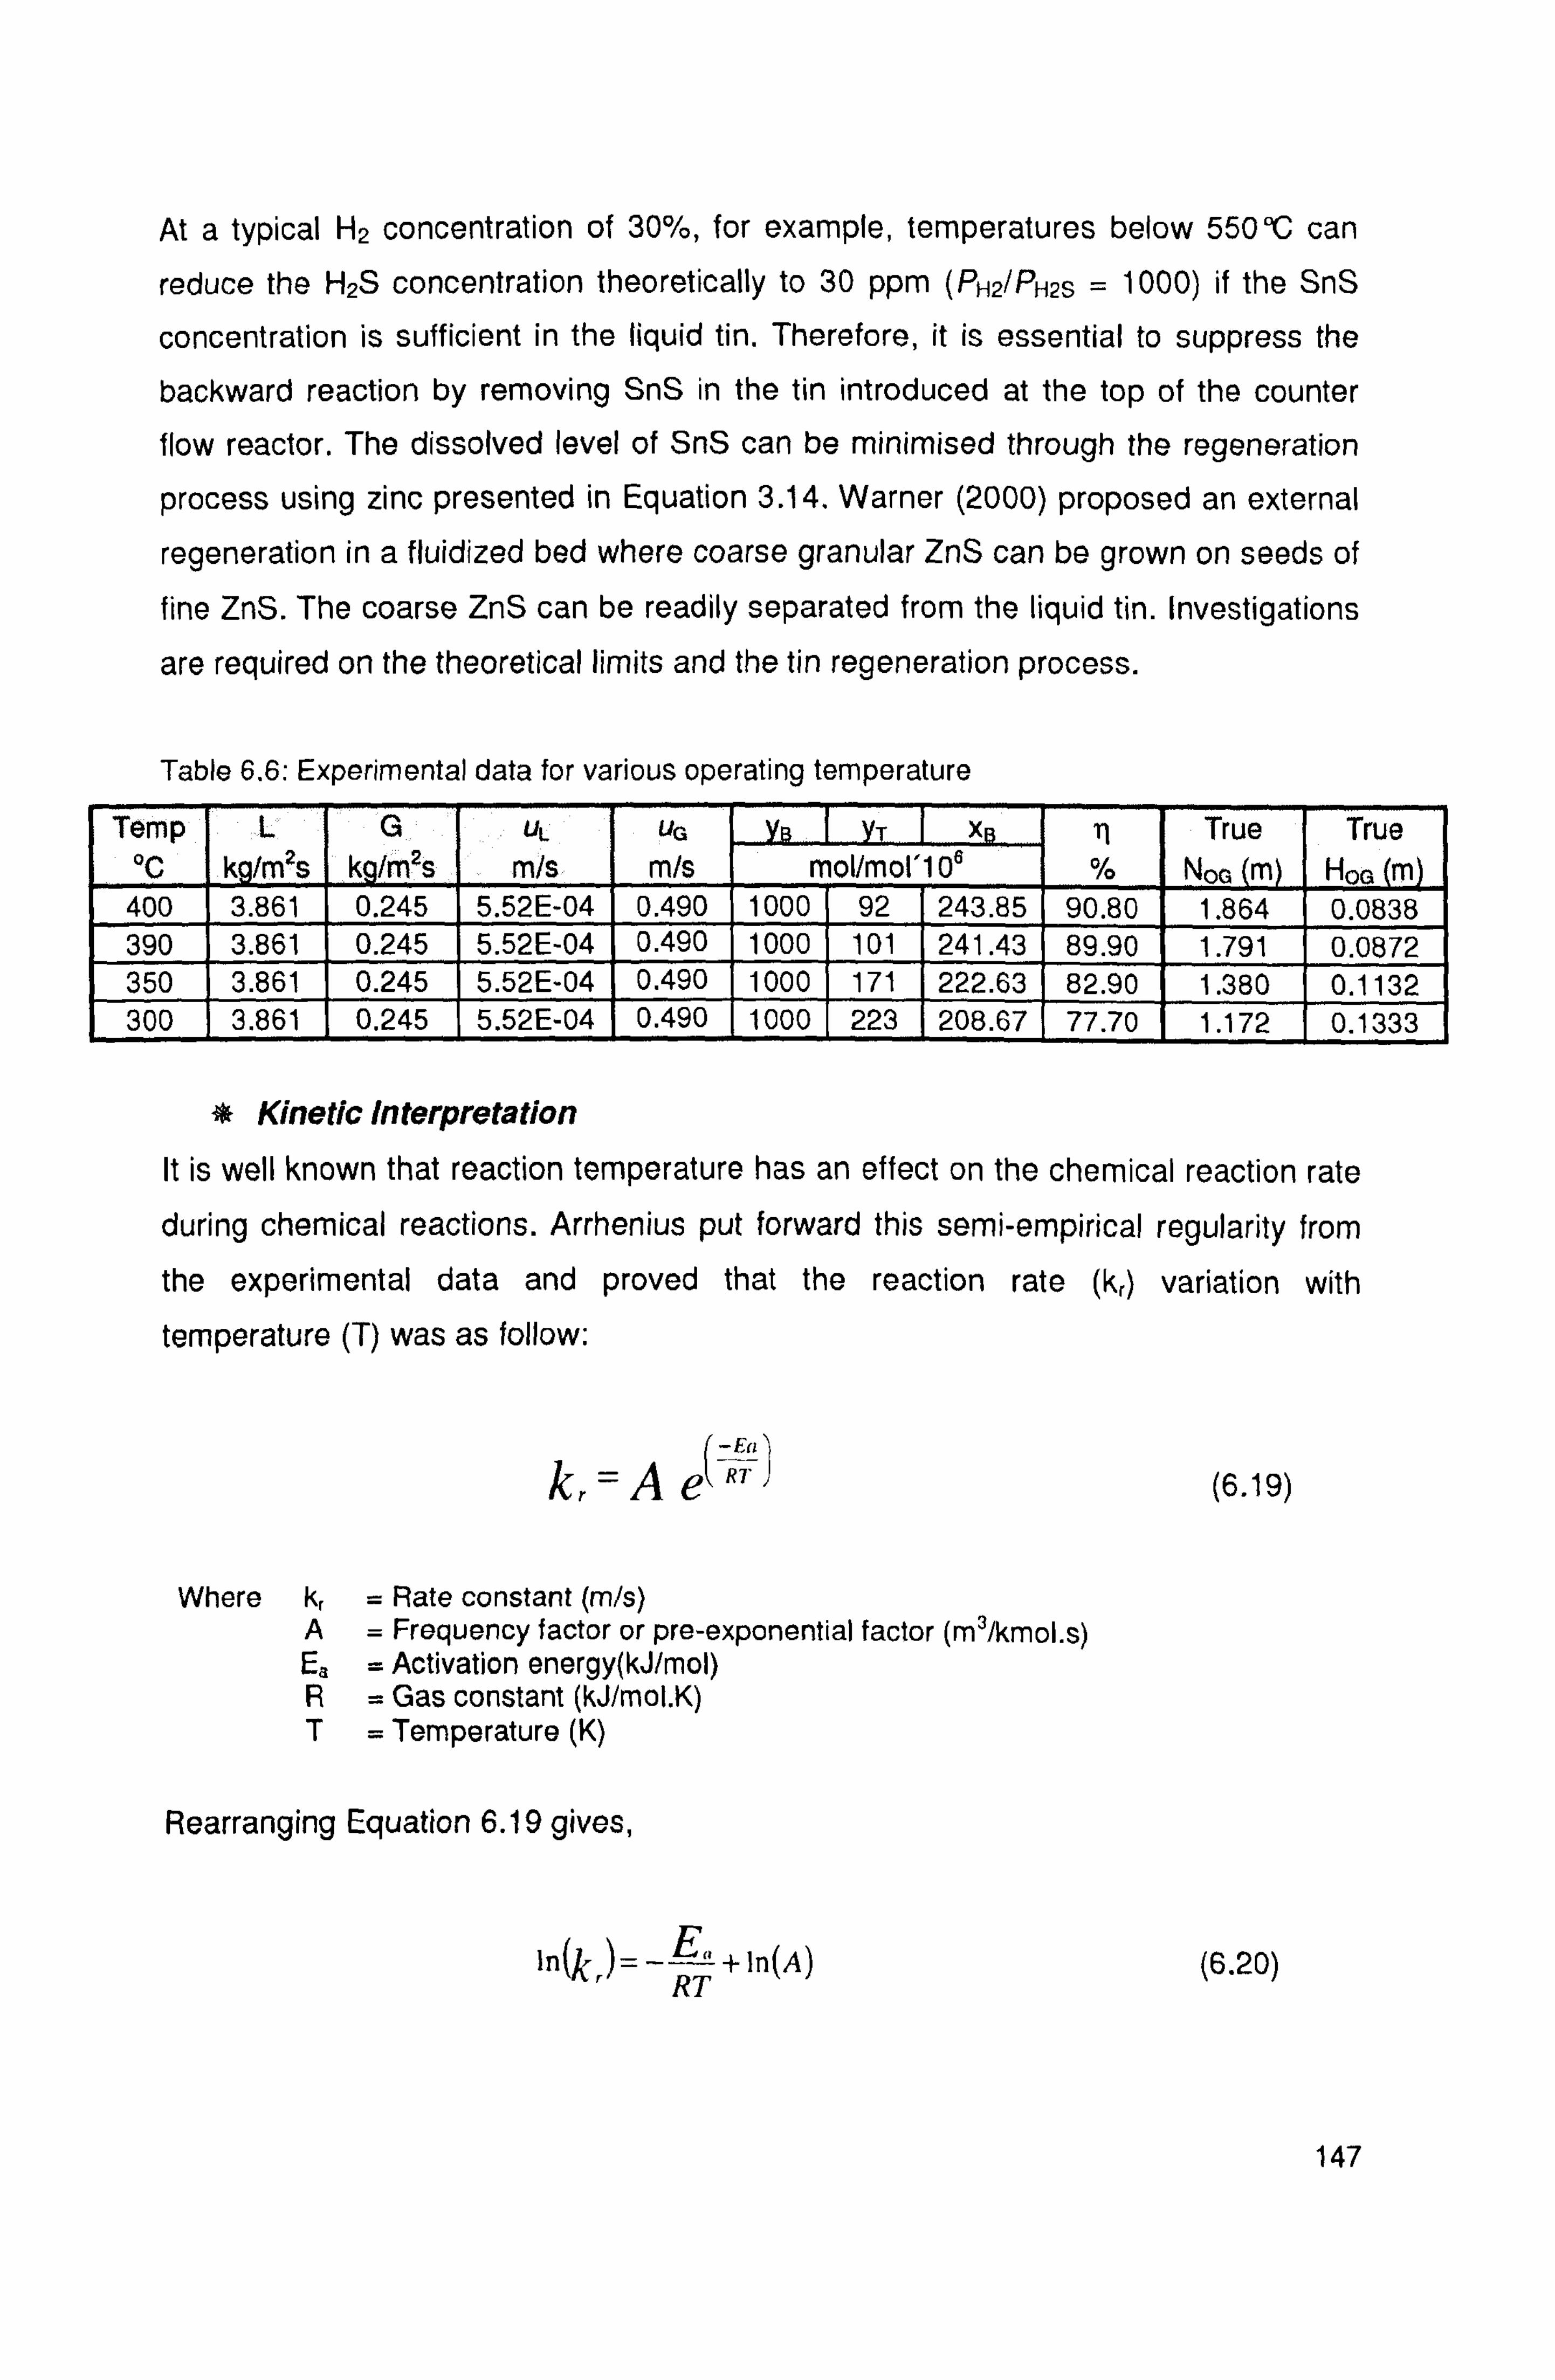
At a typical H2 concentration of 30%, for example, temperatures below 5500C can
reduce the H2S concentration theoretically to 30 ppm (PH2/PH2S = 1000) if the SnS
concentration is sufficient in the liquid tin. Therefore, it is essential to suppress the
backward reaction by removing SnS in the tin introduced at the top of the counter
flow reactor. The dissolved level of SnS can be minimised through the regeneration
process using zinc presented in Equation 3.14. Warner (2000) proposed an external
regeneration in a fluidized bed where coarse granular ZnS can be grown on seeds of
fine ZnS. The coarse ZnS can be readily separated from the liquid tin. Investigations
are required on the theoretical limits and the tin regeneration process.
Table 6.6: Experimental data for various operating temperature
Temp L G UL UG YS I YT I XB 11 True True
°C k /mzs k /m2s m/s m/s mol/mol'10' % NoG (m) H00 (m)
400 3.861 0.245 5.52E-04 0.490 1000 92 243.85 90.80 1.864 0.0838 390 3.861 0.245 5.52E-04 0.490 1000 101 241.43 89.90 1.791 0.0872 350 3.861 0.245 5.52E-04 0.490 1000 171 222.63 82.90 1.380 0.1132 300 3.861 0.245 5.52E-04 0.490 1000 223 208.67 77.70 1.172 0.1333
* Kinetic Interpretation
It is well known that reaction temperature has an effect on the chemical reaction rate during chemical reactions. Arrhenius put forward this semi-empirical regularity from
the experimental data and proved that the reaction rate (kr) variation with temperature (T) was as follow:
(-Ea kr A e` R' (6.19)
Where kK = Rate constant (m/s) A= Frequency factor or pre-exponential factor (m3/kmol. s) Ea = Activation energy(kJ/mol) R= Gas constant (kJ/mol. K) T= Temperature (K)
Rearranging Equation 6.19 gives,
ln(]{ )=-E""+]n(A) (6.20)
147
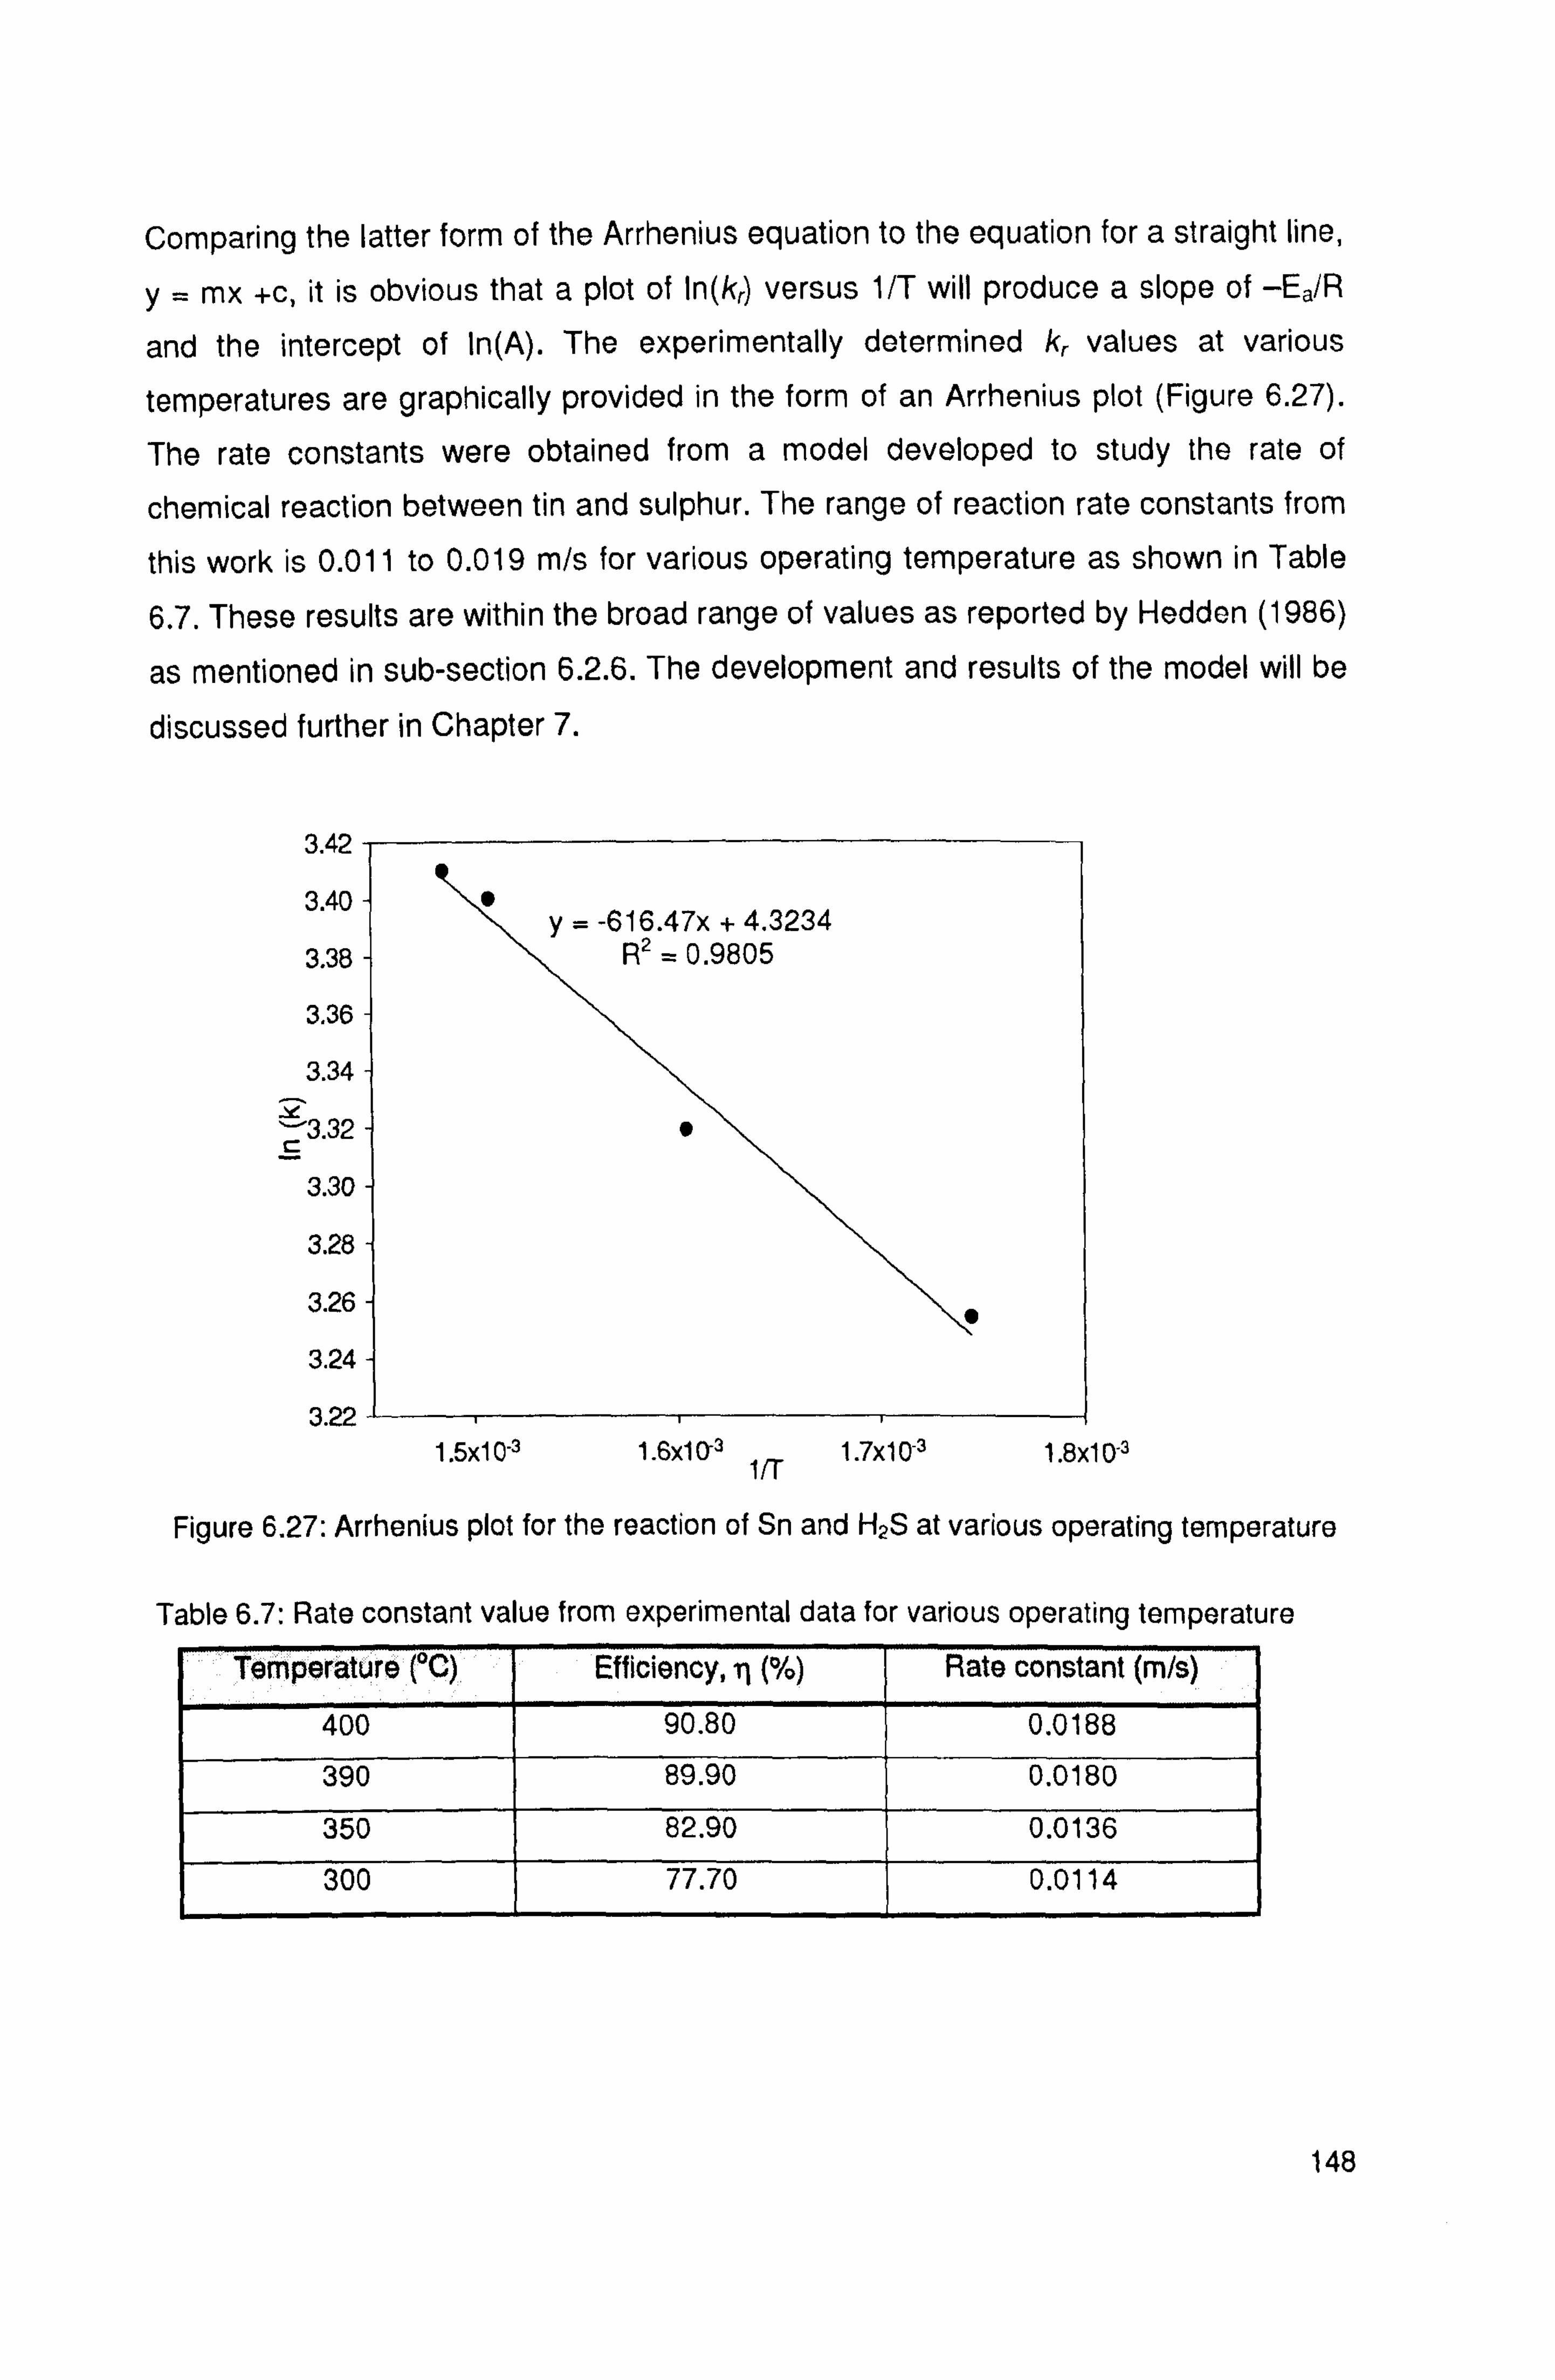
Comparing the latter form of the Arrhenius equation to the equation for a straight line,
y= mx +c, it is obvious that a plot of ln(k, ) versus 1/T will produce a slope of -Ea/R
and the intercept of In(A). The experimentally determined kr values at various
temperatures are graphically provided in the form of an Arrhenius plot (Figure 6.27).
The rate constants were obtained from a model developed to study the rate of
chemical reaction between tin and sulphur. The range of reaction rate constants from
this work is 0.011 to 0.019 m/s for various operating temperature as shown in Table
6.7. These results are within the broad range of values as reported by Hedden (1986)
as mentioned in sub-section 6.2.6. The development and results of the model will be
discussed further in Chapter 7.
3.42
3.40
3.38
3.3E
3.34
3.3,
3.3C
3.2E
3.2E
3.2ý
3. Z 1.5x10⁻³ 1.6x10³
1/T 1.7x10⁻³ 1.8x10⁻³
Figure 6.27: Arrhenius plot for the reaction of Sn and H2S at various operating temperature
Table 6.7: Rate constant value from experimental data for various operating temperature
Temperature (°C) Efficiency, il (%) Rate constant (m/s)
400 90.80 0.0188
390 89.90 0.0180
350 82.90 0.0136
300 77.70 0.0114
148
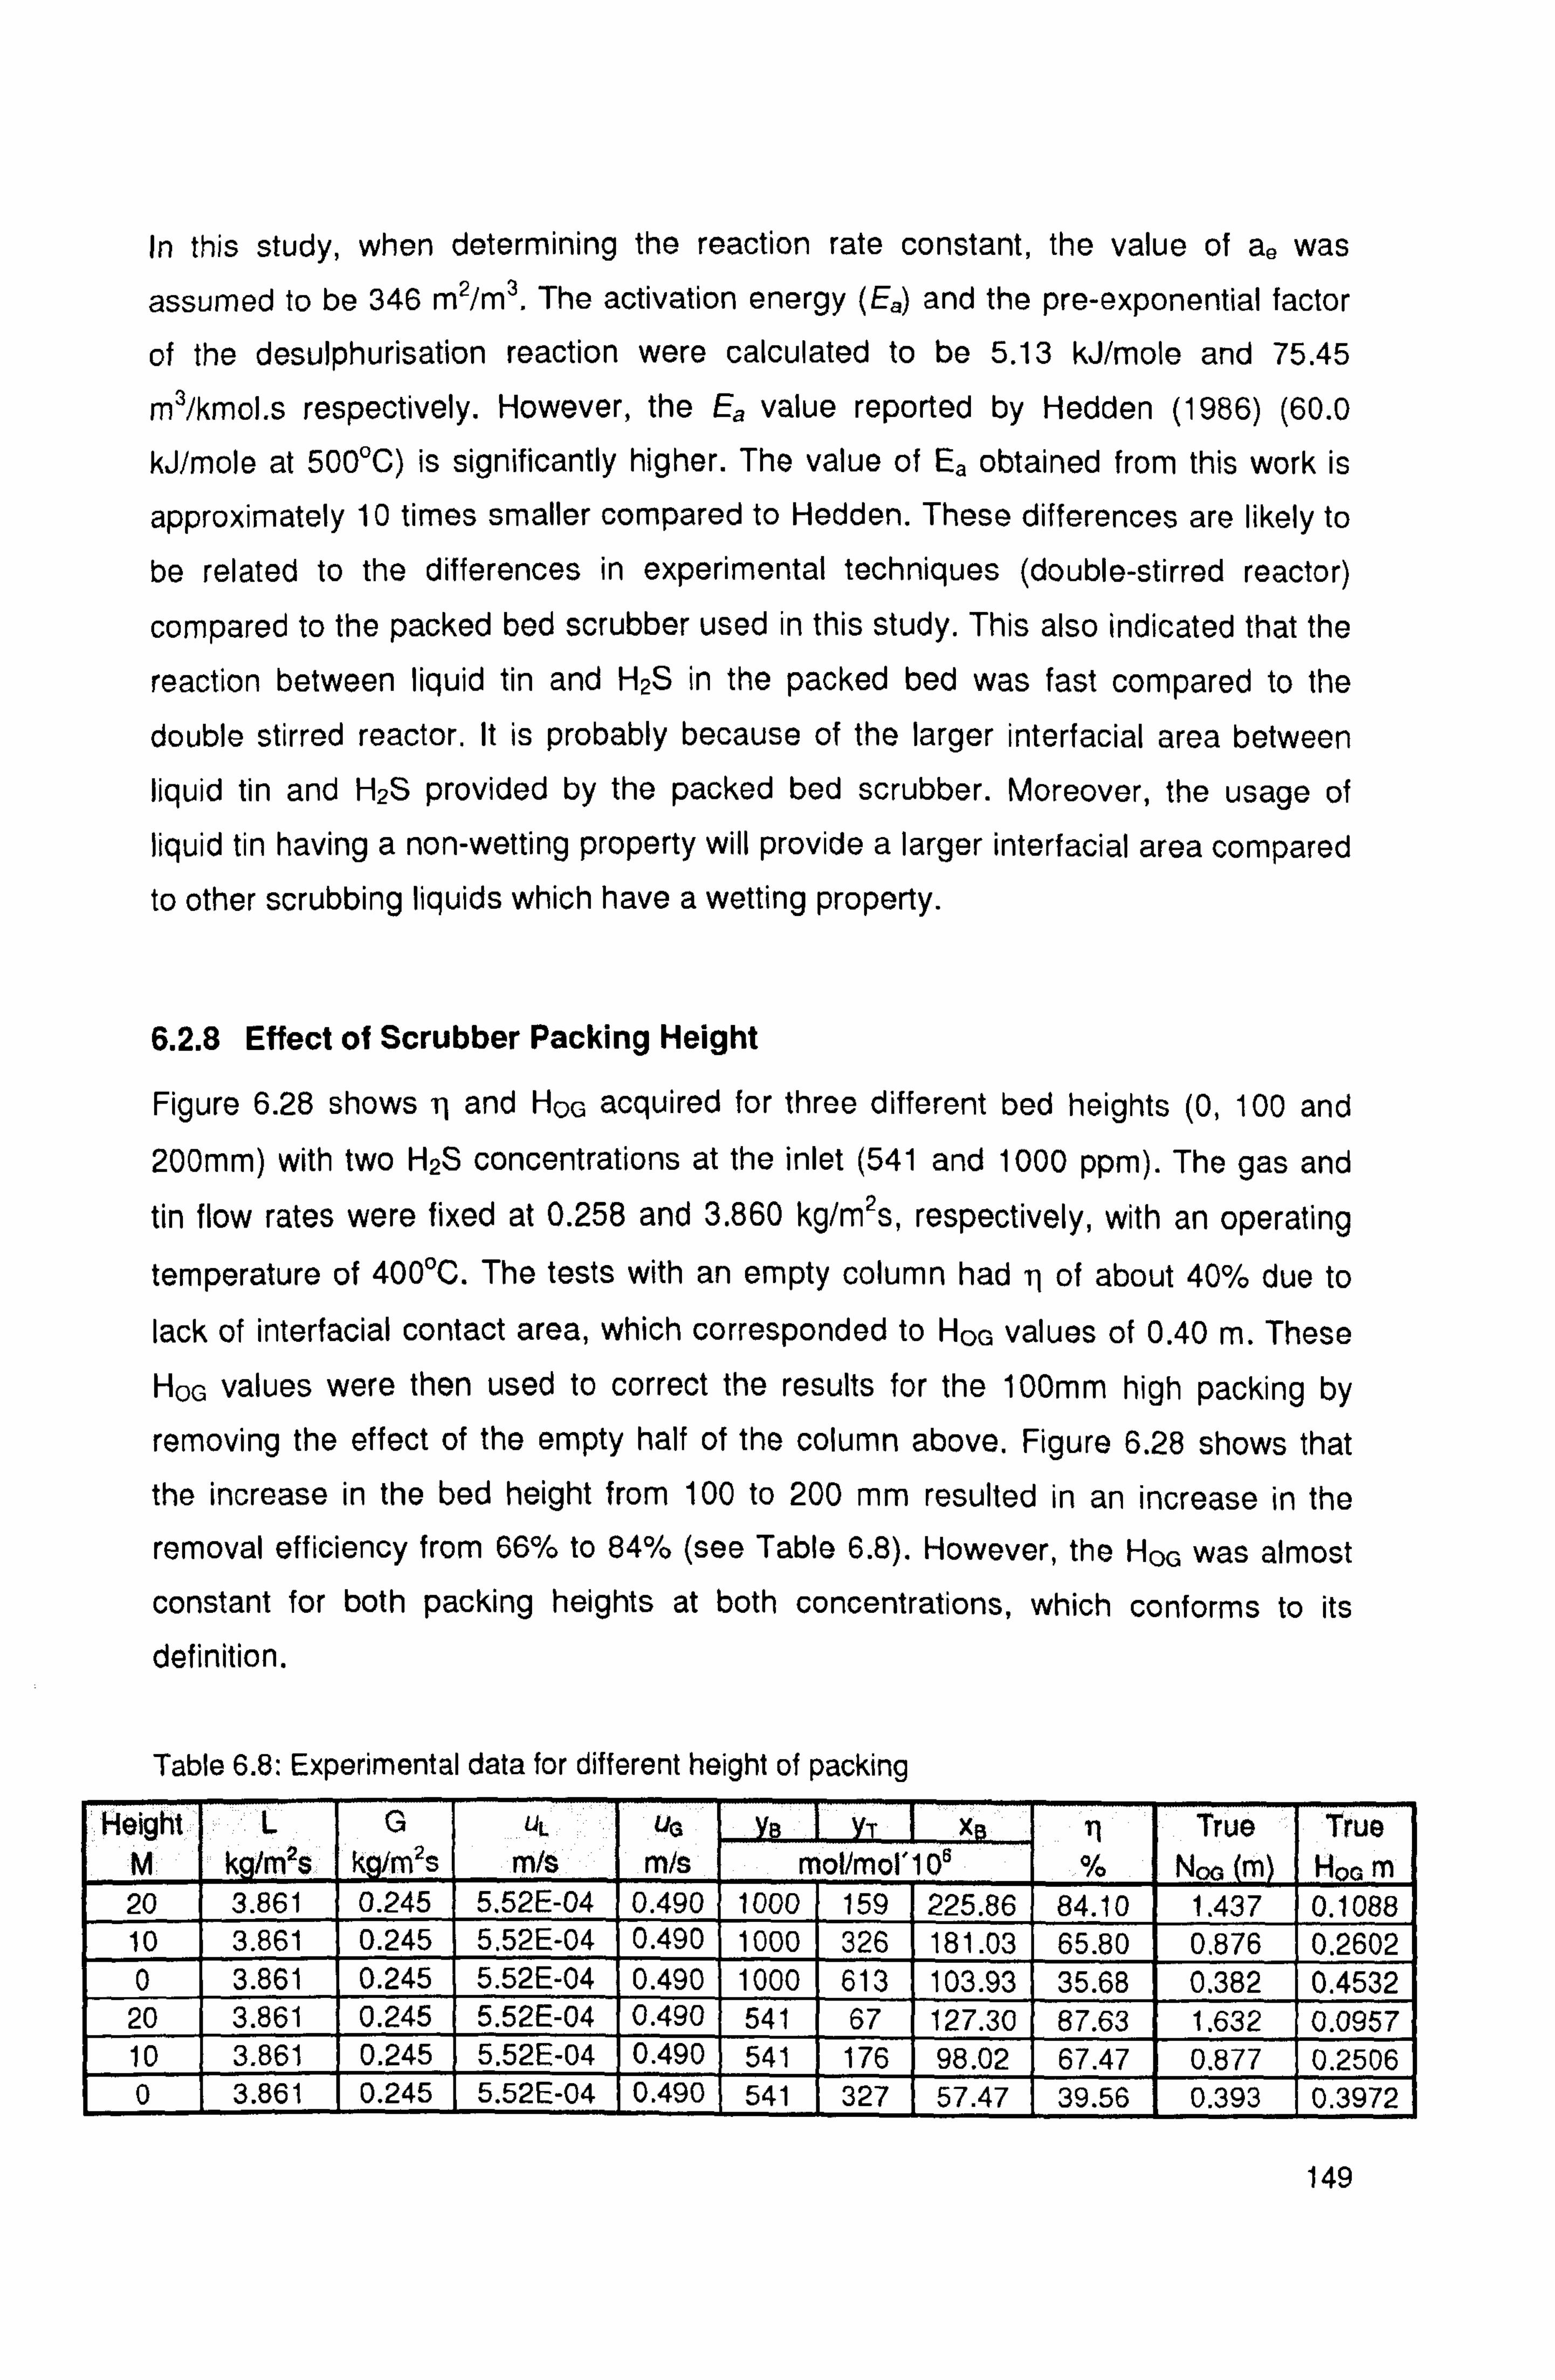
In this study, when determining the reaction rate constant, the value of ae was
assumed to be 346 m2/m3. The activation energy (Ea) and the pre-exponential factor
of the desulphurisation reaction were calculated to be 5.13 kJ/mole and 75.45
m3/kmol. s respectively. However, the Ea value reported by Hedden (1986) (60.0
kJ/mole at 500°C) is significantly higher. The value of Ea obtained from this work is
approximately 10 times smaller compared to Hedden. These differences are likely to
be related to the differences in experimental techniques (double-stirred reactor)
compared to the packed bed scrubber used in this study. This also indicated that the
reaction between liquid tin and H2S in the packed bed was fast compared to the
double stirred reactor. It is probably because of the larger interfacial area between
liquid tin and H2S provided by the packed bed scrubber. Moreover, the usage of liquid tin having a non-wetting property will provide a larger interfacial area compared to other scrubbing liquids which have a wetting property.
6.2.8 Effect of Scrubber Packing Height
Figure 6.28 shows q and HoG acquired for three different bed heights (0,100 and 200mm) with two H2S concentrations at the inlet (541 and 1000 ppm). The gas and tin flow rates were fixed at 0.258 and 3.860 kg/m2s, respectively, with an operating temperature of 400°C. The tests with an empty column had q of about 40% due to
lack of interfacial contact area, which corresponded to HOG values of 0.40 m. These HOG values were then used to correct the results for the 100mm high packing by
removing the effect of the empty half of the column above. Figure 6.28 shows that
the increase in the bed height from 100 to 200 mm resulted in an increase in the
removal efficiency from 66% to 84% (see Table 6.8). However, the HOG was almost
constant for both packing heights at both concentrations, which conforms to its
definition.
Table 6.8: Experimental data for different height of packing
Height L G uL U x rt True True M k m2s k /m2s m/s m/s mol/mol'10B % Noa rn H00 m 20 3.861 0.245 5.52E-04 0.490 1000 159 225.86 84.10 1.437 0.1088 10 3.861 0.245 5.52E-04 0.490 1000 326 181.03 65.80 0.876 0.2602 0 3.861 0.245 5.52E-04 0.490 1000 613 103.93 35.68 0.382 0.4532 20 3.861 0.245 5.52E-04 0.490 541 67 127.30 87.63 1.632 0.0957 10 3.861 0.245 5.52E-04 0.490 541 176 98.02 67.47 0.877 0.2506 0 3.861 0.245 5.52E-04 0.490 541 327 57.47 39.56 0.393 0.3972
149
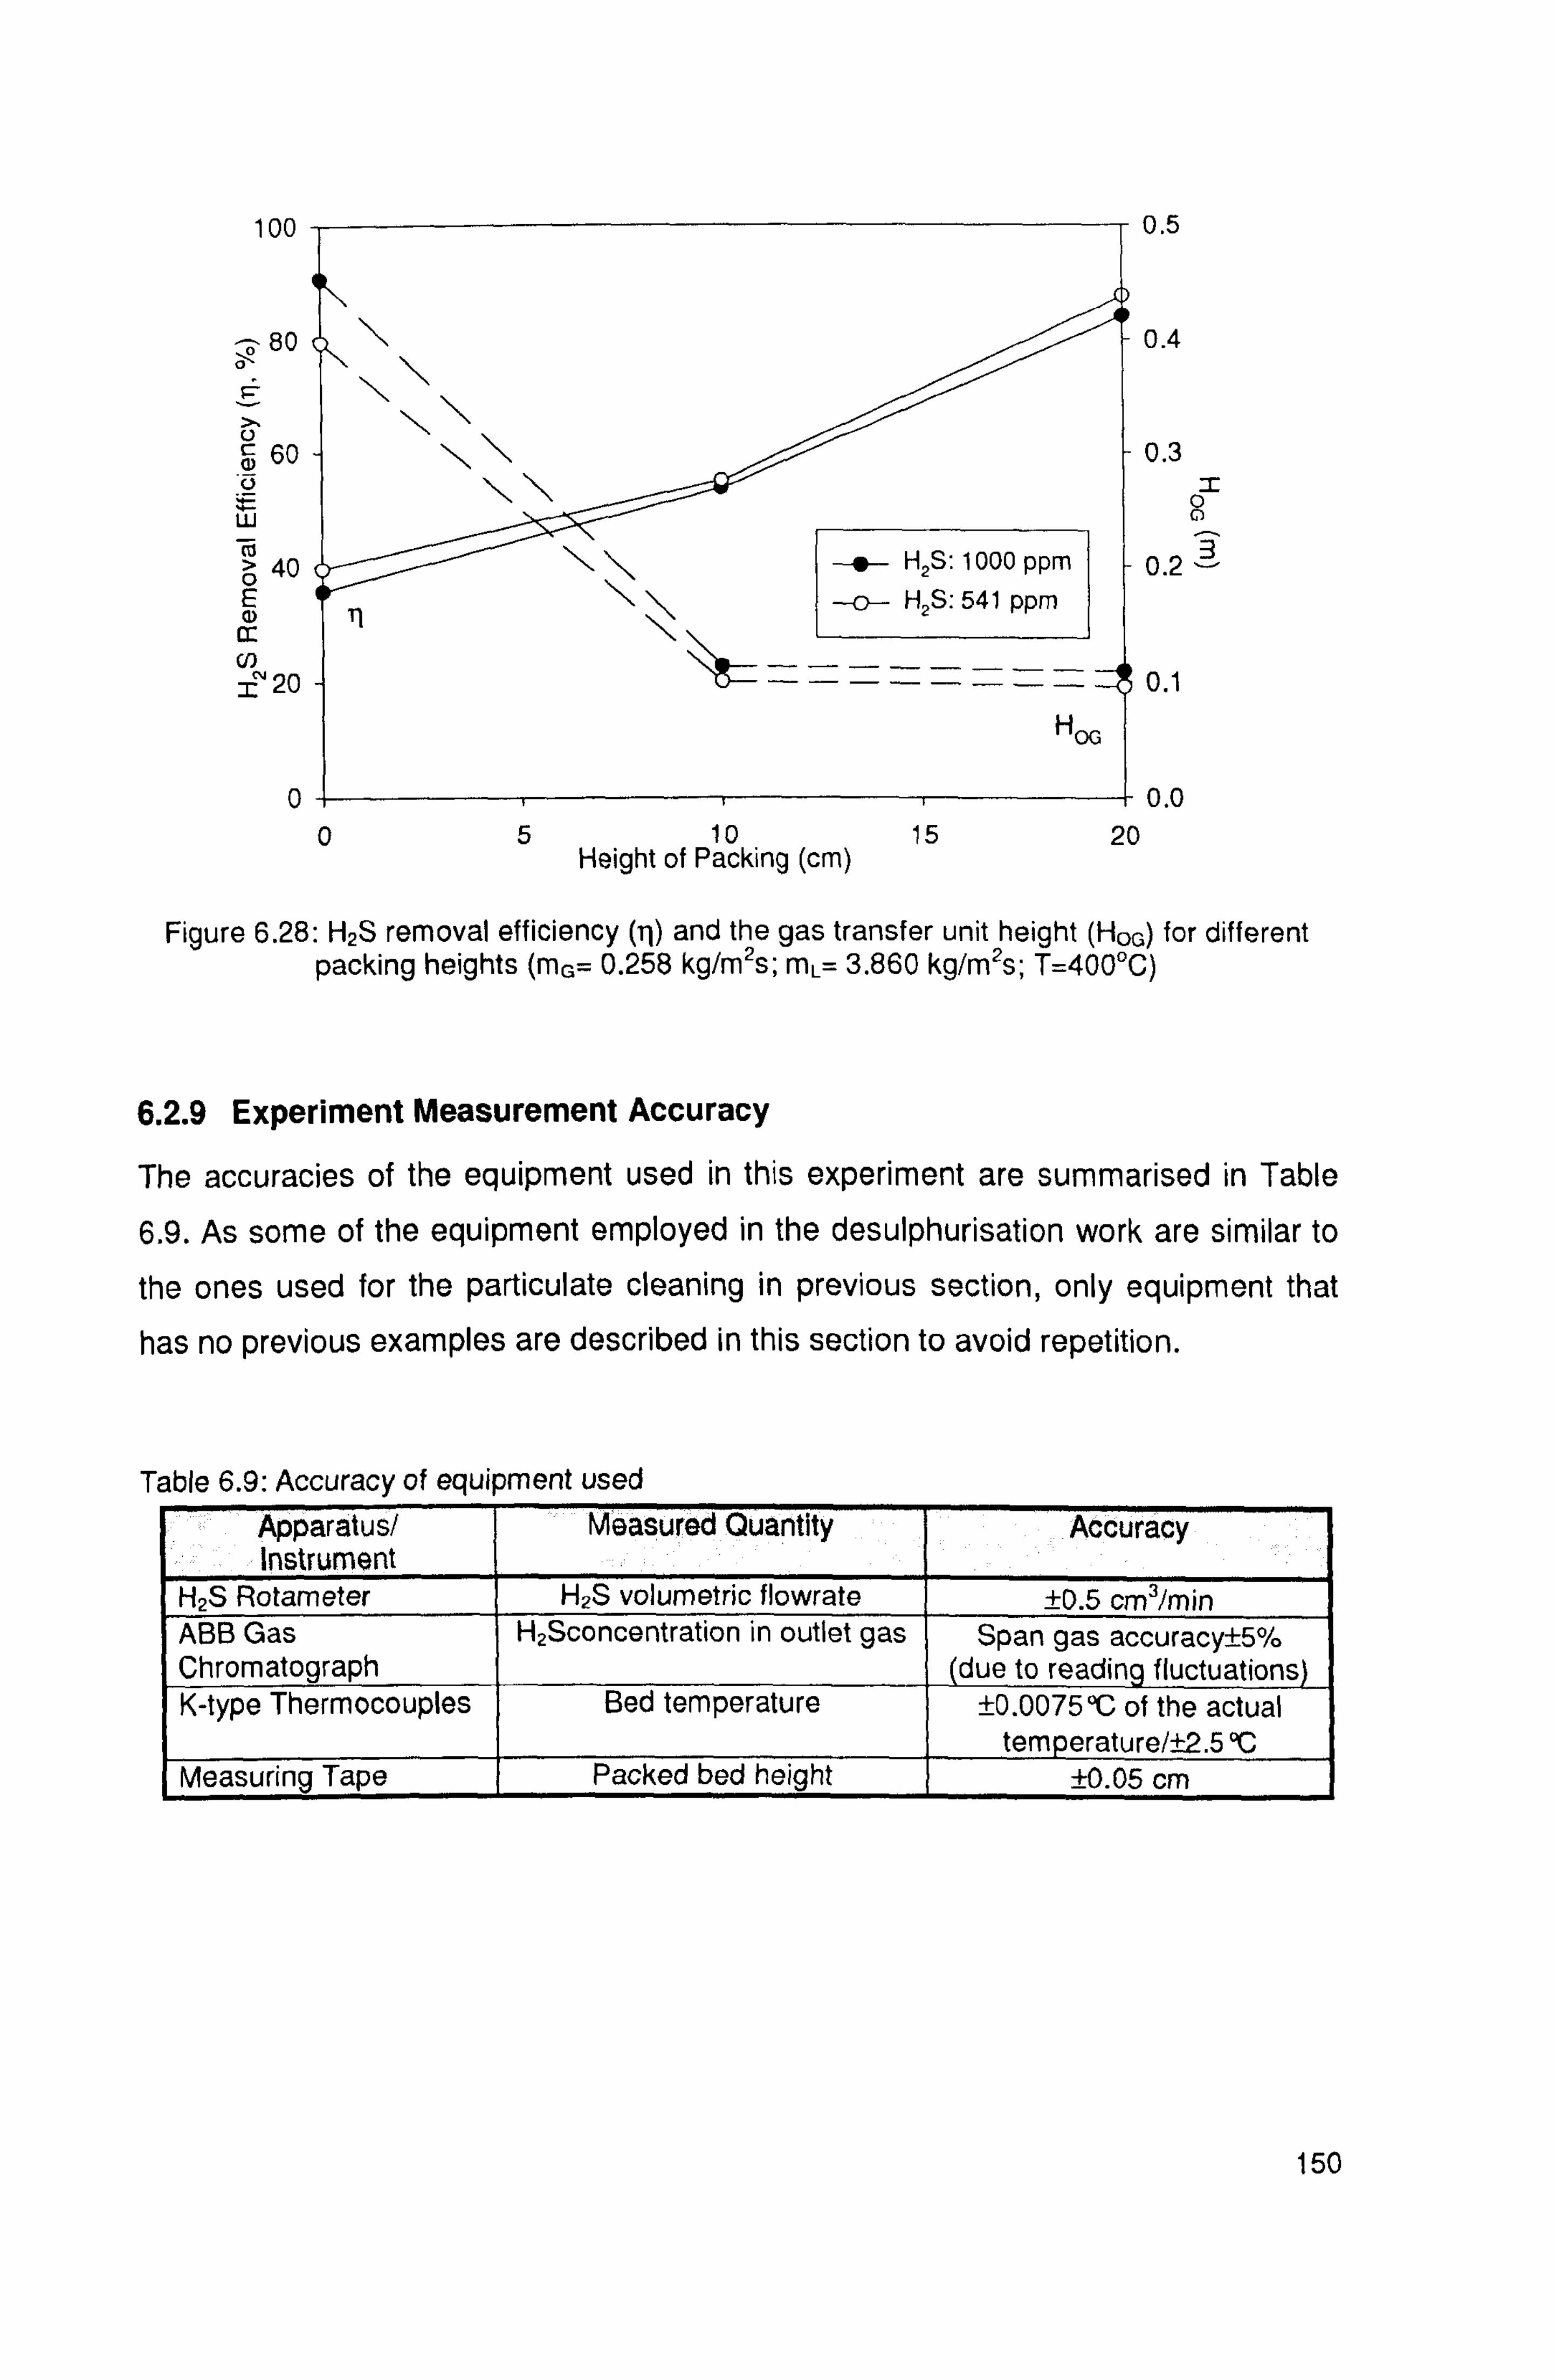
100 0.5
80
a U
C, 60 ü_
W co
40 öE
m
2 20
0
H2S: 1000 ppm
-o- H2 S: 541 ppm
-- --------- HOG
05 10 15 Height of Packing (cm)
0.4
0.3
0 0
0.2
0.1
-+ 0.0 20
Figure 6.28: H2S removal efficiency (rj) and the gas transfer unit height (HOG) for different packing heights (m0= 0.258 kg/m2s; mL= 3.860 kg/m2s; T=400°C)
6.2.9 Experiment Measurement Accuracy
The accuracies of the equipment used in this experiment are summarised in Table
6.9. As some of the equipment employed in the desulphurisation work are similar to
the ones used for the particulate cleaning in previous section, only equipment that
has no previous examples are described in this section to avoid repetition.
Table 6.9: Accuracy of equipment used Apparatus/ Instrument
Measured Quantity Accuracy
H2S Rotameter H2S volumetric flowrate ±0.5 cm3/min ABB Gas Chromatograph
H2Sconcentration in outlet gas Span gas accuracy±5% (due to reading fluctuations)
K-type Thermocouples Bed temperature ±0.0075°C of the actual temper ture/±2.5°C
Measuring Tape Packed bed height ±0.05 cm
150

6.3 Tin Sulphide Cleaning
6.3.1 Cleaning In The Presence of Zinc Powder
6.3.1.1 Amount of Sulphur Collected
Three separate test runs were carried out to determine the total sulphur removed from the tin sulphide cleaning in the presence of zinc powder. The mass of the
sulphur strips from tin sulphide before the test and the mass of the residues after the
test are summarised in Table 6.10.
Table 6.10: Results of sulphur determination for SnS cleaning in the presence of Zn
Run 1 (600°C) 3 hours)
Run 2 (400°'C)
(4 hours) Mass of SnS before test (g) 2.7863 2.6997 Mass of residues after test (g) 1.9902 1.9853
Mass Toss(-)/gain(+) of contents (g) -0.7961 -0.7144 Residues as weight % of original tin wires 71.43 73.53
6.3.1.2 Reaction with Zn Powder (1st Method)
nSzb-1O9ram yllý4ýs5 J gram
l"`
Figure 6.29: Original SnS and zinc powder in the crucible before test
In the first experiment, the sample of SnS and zinc powder were located at different
ends of the crucible. Figure 6.29 shows the original SnS and zinc powder prior to the
experiment. Figures 6.30 and 6.32 are images of the cooled SnS crucibles containing the residues after the test for different operating temperatures, 400 and 600°C
respectively. The heated SnS reacted with zinc powder forming a significant amount of soft white to yellow colour powder or crystals (Run 1) deposited between the SnS
and zinc powder area. The location of this white to yellow solid residues suggests that it was a product of reaction(s) between the SnS and the zinc powder.
151
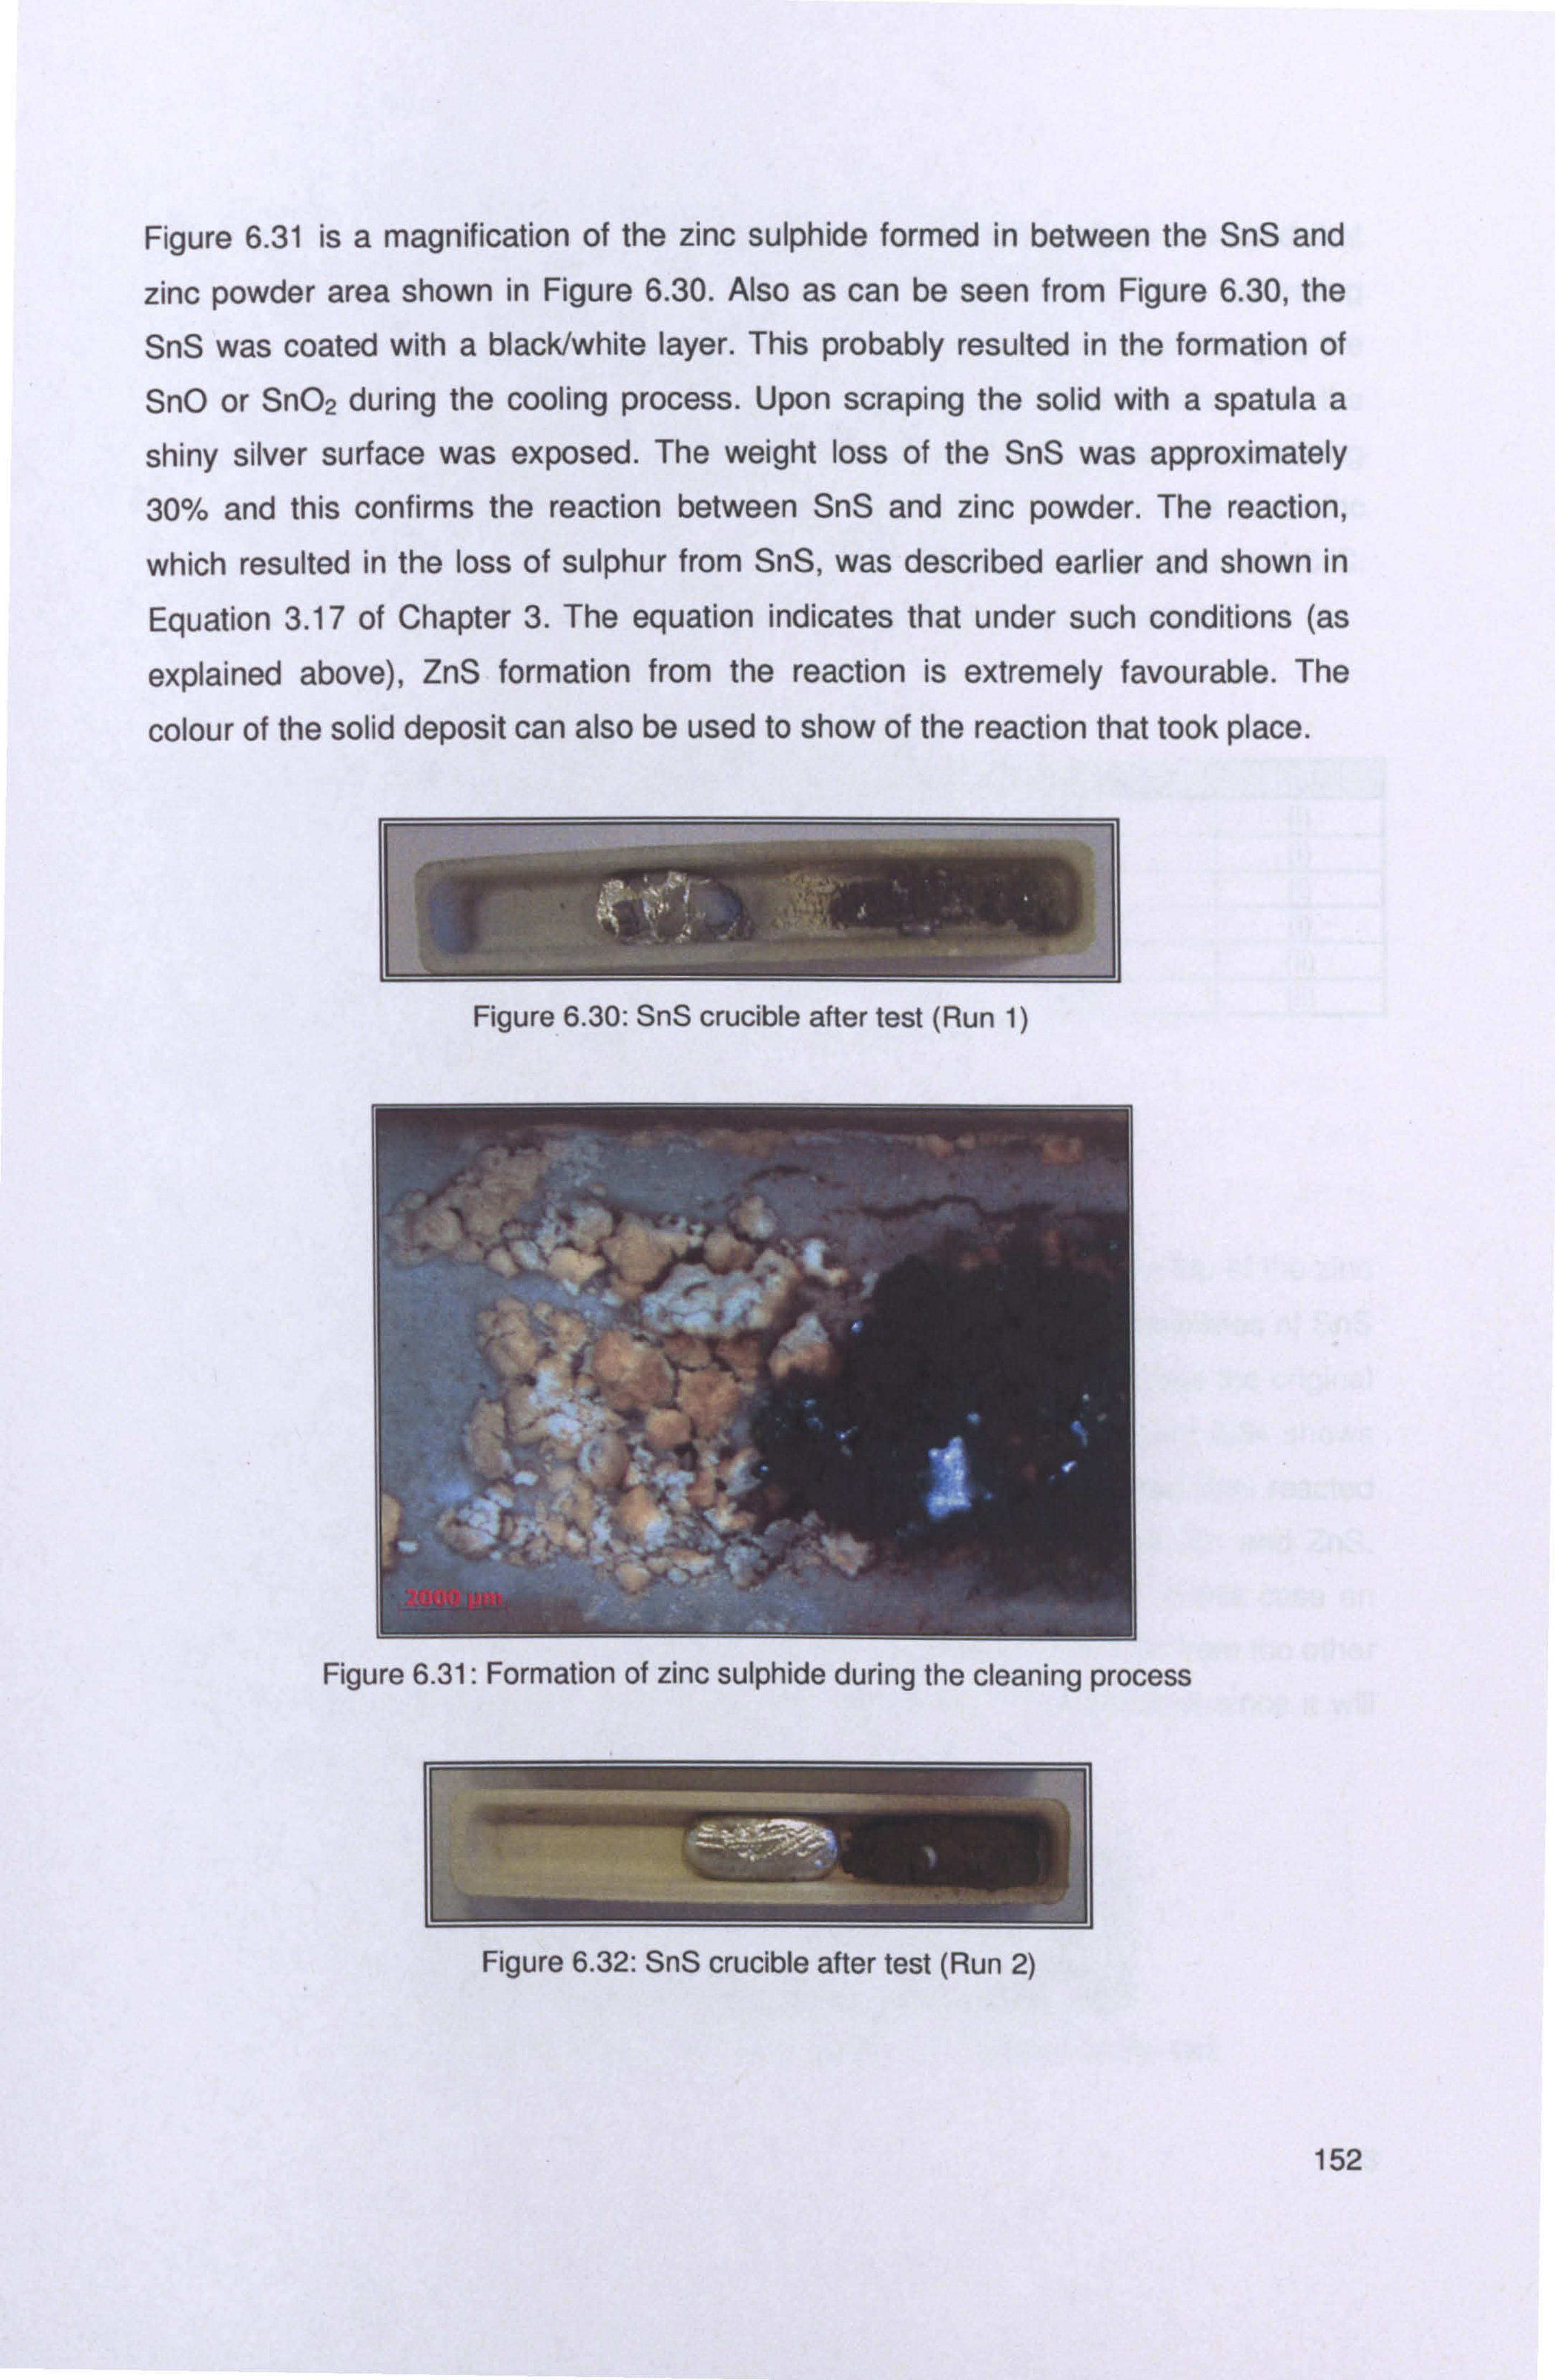
Figure 6.31 is a magnification of the zinc sulphide formed in between the SnS and
zinc powder area shown in Figure 6.30. Also as can be seen from Figure 6.30, the
SnS was coated with a black/white layer. This probably resulted in the formation of SnO or Sn02 during the cooling process. Upon scraping the solid with a spatula a
shiny silver surface was exposed. The weight loss of the SnS was approximately 30% and this confirms the reaction between SnS and zinc powder. The reaction,
which resulted in the loss of sulphur from SnS, was described earlier and shown in
Equation 3.17 of Chapter 3. The equation indicates that under such conditions (as
explained above), ZnS formation from the reaction is extremely favourable. The
colour of the solid deposit can also be used to show of the reaction that took place.
T Figure 6.30: SnS crucible after test (Run 1)
Figure 6.31: Formation of zinc sulphide during the cleaning process
152

Figure 6.32 showed the colour of the sample was silver-white, which indicated that
the sulphur also has reacted with the zinc powder. Although the operating temperature was only 400°C, it was only possible to clean the SnS by prolonging the
heating/reaction time between SnS and zinc (same temperature as the
desulphurisation operating temperature). The difference between these two operating temperatures was because at 600°C the rate of reaction between SnS and zinc
powder was assumed to be higher when compared to the rate of reaction at 400°C.
Table 6.11 shows the physical properties of several compounds of interest.
Table 6.11: Physical properties of tin compounds of interest
Compound Colour of Solid Meltin Point (C) Boilin Point (C) Ref. Sn Silver-White 232 2623 i
SnO Black 1050 1425 i Sn02 White 200 2500 i SnS Brown 881 1210 i ZnS White to Yellow 1830 1185 ii Zn Black 420 908 ii
(i)Nielsen and Sigurdardottir, 7993; Vogel, 7989; Samsanov, 1982 (ii)Oxford Chemist, 2007
6.3.1.3 Reaction with Zn Powder (2"d Method)
In the second experimental method, the sample of SnS was placed on top of the zinc
powder. The main purpose of this second method is to study the possibilities of SnS
cleaning by putting the SnS and zinc powder together. Figure 6.33 shows the original SnS and zinc powder (lumped together) prior to the experiment. Figure 6.34 shows the cooled crucibles containing the residues after the test. The heated SnS reacted
with zinc powder, fused together and formed a mixture of Sn, SnS, Zn and ZnS. Considering the Sn will be reused for the desulphurisation process, in this case an
additional process needs to be added in order to separate the fresh Sn from the other
residues. Therefore this proves that the second method is not practical since it will increase the operational cost of the plant.
Figure 6.33: Original SnS and zinc powder in the crucible before test
153

6.3.2 Cleaning Without Zinc Powder
6.3.2.1 Experimental Observations
One test run was carried out without the addition of zinc powder. In this experiment, it
was observed that the SnS sample changed colour after 2 hours of heating. The
molten state of the sample was only observed after 6 hours heating (see Figure
6.35(f)). The change of colour during the cleaning process can be seen in Figures
6.35(a) to 6.35(f). It was noted that the slight change of colour occurred at the
temperature of 300°C (Figure 6.35(d)). This initial change could be attributed some of
the sulphur being released during the heating of the SnS sample. Once the SnS
started to melt, the colour of the samples changed to gold-silver. The amount of
sulphur released during this process is shown in Table 6.12.
ý`.
ý`ý
rý
>, r_
,"..
14
Figure 6.35(d) Figure 6.35(e) Figure 6.35(f) Figure 6.35: SnS in glass flask during the test
154
Figure 6.34: SnS crucible after test
Figure 6.35(a) Figure 6.35(c) Figure 6.35(b)

6.3.2.2 Amount of Sulphur Collected
Table 6.12: Results of sulphur determination for SnS cleaning without the presence of Zinc
Mass of SnS before test (g) 2.6321
Mass of SnS after test (g) 1.9289
Mass loss(-)/gain(+) of contents (g) -0,7032 Residues as weight % of original tin wires 86.92
The weight loss of SnS after the heating process without addition of zinc powder was
approximately 13 %. There was roughly 17 % difference between cleaning (heating)
process with and without zinc. The reduction was small and any reaction involving
the SnS was limited by the small surface area exposed to the gas stream. Since
nitrogen gas was considered inert and thus did not react with either with SnS, Sn and S, the decreased in sample weight was definitely caused by the sulphur that was
released during the heating process. The presence of zinc gave a significant difference in percent weight loss of SnS.
6.3.3 Experiment Measurement Accuracy
Throughout this experiment there could have been errors that were not accounted for. However, one main source of error associated with this experiment was the
determination of the amount of sulphur left in the crucible while using the
microbalance. Calibrating the equipment prior to use rectified the error and its
accuracy was accounted for during calculations (shown in Table 6.13).
Table 6.13: Accuracy of equipment used
Apparatus/ Instrument Measured Quantity Accuracy Microbalance Mass of crucible plus contents ± 0.00005 g
155

6.4 Summary
6.4.1 Particulate Removal
This experimental work was carried out using nitrogen gas for tin circulation at high
temperatures (350 - 400°C) and the glass particles inlet was kept at ambient
temperature at 15°C. The large temperature difference meant that the liquid (flowing
downwards) solidified upon collision with the cool glass particles. This resulted in solid
tin build-up on the surface of the glass particles, thus reducing the ET. In the exhaust
side of the scrubber, liquid tin splashes were observed which were then identified in the
filter paper. The average splashed tin was found to be around 5.45 g. So the true ET
will have to take account of the amount of splashed tin, the mixture of Si-Sn and the
unseparated glass particles on the filter paper. At the lower bed temperature (350°C),
the agglomerates formed at early stages were very fragile and contained a grey Si-Sn
mixture. The liquid tin solidified slowly, making it more adhesive and it was attached
onto the surface of glass particles upon collision. At 400°C, the formed agglomerates
were stronger and had a black colour. This is associated with liquid tin, which solidified
even more rapidly during the filtration process. The liquid tin-irrigated packed bed
scrubber demonstrated particulate removal performance with ET ranging from 60 to
98%. The ET decreased as the inlet dust loading increased. The results also showed
that the temperature had a significant influence on the ET. As the temperature
increased from 350°C and 400°C, the ETotal decreased. The major reason for this is the
temperature difference between the inlet particles and the scrubber, which result in the
formation of a thicker bed of agglomerates. The resulting grade efficiency curves were
not able to demonstrate realistic results. This is because at the same corresponding liquid flow rates and inlet solid loading, the particles collected in the impinger were not a
representation of the same total particle collection as in the total efficiency experiment. As mention earlier the main reason was the formation of agglomerates. Moreover, it
was not practicable to clean the scrubber after each test run. The design limitations will be discussed in Chapter 9.
156
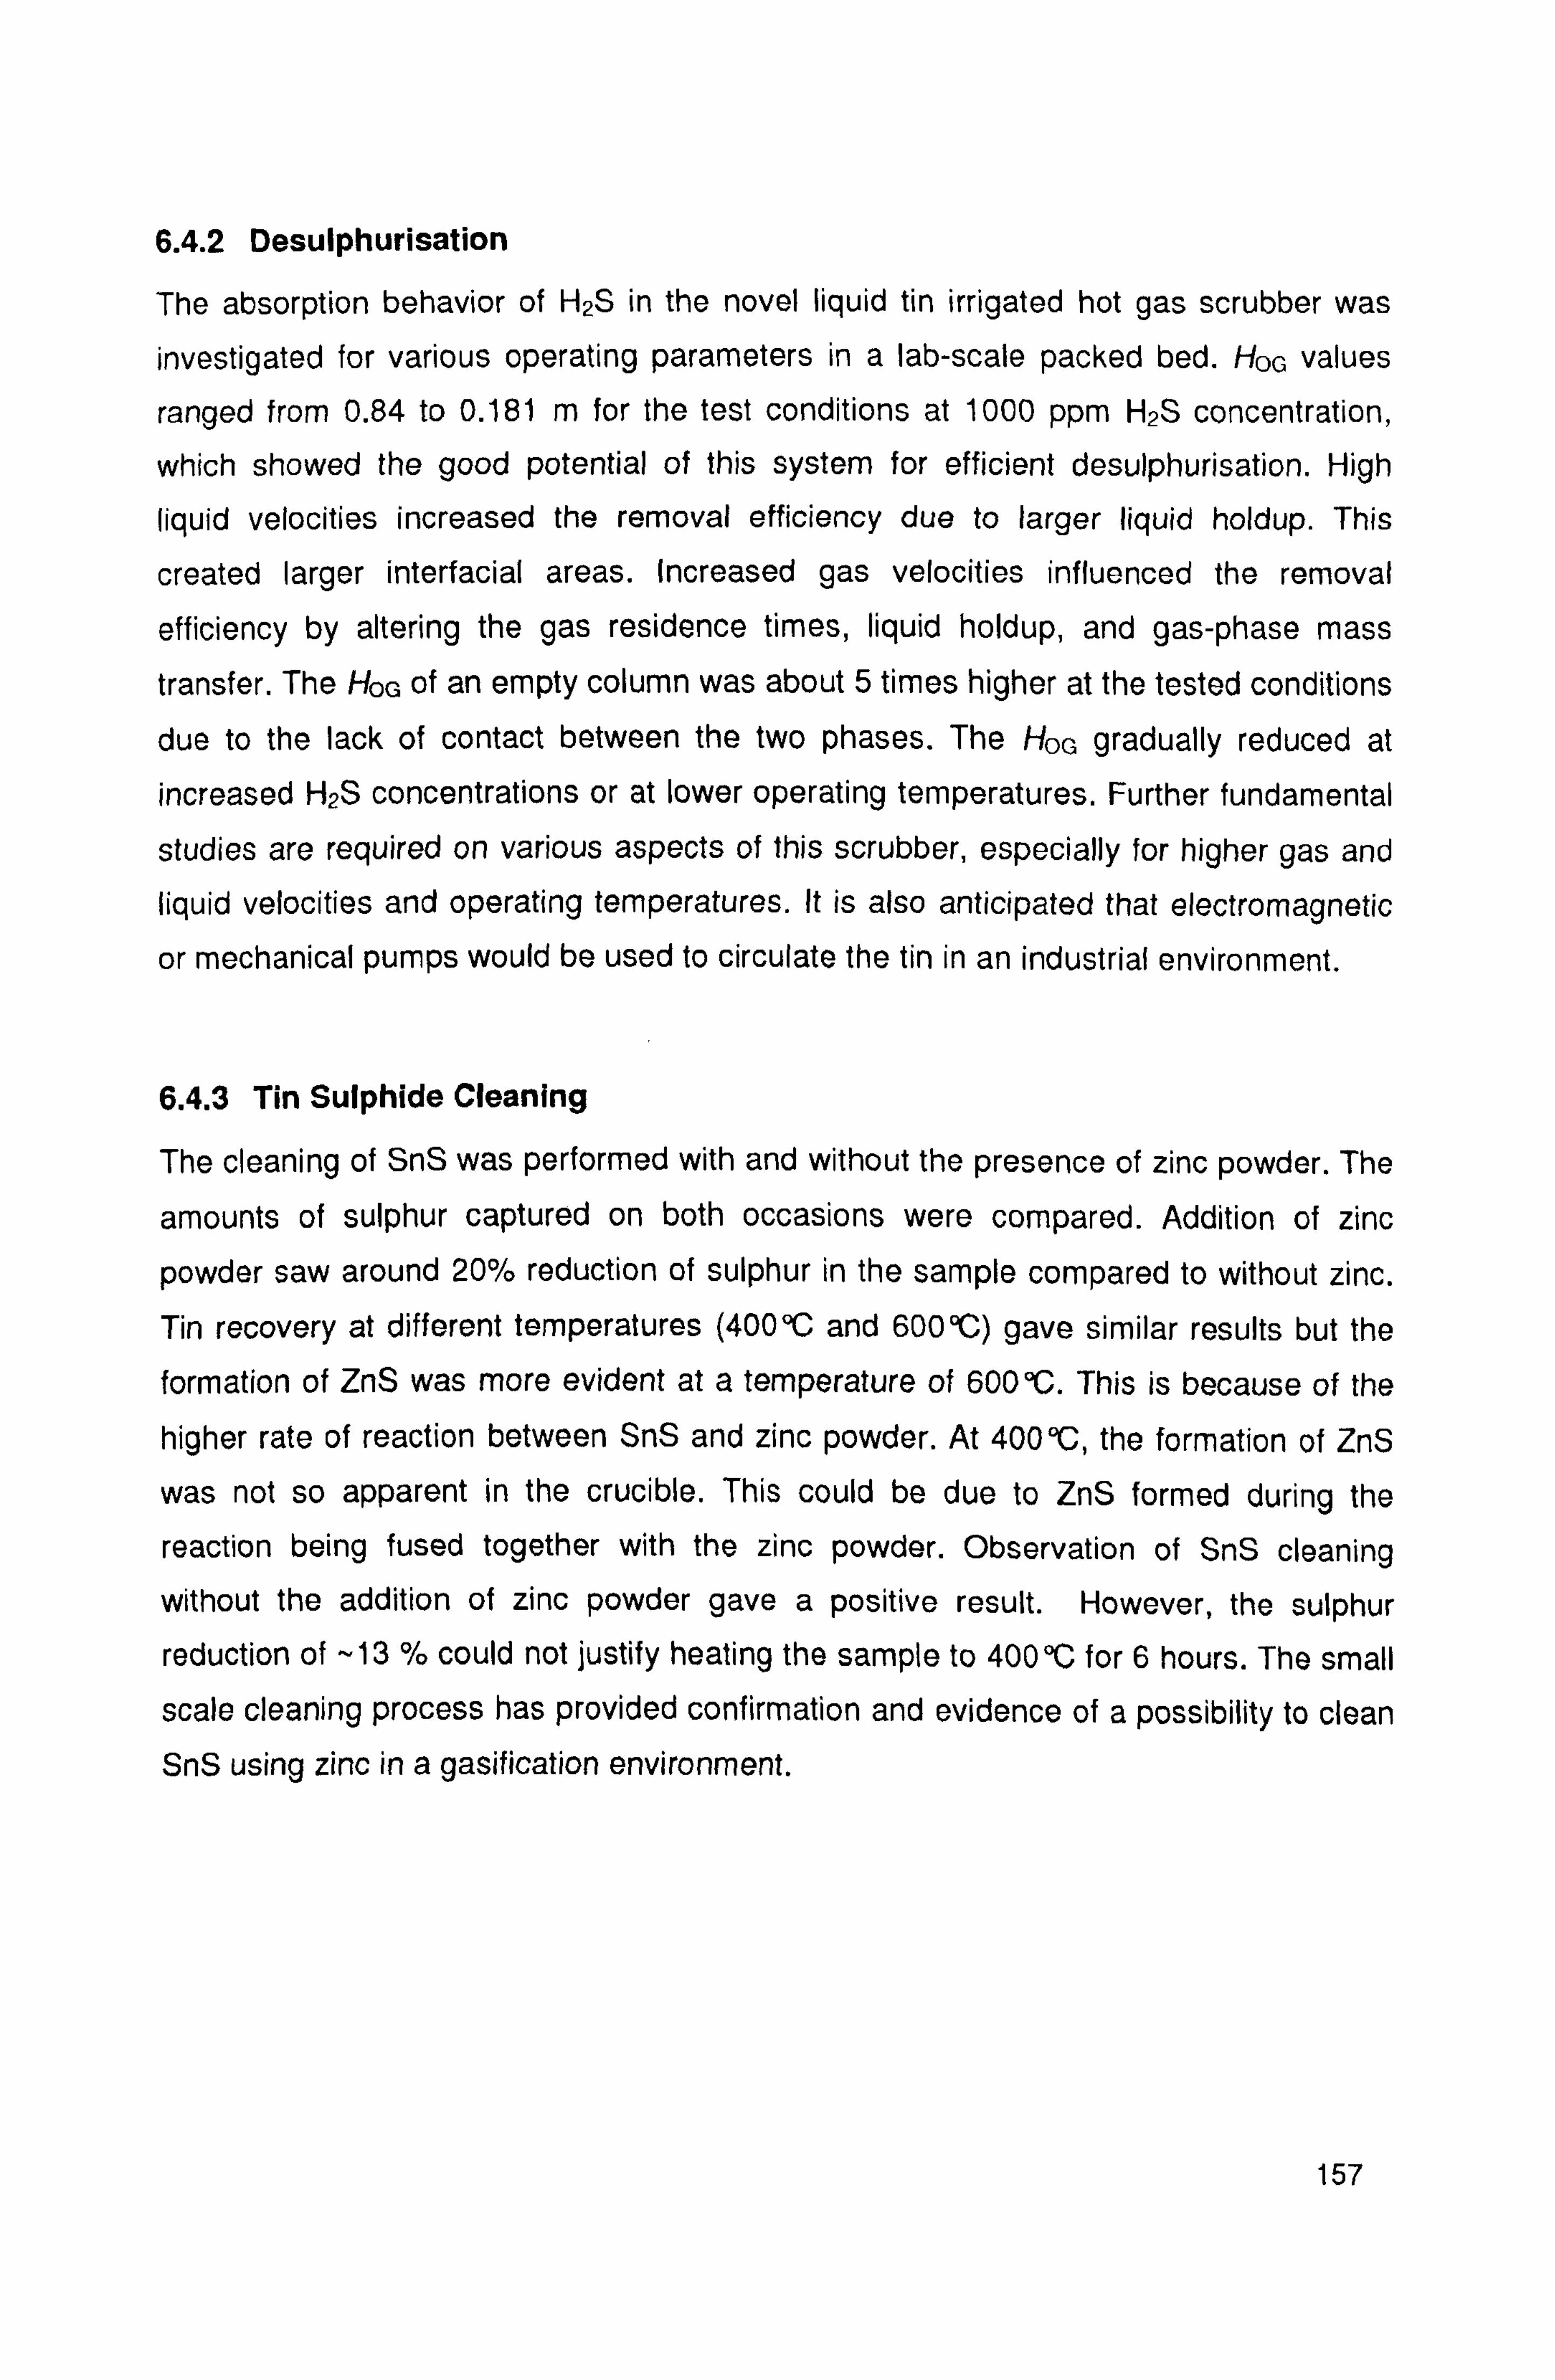
6.4.2 Desulphurisation
The absorption behavior of H2S in the novel liquid tin irrigated hot gas scrubber was
investigated for various operating parameters in a lab-scale packed bed. HOG values
ranged from 0.84 to 0.181 m for the test conditions at 1000 ppm H2S concentration,
which showed the good potential of this system for efficient desulphurisation. High
liquid velocities increased the removal efficiency due to larger liquid holdup. This
created larger interfacial areas. Increased gas velocities influenced the removal
efficiency by altering the gas residence times, liquid holdup, and gas-phase mass
transfer. The HOG of an empty column was about 5 times higher at the tested conditions
due to the lack of contact between the two phases. The HOG gradually reduced at
increased H2S concentrations or at lower operating temperatures. Further fundamental
studies are required on various aspects of this scrubber, especially for higher gas and liquid velocities and operating temperatures. It is also anticipated that electromagnetic
or mechanical pumps would be used to circulate the tin in an industrial environment.
6.4.3 Tin Sulphide Cleaning
The cleaning of SnS was performed with and without the presence of zinc powder. The
amounts of sulphur captured on both occasions were compared. Addition of zinc
powder saw around 20% reduction of sulphur in the sample compared to without zinc.
Tin recovery at different temperatures (400°C and 600°C) gave similar results but the
formation of ZnS was more evident at a temperature of 600°C. This is because of the
higher rate of reaction between SnS and zinc powder. At 400°C, the formation of ZnS
was not so apparent in the crucible. This could be due to ZnS formed during the
reaction being fused together with the zinc powder. Observation of SnS cleaning
without the addition of zinc powder gave a positive result. However, the sulphur
reduction of -13 % could not justify heating the sample to 400°C for 6 hours. The small
scale cleaning process has provided confirmation and evidence of a possibility to clean SnS using zinc in a gasification environment.
157
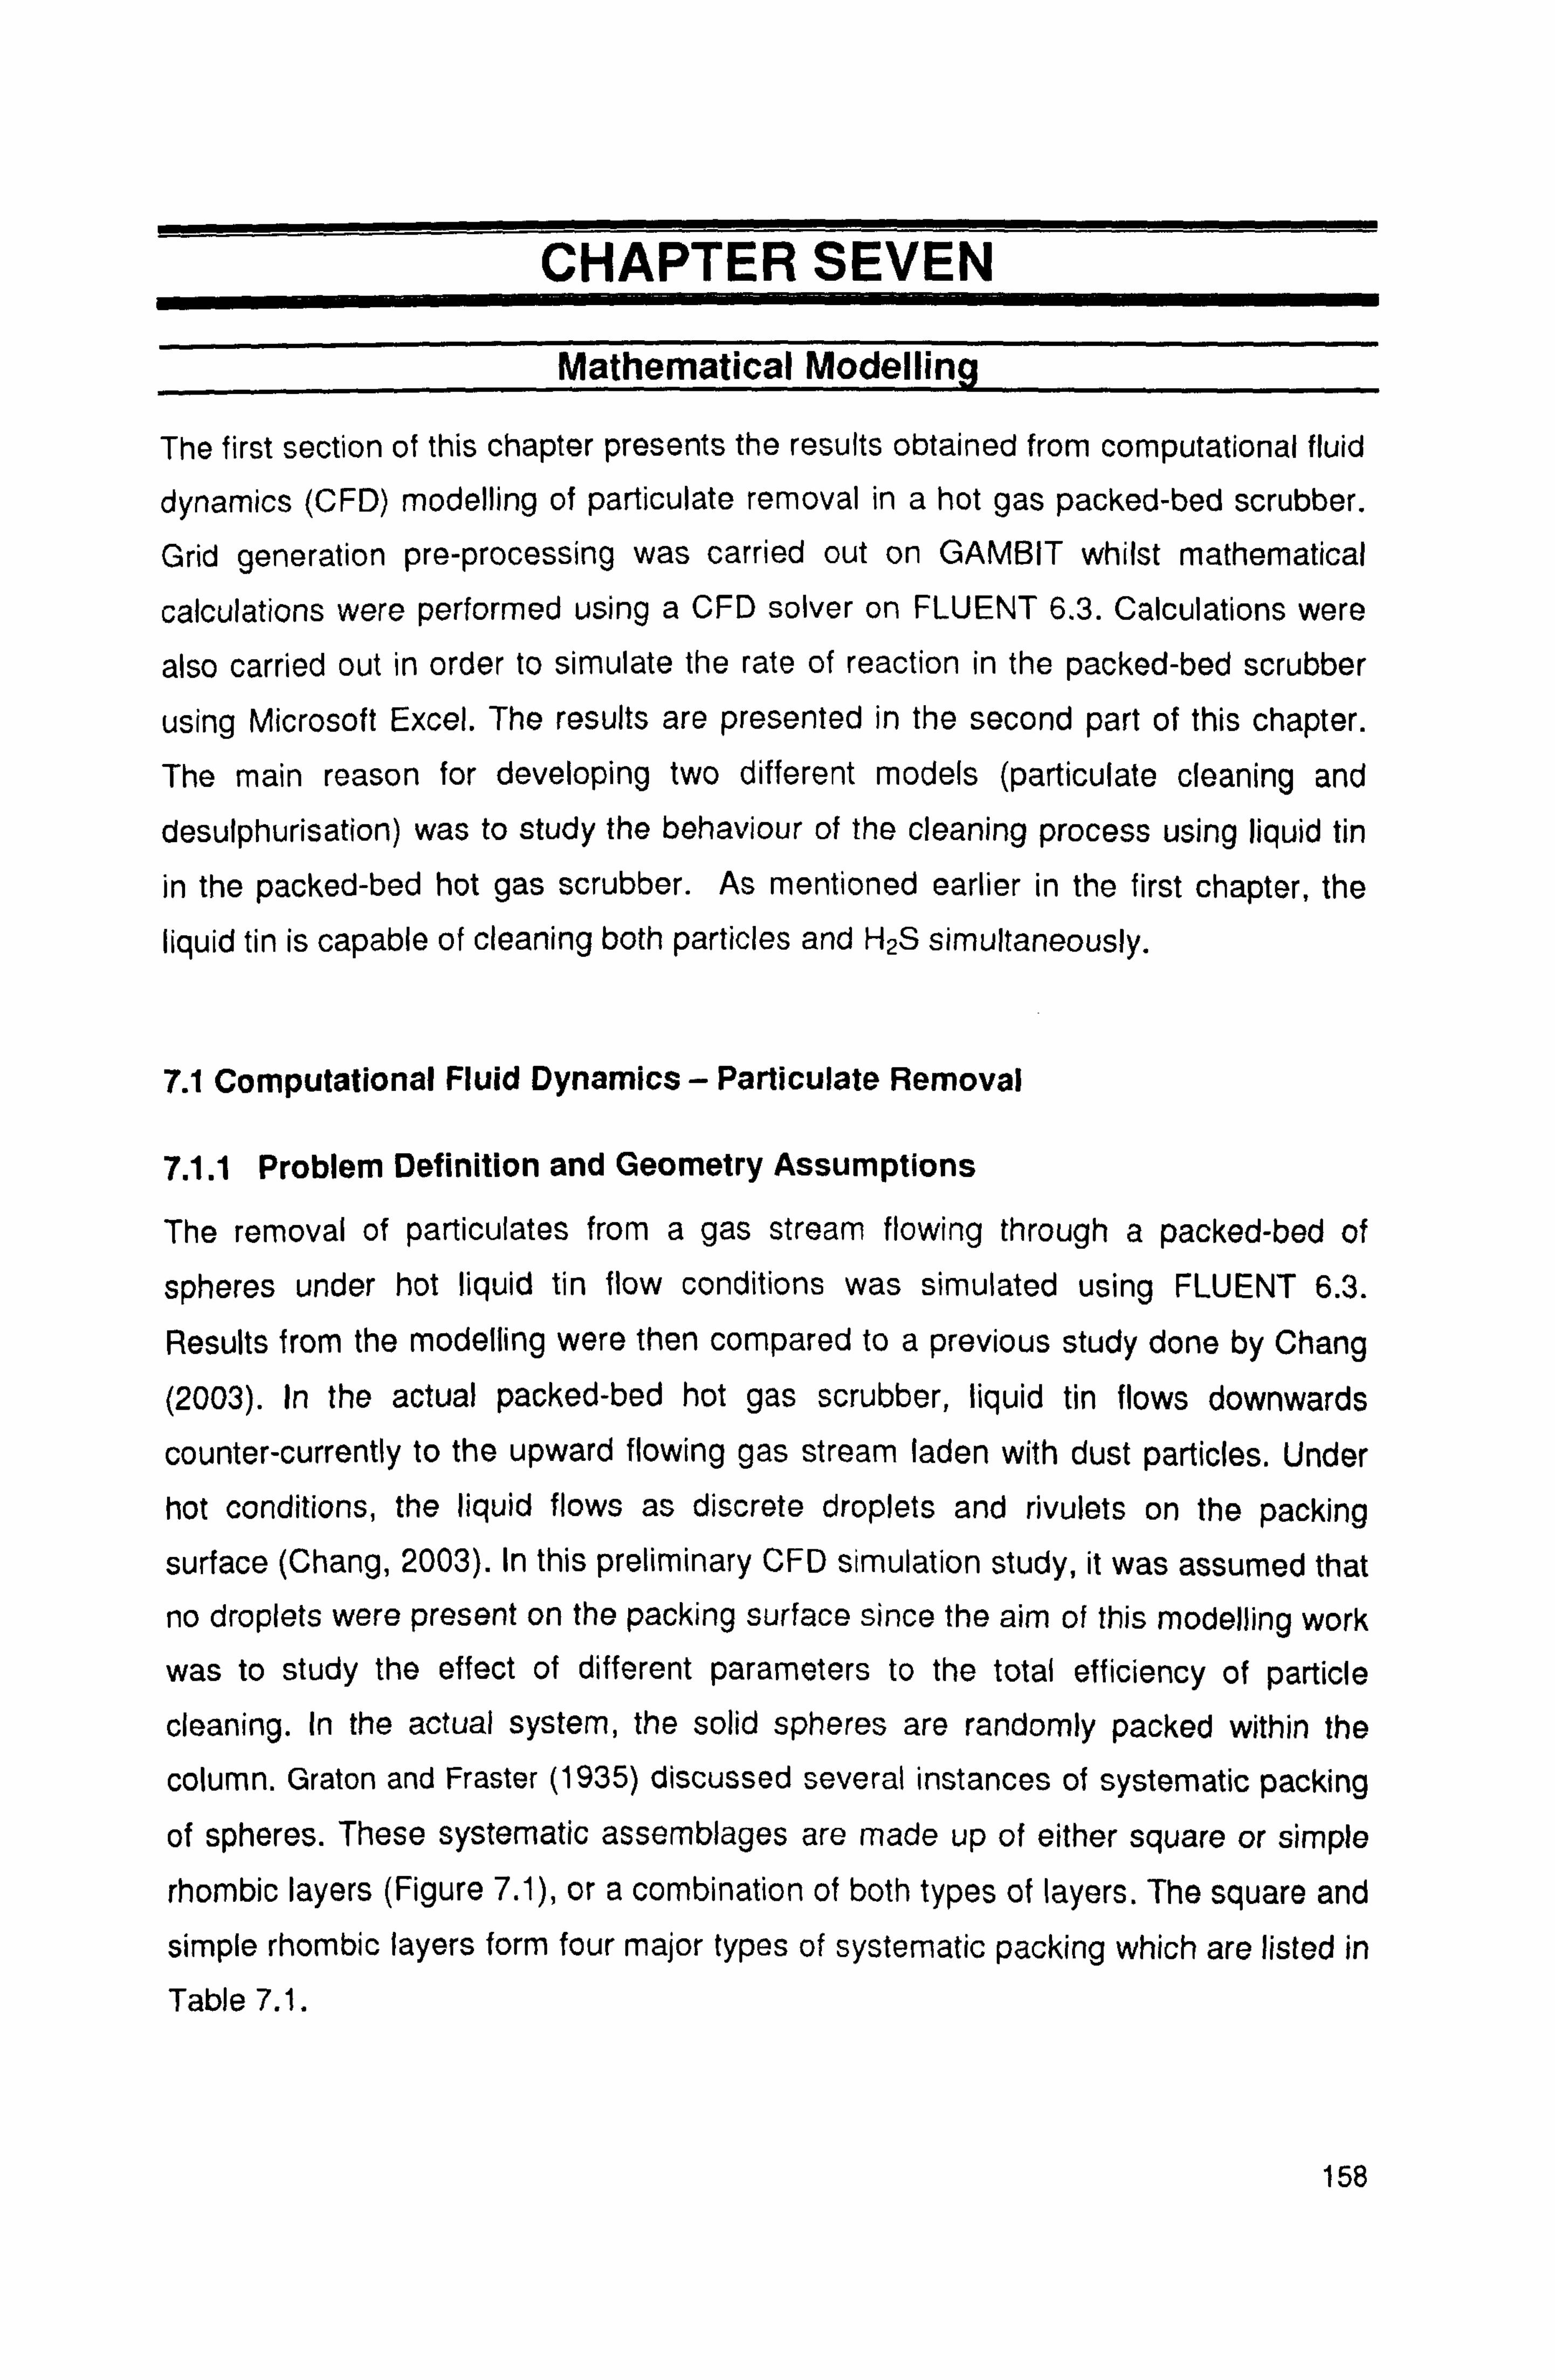
CHAPTER SEVEN
Mathematical Modelling
The first section of this chapter presents the results obtained from computational fluid
dynamics (CFD) modelling of particulate removal in a hot gas packed-bed scrubber. Grid generation pre-processing was carried out on GAMBIT whilst mathematical
calculations were performed using a CFD solver on FLUENT 6.3. Calculations were
also carried out in order to simulate the rate of reaction in the packed-bed scrubber
using Microsoft Excel. The results are presented in the second part of this chapter. The main reason for developing two different models (particulate cleaning and desulphurisation) was to study the behaviour of the cleaning process using liquid tin
in the packed-bed hot gas scrubber. As mentioned earlier in the first chapter, the
liquid tin is capable of cleaning both particles and H2S simultaneously.
7.1 Computational Fluid Dynamics - Particulate Removal
7.1.1 Problem Definition and Geometry Assumptions
The removal of particulates from a gas stream flowing through a packed-bed of
spheres under hot liquid tin flow conditions was simulated using FLUENT 6.3.
Results from the modelling were then compared to a previous study done by Chang
(2003). In the actual packed-bed hot gas scrubber, liquid tin flows downwards
counter-currently to the upward flowing gas stream laden with dust particles. Under
hot conditions, the liquid flows as discrete droplets and rivulets on the packing
surface (Chang, 2003). In this preliminary CFD simulation study, it was assumed that
no droplets were present on the packing surface since the aim of this modelling work
was to study the effect of different parameters to the total efficiency of particle
cleaning. In the actual system, the solid spheres are randomly packed within the
column. Graton and Fraster (1935) discussed several instances of systematic packing
of spheres. These systematic assemblages are made up of either square or simple
rhombic layers (Figure 7.1), or a combination of both types of layers. The square and
simple rhombic layers form four major types of systematic packing which are listed in
Table 7.1.
158

g
09,,
Square Layer Simple Rhombic Layer
Figure 7.1: Square and simple rhombic layers
In each type of systematic packing, every sphere is arranged identically with respect
to every other sphere, and each sphere is identified by the same co-ordination
number i. e. the number of adjacent spheres which are in contact with a selected
sphere (Gray, 1968). There is a characteristic porosity associated with each
systematic packing type.
Table 7.1: Systematic assemblages of spheres (Graton and Fraser, 1935)
Cubic 47.6 6 Ortho-rhombic 39.5 8
Tetragonal 30.2 10 Rhombohedral 26.0 12
The porosity of the packed-bed with 9.53 mm high-purity ceramic alumina (A1203)
spheres is 45%. Based on the porosity, the packed-bed closely resembles a cubic
type of systematic packing as shown in Table 7.1. In reality, the packed-bed was
randomly filled with the solid spheres which resemble a rhombic systematic packing
type.
7.1.2 Geometry Setup and Grid Generation
In this modelling work, the system was assumed to be without any droplets of liquid
tin. The total volume of the packed-bed (bed height 19 cm, column diameter 7.8 cm)
was 907.89 cm3 and the packing in the model was made up of spheres having a
diameter of 9.53 mm. With the assumption that the solid spheres occupied the
column in a randomly packed manner, free space exists between the packing
elements. The gap between any given solid sphere was found to be 0.3143 mm. Figure 7.2 shows the basic unit geometry representing the space between spherical
solids. 159

Figure 7.2: Basic unit geometry: Space between solid spheres in column
3-Dimensional geometry setup and grid generation were performed using the
GAMBIT CFD Pre-processor (Fluent Inc. ). The final 3-dimensional packed-bed
geometry was constructed using 2x2x 10 basic units contained within a cuboid.
This was the absolute maximum number of basic units which could be achieved by
the computer memory during meshing. The total volume of the 2x2x 10 basic units
was subtracted from the cuboid volume giving the volume occupied by the gas
phase. The cuboid represents an actual model of the packed-bed with the
dimensions of 2 cm (width) by 2 cm (length) and the height of 10 cm. The grid of the
gas phase volume was generated using the Tet/Hybrid meshing elements in
conjunction with the T-grid meshing scheme.
With the above considerations in mind, all the faces were meshed with irregular
triangular mesh elements following the Tri-Pave face meshing scheme. The grid
volume was meshed with tetrahedral mesh elements. The tetrahedral mesh elements
were chosen since they are able to fit into the rounded surface of the spheres with
the sharp corners of the intersecting spheres. It was not possible to generate finer
meshes with interval size smaller than 0.5 mm because the time taken to complete
the mesh was not practical. Also, errors were encountered in FLUENT 6.3 when the
mesh size was smaller than 0.5 mm. Figure 7.3 shows the packed-bed model (2 cm x
2 cm x 10 cm cuboid) which houses 11 layers of 2x (1/z+1+1/a) solid spheres. The gas
phase volume in between the solid spheres and droplets was completely meshed
with the final grid consisting of 148526 cells.
160

Y1
z
Figure 7.3: Front and side views of meshed packed-bed model
7.1.3 Mathematical Models
The steady-state continuous nitrogen gas phase flow field was modelled using the
RNG k-e turbulence model. Discrete phase particle trajectories were then computed
for particles injected from the Mass Flow Inlet face boundary into the flow domain.
7.1.3.1 Continuity and Momentum Equations
The conservation equations of mass and momentum were solved by FLUENT 6.3 for
all flows. The conservation of mass or continuity in the i-direction for the continuous
phase is represented by equation 7.1. The source term Sm is zero in this case as
there is no mass transfer into and out of the continuous gas phase.
a usm X7.1) ax;
The conservation of momentum in the i-direction can be described by the general
equation:
a (,,,,
'u,
aP aZ, j pgi+F, (7.2) ax Uýý" axi axj
Where P is the static pressure, t is the stress tensor, p9; is the gravitational body
force, while F; represents any external body forces impacting the continuous phase. F; is zero in this case.
161
7.1.3.2 Turbulence Model
The RNG (renormalisation group) k-e model was used to model the turbulence in the
continuous nitrogen gas flow field. It uses the Reynolds-averaged approach whereby the instantaneous solution variables consist of the mean and fluctuating components. For the velocity components:
ui = u; +u; (7.3)
Where ü; and u', are the mean and instantaneous velocity components (i = 1,2,3).
The same applies for scalar quantities such as pressure or energy. The turbulence
model includes the ensembles-averaged momentum equations containing the
Reynolds stress which represent the effects of turbulence, modelled using the
Boussinesq hypothesis. In addition to the continuity and momentum equations, the
transport equations describing the turbulent kinetic energy k (equals Yi C j' for unit
mass) and the turbulent dissipation rate E were solved. The turbulent viscosity µt is
computed as a function of k and c. The main reasons for selecting the RNG k-E
model was that it provides an option to use a differential formula for effective
viscosity to account for low Reynolds number effect, a feature which is absent from
the standard k-c model. The flow through the packed-bed is affected significantly by
the wall boundaries of the solid spheres and the liquid droplets.
7.1.3.3 Discrete Phase Model
A discrete phase of spherical particles dispersed in the continuous gas phase was
introduced to represent the solid dust particles in the gas stream. The particle
trajectories were computed via uncoupled calculations between the discrete and
continuous phases. While the continuous phase impacted the discrete phase
constantly, in the uncoupled approach the discrete phase does not affect the
continuous phase flow field. The highest solid concentrations used in the simulations
were 4800 ppmw or 0.48 wt. % and the particle was injected with the same velocity as
the gas phase at the inlet to the flow domain.
For such low mass and momentum loading of particles, the use of uncoupled
calculations is deemed reasonable. The discrete phase trajectory was computed via stepwise integration of the force balance on the particle over discrete time steps. The
particle inertia was equated to the thermodynamic drag, the gravitational force and other additional forces acting on the particle.
162

For steady flow in the x-direction in Cartesian coordinates:
/ FD(u-Ur)+gx -P)
+F -o (7.4) P,,
Where Fo(u - up) is the drag force per unit particle mass; FD equals 18pCDRe/24ppd2;
u and up are the velocities of the gas phase and particle respectively.
While 4 is the gas phase molecular viscosity; p and pp are the gas phase and
particle densities respectively; d is the particle diameter; Re is the relative Reynolds
number which is defined as pcdIuP ut/µ and CD is the drag coefficient. Fx represents
additional forces acting on the particle such as the force required to accelerate the
fluid surrounding the particle and the force arising from the pressure gradient in the
fluid. Integration in time of equation 7.4 gives the particle velocity up at each point
along the trajectory and the trajectory itself is computed from:
dx ^ ll (7.5)
dt,,
The time integration of the particle trajectory equations is controlled using two
parameters:
1. The Maximum Number of Time Steps allowed for integration of equations 7.4 and
7.5 before aborting trajectory computations when the particle does not exit the
flow domain was set at 50,000. The trajectory fate was "incomplete" when the
trajectory calculation was abandoned. The Length Scale used to set the time step
size for integration was 0.05 mm. For turbulent flow, the impact of turbulent
eddies present in the continuous phase of particle dispersion is incorporated via
the stochastic tracking or the discrete random walk model. The model considers
the effect of instantaneous turbulent velocity fluctuations on the particle trajectories. The gas phase velocity u is the sum of the mean gas phase velocity ü. The instantaneous value of the gas flow velocity fluctuation u is calculated from
the following stochastic model:
u =u +u (7.6)
163
2. The random effects of turbulence on the particle dispersion is accounted for by
turning on the Stochastic Model and setting a total of five computational (i. e.
"number of tries") for each particle trajectory. The Random Eddy Lifetime option
was included to set the characteristic lifetime of the turbulent eddy to be random.
Particle interaction with the fluid phase eddy occurs over this eddy lifetime. The
particles were released from the Mass Flow Inlet boundary surface. The individual
mass flowrate of the injected particle stream was scaled according to the area of
the face from which they were released. The initial conditions set for the particle
stream are listed as follows.
The particle density was varied from 400 to 1800 kg/m3 in the Material panel.
Particle type = Inert i. e. particle undergoes no physical or chemical changes
Particle velocity =3 m/s and no velocity in the y-direction. Initial particle
velocity was assumed to equal the gas velocity i. e. zero slip. Zero velocities
in x-direction and z-direction. * Particle diameter = Varies from 1 µm to 70 µm
" Particle temperature = 673 K
* Total mass flowrate of particles =9x 10⁻⁵ kg/s
The fate of a particle at a boundary zone was set as follows:
* Escapes through Mass Flow Inlet and Outflow boundaries
Traps/reflects via a fully elastic collision at Wall boundaries of packing
spheres and vertical sides of cuboid (z-axis).
Traps/reflects at Wall boundaries of liquid droplets and passes through
interior boundary zone (default)
The fate of a particle trajectory was reported as either "escaped" at flow boundaries,
"trapped" at flow boundaries, "incomplete" when the Maximum Number of Time Steps
was exceeded, or "aborted" for incomplete trajectories due to round-off reasons.
7.1.4 Material Properties, Operating and Boundary Conditions
The fully meshed packed-bed model was exported to Fluent Inc. 's FLUENT 6.3 for
subsequent calculations. The specified material set in this model, referred to as
continuous fluid, is nitrogen gas, while the discrete phase refers to the inlet particle.
164
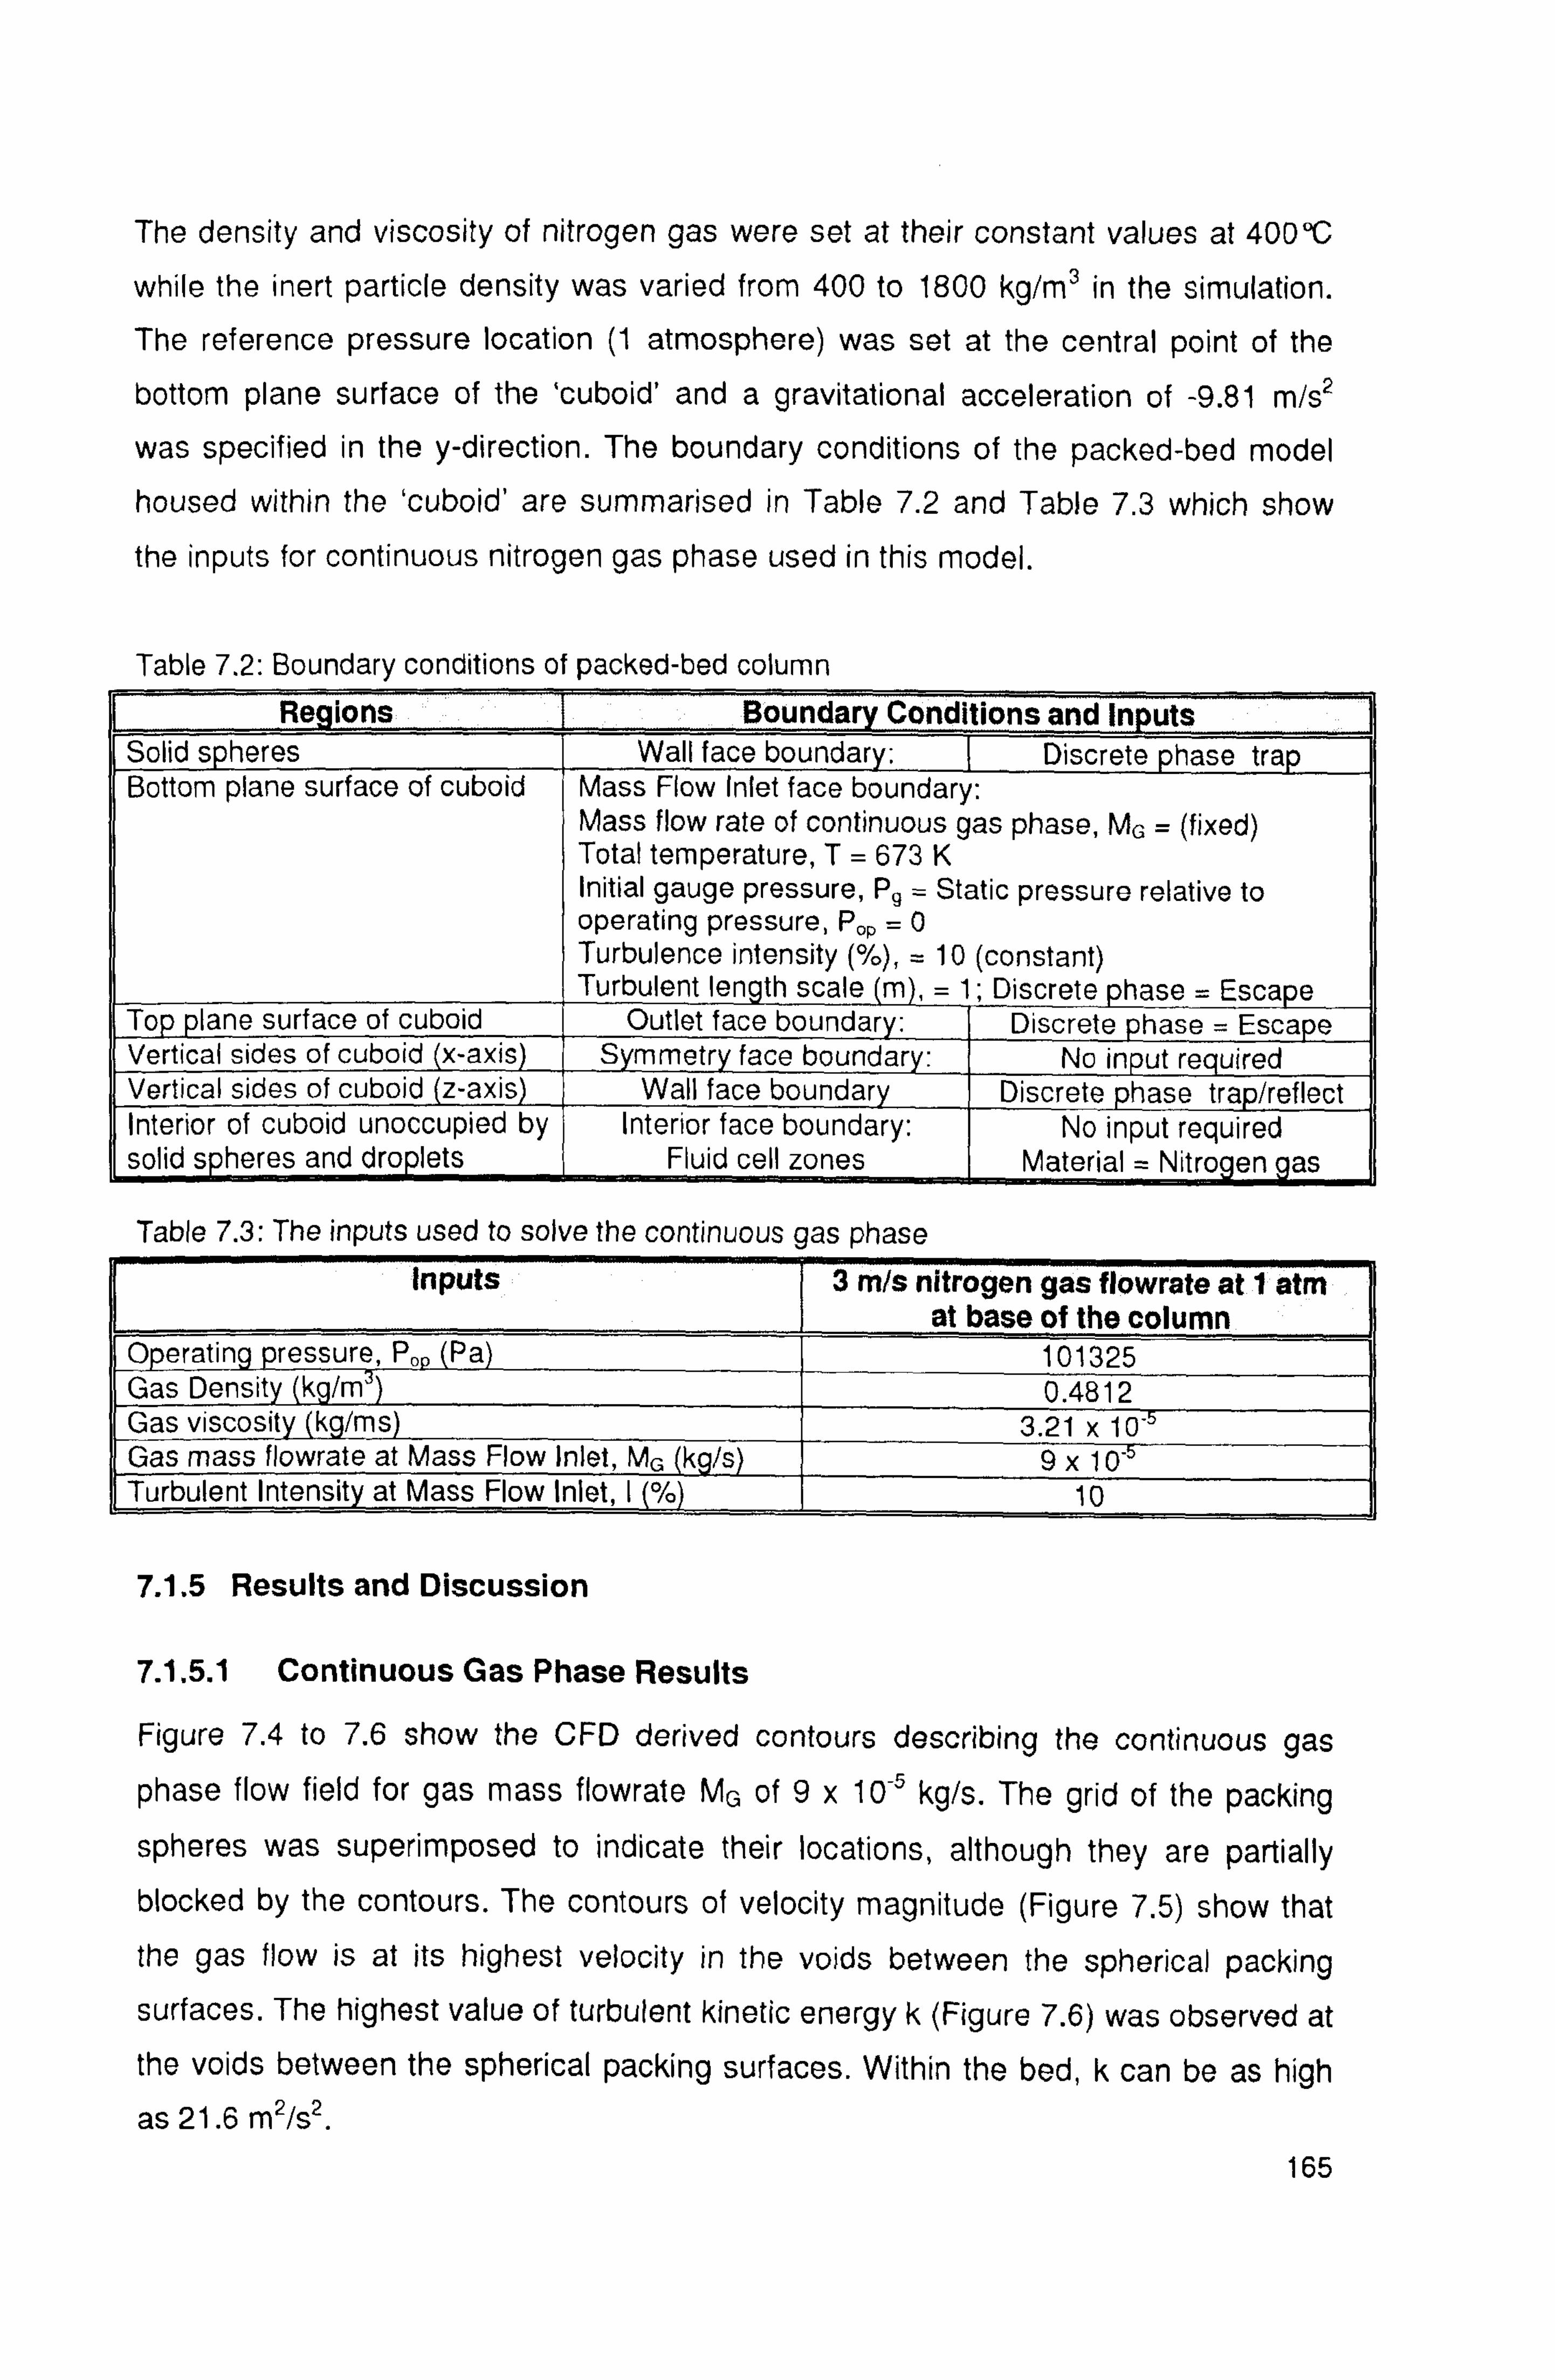
The density and viscosity of nitrogen gas were set at their constant values at 400°C
while the inert particle density was varied from 400 to 1800 kg/m3 in the simulation. The reference pressure location (1 atmosphere) was set at the central point of the
bottom plane surface of the `cuboid' and a gravitational acceleration of -9.81 m/s2
was specified in the y-direction. The boundary conditions of the packed-bed model housed within the `cuboid' are summarised in Table 7.2 and Table 7.3 which show
the inputs for continuous nitrogen gas phase used in this model.
Table 7,2: Boundary conditions of packed-bed column Regions Boundary Conditions and Inputs
Solid spheres Wall face boundary; Discrete phase trap Bottom plane surface of cuboid Mass Flow Inlet face boundary:
Mass flow rate of continuous gas phase, MG = (fixed) Total temperature, T= 673 K Initial gauge pressure, P. = Static pressure relative to operating pressure, Pop =0 Turbulence intensity (%), = 10 (constant) Turbulent length scale (m), = 1; Discrete phase = Escape
Top plane surface of cuboid Outlet face boundar : Discrete phase = Escape Vertical sides of cuboid (x-axis) S mmetr face boundar : No input required Vertical sides of cuboid z-axis Wall face boundary Discrete phase trap/reflect Interior of cuboid unoccupied by Interior face boundary: No input required solid s heres and droplets Fluid cell zones Material = Nitrogen gas
Table 7.3: The inputs used to solve the continuous gas phase Inputs 3 m/s nitrogen gas flowrate at 1 atm
at base of the column Operating pressure, Po (Pa) 101325 Gas Density (kg*') 0.4812 Gas viscosity (kg/ms) 3.21 x 10 Gas mass flowrate at Mass Flow Inlet, MG k /s 9x 10 Turbulent Intensity at Mass Flow Inlet, I (%) 10
7.1.5 Results and Discussion
7.1.5.1 Continuous Gas Phase Results
Figure 7.4 to 7.6 show the CFD derived contours describing the continuous gas
phase flow field for gas mass flowrate MG of 9x 10⁻⁵ kg/s. The grid of the packing
spheres was superimposed to indicate their locations, although they are partially blocked by the contours. The contours of velocity magnitude (Figure 7.5) show that
the gas flow is at its highest velocity in the voids between the spherical packing
surfaces. The highest value of turbulent kinetic energy k (Figure 7.6) was observed at the voids between the spherical packing surfaces. Within the bed, k can be as high
as 21.6 m2/s2. 165
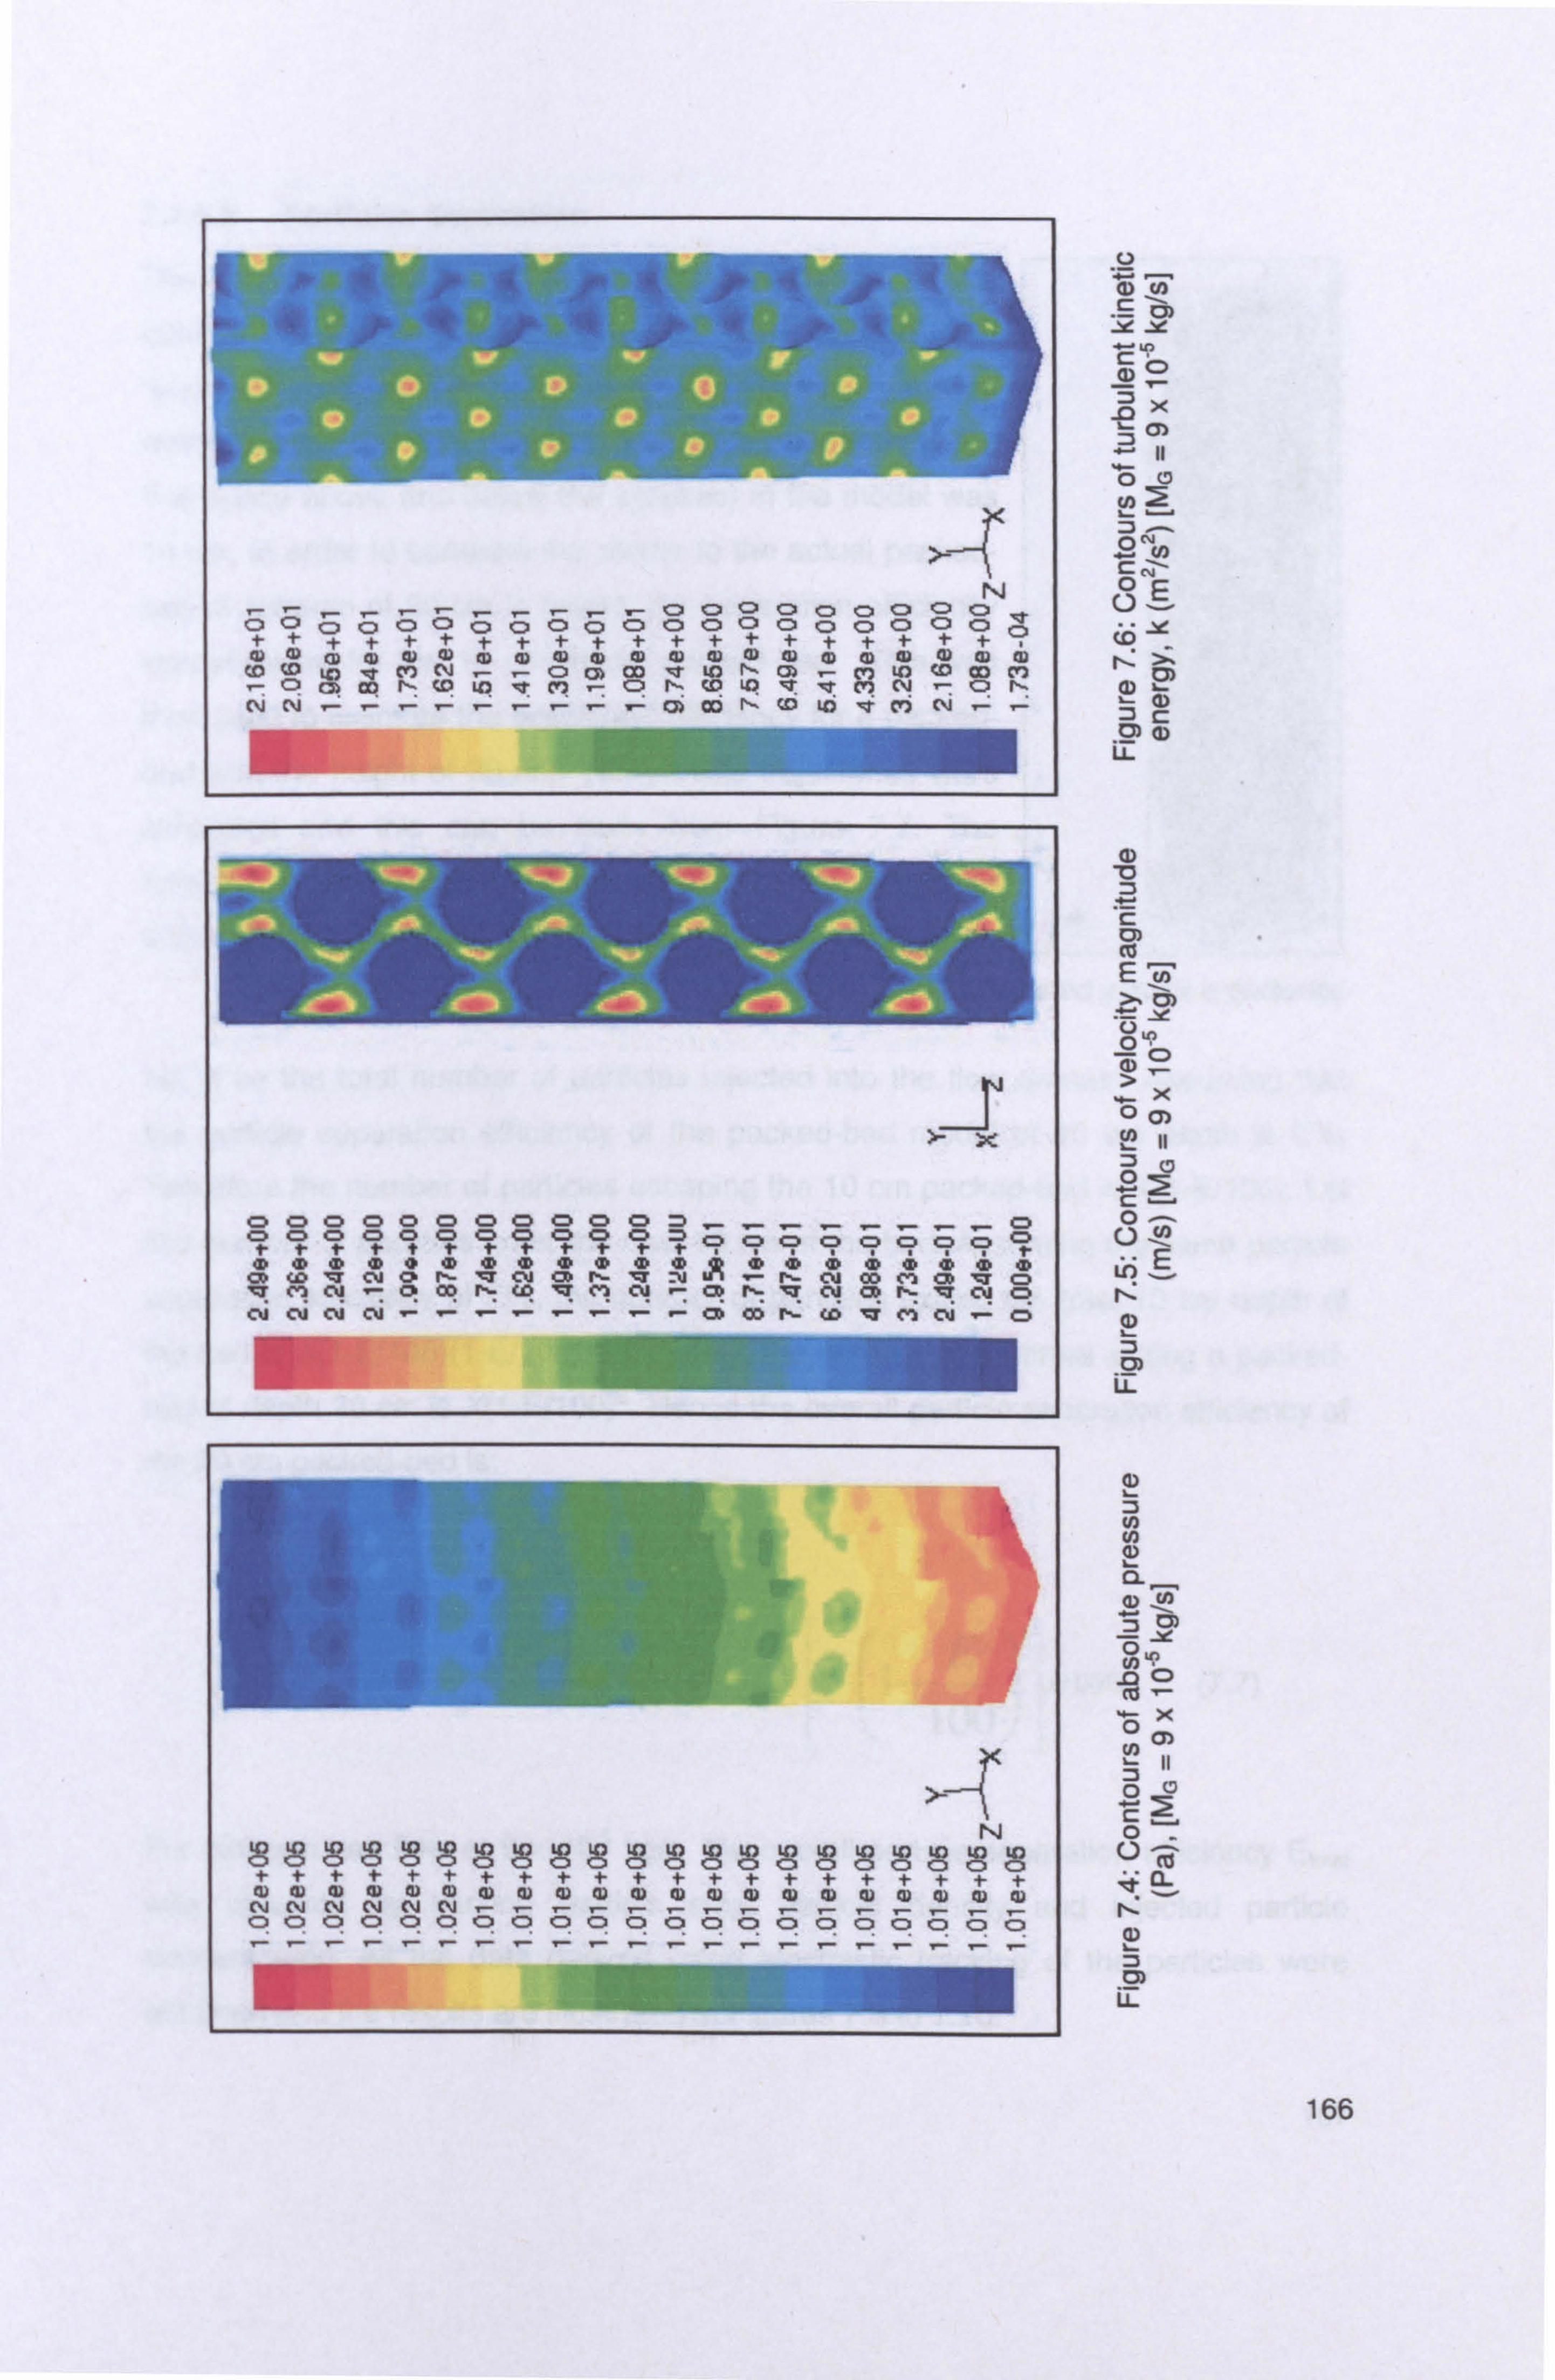
ý-4 N öööö ööö ööö ö 0 öö0 o
0 ö öö v 0ö
+++t ++t t++ + +++ + t t+ 0 ++ mmmm mmm mmm m mmm m m mmm CO CD c» ö W^ M u0 CO Co co o m n Co io vM o, h v m cY a r- . NNr rrr rrr r ä Co N- CO Ip '{ Nr .-
4
000000 00 00 0 =-- r. - o CO. 0000 0 0o ao o z fl o0 0 0000 0 trrtt "00o
r m
rr 0m
rr 0a
r 0
r m00 m m0m0 m
ao co Q C. J a ti a cu CD ti a ti ti cu OD rs CD a o a c? CM -a ao ti co a r? CU - ao r- a Cu ao r- a cu Co. of Cu NN CD ao w co C 01- ö w
öööCIE öCIE 8CIT88CIE AD öCIE öC'ööä RC9 ++++++I. ++++++++++++ mmd a) dww a) a) a) ddmmm a) a) a) a) a) NNNNNN 0000oaööööööööööööööö
....
0
m -al) ýL Y
4) O
X
Oý
w O c7 (a 2
ON U)
ON UE
a) ýa) LL
a) C
0)
E
o 0) Nu
o:
o-- Uy iii
E ri
0) LL
y y C)
Ny
-0 O
CO - ÖX
U 3 II
O C O
CL
U-
166
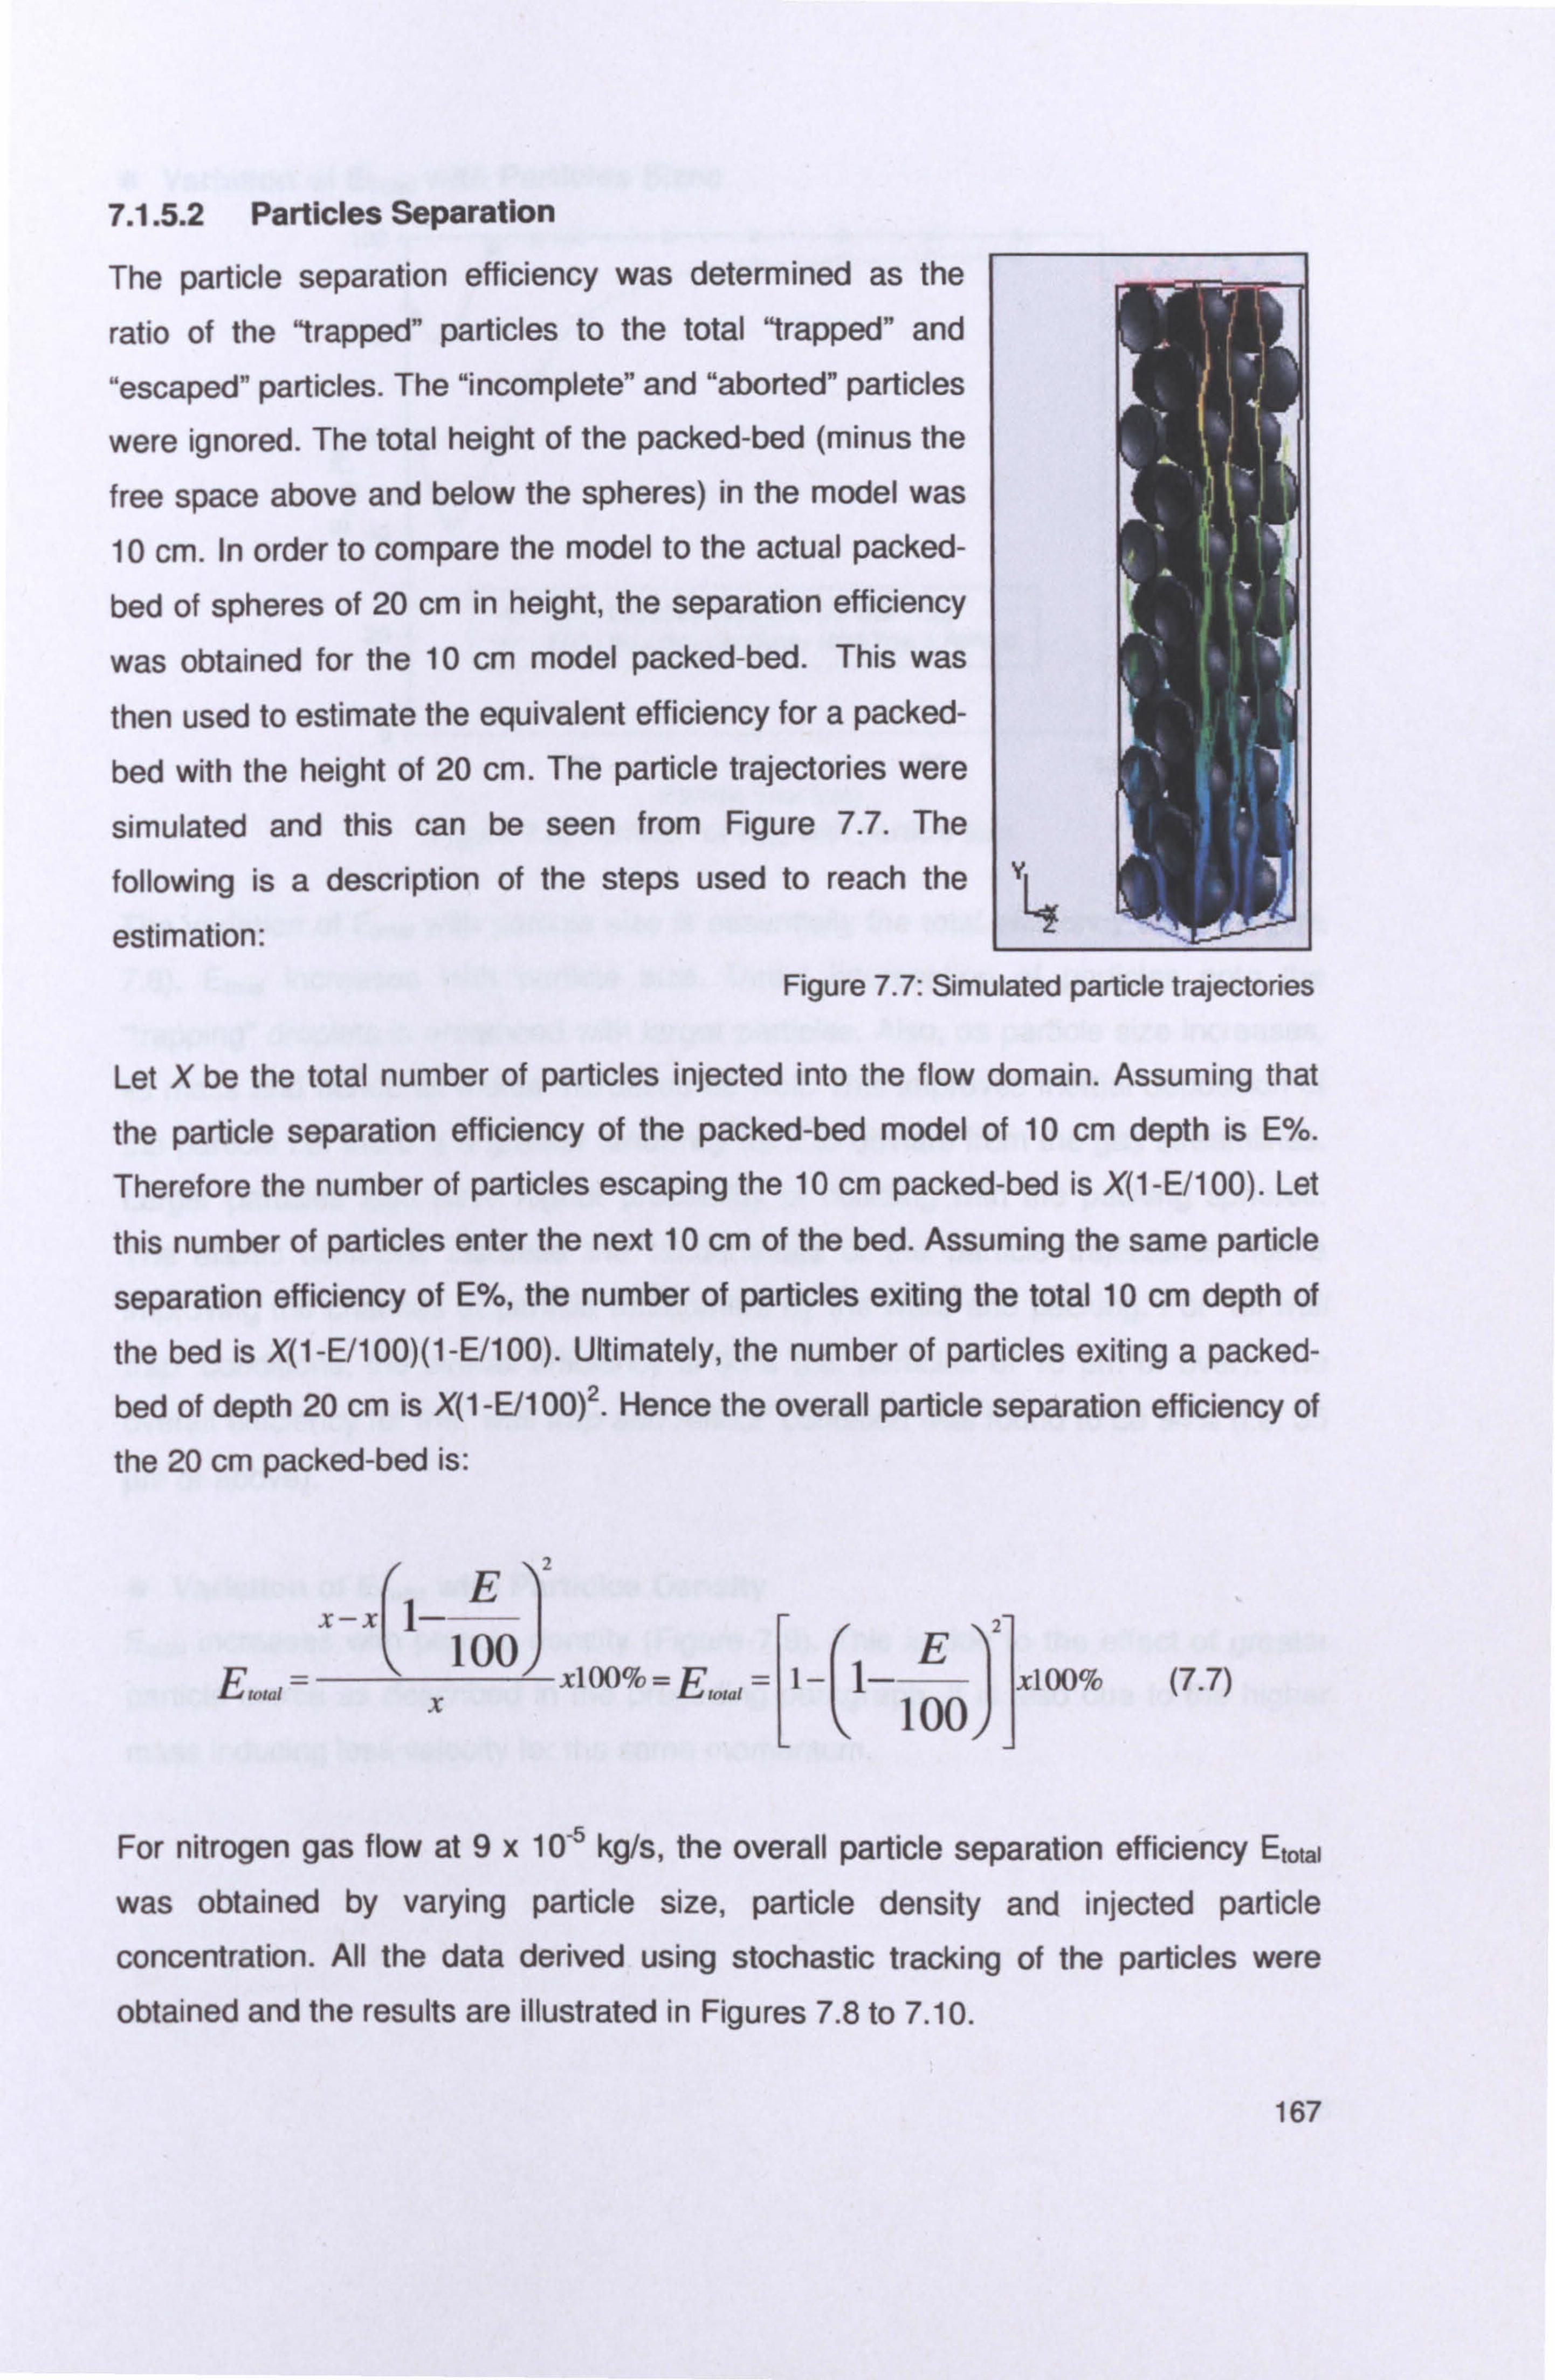
7.1.5.2 Particles Separation
The particle separation efficiency was determined as the
ratio of the "trapped" particles to the total "trapped" and
"escaped" particles. The "incomplete" and "aborted" particles
were ignored. The total height of the packed-bed (minus the
free space above and below the spheres) in the model was
10 cm. In order to compare the model to the actual packed-
bed of spheres of 20 cm in height, the separation efficiency
was obtained for the 10 cm model packed-bed. This was
then used to estimate the equivalent efficiency for a packed-
bed with the height of 20 cm. The particle trajectories were
simulated and this can be seen from Figure 7.7. The
following is a description of the steps used to reach the
estimation:
y4
Figure 7.7: Simulated particle trajectories
Let X be the total number of particles injected into the flow domain. Assuming that
the particle separation efficiency of the packed-bed model of 10 cm depth is E%.
Therefore the number of particles escaping the 10 cm packed-bed is X(1-E/100). Let
this number of particles enter the next 10 cm of the bed. Assuming the same particle
separation efficiency of E%, the number of particles exiting the total 10 cm depth of
the bed is X(1-E/100)(1-E/100). Ultimately, the number of particles exiting a packed- bed of depth 20 cm is X(1-E/100)2. Hence the overall particle separation efficiency of the 20 cm packed-bed is:
z E
X-z 1- 2 Eýaý =
100 xi oo% = E., = I- 1- E lxlOO%
(7.7) X 100
For nitrogen gas flow at 9x 10⁻⁵ kg/s, the overall particle separation efficiency Etotai
was obtained by varying particle size, particle density and injected particle
concentration. All the data derived using stochastic tracking of the particles were
obtained and the results are illustrated in Figures 7.8 to 7.10.
167

* Variation of ETOtaI with Particles Sizes
100
80
-60 '°
s I W 40
20
0
t E(T) - Boundary Conditions (All Wall Trap)
-ý E(T) - Boundary Conditions (Wall Trap & Reflect)
0 20 40 60 80 Particle Size (µm)
Figure 7.8: Variation of Etotai with particle size
The variation of Etotai with particle size is essentially the total efficiency curve (Figure
7.8). Etotai increases with particle size. Direct interception of particles onto the
"trapping" droplets is enhanced with larger particles. Also, as particle size increases,
its mass and hence its inertia increases as well. This improves inertial deposition of
the particle i. e. there is a greater tendency for it to deviate from the gas streamlines. Larger particles also have higher probability of colliding with the packing spheres.
The elastic collisions increase the randomness of the particle trajectories hence
improving the chances of particle entrapment by the walls and packing. For "all wall
trap" conditions, the overall efficiency is 95% (i. e. particles of 10 µm or over). The
overall efficiency for the "wall trap and reflecf' condition was found to be 94% (i. e. 35
µm or above).
* Variation of ETota, with Particles Density
Etota, increases with particle density (Figure 7.9). This is due to the effect of greater
particle inertia as described in the preceding paragraph. It is also due to the higher
mass inducing less velocity for the same momentum.
168

100
80
-60 ö
s w 40
20
0
+ Particles Mass Flowrate: 9E-05 kg/s Particle Size = 10 mm Nitrogen Gas Velocity 3.0 m/s
0 200 400 600 800 1000 1200 1400 1600 1800 2000 Particle Density (kg/m3)
Figure 7.9: Variation of Etota, with particle density
* Variation of ETota, with Different Inlet Velocity
100
80 2
- 60 0
W 40
20
0 0
t Inlet Velocity 0.5 Ms
-0-- Inlet Velocity 1.0 m/s t Inlet Velocity 3.0 m/s -6 Inlet Velocity 5.0 m/s
20 40 60 80 Particle Size (µm)
Figure 7.10: Variation of Etote, with particle size
For nitrogen gas velocities of 0.5 m/s and higher, the total efficiency ET increased as
shown in Figure 7.10. The total efficiency curves at 3 m/s and 5 m/s nitrogen gas
velocities were consistently higher for particles larger than 15µm. Therefore, in order
to obtain higher efficiency, a high inlet velocity was required. The comparison of total
efficiency was not carried out with the experimental results as described in Chapter
6. This was due to the formation of agglomerates in the column. Nevertheless, this
simulation work provided basic information on how the mechanisms of particulate
cleaning occurred in the packed-bed hot gas scrubber.
169

7.2 Microsoft Excel - Desulphurisation
The scope of this work is to model the process for better understanding of gas
cleaning behavior in the scrubber. This model was programmed as a Microsoft®
Excel spreadsheet and used to simulate the rate of reaction in the packed-bed
scrubber.
7.2.1 Introduction
The effectiveness of using liquid tin for H2S absorption was documented in early
1984 (Schürmann, 1984). Due to the limited source of information little effort was
made to develop a liquid tin scrubber for pollution control. Nevertheless research on
the reaction rate and mechanisms of H2S with tin was pursued by Hedden (1986) to
gain better understanding of the desulphurisation system. Absorption of H2S occurs
with simultaneous mass transfer and fast chemical reaction.
7.2.2 Mathematical Model
Consider a packed-bed column with the following characteristics. The amount of gas
absorbed in section dZ is -dy (Changkook Ryu et al., 2007):
- ýv = K0 (Y;,,
- y')a, - atz (7.8) uc;
where Ko = Overall mass transfer coefficient (m/s) ae = Effective specific interfacial area (m2/m3) y;, = Inlet gas concentration (ppm) you, = Outlet gas concentration (ppm) uG = Gas superficial velocity (m/s) Z = Column height (m)
This equation is rearranged for integration by grouping together the constant factors
u; aedZ, and Ko, which have a constant value with dZ.
K0a, (O ZrdZ =
KQ(LZT dti (7.9) J u(i uc%
" rn � mu
The equation for the column height, ZT can be written by integrating dZ from 0 to ZT; as follows:
ur d. v (7.10) Zýý- K fh (Y
in - You)
170
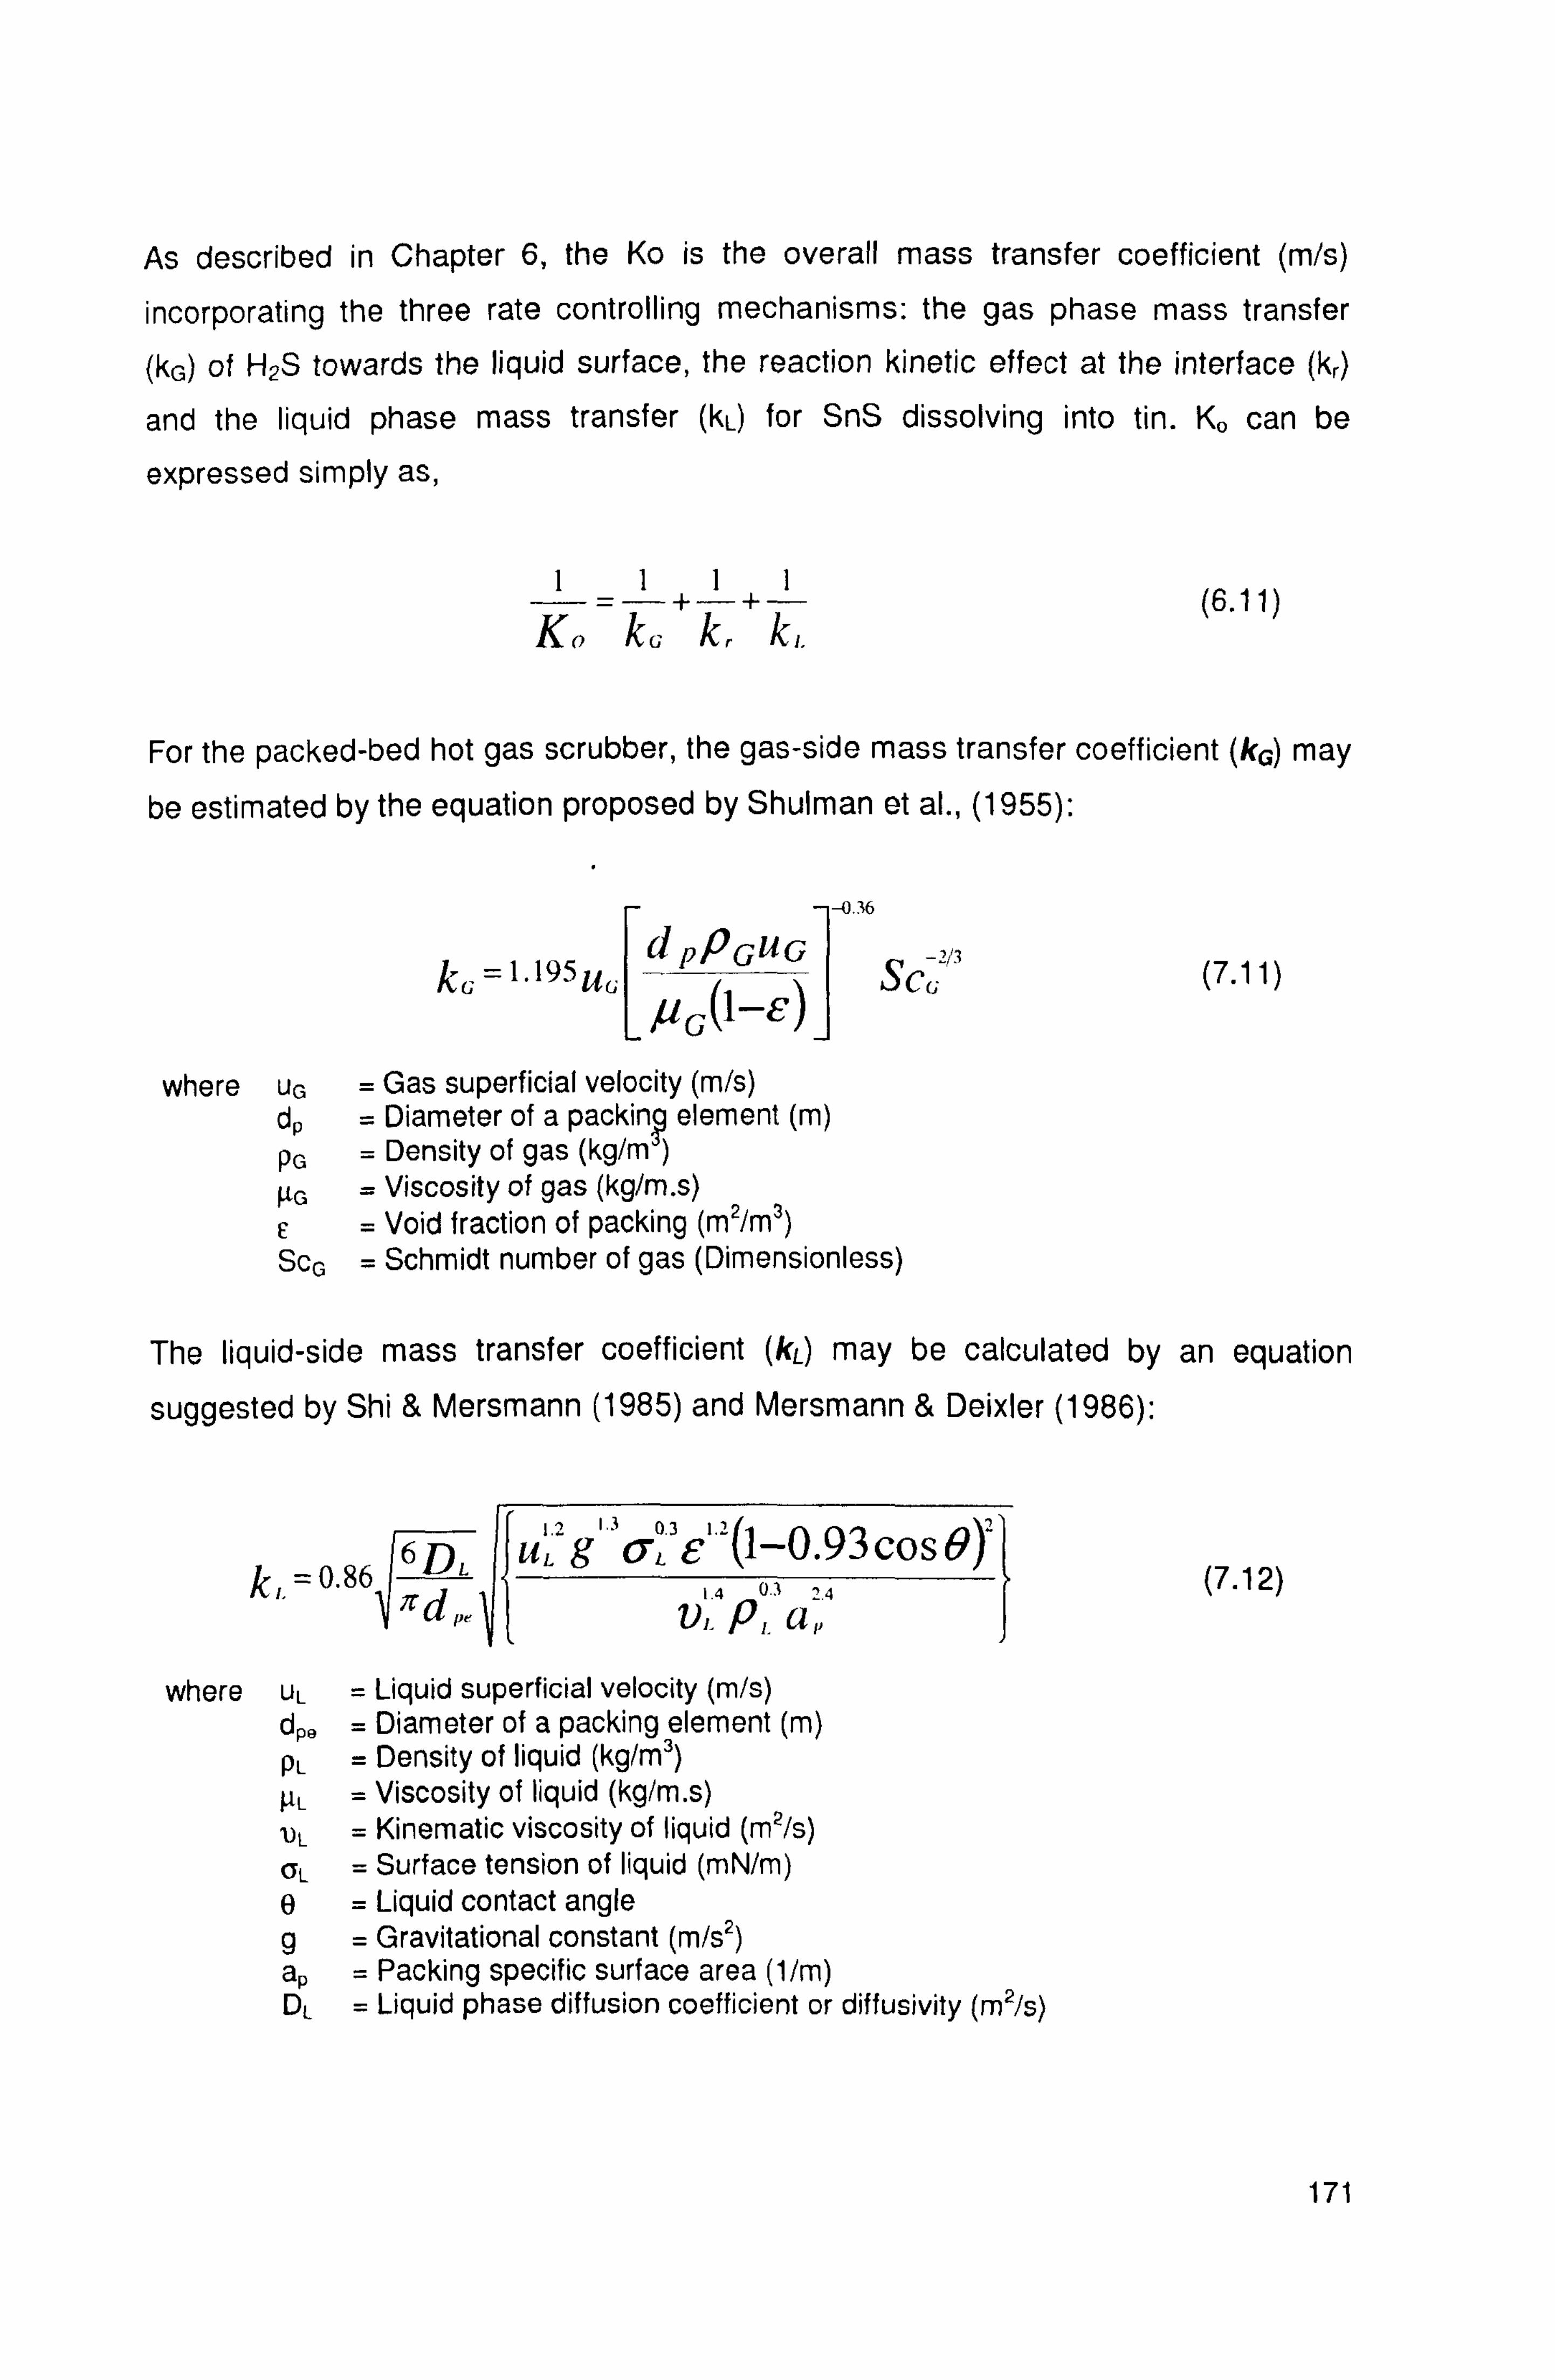
As described in Chapter 6, the Ko is the overall mass transfer coefficient (m/s)
incorporating the three rate controlling mechanisms: the gas phase mass transfer
(kG) of H2S towards the liquid surface, the reaction kinetic effect at the interface (kr)
and the liquid phase mass transfer (kL) for SnS dissolving into tin. Ko can be
expressed simply as,
1111
Ký L kr k,. (6.11)
For the packed-bed hot gas scrubber, the gas-side mass transfer coefficient (ks) may be estimated by the equation proposed by Shulman et al., (1955):
-0.36
(7.11) c =1.19511c
d
ßncPGUG -213 Sc k
(1-E)
where uG = Gas superficial velocity (m/s) dp = Diameter of a packing element (m) PG = Density of gas (kg/m
µG = Viscosity of gas (kg/m. s) F = Void fraction of packing (m2/m3) SCG = Schmidt number of gas (Dimensionless)
The liquid-side mass transfer coefficient (kL) may be calculated by an equation
suggested by Shi & Mersmann (1985) and Mersmann & Deixler (1986):
1.2 1.3 0.3F,
6DL 1.2
uL g 6L 1-0.93 cos 8)` k,. 0.86
1.4 03 2.4 (7.12)
v,. I ý,. a 1,
where UL = Liquid superficial velocity (m/s) dP0 = Diameter of a packing element (m) PL = Density of liquid (kg/m3) µL = Viscosity of liquid (kg/m. s) UL = Kinematic viscosity of liquid (m2/s) OL = Surface tension of liquid (mN/m) g = Liquid contact angle g = Gravitational constant (m/s2) ap = Packing specific surface area (1/m) DL = Liquid phase diffusion coefficient or diffusivity (m2/s)
171
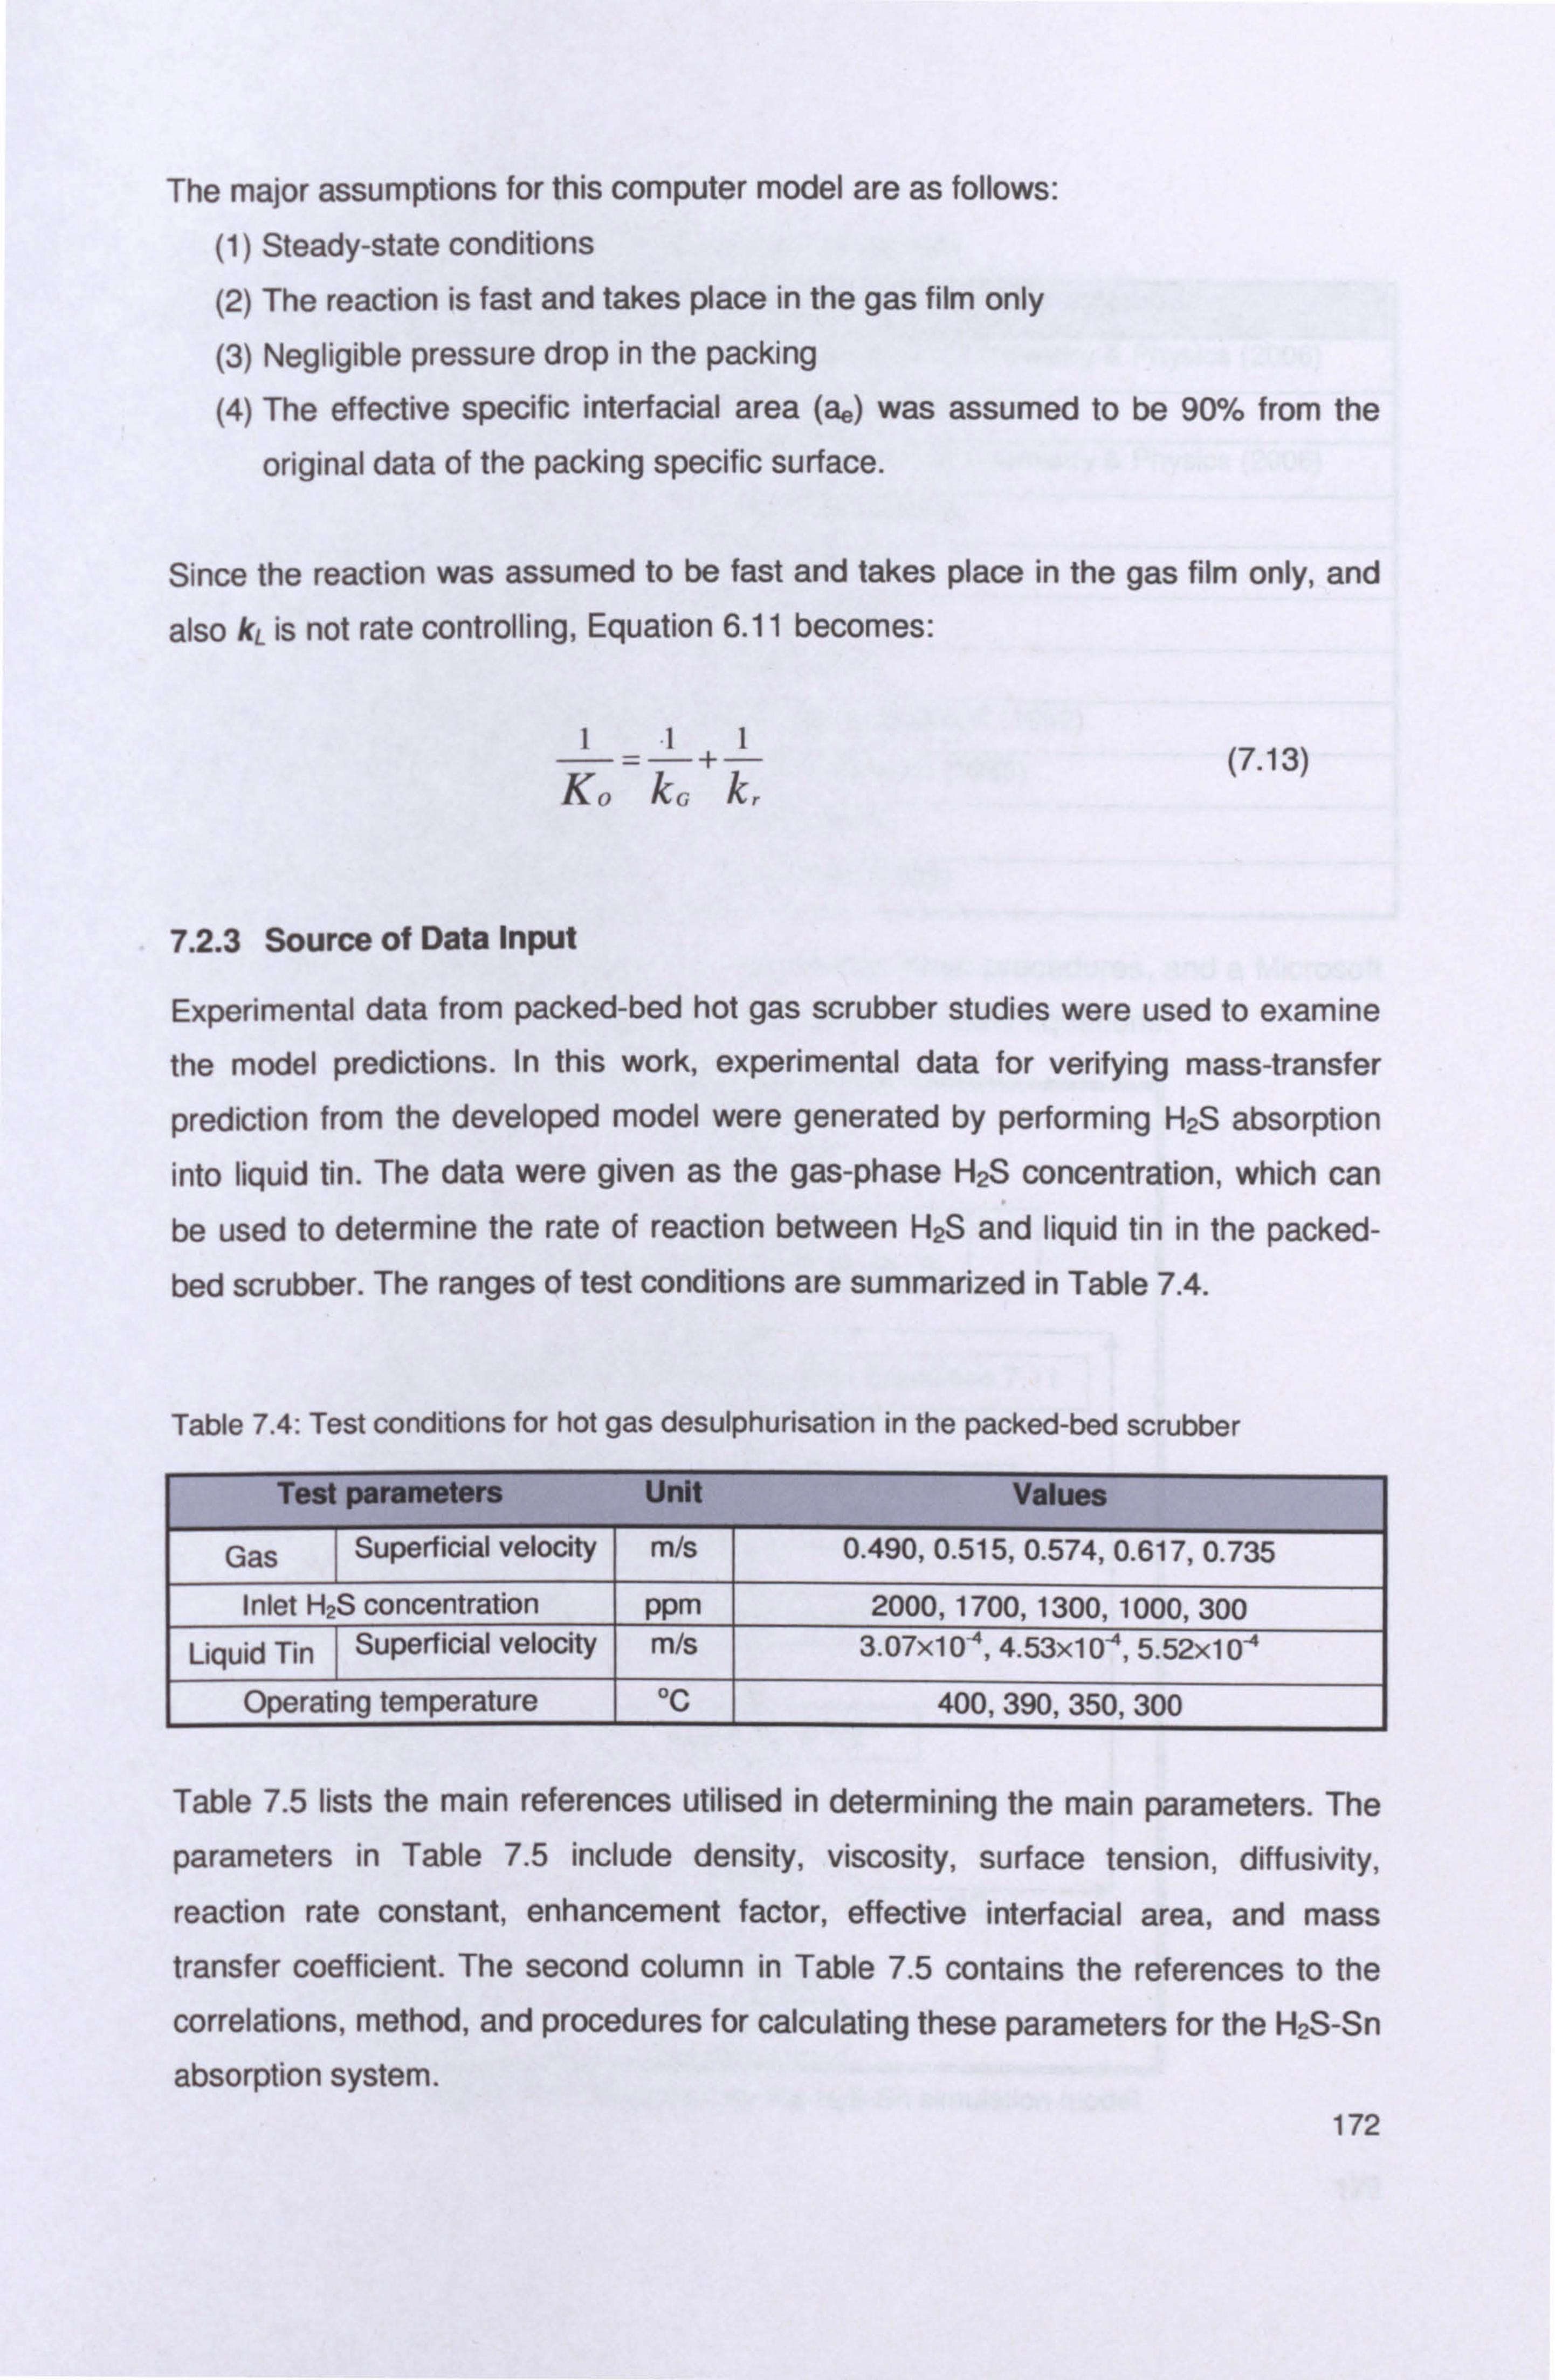
The major assumptions for this computer model are as follows:
(1) Steady-state conditions (2) The reaction is fast and takes place in the gas film only (3) Negligible pressure drop in the packing (4) The effective specific interfacial area (ae) was assumed to be 90% from the
original data of the packing specific surface.
Since the reaction was assumed to be fast and takes place in the gas film only, and
also kL is not rate controlling, Equation 6.11 becomes:
Il1 -+- (7.13)
K,, kG k,
7.2.3 Source of Data Input
Experimental data from packed-bed hot gas scrubber studies were used to examine
the model predictions. In this work, experimental data for verifying mass-transfer
prediction from the developed model were generated by performing H2S absorption
into liquid tin. The data were given as the gas-phase H2S concentration, which can
be used to determine the rate of reaction between H2S and liquid tin in the packed-
bed scrubber. The ranges of test conditions are summarized in Table 7.4.
Table 7.4: Test conditions for hot gas desulphurisation in the packed-bed scrubber
Test parameters Unit Values
Gas Superficial velocity m/s 0.490,0.515,0.574,0.617,0.735
Inlet H2S concentration ppm 2000,1700,1300,1000,300
Liquid Tin Superficial velocity m/s 3.07x10-4,4.53x10'4,5.52x10-4
Operating temperature °C 400,390,350,300
Table 7.5 lists the main references utilised in determining the main parameters. The
parameters in Table 7.5 include density, viscosity, surface tension, diffusivity,
reaction rate constant, enhancement factor, effective interfacial area, and mass transfer coefficient. The second column in Table 7.5 contains the references to the
correlations, method, and procedures for calculating these parameters for the H2S-Sn
absorption system. 172

Table 7.5: References used to estimate the main parameters
Parameter References/Method
PL, AL, 6L CRC Handbook of Chemistry & Physics (2006)
UL Experimental Work
PG, µc CRC Handbook of Chemistry & Physics (2006)
UG Experimental Work
Packed-bed porosity Chang (2003)
Packing specific surface area Chang (2003)
Effective interfacial area Linek (1984)
Gas-side mass transfer coefficients Shulman & de Grouff (1952)
Liquid-side mass transfer coefficients Shi & Mersmann (1985)
Molten tin-alumina contact angle 9 Chang (2003)
Overall mass transfer coefficients Luke Chen (2002)
The simplified flowchart of Figure 7.11 represents these procedures, and a Microsoft
Excel computer program was developed to solve the model equations.
L START
User Input: Zt UG, UL, Co µG, ltL9% PGf PL, ßL
i=1 Yin C' Yout
Calculate the gas-side (kG) from Equations 7.11
Calculate the overall mass transfer coefficient (K0) using Equation 7.13
Calculate dy using equation 7.8
your=yin+dy
Check Yout =0 NO
YES
L END
Figure 7.11: Flowchart for the H2S-Sn simulation model
173
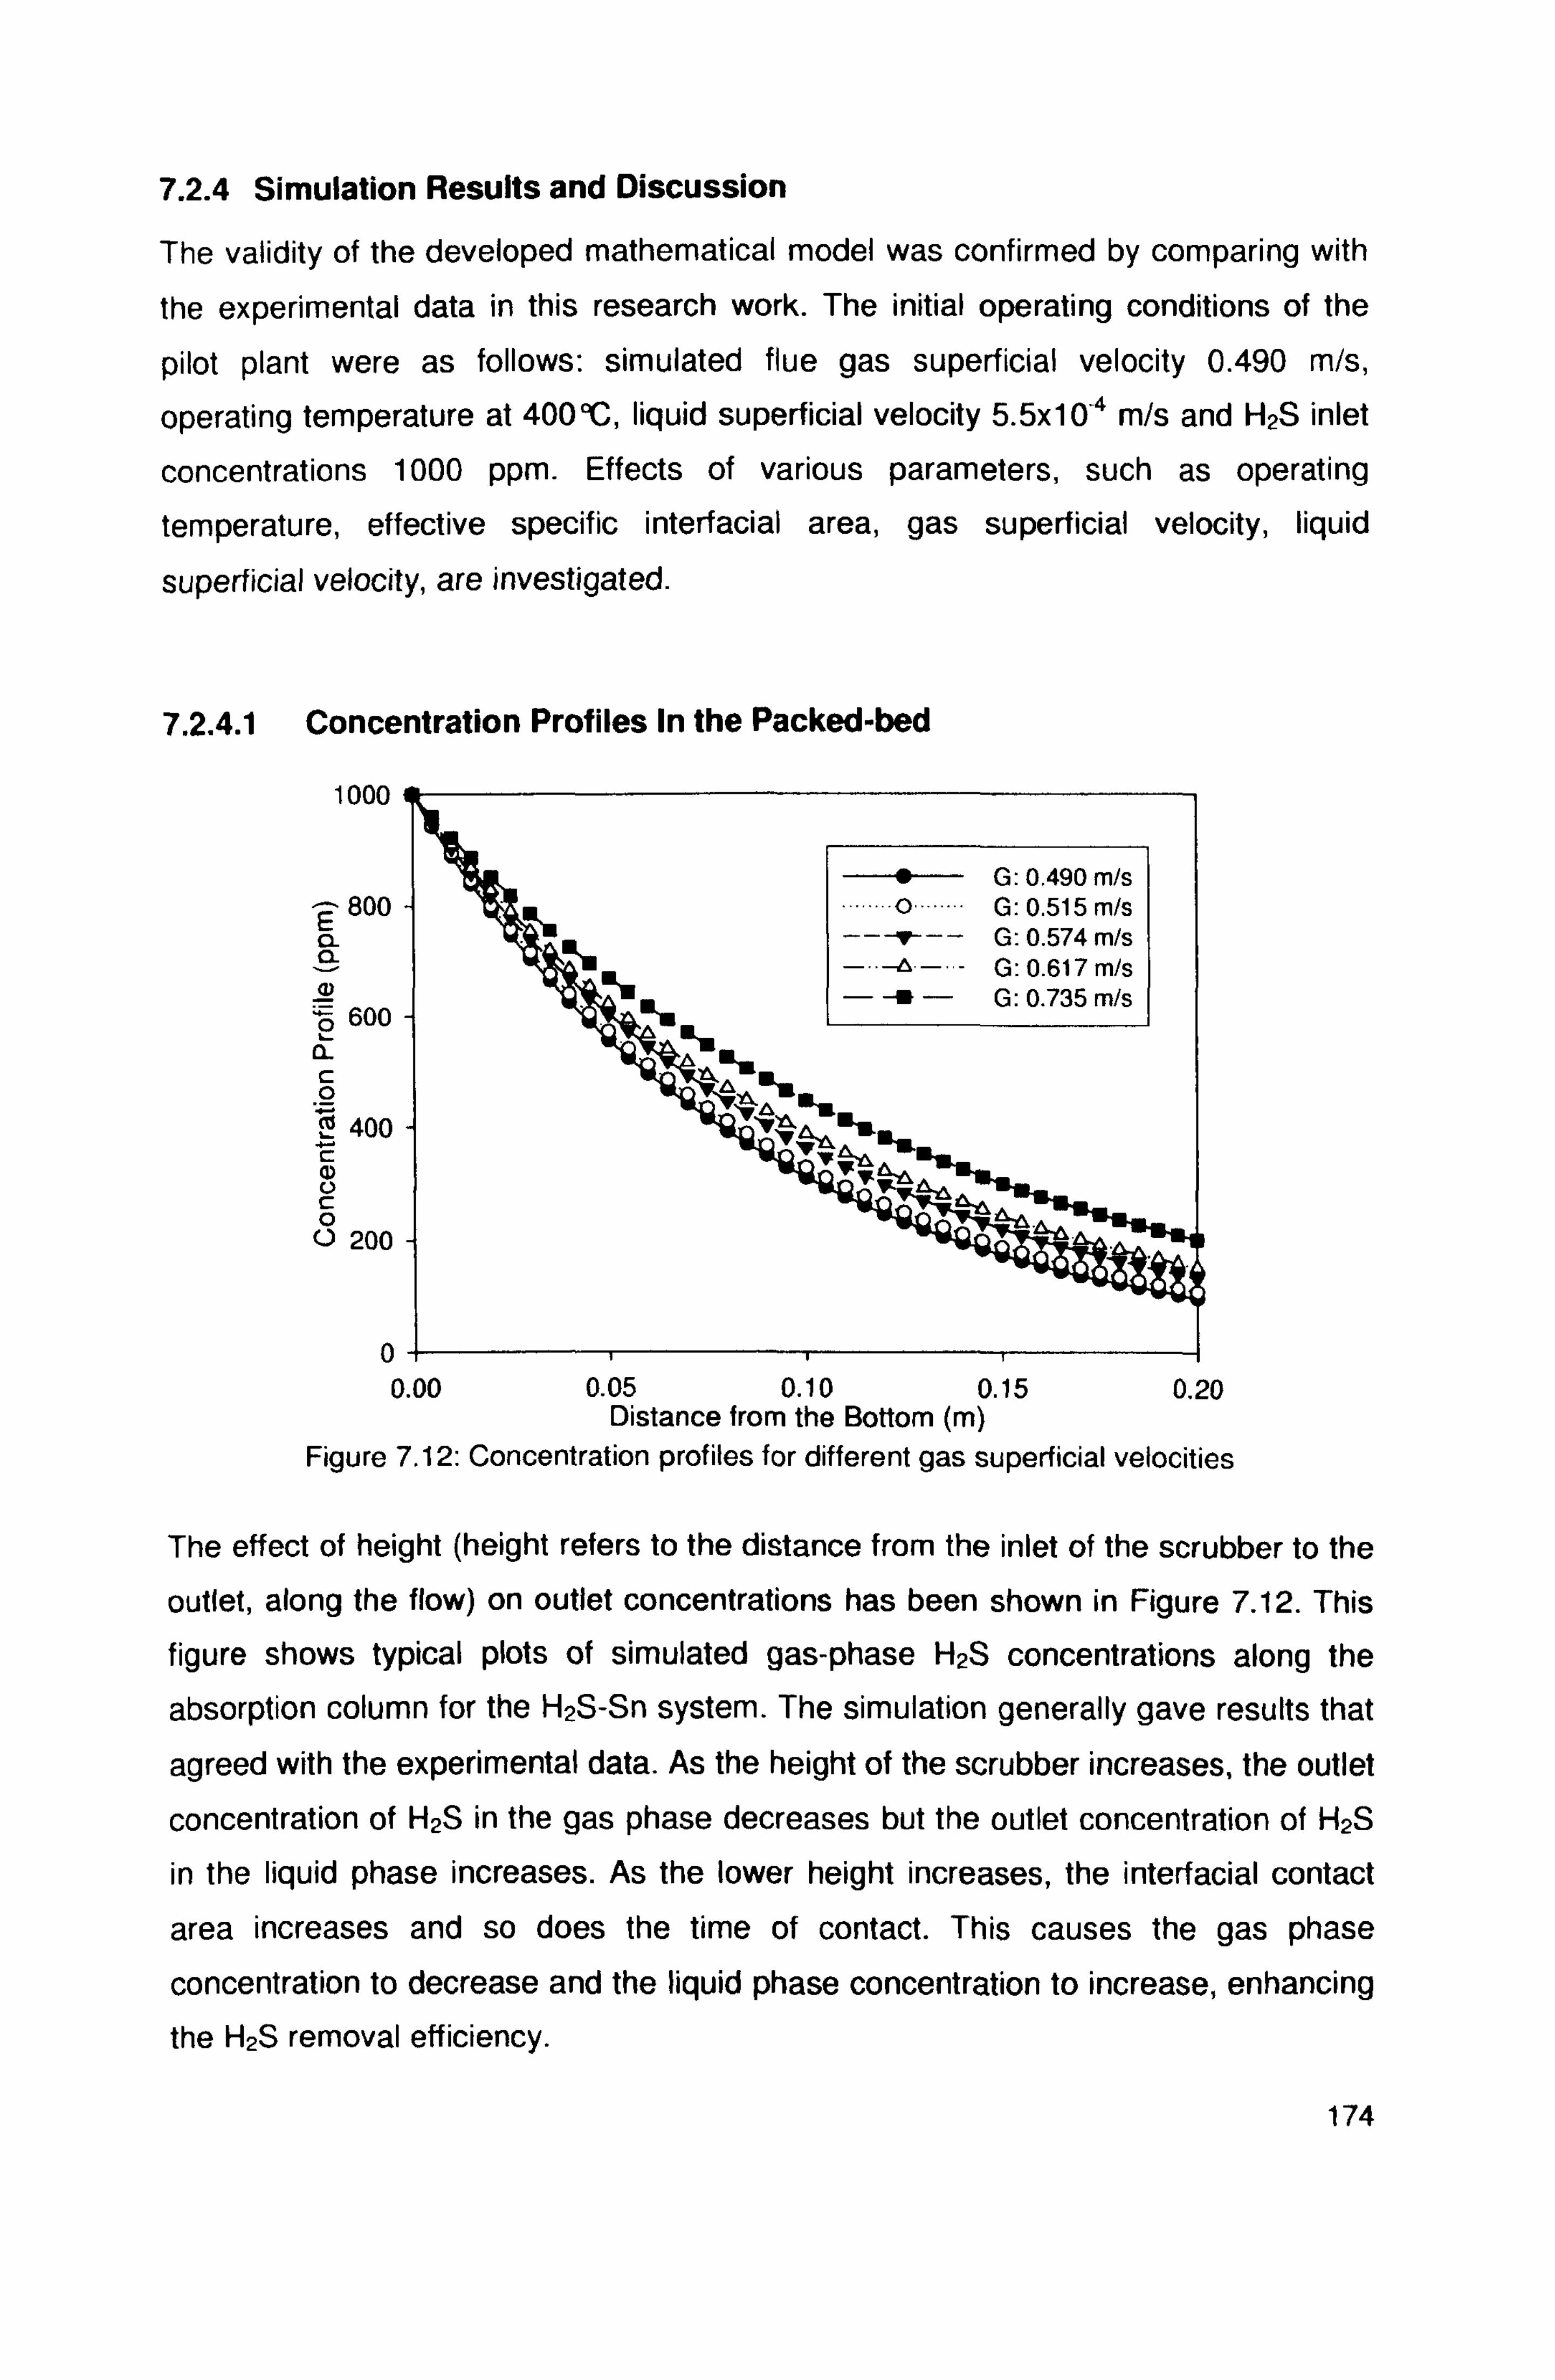
7.2.4 Simulation Results and Discussion
The validity of the developed mathematical model was confirmed by comparing with
the experimental data in this research work. The initial operating conditions of the
pilot plant were as follows: simulated flue gas superficial velocity 0.490 m/s,
operating temperature at 400°C, liquid superficial velocity 5.5x10⁻⁴ m/s and H2S inlet
concentrations 1000 ppm. Effects of various parameters, such as operating
temperature, effective specific interfacial area, gas superficial velocity, liquid
superficial velocity, are investigated.
7.2.4.1 Concentration Profiles In the Packed-bed
1000
800
aý 600
a c 0 0 400 C
a) U C 0 U 200
" G: 0.490 m/s o G: 0.515 m/s
-- t -- G: 0.574 m/s - -0- G: 0.617 m/s - -f - G: 0.735 m/s
0i 0.00 0.05 0.10 0.15 0.20
Distance from the Bottom (m)
Figure 7.12: Concentration profiles for different gas superficial velocities
The effect of height (height refers to the distance from the inlet of the scrubber to the
outlet, along the flow) on outlet concentrations has been shown in Figure 7.12. This
figure shows typical plots of simulated gas-phase H2S concentrations along the
absorption column for the H2S-Sn system. The simulation generally gave results that
agreed with the experimental data. As the height of the scrubber increases, the outlet
concentration of H2S in the gas phase decreases but the outlet concentration of H2S
in the liquid phase increases. As the lower height increases, the interfacial contact
area increases and so does the time of contact. This causes the gas phase
concentration to decrease and the liquid phase concentration to increase, enhancing
the H2S removal efficiency.
174
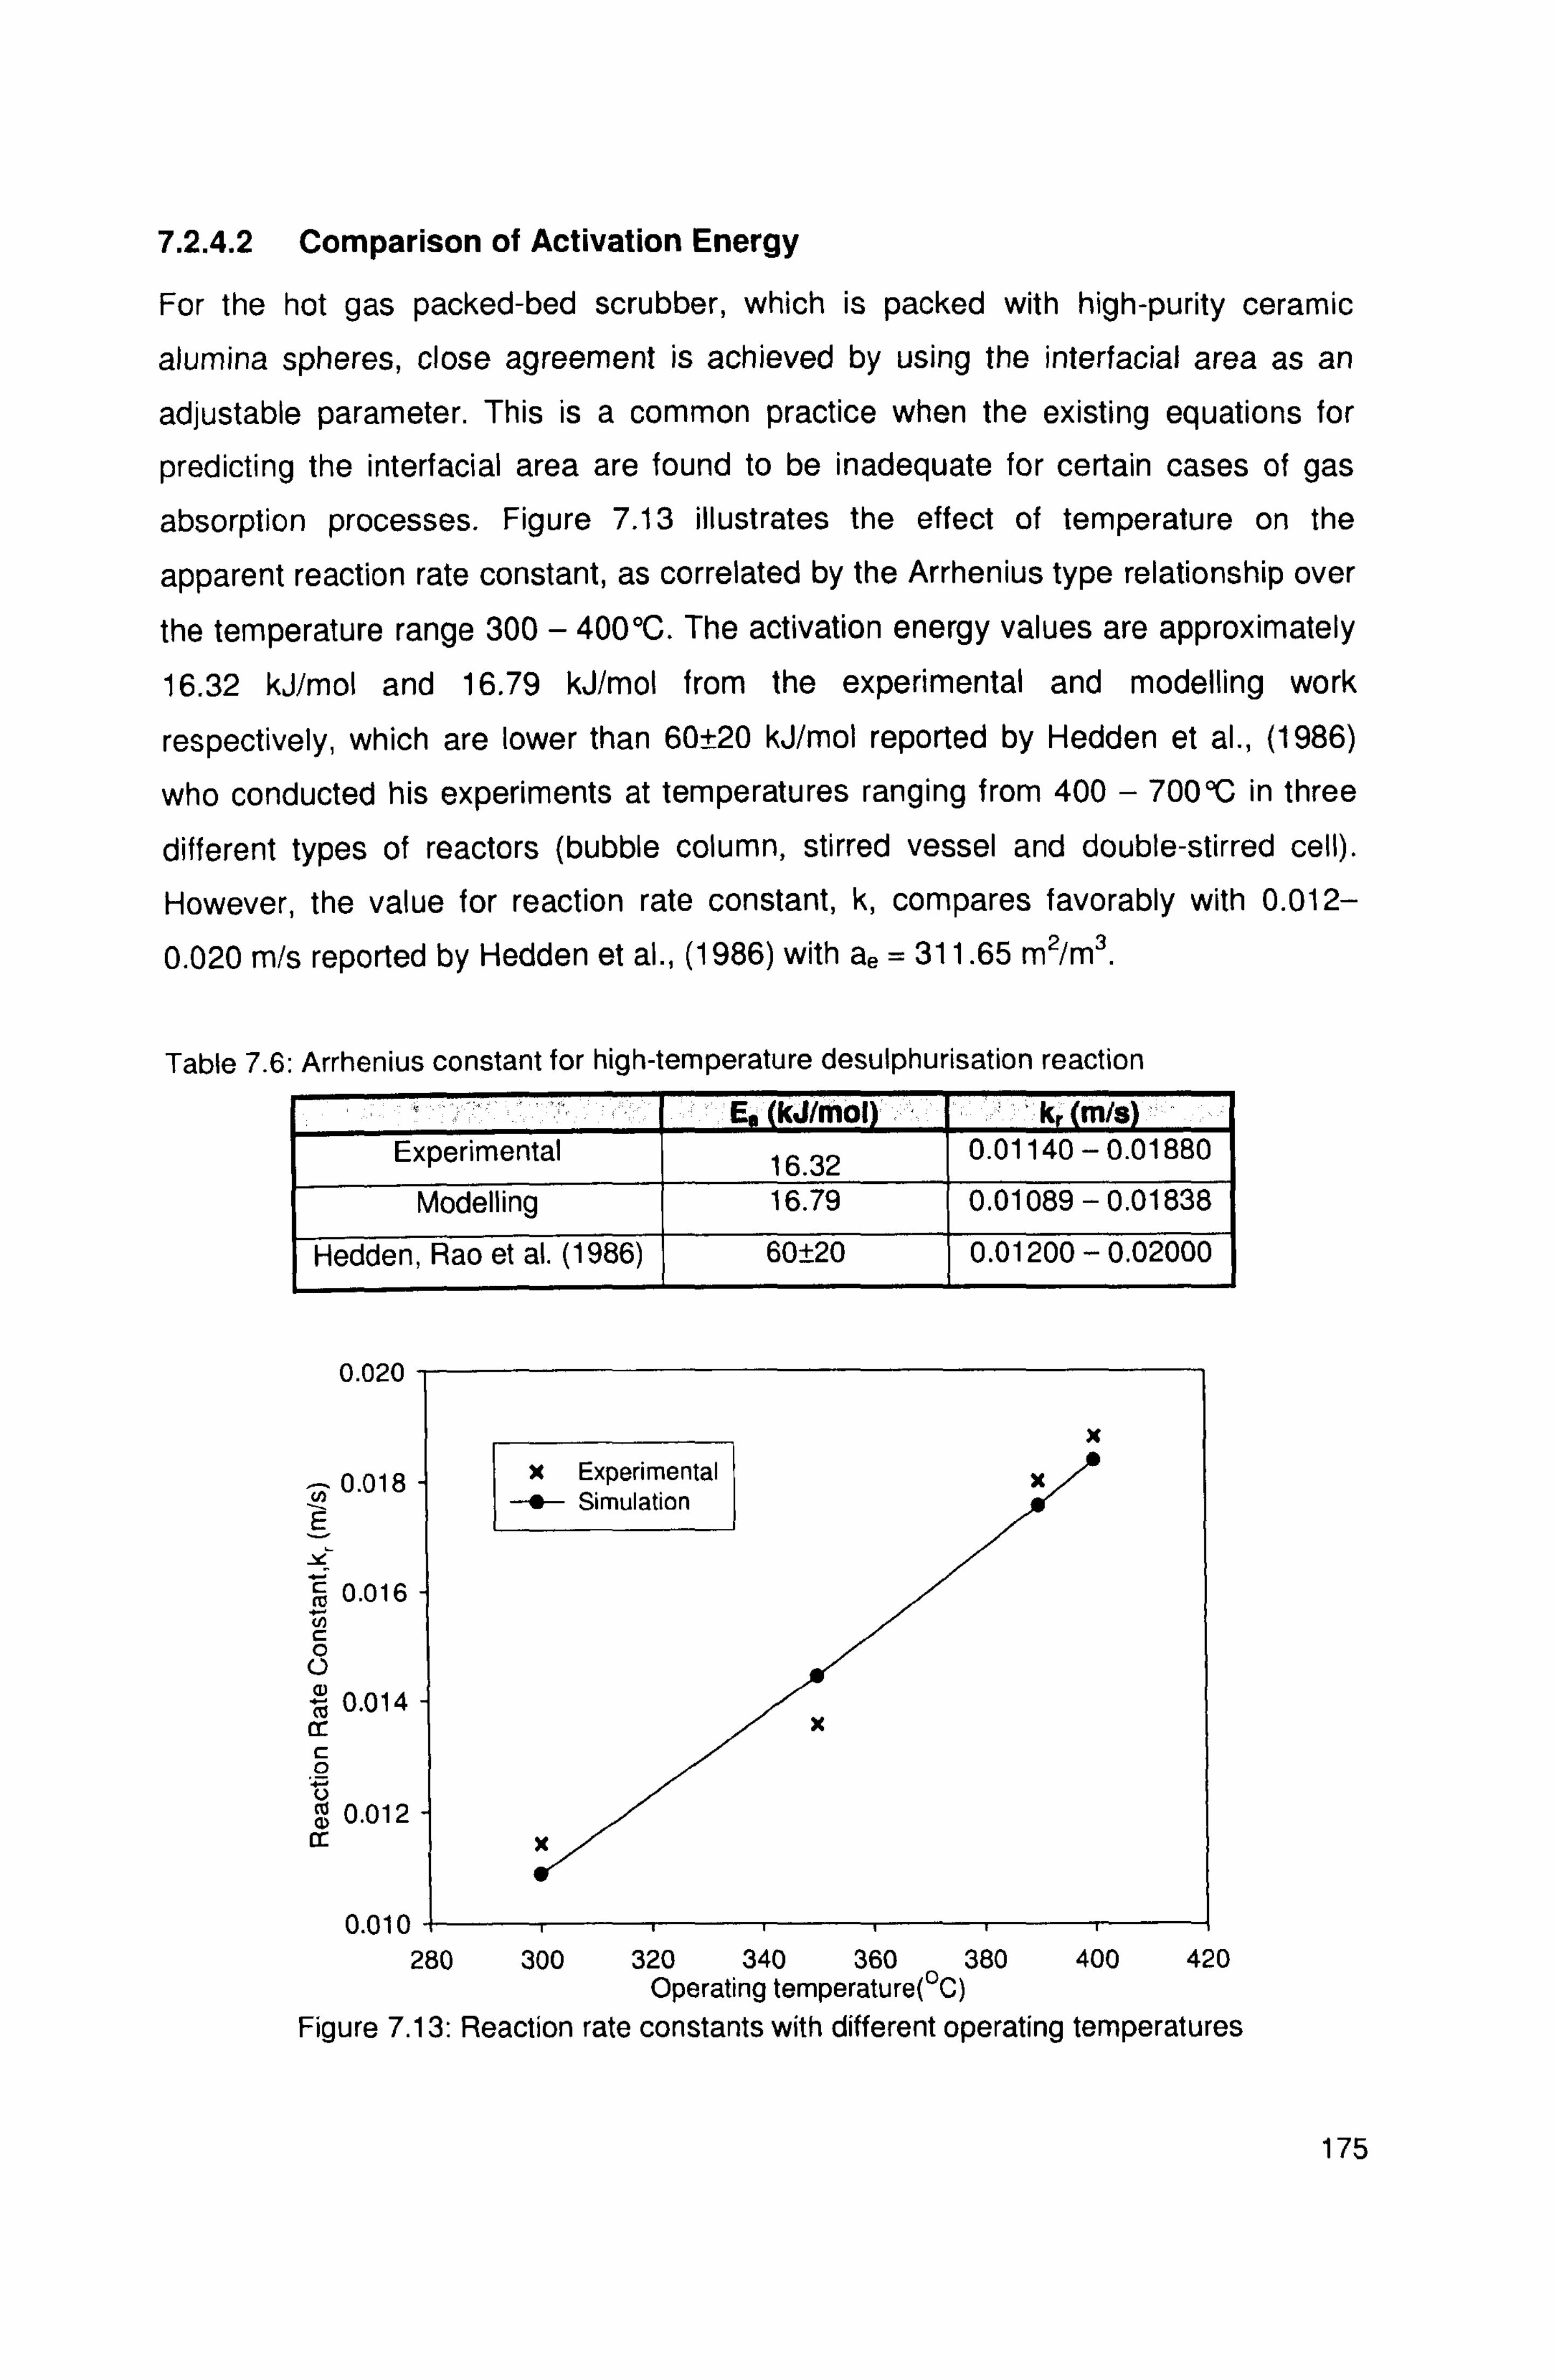
7.2.4.2 Comparison of Activation Energy
For the hot gas packed-bed scrubber, which is packed with high-purity ceramic
alumina spheres, close agreement is achieved by using the interfacial area as an
adjustable parameter. This is a common practice when the existing equations for
predicting the interfacial area are found to be inadequate for certain cases of gas
absorption processes. Figure 7.13 illustrates the effect of temperature on the
apparent reaction rate constant, as correlated by the Arrhenius type relationship over
the temperature range 300 - 400°C. The activation energy values are approximately
16.32 kJ/mol and 16.79 kJ/mol from the experimental and modelling work
respectively, which are lower than 60±20 kJ/mol reported by Hedden et al., (1986)
who conducted his experiments at temperatures ranging from 400 - 700°C in three
different types of reactors (bubble column, stirred vessel and double-stirred cell).
However, the value for reaction rate constant, k, compares favorably with 0.012-
0.020 m/s reported by Hedden et al., (1986) with ae = 311.65 m2/m3.
Table 7.6: Arrhenius constant for high-temperature desulphurisation reaction
E kJJmol k, m/s Experimental 16.32 0.01140 - 0.01880
Modelling 16.79 0.01089 - 0.01838
Hedden, Rao et al. (1986) 60±20 0.01200 - 0.02000
0.020
N 0.018 E Y
0.016
c 0 U 0.014
cr c 0 Ü
0.01 m
0.010 !ITI 280 300 320 340 360 380 400 420
Operating temperature(°C)
Figure 7.13: Reaction rate constants with different operating temperatures
175
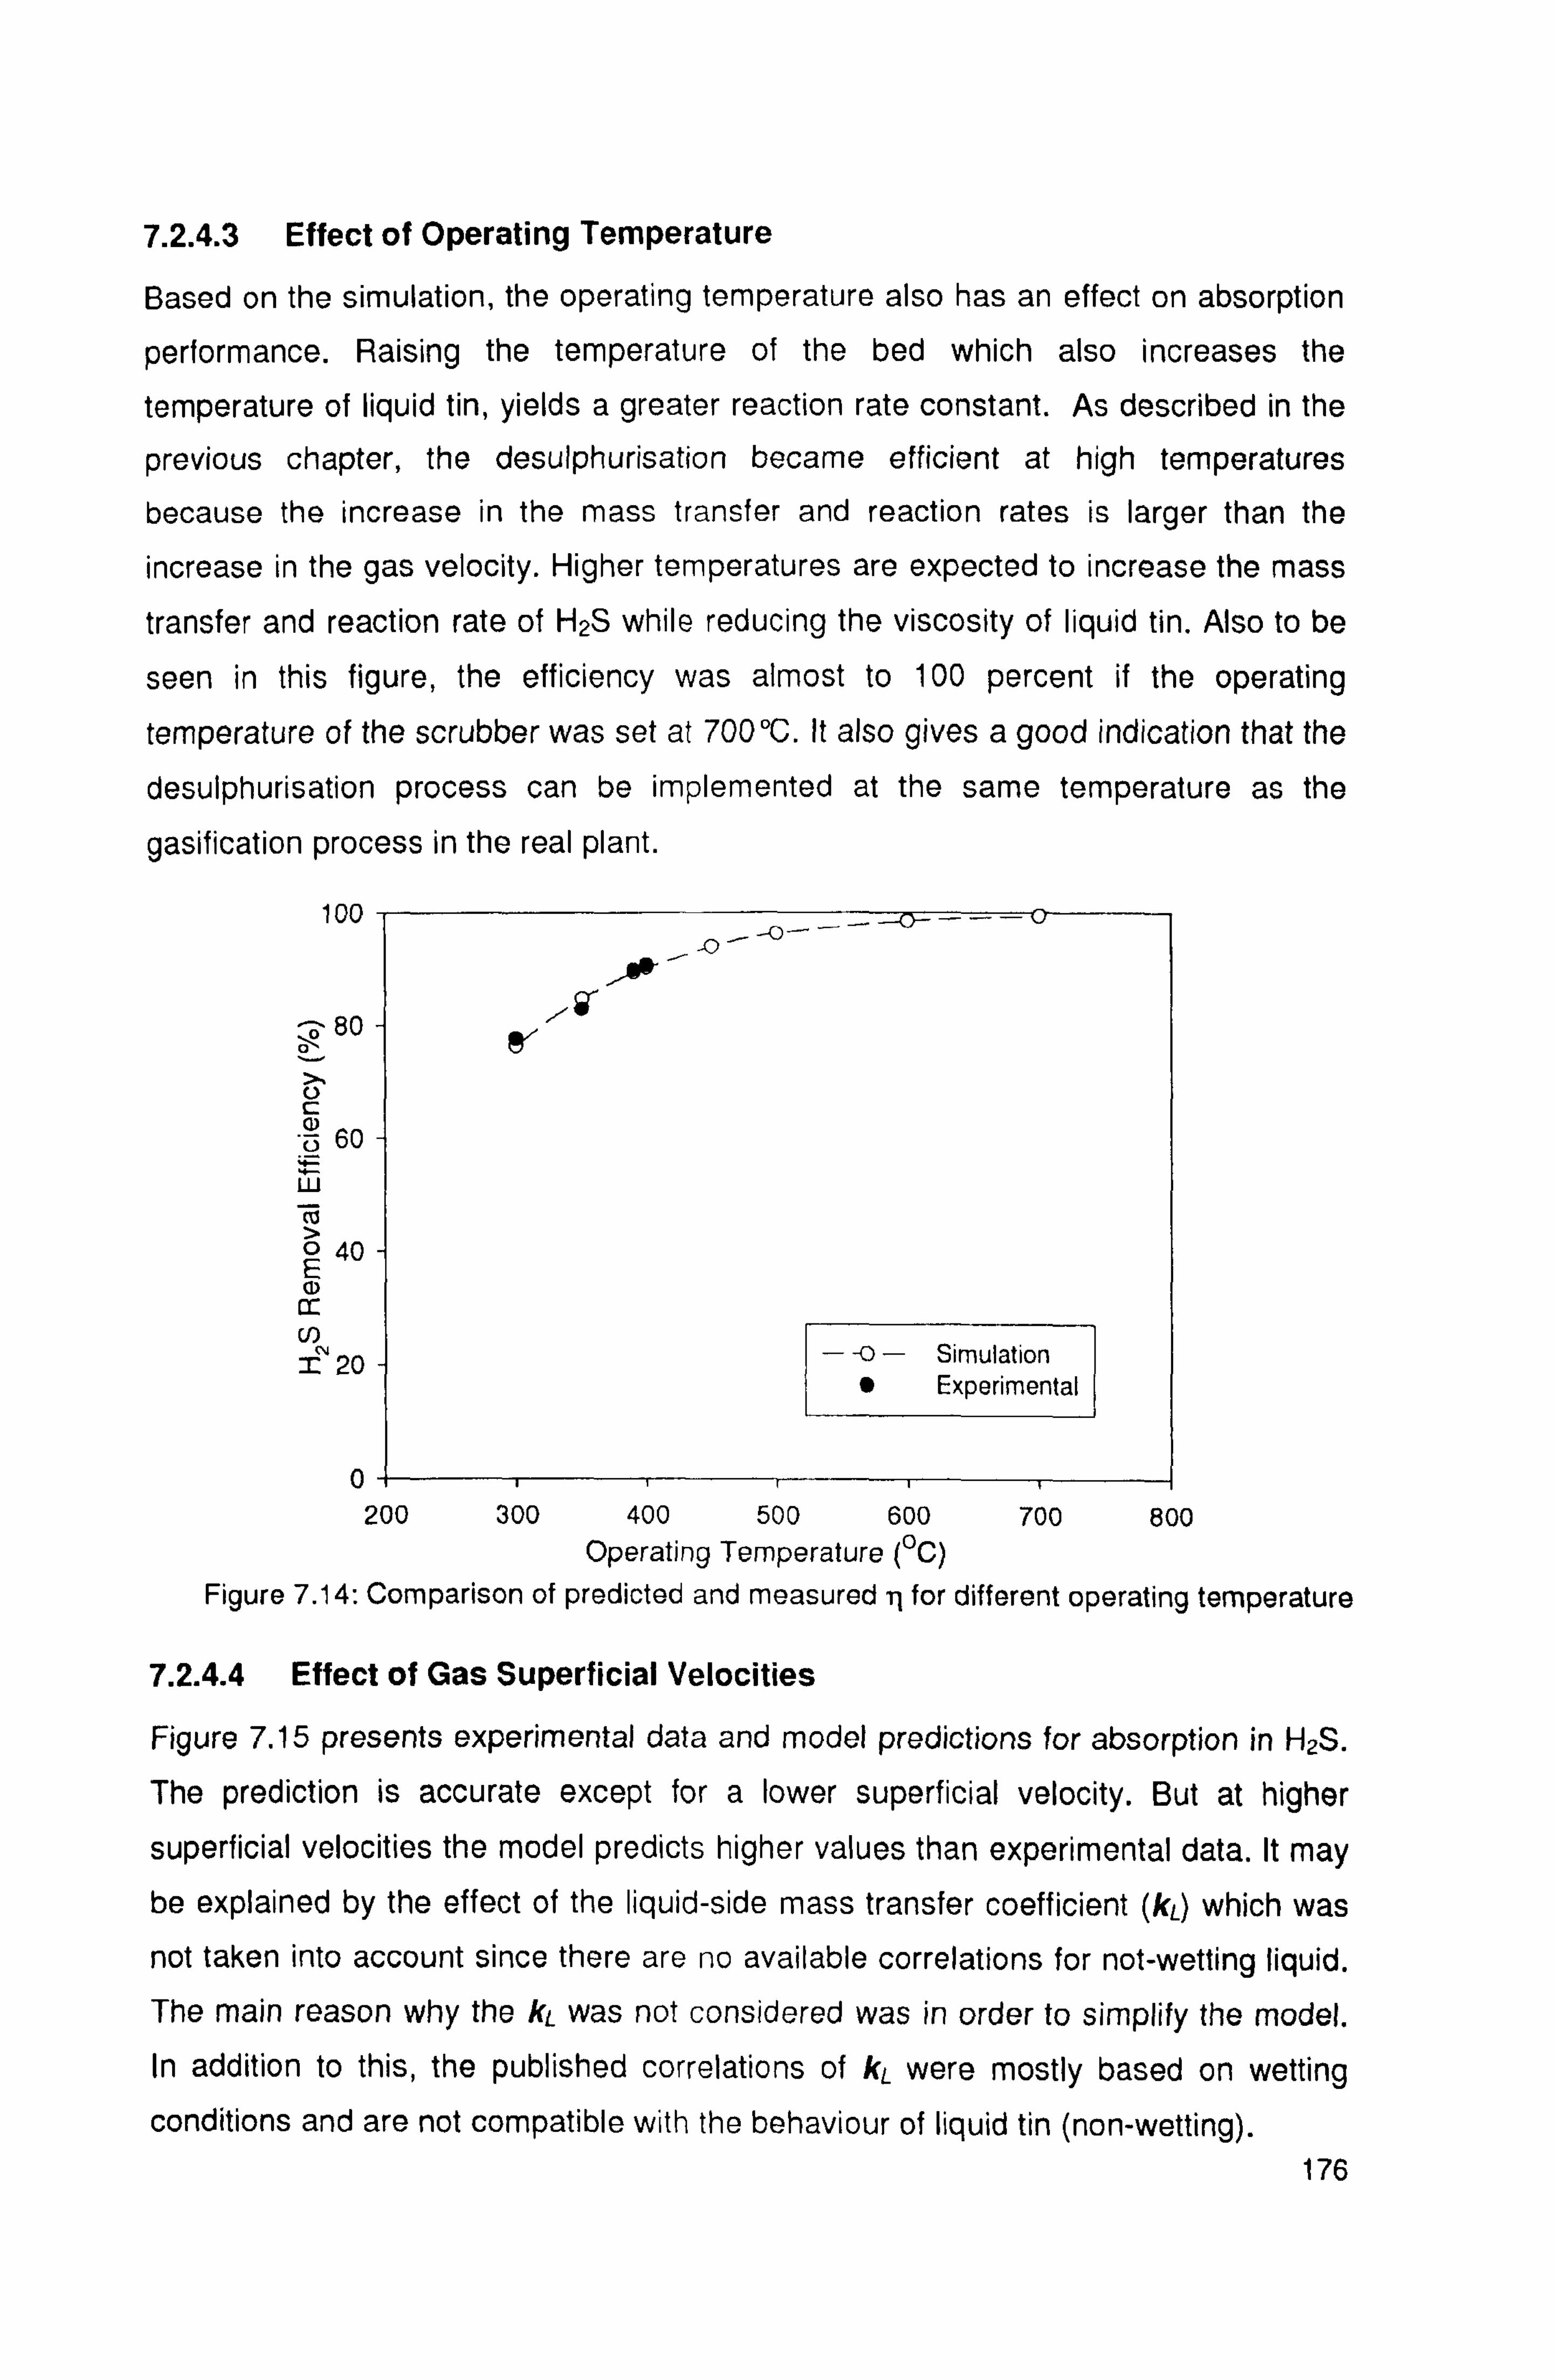
7.2.4.3 Effect of Operating Temperature
Based on the simulation, the operating temperature also has an effect on absorption
performance. Raising the temperature of the bed which also increases the
temperature of liquid tin, yields a greater reaction rate constant. As described in the
previous chapter, the desulphurisation became efficient at high temperatures
because the increase in the mass transfer and reaction rates is larger than the
increase in the gas velocity. Higher temperatures are expected to increase the mass transfer and reaction rate of H2S while reducing the viscosity of liquid tin. Also to be
seen in this figure, the efficiency was almost to 100 percent if the operating
temperature of the scrubber was set at 700°C. It also gives a good indication that the
desulphurisation process can be implemented at the same temperature as the
gasification process in the real plant.
100
8O
U C
60
w ro 0 40 a) cc U) T 20
-p. -
0` I- 200 300 400 500 600 700 800
Operating Temperature (°C)
Figure 7.14: Comparison of predicted and measured il for different operating temperature
7.2.4.4 Effect of Gas Superficial Velocities
Figure 7.15 presents experimental data and model predictions for absorption in H2S.
The prediction is accurate except for a lower superficial velocity. But at higher
superficial velocities the model predicts higher values than experimental data. It may be explained by the effect of the liquid-side mass transfer coefficient (kL) which was not taken into account since there are no available correlations for not-wetting liquid. The main reason why the kL was not considered was in order to simplify the model. In addition to this, the published correlations of kL were mostly based on wetting conditions and are not compatible with the behaviour of liquid tin (non-wetting).
176
- -o - Simulation " Experimental
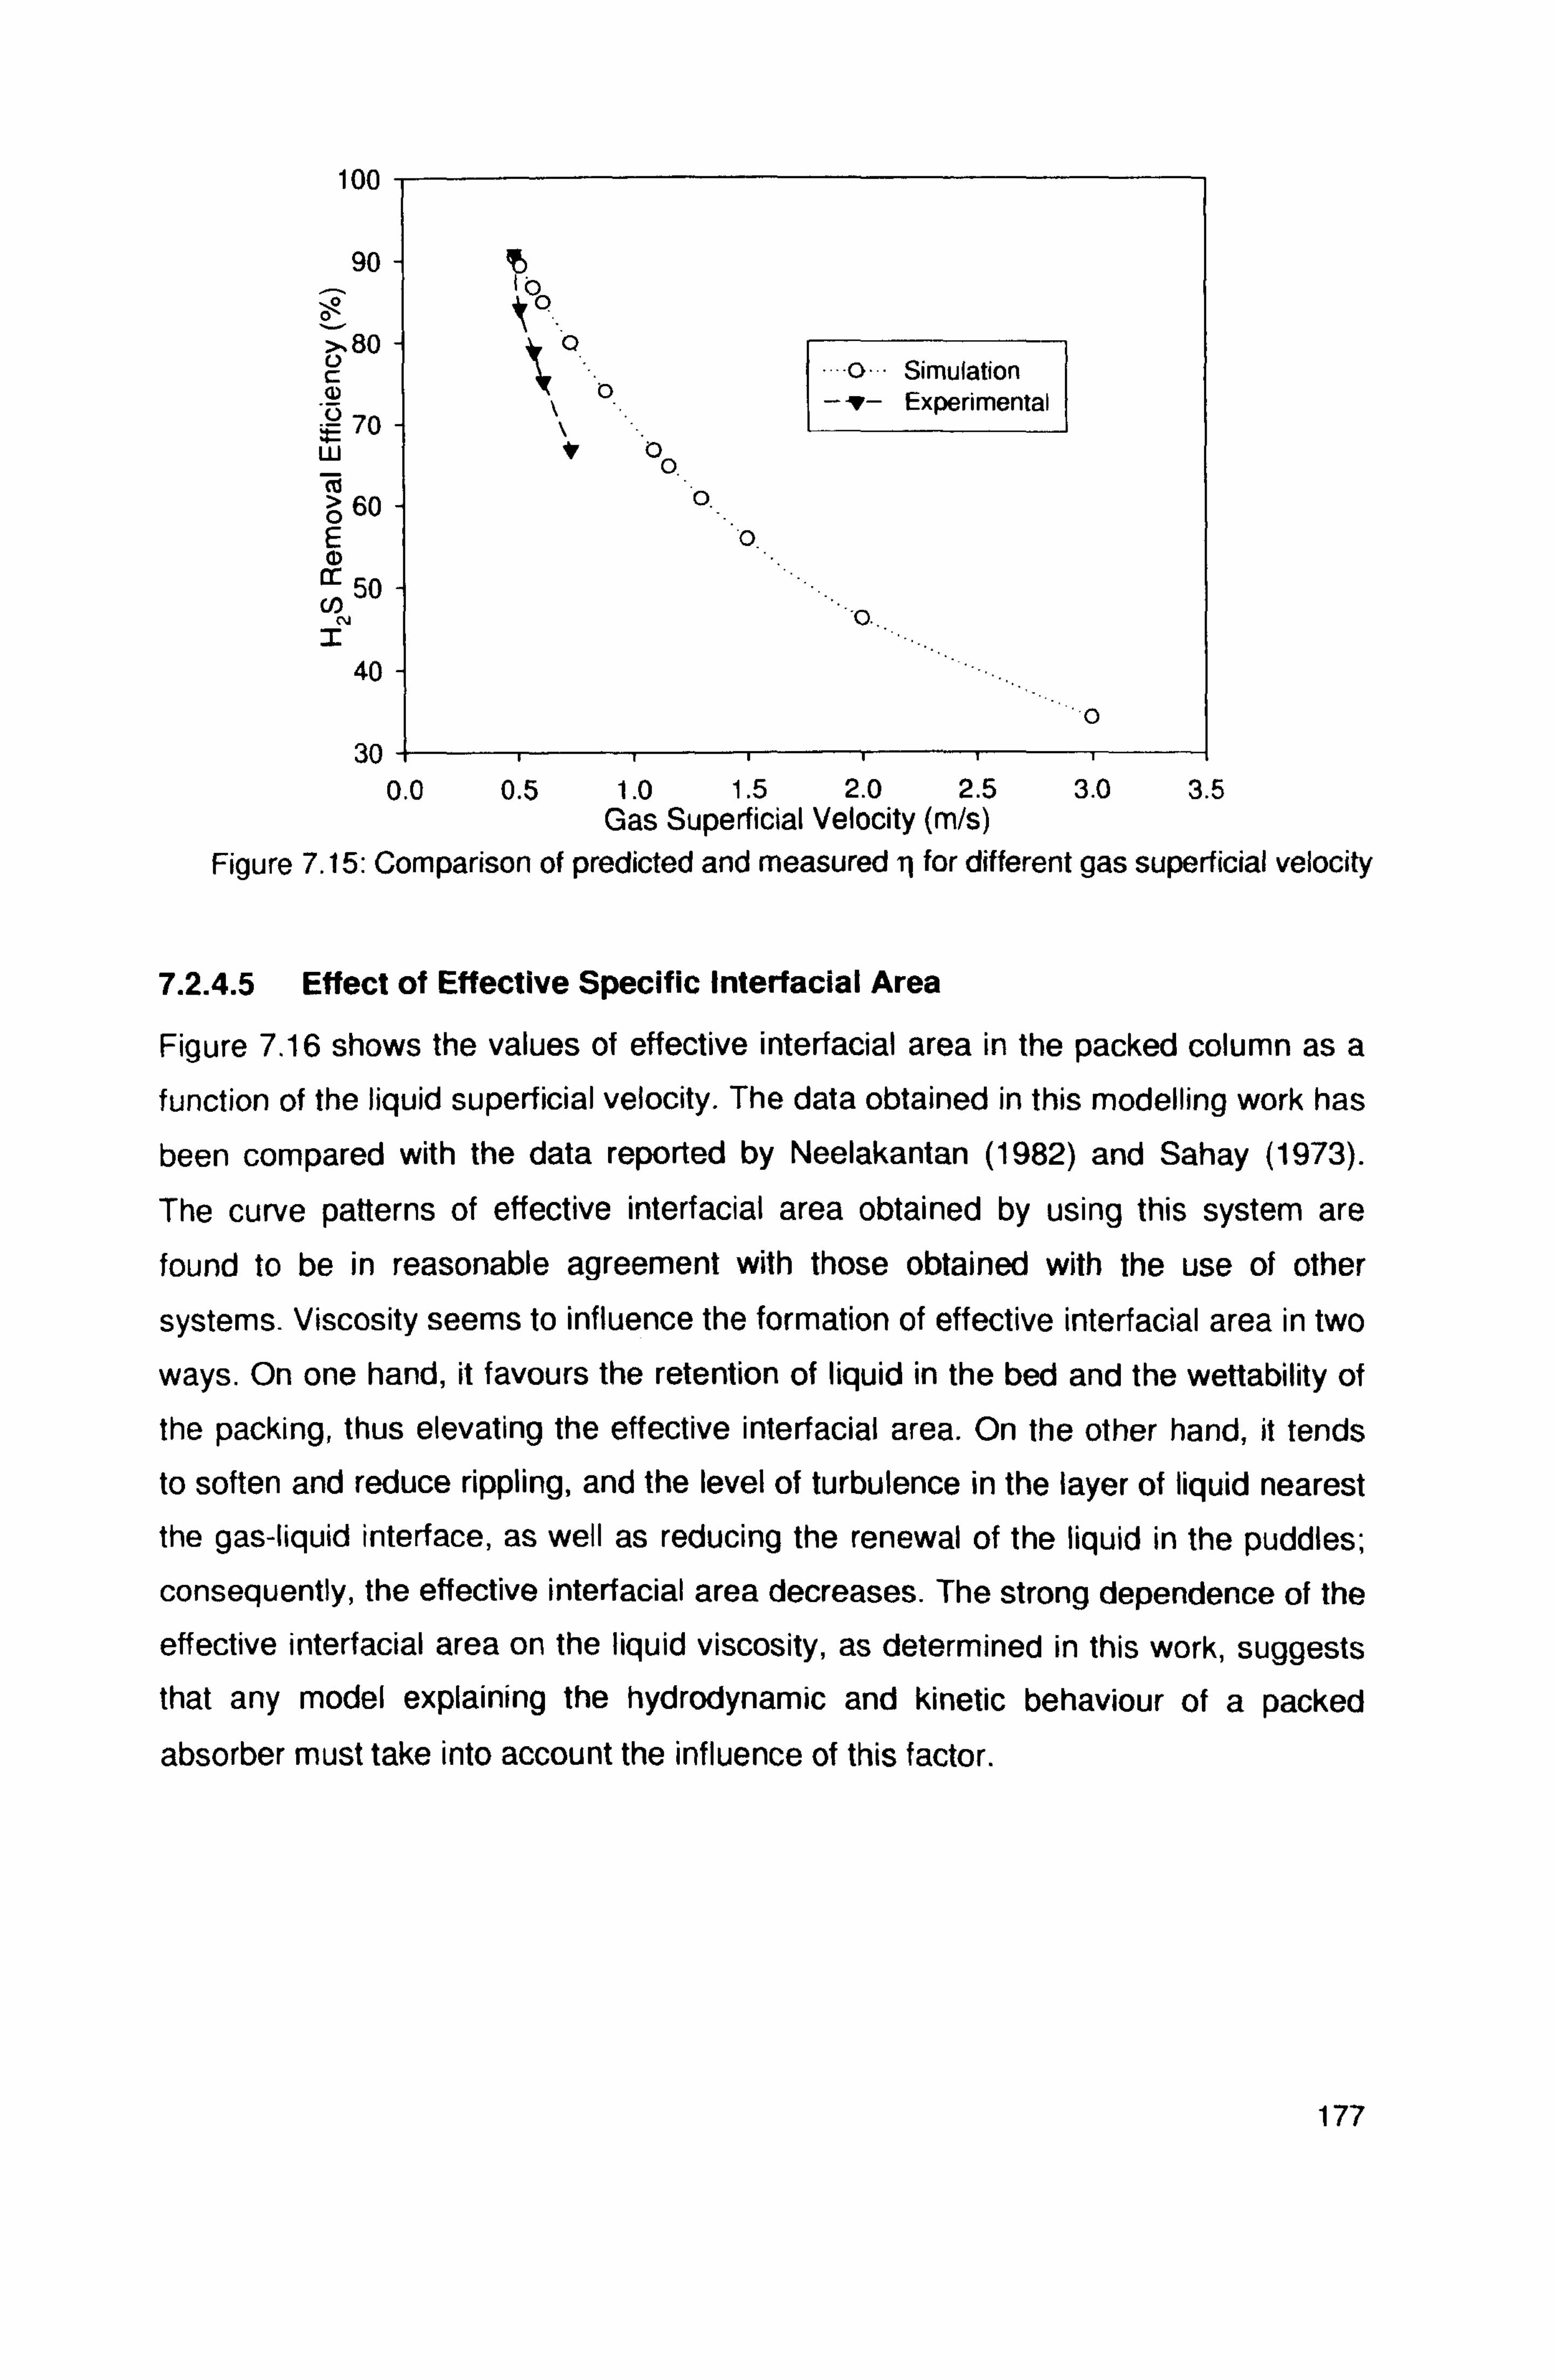
100
90 ö
>. 80 U C
%0 w cU 0> 60 E
50 CO N Z
40
30
iý ýo
o- Simulation °
-1- Experimental
0
0
o..
0
0.0 0.5 1.0 1.5 2.0 2.5 3.0 3.5 Gas Superficial Velocity (m/s)
Figure 7.15: Comparison of predicted and measured 11 for different gas superficial velocity
7.2.4.5 Effect of Effective Specific Interfacial Area
Figure 7.16 shows the values of effective interfacial area in the packed column as a
function of the liquid superficial velocity. The data obtained in this modelling work has
been compared with the data reported by Neelakantan (1982) and Sahay (1973).
The curve patterns of effective interfacial area obtained by using this system are
found to be in reasonable agreement with those obtained with the use of other
systems. Viscosity seems to influence the formation of effective interfacial area in two
ways. On one hand, it favours the retention of liquid in the bed and the wettability of
the packing, thus elevating the effective interfacial area. On the other hand, it tends
to soften and reduce rippling, and the level of turbulence in the layer of liquid nearest
the gas-liquid interface, as well as reducing the renewal of the liquid in the puddles;
consequently, the effective interfacial area decreases. The strong dependence of the
effective interfacial area on the liquid viscosity, as determined in this work, suggests that any model explaining the hydrodynamic and kinetic behaviour of a packed
absorber must take into account the influence of this factor.
177
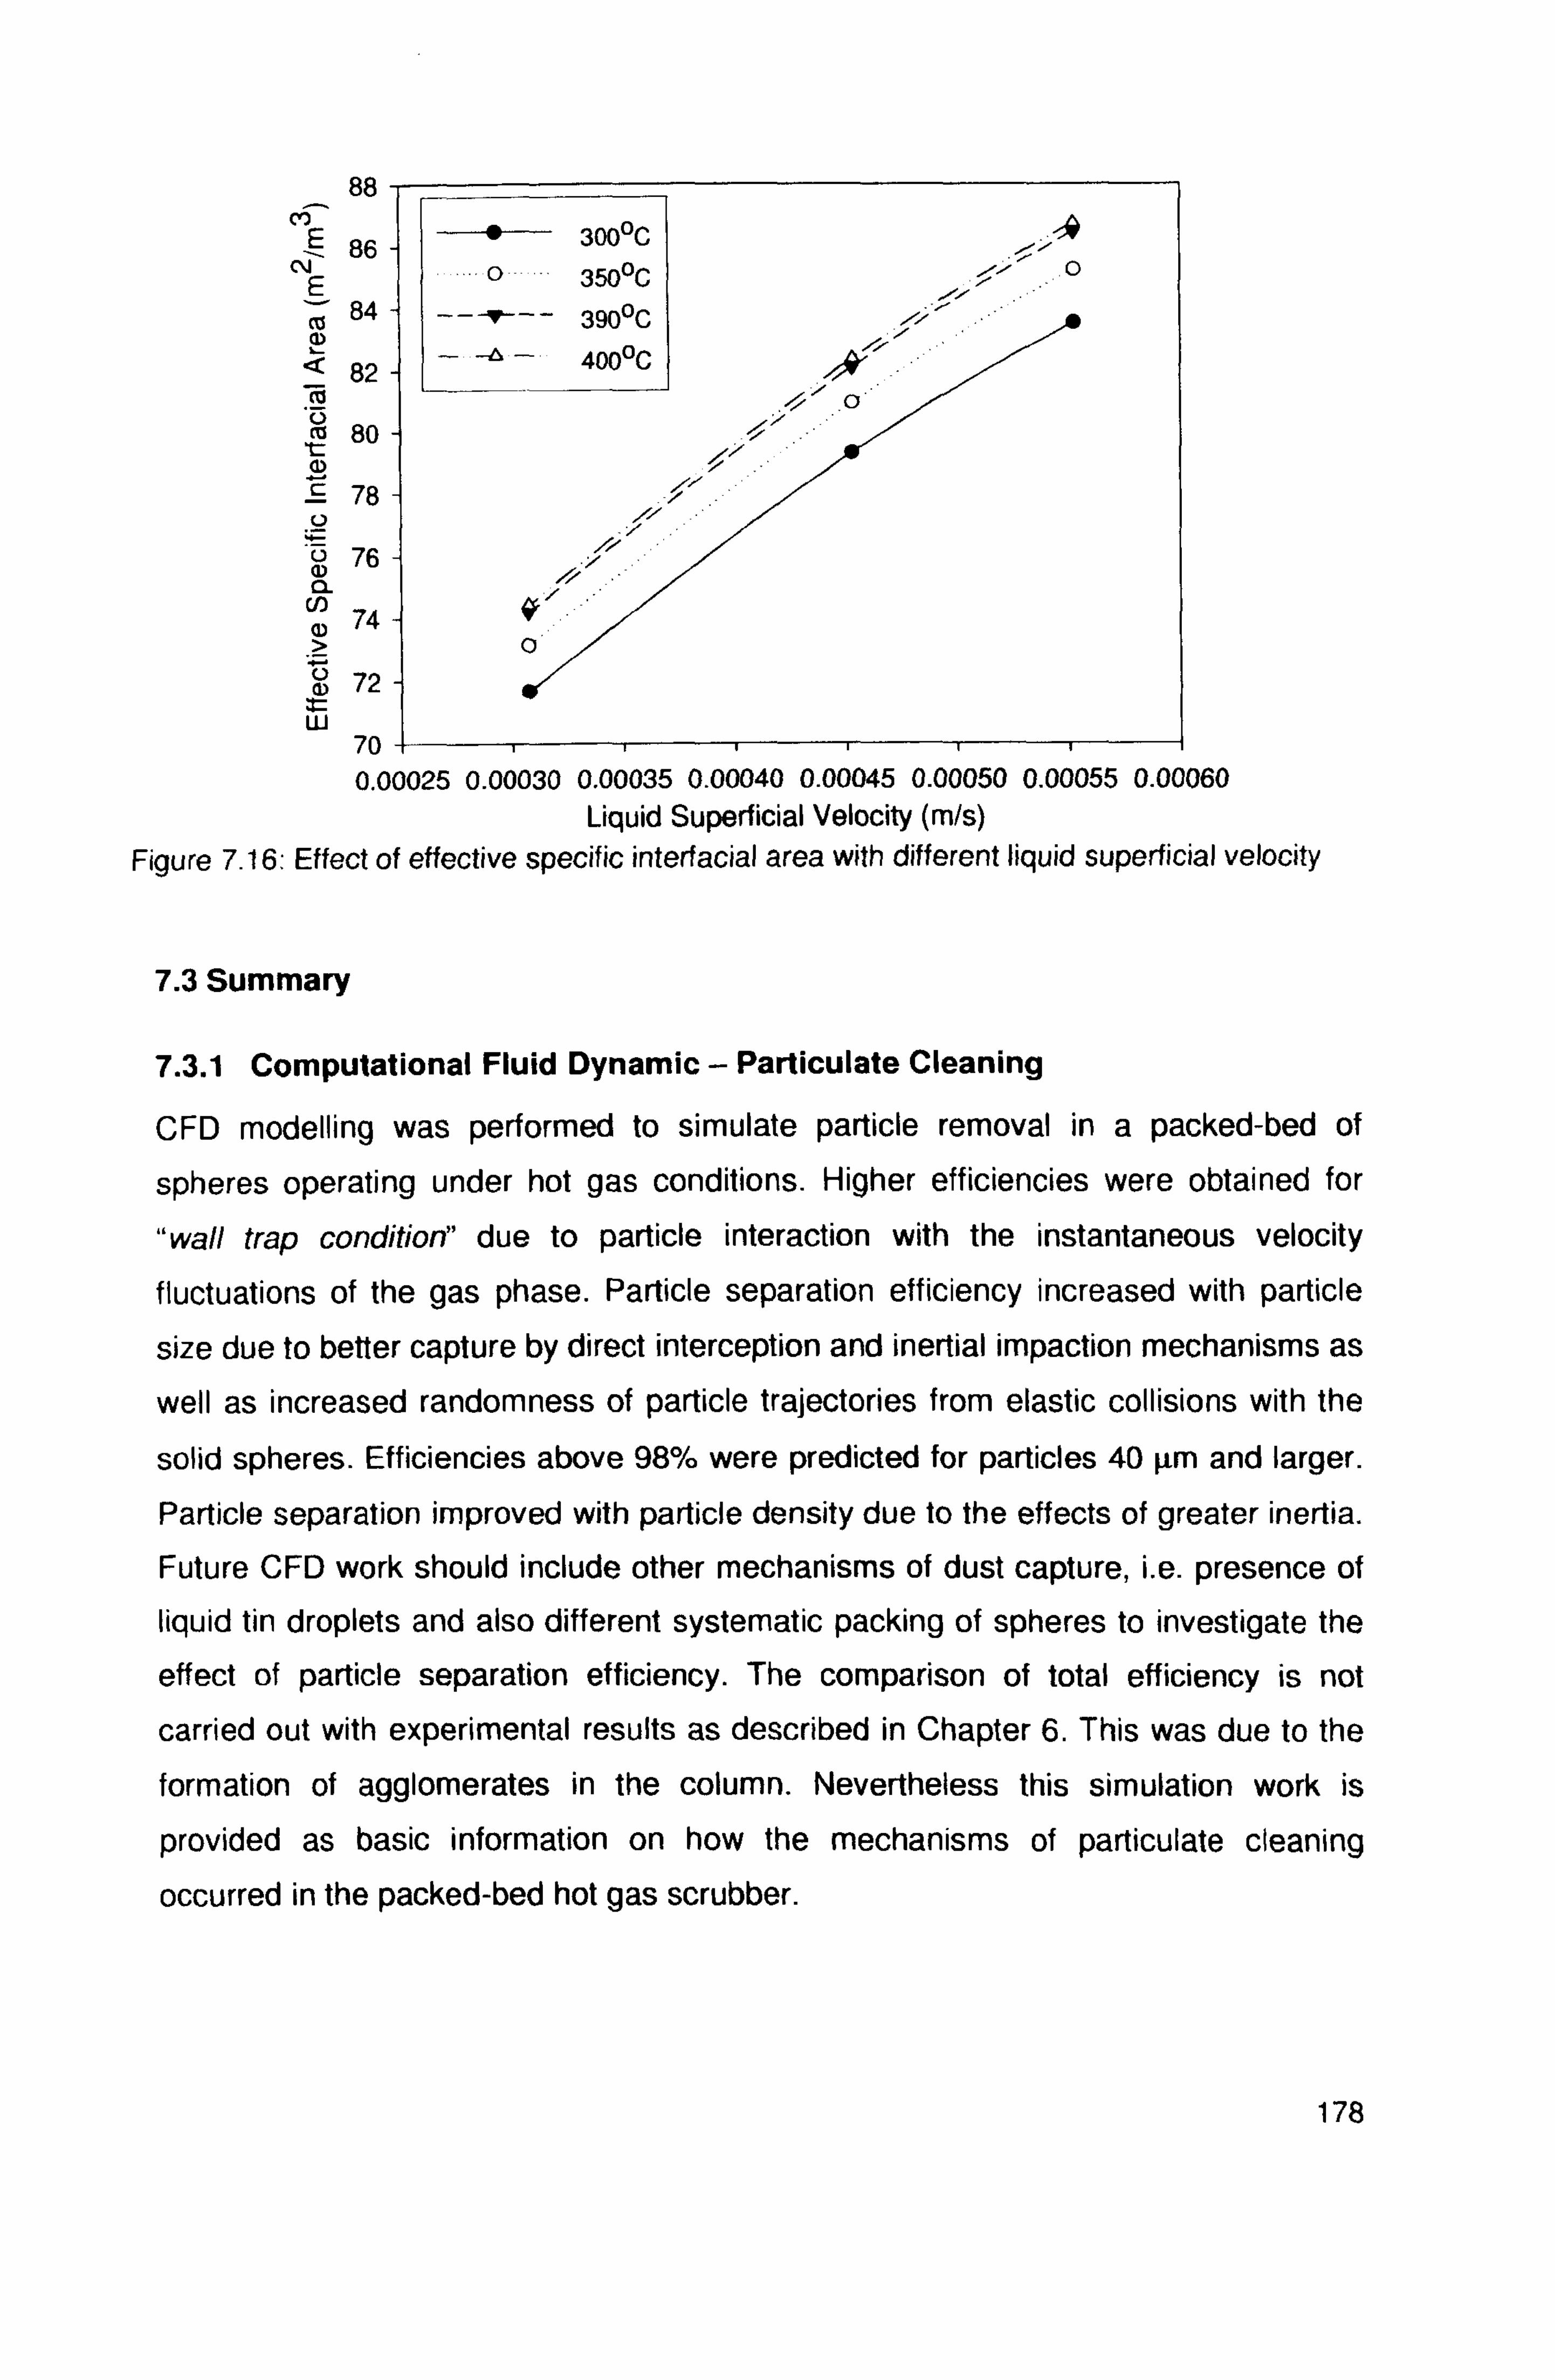
88
86 N
E Co 84 m Q 82 m ca 80 m 5 78 U
76 CL
74
72 w
70 0.00025 0.00030 0.00035 0.00040 0.00045 0.00050 0.00055 0.00060
Liquid Superficial Velocity (m/s) Figure 7.16: Effect of effective specific interfacial area with different liquid superficial velocity
7.3 Summary
7.3.1 Computational Fluid Dynamic - Particulate Cleaning
CFD modelling was performed to simulate particle removal in a packed-bed of
spheres operating under hot gas conditions. Higher efficiencies were obtained for
"wall trap condition" due to particle interaction with the instantaneous velocity fluctuations of the gas phase. Particle separation efficiency increased with particle
size due to better capture by direct interception and inertial impaction mechanisms as
well as increased randomness of particle trajectories from elastic collisions with the
solid spheres. Efficiencies above 98% were predicted for particles 40 µm and larger.
Particle separation improved with particle density due to the effects of greater inertia.
Future CFD work should include other mechanisms of dust capture, i. e. presence of
liquid tin droplets and also different systematic packing of spheres to investigate the
effect of particle separation efficiency. The comparison of total efficiency is not
carried out with experimental results as described in Chapter 6. This was due to the
formation of agglomerates in the column. Nevertheless this simulation work is
provided as basic information on how the mechanisms of particulate cleaning
occurred in the packed-bed hot gas scrubber.
--ý 300°C
o 350OC
--fi-- 390°C
//
178
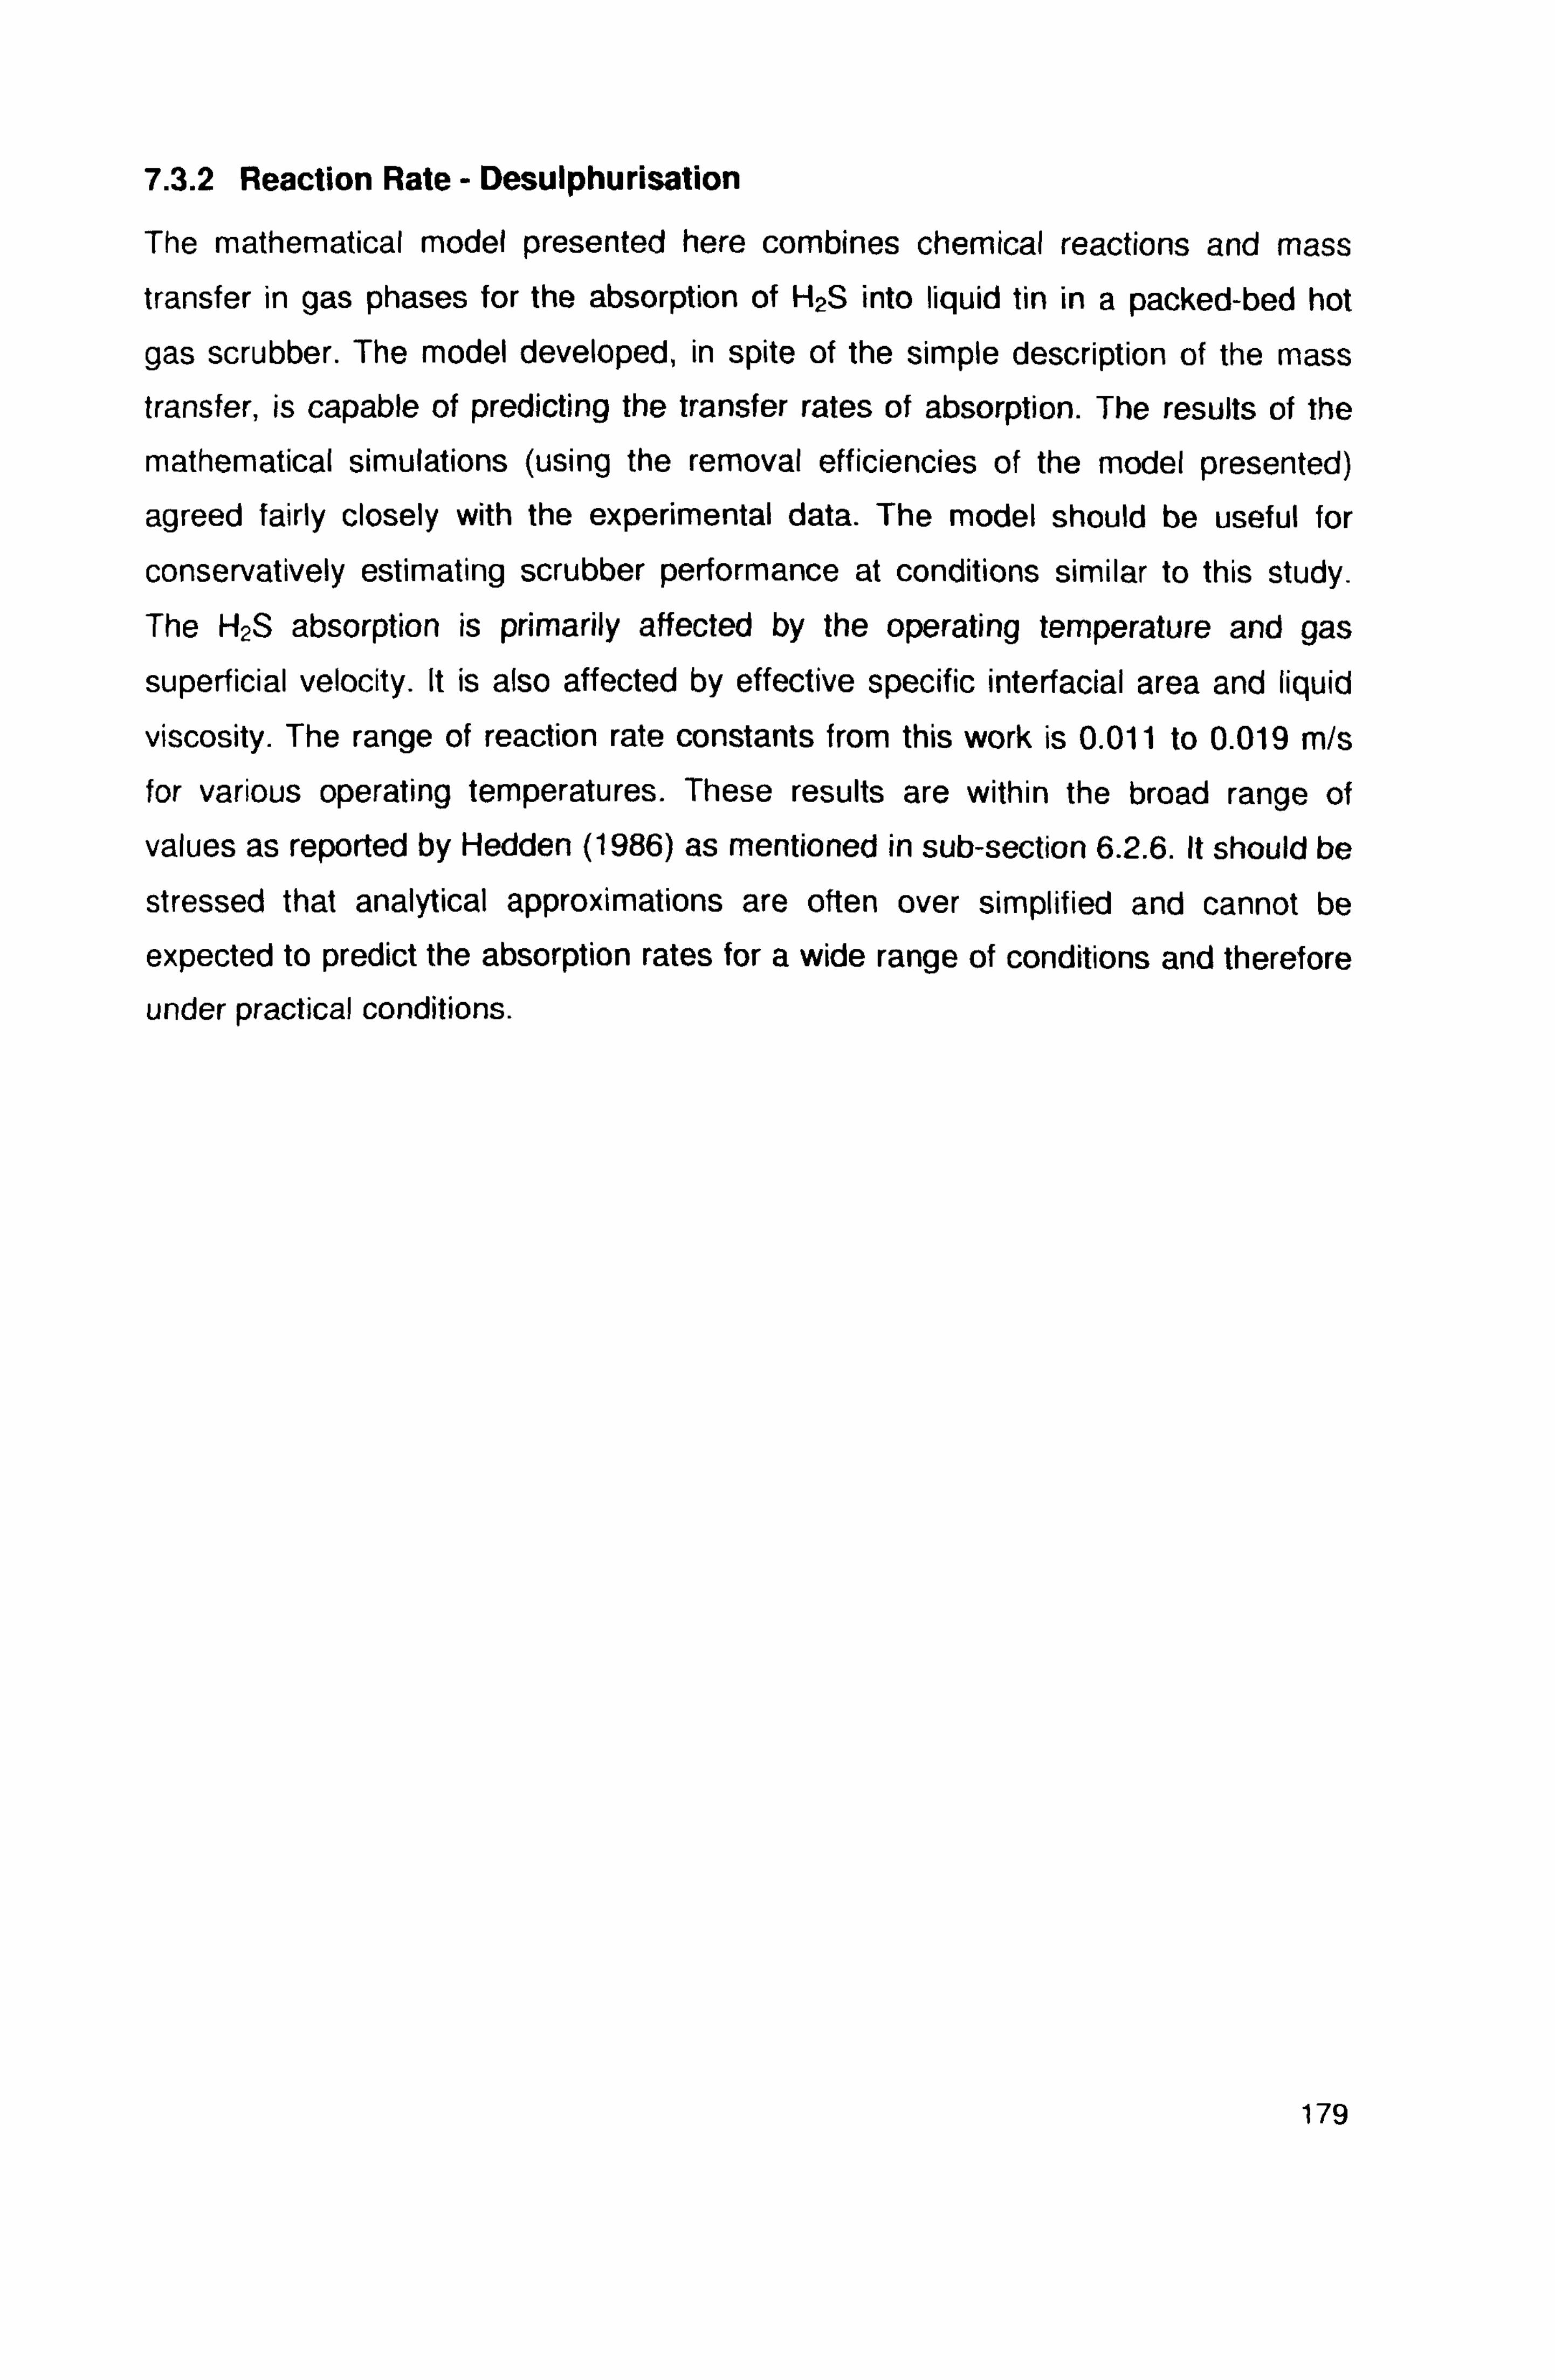
7.3.2 Reaction Rate - Desulphurisation
The mathematical model presented here combines chemical reactions and mass
transfer in gas phases for the absorption of H2S into liquid tin in a packed-bed hot
gas scrubber. The model developed, in spite of the simple description of the mass
transfer, is capable of predicting the transfer rates of absorption. The results of the
mathematical simulations (using the removal efficiencies of the model presented)
agreed fairly closely with the experimental data. The model should be useful for
conservatively estimating scrubber performance at conditions similar to this study.
The H2S absorption is primarily affected by the operating temperature and gas
superficial velocity. It is also affected by effective specific interfacial area and liquid
viscosity. The range of reaction rate constants from this work is 0.011 to 0.019 m/s for various operating temperatures. These results are within the broad range of
values as reported by Hedden (1986) as mentioned in sub-section 6.2.6. It should be
stressed that analytical approximations are often over simplified and cannot be
expected to predict the absorption rates for a wide range of conditions and therefore
under practical conditions.
179

CHAPTER EIGHT
Overall Discussion on the Packed Bed Hot Gas Scrubber
Coal is currently a major source of fuel for power generation, industrial heat, and, on
a smaller scale, manufacturing of coke and by-products such as coal tar. In the mid-
to-long term, the anticipated increase in the cost of natural gas and petroleum
relative to coal is expected to increase the incentive for expanded efforts to convert
coal to ash-free, low-sulphur transportation fuels and, ultimately, gaseous fuels for
domestic use. The current hot gas clean-up method centres on the use of metal
oxide sorbents for sulphur removal and the utilisation of a ceramic barrier filter for
particulate cleaning. This thesis presents a new approach to hot fuel gas cleaning
technology incorporating molten tin as the scrubbing medium for the simultaneous
removal of H2S and solid particulates.
In the US and several countries across Europe, there has been a rapid introduction
of hot gas cleaning systems. However, there is still of lot of research which can be
done in the areas of chemical and technical developments to further improve these
systems. In this study, the performance of packed bed hot gas scrubbers for
particulate and desulphurisation were tested in an experimental packed-bed
scrubber. Experimental investigation on this laboratory-scale plant provided detailed
information on the performance of liquid tin as a scrubbing medium for both
particulate and gas cleaning. Complementary to this, research on cleaning SnS
using zinc powder for tin regeneration was also carried out. The small-scale furnace
tests provided fundamental information on reaction between SnS and zinc powder. The scrubber was predicted earlier to be potentially better for solid removal
efficiency. However, since there was a high temperature difference between the inlet
particles and the scrubber, this increases the agglomeration of the particles coated by the liquid tin, and thus decreases the efficiency of the process. Therefore, future
work on this topic is required. Nevertheless, results from the desulphurisation
process were promising since high efficiencies can be achieved at larger scales (Changkook Ryu et at., 2007). Once the problem associated with the agglomeration has been solved, the assessment of both particulate cleaning and the
desulphurisation process running simultaneously can be tested. Results from the
small scale cleaning process have provided confirmation and evidence of the
possibility to clean SnS using zinc under a gasification environment. 180
Therefore, if all three types of processes (particulate cleaning, desulphurisation and
tin regeneration) were to be combined together, it would eliminate the production of
wet slurry, doing away with costly wastewater treatment facilities and the
corresponding additional hardware. Furthermore in HGCU, water consumption to run
the system is significantly reduced, cutting down on operating costs.
Mathematical models were applied to both the particulate cleaning and
desulphurisation process and this provided a deeper understanding of the cleaning
process in the scrubber.
The high temperature product gas formed from the gasification process if combined
with hot gas clean-up (HGCU) reduces the thermal efficiency losses associated with
gas quenching and results in higher efficiency energy recovery for systems such as
the integrated gasification combined cycle (IGCC). The gasification process offers
the opportunity for integration with combined cycle turbines or reciprocating engines,
converting fuel energy to electricity more efficiently (+40%). The lower volume of
product gas from the gasification system also requires smaller and less expensive
gas cleaning equipment compared to flue gas clean-up technology.
As mentioned in Chapter 2, the gasifier has the flexibility to handle a variety of
feedstocks. In addition to coal, possible feedstocks include petroleum coke, refinery
liquids, biomass, municipal solid waste, and sludge. These alternative feedstocks are
typically low cost, sometimes even of negative expense. When a low-cost feed is
used, the economics of gasification are enhanced and marketable products are
created from a waste stream, avoiding disposal costs and environmental concerns. In
this case, gasification fuel gas constituents other than sulphur removal are also worth investigating. The main gas components of interest are NH3, HCI CO, H2, CO2 and H2O (where steam gasification is employed).
Liquid tin is fairly reactive, and therefore other gas components in fuel gases may
react with tin. Hedges (1960) reported that tin does not react directly with H2, N2, or NH3. However, it reacts with H2O, C02, and HCI. In particular, tin can be oxidised by
steam to form solid oxides, which causes the loss of tin (Hedges, 1960); (Niesel and Sigurdardottir, 1993).
Sn(I) + 2H20(g) H Sn02(s) + 2H2(g) (8.1)
181
This reaction depends on the H20/H2 ratio and temperature. Temperatures above
500°C are required to prevent Sn02 dross formation for very wet fuel gases (Niesel
and Sigurdardottir, 1993). HCI can react with the liquid tin to form chlorides, which
are volatile (low melting and boiling points), and therefore will condense to aerosols
when cooled in heat exchangers. However, coal typically has a low Cl content, and
therefore high H2/HCI ratios will suppress the reaction of tin with HCI. Tin reacts with
CO2 at high temperatures to form tin oxide (Hedges, 1960).
Sn(l) + 2CO2(g) H Sn02(s) + 2CO(g) (8.2)
Niesel and Sigurdardottir (1993) reported that the forward reaction is favoured at
temperatures of 350-500 °C with equal proportions of CO2 and CO. However, fuel
gases typically have higher CO concentration than CO2, which would suppress the
formation of Sn02. From experimental investigation in a double-stirred reactor,
Hedden et al. (1986) reported that gas components such as CO and CO2 did not
influence the degree of H2S conversion to SnS, although the tested gas
concentrations were not specified. The same study also reported that the reaction
rate for COS at 500°C was about 3 times smaller than that for H2S.
The research carried out in this PhD also showed that employment of a gas lift
system in the packed-bed hot gas scrubber using liquid tin could pose significant
problems in the plant operation. As discovered from the desulphurisation
experimental work, the gas lift may pose a problem during maintenance. It can be
replaced by a centrifugal pump as reported by Warner (1959), which provides better
control of the liquid tin flow rate. Magnets-hydrodynamic pumping is also a relevant technique.
This research work examines the performance of the packed bed hot gas scrubber for both particulate cleaning and desulphurisation processes. Although the test
results especially from the desulphurisation and SnS cleaning work showed that the
potential of this new system is very promising, further fundamental investigations are
required on various aspects in order to obtain more information about fundamental
mechanisms of the absorption process in the non-wetting packed bed scrubber. Development of reaction modelling for the scrubber is also crucial in any scale-up of
the reactor. To sum up, hot gas cleaning will continue to play a major role in the
development of coal-based combined cycle power generation systems in the
foreseeable future.
182
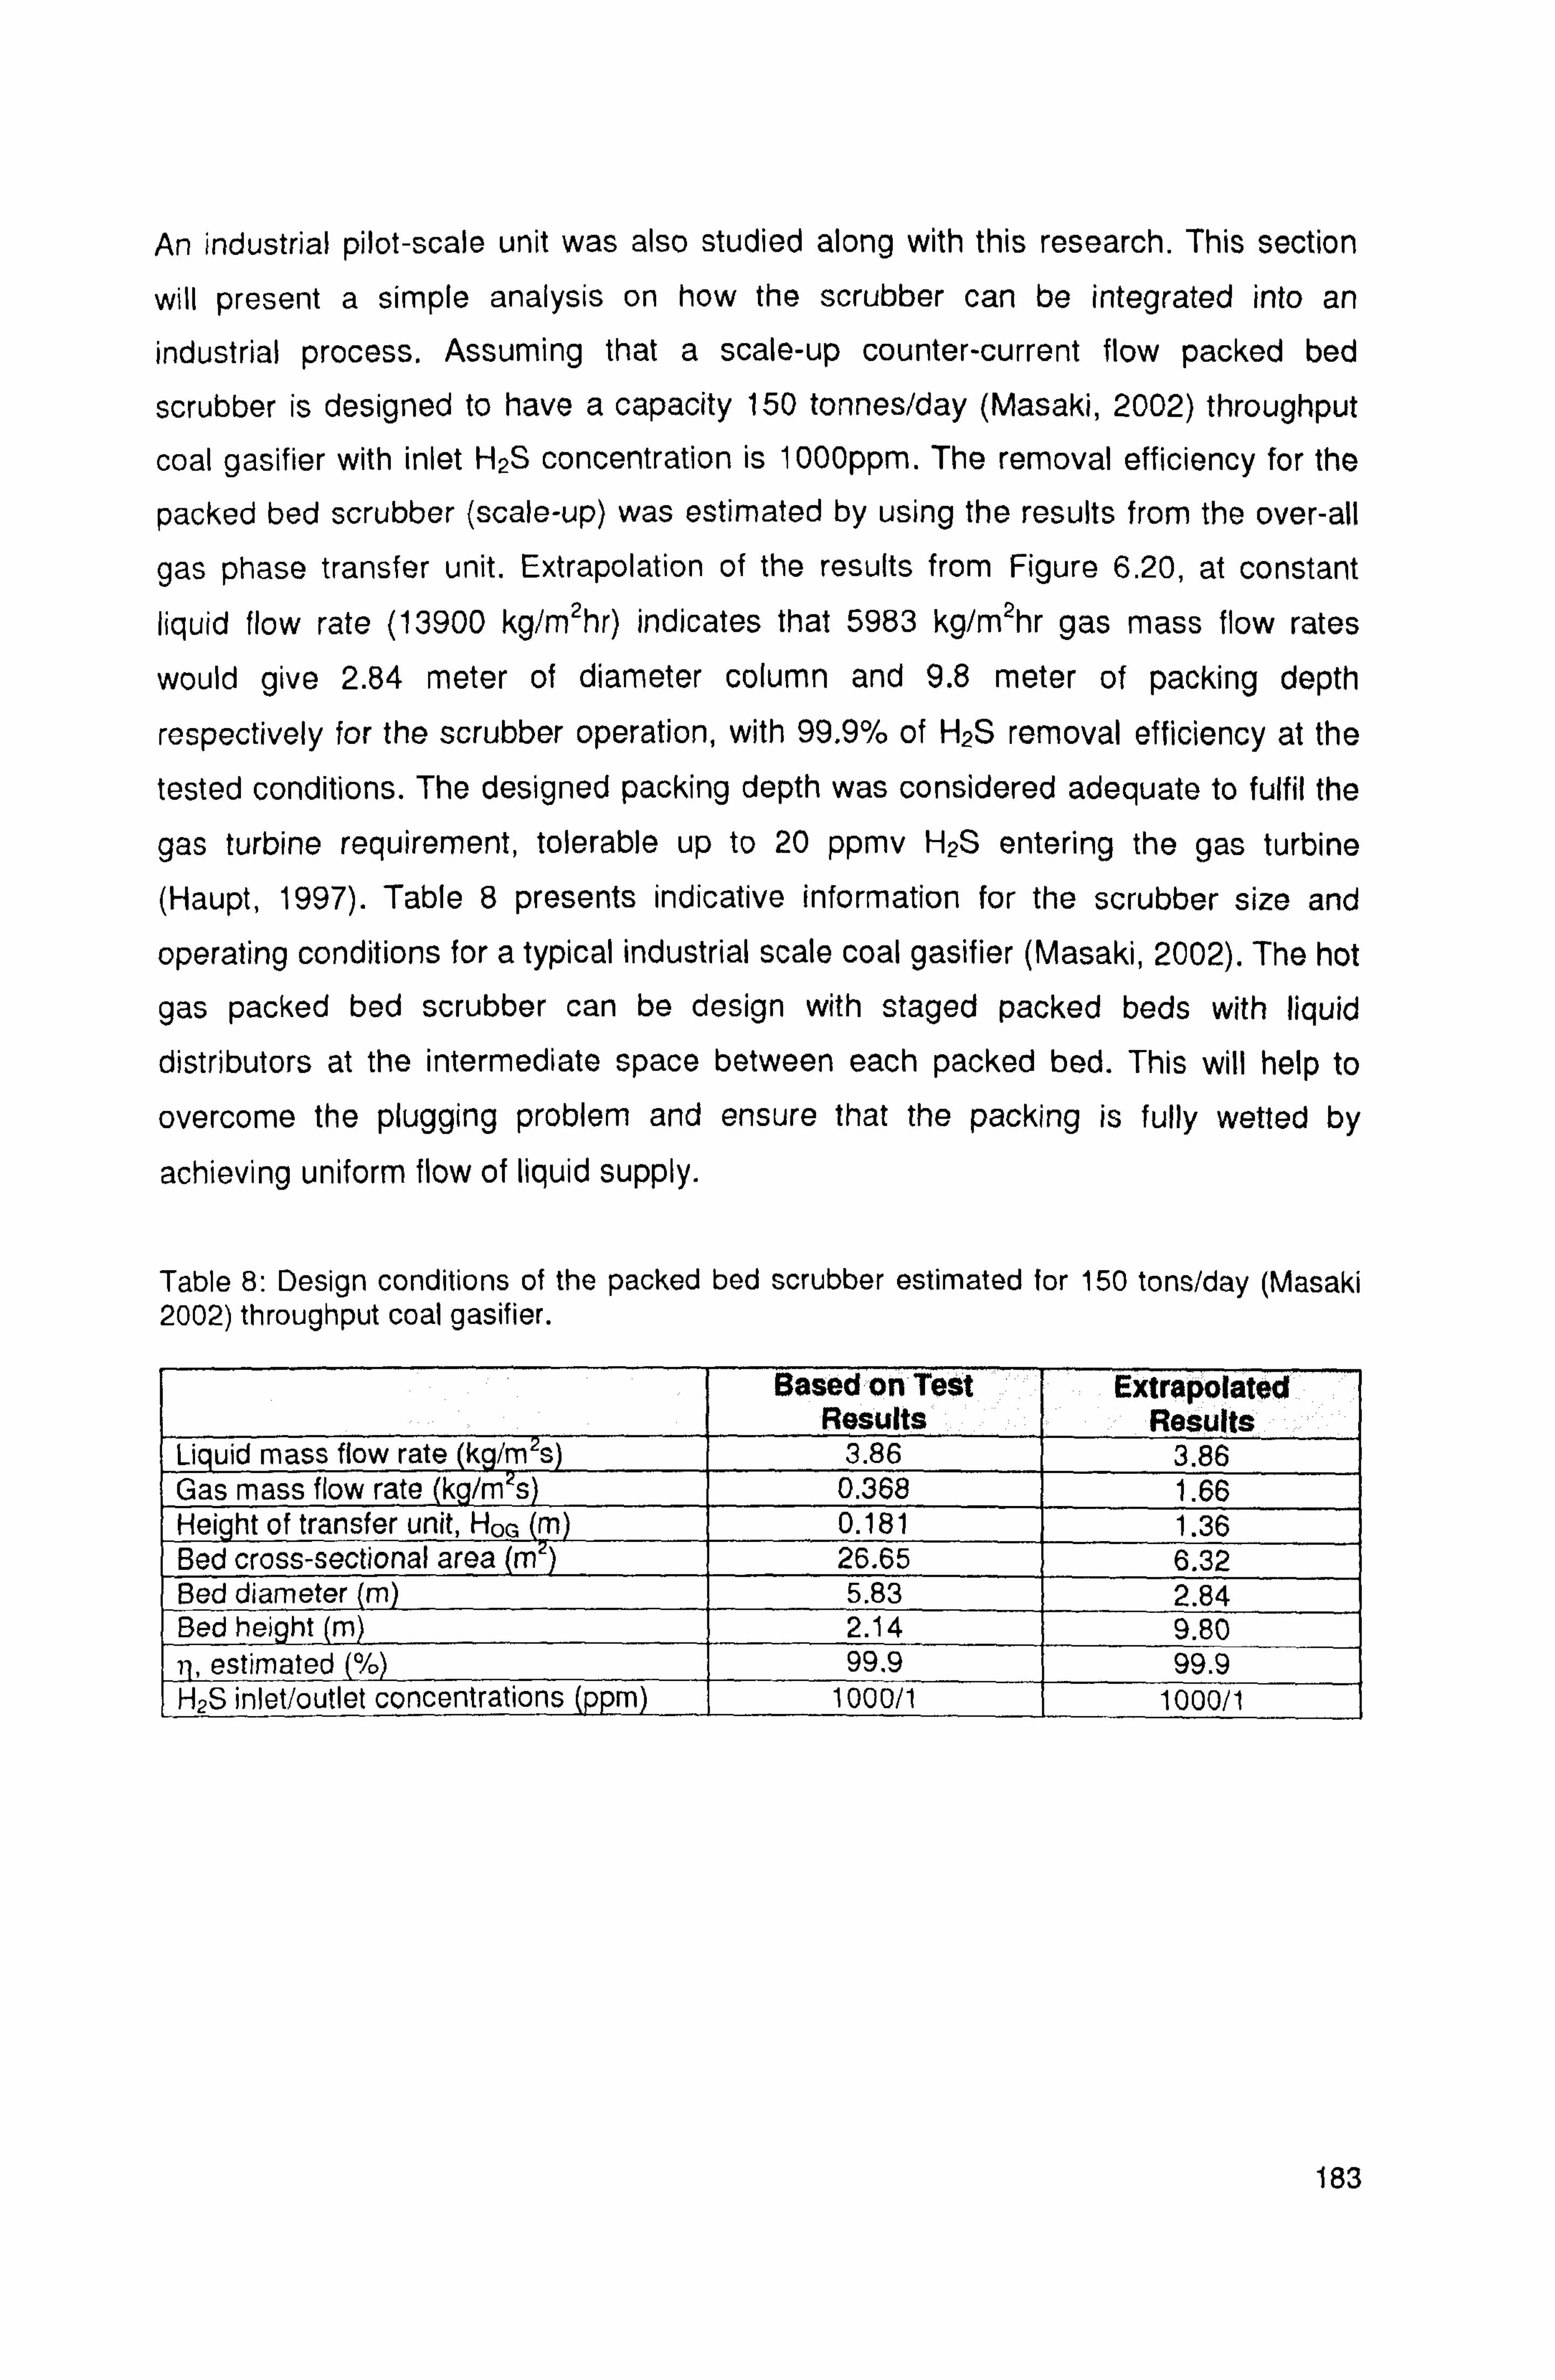
An industrial pilot-scale unit was also studied along with this research. This section
will present a simple analysis on how the scrubber can be integrated into an
industrial process. Assuming that a scale-up counter-current flow packed bed
scrubber is designed to have a capacity 150 tonnes/day (Masaki, 2002) throughput
coal gasifier with inlet H2S concentration is 1 000ppm. The removal efficiency for the
packed bed scrubber (scale-up) was estimated by using the results from the over-all
gas phase transfer unit. Extrapolation of the results from Figure 6.20, at constant
liquid flow rate (13900 kg/mehr) indicates that 5983 kg/mehr gas mass flow rates
would give 2.84 meter of diameter column and 9.8 meter of packing depth
respectively for the scrubber operation, with 99.9% of H2S removal efficiency at the
tested conditions. The designed packing depth was considered adequate to fulfil the
gas turbine requirement, tolerable up to 20 ppmv H2S entering the gas turbine
(Haupt, 1997). Table 8 presents indicative information for the scrubber size and
operating conditions for a typical industrial scale coal gasifier (Masaki, 2002). The hot
gas packed bed scrubber can be design with staged packed beds with liquid
distributors at the intermediate space between each packed bed. This will help to
overcome the plugging problem and ensure that the packing is fully wetted by
achieving uniform flow of liquid supply.
Table 8: Design conditions of the packed bed scrubber estimated for 150 tons/day (Masaki 2002) throughput coal gasifier.
Based on Test Results
Extrapolated Results
Liquid mass flow rate k /m s 3.86 3.86 Gas mass flow rate (kg/m's) 0.368 1.66 Height of transfer unit, Hoy m 0.181 1.36 Bed cross-sectional area (m2) 26.65 6.32 Bed diameter m 5.83 2.84 Bed height (m) 2.14 9.80 TI, estimated / 99.9 99.9 H2S inlet/outlet concentrations (ppm) 1000/1 1000/1
183
CHAPTER NINE
Conclusions and Recommendations for Future Work
This chapter highlights the conclusions and study limitations during this research
work. Areas where further developments are necessary are identified and
suggestions are put forward for possible future work.
9.1 Conclusion
All the design modifications and testing for the pilot plant unit of the liquid metal
based scrubber were successfully completed. In this research work, the existing
equipment has been modified in order to investigate the process of particulate
cleaning. Various parts of the equipment have been modified such as packing
support plate, gas heaters, air seal and gas lift. For particulate removal tests, an
additional system was added to the original design i. e. particle feeder. It consisted
of a screw feeder and a venturi system. An online filter was also added to the
system to determine the total efficiency of particle removal. This modification work
was considered to be a major contribution of this research work.
This experimental work was carried out using nitrogen gas for tin circulation at
high temperatures (350 - 400°C) and the glass particles inlet was kept at an
ambient temperature of 15°C. The large temperature difference meant that the
liquid (flowing downwards) solidified upon collision with the cool glass particles.
This resulted in solid tin build-up on the surface of the glass particles, thus
reducing the ET. Also, on the exhaust side of the scrubber, liquid tin splashes
were observed which were then identified in the filter paper.
At the lower bed temperature (350°C), the agglomerates formed at early stages
were very fragile and contained a grey Si-Sn mixture. The liquid tin solidified
slowly, making it more adhesive and easily attached onto the surface of glass
particles upon collision. At 400°C, the formed agglomerates were stronger and
had a black colour. This is associated with liquid tin, which solidified even more
rapidly during the filtration process. The liquid tin-irrigated packed bed scrubber
demonstrated particulate removal performance with ET ranging from 60 to 98%.
The Er decreased as the inlet dust loading increased.
184
The results also showed that the temperature had a significant influence on the
ET. As the temperature increased from 350 °C and 400 °C, the ET decreased. The
major reason for this is the large temperature difference between the inlet
particles and the scrubber, which result in the formation of a thicker bed of
agglomerates.
The resulting grade efficiency curves were not able to demonstrate realistic
results. This is because at corresponding liquid flow rates and inlet solid loading,
the particles collected in the impinger were not representative of the total removal
efficiency. From the particulate cleaning test, the results were unsatisfactory and
the equipment operation had low efficiency for particulate cleaning. Nevertheless,
the proposed objectives have been met and it is evident that with several important modifications, the equipment would be able to operate satisfactorily.
4 The absorption behaviour of H2S in a novel liquid tin irrigated hot gas scrubber
was investigated for various operating parameters in a lab-scale packed bed. HOG
values ranged from 0.84 to 0.181 m for tested conditions at 1000 ppm of H2S
concentration, which meant that this system has very good potential for efficient
desulphurisation. High liquid velocities increased the removal efficiency due to
larger liquid holdup, creating a larger interfacial area. Increased gas velocities
influenced the removal efficiency by altering the gas residence times, liquid
holdup, and gas-phase mass transfer. The HOG of an empty column was about 5
times higher at the tested conditions due to lack of contact between the two
phases. The HOG gradually reduced for increased H2S concentrations or at lower
operating temperatures.
The cleaning of SnS was performed with and without the presence of zinc
powder. Addition of zinc powder saw around 20% reduction of sulphur in the
sample compared to without zinc. Observation from SnS cleaning without the
addition of zinc powder gave a positive result. However, the sulphur reduction of
13 % could not justify heating the sample to 400 °C for 6 hours.
CFD modelling work was performed to simulate particle removal in a packed bed
of spheres operating under hot gas conditions. The case study using a "wall trap
condition" provided higher efficiency due to the particle interaction with the instantaneous velocity fluctuations of the gas phase.
185
Study showed that particle separation efficiency increased with particle size due
to the mass and hence its inertia. It is also caused by larger particles colliding with the packing spheres. The elastic collisions increase the randomness of the
particle trajectories hence improving the chances of particle entrapment by the
walls and packing. Efficiencies above 98% were predicted for particles of 40 µm
and larger. Particle separation improved with particle density due to the effect of
greater interaction.
* The mathematical model presented here combines chemical reactions and mass transfer in gas phases for the absorption of H2S into liquid tin in a packed-bed hot
gas scrubber. The range of reaction rate constants from this work is 0.011 to
0.019 m/s for various operating temperatures, which are within the broad range of
values as reported by Hedden (1986). The H2S absorption is primarily affected by
the operating temperature and gas superficial velocity. It is also affected by
effective specific interfacial area and liquid viscosity.
9.2 Study Limitations
The following study limitations were identified in the investigation:
The heat-up of the system was relatively slow, after 6 hours the bed temperature
was only around 400 °C and this was not high enough for the most crucial part of
gasification process. Therefore, an extra heater needs to be installed in order to
provide sufficient heat and also to shorten the heat-up time.
It was also not possible to clean the scrubber after every test run due to time
constraints, especially for particulate cleaning experimental work. This is mainly because once the rig has been dismantled; it will take minimum of two days to re-
assemble the rig. Since the experimental work dealt with liquid tin at a high
temperature, another one-day of testing is needed in order to make sure there are
no leakages at all joints.
Even the main column was not clean after every test run, valves V4, V9 and V10
needed to be checked every time before new test runs. Solid tin had to be
cleaned and removed from the valves to prevent blockage. Any blockage in one
of the valves would tend to interrupt the test, especially when the tin starts to circulate inside the column.
186
The tip of the nitrogen injector had to be checked regularly. During the
experimental work, sometimes tin was not circulating due to a blockage of solid tin
at the tip of the nitrogen injector. Since it was a closed system and it was not
possible to visualise the actual situation inside the system, the only way to ensure
smooth operation was to check all the possible sections that tended to give
problems.
9.3 Recommendations for Future Work
* The temperatures of the particles need to be nearly the same as the temperature
of the packed bed scrubber (ý 400 °C). An extra heater should be installed for the
dust feeder and particles inlet line system for particulate cleaning experimental
work. This would avoid any solidification of liquid tin upon colliding with cold
particles. In this way, the total efficiency of particulate cleaning is expected to increase dramatically. This modification would also avoid any formation of
agglomerated material inside the column.
Extra semi-cylindrical ceramic radiant heaters are also needed to heat the main
scrubber. This is necessary to provide sufficient heat to the scrubber and also to
shorten the heat-up time.
The capability of the scrubber for particle/tar removal should also be studied in
order to fully exploit the potential of this technology.
The test results presented here showed the excellent potential of this new desulphurisation system. However, further fundamental investigations are
required on various aspects including wider ranges of test parameters such as
gas and liquid flow rates, temperature, pressure, and test duration.
* This study touched on the mechanisms of SnS cleaning using Zinc powder. However, further work would be needed to create a better understanding of the fundamental mechanisms, which is essential for high H2S removal efficiencies at high H2/H2S ratios. It is also anticipated that electromagnetic or mechanical
pumps would be used to circulate the tin in an industrial environment.
187
Further fundamental studies on the reaction chemistry between various gas
species (H2S, H2O, HCI etc. ), tin and its compounds (SnS, SnS2 and Sn2S3) for
various temperatures would identify the theoretical limits of this system.
An economic analysis of the various aspects that involve the use of molten tin
such as material recovery would provide valuable information to access the
profitability of the hot flue gas cleaning.
Further improvements to CFD work should include different expressions used for
the kinetics of reactions in the case of the particle-liquid tin interaction.
Improvement to CFD should be carried out in parallel with experimental work so
that any development or improvement to the model can be simultaneously
validated.
Other aspects of the modelling work such as liquid film and effective specific
interfacial area (ae) correlations for non-wetting system for the desulphurisation
process was outside the scope of the present study. However, full understanding
of these topics is important in order to scale-up the system to industrial
applications.
188
References Abbasian, J. & Slimane, R. B. (1998). "A regenerable copper-based sorbent for H2S removal from coal gases". Ind. Eng. Chem. Res., 37 (7), 2775-2782.
Anderson, I. E., Gleeson, B. & Terpstra, R. L. (2003). Development of metallic hot gas filters. Oak Ridge National Laboratory. Available from: htt : //wp ww. ornl.. qov/sci/fossil/Publications/RECENT%20PUBS/AMES-3. pdf [Accessed: 151m December 2004].
Androutsopoulos, G. P. & Hatzilyberis, K. S. (2001). "Electricity generation and atmospheric pollution: The role of solid fuels gasification". Global Nest: The Int. Journal, 3 (3), 171-178.
ASM (1981). Metal Handbook, Volume 4: Heat Treating. 9th Edition. Ohio, American Society for Metals. Cited in: Chang, B. F. (2003)
ASM (1984). Metal Handbook, Volume 7: Power Metallurgy. 9th Edition. Ohio, American Society for Metals. Cited in: Chang, B. F. (2003)
Ayala, R. E. & Venkataramani, V. S. (1998). Advanced sorbent development program: Development of sorbents for moving-bed and fluidized-bed applications (Volume /- Development of sorbents for moving-bed applications). GE Corporate Research and Development & U. S. Department of Energy, Morgantown, West Virginia. Report No. DE- AC21-94MC31089 -02.
Bandosz, T. J. (1999). "Effect of pore structure and surface chemistry of virgin activated carbons on removal of hydrogen sulfide". Carbon, 37 (3), 483-491.
Bonk, D. L., Freier, M. D., Buchanan, T. L., DeLallo, M. R., Goldstein, H. N. & White, J. S. (1996). "Asssessment of PFBC and gasification repowering". Advanced Coal-Fired Power Systems '96 Review Meeting (July 16-18,1996). Morgantown, West Virginia.
Cal, M. P., Strickler, B. W. & Lizzio, A. A. (2000). "High temperature hydrogen sulfide adsorption on activated carbon I. Effects of gas composition and metal addition". Carbon, 38 (13), 1757-1765.
Chang, B. F. (2003). A non-wetting packed bed gas scrubber. PhD. Thesis, Department of Chemical and Process Engineering, University of Sheffield, U. K.
Chang, B. F., Sharifi, V. N., Swithenbank, J. & Warner, N. (2002). "Development of a liquid metal based fuel gas scrubbing system". Proceedings of the 5r" International Symposium on Gas Cleaning at High Temperature held at Morgantown, West Virginia. U. S. DOE, Morgantown Energy Technology Center.
Changkook Ryu, Ismail, M. H. S., Sharifi, V. N. & Swithenbank, J. (2007). "Liquid tin irrigated packed bed for hot fuel gas desulfurization". Ind. Eng. Chem. Res., 46 (26), 9015-9021.
189
* ChevronChevron (2002). Coal gasification for power generation. A New Role for Coal in Meeting the United Kingdom's Clean Energy Challenge. ChevronChevron Texaco Worldwide Power & Gasification.
* Chilton, T. H. & Colburn, A. P. (1934). "Mass transfer (absorption) coefficient. Prediction from data on heat transfer and fluid friction". Industrial and Engineering Chemistry Research, 26 (11), 1183-1187.
* Christof, R. (2007). Energy in perspective: BP statistical review of world energy 2007. Available from: http: //www. bp. com/home. do? cateqorvld=l &contentld=2006973 [Accessed: 21 t November 2007]
* CIAB (2004). International coal market & policy developments in 2003. Coal Industry Advisory Board. Available from: http: //www. iea. orq/textbase/papers/2004/ciabmark 2003. pdf.
* Clift, R. (1997). "Inertial separators: Basic principles". In: Seville, J. P. K., Gas cleaning in demanding applications. London, Blackie Academic & Professional. p. 41-52.
* Colburn, A. P. (1939). "The simplified calculation of diffusional process, general consideration of two-film resistances". Transactions of American Institute of Chemical Engineers, 35,211-231. Cited in: Chang, B. F. (2003).
* Coulson, J. M. & Richardson, J. F. (1990). Chemical Engineering, Volume 2: Particle technology and separation processes. 4th Edition. Butterworth Heinemann.
* Coury, R. C., Coury, J. R., Thambimuthu, K. V. & Clift, R. (1987). "Capture and rebound of dust in granular bag gas filtes". Powder Technol, 50,253-265. Cited in: Chang, B. F. (2003).
* Danckwerts, P. V. (1951). "Significance of liquid-film coefficients in gas absorption". Ind. Eng. Chem., 43 (6), 1460-1467.
* DEFRA (2006). Climate Change The UK Programme 2006. Department for Environment, Food and Rural Affairs. Report No. CM6764-SE/2006/43.
* DEFRA (2008). INFORMATION BULLETIN: Statistical Release - UK Emissions of air pollutants - 2006 Results (13Th March 2008). London: Department for Environment, Food and Rural Affairs. Available from: http: //www. defra. qov. uk/news/2008/080313a. htm [Accessed: 8`h June 2008]
* DTI (2002). Energy: Its impact on the environment and society. Available from- http: //www. berr. qov. uk/files/file32296. pdf [Accessed: 28th August 2007]
* EEA (2002). Environmental signals 2002: Benchmarking the millennium (European environment agency regular indicator report). European Environment Agency. Report No. TH-AG-02-001 -EN-C.
* Elseviers, W. F. & Vereist, H. (1999). "Transition metal oxides for hot gas desulphurization". Fuel, 78 (5), 601-612.
190

* EPA (1996). Draft technical support document for HWC MACT standards. U. S. Environmental Protection Agency. Volume I- Description of source categories Report No. 68-D2-0164.
* EPA (2005). Module 6: Air pollutants and control techniques. U. S. Environmental Protection Agency. Available from: http: //www. epa. qov/eoqaptil/module6/matter/control/control. htm [Accessed: 23`d March 2005]
* EPA (2007a). Design review of absorbers used for gaseous pollutants - Lesson 11. Air Pollution Training Institute, U. S. Environmental Protection Agency. Available from: http: //www. epa. qov/oar/oaqps/eog/ [Accessed: 28th April 2007]
* EPA (2007b). Operating Principles of Scrubbers - Lesson 2. Air Pollution Training Institute, U. S. Environmental Protection Agency. Available from: http: //www. epa. qov/oar/oaqps/eog/ [Accessed: 18th February 2007]
* Fadel, T. M. (1984). "Selecting packed-column auxiliaries". Chemical Engineering Science, 91 (2), 71-76. Cited in: Chang, B. F. (2003)
* Gangwal, S. K. (1995). "Hot-gas-cleanup-sulfur recovery: Techanical, environmental, and economic issues". Heat Recovery System and CHP, 15 (2), 205-214.
* Gangwal, S. K., Portzer, J. W., Roberts, G. W. & Kozup, S. C. (1998). Engineering evaluation of hot-gas desulfurization with sulfur recovery. Research Triangle Institute. Research Triangle Park, NC. Report No. DEAC21-94MC31258.
* Gary, J. S. & Russell, C. M. (2001). "Gasification technologies: The path to clean, affordable energy in the 21st century". Fuel Processing Technology, 71 (1-3), 79-97.
* Grasa, G., Wellman, R. G., Kilgallon, P., Simms, N. J. & Oakey, J. E. (2004). Novel hot gas cleaning/heat recovery system. Power Generation Technology Centre, Cranfield University. Report No. COAL R269 DTI/Pub URN 04/1794.
* Graton, L. C. & Fraser, H. J. (1935). "J. Geol. " 43,785, Cited in: Gray, W. A. (1968). "The packing of solid particles". London, Chapman & Hall Ltd.
* Gray, W. A. (1968). The packing of solid particles. London, Chapman & Hall Ltd. Cited in: Chang, B. F. (2003)
* Gupta, R. P. & Gangwal, S. K. (1993). High temperature, high pressure testing of zinc titanate in a bench-scale fluidized bed reactor for 100 cycles. Topical Report under U. S. Dept. of Energy Contract, Research Triangle Inst., Research Triangle Park. Report No. NC 27709-2194.
Gupta, R. P., Turk, B. S. & Gangwal, S. K. (1996). "Bench-scale development of fluidized- bed spray-dried sorbents". Proceedings of the Advanced Coal-Fired Power Systems '96 Review Meeting held at Morgantown, West Virginia. U. S. DOE, Morgantown Energy Technology Center.
191
* Gupta, R. P., Turk, B. S. & Vierheilig, A. A. (1998). Desulfurization sorbents for transport- bed applications. Available from: http: //www. netl. doe. gov/publications/proceedings/98/98ps/ps2a-2. pdf [Accessed: 5th November 2004]
* Haupt, G. (1997). Erlangen, Germany, Siemen/KWU London: IEA Coal Research. Cited in: Mitchell, S. C. (1998)
* Heath, B. (2004). International coal market & policy developments in 2003. Coal Industry Advisory Board (CIAB).
* Hedden, K., Rao, B. R. & Reitz, F. (1986). "Desulfurization of manufactured gases with liquid metals". Proceedings of the 1986 International Gas Research Conference held at Toronto, Ont, Canada, pp. 1124-1133. Government Inst Inc, Rockville, MD, USA.
* Hedges, E. S. (1960). Tin and its alloys. Edward Arnold Ltd.: London.
* Higbie, R. (1935). "The rate of absorption of pure gas into a still liquid during short periods of exposure". Transactions of AIChE, 31,365. Cited in: Chang, B. F. (2003).
* Hrdlicka, T. & Swanson, W. (2003). Demonstration of a full-scale retrofit of the advanced hybrid particulate collector technology. Otter Tail Power Company, United States Department of Energy, National Energy Technology Laboratory. Report No. DE-FC26- 02NT41420.
* Huque, Z., Mei, D. & Zhou, J. (1996). Initial failure analysis of ceramic filters. Advanced Coal-Fired Power Systems '96 Review Meeting, Morgantown, West Virginia.
* IEA (2003). Control and minimisation of coal-fired power plant emissions: Zero emissions technologies for fossil fuels. IEA, Clean Coal Centre. Available from: http: //www. iea. orq/textbase/papers/2003/Coal Fired Fossil Fuels. pdf [Accessed: 14th June 2005]
Jothimurugesan, K., Adeyiga, A. A. & Gangwal, S. K. (1986). "Advanced hot-gas desulfurization sorbents". Proceedings of the Advanced Coal-Fired Power Systems '96, Review Meeting. Morgantown Energy Technology Center, Morgantown, West Virginia.
* Jun, H. K., Lee, T. J., Ryu, S. O. & Kim, J. C. (2001). "A study of Zn-Ti-based H2S removal sorbents promoted with cobalt oxides". Ind. Eng. Chem. Res., 40 (16), 3547-3556.
* Kwon, K. C. (1998). Investigation on durability and reactivity of promising metal oxide sorbents during sulphidation and regeneration. U. S. Department of Energy, Morgantown, West Virginia, U. S. Report No. DE-FG21-94MC31206-13.
* Kwon, K. C. & Gangwal, S. K. (2004). Kinetics of direct oxidation of H2S in coal gas to elemental sulfur. Tuskegee University, Tuskegee, Alabama and Research Triangle Institute. Report No. DE-FG26-00NT40835.
Levenspiel, O. (1999). Chemical reaction engineering. John Wiley and Sons, New York.
192

* Lew, S., Jothimurugesan, K. & Flytzani-S, M. (1989). "High-temperature hydrogen sulfide removal from fuel gases by regenerable zinc oxide-titanium dioxide sorbents". Ind. Eng. Chem. Res., 28 (5), 535-541.
* Lide, D. R. (2005). CRC Handbook of Chemistry and Physics. 86th edition. CRC Press: Boca Raton, FL.
* Linek, V., Petricek, P., Benes, P. & Braun, R. E. (1984). "Interfacial area and liquid side mass transfer coefficients in absorption columns packed with hydrophilised and untreated plastic packings". Chem. Eng. Res. Des., 62 (13), Cited in: G. Q. Wang, X. G. Yuan and K. T. Yu. (2005). "Review of mass-transfer correlations for packed columns". Ind. Eng. Chem. Res., 44,8715-8729.
* Lippert, T. E., Bruck, G. J., Sanjana, Z. N., Newby, R. A. & Bachovchin, D. M. (1996). "Westinghouse advanced particle filter system". Advanced Coal-Fired Power Systems '96 Review Meeting. Morgantown, West Virginia.
* Longwell, J. P., Rubin, E. S. & Wilson, J. (1995). "Coal: Energy for the future". Progress in Energy and Combustion Science, 21 (4), 269-360.
* Luke, C., Jin-Wei, L. & Chen-Lu, Y. (2002). "Absorption of NO2 in a packed tower with Na2SO3 aqueous solution". Environmental Progress, 21 (4), 225-230.
* Mackey, P. J. & Warner, N. A. (1973). "Studies in the vaporisation of mercury in irrigated packed beds". Chemical Engineering Science, 28 (12), 2141-2154.
* Masaki, T. & Jun-Ichi, T. (2002). "Development status of the EAGLE gasification pilot plant". Gasification Technologies 2002, October 27-30,2002. San Francisco, California.
* McCabe, W. L., Smith , J. C. & Harriott, P. (1993). Unit operations of chemical engineer/rig. .5 Edition. New York, McGraw-Hill.
* McConville, A. (1997). Emissions standards handbook. IEACR/96. London: IEA Coal Research. Cited in: Chang, B. F. (2003)
* Meissner, H. P. (1976). Removal of hydrogen sulfide from reducing gases. Institute of Gas Technology, US Patent US3954938
* Meissner, H. P. & Shora, F. C. (1981). High temperature pollutant removal from gas streams. Institute of Gas Technology, US Patent US4308037
* Mersmann, A. & Deixler, A. (1986). "Packed columns". Ger. Chem. Eng., 9 (265), Cited in: G. Q. Wang, X. G. Yuan and K. T. Yu. (2005). "Review of mass-transfer correlations for packed columns". Ind. Eng. Chem. Res., 44,8715-8729.
* Minchener, A. J. (2005). "Coal gasification for advanced power generation". Fuel, 84 (17), 2222-2235.
* Mitchell, S. C. (1997). Hot gas particulate filtration. London. IEA Coal Research. Report No. IEACR/95.
193
* Mitchell, S. C. (1998). Hot gas cleanup of sulphur, nitrogen, minor and trace elements. CCC/12. London: lEA Coal Research.
* Mojtahedi, W., Salo, K. & Abbasian, J. (1994). "Desulfurization of hot coal gas in fluidized-bed with regenerable zinc titanate sorbents". Fuel Processing Technology, 37, 53-65.
* Neelakantan, K. & Gehlawat, J. K. (1982). "New chemical systems for the determination of liquid-side mass transfer coefficient and effective interfacial area in gas-liquid contactors". The Chemical Engineering Journal, 24,1-6.
* Ness, H. M., Kim, S. S. & Ramezan, M. (1999). "Status of advanced coal-fired power generation technology development in the U. S". 13*h U. S/Korea Joint Workshop on Energy and Environment. Reno, Nevada.
* Neville, H. E. (2004). "Gasification process selection- Trade-offs and ironies". Proceedings of the Gasification Technologies Conference 2004. JW Marriott Hotel, Washington, DC.
* Nielsen, P. E. H. & Sigurdardottir, I. D. (1993). Development and characterization of steam regenerable sorbents for hot gas desulphurization in coal gasification based combined cycle plant. In Gas Cleaning At High Temperatures; Clift, R., Seville, J. P. K., Eds. Blackie Academic & Professional: Glasgow.
* Noll, C. G. & Peter Castle, G. S. (1995). "Electrostatics in gas cleaning: Contributions of Professor James R. Melcher". Journal of Electrostatics, 34 (2-3), 299-305.
* O'Brien, J. N., Blau, J. & Rose, M. (2004). An analysis of the institutional challanges to commercialization and development of IGCC technology in the U. S. electric industry: Recommended policy, regulatory, executive and legislative Initiatives. Global-Change Associstes. Available from: http: //www. netl. doe. aov/enerqy-analyses/pubs/FinalRegort2- 20Vol1. pdf [Accessed: 24th February 2006]
* Oak-Ridge (2005). Technology transfer: Ceramic filter is key to advanced coal technology. Oak Ridge National Laboratory, Department of Energy. Available from: http: //www. ornl. gov/info/ornlreview/rev28-4/text/tec. htm [Accessed: 24`h March 2005]
* Oakey, J. E., Simms, N. J. & Kilgallon, P. J. (2004). "Gas turbines: Gas cleaning requirements for biomass-fired systems". Materials Research, 7 (1), 17-25.
* Oxford-Chemist (2006). The physical and theoretical chemistry laboratory: Oxford University chemical and other safety information. Oxford Chemist Dorothy Crowfoot Hodgkin, University of Oxford. Available from: http: //www. pcl. ox. ac. uk/MSDS/ [Accessed: 22nd December 2006]
* Pahl, D. (1983). "EPA's program for establishing standards of performance for new stationary sources of air pollution". J. Air Pollut. Control Assoc., 33 (5), 468-482.
* Parkinson, G. (2004). "Power Generation: OEMs getting ready for coal gasification". Turbomachinery International, (May/June 2004).
194
* Patrick, V., Gavalas, G. R., Flytzani-S, M. & Jothimurugesan, K. (1989). "High- temperature sulfidation-regeneration of copper(II) oxide-alumina sorbents". Ind. Eng. Chem. Res., 28 (7), 931-940.
* Perry, R. H. & Green, D. W. (1997). Chemical Engineers' Handbook. 7r" Edition. New York, McGraw-Hill.
* Pineda, M., Palacios, J. M., Garcia, E., Cilleruelo, C. & Ibarra, J. (1997). "Modelling of performance of zinc ferrites as high-temperature desulfurizing sorbents in a fixed-bed reactor". Fuel, 76 (7), 567-573.
* Ratafia-Brown, J., Manfredo, L., Hoffmann, J. & Ramezan, M. (2002). Major environmental aspects of gasification-based power generation technologies. National Energy Technology Laboratory. Report No. DE-AT26-99FT201 01.
* Reitz, F. (1985). Selective desulfurization of hot reducing gases by liquid tin and lead. Dr. -Ing. dissertation. University of Karlsruhe. Cited in: Hedden, K. (1986).
* Rhodes, K. (2006). It's Academic: The case for coal gasification on campus. Woolpert, Inc. Available from: http: //www. woolpert. com/asp/articles/Its Academic. asp [Accessed: 16th February 2008]
* Ron, Z. & Pia, K. (2004). Control of pollutants in flue gases and fuel gases. Finland: 3`d edition (ISBN: 951-22-5527-8). Helsinki University of Technology. Available from: http: //web. abo. fi/-rzevenho/qasbook. html [Accessed: 24th November 2006]
* RS-Components (1996) Air process heaters. RS Components Ltd. Birchington Road, Corby, Northants, NN17 9RS, UK.
* Rutkowski, M. D., Klett, M. G. & Zaharchuk, R. (1996). "Assessment of hot gas contaminant control". Advanced Coal-Fired Power Syatems '96 Review Meeting. Morgantown, West Virginia.
* Sadownik, B., Nyboer, J., Murphy, R. & Laurin, A. (2004). Potential impact of energy efficiency of electricity demand in Ontario: Appendix 4-A comparison of combustion technologies for electricity generation. The Pembina Institute, Ontario. Available from: http: //www. pembina. orq/publications. asp [Accessed: 18th November 2004]
* Sahay, B. N. & Sharma, M. M. (1973). "Effective interfacial area and liquid and gas side mass transfer coefficients in a packed column". Chemical Engineering Science, 28,41- 47.
* Samsanov, G. V. (1982). The Oxide Handbook. 2"d Edition. New York, Plenum Data Co. Cited in: Chang, B. F. (2003).
* Sanchez, J. M., Ruiz, E. & Otero, J. (2005). "Selective removal of hydrogen sulfide from gaseous streams using a zinc-based sorbent". Ind. Eng. Chem. Res., 44 (2), 241-249.
* Sasaoka, E., Hatori, M., Yoshimura, H., Su, C. & Uddin, M. A. (2001). "Role of H2O in oxidation of spent high-temperature desulfurization sorbent Fe203 and CuO in the presence of 02". Ind Eng. Chem. Res., 40 (11), 2512-2517.
195
Sasaoka, E., Hirano, S., Kasaoka, S. & Sakata, Y. (1994). "Stability of zinc oxide high- temperature desulfurization sorbents for reduction". Energy and Fuels, 8 (3), 763-769.
Sasaoka, E., Ichio, T. & Kasaoka, S. (1992). "High-temperature H2S removal from coal- derived gas by iron ore". Energy and Fuels, 6 (5), 603-608.
Schürmann, B. (1984). "Untersuchungen lieber die Gasreinigung durch geschmolzene Stoffe und Entwicklung eines entsprechnenden Verfahrens (Studies of gas purification by molten materials and development of an appropriate method)". Fortschritt-Berichte der VDI-Zeitschriften Reihe 3: Verfahrenstechnik, 85,231.
* Scott, D. H. (1997). Improving existing power stations to comply with emerging emissions standards. IEA Coal Research. Report No. IEACR/92.
* Seville, J. P. K. (1996). Hot gas particulate clean-up: Curent technological and commercial status. UK DTI's Coal Research and Development Programme. Harwell, Energy Technology Support Unit. Report No. COAL 8092.
* Seville, J. P. K. (1997). Rigid ceramic filters. In: Seville, J. P. K. (ed) Gas cleaning in demanding applications. London: Blackie Academic & Professional.
* Shi, M. G. & Mersmann, A. (1985). "Effective interfacial area in packed columns". Ger. Chem. Eng., 8 (87), Cited in: G. Q. Wang, X. G. Yuan and K. T. Yu. (2005). "Review of mass-transfer correlations for packed columns". Ind. Eng. Chem. Res., 44,8715-8729,
* Shulman, H. L. & de Gouff, J. J. (1952). "Mass transfer coefficients and interfacial areas for 1-inch raschig rings". Ind. Eng. Chem., 44,1915, Cited in: G. Q. Wang, X. G. Yuan and K. T. Yu. (2005). "Review of mass-transfer correlations for packed columns". Ind. Eng. Chem. Res., 44,8715-8729.
* Shulman, H. L., Ullrich, C. F., Proulx, A. Z. & Zimmerman, J. O. (1955). "Performance of packed column. 2. Wetted and effective interfacial area, Gas- and liquid-phase mass transfer rates". American Institute of Chemical Engineers Journal, 1,253, Cited in: G. Q. Wang, X. G. Yuan and K. T. Yu. (2005). "Review of mass-transfer correlations for packed columns". Ind. Eng. Chem. Res., 44,8715-8729
* Simms, N. J., Oakey, J. E., Stephenson, D. J., Smith, P. J. & Nicholls, J. R. (1995). "Erosion-corrosion modelling of gas turbine materials for coal-fired combined cycle power generation". Wear, 186-187,247-255.
* Slimane, R. B. & Abbasian, J. (2000). "Copper-based sorbents for coal gas desulfurization at moderate temperatures". Ind. Eng. Chem. Res., 39 (5), 1338-1344.
* Slimane, R. B. & Hepworth, M. T. (1994a). "Desulfurization of hot coal-derived fuel gases with manganese-based regenerable sorbents. 1. Loading (sulfidation) tests". Energy and Fuels, 8 (6), 1175-1183.
Slimane, R. B. & Hepworth, M. T. (1994b). "Desulfurization of hot coal-derived fuel gases with manganese-based regenerable sorbents. 2. Regeneration and multicycle tests". Energy and Fuels, 8 (6), 1184-1191.
196

* Slimane, R. B. & Hepworth, M. T. (1995). "Desulfurization of hot coal-derived fuel gases with manganese-based regenerable sorbents. 3. Fixed-bed testing". Energy and Fuels, 9 (2), 372-378.
" Slimane, R. B. & Williams, B. E. (2002). "New ZnO-based regenerable sulfur sorbents for fluid-bed/transport reactor applications". Ind. Eng. Chem. Res., 41 (23), 5676-5685.
* Smeers, Y., Bolle, L. & Squilbin, O. (2001). Coal options: Evaluation of coal-based power generation in an uncertain context. Federal Office for Scientific, Technical and Cultural Affairs. Report No. CG/DD/231 - G/DD/232.
* Standish, N. (1968). "Heat transfer in liquid metal irrigated packed beds countercurrent to gases". Trans. Metall. Soc. ATME, 242,1733-1740.
* Standish, N. (1973). "On the flooding criteria for liquid metals". Chemical Engineering Science, 28 (10), 1906-1907.
* Stevens, D. J. (2001). Hot gas conditioning: Recent progress with large-scale biomass gasification systems. U. S. Department of Energy. Update and summary of recent progress Report No. NREL/SR-510-29952.
* Stiegel, G. J. (1999). Integrated gasification combined cycle: Clean, affordable energy for tomorrow's world. U. S. Department of Energy, Office of Fossil Energy, Pittsburgh. Available from: http: //www. energy. qov/ [Accessed: 26`h October 2005]
* Strigle, R. F. 1994). Packed tower designs and applications. Random and structured packings. 2' Edition. Gulf Publishing Company: Houston.
* SugarUdyog (2005). Controlling air pollution. Haryana: SugarUdyog. Available from: http: //www. suqarudvog. com/pollution. htm [Accessed: 30th March 2005]
* Svarovsky, L. (1981). Solid-gas separation. Amsterdam, Elsevier Scientific Publishing Company. Cited in: Chang, B. F. (2003).
* Tamhankar, S. S., Hasatani, M. & Wen, C. Y. (1981). "Kinetic studies on the reactions involved in the hot gas desulfurization using a regenerable iron oxide sorbent I: Reduction and sulfidation of iron oxide". Chemical Engineering Science, 36 (7), 1181- 1191.
* Toor, H. L. & Marchello, J. M. (1958). "Film-penetration model for mass and heat transfer". AIChE Journal, 4 (1), 97-101.
* Turk, B. S., Merkel, T., Lopez-Ortiz, A., Gupta, R. P., Krishnan, G. N., Freeman, B. D. & Fleming, G. K. (2001). Novel technologies for gaseous contaminants control. U. S. Department of Energy. Report No. DE-AC26-99FT40675.
* UK-DT) (1998). Technology status report-gasification of solid and liquid fuels for power generation. UK DTI's Cleaner Coal Technology Programme. Department of Trade and Industry. Cited in: Chang, B. F. (2003)
197

* US-DOE (2004). Gasification technology research and development. Available from: http: //www. fe. doe. gov/programs/powersystems/index. htmI [Accessed: 30`h November 20041
* Vogel, A. I. (1989). Vogel's Textbook of Quantitative Chemical Analysis. 5rh Edition. Essex, Longman Scientific & Technical. Cited in: Chang, B. F. (2003).
* Wakker, J. P. & Gerritsen, A. W. (1993). "High temperature hydrogen sulfide and carbonyl sulfide removal with manganese oxide (MnO) and iron oxide (FeO) on . gamma. -alumina acceptors ". Ind. Eng. Chem. Res., 32 (1), 139-149.
* Warner, N. A. (1959). "Liquid metal irrigation of a packed bed". Chemical Engineering Science 11 (3), 149-224.
* Warner, N. A. (1997). Zinc-based clean technology for desuffurization in advanced power generation. COAR R127. R127; UK DTI's Coal Research and Development Programme, Harwell, Energy Technology Support Unit.
* Warner, N. A. (2000). Personal communication: Theoretical framework for liquid metal based coal gasification (Draft) - 23" February 2000. Cited in: Chang, B. F. (2003)
# Warner, N. A. (2001). Personal communication: Theoretical framework for liquid metal based coal gasification (Draft) - 25rh April 2001. Cited in: Chang, B. F. (2003)
* WCI (2003). Coal the role of as an energy source. London: World Coal Institute. Available from: http: //wci. rmid. co. uk/uploads/RoleofCoal. pdf [Accessed: 22nd July 2006]
* WCI (2006). Coal facts 2006. London: World Coal Institute. Available from:
www. worldcoal. org [Accessed: 15th October 2006]
* Westmoreland, P. R., Gibson, J. B. & Harrison, D. P. (1977). "Comparative kinetics of high-temperature reaction between H2S and selected metal oxides". Environmental Science and Technology, 11 (5), 488-491.
# White, A. M. (1935). "Pressure drop and loading velocities in packed towers". Transactions American Institute of Chemical Engineers, 31,390-408. Cited in: Chang, B. F. (2003)
Whitman, W. G. (1923). "The two-film theory of gas absorption". Chemical and Metallurgical Engineering, 29 (4), 146-148. Cited in: Various sources.
# Williams, B. C. & McMullan, J. T. (1998). Hot gas chemical clean-up: Current commercial and technological status. UK DTI's Coal Research and Development Programme. Harwell, Energy Technology Support Unit. Report No. COAL R319. Cited in: Chang, B. F. (2003)
Zhu, Q. (2003). Developments in particulate control (PF 03-04). Available from: httr): //www. iea-coal. orq. uk [Accessed: 215` December 2004]
198
APPENDIX
List of Journal Publication and Oral/Poster Presentations
Changkook Ryu, Mohd H. S. Ismail, Vida N. Sharifi, and Jim Swithenbank,
"Liquid Tin irrigated Packed Bed for Hot Fuel Gas Desulfurization" Ind. Eng.
Chem. Res. 2007,46, pp. 9015-9021.
Mohd H. S. Ismail, Changkook Ryu, Vida N. Sharifi, and Jim Swithenbank, "Hot
Gas Clean-Up for Gasification Process" Poster presented at CIWM 2006/5'h
International Symposium on Waste Treatment technologies, 13-15`h June, 2006,
Paignton, UK.
Mohd H. S. Ismail, Changkook Ryu, Vida N. Sharifi, and Jim Swithenbank, "Hot
Gas Clean-Up for Gasification Process" 241h Month Poster Presentation,
Department of Chemical and Process Engineering, University of Sheffield.
October 2006.
Mohd H. S. Ismail, "Development of Liquid Tin Irrigated Packed Bed for Hot
Fuel Gas Desulphurisation" Oral Presentation, Department of Chemical and Process Engineering, University of Sheffield. 25th April, 2007.
199
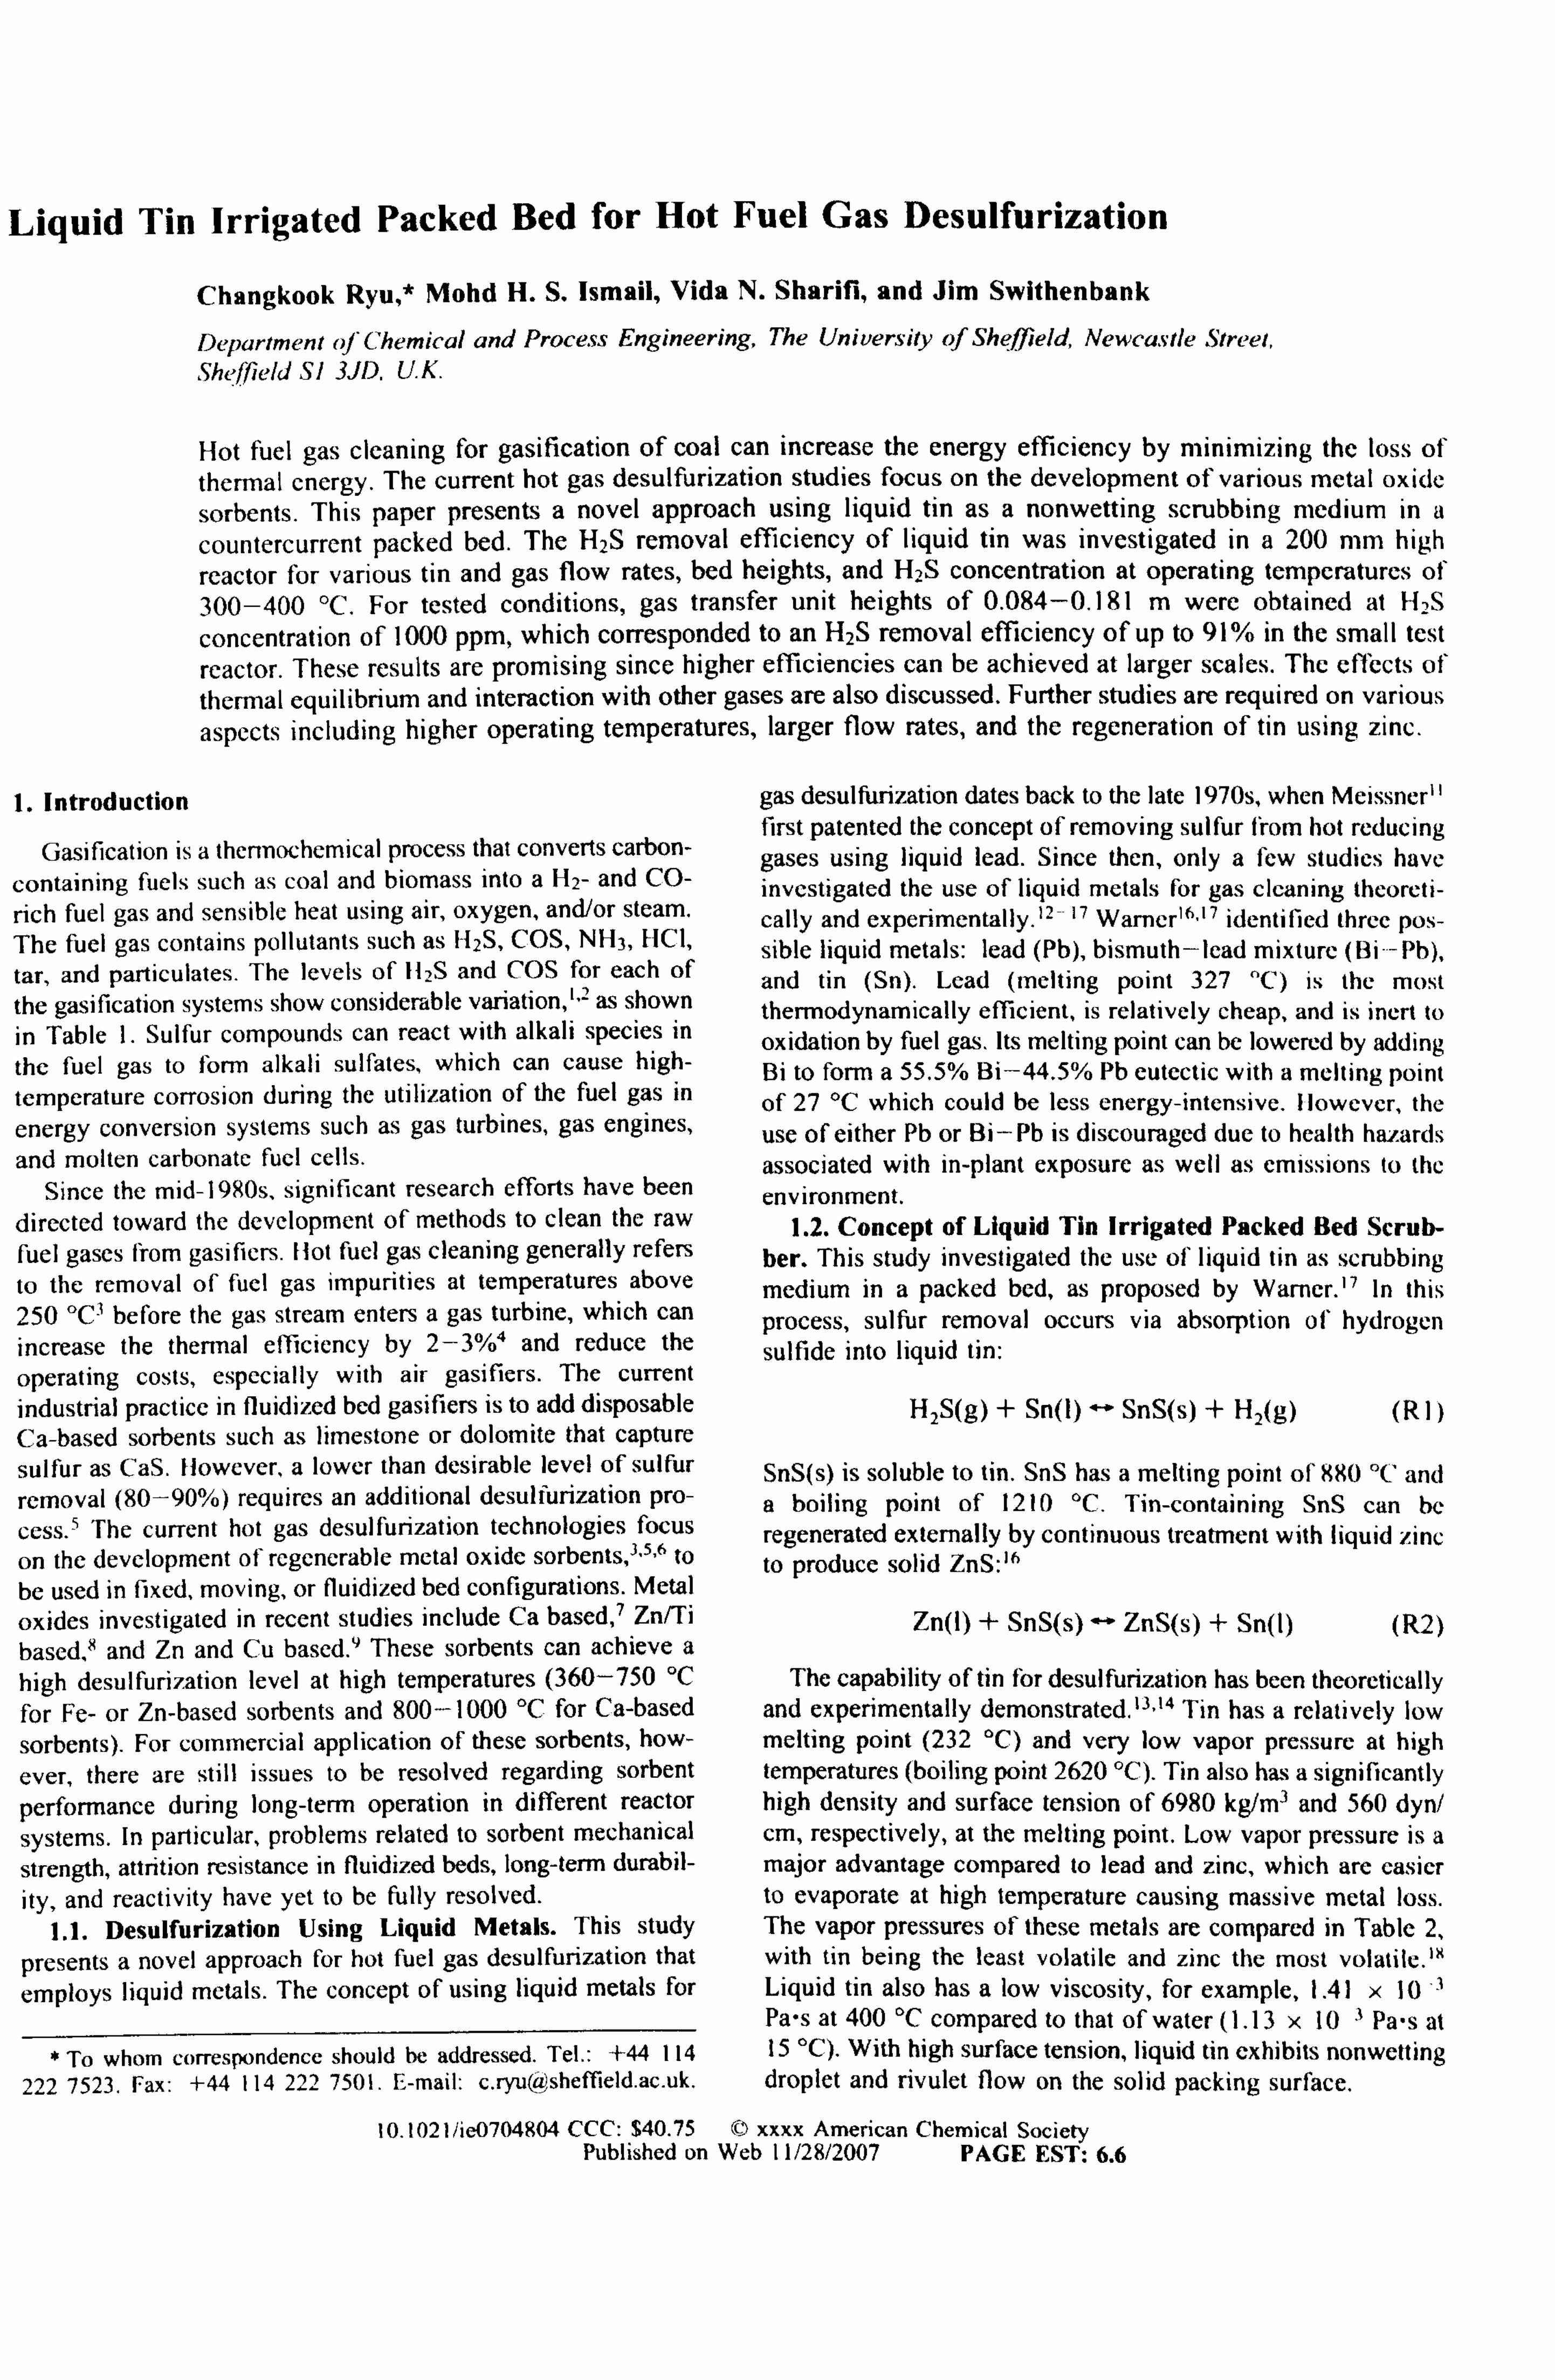
Liquid Tin Irrigated Packed Bed for Hot Fuel Gas Desulfurization
Changkook Ryu, * Mohd H. S. Ismail, Vida N. Sharifi, and Jim Swithenbank
Department of'Chemical and Process Engineering, The University of Shefeld, Newcastle Street, Sheffield SI 3JD. UK.
Hot fuel gas cleaning for gasification of coal can increase the energy efficiency by minimizing the loss of thermal energy. The current hot gas desulfurization studies focus on the development of various metal oxide sorbents. This paper presents a novel approach using liquid tin as a nonwetting scrubbing medium in a countercurrent packed bed. The H2S removal efficiency of liquid tin was investigated in a 200 mm high
reactor for various tin and gas flow rates, bed heights, and H2S concentration at operating temperatures of 300-400 °C. For tested conditions, gas transfer unit heights of 0.084-0.181 m were obtained at H7S
concentration of 1000 ppm, which corresponded to an H2S removal efficiency of up to 91% in the small test
reactor. These results are promising since higher efficiencies can be achieved at larger scales. The effects of thermal equilibrium and interaction with other gases are also discussed. Further studies are required on various aspects including higher operating temperatures, larger flow rates, and the regeneration of tin using zinc.
1. Introduction
Gasification is a thermochemical process that converts carbon- containing fuels such as coal and biomass into a H2- and CO-
rich fuel gas and sensible heat using air, oxygen, and/or steam. The fuel gas contains pollutants such as 1-12S, COS, NH3, HCI,
tar, and particulates. The levels of 112 and COS for each of the gasification systems show considerable variation, "- as shown in Table 1. Sulfur compounds can react with alkali species in
the fuel gas to form alkali sulfates, which can cause high-
temperature corrosion during the utilization of the fuel gas in
energy conversion systems such as gas turbines, gas engines, and molten carbonate fuel cells.
Since the mid-1980s, significant research efforts have been directed toward the development of methods to clean the raw fuel gases from gasifiers. Hot fuel gas cleaning generally refers to the removal of fuel gas impurities at temperatures above 250 °C3 before the gas stream enters a gas turbine, which can increase the thermal efficiency by 2-3%° and reduce the
operating costs, especially with air gasifiers. The current industrial practice in fluidized bed gasifiers is to add disposable Ca-based sorbents such as limestone or dolomite that capture sulfur as CaS. However, a lower than desirable level of sulfur removal (80-90%) requires an additional desulfurization pro- cess. ' The current hot gas desulfurization technologies focus
on the development of regenerable metal oxide sorbents, 3 5.6 to be used in fixed, moving, or fluidized bed configurations. Metal
oxides investigated in recent studies include Ca based, ' Zn/Ti based, 8 and Zn and Cu based. ' These sorbents can achieve a high desulfurization level at high temperatures (360-750 °C for Fe- or Zn-based sorbents and 800-1000 °C for Ca-based
sorbents). For commercial application of these sorbents, how-
ever, there are still issues to be resolved regarding sorbent performance during long-term operation in different reactor systems. In particular, problems related to sorbent mechanical strength, attrition resistance in fluidized beds, long-term durabil- ity, and reactivity have yet to be fully resolved.
1.1. Desulfurization Using Liquid Metals. This study presents a novel approach for hot fuel gas desulfurization that
employs liquid metals. The concept of using liquid metals for
gas desulfurization dates back to the late 1970s, when Meissner" first patented the concept of removing sulfur from hot reducing gases using liquid lead. Since then, only a few studies have investigated the use of liquid metals for gas cleaning theoreti- cally and experi mentally. ''- 17 Warner", " identified three pos- sible liquid metals: lead (Pb), bismuth-lead mixture (Bi -Pb), and tin (Sri). Lead (inciting point 327 "C) is the most thermodynamically efficient, is relatively cheap, and is inert to oxidation by fuel gas. Its melting point can be lowered by adding Bi to form a 55.5% Bi-44.5% Pb eutectic with a melting point of 27 °C which could be less energy-intensive. However, the use of either Pb or Bi-Pb is discouraged due to health hazards associated with in-plant exposure as well as emissions to the environment.
1.2. Concept of Liquid Tin Irrigated Packed Bed Scrub- ber. This study investigated the use of liquid tin as scrubbing medium in a packed bed, as proposed by Warner. " In this process, sulfur removal occurs via absorption of hydrogen sulfide into liquid tin:
H2S(g) + Sn(t) -" SnS(s) + H2(g) (RI)
SnS(s) is soluble to tin. SnS has a melting point of 980 °C and a boiling point of 1210 °C. Tin-containing SnS can be regenerated externally by continuous treatment with liquid zinc to produce solid ZnS: '6
Zn(I) + SnS(s) -" ZnS(s) + Sn(l) (R2)
The capability of tin for desulfurization has been theoretically and experimentally demonstrated. }, 14 Tin has a relatively low melting point (232 °C) and very low vapor pressure at high temperatures (boiling point 2620 °C). Tin also has a significantly high density and surface tension of 6980 kg/m3 and 560 dyn/ cm, respectively, at the melting point. Low vapor pressure is a major advantage compared to lead and zinc, which are easier to evaporate at high temperature causing massive metal loss. The vapor pressures of these metals are compared in Table 2, with tin being the least volatile and zinc the most volatile. "' Liquid tin also has a low viscosity, for example, 1.41 x 10 1 Pas at 400 °C compared to that of water (1.13 x 10 1 Pas at 15 °C). With high surface tension, liquid tin exhibits nonwetting droplet and rivulet flow on the solid packing surface.
To whom correspondence should be addressed. Tel.: +44 1 14 222 7523. Fax: +44 114 222 7501. E-mail: c. ryu(ilsheffield. ac. uk.
10.1021 /ie0704904 CCC: $40.75 © xxxx American Chemical Society Published on Web 11/28/2007 PAGE EST: 6.6
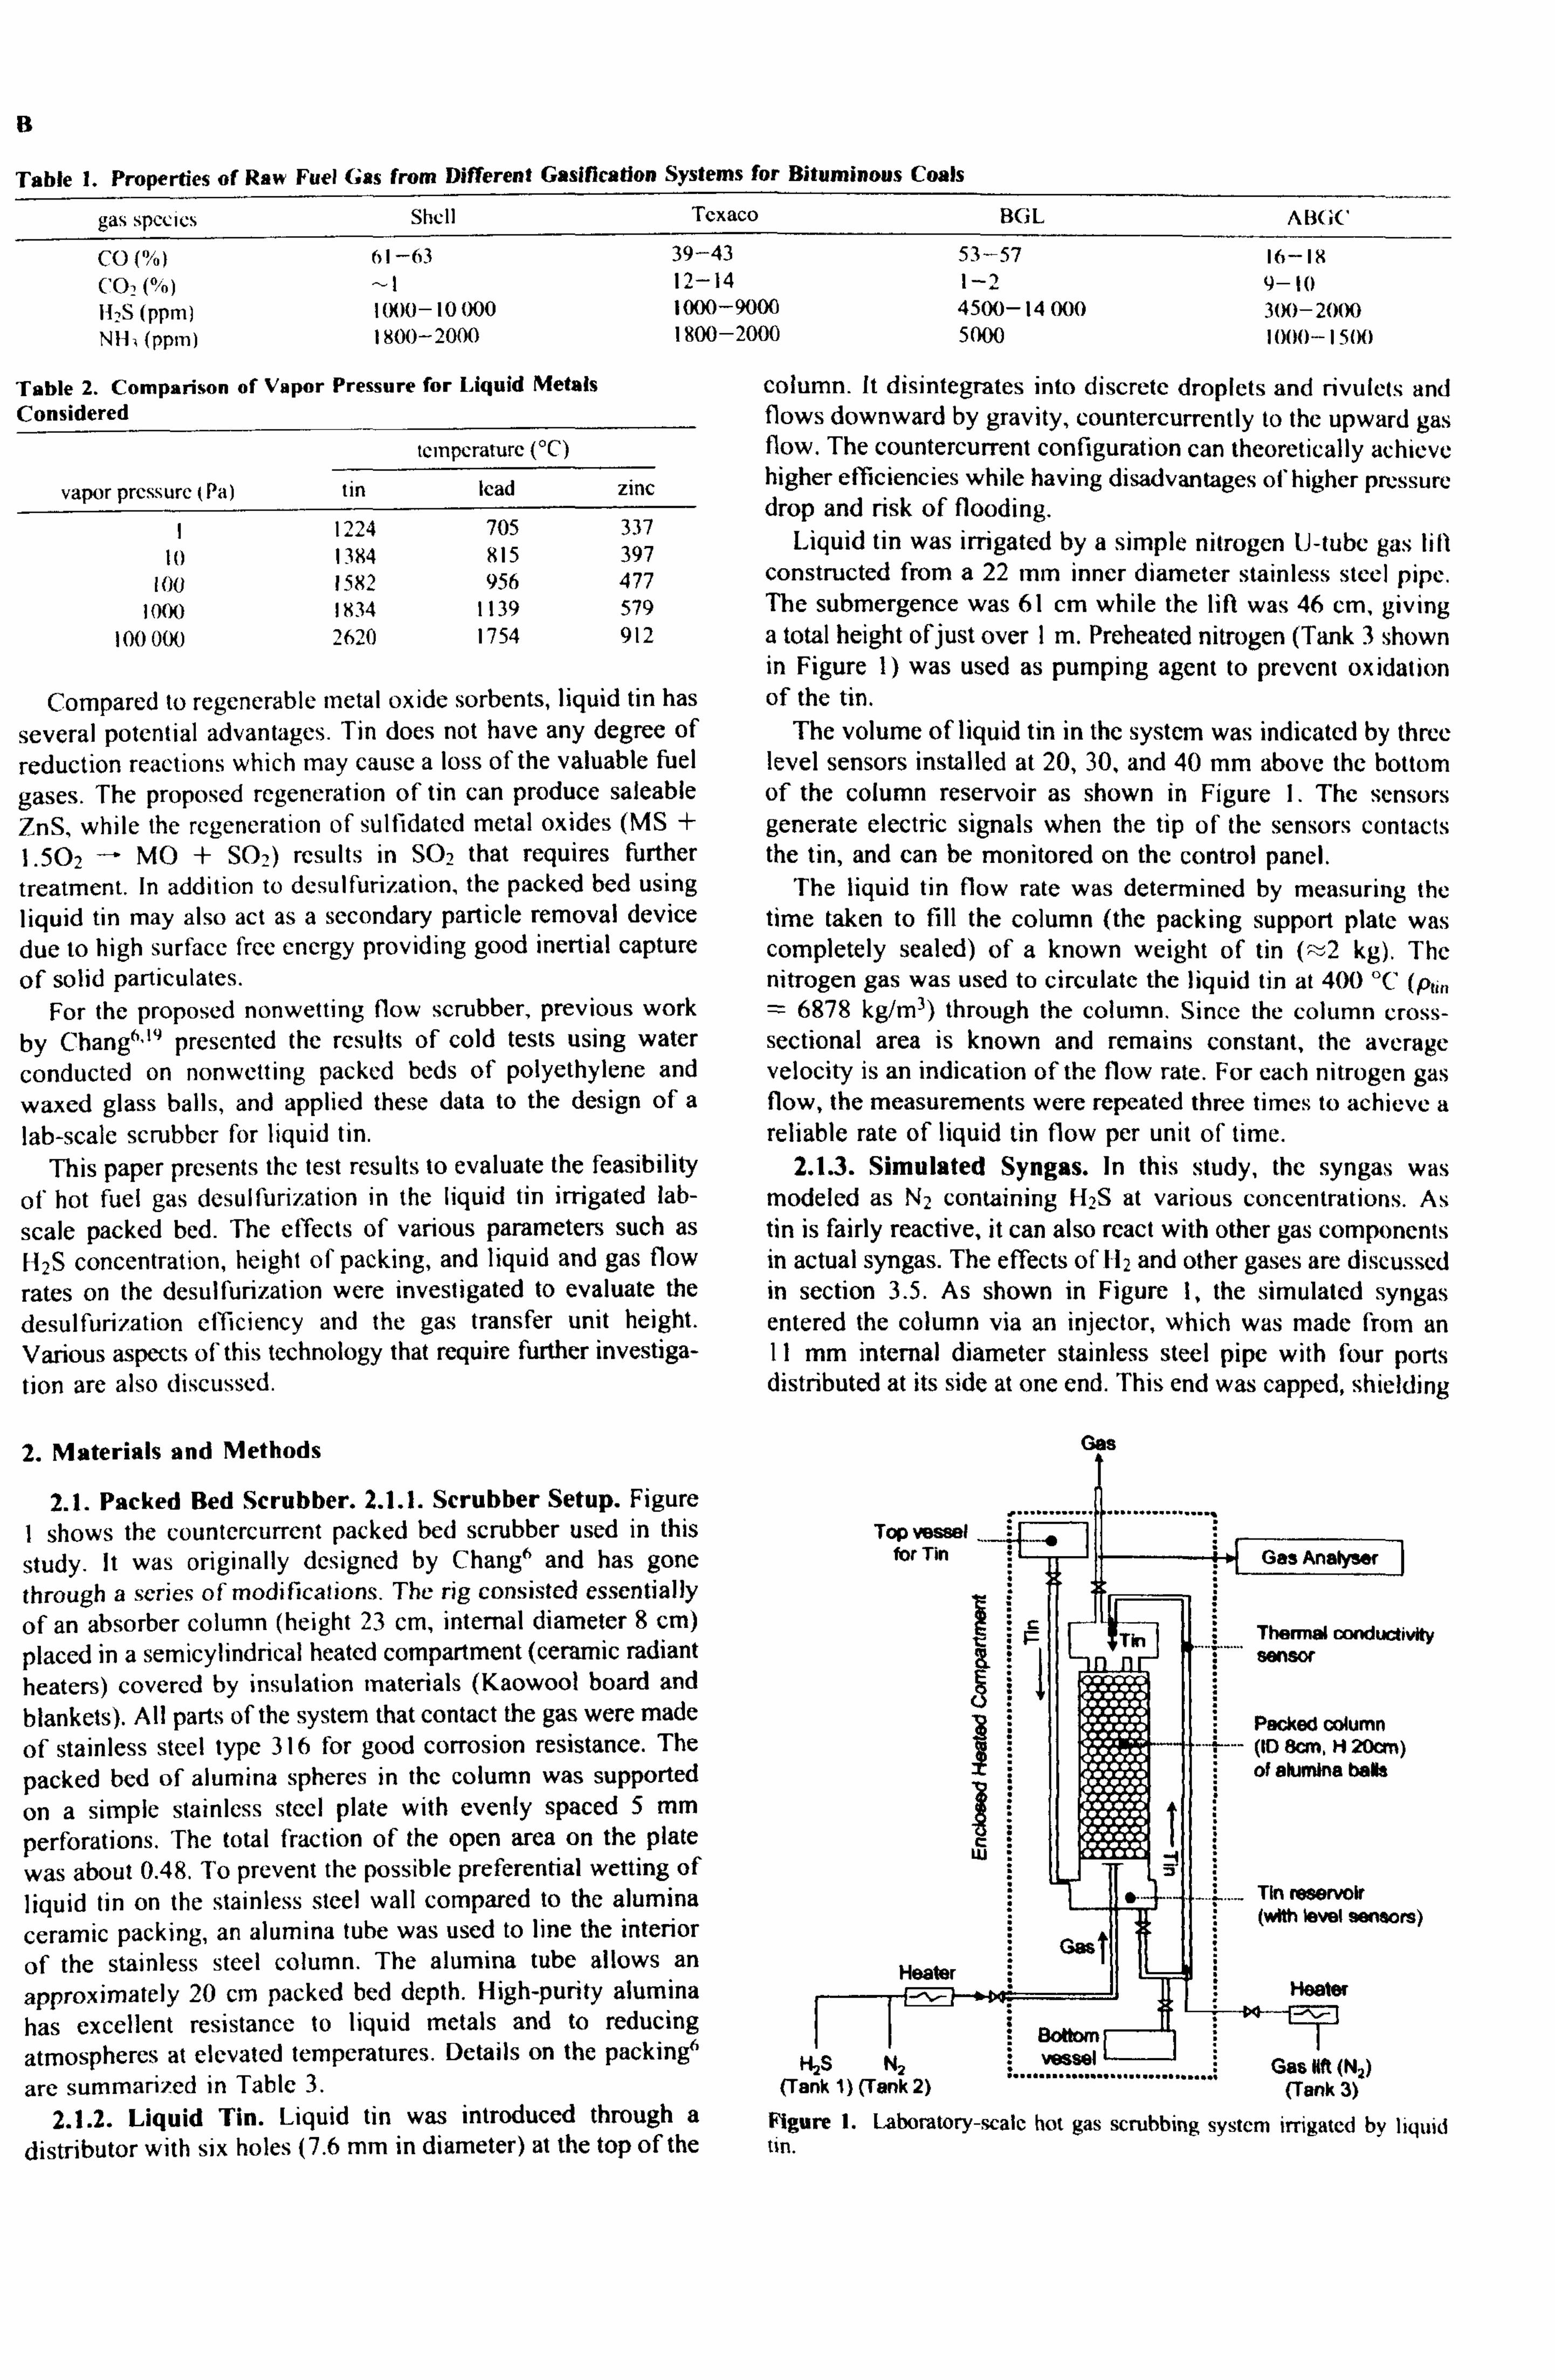
Table 1. Properties of Raw Fuel Gas from Different Gasification Systems for Bituminous Coals
gas spccics Shcll Texaco BGL ABGC
CO (%) 61-63 39-43 53-57 16-19 ('0, (%) ^1 12-14 1-2 9-I0 11, S (Ppm) I (N)0-10 000 1000-9000 4500-14000 300-2000 NII, (ppm) 1800-2000 1800-2000 5000 1000-I5(S)
Table 2. Comparison of Vapor Pressure for Liquid Metals
Considered
temperature (°C)
vapor pressure (Pa) tin lead zinc
1 1224 705 337 10 1394 915 397
100 1582 956 477 1000 1834 1139 579
100 000 2620 1754 912
Compared to regenerable metal oxide sorbents, liquid tin has
several potential advantages. Tin does not have any degree of reduction reactions which may cause a loss of the valuable fuel
gases. The proposed regeneration of tin can produce saleable ZnS, while the regeneration of sulfidated metal oxides (MS + 1.502 ~ MO + SO2) results in SO2 that requires further
treatment. In addition to desulfurization, the packed bed using liquid tin may also act as a secondary particle removal device due to high surface free energy providing good inertial capture of solid particulates.
For the proposed nonwetting flow scrubber, previous work by Chang 6, presented the results of cold tests using water conducted on nonwetting packed beds of polyethylene and waxed glass balls, and applied these data to the design of a lab-scale scrubber for liquid tin.
This paper presents the test results to evaluate the feasibility
of hot fuel gas desulfurization in the liquid tin irrigated lab-
scale packed bed. The effects of various parameters such as 112S concentration, height of packing, and liquid and gas flow
rates on the desulfurization were investigated to evaluate the desulfurization efficiency and the gas transfer unit height. Various aspects of this technology that require further investiga-
tion are also discussed.
column. It disintegrates into discrete droplets and rivulets and flows downward by gravity, countercurrently to the upward gas flow. The countercurrent configuration can theoretically achieve higher efficiencies while having disadvantages of higher pressure drop and risk of flooding.
Liquid tin was irrigated by a simple nitrogen U-tube gas lift constructed from a 22 mm inner diameter stainless steel pipe. The submergence was 61 cm while the lift was 46 cm, giving a total height of just over I m. Preheated nitrogen (Tank 3 shown in Figure 1) was used as pumping agent to prevent oxidation of the tin.
The volume of liquid tin in the system was indicated by three level sensors installed at 20,30, and 40 mm above the bottom of the column reservoir as shown in Figure 1. The sensors generate electric signals when the tip of the sensors contacts the tin, and can be monitored on the control panel.
The liquid tin flow rate was determined by measuring the time taken to fill the column (the packing support plate was completely sealed) of a known weight of tin (ý2 kg). The nitrogen gas was used to circulate the liquid tin at 400 °C (pi;,, = 6878 kg/m3) through the column. Since the column cross- sectional area is known and remains constant, the average velocity is an indication of the flow rate. For each nitrogen gas flow, the measurements were repeated three times to achieve a reliable rate of liquid tin flow per unit of time.
2.1.3. Simulated Syngas. In this study, the syngas was modeled as N2 containing 112S at various concentrations. As tin is fairly reactive, it can also react with other gas components in actual syngas. The effects of I I2 and other gases are discussed in section 3.5. As shown in Figure 1, the simulated syngas entered the column via an injector, which was made from an II mm internal diameter stainless steel pipe with four ports distributed at its side at one end. This end was capped, shielding
2. Materials and Methods
2.1. Packed Bed Scrubber. 2.1.1. Scrubber Setup. Figure I shows the countercurrent packed bed scrubber used in this
study. It was originally designed by Chan' and has gone through a series of modifications. The rig consisted essentially of an absorber column (height 23 cm, internal diameter 8 cm) placed in a semicylindrical heated compartment (ceramic radiant heaters) covered by insulation materials (Kaowool board and blankets). All parts of the system that contact the gas were made of stainless steel type 316 for good corrosion resistance. The
packed bed of alumina spheres in the column was supported on a simple stainless steel plate with evenly spaced 5 mm perforations. The total fraction of the open area on the plate was about 0.48. To prevent the possible preferential wetting of liquid tin on the stainless steel wall compared to the alumina ceramic packing, an alumina tube was used to line the interior
of the stainless steel column. The alumina tube allows an approximately 20 cm packed bed depth. High-purity alumina has excellent resistance to liquid metals and to reducing atmospheres at elevated temperatures. Details on the packing6 are summarized in Table 3.
2.1.2. Liquid Tin. Liquid tin was introduced through a distributor with six holes (7.6 mm in diameter) at the top of the
Top TAI 1ý- 14 for Tin Gas Analyser
t: 1. F Tin Thermal conductivity
sensor Pecked column (ID 8cm, H 20cm)
of alumina baba
w
a_ Tin reservoir (with level sensors)
Heater 'Gas Ali .
Heater
H2S N2 sel Gas Nft (N2) (Tank 1) (Tank 2) (Tank 3)
Figure 1. Laboratory-scale hot gas scrubbing system irrigated by liquid tin.
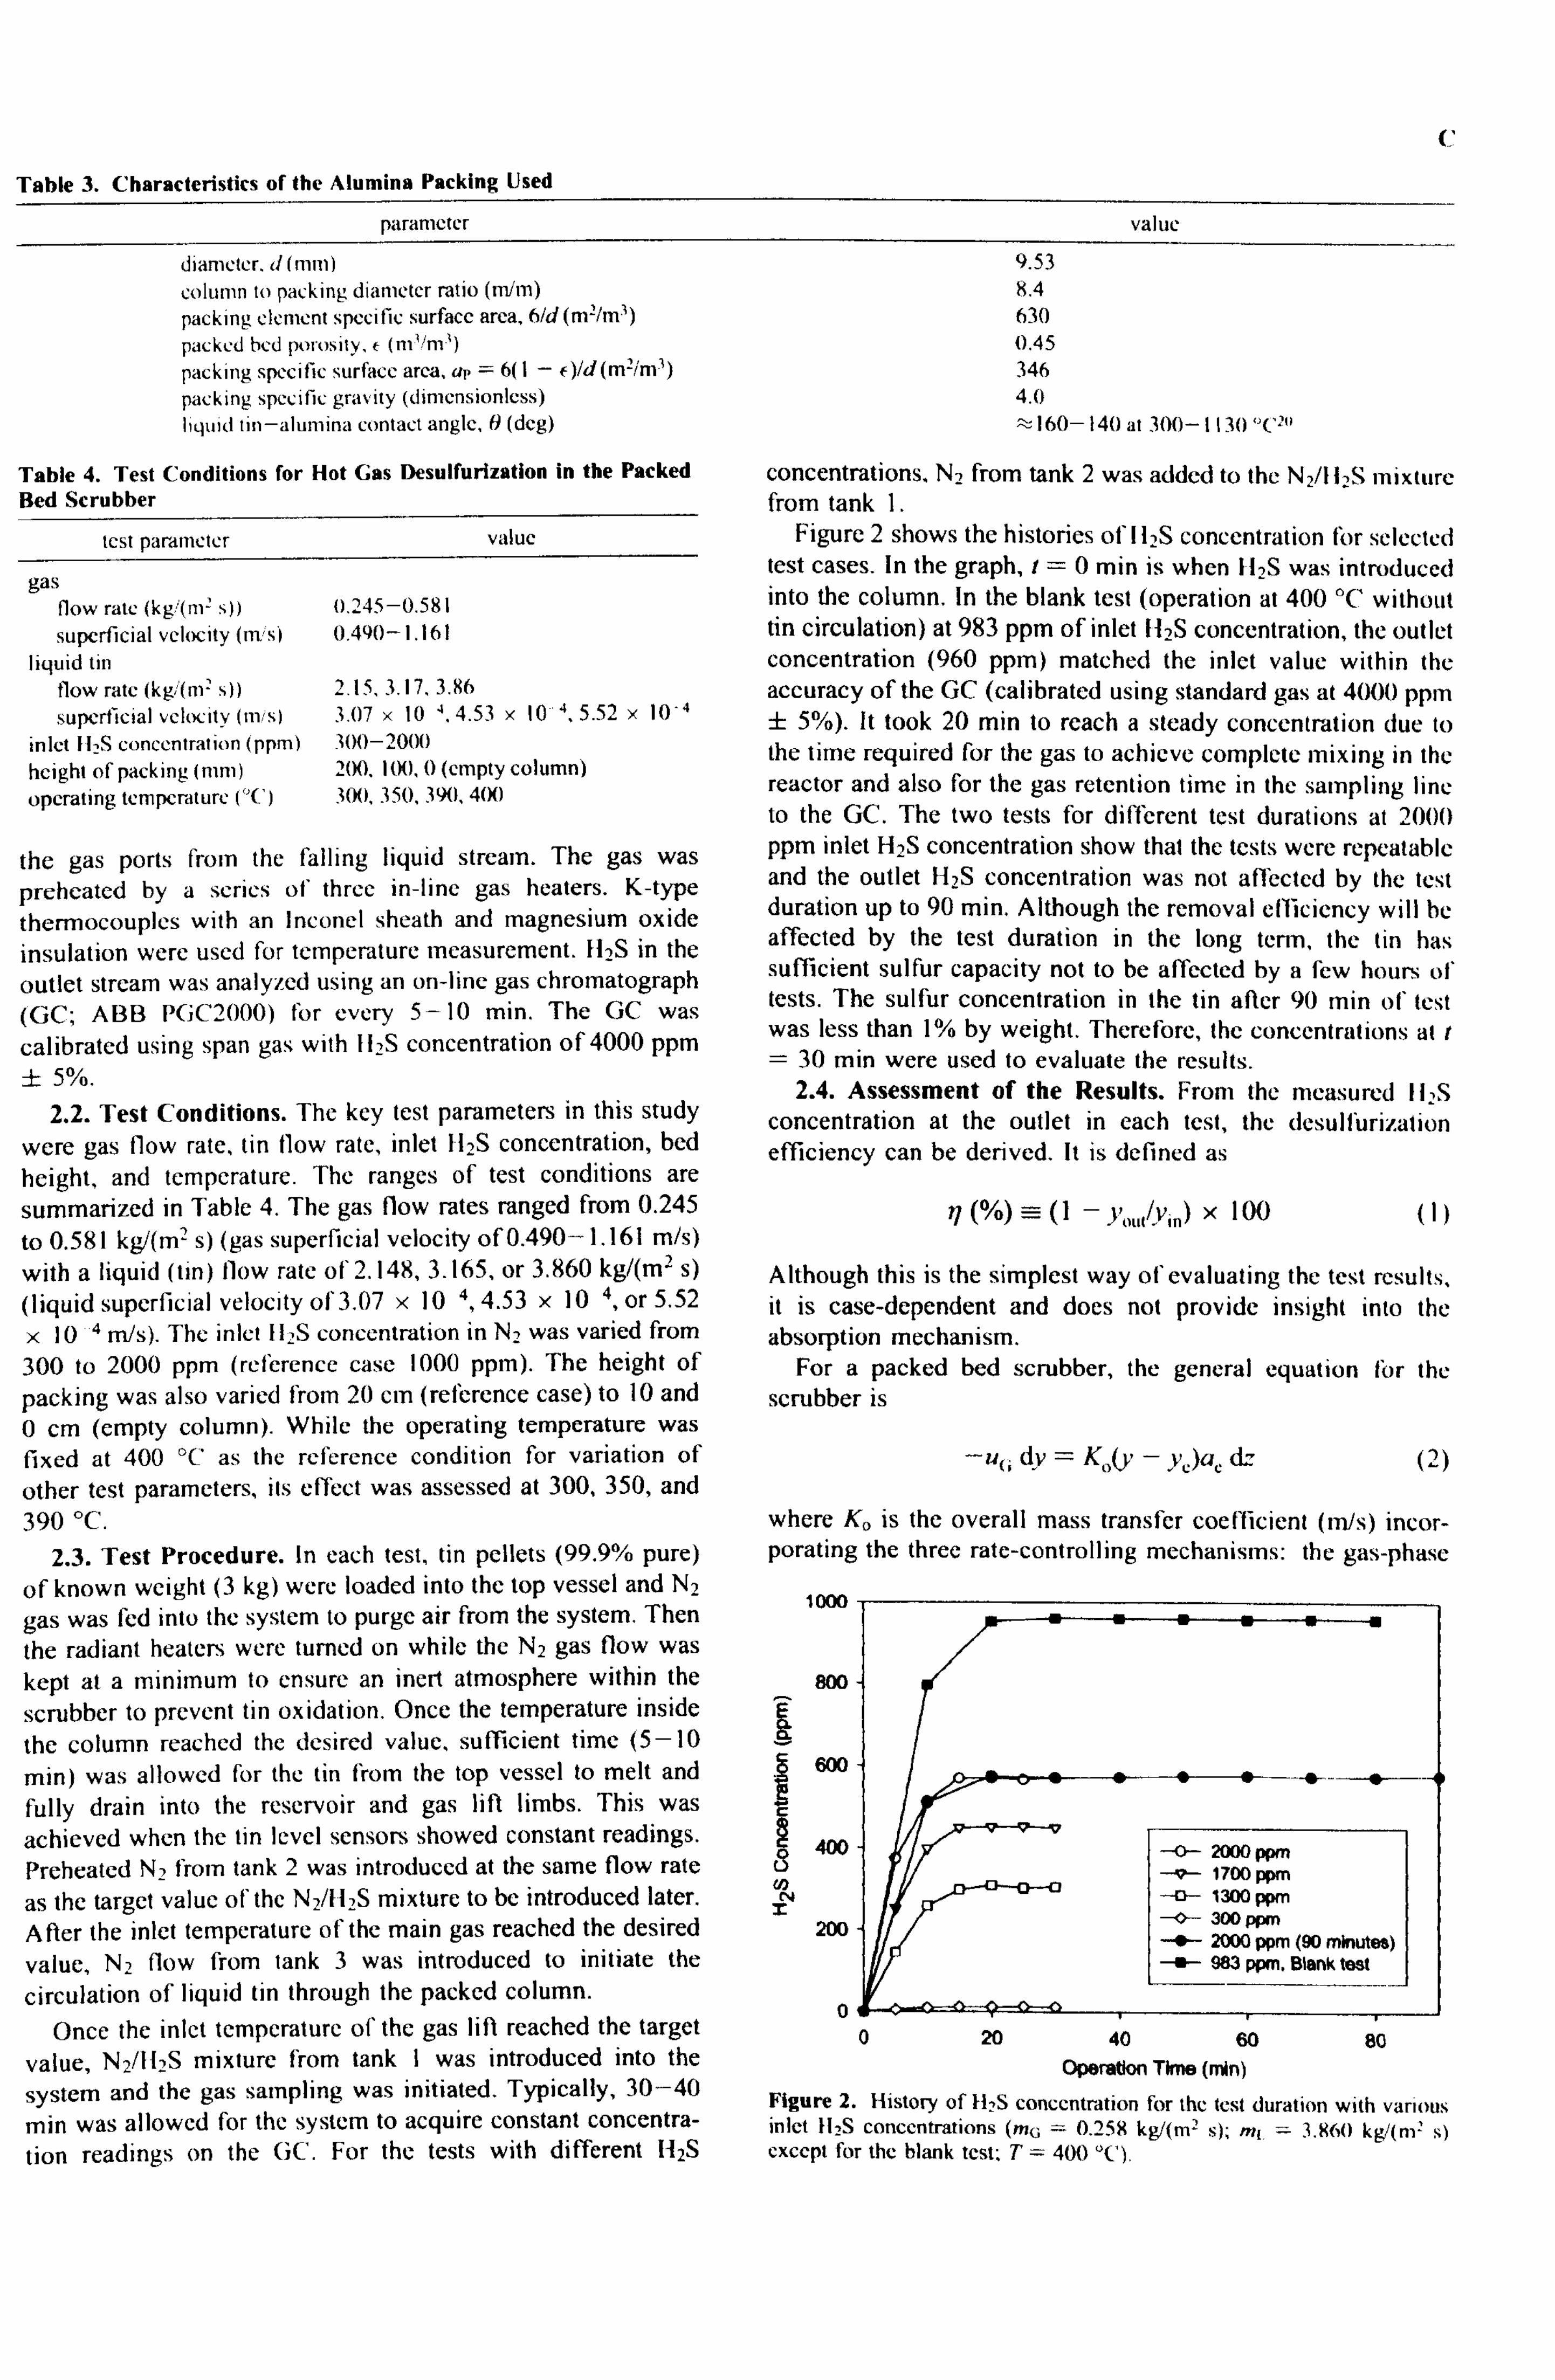
C Table 3. Characteristics of the Alumina Packing Used
parameter value
diameter. d (mm) 9.53
column to packing diameter ratio (rn/m) 8.4
packing clement specific surface area, 6/d (m'/m; ) 630 packed bed porosity, e (m'/m1) 0.45
packing specific surface area, ar - 6(1 - f)/d(m2/m') 346 packing specific gravity (dimensionless) 4.0
liquid tin-alumina contact angle, 0 (deg) ti 160- 140 at 300- 11 3O °C-'
Table 4. Test Conditions for Hot Gas Desulfurization in the Packed Bed Scrubber
test parameter value
gas flow rate (kgjm= Sp 0.245-0.581 superficial velocity (in%s) 0.490-I. 161
liquid tin flow rate (kg(m2 s)) 115,3.17,3.86
superficial velocity 0n/s) 3.07 x 10 1,4.53 x 10 °, 5.52 x 10 inlet 11, S concentration (ppm) 300-2000
height of packing (mm) 200. I(N), 0 (empty column) operating temperature (°C) 300,350,390,400
the gas ports from the falling liquid stream. The gas was preheated by a series of three in-line gas heaters. K-type
thermocouples with an Inconel sheath and magnesium oxide insulation were used for temperature measurement. 11, S in the
outlet stream was analyzed using an on-line gas chromatograph (GC; Aßß PGC2000) for every 5-10 min. The GC was calibrated using span gas with 112S concentration of 4000 ppm f 5%.
2.2. Test Conditions. The key test parameters in this study were gas flow rate, tin flow rate, inlet ll2S concentration, bed height, and temperature. The ranges of test conditions are summarized in Table 4. The gas flow rates ranged from 0.245
to 0.581 kg/(m2 s) (gas superficial velocity of 0.490-1.161 m/s) with a liquid (tin) flow rate of 2.148,3.165, or 3.860 kg/(m2 s) (liquid superficial velocity of 3.07 x 10 4,4.53 x 10 4, or 5.52
x 10 ° m/s). The inlet l hS concentration in N, was varied from 300 to 2000 ppm (reference case 1000 ppm). The height of packing was also varied from 20 cm (reference case) to 10 and 0 cm (empty column). While the operating temperature was fixed at 400 °C as the reference condition for variation of other test parameters, its effect was assessed at 300,350, and 390 °C.
2.3. Test Procedure. In each test, tin pellets (99.9% pure) of known weight (3 kg) were loaded into the top vessel and N,
gas was fed into the system to purge air from the system. Then
the radiant heaters were turned on while the N2 gas flow was kept at a minimum to ensure an inert atmosphere within the
scrubber to prevent tin oxidation. Once the temperature inside
the column reached the desired value, sufficient time (5-10
min) was allowed for the tin from the top vessel to melt and fully drain into the reservoir and gas lift limbs. This was achieved when the tin level sensors showed constant readings. Preheated N2 from tank 2 was introduced at the same flow rate as the target value of the N2/111S mixture to be introduced later.
After the inlet temperature of the main gas reached the desired
value, N2 flow from tank 3 was introduced to initiate the
circulation of liquid tin through the packed column. Once the inlet temperature of the gas lift reached the target
value, N2/112S mixture from tank I was introduced into the
system and the gas sampling was initiated. Typically, 30-40
min was allowed for the system to acquire constant concentra- tion readings on the GC. For the tests with different H2S
concentrations, N2 from tank 2 was added to the N2/H: S mixture from tank 1.
Figure 2 shows the histories off 12S concentration for selected test cases. In the graph, t=0 min is when 11, S was introduced into the column. In the blank test (operation at 400 °C without tin circulation) at 983 ppm of inlet 112S concentration, the outlet concentration (960 ppm) matched the inlet value within the accuracy of the GC (calibrated using standard gas at 4000 ppm ± 5%). It took 20 min to reach a steady concentration due to the time required for the gas to achieve complete mixing in the reactor and also for the gas retention time in the sampling line to the GC. The two tests for different test durations at 2000 ppm inlet H2S concentration show that the tests were repeatable and the outlet 112S concentration was not affected by the test duration up to 90 min. Although the removal efficiency will be affected by the test duration in the long teen, the tin has sufficient sulfur capacity not to be affected by a few hours of tests. The sulfur concentration in the tin after 90 min of test was less than 1% by weight. Therefore, the concentrations at t = 30 min were used to evaluate the results.
2.4. Assessment of the Results. From the measured 112S concentration at the outlet in each test, the desulfurization efficiency can be derived. It is defined as
17 (%) -=(I - Yo. iwjo) x 100 (1)
Although this is the simplest way of evaluating the test results, it is case-dependent and does not provide insight into the absorption mechanism.
For a packed bed scrubber, the general equation for the scrubber is
-uc dv = Ko(Y - Y, )a, d' (2)
where Ko is the overall mass transfer coefficient (m/s) incor- porating the three rate-controlling mechanisms: the gas-phase
1000
am
600
4°°
N i
200
-0- 2000 ppm -Q- 1700 ppm n 1300 ppm 300 ppm
+ 2000 ppm (90 minutes) ý- 983 ppm. Blank test
20 40 60 80 Operation The (min)
Figure 2. History of ü, S concentration for the test duration with various inlet H2S concentrations (mG = 0259 kg/(m- s); mi = 3.860 kg/(m' s) except for the blank test; T= 400 °C).

D
100
8O T
60
40
O N = 20
0.5
0.4
0.3 x
0.2
0.1
0.0
Figure 3. IS removal elliciency (q) and the gas transfer unit height (11(1(1)
for different packing heights (mi, - 0.258 kg/(m' s); mt. = 3.860 kg/(m2
s); T= 400 `C).
100
e 80
60 m
E m
40
O
E 0
20
0.30
0.25
0.20
S 0.15
3
0.10
0.05
0.00 0.2 0.3 0.4 0.5 0.6 0.7
Gas flow rate (mß kglm2s)
Figure 4. El S removal efficiency (r/) and gas transfer unit height (H(x; )
for various gas and liquid superficial velocities (inlet 112S concentration =
1000 ppm: T= 400 `C).
mass transfer (kO of TO toward the liquid surface, the reaction
kinetic effect at the interface (kr), and the liquid-phase mass
transfer (k1) for SnS dissolving into tin. K� can be expressed
simply as
xii k, +
kr+ kl. (3)
Rearranging eq 2 gives
dv Kuc =-d: (4)
} Vc lit
Integration of eq 4 yields
, 'Vox - UG Z (5)
where Z is the bed height, Kc is the overall mass transfer
averaged along the bed height, and N(x; is the overall number
of gas-phase transfer units defined as
ý,,, d1,6
ýý oG
-o- rr+ 3.860 Nym'a
-ý- n4: 3.165 Rplm's
-ý- rni: 2.148 kglm's
For a fast absorption process (y> ye), N(x; can be simplified using only the inlet and outlet pollutant concentrations.
Noce = ln(y, �/Y(,,,, ) (7)
From eq 6, the removal efficiency of a packed bed scrubber can then be expressed in terms of the overall height of the gas- phase transfer unit (Hoo(; ). 2
Hor = ZING, = ""
Ku (K)
Hoc represents the height (m) required to achieve a characteristic level of desulfurization (y; n/y,,,,, =e or q= 63.2%). The smaller the value of Ho>(; is, the more efficient an absorption process is. As shown in the equations, /lcx; is affected by the three reaction/mass transfer rates for K� as well as the interfacial area (ae) and gas velocity (u(j, or gas residence time in the column).
3. Results and Discussion
3.1. Effect of Scrubber Packing Height. Figure 3 shows r1 and Hoc acquired for three different bed heights (0,100, and 200 mm) with two 112S concentrations at the inlet (541 and 1000 ppm). The gas and tin flow rates were fixed at 0.258 and 3.860 kg/(m-' s), respectively, with an operating temperature of 400 °C. The tests with an empty column had r, of about 40% due to lack of interfacial contact area, which corresponded to H0; values of 0.40 m. These IIo ; values were then used to correct the results for the 100 mm high packing by removing the effect of the empty half of the column above the packing. Figure 3 shows that the increase in the bed height from 100 to 200 mm resulted in an increase in the removal efficiency from 66% to 84%. However, the fl(x; was almost constant for both packing heights at both concentrations, which conforms to its definition.
3.2. Effect of Gas and Liquid Tin Flow Rates. Figure 4 shows the trends of the 112S removal efficiency (r7) and Ihx; for different gas and liquid superficial velocities for an inlet H2S concentration of 1000 ppm at 400 °C, r1 ranged from 67% to 91% in the test reactor, which resulted in II values of 0.084-0.181 m. Increasing the liquid flow rate from 2.148 to 3.860 kg/(m2 s) led to 2-4% higher values of r/ and, therefore, lower values of Hex; by 0.012-0.014 m. However, larger gas flow rates up to a certain point (0.443 kg/(m2 s)) increased 11(K, (reduced r/) and then started to decrease the value. Recalling eq 8 for Hcx, these trends can be explained from the way the gas and liquid velocities affect the flow characteristics in the column such as the residence time, interfacial contact area, and mass transfer rate.
First, the gas velocity determines the residence time of the gas phase in the column, which represents the macro-opportunity for the gas to contact the liquid. For example, the gas residence time in the lab-scale scrubber decreased from 0.183 to 0.078 s based on the void volume of the dry column as the mass flow rate increased from 0.245 to 0.581 kg/(m2 s). The actual values are lower than these due to the volume of the liquid retained in the bed, which is known as liquid holdup. The decrease in r1 from about 90% to about 66% for gas flow rates up to 0.443 kg/(m2 s) is attributable to the reduced gas residence time.
Second, the gas and liquid velocities affect the liquid holdup in the bed. Higher liquid flow rates directly increase the liquid holdup. As more liquid is retained, it generally creates a larger interfacial contact area (ae) between the two phases. This results in lower values of H( at higher liquid velocities. At a constant
05 10 15 20
Height of packing (cm)
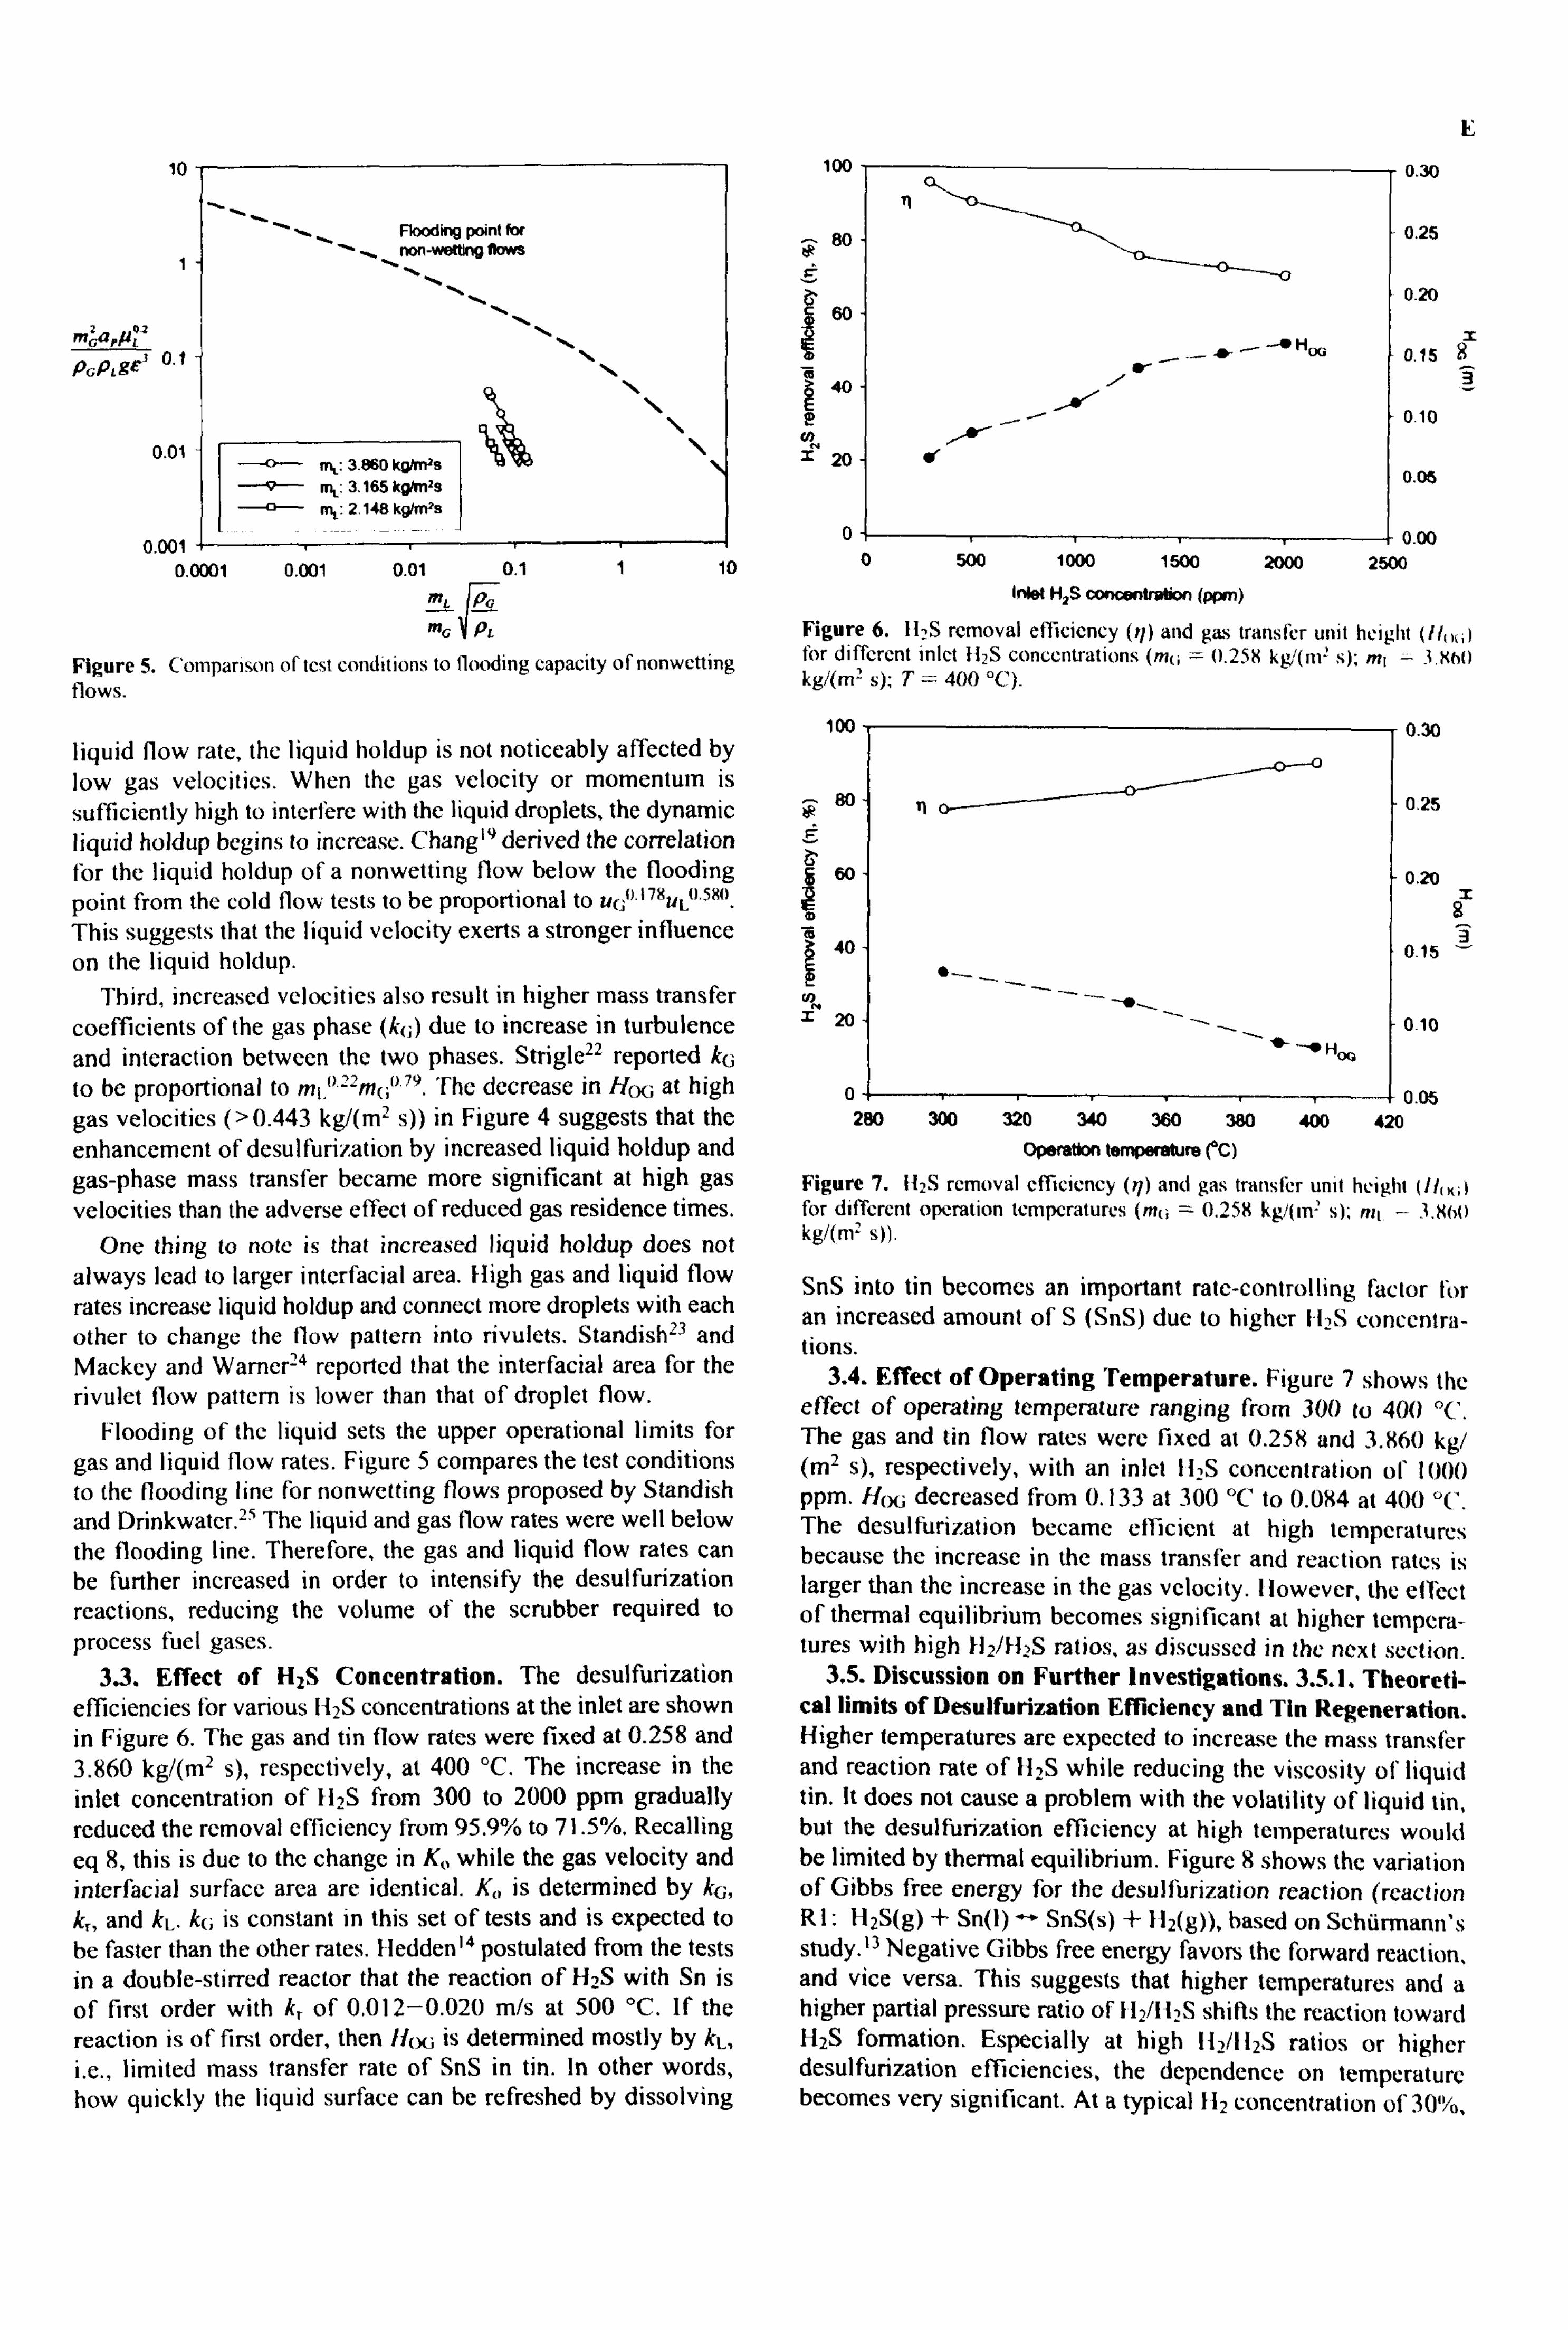
10
1
mcar/1tý
P. PLB£' 0.1
0.01
0.001 +-- 0.0001 0.001 0.01 0.1 1 10
mL Pc
mG PL
Figure 5. Comparison of test conditions to flooding capacity of nonwctting flows.
liquid flow rate, the liquid holdup is not noticeably affected by low gas velocities. When the gas velocity or momentum is
sufficiently high to interfere with the liquid droplets, the dynamic liquid holdup begins to increase. Chang" derived the correlation for the liquid holdup of a nonwetting flow below the flooding
point from the cold flow tests to be proportional to uc° 178UL0.580. This suggests that the liquid velocity exerts a stronger influence
on the liquid holdup. Third, increased velocities also result in higher mass transfer
coefficients of the gas phase (k(; ) due to increase in turbulence and interaction between the two phases. Strigle22 reported k0 to be proportional to m1 22m(; ° 79. The decrease in HOG at high
gas velocities (>0.443 kg/(m2 s)) in Figure 4 suggests that the enhancement of desulfurization by increased liquid holdup and gas-phase mass transfer became more significant at high gas velocities than the adverse effect of reduced gas residence times.
One thing to note is that increased liquid holdup does not always lead to larger interfacial area. High gas and liquid flow
rates increase liquid holdup and connect more droplets with each other to change the flow pattern into rivulets. Standish23 and Mackey and Wamer24 reported that the interfacial area for the rivulet flow pattern is lower than that of droplet flow.
Flooding of the liquid sets the upper operational limits for
gas and liquid flow rates. Figure 5 compares the test conditions to the flooding line for nonwetting flows proposed by Standish and Drinkwater. 25 The liquid and gas now rates were well below the flooding line. Therefore, the gas and liquid flow rates can be further increased in order to intensify the desulfurization
reactions, reducing the volume of the scrubber required to process fuel gases.
3.3. Effect of HZS Concentration. The desulfurization
efficiencies for various 1-12S concentrations at the inlet are shown in Figure 6. The gas and tin flow rates were fixed at 0.258 and 3.860 kg/(m2 s), respectively, at 400 °C. The increase in the inlet concentration of I12S from 300 to 2000 ppm gradually reduced the removal efficiency from 95.9% to 71.5%. Recalling
eq 8, this is due to the change in & while the gas velocity and interfacial surface area are identical. K� is determined by k0, k� and kL. k(; is constant in this set of tests and is expected to be faster than the other rates. Iledden14 postulated from the tests in a double-stirred reactor that the reaction of 1I2S with Sri is
of first order with k, of 0.012-0.020 m/s at 500 °C. If the reaction is of first order, then //cw is determined mostly by kL, i. e., limited mass transfer rate of SnS in tin. In other words, how quickly the liquid surface can be refreshed by dissolving
Flooding point for non_wetWV flows
BW
\
--ý-- mi: 3.860 kgWs
--ý- m,: 3.165 kg! m s
-V- n4: 2.148 kgWs
100
80
E 60
m A 40
= 20
_ __ -- r
d
500 1000 1500 2000
Inlet H2S concentration (ppa)
Figure 6.11, S removal efficiency (q) and gas transfer unit height (Ilu5; l for different inlet H2S concentrations (m(; ý 0.25t kg/(m2 s); m, - 3. Kbo kg/(m2 s); T= 400 °C)-
100
80
60
ao
r 20
0
00
0.30
0.25
0.20
0.15
0.10
0.05
0.00 2500
0.30
0.25
0.20 x
0.15
0.10
0.0 280 300 320 340 360 380 400 420
Operation temperature rC)
Figure 7. U2S removal efficiency (ri) and gas transfer unit height (//Ik; t for different operation temperatures (m(; = 0.258 kg/(m' s); nit - 3.860 kg/(m2 s)).
SnS into tin becomes an important rate-controlling factor for an increased amount of S (SnS) due to higher II2S concentra- tions.
3.4. Effect of Operating Temperature. Figure 7 shows the effect of operating temperature ranging from 300 to 400 °C. The gas and tin flow rates were fixed at 0.258 and 3.860 kg/ (ml s), respectively, with an inlet 112S concentration of 1000 ppm. H( decreased from 0.133 at 300 °C to 0.084 at 400 C. The desulfurization became efficient at high temperatures because the increase in the mass transfer and reaction rates is larger than the increase in the gas velocity. However, the effect of thermal equilibrium becomes significant at higher tempera- tures with high 112/H2S ratios, as discussed in the next section.
3.5. Discussion on Further Investigations. 3.5.1. Theoreti- cal limits of Desulfurization Efficiency and Tin Regeneration. Higher temperatures are expected to increase the mass transfer and reaction rate of 112S while reducing the viscosity of liquid tin. It does not cause a problem with the volatility of liquid tin, but the desulfurization efficiency at high temperatures would be limited by thermal equilibrium. Figure 8 shows the variation of Gibbs free energy for the desulfurization reaction (reaction RI: H2S(g) + Sn(1) -- SnS(s) + 112(g)), based on Sehürmann's study. 13 Negative Gibbs free energy favors the forward reaction, and vice versa. This suggests that higher temperatures and a higher partial pressure ratio of 112/1 I'S shifts the reaction toward H2S formation. Especially at high 112/I12S ratios or higher desulfurization efficiencies, the dependence on temperature becomes very significant. At a typical 112 concentration of 30%.

-60
-40
E -20
T 0
20
0 40
I Forward reaction favoured
10 loo
Pt+,. c
1000
! 0000 ------ ------------------------ ----
-az -550' -780'C
60 +i 300 400 500 600 700 800
Temperature (°C)
Figure 8. Variation of Gibbs free energy for the dcsulfurization reaction of tin by H2/H2S ratio and temperature.
for example, temperatures below 550 °C can reduce the HZS
concentration theoretically to 30 ppm (PH, /Puts = 1000) if the SnS concentration is sufficient in the liquid tin. Therefore, it is
essential to suppress the backward reaction by removing SnS in the tin introduced at the top of the counterflow reactor. The dissolved level of SnS can be minimized through the regenera- tion process using zinc presented in reaction R2. Warner",
proposed an external regeneration in a fluidized bed where coarse granular ZnS can be grown on seeds of fine ZnS. The coarse ZnS can be readily separated from the liquid tin. Investigations are required on the theoretical limits and the tin regeneration process.
3.5.2. Interaction with Other Gas Species. Liquid tin is fairly reactive, and therefore other gas components in fuel gases may react with tin. [ledges 26 reported that tin does not react directly with U2, N2, or NH;. However, it reacts with H20, CO2, and IICI. First, tin can be oxidized by steam to form solid oxides, which causes the loss of tin. 26,27
Sn(1) + 2H2O(g) -Sn02(s) + 2H, (g)
This reaction depends on the H2O/HZ ratio and temperature. Temperatures above 500 °C are required to prevent Sn02 dross formation for very wet fuel gases. 27
IICI can react with the liquid tin to form chlorides which are volatile (low melting and boiling points) and therefore will condense to aerosols when cooled in heat exchangers. However, coal typically has a low Cl content, and therefore high H2/HCl ratios will suppress the reaction of tin with HCI.
Tin reacts with CO2 at high temperatures to form tin oxide. 26
Sn(1) + 2CO2(g) - SnO2(s) + 2CO(g)
Niesel and Sigurdardottirzn reported that the forward reaction is favored at temperatures of 350-500 °C with equal proportions of CO2 and CO. I lowever, fuel gases typically have higher CO
concentration than C02, which would suppress the formation
of SnO2. From experimental investigation in a double-stirred
reactor, I ledden et al. 14 reported that the gas components such as CO and CO2 did not influence the degree of U2S conversion to SnS, although tested gas concentrations were not specified. The same study also reported that the reaction rate for COS at 500 °C was about 3 times smaller than that for F12S.
From the current experimental investigation, a very thin film
of shiny yellow SnS2 was identified on part of the liquid surface
Backward macoon favoured
from tin collected after the scrubber was cooled down, while tin containing SnS lost its shine and became dull. The lbrmation of SnS2 is presumably with the following sur(äce reaction of SnS with H2S:
H, S(g) + SnS(s) - SnS7(s) + li, (g)
3.5.3. Further Investigations. The test results presented here show the good potential of this new desulfurization system. However, further fundamental investigations are required on various aspects including wider ranges of test parameters including gas and liquid flow rates, temperature, pressure, and test duration. The capability for particle/tar removal should be also studied in order to fully exploit the potential of this technology. Our initial trials with glass powders showed that heavy dust loading may clog the bottom of the reactor where the dust is introduced and then mix with the liquid tin. Therefor:, this scrubber should be employed after a primary particle removal device.
4. Conclusions
The absorption behavior of il2S in a novel liquid tin irrigated hot gas scrubber was investigated for various operation param- eters in a lab-scale packed bed. Hoi; values ranged from 0.94 to 0.181 m for tested conditions at 1000 ppm 112S concentration, which showed the good potential of this system for efficient desulfurization. High liquid velocities increased the removal efficiency due to larger liquid holdup creating larger interfacial area. Increased gas velocities influenced the removal efficiency by altering the gas residence times, liquid holdup, and gas-phase mass transfer. The Hex; of an empty column was about 5 times higher at the tested conditions due to lack of contact between the two phases. The Hoc; gradually reduced for increased 112S concentrations or at lower operating temperatures. Further fundamental studies are required on various aspects of this scrubber, especially for higher gas and liquid velocities and operating temperatures. Regeneration of tin should be also investigated, which is essential for high I12S removal efficiencies at high H2/H2S ratios. It is also anticipated that electromagnetic or mechanical pumps would be used to circulate the tin in an industrial environment.
Acknowledgment
The authors wish to acknowledge the financial support 16r this research program from the United Kingdom Engineering and Physical Sciences Research Council (EPSRC) and the Malaysian Government.
Nomenclature
N((; = number of transfer units Ham; = height of the gas-phase transfer unit, in Z= total column height, m K� = overall mass transfer coefficient, m/s ae = effective specific interfacial area, m'/m3 ap = packing specific surface area (see Table 3), m2/m3 k= reaction or mass transfer rate, m/s g= gravitational acceleration, m/s2 in = mass flow rate, kg/m2 s u= velocity, m/s y= 112S concentration, kmol/m}
., = coordinate along the vertical direction, m

PAGE EST: 6.6
Greek Symbols
c= porosity, m'/m3 r/ = 112S removal efficiency, %
p= dynamic viscosity, kg/m s p= density, kg/m'
SuhscripLs
G= gas phase L= liquid phase e= equilibrium in = inlet r= reaction out = outlet
Literature Cited
(1) William, B. C.; McMullan, J. T. Hot gas chemical clean-up: current commercial and technological status; R139; UK DTI's Coal Research and Development Programme; Harwell Energy Technology Support Unit, 1998.
(2) ETSU. Hot gas chemical cleanup; TSR 006; Harwell, Energy Technology Support Unit, 1998.
(3) Mitchell, S. C. Hot gas cleanup of sulfur, nitrogen, minor and trace elements; CCC/12; IFA Coal Research, London, 1998.
(4) DOE (Department of Energy). Texaco gasifier IGCC base cases; Report No. PED-IGCC-98-001 (rev 1), issued by Office of Systems Engineering and Analysis, U. S., 1998.
(5) Gangwal, S. K.; Gupta, G.; McMichael, W. J. Hot-gas cleanup-
sulfur recovery technical, environmental and economic issues. Heat
Recovers Svst. CHP 1995,15,205-214-
(6) Chang, B. F. A non-wetting packed bed gas scrubber. Ph. D. Thesis, University of Sheffield, U. K., 2003.
(7) Adänez, J.; Abad, A.; Garcia-Labiano, F.; de Diego, L. F.; Gayän, P. 112S retention with Ca-based sorbents in a pressurized fixed-bed reactor: application to moving-bed design. Fuel 2005,84,533-542.
(8) Bu, X.; Ying, Y.; Ji, X.; Zhang, C.; Peng, W. New development of zinc-based sorbents for hot gas desulfurization. Fuel Process. Technol. 2007, 88,143-147.
(9) Park, N.; Lee, D.; Jun, J.; Lee, J.; Ryu, S. 0.; Lee, T. J.; Kim, J.; Chang, C. H. Two-stage desulfurization process for hot gas ultra cleanup in IGCC. Fuel 2006,85,227-234.
(10) Turk, B. S.; Merkel, T.; Lopez-Ortiz, A.; Gupta, R. P.; Portier, J. W.; Krishnan, G. N.; Freeman, B. D.; Fleming, G. K. Novel technologies
Jar gaseous contaminants control; DOE Contract No. DE-AC26-99FT40675; DOE, U. S., 2001.
(11) Meissner, H. P. (Institute of Gas Technology). Removal of hydrogen
sulfide from reducing gases. U. S. Patent 3,954,938,1976.
c: (12) Meissner, H. P.; Shora, F. C. (Institute of Gas Technology). High
temperature pollutant removal from gas streams. U. S. Patent 4,308,037, 1991.
(13) Schür rann, H. Studies of gas purification by liquid materials and development of an appropriate method. Fortsehr. -Ber. ID/ Z. Reihe 1 Ver/ahrenstech. 1984, No. 115.
(14) Hcdden, K.; Rao, B. R. Desulfuriration of manufitctured gases with liquid metals. In Proceedings of the 1986 International Gas Resear( h Conference, Toronto, Ontario, Canada, 1986.
(I5) Warner, N. A. Zinc-hated clean technology for desul/uri-ation in
advanced power generation; R127; UK DTI's Coal Research and Develop-
ment Programme, Harwell, Energy Technology Support Unit, 1997. (16) Warner, N. A. Personal communication: theoretical framework For
liquid metal based coal gasification (draft)--Feb 23,2(K)O; cited in ref 6. (17) Warner, N. A. Personal communication: theoretical framework lür
liquid metal based coal gasification (draft)-April 25 200l; cited in ref h. (18) CRC Handbook of Chemistry and Physics, 86th cd.; Lide, 1). R.,
Ed.; CRC Press: Boca Raton, FL, 2005; p 6-15. (19) Chang, B. F.; Sharifi, V. N.; Swithenbank, J.; Warner, N.
Development of a liquid metal based fuel gas scrubbing system. In Proceedings of the 5th International Symposium on Gas Cleaning at High Temperaturre, Sept 17-20,2002, Morgantown, WV.
(20) Nogi, K. Wettability of solid oxides by liquid pure metals. J... Jpn Inst. Met. 1988,52,72-78.
(21) Calvert, S.; (ioldschmid, 1.; Leith, D.; Mehta, D. O'er &'ruhhvi System Study. Vol. 1, Scrubber Handbook; EPA-R2-72-118a; U. S. Envi- ronmental Protection Agency, 1972.
(22) Strigle, R. F. Packed tower designs and applications - random and structured packings, 2nd ed.; Gulf Publishing Company: Houston, 1994.
(23) Standish, N. Heat transfer in liquid metal irrigated packed beds
countercurrent to gases. Trans. Metall. Soc. 4/ME 1968,242,1733- 1740. (24) Mackey, P. J.; Warner, N. A. Studies in the vaporiuttion of'rnercury
in irrigated packed beds. Chem. Frig. Sei. 1973,2ö (12), 2141-2154. (25) Standish, N. On the flooding criteria for liquid metals. ('hem. Engle
Sci. 1973,28 (10), 1906-1907. (26) Tin and its allcrvr Hedges, F, S., Ed.; Edward Arnold Ltd.: London,
1960. (27) Nielsen, P. E. H.; Sigurdardottir, 1. D. Development and chanrc-
terization of steam regenerable sorbents for hot gas desulphurization in coal gasification based combined cycle plant. In Gas Cleaning At high Temperatures; Clift, R., Seville, J. P. K., Eds.; Blackie Academic & Professional: Glasgow, 1993.
Received . fin- review April 3,2(1)7
Revised manuscript received August 17,2(1)7 Accepted October 4,2(1)7
I10704Rn4
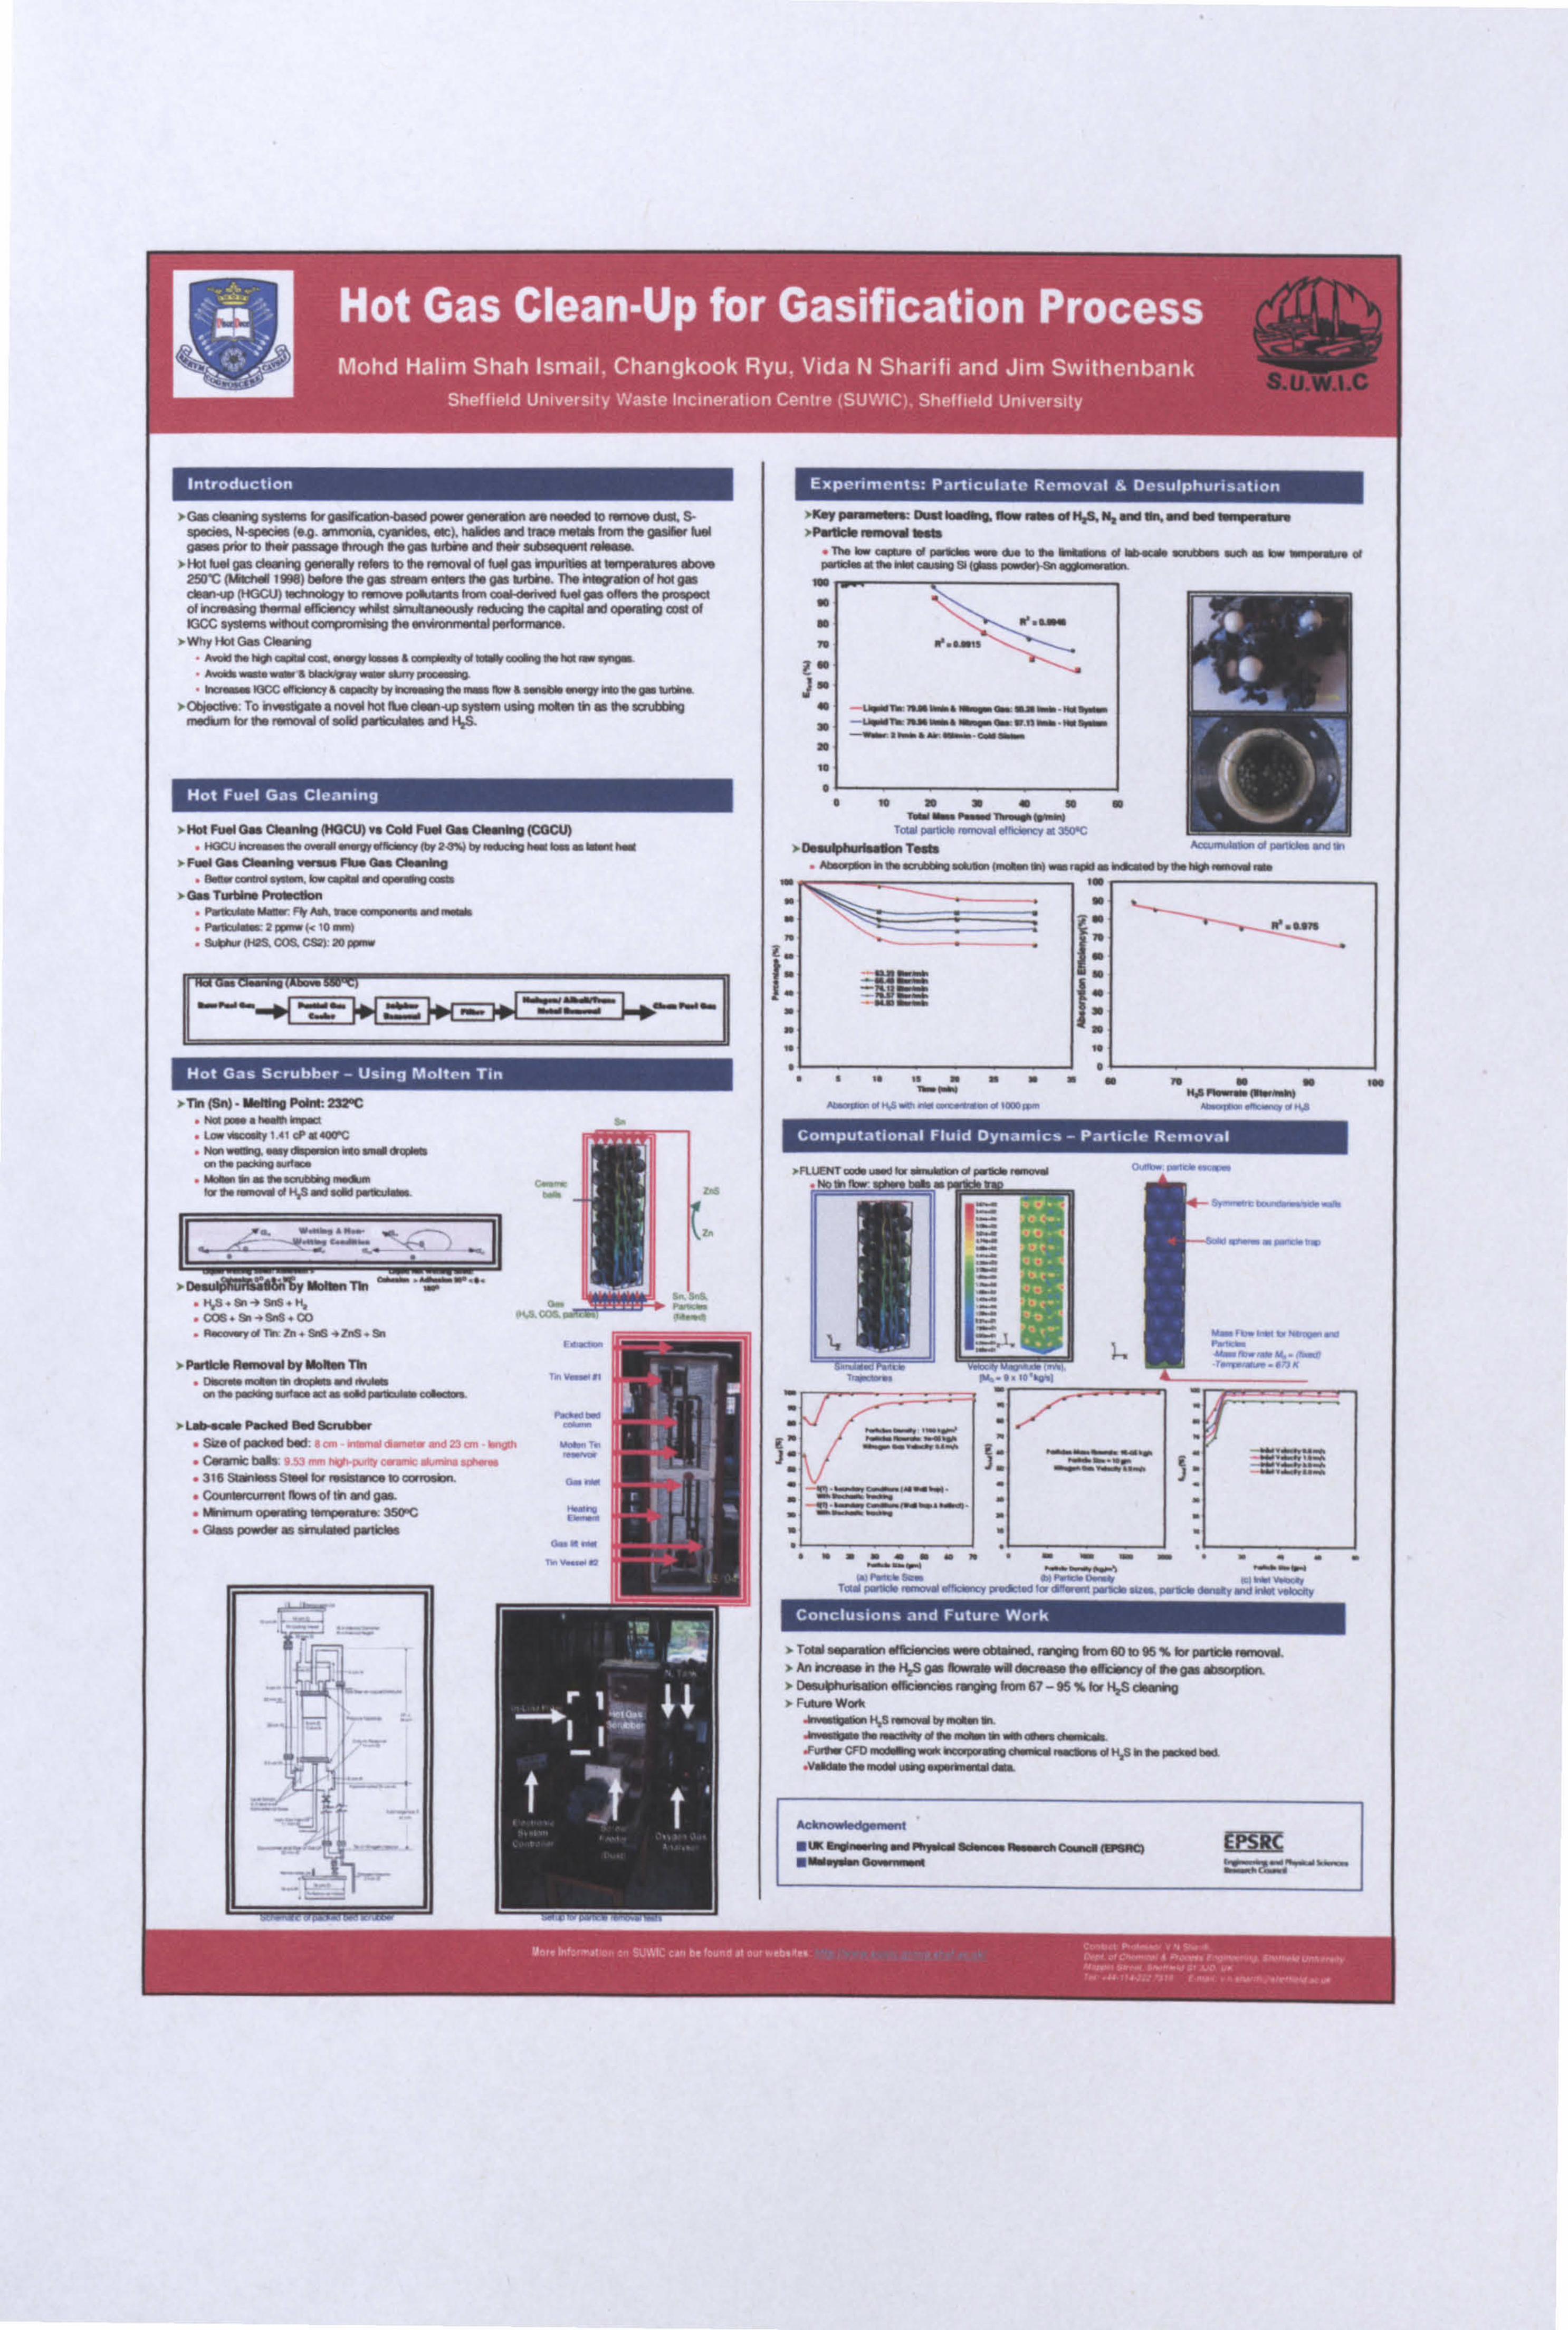
>Gwcl\Yiilp srslne brgWi'ý-0aW p0o 9rwln a0 naad0 0m 10w. S. aparin. N-epecise (eQ. anncnw cvanodaa et), ha th wId ta ms4W km ft pWir WM 9ý Mop W Ni powage /Ilaph ft gm u. Nw nM Ni wbaepusol EM.. .
> Nd kW pro daslry qw mMj W- b IM n ooo of bN ;- m4o04 r lartp W- ab- 250C(hi"I998)boir Mgam e ft pas ut .. The Mp' b4 of MI p� CMn W (HGCU) .. obey b- poh. O No owl-Ariv\E Io W ollen 10 pppaq of ilawip Nio dNo, cy whht alminrady . o10 p ft C WW arid opwamp Cod of IWC aystamo wd WcV mnd*4 M -wonme pd puto4o 4o .
> Mhy Nol Gn Ckrnp
" awtlM 44Q X41mt. r10th \mry1nM al Vlr/pooiq w141rýryýp.
"a. _wrs0 V47. *nIn a "wwKifx. nrrty! no. elv Ey th0 Qe. 0 nw. a.. wer... prboar Yr YMh.
>Oblecew: TonoNepaa, a flood Pod Ilwd4 opopaw uwkq ndm öl=ft eml... -a- ow I. --, W of eofd D/\ýWaa Ni N'S.
> Ho F.. 1 Or CW Nq CCM w coM F Nl Or CY.. mg (COcU
. IKicu: ow uý owýl1`+wrýi M aatY M ýW Mr br r Ywy br > FW Or CbrýYq wrr Rw fiMf OrýYq
. eýmw ca1na ýrý, bý opd ýN mýýMV mm > 0» Tu'OYr Pml cO n
"P th . Nrr. R/ f to mipurr rO ý
" V. V. 9- 2-k 10 wn) " suw. Ms, coa =) . Nor
HTh (SW - Mw Pof: 22C .N -"nrn ties
l -My I41cPrIG6'C
. Nan waYi0. ý"D'ý. im Iwe "nr OOOW m Vrp.
_ "wta
. HynF -0 d al /y, 4 ýd 01, S &W uNd b Vw ! pýbJW..
. n.. WoVra ilbrrolesrn o.. r ....
. Cab. 9i . s, 5. CO
.P*. R. -ml by M~ 7%
. 1.6.. 01. r.. Wd BW Smae..
. S4. olp. MMEO0l..., ý ........ e. ýýn�e aýýa la ým C, H CW icEW ti. Qamw awýýa sonar
". aa 316 SMOd-Srdbl, aoi1 Cokvt 6owa of tin and pr.
. GMn vow4 eM 100 pwOcW
`,,; ý _..
=ýý
_' :I w. _ .ý
ý_ý
F::
Experiments: Particulate Removal & Desulphurisation
K" V.. -...: Due X0.. 11" nr of MA w.. W.,. M b0.....
. Tn. n. opt.. a aý ... m. W e. I. .n ii sPa er 10+w C. -O 1010- w. d. 1ý+YYaýrýlm
tr
ýw Ja
w s
w.... V...,.
"wss-: W.. 40
w
rav wn. ie re. a. ei rndw.. T r xwc D**ulOW,, I- Tomb
.. e.. aa, ti+.. uýeew.. w"., nw. ý rý.... sýa r. ýau.. a w. ua ý. no. r n..
-gi C: r
s s
w. r. nqýa ýs. m. +s eý. w. aný®mm . u. ý. ns.. ý+rn n«s
vRL NTm6 X04 vYnYtll .d Výmýww1 ý"r ". r" 1b. lbr.
_ ---. vMZd rmt nr. rnue. rt
;w -Y. rý. nrrýrw
*ar w1K+e rear wnosry nea-oa n
iýw wem. o. rd. wýwr Ye wV.
earny r
Conclusions and Future Work
>TaW sýprýYVýMMivrir wwýaMYrO. wiV9 fro $Db%%brp 9c ýsrovýl. > Mnvýrh IM H$qr Is. n ri tlraý sM Mfiryrw. yd . pr ýdpbn > Dý. +aýý.. lion. IFCený+ý mp: y $om $T -ss xa HrS Wr+ýo >F* wens
Jwýlb11ý M ýdMiy dh nidlýý III �w dlý tlr4FaLL
CFD ngOipwM YWpvrnp dwFr ný. bý d 1t$ ti M Vý0lý6 . VrOýYM inotld wiV ýPýd EY
"cknO l. dgsm. nt USE
Related Documents


