Hospital Survey on Patient Safety Culture: 2018 User Database Report Part II: Appendix A—Results by Hospital Characteristics Appendix B—Results by Respondent Characteristics Part III: Appendix C—Trending Results by Hospital Characteristics Appendix D—Trending Results by Respondent Characteristics Prepared for: Agency for Healthcare Research and Quality U.S. Department of Health and Human Services 5600 Fishers Lane Rockville, MD 20857 www.ahrq.gov Contract No. HHSA 290201300003C Managed and prepared by: Westat, Rockville, MD Theresa Famolaro, M.P.S., M.S., M.B.A. Naomi Dyer Yount, Ph.D. Ryan Hare Shakia Thornton Kristi Meadows Lei Fan M.D., Ph.D. Rebecca Birch M.P.H Joann Sorra, Ph.D. AHRQ Publication No. 18-0025-EF March 2018

Welcome message from author
This document is posted to help you gain knowledge. Please leave a comment to let me know what you think about it! Share it to your friends and learn new things together.
Transcript

Hospital Survey on Patient Safety Culture: 2018 User Database Report Part II: Appendix A—Results by Hospital Characteristics
Appendix B—Results by Respondent Characteristics
Part III: Appendix C—Trending Results by Hospital Characteristics
Appendix D—Trending Results by Respondent Characteristics
Prepared for:
Agency for Healthcare Research and Quality U.S. Department of Health and Human Services 5600 Fishers Lane Rockville, MD 20857 www.ahrq.gov
Contract No. HHSA 290201300003C
Managed and prepared by:
Westat, Rockville, MD
Theresa Famolaro, M.P.S., M.S., M.B.A. Naomi Dyer Yount, Ph.D. Ryan Hare Shakia Thornton Kristi Meadows Lei Fan M.D., Ph.D. Rebecca Birch M.P.H Joann Sorra, Ph.D.
AHRQ Publication No. 18-0025-EF March 2018

ii
This document is in the public domain and may be used and reprinted without permission except those copyrighted materials noted for which further reproduction is prohibited without specific permission of copyright holders.
Suggested Citation:
Famolaro T, Yount ND, Hare, R, et al. Hospital Survey on Patient Safety Culture 2018 Database Report, Appendixes, Parts II and III (Appendixes for AHRQ Publication No.18-0025-EF). (Prepared by Westat, Rockville, MD, under contract No. HHSA290201300003C). Rockville, MD: Agency for Healthcare Research and Quality; March 2018.
Surveys on Patient Safety Culture™ and SOPS™ are registered trademarks of AHRQ.
The authors of this report are responsible for its content. Statements in the report should not be construed as endorsement by the Agency for Healthcare Research and Quality or the U.S. Department of Health and Human Services.
No investigators have any affiliations or financial involvement (e.g., employment, consultancies, honoraria, stock options, expert testimony, grants or patents received or pending, or royalties) that conflict with material presented in this report.
iii
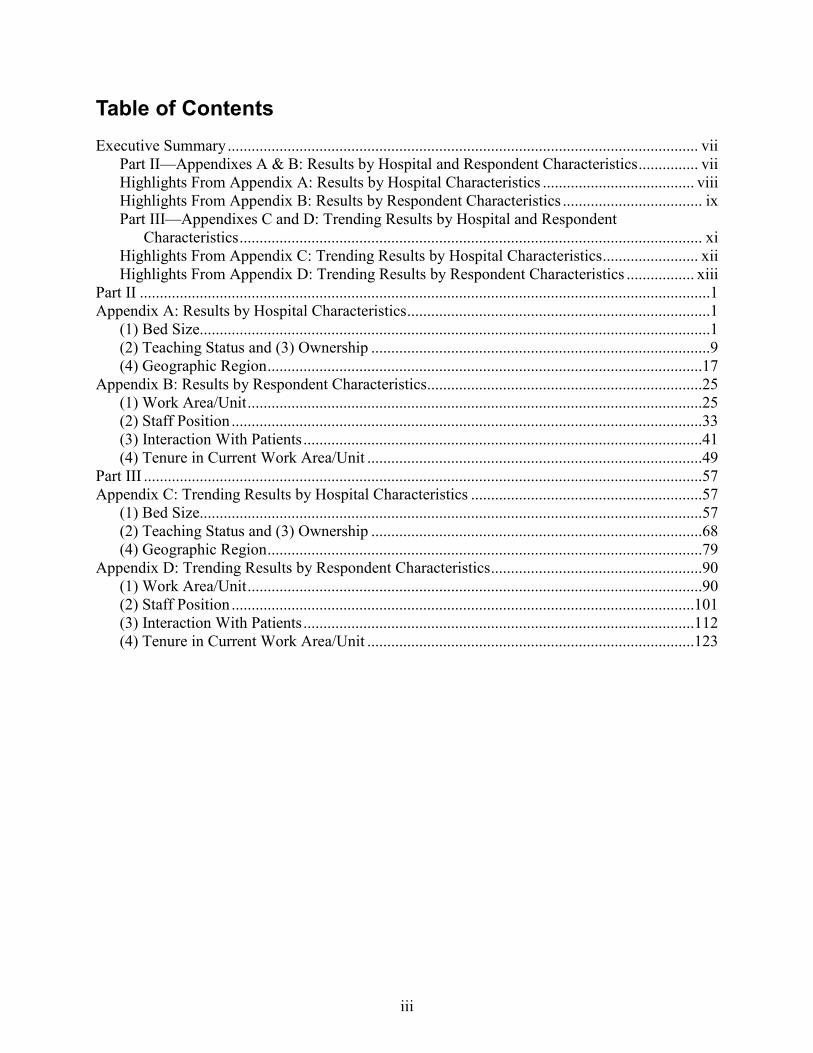
Table of Contents Executive Summary ...................................................................................................................... vii
Part II—Appendixes A & B: Results by Hospital and Respondent Characteristics ............... viiHighlights From Appendix A: Results by Hospital Characteristics ...................................... viii Highlights From Appendix B: Results by Respondent Characteristics ................................... ix Part III—Appendixes C and D: Trending Results by Hospital and Respondent
Characteristics .................................................................................................................... xiHighlights From Appendix C: Trending Results by Hospital Characteristics ........................ xii Highlights From Appendix D: Trending Results by Respondent Characteristics ................. xiii
Part II ...............................................................................................................................................1Appendix A: Results by Hospital Characteristics ............................................................................1
(1) Bed Size................................................................................................................................1(2) Teaching Status and (3) Ownership .....................................................................................9(4) Geographic Region .............................................................................................................17
Appendix B: Results by Respondent Characteristics .....................................................................25(1) Work Area/Unit ..................................................................................................................25(2) Staff Position ......................................................................................................................33(3) Interaction With Patients ....................................................................................................41(4) Tenure in Current Work Area/Unit ....................................................................................49
Part III ............................................................................................................................................57Appendix C: Trending Results by Hospital Characteristics ..........................................................57
(1) Bed Size..............................................................................................................................57(2) Teaching Status and (3) Ownership ...................................................................................68(4) Geographic Region .............................................................................................................79
Appendix D: Trending Results by Respondent Characteristics .....................................................90(1) Work Area/Unit ..................................................................................................................90(2) Staff Position ....................................................................................................................101(3) Interaction With Patients ..................................................................................................112(4) Tenure in Current Work Area/Unit ..................................................................................123

iv
List of Tables Table 1. Example of Decrease in Average Score Over Time (Negative Change) ......................... xiTable 2. Example of Increase in Average Score Over Time (Positive Change) ............................ xiTable A-1. Composite-Level Average Percent Positive Response by Bed Size – 2018 Database
Hospitals ....................................................................................................................................2Table A-2. Item-Level Average Percent Positive Response by Bed Size – 2018 Database
Hospitals ....................................................................................................................................3Table A-3. Average Percentage of Respondents Giving Their Work Area/Unit a Patient Safety
Grade by Bed Size – 2018 Database Hospitals ..........................................................................7Table A-4. Average Percentage of Respondents Reporting Events in the Past 12 Months by
Bed Size – 2018 Database Hospitals .........................................................................................8Table A-5. Composite-Level Average Percent Positive Response by Teaching Status and
Ownership– 2018 Database Hospitals .....................................................................................10Table A-6. Item-Level Average Percent Positive Response by Teaching Status and Ownership–
2018 Database Hospitals ..........................................................................................................11Table A-7. Average Percentage of Respondents Giving Their Work Area/Unit a Patient Safety
Grade by Teaching Status and Ownership – 2018 Database Hospitals ...................................15Table A-8. Average Percentage of Respondents Reporting Events in the Past 12 Months by
Teaching Status and Ownership – 2018 Database Hospitals ...................................................16Table A-9. Composite-Level Average Percent Positive Response by Geographic Region –
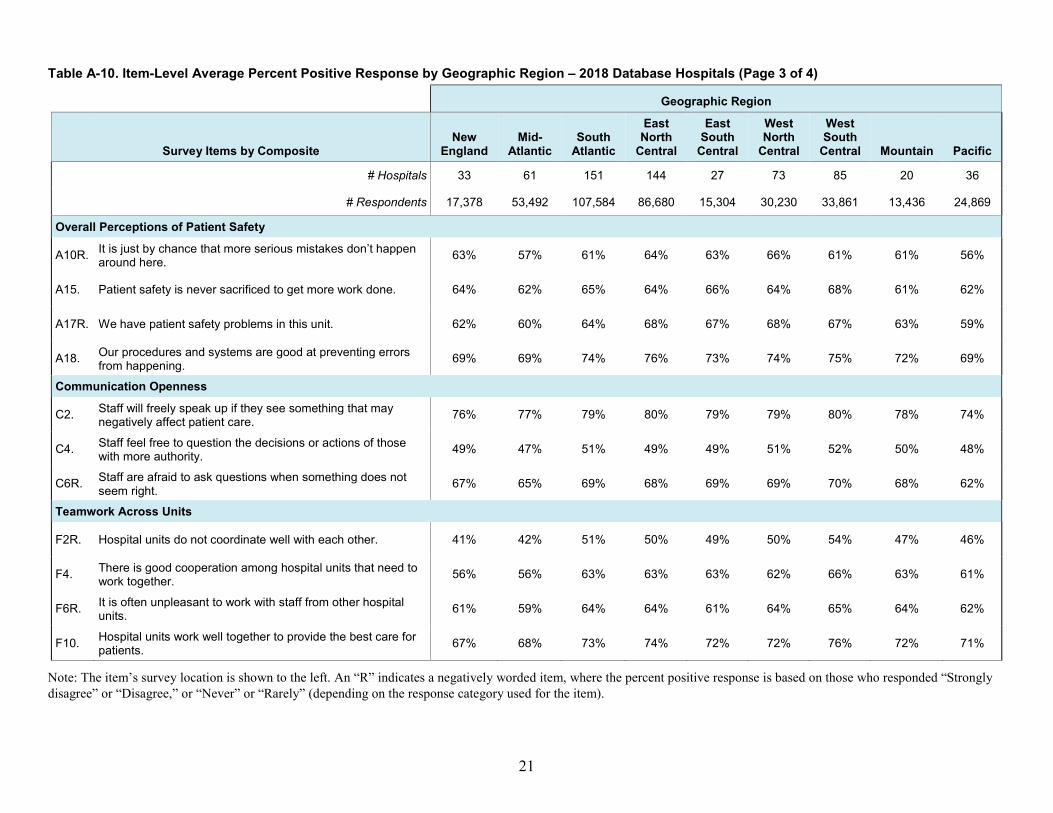
2018 Database Hospitals ..........................................................................................................18Table A-10. Item-Level Average Percent Positive Response by Geographic Region – 2018
Database Hospitals ...................................................................................................................19Table A-11. Average Percentage of Respondents Giving Their Work Area/Unit a Patient
Safety Grade by Geographic Region – 2018 Database Hospitals............................................23Table A-12. Average Percentage of Respondents Reporting Events in the Past 12 Months by
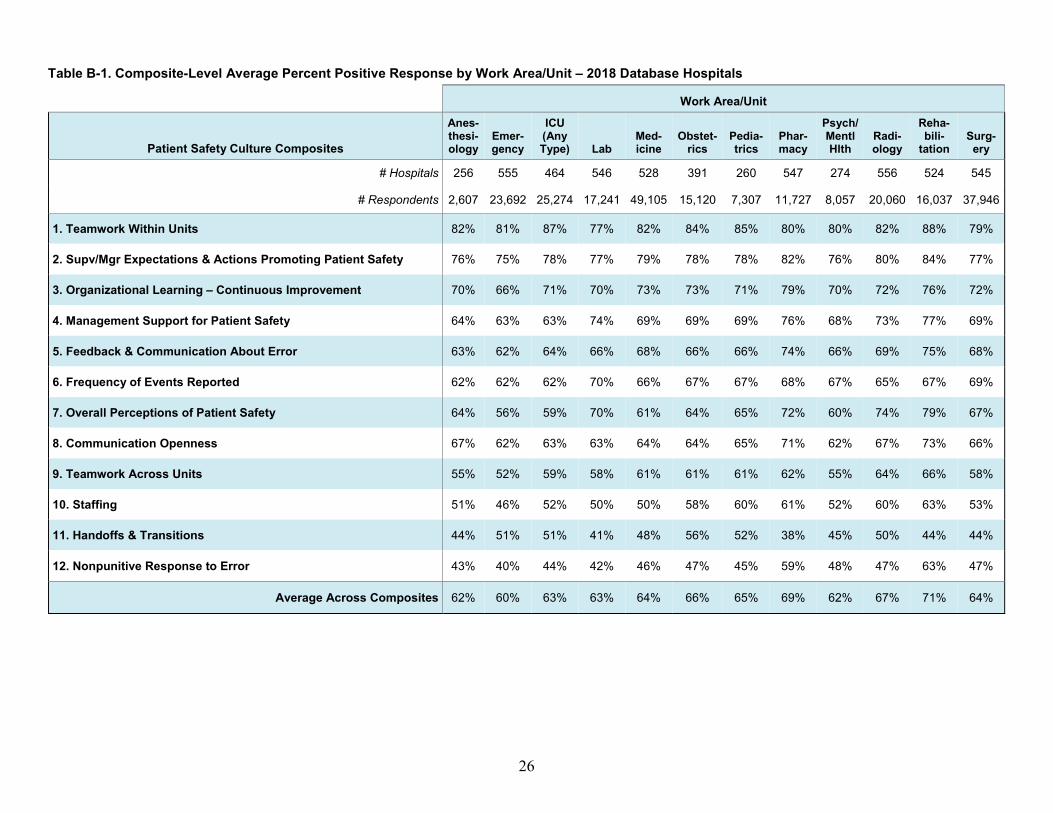
Geographic Region – 2018 Database Hospitals .......................................................................24Table B-1. Composite-Level Average Percent Positive Response by Work Area/Unit – 2018
Database Hospitals ...................................................................................................................26Table B-2. Item-Level Average Percent Positive Response by Work Area/Unit – 2018
Database Hospitals ...................................................................................................................27Table B-3. Average Percentage of Respondents Giving Their Work Area/Unit a Patient Safety
Grade by Work Area/Unit – 2018 Database Hospitals ............................................................31Table B-4. Average Percentage of Respondents Reporting Events in the Past 12 Months by
Work Area/Unit – 2018 Database Hospitals ............................................................................32Table B-5. Composite-Level Average Percent Positive Response by Staff Position – 2018
Database Hospitals ...................................................................................................................34Table B-6. Item-Level Average Percent Positive Response by Staff Position – 2018 Database
Hospitals ..................................................................................................................................35Table B-7. Average Percentage of Respondents Giving Their Work Area/Unit a Patient Safety
Grade by Staff Position – 2018 Database Hospitals ................................................................39Table B-8. Average Percentage of Respondents Reporting Events in the Past 12 Months by
Staff Position – 2018 Database Hospitals ................................................................................40Table B-9. Composite-Level Average Percent Positive Response by Interaction With Patients –
2018 Database Hospitals ..........................................................................................................42

v
Table B-10. Item-Level Average Percent Positive Response by Interaction With Patients – 2018 Database Hospitals ..........................................................................................................43
Table B-11. Average Percentage of Respondents Giving Their Work Area/Unit a Patient Safety Grade by Interaction With Patients – 2018 Database Hospitals ...................................47
Table B-12. Average Percentage of Respondents Reporting Events in the Past 12 Months by Interaction With Patients – 2018 Database Hospitals ..............................................................48
Table B-13. Composite-Level Average Percent Positive Response by Tenure in Current Work Area/Unit – 2018 Database Hospitals ......................................................................................50
Table B-14. Item-Level Average Percent Positive Response by Tenure in Current Work Area/Unit – 2018 Database Hospitals ......................................................................................51
Table B-15. Average Percentage of Respondents Giving Their Work Area/Unit a Patient Safety Grade by Tenure in Current Work Area/Unit – 2018 Database Hospitals ...................55
Table B-16. Average Percentage of Respondents Reporting Events in the Past 12 Months by Tenure in Current Work Area/Unit – 2018 Database Hospitals ..............................................56
Table C-1. Trending: Composite-Level Average Percent Positive Response by Bed Size – 2018 Database Hospitals ..........................................................................................................58
Table C-2. Trending: Item-Level Average Percent Positive Response by Bed Size – 2018 Database Hospitals ...................................................................................................................60
Table C-3. Trending: Average Percentage of Respondents Giving Their Work Area/Unit a Patient Safety Grade by Bed Size – 2018 Database Hospitals ................................................66
Table C-4. Trending: Average Percentage of Respondents Reporting Events in the Past 12 Months by Bed Size – 2018 Database Hospitals .....................................................................67
Table C-5. Trending: Composite-Level Average Percent Positive Response by Teaching Status and Ownership – 2018 Database Hospitals .............................................................................69
Table C-6. Trending: Item-Level Average Percent Positive Response by Teaching Status and Ownership – 2018 Database Hospitals ....................................................................................71
Table C-7. Trending: Average Percentage of Respondents Giving Their Work Area/Unit a Patient Safety Grade by Teaching Status and Ownership – 2018 Database Hospitals ............77
Table C-8. Trending: Average Percent Positive of Respondents Reporting Events in the Past 12 Months by Teaching Status and Ownership – 2018 Database Hospitals............................78
Table C-9. Trending: Composite-Level Average Percent Positive Response by Geographic Region – 2018 Database Hospitals ..........................................................................................80
Table C-10. Trending: Item-Level Average Percent Positive Response by Geographic Region – 2018 Database Hospitals ..........................................................................................................82
Table C-11. Trending: Average Percentage of Respondents Giving Their Work Area/Unit a Patient Safety Grade by Geographic Region – 2018 Database Hospitals ...............................88
Table C-12. Trending: Average Percentage of Respondents Reporting Events in the Past 12 Months by Geographic Region – 2018 Database Hospitals ....................................................89
Table D-1. Trending: Composite-Level Average Percent Positive Response by Work Area/ Unit – 2018 Database Hospitals ...............................................................................................91
Table D-2. Trending: Item-Level Average Percent Positive Response by Work Area/Unit – 2018 Database Hospitals ..........................................................................................................93
Table D-3. Trending: Average Percentage of Respondents Giving Their Work Area/Unit a Patient Safety Grade by Work Area/Unit – 2018 Database Hospitals.....................................99
Table D-4. Trending: Average Percentage of Respondents Reporting Events in the Past 12 Months by Work Area/Unit – 2018 Database Hospitals .......................................................100

vi
Table D-5. Trending: Composite-Level Average Percent Positive Response by Staff Position – 2018 Database Hospitals ........................................................................................................102
Table D-6. Trending: Item-Level Average Percent Positive Response by Staff Position – 2018 Database Hospitals ........................................................................................................104
Table D-7. Trending: Average Percentage of Respondents Giving Their Work Area/Unit a Patient Safety Grade by Staff Position – 2018 Database Hospitals .......................................110
Table D-8. Trending: Average Percentage of Respondents Reporting Events in the Past 12 Months by Staff Position – 2018 Database Hospitals ............................................................111
Table D-9. Trending: Composite-Level Average Percent Positive Response by Interaction With Patients – 2018 Database Hospitals ..............................................................................113
Table D-10. Trending: Item-Level Average Percent Positive Response by Interaction With Patients – 2018 Database Hospitals .......................................................................................115
Table D-11. Trending: Average Percentage of Respondents Giving Their Work Area/Unit a Patient Safety Grade by Interaction With Patients – 2018 Database Hospitals .....................121
Table D-12. Trending: Average Percent Positive of Respondents Reporting Events in the Past 12 Months by Interaction With Patients – 2018 Database Hospitals.....................................122
Table D-13. Trending: Composite-Level Average Percent Positive Response by Tenure in Current Work Area/Unit – 2018 Database Hospitals ............................................................124
Table D-14. Trending: Item-Level Average Percent Positive Response by Tenure in Current Work Area/Unit – 2018 Database Hospitals ..........................................................................126
Table D-15. Trending: Average Percentage of Respondents Giving Their Work Area/Unit a Patient Safety Grade by Tenure in Current Work Area/Unit – 2018 Database Hospitals .....132
Table D-16. Trending: Average Percentage of Respondents Reporting Events in the Past 12 Months by Tenure in Current Work Area/Unit – 2018 Database Hospitals ..........................133

vii
Executive Summary Part II—Appendixes A & B: Results by Hospital and Respondent Characteristics Appendixes A and B present data tables that show average percent positive scores on the survey composites and items across database hospitals broken down by the following hospital and respondent characteristics:
Appendix A: Results by Hospital Characteristics
• Bed size• Teaching status• Ownership• Geographic region
Appendix B: Results by Respondent Characteristics
• Work area/unit• Staff position• Interaction with patients• Tenure in current work area/unit
Highlights from these results were presented in the main body of the report, Part I: User Database Report, at the end of Chapter 6 and are also shown on the next three pages. Highlights were based on results for the 12 patient safety culture composites, patient safety grade, and number of events reported. In the bottom row of the composite-level tables, an overall average across composites is shown as a summary statistic when comparing across breakout categories.
Comparing Your Results You can compare your hospital’s percent positive scores on the patient safety culture composites and items against the averages shown in Appendix A for hospitals with your same bed size, teaching status, ownership, and geographic region. You can also compare your scores against the averages for hospitals that are part of a healthcare system and hospitals that are not part of a healthcare system. You can use a 5 percentage point difference as a rule of thumb for determining which differences to focus on.
To compare your hospital’s results against Appendix B, your hospital will have to compute percent positive scores on the safety culture composites and items broken down by work area/unit, staff position, interaction with patients, and tenure in current work area/unit. You can then compare your hospital’s percent positive scores against the averages shown in the tables. Again, you can use a 5 percentage point difference as a rule of thumb.

viii
Highlights From Appendix A: Results by Hospital Characteristics
Bed Size (Tables A-1, A-3)
• Hospitals with the smallest bed size (6–24 beds) had the highest average percent positive across all composites (71 percent positive); hospitals with the largest bed size (500 or more beds) had the lowest (61 percent positive).
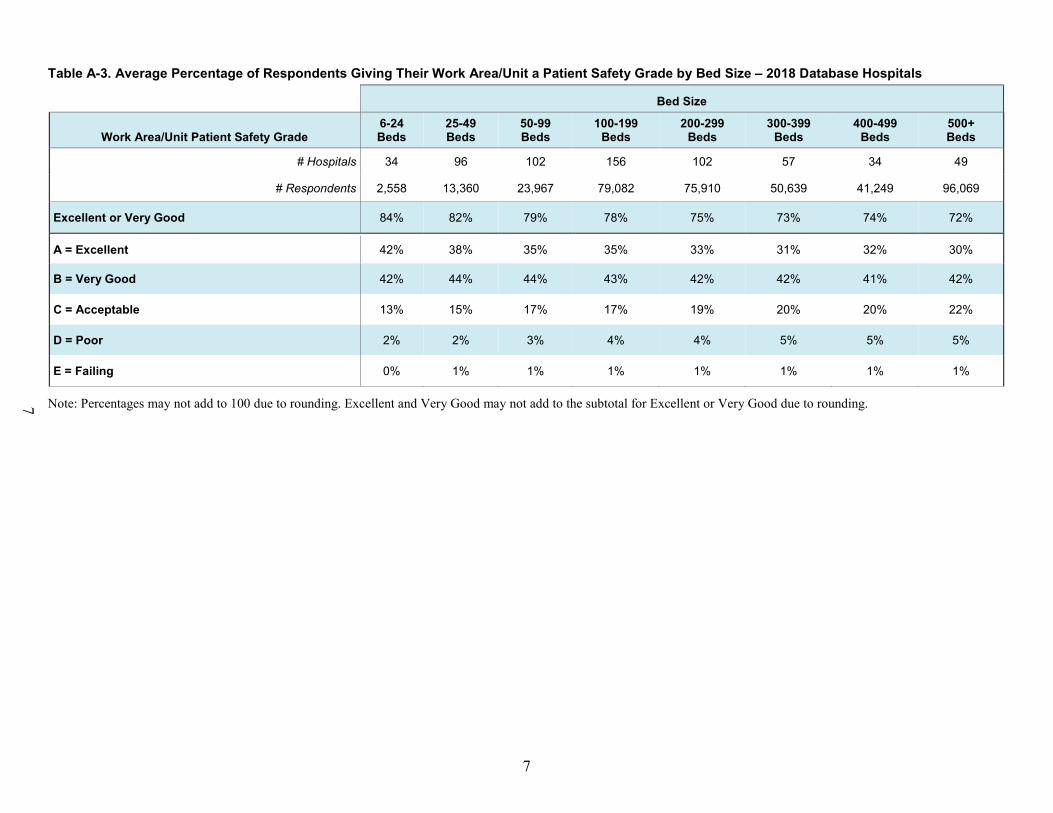
• Hospitals with the smallest bed size (6–24 beds) had the highest percentage of respondents who gave their work area/unit a patient safety grade of “Excellent” or “Very Good” (84 percent); hospitals with the largest bed size (500 or more beds) had the lowest (72 percent).
Teaching Status and Ownership (Table A-5)
• Nonteaching hospitals, on average, scored 5 percentage points or more than teaching hospitals on Staffing and Handoffs and Transitions.
• For-profit hospitals, on average, scored higher than not-for-profit and government hospitals by 5 percentage points or more on Teamwork Across Units and Handoffs and Transitions.
Geographic Region (Tables A-9, A-11, A-12)
• West South Central hospitals had the highest average percent positive across all composites (67 percent positive); Mid-Atlantic hospitals had the lowest (61 percent positive).
• East North Central hospitals had the highest percentage of respondents who gave their work area/unit a patient safety grade of “Excellent” or “Very Good” (80 percent); Mid-Atlantic and Pacific/Associated Territories hospitals had the lowest (73 percent).
• Mountain hospitals had the highest percentage of respondents who reported one or more events in the past year (50 percent); West South Central hospitals had the lowest (40 percent).

ix
Highlights From Appendix B: Results by Respondent Characteristics
Work Area/Unit (Tables B-1, B-3, B-4) • Respondents in Rehabilitation had the highest average percent positive response
across the composites (71 percent positive); Emergency had the lowest (60 percent positive).
• Rehabilitation had the highest percentage of respondents who gave their work area/unit a patient safety grade of “Excellent” or “Very Good” (87 percent); Emergency had the lowest (67 percent).
• ICU (Any Type) had the highest percentage of respondents reporting one or more events in the past year (64 percent); Rehabilitation had the lowest (40 percent).
Staff Position (Tables B-5, B-7, B-8) • Respondents in Administration/Management had the highest average percent
positive across the composites (77 percent positive); RN/LVN/LPN had the lowest (63 percent positive).
• Administration/Management had the highest percentage of respondents who gave their work area/unit a patient safety grade of “Excellent” or “Very Good” (89 percent); RN/LVN/LPN had the lowest (71 percent).
• Pharmacists had the highest percentage of respondents reporting one or more events in the past year (76 percent); Unit Assistants/Clerks/Secretaries had the lowest (17 percent).
Interaction With Patients (Tables B-9, B-11, B-12) • Respondents with direct patient interaction had a higher percent positive (49
percent) than those without direct interaction (44 percent) on Handoffs and Transitions.
• Respondents without direct patient interaction were overall more positive than those with direct interaction by at least 5 percentage points on Feedback & Communication About Error (73 percent) and Management Support for Patient Safety (79 percent).
• Respondents without direct patient interaction had a higher percentage of respondents who gave their work area/unit a patient safety grade of “Excellent” or “Very Good” (83 percent) than respondents with direct patient interaction (76 percent).
• Respondents with direct patient interaction had a higher percentage of respondents reporting one or more events in the past year (49 percent) than respondents without direct patient interaction (31 percent).

x
Highlights From Appendix B: Results by Respondent Characteristics (continued)
Tenure in Current Work Area/Unit (Tables B-13, B-15, B-16)
• Respondents with less than 1 year in their current work area/unit had the highest average percent positive across the composites (70 percent positive); respondents with 6 to 10 years had the lowest (64 percent positive).
• Respondents with less than 1 year in their current work area/unit had the highest percentage of respondents who gave their work area/unit a patient safety grade of “Excellent” or “Very Good” (84 percent); respondents with 1 to 5 and 6 to 10 years had the lowest (76 percent).
• Respondents with 6 to 10 years in their current work area/unit had the highest percentage of respondents reporting one or more events in the past year (50 percent); respondents with less than 1 year had the lowest (31 percent).

xi
Part III—Appendixes C and D: Trending Results by Hospital and Respondent Characteristics Appendixes C and D show trends over time for the 306 hospitals (of the 630 total database hospitals) that administered the survey and submitted data twice, both to the 2016 and 2018 databases. Average percent positive scores across hospitals from the most recent and previous administrations are shown for the survey composites and items, broken down by the following characteristics.
Appendix C: Trending Results by Hospital Characteristics
• Bed size • Teaching status • Ownership • Geographic region
Appendix D: Trending Results by Respondent Characteristics
• Work area/unit • Staff position • Interaction with patients • Tenure in current work area/unit
To ensure hospital confidentiality, a rule was established requiring at least 10 hospitals to be in a particular breakout category in order for data would be displayed by that category.
Tables 1 and 2 below show examples of the statistics in this appendix. The tables show the average percentage of respondents who answered positively among the trending hospitals for the hospitals’ most recent survey administration (top row) and their previous administration (middle row). The change over time is shown in the bottom row as a negative number if the most recent administration showed a decline or a positive number if the most recent administration showed an increase. Changes in scores of 5 percentage points or more, whether positive or negative, are shown in bold in the tables.
Table 1. Example of Decrease in Average Score Over Time (Negative Change) Most Recent 85% Previous 90% Change -5%
Table 2. Example of Increase in Average Score Over Time (Positive Change)
Most Recent 70% Previous 60% Change 10%
Highlights of the findings from the breakout tables in these appendixes are provided on the following pages. Highlights of trending results show the largest increases by hospital and respondent characteristics.

xii
Highlights From Appendix C: Trending Results by Hospital Characteristics
Bed Size (Tables C-1, C-3, C-4)
• Hospitals with 50-99 beds showed the largest increase (4 percentage points) on Nonpunitive Response to Error.
• Hospitals with 300-399 beds had the largest increase (6 percentage points,from 69 percent to 75 percent) in the percentage of respondents who gave their work area/unit a patient safety grade of “Excellent” or “Very Good.”
• Hospitals with the smallest bed size (6-24 beds) increased by 5 percentage points (from 45 percent to 50 percent) for respondents who reported 1 or more events in the past year.
Teaching Status and Ownership (Tables C-5, C-7)
• Nonteaching hospitals showed the largest increase (3 percentage points) on Nonpunitive Response to Error.
• For-Profit hospitals showed the largest increase (4 percentage points) on Teamwork Across Units and Handoffs and Transitions.
• For-Profit hospitals had the largest increase (5 percentage points, from 72 percent to 77 percent) in the percentage of respondents who gave their work area/unit a patient safety grade of “Excellent” or “Very Good.”
Geographic Region (Tables C-9, C-11)
• East North Central region hospitals had the greatest increase (5 percentage points) on Nonpunitive Response to Error.
• Pacific/Associated Territories region hospitals had the largest increase (5 percentage points, from 67 to 72 percent) in respondents who gave their work area/unit a patient safety grade of “Excellent” or “Very Good.”

xiii
Highlights From Appendix D: Trending Results by Respondent Characteristics
Work Area/Unit (Tables D-1, D-3)
• ICU (any type), Medicine, and Obstetrics increased by 4 percentage points on Nonpunitive Response to Error.
• ICU (any type) and Psych/Mental Health had the largest increase (5 percentage points) in respondents who gave their work area/unit a patient safety grade of“Excellent” or “Very Good.”
Staff Position (Table D-5)
• Dietitians increased 6 percentage points (49 percent to 55 percent) on NonpunitiveResponse to Error.
Interaction With Patients (Table D-9)
• Respondents without direct patient interaction increased 3 percentage points (49percent to 52 percent) on Nonpunitive Response to Error.
Tenure in Current Work Area/Unit (Table D-13)
• Respondents with 1 to 5, 6 to 10, and 11 to 15 years in their work area/unitincreased by 3 percentage points on Nonpunitive Response to Error.

1
Part II
Appendix A: Results by Hospital Characteristics (1) Bed Size NOTE: The number of hospitals and respondents in each bed size category is shown in each table. However, the precise number of hospitals and respondents corresponding to each data cell in a table will vary because hospitals may have omitted a specific survey item and because of individual nonresponse/missing data.

2
2
Table A-1. Composite-Level Average Percent Positive Response by Bed Size – 2018 Database Hospitals
Bed Size
Patient Safety Culture Composites 6-24 Beds
25-49 Beds
50-99 Beds
100-199 Beds
200-299 Beds
300-399 Beds
400-499 Beds
500+ Beds
# Hospitals 34 96 102 156 102 57 34 49
# Respondents 2,558 13,360 23,967 79,082 75,910 50,639 41,249 96,069
1. Teamwork Within Units 86% 84% 83% 82% 81% 80% 82% 80%
2. Supv/Mgr Expectations & Actions Promoting Patient Safety 83% 83% 81% 79% 78% 76% 78% 77%
3. Organizational Learning – Continuous Improvement 75% 73% 74% 73% 71% 70% 72% 70%
4. Management Support for Patient Safety 78% 76% 74% 73% 69% 68% 69% 66%
5. Feedback & Communication About Error 72% 70% 69% 69% 68% 67% 69% 66%
6. Frequency of Events Reported 69% 69% 68% 68% 66% 65% 66% 63%
7. Overall Perceptions of Patient Safety 73% 72% 68% 66% 63% 62% 62% 61%
8. Communication Openness 71% 68% 66% 65% 65% 62% 63% 63%
9. Teamwork Across Units 72% 69% 64% 61% 58% 56% 59% 55%
10. Staffing 63% 59% 55% 53% 50% 49% 49% 48%
11. Handoffs & Transitions 61% 55% 49% 47% 43% 42% 43% 42%
12. Nonpunitive Response to Error 52% 52% 50% 48% 44% 42% 44% 43%
Average Across Composites 71% 69% 67% 65% 63% 62% 63% 61%

3
3
Table A-2. Item-Level Average Percent Positive Response by Bed Size – 2018 Database Hospitals (Page 1 of 4)
Bed Size
Survey Items by Composite 6-24 Beds
25-49 Beds
50-99 Beds
100-199 Beds
200-299 Beds
300-399 Beds
400-499 Beds
500+ Beds
# Hospitals 34 96 102 156 102 57 34 49
# Respondents 2,558 13,360 23,967 79,082 75,910 50,639 41,249 96,069
Teamwork Within Units
A1. People support one another in this unit. 90% 89% 88% 87% 87% 86% 87% 86%
A3. When a lot of work needs to be done quickly, we work together as a team to get the work done. 91% 89% 88% 87% 86% 85% 87% 85%
A4. In this unit, people treat each other with respect. 86% 84% 83% 82% 81% 80% 81% 79%
A11. When one area in this unit gets really busy, others help out. 76% 75% 73% 72% 71% 70% 72% 71%
Supv/Mgr Expectations & Actions Promoting Patient Safety
B1. My supv/mgr says a good word when he/she sees a job done according to established patient safety procedures. 82% 81% 80% 79% 79% 77% 79% 77%
B2. My supv/mgr seriously considers staff suggestions for improving patient safety. 83% 83% 82% 80% 79% 78% 80% 78%
B3R. Whenever pressure builds up, my supv/mgr wants us to work faster, even if it means taking shortcuts. 83% 83% 80% 79% 76% 74% 76% 76%
B4R. My supv/mgr overlooks patient safety problems that happen over and over. 84% 82% 82% 79% 78% 76% 78% 78%
Organizational Learning – Continuous Improvement
A6. We are actively doing things to improve patient safety. 87% 84% 84% 84% 83% 83% 83% 82%
A9. Mistakes have led to positive changes here. 64% 64% 65% 63% 61% 60% 63% 61%
A13. After we make changes to improve patient safety, we evaluate their effectiveness. 73% 70% 71% 71% 69% 68% 70% 67%
Note: The item’s survey location is shown to the left. An “R” indicates a negatively worded item, where the percent positive response is based on those who responded “Strongly disagree” or “Disagree,” or “Never” or “Rarely” (depending on the response category used for the item).

4
4
Table A-2. Item-Level Average Percent Positive Response by Bed Size – 2018 Database Hospitals (Page 2 of 4)
Bed Size
Survey Items by Composite 6-24 Beds
25-49 Beds
50-99 Beds
100-199 Beds
200-299 Beds
300-399 Beds
400-499 Beds
500+ Beds
# Hospitals 34 96 102 156 102 57 34 49
# Respondents 2,558 13,360 23,967 79,082 75,910 50,639 41,249 96,069
Management Support for Patient Safety
F1. Hospital management provides a work climate that promotes patient safety. 87% 86% 83% 82% 79% 77% 78% 76%
F8. The actions of hospital management show that patient safety is a top priority. 81% 79% 77% 76% 73% 73% 73% 70%
F9R. Hospital management seems interested in patient safety only after an adverse event happens. 65% 65% 62% 60% 56% 54% 55% 53%
Feedback & Communication About Error
C1. We are given feedback about changes put into place based on event reports. 62% 60% 61% 61% 60% 60% 62% 59%
C3. We are informed about errors that happen in this unit. 74% 71% 69% 69% 68% 69% 70% 67%
C5. In this unit, we discuss ways to prevent errors from happening again. 80% 78% 77% 76% 75% 73% 75% 72%
Frequency of Events Reported
D1. When a mistake is made, but is caught and corrected before affecting the patient, how often is this reported? 64% 63% 63% 63% 61% 61% 62% 59%
D2. When a mistake is made, but has no potential to harm the patient, how often is this reported? 66% 65% 64% 64% 62% 61% 62% 59%
D3. When a mistake is made that could harm the patient, but does not, how often is this reported? 78% 79% 77% 76% 74% 74% 74% 72%
Note: The item’s survey location is shown to the left. An “R” indicates a negatively worded item, where the percent positive response is based on those who responded “Strongly disagree” or “Disagree,” or “Never” or “Rarely” (depending on the response category used for the item).
5
5
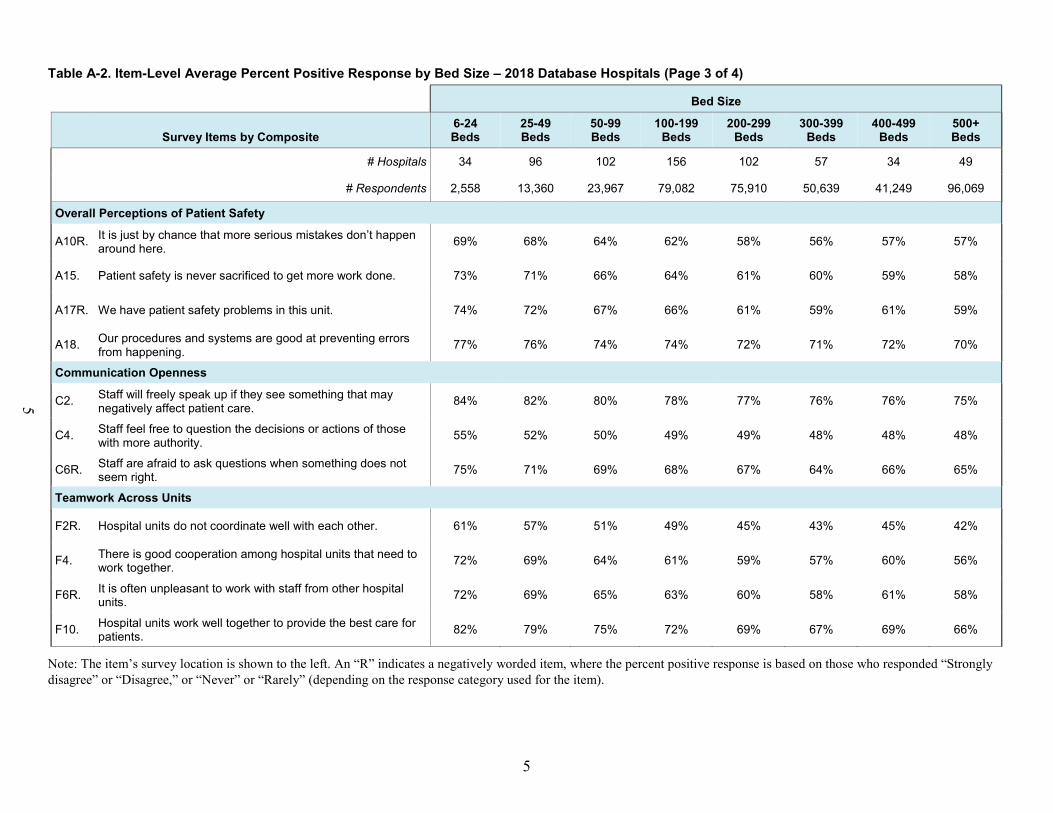
Table A-2. Item-Level Average Percent Positive Response by Bed Size – 2018 Database Hospitals (Page 3 of 4)
Bed Size
Survey Items by Composite 6-24 Beds
25-49 Beds
50-99 Beds
100-199 Beds
200-299 Beds
300-399 Beds
400-499 Beds
500+ Beds
# Hospitals 34 96 102 156 102 57 34 49
# Respondents 2,558 13,360 23,967 79,082 75,910 50,639 41,249 96,069
Overall Perceptions of Patient Safety
A10R. It is just by chance that more serious mistakes don’t happen around here. 69% 68% 64% 62% 58% 56% 57% 57%
A15. Patient safety is never sacrificed to get more work done. 73% 71% 66% 64% 61% 60% 59% 58%
A17R. We have patient safety problems in this unit. 74% 72% 67% 66% 61% 59% 61% 59%
A18. Our procedures and systems are good at preventing errors from happening. 77% 76% 74% 74% 72% 71% 72% 70%
Communication Openness
C2. Staff will freely speak up if they see something that may negatively affect patient care. 84% 82% 80% 78% 77% 76% 76% 75%
C4. Staff feel free to question the decisions or actions of those with more authority. 55% 52% 50% 49% 49% 48% 48% 48%
C6R. Staff are afraid to ask questions when something does not seem right. 75% 71% 69% 68% 67% 64% 66% 65%
Teamwork Across Units
F2R. Hospital units do not coordinate well with each other. 61% 57% 51% 49% 45% 43% 45% 42%
F4. There is good cooperation among hospital units that need to work together. 72% 69% 64% 61% 59% 57% 60% 56%
F6R. It is often unpleasant to work with staff from other hospital units. 72% 69% 65% 63% 60% 58% 61% 58%
F10. Hospital units work well together to provide the best care for patients. 82% 79% 75% 72% 69% 67% 69% 66%
Note: The item’s survey location is shown to the left. An “R” indicates a negatively worded item, where the percent positive response is based on those who responded “Strongly disagree” or “Disagree,” or “Never” or “Rarely” (depending on the response category used for the item).
6
6
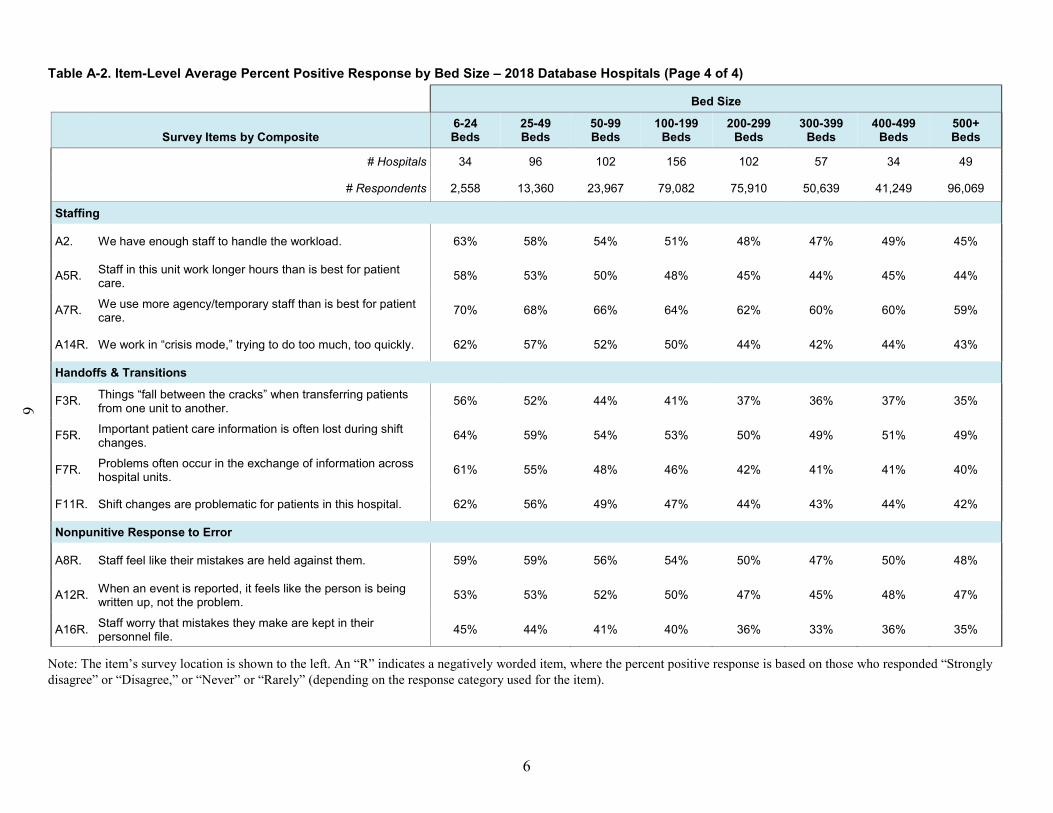
Table A-2. Item-Level Average Percent Positive Response by Bed Size – 2018 Database Hospitals (Page 4 of 4)
Bed Size
Survey Items by Composite 6-24 Beds
25-49 Beds
50-99 Beds
100-199 Beds
200-299 Beds
300-399 Beds
400-499 Beds
500+ Beds
# Hospitals 34 96 102 156 102 57 34 49
# Respondents 2,558 13,360 23,967 79,082 75,910 50,639 41,249 96,069
Staffing
A2. We have enough staff to handle the workload. 63% 58% 54% 51% 48% 47% 49% 45%
A5R. Staff in this unit work longer hours than is best for patient care. 58% 53% 50% 48% 45% 44% 45% 44%
A7R. We use more agency/temporary staff than is best for patient care. 70% 68% 66% 64% 62% 60% 60% 59%
A14R. We work in “crisis mode,” trying to do too much, too quickly. 62% 57% 52% 50% 44% 42% 44% 43%
Handoffs & Transitions
F3R. Things “fall between the cracks” when transferring patients from one unit to another. 56% 52% 44% 41% 37% 36% 37% 35%
F5R. Important patient care information is often lost during shift changes. 64% 59% 54% 53% 50% 49% 51% 49%
F7R. Problems often occur in the exchange of information across hospital units. 61% 55% 48% 46% 42% 41% 41% 40%
F11R. Shift changes are problematic for patients in this hospital. 62% 56% 49% 47% 44% 43% 44% 42%
Nonpunitive Response to Error
A8R. Staff feel like their mistakes are held against them. 59% 59% 56% 54% 50% 47% 50% 48%
A12R. When an event is reported, it feels like the person is being written up, not the problem. 53% 53% 52% 50% 47% 45% 48% 47%
A16R. Staff worry that mistakes they make are kept in their personnel file. 45% 44% 41% 40% 36% 33% 36% 35%
Note: The item’s survey location is shown to the left. An “R” indicates a negatively worded item, where the percent positive response is based on those who responded “Strongly disagree” or “Disagree,” or “Never” or “Rarely” (depending on the response category used for the item).
7
7
Table A-3. Average Percentage of Respondents Giving Their Work Area/Unit a Patient Safety Grade by Bed Size – 2018 Database Hospitals
Bed Size
Work Area/Unit Patient Safety Grade 6-24 Beds
25-49 Beds
50-99 Beds
100-199 Beds
200-299 Beds
300-399 Beds
400-499 Beds
500+ Beds
# Hospitals 34 96 102 156 102 57 34 49
# Respondents 2,558 13,360 23,967 79,082 75,910 50,639 41,249 96,069
Excellent or Very Good 84% 82% 79% 78% 75% 73% 74% 72%
A = Excellent 42% 38% 35% 35% 33% 31% 32% 30%
B = Very Good 42% 44% 44% 43% 42% 42% 41% 42%
C = Acceptable 13% 15% 17% 17% 19% 20% 20% 22%
D = Poor 2% 2% 3% 4% 4% 5% 5% 5%
E = Failing 0% 1% 1% 1% 1% 1% 1% 1%
Note: Percentages may not add to 100 due to rounding. Excellent and Very Good may not add to the subtotal for Excellent or Very Good due to rounding.

8
8
Table A-4. Average Percentage of Respondents Reporting Events in the Past 12 Months by Bed Size – 2018 Database Hospitals
Bed Size
Number of Events Reported by Respondents 6-24 Beds
25-49 Beds
50-99 Beds
100-199 Beds
200-299 Beds
300-399 Beds
400-499 Beds
500+ Beds
# Hospitals 34 96 102 156 102 57 34 49
# Respondents 2,558 13,360 23,967 79,082 75,910 50,639 41,249 96,069
1 or More Events 43% 44% 45% 45% 47% 45% 46% 46%
None 57% 56% 55% 55% 53% 55% 54% 54%
1 to 2 27% 25% 24% 24% 27% 24% 24% 25%
3 to 5 10% 13% 14% 13% 12% 13% 13% 13%
6 to 10 4% 4% 4% 4% 5% 4% 4% 4%
11 to 20 1% 2% 3% 3% 2% 3% 3% 3%
21 or More 1% 1% 1% 1% 1% 1% 1% 1%
Note: Percentages may not add to 100 due to rounding. Percentages for number of events may not add to the subtotal for 1 or more events due to rounding.

9
Appendix A: Results by Hospital Characteristics (2) Teaching Status and (3) Ownership NOTE: The number of hospitals and respondents in each teaching status and ownership category is shown in each table. However, the precise number of hospitals and respondents corresponding to each data cell in a table will vary because hospitals may have omitted a specific survey item and because of individual nonresponse/missing data.

10
Table A-5. Composite-Level Average Percent Positive Response by Teaching Status and Ownership– 2018 Database Hospitals
Teaching Status Ownership
Patient Safety Culture Composites Teaching Nonteaching Government Not for Profit For Profit
# Hospitals 226 404 77 489 64
# Respondents 216,301 166,533 31,996 318,376 32,462
1. Teamwork Within Units 81% 83% 81% 82% 83%
2. Supv/Mgr Expectations & Actions Promoting Patient Safety 78% 80% 78% 80% 79%
3. Organizational Learning – Continuous Improvement 71% 73% 71% 72% 73%
4. Management Support for Patient Safety 70% 73% 71% 72% 73%
5. Feedback & Communication About Error 67% 69% 66% 69% 69%
6. Frequency of Events Reported 65% 68% 65% 67% 68%
7. Overall Perceptions of Patient Safety 64% 68% 65% 67% 65%
8. Communication Openness 64% 66% 62% 66% 65%
9. Teamwork Across Units 59% 63% 60% 61% 66%
10. Staffing 50% 55% 54% 53% 53%
11. Handoffs & Transitions 44% 49% 46% 47% 53%
12. Nonpunitive Response to Error 45% 49% 46% 48% 46%
Average Across Composites 63% 66% 64% 65% 66%

11
Table A-6. Item-Level Average Percent Positive Response by Teaching Status and Ownership– 2018 Database Hospitals (Page 1 of 4)
Teaching Status and Ownership
Survey Items by Composite Teaching Nonteaching Government Not for Profit For Profit
# Hospitals 226 404 77 489 64
# Respondents 216,301 166,533 31,996 318,376 32,462
Teamwork Within Units
A1. People support one another in this unit. 87% 88% 86% 88% 88%
A3. When a lot of work needs to be done quickly, we work together as a team to get the work done. 86% 88% 87% 87% 88%
A4. In this unit, people treat each other with respect. 81% 83% 80% 82% 84%
A11. When one area in this unit gets really busy, others help out. 71% 73% 71% 73% 72%
Supv/Mgr Expectations & Actions Promoting Patient Safety
B1. My supv/mgr says a good word when he/she sees a job done according to established patient safety procedures. 78% 80% 77% 80% 81%
B2. My supv/mgr seriously considers staff suggestions for improving patient safety. 79% 81% 78% 81% 81%
B3R. Whenever pressure builds up, my supv/mgr wants us to work faster, even if it means taking shortcuts. 77% 80% 78% 79% 77%
B4R. My supv/mgr overlooks patient safety problems that happen over and over. 78% 81% 79% 80% 77%
Organizational Learning – Continuous Improvement
A6. We are actively doing things to improve patient safety. 83% 84% 82% 84% 85%
A9. Mistakes have led to positive changes here. 62% 63% 63% 63% 63%
A13. After we make changes to improve patient safety, we evaluate their effectiveness. 69% 71% 68% 70% 71%
Note: The item’s survey location is shown to the left. An “R” indicates a negatively worded item, where the percent positive response is based on those who responded “Strongly disagree” or “Disagree,” or “Never” or “Rarely” (depending on the response category used for the item).

12
Table A-6. Item-Level Average Percent Positive Response by Teaching Status and Ownership – 2018 Database Hospitals (Page 2 of 4)
Teaching Status and Ownership
Survey Items by Composite Teaching Nonteaching Government Not for Profit For Profit
# Hospitals 226 404 77 489 64
# Respondents 216,301 166,533 31,996 318,376 32,462
Management Support for Patient Safety
F1. Hospital management provides a work climate that promotes patient safety. 79% 82% 81% 81% 83%
F8. The actions of hospital management show that patient safety is a top priority. 74% 77% 74% 76% 78%
F9R. Hospital management seems interested in patient safety only after an adverse event happens. 57% 61% 58% 60% 59%
Feedback & Communication About Error
C1. We are given feedback about changes put into place based on event reports. 60% 61% 56% 61% 60%
C3. We are informed about errors that happen in this unit. 68% 70% 67% 70% 70%
C5. In this unit, we discuss ways to prevent errors from happening again. 75% 77% 73% 76% 76%
Frequency of Events Reported
D1. When a mistake is made, but is caught and corrected before affecting the patient, how often is this reported? 61% 63% 60% 63% 64%
D2. When a mistake is made, but has no potential to harm the patient, how often is this reported? 61% 64% 62% 63% 64%
D3. When a mistake is made that could harm the patient, but does not, how often is this reported? 74% 77% 74% 76% 75%
Note: The item’s survey location is shown to the left. An “R” indicates a negatively worded item, where the percent positive response is based on those who responded “Strongly disagree” or “Disagree,” or “Never” or “Rarely” (depending on the response category used for the item).

13
Table A-6. Item-Level Average Percent Positive Response by Teaching Status and Ownership – 2018 Database Hospitals (Page 3 of 4)
Teaching Status and Ownership
Survey Items by Composite Teaching Nonteaching Government Not for Profit For Profit
# Hospitals 226 404 77 489 64
# Respondents 216,301 166,533 31,996 318,376 32,462
Overall Perceptions of Patient Safety
A10R. It is just by chance that more serious mistakes don’t happen around here. 59% 63% 60% 63% 58%
A15. Patient safety is never sacrificed to get more work done. 61% 66% 65% 64% 64%
A17R. We have patient safety problems in this unit. 62% 67% 65% 66% 63%
A18. Our procedures and systems are good at preventing errors from happening. 72% 74% 72% 74% 73%
Communication Openness
C2. Staff will freely speak up if they see something that may negatively affect patient care. 77% 80% 76% 79% 77%
C4. Staff feel free to question the decisions or actions of those with more authority. 49% 51% 46% 50% 51%
C6R. Staff are afraid to ask questions when something does not seem right. 66% 69% 65% 69% 68%
Teamwork Across Units
F2R. Hospital units do not coordinate well with each other. 45% 51% 47% 49% 55%
F4. There is good cooperation among hospital units that need to work together. 59% 64% 62% 62% 67%
F6R. It is often unpleasant to work with staff from other hospital units. 62% 64% 61% 63% 67%
F10. Hospital units work well together to provide the best care for patients. 70% 74% 72% 72% 77%
Note: The item’s survey location is shown to the left. An “R” indicates a negatively worded item, where the percent positive response is based on those who responded “Strongly disagree” or “Disagree,” or “Never” or “Rarely” (depending on the response category used for the item).

14
Table A-6. Item-Level Average Percent Positive Response by Teaching Status and Ownership – 2018 Database Hospitals (Page 4 of 4)
Teaching Status and Ownership
Survey Items by Composite Teaching Nonteaching Government Not for Profit For Profit
# Hospitals 226 404 77 489 64
# Respondents 216,301 166,533 31,996 318,376 32,462
Staffing
A2. We have enough staff to handle the workload. 48% 53% 54% 51% 54%
A5R. Staff in this unit work longer hours than is best for patient care. 45% 50% 49% 48% 48%
A7R. We use more agency/temporary staff than is best for patient care. 62% 65% 63% 65% 61%
A14R. We work in “crisis mode,” trying to do too much, too quickly. 46% 52% 51% 49% 50%
Handoffs & Transitions
F3R. Things “fall between the cracks” when transferring patients from one unit to another. 38% 45% 41% 42% 48%
F5R. Important patient care information is often lost during shift changes. 51% 54% 50% 53% 58%
F7R. Problems often occur in the exchange of information across hospital units. 43% 49% 44% 46% 53%
F11R. Shift changes are problematic for patients in this hospital. 45% 50% 46% 48% 54%
Nonpunitive Response to Error
A8R. Staff feel like their mistakes are held against them. 50% 55% 52% 54% 52%
A12R. When an event is reported, it feels like the person is being written up, not the problem. 48% 51% 47% 50% 47%
A16R. Staff worry that mistakes they make are kept in their personnel file. 36% 41% 38% 40% 37%
Note: The item’s survey location is shown to the left. An “R” indicates a negatively worded item, where the percent positive response is based on those who responded “Strongly disagree” or “Disagree,” or “Never” or “Rarely” (depending on the response category used for the item).

15
Table A-7. Average Percentage of Respondents Giving Their Work Area/Unit a Patient Safety Grade by Teaching Status and Ownership – 2018 Database Hospitals
Teaching Status and Ownership
Work Area/Unit Patient Safety Grade Teaching Nonteaching Government Not for Profit For Profit
# Hospitals 226 404 77 489 64
# Respondents 216,301 166,533 31,996 318,376 32,462
Excellent or Very Good 75% 79% 77% 78% 77%
A = Excellent 32% 36% 32% 35% 36%
B = Very Good 43% 42% 44% 43% 40%
C = Acceptable 19% 17% 19% 18% 18%
D = Poor 4% 3% 4% 4% 4%
E = Failing 1% 1% 1% 1% 1%
Note: Percentages may not add to 100 due to rounding. Excellent and Very Good may not add to the subtotal for Excellent or Very Good due to rounding.
16
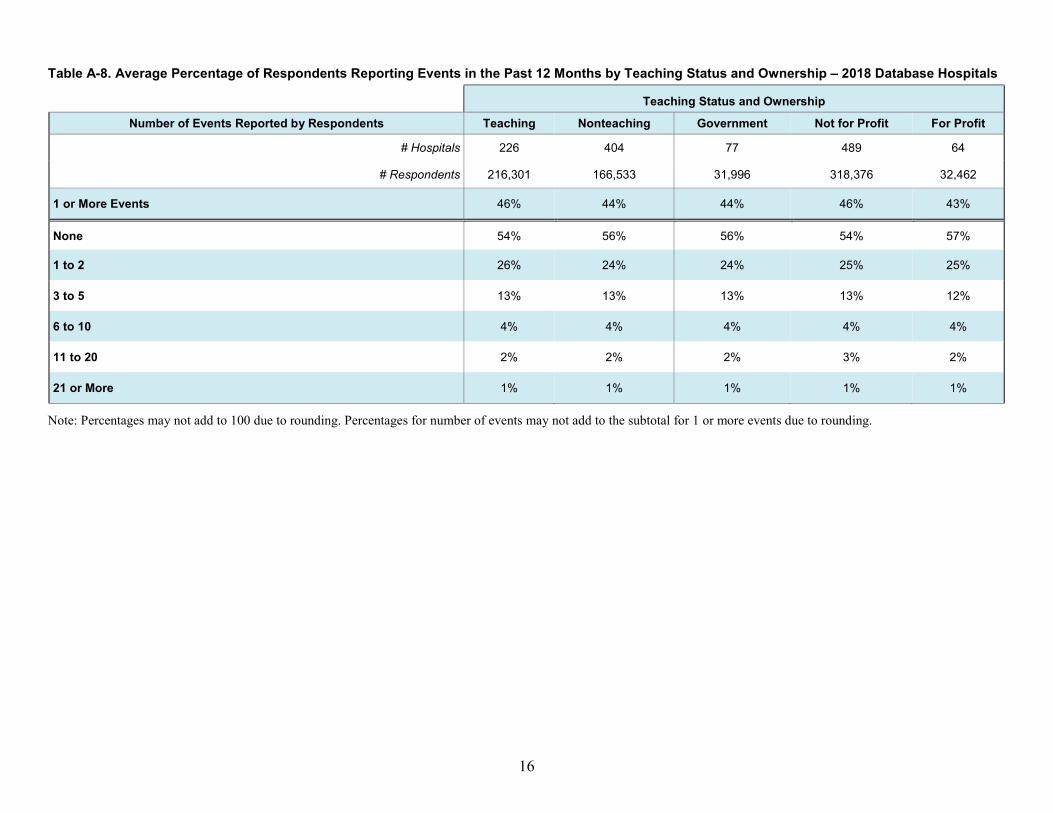
Table A-8. Average Percentage of Respondents Reporting Events in the Past 12 Months by Teaching Status and Ownership – 2018 Database Hospitals
Teaching Status and Ownership
Number of Events Reported by Respondents Teaching Nonteaching Government Not for Profit For Profit
# Hospitals 226 404 77 489 64
# Respondents 216,301 166,533 31,996 318,376 32,462
1 or More Events 46% 44% 44% 46% 43%
None 54% 56% 56% 54% 57%
1 to 2 26% 24% 24% 25% 25%
3 to 5 13% 13% 13% 13% 12%
6 to 10 4% 4% 4% 4% 4%
11 to 20 2% 2% 2% 3% 2%
21 or More 1% 1% 1% 1% 1%
Note: Percentages may not add to 100 due to rounding. Percentages for number of events may not add to the subtotal for 1 or more events due to rounding.

17
Appendix A: Results by Hospital Characteristics (4) Geographic Region NOTE 1: The number of hospitals and respondents in each geographic region is shown in each table. However, the precise number of hospitals and respondents corresponding to each data cell in a table will vary because hospitals may have omitted a specific survey item and because of individual nonresponse/missing data.
NOTE 2: States and territories are categorized into regions defined by the American Hospital Association (AHA) as follows:
• New England: CT, MA, ME, NH, RI, VT • Mid-Atlantic: NJ, NY, PA • South Atlantic/Associated Territories: DC, DE, FL, GA, MD, NC, SC, VA, WV, Puerto
Rico, Virgin Islands • East North Central: IL, IN, MI, OH, WI • East South Central: AL, KY, MS, TN • West North Central: IA, KS, MN, MO, ND, NE, SD • West South Central: AR, LA, OK, TX • Mountain: AZ, CO, ID, MT, NM, NV, UT, WY • Pacific/Associated Territories: AK, CA, HI, OR, WA, American Samoa, Guam, Marshall
Islands, Northern Mariana Islands

18
Table A-9. Composite-Level Average Percent Positive Response by Geographic Region – 2018 Database Hospitals
Geographic Region
Patient Safety Culture Composites New
England Mid-
Atlantic South
Atlantic
East North
Central
East South
Central
West North
Central
West South
Central Mountain Pacific
# Hospitals 33 61 151 144 27 73 85 20 36
# Respondents 17,378 53,492 107,584 86,680 15,304 30,230 33,861 13,436 24,869
1. Teamwork Within Units 80% 79% 83% 83% 83% 83% 83% 84% 80%
2. Supv/Mgr Expectations & Actions Promoting Patient Safety 77% 76% 81% 80% 81% 80% 81% 79% 75%
3. Organizational Learning – Continuous Improvement 67% 70% 74% 73% 73% 71% 73% 72% 70%
4. Management Support for Patient Safety 69% 68% 74% 73% 73% 72% 74% 70% 69%
5. Feedback & Communication About Error 62% 66% 71% 69% 68% 67% 71% 67% 66%
6. Frequency of Events Reported 63% 67% 69% 66% 68% 65% 69% 65% 67%
7. Overall Perceptions of Patient Safety 65% 62% 66% 68% 67% 68% 68% 64% 61%
8. Communication Openness 64% 63% 66% 66% 66% 67% 68% 65% 61%
9. Teamwork Across Units 56% 56% 63% 63% 61% 62% 66% 61% 60%
10. Staffing 52% 46% 53% 55% 57% 56% 56% 54% 49%
11. Handoffs & Transitions 42% 42% 49% 48% 48% 48% 52% 45% 45%
12. Nonpunitive Response to Error 49% 41% 48% 48% 50% 51% 48% 46% 42%
Average Across Composites 62% 61% 66% 66% 66% 66% 67% 64% 62%

19
Table A-10. Item-Level Average Percent Positive Response by Geographic Region – 2018 Database Hospitals (Page 1 of 4)
Geographic Region
Survey Items by Composite New
England Mid-
Atlantic South
Atlantic
East North
Central
East South
Central
West North
Central
West South
Central Mountain Pacific
# Hospitals 33 61 151 144 27 73 85 20 36
# Respondents 17,378 53,492 107,584 86,680 15,304 30,230 33,861 13,436 24,869
Teamwork Within Units
A1. People support one another in this unit. 86% 85% 88% 88% 89% 89% 88% 89% 86%
A3. When a lot of work needs to be done quickly, we work together as a team to get the work done. 85% 84% 87% 89% 89% 88% 88% 88% 84%
A4. In this unit, people treat each other with respect. 79% 78% 82% 83% 83% 82% 83% 85% 81%
A11. When one area in this unit gets really busy, others help out. 70% 68% 73% 73% 73% 73% 73% 74% 70%
Supv/Mgr Expectations & Actions Promoting Patient Safety
B1. My supv/mgr says a good word when he/she sees a job done according to established patient safety procedures. 76% 77% 82% 79% 79% 79% 81% 79% 76%
B2. My supv/mgr seriously considers staff suggestions for improving patient safety. 78% 77% 81% 81% 81% 81% 82% 82% 76%
B3R. Whenever pressure builds up, my supv/mgr wants us to work faster, even if it means taking shortcuts. 78% 75% 80% 79% 79% 80% 79% 77% 75%
B4R. My supv/mgr overlooks patient safety problems that happen over and over. 77% 76% 81% 80% 83% 81% 80% 78% 73%
Organizational Learning – Continuous Improvement
A6. We are actively doing things to improve patient safety. 78% 82% 84% 85% 84% 83% 85% 84% 82%
A9. Mistakes have led to positive changes here. 60% 59% 65% 64% 63% 63% 63% 63% 61%
A13. After we make changes to improve patient safety, we evaluate their effectiveness. 62% 68% 73% 71% 73% 67% 72% 67% 67%
Note: The item’s survey location is shown to the left. An “R” indicates a negatively worded item, where the percent positive response is based on those who responded “Strongly disagree” or “Disagree,” or “Never” or “Rarely” (depending on the response category used for the item).

20
Table A-10. Item-Level Average Percent Positive Response by Geographic Region – 2018 Database Hospitals (Page 2 of 4)
Geographic Region
Survey Items by Composite New
England Mid-
Atlantic South
Atlantic
East North
Central
East South
Central
West North
Central
West South
Central Mountain Pacific
# Hospitals 33 61 151 144 27 73 85 20 36
# Respondents 17,378 53,492 107,584 86,680 15,304 30,230 33,861 13,436 24,869
Management Support for Patient Safety
F1. Hospital management provides a work climate that promotes patient safety. 77% 76% 82% 82% 82% 82% 83% 80% 80%
F8. The actions of hospital management show that patient safety is a top priority. 72% 72% 77% 76% 76% 74% 78% 74% 74%
F9R. Hospital management seems interested in patient safety only after an adverse event happens. 58% 54% 62% 60% 60% 59% 61% 57% 54%
Feedback & Communication About Error
C1. We are given feedback about changes put into place based on event reports. 53% 57% 65% 61% 60% 58% 62% 58% 58%
C3. We are informed about errors that happen in this unit. 62% 68% 72% 69% 70% 66% 72% 68% 66%
C5. In this unit, we discuss ways to prevent errors from happening again. 72% 72% 77% 77% 76% 76% 78% 75% 73%
Frequency of Events Reported
D1. When a mistake is made, but is caught and corrected before affecting the patient, how often is this reported? 57% 62% 65% 61% 62% 60% 64% 61% 63%
D2. When a mistake is made, but has no potential to harm the patient, how often is this reported? 58% 63% 65% 62% 64% 61% 65% 60% 63%
D3. When a mistake is made that could harm the patient, but does not, how often is this reported? 73% 76% 76% 76% 77% 76% 77% 74% 75%
Note: The item’s survey location is shown to the left. An “R” indicates a negatively worded item, where the percent positive response is based on those who responded “Strongly disagree” or “Disagree,” or “Never” or “Rarely” (depending on the response category used for the item).
21
Table A-10. Item-Level Average Percent Positive Response by Geographic Region – 2018 Database Hospitals (Page 3 of 4)
Geographic Region
Survey Items by Composite New
England Mid-
Atlantic South
Atlantic
East North
Central
East South
Central
West North
Central
West South
Central Mountain Pacific
# Hospitals 33 61 151 144 27 73 85 20 36
# Respondents 17,378 53,492 107,584 86,680 15,304 30,230 33,861 13,436 24,869
Overall Perceptions of Patient Safety
A10R. It is just by chance that more serious mistakes don’t happen around here. 63% 57% 61% 64% 63% 66% 61% 61% 56%
A15. Patient safety is never sacrificed to get more work done. 64% 62% 65% 64% 66% 64% 68% 61% 62%
A17R. We have patient safety problems in this unit. 62% 60% 64% 68% 67% 68% 67% 63% 59%
A18. Our procedures and systems are good at preventing errors from happening. 69% 69% 74% 76% 73% 74% 75% 72% 69%
Communication Openness
C2. Staff will freely speak up if they see something that may negatively affect patient care. 76% 77% 79% 80% 79% 79% 80% 78% 74%
C4. Staff feel free to question the decisions or actions of those with more authority. 49% 47% 51% 49% 49% 51% 52% 50% 48%
C6R. Staff are afraid to ask questions when something does not seem right. 67% 65% 69% 68% 69% 69% 70% 68% 62%
Teamwork Across Units
F2R. Hospital units do not coordinate well with each other. 41% 42% 51% 50% 49% 50% 54% 47% 46%
F4. There is good cooperation among hospital units that need to work together. 56% 56% 63% 63% 63% 62% 66% 63% 61%
F6R. It is often unpleasant to work with staff from other hospital units. 61% 59% 64% 64% 61% 64% 65% 64% 62%
F10. Hospital units work well together to provide the best care for patients. 67% 68% 73% 74% 72% 72% 76% 72% 71%
Note: The item’s survey location is shown to the left. An “R” indicates a negatively worded item, where the percent positive response is based on those who responded “Strongly disagree” or “Disagree,” or “Never” or “Rarely” (depending on the response category used for the item).

22
Table A-10. Item-Level Average Percent Positive Response by Geographic Region – 2018 Database Hospitals (Page 4 of 4)
Geographic Region
Survey Items by Composite New
England Mid-
Atlantic South
Atlantic
East North
Central
East South
Central
West North
Central
West South
Central Mountain Pacific
# Hospitals 33 61 151 144 27 73 85 20 36
# Respondents 17,378 53,492 107,584 86,680 15,304 30,230 33,861 13,436 24,869
Staffing
A2. We have enough staff to handle the workload. 49% 43% 50% 53% 55% 55% 57% 53% 49%
A5R. Staff in this unit work longer hours than is best for patient care. 48% 41% 48% 50% 53% 51% 51% 49% 43%
A7R. We use more agency/temporary staff than is best for patient care. 63% 61% 62% 67% 67% 67% 64% 65% 58%
A14R. We work in “crisis mode,” trying to do too much, too quickly. 47% 41% 50% 50% 53% 51% 54% 48% 45%
Handoffs & Transitions
F3R. Things “fall between the cracks” when transferring patients from one unit to another. 36% 37% 44% 43% 43% 42% 47% 38% 39%
F5R. Important patient care information is often lost during shift changes. 48% 49% 54% 55% 53% 53% 57% 50% 51%
F7R. Problems often occur in the exchange of information across hospital units. 41% 41% 47% 47% 47% 47% 52% 44% 44%
F11R. Shift changes are problematic for patients in this hospital. 41% 42% 49% 49% 48% 48% 53% 47% 46%
Nonpunitive Response to Error
A8R. Staff feel like their mistakes are held against them. 55% 47% 54% 54% 55% 58% 55% 53% 48%
A12R. When an event is reported, it feels like the person is being written up, not the problem. 52% 45% 50% 50% 51% 53% 49% 47% 45%
A16R. Staff worry that mistakes they make are kept in their personnel file. 41% 33% 40% 40% 42% 43% 40% 37% 32%
Note: The item’s survey location is shown to the left. An “R” indicates a negatively worded item, where the percent positive response is based on those who responded “Strongly disagree” or “Disagree,” or “Never” or “Rarely” (depending on the response category used for the item).

23
Table A-11. Average Percentage of Respondents Giving Their Work Area/Unit a Patient Safety Grade by Geographic Region – 2018 Database Hospitals
Geographic Region
Work Area/Unit Patient Safety Grade New
England Mid-
Atlantic South
Atlantic
East North
Central
East South
Central
West North
Central
West South
Central Mountain Pacific
# Hospitals 33 61 151 144 27 73 85 20 36
# Respondents 17,378 53,492 107,584 86,680 15,304 30,230 33,861 13,436 24,869
Excellent or Very Good 77% 73% 77% 80% 78% 79% 79% 77% 73%
A = Excellent 32% 30% 36% 37% 35% 33% 37% 33% 31%
B = Very Good 44% 43% 41% 43% 43% 46% 42% 44% 42%
C = Acceptable 19% 21% 18% 16% 18% 17% 17% 18% 22%
D = Poor 4% 5% 4% 3% 3% 4% 3% 4% 4%
E = Failing 1% 1% 1% 1% 1% 1% 1% 1% 1%
Note: Percentages may not add to 100 due to rounding. Excellent and Very Good may not add to the subtotal for Excellent or Very Good due to rounding.

24
Table A-12. Average Percentage of Respondents Reporting Events in the Past 12 Months by Geographic Region – 2018 Database Hospitals
Geographic Region
Number of Events Reported by Respondents New
England Mid-
Atlantic South
Atlantic
East North
Central
East South
Central
West North
Central
West South
Central Mountain Pacific
# Hospitals 33 61 151 144 27 73 85 20 36
# Respondents 17,378 53,492 107,584 86,680 15,304 30,230 33,861 13,436 24,869
1 or More Events 45% 43% 43% 48% 44% 49% 40% 50% 45%
None 55% 57% 57% 52% 56% 51% 60% 50% 55%
1 to 2 27% 24% 22% 28% 25% 23% 24% 27% 27%
3 to 5 12% 12% 13% 13% 12% 16% 11% 14% 12%
6 to 10 4% 4% 4% 4% 4% 5% 3% 5% 4%
11 to 20 2% 2% 3% 2% 1% 5% 2% 2% 1%
21 or More 1% 2% 1% 1% 1% 1% 1% 2% 1%
Note: Percentages may not add to 100 due to rounding. Percentages for number of events may not add to the subtotal for 1 or more events due to rounding.

25
Part II
Appendix B: Results by Respondent Characteristics (1) Work Area/Unit NOTE 1: Hospitals that did not ask respondents to indicate their work area/unit were excluded from these breakout tables. In addition, respondents who selected “Many different work areas/No specific work area” or “Other” or who did not answer (missing) were not included.
NOTE 2: The number of hospitals and respondents in each work area/unit is shown. The number of hospitals is based on hospitals that asked respondents to indicate their work area/unit (not all hospitals asked this question). However, the precise number of hospitals and respondents corresponding to each data cell in the tables will vary because hospitals may have omitted a specific survey item and because of individual nonresponse/missing data.
26
Table B-1. Composite-Level Average Percent Positive Response by Work Area/Unit – 2018 Database Hospitals
Work Area/Unit
Patient Safety Culture Composites
Anes- thesi- ology
Emer- gency
ICU (Any Type) Lab
Med- icine
Obstet- rics
Pedia- trics
Phar- macy
Psych/ Mentl Hlth
Radi- ology
Reha- bili-
tation Surg-
ery
# Hospitals 256 555 464 546 528 391 260 547 274 556 524 545
# Respondents 2,607 23,692 25,274 17,241 49,105 15,120 7,307 11,727 8,057 20,060 16,037 37,946
1. Teamwork Within Units 82% 81% 87% 77% 82% 84% 85% 80% 80% 82% 88% 79%
2. Supv/Mgr Expectations & Actions Promoting Patient Safety 76% 75% 78% 77% 79% 78% 78% 82% 76% 80% 84% 77%
3. Organizational Learning – Continuous Improvement 70% 66% 71% 70% 73% 73% 71% 79% 70% 72% 76% 72%
4. Management Support for Patient Safety 64% 63% 63% 74% 69% 69% 69% 76% 68% 73% 77% 69%
5. Feedback & Communication About Error 63% 62% 64% 66% 68% 66% 66% 74% 66% 69% 75% 68%
6. Frequency of Events Reported 62% 62% 62% 70% 66% 67% 67% 68% 67% 65% 67% 69%
7. Overall Perceptions of Patient Safety 64% 56% 59% 70% 61% 64% 65% 72% 60% 74% 79% 67%
8. Communication Openness 67% 62% 63% 63% 64% 64% 65% 71% 62% 67% 73% 66%
9. Teamwork Across Units 55% 52% 59% 58% 61% 61% 61% 62% 55% 64% 66% 58%
10. Staffing 51% 46% 52% 50% 50% 58% 60% 61% 52% 60% 63% 53%
11. Handoffs & Transitions 44% 51% 51% 41% 48% 56% 52% 38% 45% 50% 44% 44%
12. Nonpunitive Response to Error 43% 40% 44% 42% 46% 47% 45% 59% 48% 47% 63% 47%
Average Across Composites 62% 60% 63% 63% 64% 66% 65% 69% 62% 67% 71% 64%

27
Table B-2. Item-Level Average Percent Positive Response by Work Area/Unit – 2018 Database Hospitals (Page 1 of 4)
Work Area/Unit
Survey Items by Composite
Anes- thesi- ology
Emer- gency
ICU (Any Type) Lab
Med- icine
Obstet- rics
Pedia- trics
Phar- macy
Psych/ Mentl Hlth
Radi- ology
Reha- bili-
tation Surg-
ery
# Hospitals 256 555 464 546 528 391 260 547 274 556 524 545
# Respondents 2,607 23,692 25,274 17,241 49,105 15,120 7,307 11,727 8,057 20,060 16,037 37,946
Teamwork Within Units
A1. People support one another in this unit. 89% 87% 91% 83% 89% 90% 92% 85% 85% 88% 93% 86%
A3. When a lot of work needs to be done quickly, we work together as a team to get the work done. 88% 88% 92% 83% 85% 92% 89% 85% 84% 89% 91% 87%
A4. In this unit, people treat each other with respect. 84% 78% 85% 75% 83% 82% 85% 79% 79% 83% 90% 77%
A11. When one area in this unit gets really busy, others help out. 66% 71% 79% 67% 70% 73% 75% 72% 70% 70% 79% 67%
Supv/Mgr Expectations & Actions Promoting Patient Safety
B1. My supv/mgr says a good word when he/she sees a job done according to established patient safety procedures. 73% 76% 77% 74% 79% 78% 77% 79% 77% 77% 82% 77%
B2. My supv/mgr seriously considers staff suggestions for improving patient safety. 79% 76% 79% 75% 80% 79% 78% 83% 77% 80% 87% 79%
B3R. Whenever pressure builds up, my supv/mgr wants us to work faster, even if it means taking shortcuts. 72% 73% 78% 80% 78% 77% 78% 84% 74% 80% 83% 76%
B4R. My supv/mgr overlooks patient safety problems that happen over and over. 79% 76% 77% 78% 78% 78% 77% 83% 75% 82% 86% 78%
Organizational Learning – Continuous Improvement
A6. We are actively doing things to improve patient safety. 83% 78% 83% 81% 84% 84% 85% 90% 81% 84% 90% 84%
A9. Mistakes have led to positive changes here. 64% 56% 60% 64% 63% 65% 59% 77% 60% 62% 63% 63%
A13. After we make changes to improve patient safety, we evaluate their effectiveness. 64% 64% 70% 66% 73% 71% 70% 71% 68% 69% 76% 70%
Note: The item’s survey location is shown to the left. An “R” indicates a negatively worded item, where the percent positive response is based on those who responded “Strongly disagree” or “Disagree,” or “Never” or “Rarely” (depending on the response category used for the item).

28
Table B-2. Item-Level Average Percent Positive Response by Work Area/Unit – 2018 Database Hospitals (Page 2 of 4)
Work Area/Unit
Survey Items by Composite
Anes- thesi- ology
Emer- gency
ICU (Any Type) Lab
Med- icine
Obstet- rics
Pedia- trics
Phar- macy
Psych/ Mentl Hlth
Radi- ology
Reha- bili-
tation Surg-
ery
# Hospitals 256 555 464 546 528 391 260 547 274 556 524 545
# Respondents 2,607 23,692 25,274 17,241 49,105 15,120 7,307 11,727 8,057 20,060 16,037 37,946
Management Support for Patient Safety
F1. Hospital management provides a work climate that promotes patient safety. 72% 73% 72% 83% 77% 79% 79% 83% 77% 83% 86% 79%
F8. The actions of hospital management show that patient safety is a top priority. 67% 67% 66% 77% 72% 72% 72% 79% 72% 77% 80% 73%
F9R. Hospital management seems interested in patient safety only after an adverse event happens. 51% 49% 51% 61% 57% 57% 57% 64% 56% 60% 64% 56%
Feedback & Communication About Error
C1. We are given feedback about changes put into place based on event reports. 54% 56% 58% 56% 61% 59% 58% 63% 56% 60% 67% 59%
C3. We are informed about errors that happen in this unit. 63% 62% 63% 69% 68% 64% 66% 78% 67% 72% 74% 69%
C5. In this unit, we discuss ways to prevent errors from happening again. 74% 67% 72% 73% 75% 75% 75% 81% 74% 76% 83% 76%
Frequency of Events Reported
D1. When a mistake is made, but is caught and corrected before affecting the patient, how often is this reported? 58% 55% 56% 65% 61% 61% 62% 59% 63% 58% 63% 65%
D2. When a mistake is made, but has no potential to harm the patient, how often is this reported? 57% 58% 58% 64% 63% 63% 63% 64% 63% 60% 61% 65%
D3. When a mistake is made that could harm the patient, but does not, how often is this reported? 71% 72% 72% 81% 75% 77% 77% 80% 77% 76% 76% 77%
Note: The item’s survey location is shown to the left. An “R” indicates a negatively worded item, where the percent positive response is based on those who responded “Strongly disagree” or “Disagree,” or “Never” or “Rarely” (depending on the response category used for the item).

29
Table B-2. Item-Level Average Percent Positive Response by Work Area/Unit – 2018 Database Hospitals (Page 3 of 4)
Work Area/Unit
Survey Items by Composite
Anes- thesi- ology
Emer- gency
ICU (Any Type) Lab
Med- icine
Obstet- rics
Pedia- trics
Phar- macy
Psych/ Mentl Hlth
Radi- ology
Reha- bili-
tation Surg-
ery
# Hospitals 256 555 464 546 528 391 260 547 274 556 524 545
# Respondents 2,607 23,692 25,274 17,241 49,105 15,120 7,307 11,727 8,057 20,060 16,037 37,946
Overall Perceptions of Patient Safety
A10R. It is just by chance that more serious mistakes don’t happen around here. 63% 54% 59% 62% 59% 61% 61% 68% 57% 68% 76% 63%
A15. Patient safety is never sacrificed to get more work done. 57% 52% 51% 69% 57% 58% 62% 70% 64% 72% 79% 63%
A17R. We have patient safety problems in this unit. 64% 52% 56% 71% 58% 64% 65% 71% 54% 76% 79% 67%
A18. Our procedures and systems are good at preventing errors from happening. 72% 64% 71% 77% 72% 74% 74% 80% 67% 79% 82% 75%
Communication Openness
C2. Staff will freely speak up if they see something that may negatively affect patient care. 79% 73% 76% 76% 77% 79% 78% 80% 75% 81% 86% 81%
C4. Staff feel free to question the decisions or actions of those with more authority. 55% 47% 47% 46% 47% 46% 51% 57% 46% 48% 57% 50%
C6R. Staff are afraid to ask questions when something does not seem right. 68% 65% 66% 67% 67% 66% 66% 76% 63% 70% 77% 67%
Teamwork Across Units
F2R. Hospital units do not coordinate well with each other. 41% 40% 45% 46% 47% 47% 47% 50% 41% 51% 52% 45%
F4. There is good cooperation among hospital units that need to work together. 56% 51% 59% 59% 60% 62% 62% 62% 54% 65% 67% 58%
F6R. It is often unpleasant to work with staff from other hospital units. 57% 54% 66% 57% 66% 63% 64% 65% 60% 63% 69% 59%
F10. Hospital units work well together to provide the best care for patients. 66% 62% 68% 71% 71% 72% 71% 73% 65% 75% 75% 69%
Note: The item’s survey location is shown to the left. An “R” indicates a negatively worded item, where the percent positive response is based on those who responded “Strongly disagree” or “Disagree,” or “Never” or “Rarely” (depending on the response category used for the item).

30
Table B-2. Item-Level Average Percent Positive Response by Work Area/Unit – 2018 Database Hospitals (Page 4 of 4)
Work Area/Unit
Survey Items by Composite
Anes- thesi- ology
Emer- gency
ICU (Any Type) Lab
Med- icine
Obstet- rics
Pedia- trics
Phar- macy
Psych/ Mentl Hlth
Radi- ology
Reha- bili-
tation Surg-
ery
# Hospitals 256 555 464 546 528 391 260 547 274 556 524 545
# Respondents 2,607 23,692 25,274 17,241 49,105 15,120 7,307 11,727 8,057 20,060 16,037 37,946
Staffing
A2. We have enough staff to handle the workload. 49% 40% 49% 42% 46% 55% 58% 54% 46% 54% 60% 51%
A5R. Staff in this unit work longer hours than is best for patient care. 42% 46% 48% 50% 46% 51% 54% 61% 48% 57% 57% 45%
A7R. We use more agency/temporary staff than is best for patient care. 64% 61% 64% 64% 64% 72% 70% 72% 65% 73% 70% 67%
A14R. We work in “crisis mode,” trying to do too much, too quickly. 49% 39% 49% 45% 45% 53% 56% 56% 50% 54% 65% 48%
Handoffs & Transitions
F3R. Things “fall between the cracks” when transferring patients from one unit to another. 41% 46% 39% 32% 41% 46% 47% 28% 38% 48% 40% 41%
F5R. Important patient care information is often lost during shift changes. 49% 61% 60% 49% 55% 64% 60% 42% 52% 55% 47% 50%
F7R. Problems often occur in the exchange of information across hospital units. 46% 48% 47% 40% 47% 50% 49% 39% 41% 50% 46% 43%
F11R. Shift changes are problematic for patients in this hospital. 40% 50% 58% 43% 50% 64% 54% 42% 47% 48% 42% 40%
Nonpunitive Response to Error
A8R. Staff feel like their mistakes are held against them. 51% 46% 49% 49% 51% 54% 54% 63% 52% 53% 68% 52%
A12R. When an event is reported, it feels like the person is being written up, not the problem. 43% 41% 47% 45% 48% 50% 46% 62% 51% 50% 65% 50%
A16R. Staff worry that mistakes they make are kept in their personnel file. 34% 32% 36% 33% 37% 37% 37% 51% 40% 39% 57% 38%
Note: The item’s survey location is shown to the left. An “R” indicates a negatively worded item, where the percent positive response is based on those who responded “Strongly disagree” or “Disagree,” or “Never” or “Rarely” (depending on the response category used for the item).

31
Table B-3. Average Percentage of Respondents Giving Their Work Area/Unit a Patient Safety Grade by Work Area/Unit – 2018 Database Hospitals
Work Area/Unit
Work Area/Unit Patient Safety Grade
Anes- thesi- ology
Emer- gency
ICU (Any Type) Lab
Med- icine
Obstet- rics
Pedia- trics
Phar- macy
Psych/ Mentl Hlth
Radi- ology
Reha- bili-
tation Surg- ery
# Hospitals 256 555 464 546 528 391 260 547 274 556 524 545
# Respondents 2,607 23,692 25,274 17,241 49,105 15,120 7,307 11,727 8,057 20,060 16,037 37,946
Excellent or Very Good 79% 67% 73% 77% 73% 77% 78% 81% 69% 82% 87% 79%
A = Excellent 39% 23% 28% 33% 27% 33% 34% 38% 28% 41% 48% 37%
B = Very Good 40% 44% 45% 43% 46% 44% 45% 43% 41% 42% 40% 41%
C = Acceptable 17% 24% 21% 19% 22% 18% 17% 15% 22% 14% 11% 17%
D = Poor 3% 7% 5% 3% 5% 4% 4% 3% 7% 3% 2% 4%
E = Failing 1% 2% 1% 1% 1% 1% 1% 1% 2% 1% 0% 1%
Note: Percentages may not add to 100 due to rounding. Excellent and Very Good may not add to the subtotal for Excellent or Very Good due to rounding.

32
Table B-4. Average Percentage of Respondents Reporting Events in the Past 12 Months by Work Area/Unit – 2018 Database Hospitals
Work Area/Unit
Number of Events Reported by Respondents
Anes- thesi- ology
Emer- gency
ICU (Any Type) Lab
Med- icine
Obstet- rics
Pedia- trics
Phar- macy
Psych/ Mentl Hlth
Radi- ology
Reha- bili-
tation Surg-
ery
# Hospitals 256 555 464 546 528 391 260 547 274 556 524 545
# Respondents 2,607 23,692 25,274 17,241 49,105 15,120 7,307 11,727 8,057 20,060 16,037 37,946
1 or More Events 41% 51% 64% 51% 54% 55% 50% 57% 46% 47% 40% 51%
None 59% 49% 36% 49% 46% 45% 50% 43% 54% 53% 60% 49%
1 to 2 29% 28% 35% 23% 30% 33% 31% 18% 24% 30% 30% 29%
3 to 5 10% 15% 19% 14% 16% 16% 14% 17% 14% 12% 8% 15%
6 to 10 2% 5% 5% 7% 5% 4% 3% 10% 5% 3% 2% 4%
11 to 20 1% 3% 3% 4% 3% 2% 2% 7% 2% 2% 1% 3%
21 or More 0% 1% 1% 3% 1% 0% 1% 5% 1% 1% 0% 1%
Note: Percentages may not add to 100 due to rounding. Percentages for number of events may not add to the subtotal for 1 or more events due to rounding.

33
Appendix B: Results by Respondent Characteristics (2) Staff Position NOTE 1: Hospitals that did not ask respondents to indicate their staff position were excluded from these breakout tables. In addition, respondents who selected “Other” or who did not answer (missing) were not included.
NOTE 2: The number of hospitals and respondents in each staff position is shown. The number of hospitals is based on hospitals that asked respondents to indicate their staff position (not all hospitals asked this question). However, the precise number of hospitals and respondents corresponding to each data cell in the tables will vary because hospitals may have omitted a specific survey item and because of individual nonresponse/missing data.

34
Table B-5. Composite-Level Average Percent Positive Response by Staff Position – 2018 Database Hospitals
Staff Position
Patient Safety Culture Composites Admin/ Mgmt
Attending/ Physician/ Resident/
PA or NP Dietitian
Pat. Care Asst/ Aide/ Care
Partner Pharm-
acist
RN/ LVN/ LPN
Tech (EKG, Lab,
Radiol)
Therapist (Respir, Phys,
Occup, Speech)
Unit Asst/ Clerk/
Secretary
# Hospitals 592 512 422 574 552 600 582 570 572
# Respondents 23,959 18,557 1,851 21,964 6,750 126,390 38,512 17,325 16,944
1. Teamwork Within Units 91% 85% 83% 78% 83% 83% 79% 87% 81%
2. Supv/Mgr Expectations & Actions Promoting Patient Safety 90% 79% 83% 78% 83% 77% 78% 81% 82%
3. Organizational Learning – Continuous Improvement 85% 71% 72% 74% 79% 72% 71% 71% 73%
4. Management Support for Patient Safety 86% 70% 77% 73% 75% 65% 73% 73% 77%
5. Feedback & Communication About Error 81% 64% 71% 71% 74% 65% 68% 69% 72%
6. Frequency of Events Reported 75% 61% 61% 71% 63% 67% 67% 61% 71%
7. Overall Perceptions of Patient Safety 78% 65% 69% 63% 71% 61% 71% 73% 68%
8. Communication Openness 80% 69% 68% 60% 73% 64% 64% 69% 64%
9. Teamwork Across Units 71% 63% 66% 62% 64% 59% 61% 66% 63%
10. Staffing 64% 53% 54% 47% 62% 53% 54% 60% 53%
11. Handoffs & Transitions 51% 46% 42% 53% 38% 48% 47% 46% 50%
12. Nonpunitive Response to Error 68% 43% 52% 40% 63% 47% 45% 55% 43%
Average Across Composites 77% 64% 67% 64% 69% 63% 65% 68% 66%

35
Table B-6. Item-Level Average Percent Positive Response by Staff Position – 2018 Database Hospitals (Page 1 of 4)
Staff Position
Survey Items by Composite Admin/ Mgmt
Attending/ Physician/ Resident/
PA or NP Dietitian
Pat. Care Asst/ Aide/ Care
Partner Pharm-
acist
RN/ LVN/ LPN
Tech (EKG, Lab,
Radiol)
Therapist (Respir, Phys,
Occup, Speech)
Unit Asst/ Clerk/
Secretary
# Hospitals 592 512 422 574 552 600 582 570 572
# Respondents 23,959 18,557 1,851 21,964 6,750 126,390 38,512 17,325 16,944
Teamwork Within Units
A1. People support one another in this unit. 95% 90% 88% 84% 89% 89% 84% 92% 86%
A3. When a lot of work needs to be done quickly, we work together as a team to get the work done. 95% 89% 87% 81% 88% 89% 85% 90% 86%
A4. In this unit, people treat each other with respect. 91% 88% 82% 77% 83% 83% 77% 87% 79%
A11. When one area in this unit gets really busy, others help out. 82% 72% 75% 69% 74% 72% 68% 79% 72%
Supv/Mgr Expectations & Actions Promoting Patient Safety
B1. My supv/mgr says a good word when he/she sees a job done according to established patient safety procedures. 90% 77% 82% 79% 80% 78% 76% 79% 82%
B2. My supv/mgr seriously considers staff suggestions for improving patient safety. 92% 82% 86% 80% 84% 78% 77% 83% 83%
B3R. Whenever pressure builds up, my supv/mgr wants us to work faster, even if it means taking shortcuts. 90% 76% 79% 79% 85% 76% 79% 80% 81%
B4R. My supv/mgr overlooks patient safety problems that happen over and over. 90% 79% 83% 76% 84% 77% 79% 83% 81%
Organizational Learning – Continuous Improvement
A6. We are actively doing things to improve patient safety. 91% 83% 84% 86% 90% 83% 83% 85% 85%
A9. Mistakes have led to positive changes here. 82% 67% 60% 60% 80% 62% 63% 60% 62%
A13. After we make changes to improve patient safety, we evaluate their effectiveness. 81% 64% 72% 76% 68% 71% 68% 70% 71%
Note: The item’s survey location is shown to the left. An “R” indicates a negatively worded item, where the percent positive response is based on those who responded “Strongly disagree” or “Disagree,” or “Never” or “Rarely” (depending on the response category used for the item).

36
Table B-6. Item-Level Average Percent Positive Response by Staff Position – 2018 Database Hospitals (Page 2 of 4)
Staff Position
Survey Items by Composite Admin/ Mgmt
Attending/ Physician/ Resident/
PA or NP Dietitian
Pat. Care Asst/ Aide/ Care
Partner Pharm-
acist
RN/ LVN/ LPN
Tech (EKG, Lab,
Radiol)
Therapist (Respir, Phys,
Occup, Speech)
Unit Asst/ Clerk/
Secretary
# Hospitals 592 512 422 574 552 600 582 570 572
# Respondents 23,959 18,557 1,851 21,964 6,750 126,390 38,512 17,325 16,944
Management Support for Patient Safety
F1. Hospital management provides a work climate that promotes patient safety. 92% 79% 87% 83% 81% 74% 83% 83% 86%
F8. The actions of hospital management show that patient safety is a top priority. 90% 73% 81% 78% 79% 68% 77% 76% 81%
F9R. Hospital management seems interested in patient safety only after an adverse event happens. 76% 57% 62% 58% 64% 54% 60% 60% 63%
Feedback & Communication About Error
C1. We are given feedback about changes put into place based on event reports. 74% 56% 63% 64% 64% 58% 58% 62% 63%
C3. We are informed about errors that happen in this unit. 82% 62% 73% 73% 78% 64% 71% 69% 75%
C5. In this unit, we discuss ways to prevent errors from happening again. 89% 73% 78% 76% 81% 73% 75% 77% 78%
Frequency of Events Reported
D1. When a mistake is made, but is caught and corrected before affecting the patient, how often is this reported? 71% 56% 58% 69% 52% 60% 62% 56% 69%
D2. When a mistake is made, but has no potential to harm the patient, how often is this reported? 70% 54% 54% 68% 60% 64% 62% 55% 66%
D3. When a mistake is made that could harm the patient, but does not, how often is this reported? 83% 71% 71% 76% 78% 76% 78% 71% 78%
Note: The item’s survey location is shown to the left. An “R” indicates a negatively worded item, where the percent positive response is based on those who responded “Strongly disagree” or “Disagree,” or “Never” or “Rarely” (depending on the response category used for the item).

37
Table B-6. Item-Level Average Percent Positive Response by Staff Position – 2018 Database Hospitals (Page 3 of 4)
Staff Position
Survey Items by Composite Admin/ Mgmt
Attending/ Physician/ Resident/
PA or NP Dietitian
Pat. Care Asst/ Aide/ Care
Partner Pharm-
acist
RN/ LVN/ LPN
Tech (EKG, Lab,
Radiol)
Therapist (Respir, Phys,
Occup, Speech)
Unit Asst/ Clerk/
Secretary
# Hospitals 592 512 422 574 552 600 582 570 572
# Respondents 23,959 18,557 1,851 21,964 6,750 126,390 38,512 17,325 16,944
Overall Perceptions of Patient Safety
A10R. It is just by chance that more serious mistakes don’t happen around here. 77% 64% 64% 52% 70% 61% 64% 70% 59%
A15. Patient safety is never sacrificed to get more work done. 76% 61% 69% 64% 66% 55% 71% 70% 71%
A17R. We have patient safety problems in this unit. 77% 63% 69% 63% 70% 57% 73% 74% 69%
A18. Our procedures and systems are good at preventing errors from happening. 81% 71% 73% 73% 78% 71% 77% 77% 74%
Communication Openness
C2. Staff will freely speak up if they see something that may negatively affect patient care. 88% 77% 79% 76% 81% 77% 79% 82% 80%
C4. Staff feel free to question the decisions or actions of those with more authority. 73% 60% 54% 42% 60% 48% 46% 53% 46%
C6R. Staff are afraid to ask questions when something does not seem right. 80% 71% 71% 64% 78% 66% 68% 72% 67%
Teamwork Across Units
F2R. Hospital units do not coordinate well with each other. 61% 49% 53% 49% 52% 45% 48% 53% 51%
F4. There is good cooperation among hospital units that need to work together. 72% 63% 67% 62% 63% 58% 62% 67% 64%
F6R. It is often unpleasant to work with staff from other hospital units. 71% 67% 69% 62% 69% 63% 61% 70% 63%
F10. Hospital units work well together to provide the best care for patients. 80% 71% 77% 75% 72% 68% 73% 76% 74%
Note: The item’s survey location is shown to the left. An “R” indicates a negatively worded item, where the percent positive response is based on those who responded “Strongly disagree” or “Disagree,” or “Never” or “Rarely” (depending on the response category used for the item).

38
Table B-6. Item-Level Average Percent Positive Response by Staff Position – 2018 Database Hospitals (Page 4 of 4)
Staff Position
Survey Items by Composite Admin/ Mgmt
Attending/ Physician/ Resident/
PA or NP Dietitian
Pat. Care Asst/ Aide/ Care
Partner Pharm-
acist
RN/ LVN/ LPN
Tech (EKG, Lab,
Radiol)
Therapist (Respir, Phys,
Occup, Speech)
Unit Asst/ Clerk/
Secretary
# Hospitals 592 512 422 574 552 600 582 570 572
# Respondents 23,959 18,557 1,851 21,964 6,750 126,390 38,512 17,325 16,944
Staffing
A2. We have enough staff to handle the workload. 68% 55% 54% 43% 55% 49% 49% 55% 52%
A5R. Staff in this unit work longer hours than is best for patient care. 57% 48% 46% 40% 64% 50% 52% 55% 46%
A7R. We use more agency/temporary staff than is best for patient care. 70% 57% 62% 59% 74% 68% 67% 71% 62%
A14R. We work in “crisis mode,” trying to do too much, too quickly. 60% 52% 55% 47% 55% 46% 50% 58% 52%
Handoffs & Transitions
F3R. Things “fall between the cracks” when transferring patients from one unit to another. 47% 44% 40% 49% 28% 41% 42% 40% 45%
F5R. Important patient care information is often lost during shift changes. 55% 48% 44% 60% 42% 55% 53% 48% 57%
F7R. Problems often occur in the exchange of information across hospital units. 51% 47% 44% 49% 39% 47% 46% 48% 49%
F11R. Shift changes are problematic for patients in this hospital. 51% 44% 41% 54% 41% 50% 47% 47% 47%
Nonpunitive Response to Error
A8R. Staff feel like their mistakes are held against them. 73% 49% 60% 46% 66% 53% 51% 61% 50%
A12R. When an event is reported, it feels like the person is being written up, not the problem. 74% 47% 50% 40% 67% 51% 47% 56% 44%
A16R. Staff worry that mistakes they make are kept in their personnel file. 57% 34% 47% 33% 56% 38% 37% 48% 35%
Note: The item’s survey location is shown to the left. An “R” indicates a negatively worded item, where the percent positive response is based on those who responded “Strongly disagree” or “Disagree,” or “Never” or “Rarely” (depending on the response category used for the item).
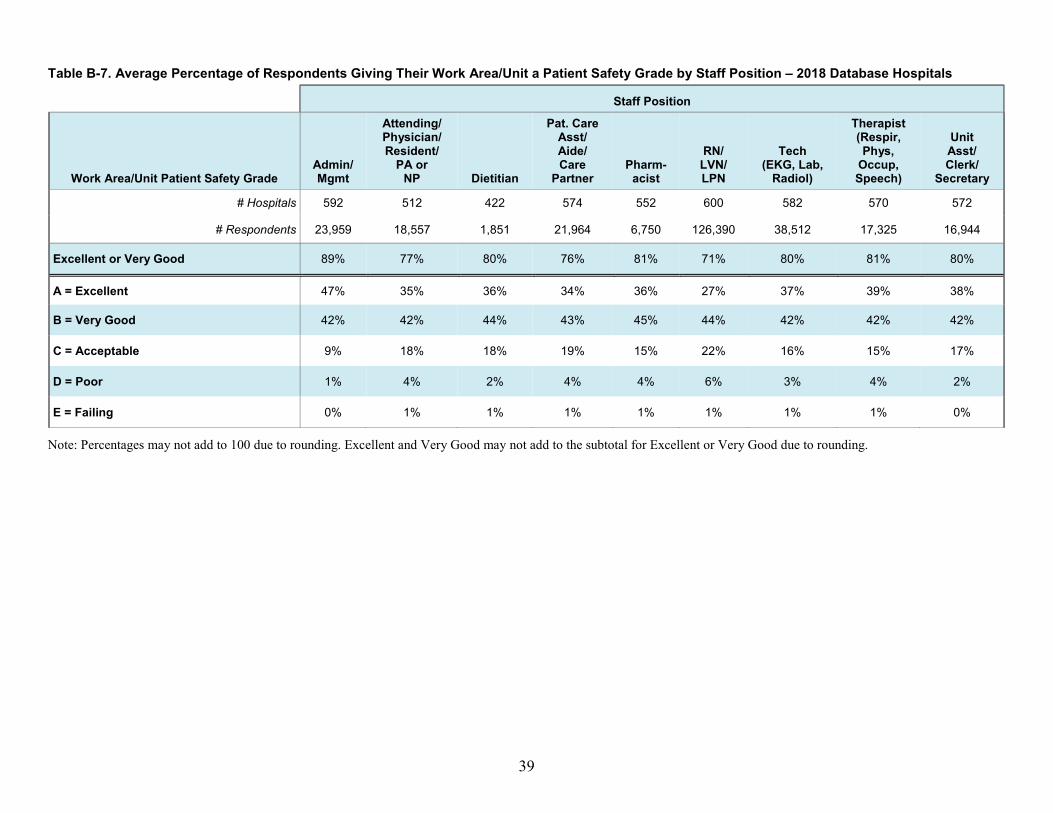
39
Table B-7. Average Percentage of Respondents Giving Their Work Area/Unit a Patient Safety Grade by Staff Position – 2018 Database Hospitals
Staff Position
Work Area/Unit Patient Safety Grade Admin/ Mgmt
Attending/ Physician/ Resident/
PA or NP Dietitian
Pat. Care Asst/ Aide/ Care
Partner Pharm-
acist
RN/ LVN/ LPN
Tech (EKG, Lab,
Radiol)
Therapist (Respir, Phys,
Occup, Speech)
Unit Asst/ Clerk/
Secretary
# Hospitals 592 512 422 574 552 600 582 570 572
# Respondents 23,959 18,557 1,851 21,964 6,750 126,390 38,512 17,325 16,944
Excellent or Very Good 89% 77% 80% 76% 81% 71% 80% 81% 80%
A = Excellent 47% 35% 36% 34% 36% 27% 37% 39% 38%
B = Very Good 42% 42% 44% 43% 45% 44% 42% 42% 42%
C = Acceptable 9% 18% 18% 19% 15% 22% 16% 15% 17%
D = Poor 1% 4% 2% 4% 4% 6% 3% 4% 2%
E = Failing 0% 1% 1% 1% 1% 1% 1% 1% 0%
Note: Percentages may not add to 100 due to rounding. Excellent and Very Good may not add to the subtotal for Excellent or Very Good due to rounding.
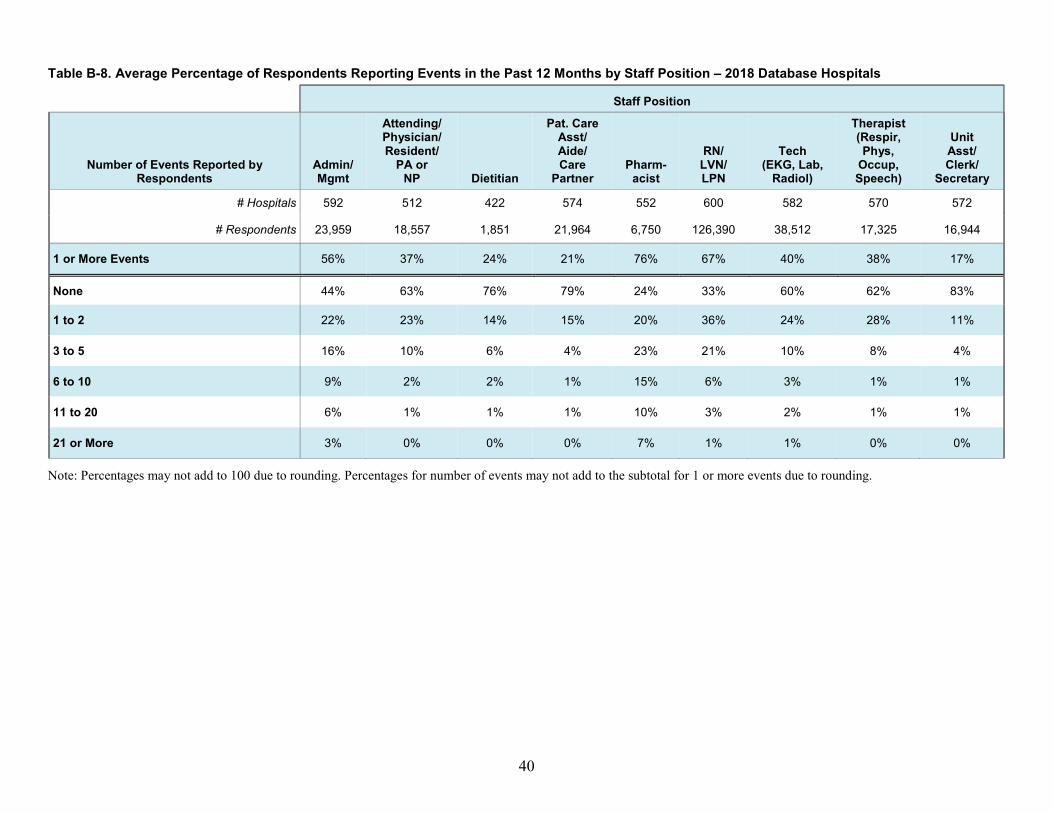
40
Table B-8. Average Percentage of Respondents Reporting Events in the Past 12 Months by Staff Position – 2018 Database Hospitals
Staff Position
Number of Events Reported by Respondents
Admin/ Mgmt
Attending/ Physician/ Resident/
PA or NP Dietitian
Pat. Care Asst/ Aide/ Care
Partner Pharm-
acist
RN/ LVN/ LPN
Tech (EKG, Lab,
Radiol)
Therapist (Respir, Phys,
Occup, Speech)
Unit Asst/ Clerk/
Secretary
# Hospitals 592 512 422 574 552 600 582 570 572
# Respondents 23,959 18,557 1,851 21,964 6,750 126,390 38,512 17,325 16,944
1 or More Events 56% 37% 24% 21% 76% 67% 40% 38% 17%
None 44% 63% 76% 79% 24% 33% 60% 62% 83%
1 to 2 22% 23% 14% 15% 20% 36% 24% 28% 11%
3 to 5 16% 10% 6% 4% 23% 21% 10% 8% 4%
6 to 10 9% 2% 2% 1% 15% 6% 3% 1% 1%
11 to 20 6% 1% 1% 1% 10% 3% 2% 1% 1%
21 or More 3% 0% 0% 0% 7% 1% 1% 0% 0%
Note: Percentages may not add to 100 due to rounding. Percentages for number of events may not add to the subtotal for 1 or more events due to rounding.

41
Appendix B: Results by Respondent Characteristics (3) Interaction With Patients NOTE 1: Hospitals that did not ask respondents to indicate their interaction with patients were excluded from these breakout tables. In addition, respondents who did not answer (missing) were not included.
NOTE 2: The number of hospitals and respondents is shown in each table. The number of hospitals is based on hospitals that asked respondents to indicate their interaction with patients (not all hospitals asked this question). However, the precise number of hospitals and respondents corresponding to each data cell in the tables will vary because hospitals may have omitted a specific survey item and because of individual nonresponse/missing data.

42
Table B-9. Composite-Level Average Percent Positive Response by Interaction With Patients – 2018 Database Hospitals
Interaction With Patients
Patient Safety Culture Composites WITH
Direct Interaction WITHOUT
Direct Interaction
# Hospitals 629 627
# Respondents 277,498 80,059
1. Teamwork Within Units 82% 83%
2. Supv/Mgr Expectations & Actions Promoting Patient Safety 79% 83%
3. Organizational Learning – Continuous Improvement 72% 74%
4. Management Support for Patient Safety 70% 79%
5. Feedback & Communication About Error 68% 73%
6. Frequency of Events Reported 66% 70%
7. Overall Perceptions of Patient Safety 66% 70%
8. Communication Openness 65% 69%
9. Teamwork Across Units 61% 64%
10. Staffing 54% 53%
11. Handoffs & Transitions 49% 44%
12. Nonpunitive Response to Error 47% 51%
Average Across Composites 65% 68%

43
Table B-10. Item-Level Average Percent Positive Response by Interaction With Patients – 2018 Database Hospitals (Page 1 of 4)
Interaction With Patients
Survey Items by Composite WITH
Direct Interaction WITHOUT
Direct Interaction
# Hospitals 629 627
# Respondents 277,498 80,059
Teamwork Within Units
A1. People support one another in this unit. 88% 88%
A3. When a lot of work needs to be done quickly, we work together as a team to get the work done. 87% 88%
A4. In this unit, people treat each other with respect. 82% 83%
A11. When one area in this unit gets really busy, others help out. 72% 73%
Supv/Mgr Expectations & Actions Promoting Patient Safety
B1. My supv/mgr says a good word when he/she sees a job done according to established patient safety procedures. 79% 83%
B2. My supv/mgr seriously considers staff suggestions for improving patient safety. 80% 83%
B3R. Whenever pressure builds up, my supv/mgr wants us to work faster, even if it means taking shortcuts. 78% 82%
B4R. My supv/mgr overlooks patient safety problems that happen over and over. 79% 82%
Organizational Learning – Continuous Improvement
A6. We are actively doing things to improve patient safety. 84% 84%
A9. Mistakes have led to positive changes here. 62% 69%
A13. After we make changes to improve patient safety, we evaluate their effectiveness. 71% 71%
Note: The item’s survey location is shown to the left. An “R” indicates a negatively worded item, where the percent positive response is based on those who responded “Strongly disagree” or “Disagree,” or “Never” or “Rarely” (depending on the response category used for the item).

44
Table B-10. Item-Level Average Percent Positive Response by Interaction With Patients – 2018 Database Hospitals (Page 2 of 4)
Interaction With Patients
Survey Items by Composite WITH
Direct Interaction WITHOUT
Direct Interaction
# Hospitals 629 627
# Respondents 277,498 80,059
Management Support for Patient Safety
F1. Hospital management provides a work climate that promotes patient safety. 80% 88%
F8. The actions of hospital management show that patient safety is a top priority. 74% 83%
F9R. Hospital management seems interested in patient safety only after an adverse event happens. 58% 66%
Feedback & Communication About Error
C1. We are given feedback about changes put into place based on event reports. 60% 64%
C3. We are informed about errors that happen in this unit. 68% 74%
C5. In this unit, we discuss ways to prevent errors from happening again. 75% 80%
Frequency of Events Reported
D1. When a mistake is made, but is caught and corrected before affecting the patient, how often is this reported? 61% 67%
D2. When a mistake is made, but has no potential to harm the patient, how often is this reported? 62% 65%
D3. When a mistake is made that could harm the patient, but does not, how often is this reported? 76% 78%
Note: The item’s survey location is shown to the left. An “R” indicates a negatively worded item, where the percent positive response is based on those who responded “Strongly disagree” or “Disagree,” or “Never” or “Rarely” (depending on the response category used for the item).

45
Table B-10. Item-Level Average Percent Positive Response by Interaction With Patients – 2018 Database Hospitals (Page 3 of 4)
Interaction With Patients
Survey Items by Composite WITH
Direct Interaction WITHOUT
Direct Interaction
# Hospitals 629 627
# Respondents 277,498 80,059
Overall Perceptions of Patient Safety
A10R. It is just by chance that more serious mistakes don’t happen around here. 62% 63%
A15. Patient safety is never sacrificed to get more work done. 63% 70%
A17R. We have patient safety problems in this unit. 64% 69%
A18. Our procedures and systems are good at preventing errors from happening. 73% 76%
Communication Openness
C2. Staff will freely speak up if they see something that may negatively affect patient care. 78% 81%
C4. Staff feel free to question the decisions or actions of those with more authority. 49% 55%
C6R. Staff are afraid to ask questions when something does not seem right. 67% 72%
Teamwork Across Units
F2R. Hospital units do not coordinate well with each other. 48% 52%
F4. There is good cooperation among hospital units that need to work together. 62% 65%
F6R. It is often unpleasant to work with staff from other hospital units. 64% 62%
F10. Hospital units work well together to provide the best care for patients. 72% 75%
Note: The item’s survey location is shown to the left. An “R” indicates a negatively worded item, where the percent positive response is based on those who responded “Strongly disagree” or “Disagree,” or “Never” or “Rarely” (depending on the response category used for the item).

46
Table B-10. Item-Level Average Percent Positive Response by Interaction With Patients – 2018 Database Hospitals (Page 4 of 4)
Interaction With Patients
Survey Items by Composite WITH
Direct Interaction WITHOUT
Direct Interaction
# Hospitals 629 627
# Respondents 277,498 80,059
Staffing
A2. We have enough staff to handle the workload. 51% 56%
A5R. Staff in this unit work longer hours than is best for patient care. 49% 48%
A7R. We use more agency/temporary staff than is best for patient care. 66% 59%
A14R. We work in “crisis mode,” trying to do too much, too quickly. 50% 50%
Handoffs & Transitions
F3R. Things “fall between the cracks” when transferring patients from one unit to another. 43% 39%
F5R. Important patient care information is often lost during shift changes. 55% 48%
F7R. Problems often occur in the exchange of information across hospital units. 48% 43%
F11R. Shift changes are problematic for patients in this hospital. 49% 44%
Nonpunitive Response to Error
A8R. Staff feel like their mistakes are held against them. 53% 57%
A12R. When an event is reported, it feels like the person is being written up, not the problem. 49% 53%
A16R. Staff worry that mistakes they make are kept in their personnel file. 39% 42%
Note: The item’s survey location is shown to the left. An “R” indicates a negatively worded item, where the percent positive response is based on those who responded “Strongly disagree” or “Disagree,” or “Never” or “Rarely” (depending on the response category used for the item).

47
Table B-11. Average Percentage of Respondents Giving Their Work Area/Unit a Patient Safety Grade by Interaction With Patients – 2018 Database Hospitals
Interaction With Patients
Work Area/Unit Patient Safety Grade WITH
Direct Interaction WITHOUT
Direct Interaction
# Hospitals 629 627
# Respondents 277,498 80,059
Excellent or Very Good 76% 83%
A = Excellent 34% 40%
B = Very Good 43% 43%
C = Acceptable 18% 15%
D = Poor 4% 2%
E = Failing 1% 0%
Note: Percentages may not add to 100 due to rounding. Excellent and Very Good may not add to the subtotal for Excellent or Very Good due to rounding.

48
Table B-12. Average Percentage of Respondents Reporting Events in the Past 12 Months by Interaction With Patients – 2018 Database Hospitals
Interaction With Patients
Number of Events Reported by Respondents WITH
Direct Interaction WITHOUT
Direct Interaction
# Hospitals 629 627
# Respondents 277,498 80,059
1 or More Events 49% 31%
None 51% 69%
1 to 2 28% 14%
3 to 5 14% 8%
6 to 10 4% 4%
11 to 20 2% 3%
21 or More 1% 2%
Note: Percentages may not add to 100 due to rounding. Percentages for number of events may not add to the subtotal for 1 or more events due to rounding.

49
Appendix B: Results by Respondent Characteristics (4) Tenure in Current Work Area/Unit NOTE 1: Hospitals that did not ask respondents to indicate their amount of tenure in current work area/unit were excluded from these breakout tables. In addition, respondents who did not answer (missing) were not included.
NOTE 2: The number of hospitals and respondents is shown in each table. The number of hospitals is based on hospitals that asked respondents to indicate their amount of tenure in current work area/unit (not all hospitals asked this question). However, the precise number of hospitals and respondents corresponding to each data cell in the tables will vary because hospitals may have omitted a specific survey item and because of individual nonresponse/missing data.

50
Table B-13. Composite-Level Average Percent Positive Response by Tenure in Current Work Area/Unit – 2018 Database Hospitals
Tenure in Current Work Area/Unit
Patient Safety Culture Composites
Less Than
1 Year 1 to 5 Years
6 to 10 Years
11 to 15 Years
16 to 20 Years
21 Years or More
# Hospitals 574 576 574 569 562 556
# Respondents 56,984 135,427 57,370 35,666 22,113 25,314
1. Teamwork Within Units 86% 82% 81% 82% 83% 84%
2. Supv/Mgr Expectations & Actions Promoting Patient Safety 84% 79% 78% 79% 80% 82%
3. Organizational Learning – Continuous Improvement 74% 72% 72% 73% 74% 76%
4. Management Support for Patient Safety 78% 71% 70% 72% 73% 77%
5. Feedback & Communication About Error 75% 68% 67% 68% 69% 69%
6. Frequency of Events Reported 70% 66% 67% 67% 68% 69%
7. Overall Perceptions of Patient Safety 71% 65% 65% 66% 67% 70%
8. Communication Openness 70% 64% 64% 66% 67% 68%
9. Teamwork Across Units 68% 60% 60% 61% 64% 66%
10. Staffing 56% 53% 54% 54% 55% 56%
11. Handoffs & Transitions 54% 47% 46% 46% 48% 48%
12. Nonpunitive Response to Error 48% 48% 48% 49% 48% 52%
Average Across Composites 70% 65% 64% 65% 66% 68%

51
Table B-14. Item-Level Average Percent Positive Response by Tenure in Current Work Area/Unit – 2018 Database Hospitals (Page 1 of 4)
Tenure in Current Work Area/Unit
Survey Items by Composite
Less Than
1 Year 1 to 5 Years
6 to 10 Years
11 to 15 Years
16 to 20 Years
21 Years or More
# Hospitals 574 576 574 569 562 556
# Respondents 56,984 135,427 57,370 35,666 22,113 25,314
Teamwork Within Units
A1. People support one another in this unit. 91% 87% 87% 87% 88% 90%
A3. When a lot of work needs to be done quickly, we work together as a team to get the work done. 89% 87% 87% 88% 89% 89%
A4. In this unit, people treat each other with respect. 86% 82% 81% 82% 83% 84%
A11. When one area in this unit gets really busy, others help out. 79% 72% 71% 72% 72% 73%
Supv/Mgr Expectations & Actions Promoting Patient Safety
B1. My supv/mgr says a good word when he/she sees a job done according to established patient safety procedures. 85% 79% 78% 79% 80% 81%
B2. My supv/mgr seriously considers staff suggestions for improving patient safety. 86% 80% 79% 81% 81% 83%
B3R. Whenever pressure builds up, my supv/mgr wants us to work faster, even if it means taking shortcuts. 83% 78% 77% 78% 79% 80%
B4R. My supv/mgr overlooks patient safety problems that happen over and over. 82% 79% 79% 80% 81% 82%
Organizational Learning – Continuous Improvement
A6. We are actively doing things to improve patient safety. 87% 83% 83% 83% 84% 85%
A9. Mistakes have led to positive changes here. 62% 62% 64% 65% 66% 69%
A13. After we make changes to improve patient safety, we evaluate their effectiveness. 74% 70% 69% 70% 72% 73%
Note: The item’s survey location is shown to the left. An “R” indicates a negatively worded item, where the percent positive response is based on those who responded “Strongly disagree” or “Disagree,” or “Never” or “Rarely” (depending on the response category used for the item).

52
Table B-14. Item-Level Average Percent Positive Response by Tenure in Current Work Area/Unit – 2018 Database Hospitals (Page 2 of 4)
Tenure in Current Work Area/Unit
Survey Items by Composite
Less Than
1 Year 1 to 5 Years
6 to 10 Years
11 to 15 Years
16 to 20 Years
21 Years or More
# Hospitals 574 576 574 569 562 556
# Respondents 56,984 135,427 57,370 35,666 22,113 25,314
Management Support for Patient Safety
F1. Hospital management provides a work climate that promotes patient safety. 88% 80% 79% 80% 82% 84%
F8. The actions of hospital management show that patient safety is a top priority. 82% 74% 74% 75% 76% 79%
F9R. Hospital management seems interested in patient safety only after an adverse event happens. 64% 57% 58% 59% 62% 66%
Feedback & Communication About Error
C1. We are given feedback about changes put into place based on event reports. 69% 59% 58% 59% 61% 63%
C3. We are informed about errors that happen in this unit. 76% 69% 68% 69% 69% 69%
C5. In this unit, we discuss ways to prevent errors from happening again. 82% 75% 74% 75% 76% 77%
Frequency of Events Reported
D1. When a mistake is made, but is caught and corrected before affecting the patient, how often is this reported?
67% 61% 62% 62% 63% 64%
D2. When a mistake is made, but has no potential to harm the patient, how often is this reported?
66% 62% 63% 63% 64% 65%
D3. When a mistake is made that could harm the patient, but does not, how often is this reported?
77% 75% 75% 75% 77% 78%
Note: The item’s survey location is shown to the left. An “R” indicates a negatively worded item, where the percent positive response is based on those who responded “Strongly disagree” or “Disagree,” or “Never” or “Rarely” (depending on the response category used for the item).

53
Table B-14. Item-Level Average Percent Positive Response by Tenure in Current Work Area/Unit – 2018 Database Hospitals (Page 3 of 4)
Tenure in Current Work Area/Unit
Survey Items by Composite
Less Than
1 Year 1 to 5 Years
6 to 10 Years
11 to 15 Years
16 to 20 Years
21 Years or More
# Hospitals 574 576 574 569 562 556
# Respondents 56,984 135,427 57,370 35,666 22,113 25,314
Overall Perceptions of Patient Safety
A10R. It is just by chance that more serious mistakes don’t happen around here. 64% 61% 62% 61% 62% 65%
A15. Patient safety is never sacrificed to get more work done. 71% 63% 63% 65% 65% 67%
A17R. We have patient safety problems in this unit. 70% 64% 64% 65% 66% 68%
A18. Our procedures and systems are good at preventing errors from happening. 77% 72% 72% 75% 75% 78%
Communication Openness
C2. Staff will freely speak up if they see something that may negatively affect patient care. 82% 77% 78% 79% 80% 80%
C4. Staff feel free to question the decisions or actions of those with more authority. 53% 48% 49% 51% 52% 56%
C6R. Staff are afraid to ask questions when something does not seem right. 75% 68% 66% 67% 67% 69%
Teamwork Across Units
F2R. Hospital units do not coordinate well with each other. 56% 47% 48% 49% 52% 54%
F4. There is good cooperation among hospital units that need to work together. 69% 60% 60% 62% 65% 67%
F6R. It is often unpleasant to work with staff from other hospital units. 69% 62% 62% 62% 64% 66%
F10. Hospital units work well together to provide the best care for patients. 78% 71% 71% 72% 74% 76%
Note: The item’s survey location is shown to the left. An “R” indicates a negatively worded item, where the percent positive response is based on those who responded “Strongly disagree” or “Disagree,” or “Never” or “Rarely” (depending on the response category used for the item).

54
Table B-14. Item-Level Average Percent Positive Response by Tenure in Current Work Area/Unit – 2018 Database Hospitals (Page 4 of 4)
Tenure in Current Work Area/Unit
Survey Items by Composite
Less Than
1 Year 1 to 5 Years
6 to 10 Years
11 to 15 Years
16 to 20 Years
21 Years or More
# Hospitals 574 576 574 569 562 556
# Respondents 56,984 135,427 57,370 35,666 22,113 25,314
Staffing
A2. We have enough staff to handle the workload. 58% 50% 51% 53% 54% 55%
A5R. Staff in this unit work longer hours than is best for patient care. 48% 48% 50% 50% 50% 52%
A7R. We use more agency/temporary staff than is best for patient care. 62% 64% 66% 66% 66% 68%
A14R. We work in “crisis mode,” trying to do too much, too quickly. 56% 49% 49% 49% 49% 51%
Handoffs & Transitions
F3R. Things “fall between the cracks” when transferring patients from one unit to another. 49% 41% 41% 41% 43% 43%
F5R. Important patient care information is often lost during shift changes. 61% 53% 51% 50% 53% 53%
F7R. Problems often occur in the exchange of information across hospital units. 53% 46% 45% 46% 49% 48%
F11R. Shift changes are problematic for patients in this hospital. 55% 48% 46% 46% 47% 48%
Nonpunitive Response to Error
A8R. Staff feel like their mistakes are held against them. 56% 53% 54% 54% 54% 57%
A12R. When an event is reported, it feels like the person is being written up, not the problem. 48% 49% 51% 52% 53% 56%
A16R. Staff worry that mistakes they make are kept in their personnel file. 41% 40% 39% 39% 39% 41%
Note: The item’s survey location is shown to the left. An “R” indicates a negatively worded item, where the percent positive response is based on those who responded “Strongly disagree” or “Disagree,” or “Never” or “Rarely” (depending on the response category used for the item).

55
Table B-15. Average Percentage of Respondents Giving Their Work Area/Unit a Patient Safety Grade by Tenure in Current Work Area/Unit – 2018 Database Hospitals
Tenure in Current Work Area/Unit
Work Area/Unit Patient Safety Grade
Less Than
1 Year 1 to 5 Years
6 to 10 Years
11 to 15 Years
16 to 20 Years
21 Years or More
# Hospitals 574 576 574 569 562 556
# Respondents 56,984 135,427 57,370 35,666 22,113 25,314
Excellent or Very Good 84% 76% 76% 77% 78% 79%
A = Excellent 41% 33% 34% 35% 35% 36%
B = Very Good 42% 43% 42% 42% 43% 43%
C = Acceptable 13% 19% 19% 18% 18% 17%
D = Poor 2% 4% 4% 4% 3% 3%
E = Failing 0% 1% 1% 1% 1% 1%
Note: Percentages may not add to 100 due to rounding. Excellent and Very Good may not add to the subtotal for Excellent or Very Good due to rounding.

56
Table B-16. Average Percentage of Respondents Reporting Events in the Past 12 Months by Tenure in Current Work Area/Unit – 2018 Database Hospitals
Tenure in Current Work Area/Unit
Number of Events Reported by Respondents
Less Than
1 Year 1 to 5 Years
6 to 10 Years
11 to 15 Years
16 to 20 Years
21 Years or More
# Hospitals 574 576 574 569 562 556
# Respondents 56,984 135,427 57,370 35,666 22,113 25,314
1 or More Events 31% 48% 50% 48% 48% 48%
None 69% 52% 50% 52% 52% 52%
1 to 2 20% 26% 26% 25% 24% 26%
3 to 5 8% 14% 15% 14% 14% 14%
6 to 10 1% 4% 5% 5% 5% 5%
11 to 20 1% 3% 3% 3% 3% 2%
21 or More 0% 1% 1% 1% 1% 2%
Note: Percentages may not add to 100 due to rounding. Percentages for number of events may not add to the subtotal for 1 or more events due to rounding.

57
Part III
Appendix C: Trending Results by Hospital Characteristics (1) Bed Size NOTE: Results are from 306 hospitals. The number of hospitals and respondents in each bed size category is shown in each table. However, the precise number of hospitals and respondents corresponding to each data cell in a table will vary because hospitals may have omitted a specific survey item and because of individual nonresponse/missing data.

58
Table C-1. Trending: Composite-Level Average Percent Positive Response by Bed Size – 2018 Database Hospitals (Page 1 of 2)
Bed Size
Patient Safety Culture Composites Database
Year 6-24 Beds
25-49 Beds
50-99 Beds
100-199 Beds
200-299 Beds
300-399 Beds
400-499 Beds
500+ Beds
# Hospitals Both Years 11 22 55 85 57 30 17 29
# Respondents Most Recent 914 3,275 15,441 48,200 44,111 28,319 23,317 64,853
Previous 911 3,565 14,643 42,783 41,437 25,460 22,050 61,825
1. Teamwork Within Units Most Recent 84% 83% 83% 82% 82% 81% 83% 80%
Previous 84% 85% 83% 82% 81% 80% 81% 79%
Change 0% -2% 0% 0% 1% 1% 2% 1%
2. Supv/Mgr Expectations & Actions Promoting Patient Safety Most Recent 83% 82% 82% 80% 79% 78% 79% 77%
Previous 82% 83% 79% 79% 78% 76% 78% 76%
Change 1% -1% 3% 1% 1% 2% 1% 1%
3. Organizational Learning – Continuous Improvement Most Recent 75% 73% 74% 73% 72% 71% 73% 71%
Previous 72% 76% 74% 73% 71% 71% 72% 71%
Change 3% -3% 0% 0% 1% 0% 1% 0%
4. Management Support for Patient Safety Most Recent 78% 78% 75% 74% 71% 70% 71% 67%
Previous 79% 81% 75% 74% 71% 69% 69% 67%
Change -1% -3% 0% 0% 0% 1% 2% 0%
5. Feedback & Communication About Error Most Recent 71% 69% 70% 70% 69% 68% 70% 67%
Previous 70% 70% 69% 70% 67% 66% 69% 66%
Change 1% -1% 1% 0% 2% 2% 1% 1%
6. Frequency of Events Reported Most Recent 67% 69% 68% 69% 66% 66% 67% 64%
Previous 67% 71% 66% 68% 64% 64% 67% 63%
Change 0% -2% 2% 1% 2% 2% 0% 1%

59
Table C-1. Trending: Composite-Level Average Percent Positive Response by Bed Size – 2018 Database Hospitals (Page 2 of 2)
Bed Size
Patient Safety Culture Composites Database
Year 6-24 Beds
25-49 Beds
50-99 Beds
100-199 Beds
200-299 Beds
300-399 Beds
400-499 Beds
500+ Beds
# Hospitals Both Years 11 22 55 85 57 30 17 29
# Respondents Most Recent 914 3,275 15,441 48,200 44,111 28,319 23,317 64,853
Previous 911 3,565 14,643 42,783 41,437 25,460 22,050 61,825
7. Overall Perceptions of Patient Safety Most Recent 73% 74% 69% 67% 64% 64% 64% 61%
Previous 72% 74% 68% 67% 64% 62% 62% 61%
Change 1% 0% 1% 0% 0% 2% 2% 0%
8. Communication Openness Most Recent 69% 68% 67% 66% 65% 63% 64% 63%
Previous 66% 68% 65% 65% 63% 61% 63% 62%
Change 3% 0% 2% 1% 2% 2% 1% 1%
9. Teamwork Across Units Most Recent 67% 71% 64% 62% 59% 58% 61% 56%
Previous 69% 71% 63% 62% 58% 57% 58% 56%
Change -2% 0% 1% 0% 1% 1% 3% 0%
10. Staffing Most Recent 64% 60% 58% 54% 51% 50% 51% 46%
Previous 64% 64% 57% 54% 52% 50% 50% 48%
Change 0% -4% 1% 0% -1% 0% 1% -2%
11. Handoffs & Transitions Most Recent 57% 60% 49% 48% 45% 43% 45% 42%
Previous 58% 60% 49% 48% 44% 43% 44% 42%
Change -1% 0% 0% 0% 1% 0% 1% 0%
12. Nonpunitive Response to Error Most Recent 51% 54% 51% 49% 46% 42% 47% 43%
Previous 50% 53% 47% 46% 44% 41% 44% 41%
Change 1% 1% 4% 3% 2% 1% 3% 2%

60
Table C-2. Trending: Item-Level Average Percent Positive Response by Bed Size – 2018 Database Hospitals (Page 1 of 6)
Bed Size
Survey Items by Composite Database
Year 6-24 Beds
25-49 Beds
50-99 Beds
100-199 Beds
200-299 Beds
300-399 Beds
400-499 Beds
500+ Beds
# Hospitals Both Years 11 22 55 85 57 30 17 29
# Respondents Most Recent 914 3,275 15,441 48,200 44,111 28,319 23,317 64,853
Previous 911 3,565 14,643 42,783 41,437 25,460 22,050 61,825
Teamwork Within Units
A1. People support one another in this unit. Most Recent 88% 88% 88% 87% 88% 87% 88% 85% Previous 90% 90% 88% 87% 87% 86% 87% 85% Change -2% -2% 0% 0% 1% 1% 1% 0%
A3. When a lot of work needs to be done quickly, we work together as a team to get the work done.
Most Recent 90% 88% 89% 87% 87% 86% 87% 84% Previous 89% 91% 88% 87% 87% 86% 86% 85% Change 1% -3% 1% 0% 0% 0% 1% -1%
A4. In this unit, people treat each other with respect. Most Recent 83% 82% 82% 83% 81% 80% 82% 79% Previous 82% 84% 82% 81% 80% 79% 81% 78% Change 1% -2% 0% 2% 1% 1% 1% 1%
A11. When one area in this unit gets really busy, others help out. Most Recent 75% 75% 73% 73% 72% 71% 73% 70% Previous 76% 76% 73% 72% 71% 70% 71% 69% Change -1% -1% 0% 1% 1% 1% 2% 1%
Supv/Mgr Expectations & Actions Promoting Patient Safety
B1. My supv/mgr says a good word when he/she sees a job done according to established patient safety procedures.
Most Recent 79% 80% 81% 80% 80% 78% 80% 78% Previous 80% 81% 78% 79% 78% 76% 78% 75% Change -1% -1% 3% 1% 2% 2% 2% 3%
B2. My supv/mgr seriously considers staff suggestions for improving patient safety.
Most Recent 84% 82% 83% 81% 80% 79% 80% 78% Previous 83% 85% 81% 80% 79% 77% 79% 77% Change 1% -3% 2% 1% 1% 2% 1% 1%
B3R. Whenever pressure builds up, my supv/mgr wants us to work faster, even if it means taking shortcuts.
Most Recent 86% 84% 81% 80% 77% 76% 78% 76% Previous 81% 83% 77% 78% 76% 74% 75% 74% Change 5% 1% 4% 2% 1% 2% 3% 2%
B4R. My supv/mgr overlooks patient safety problems that happen over and over.
Most Recent 84% 82% 82% 81% 79% 79% 79% 77% Previous 82% 83% 79% 79% 79% 78% 78% 77% Change 2% -1% 3% 2% 0% 1% 1% 0%
Note: The item’s survey location is shown to the left. An “R” indicates a negatively worded item, where the percent positive response is based on those who responded “Strongly disagree” or “Disagree,” or “Never” or “Rarely” (depending on the response category used for the item).

61
Table C-2. Trending: Item-Level Average Percent Positive Response by Bed Size – 2018 Database Hospitals (Page 2 of 6)
Bed Size
Survey Items by Composite Database
Year 6-24 Beds
25-49 Beds
50-99 Beds
100-199 Beds
200-299 Beds
300-399 Beds
400-499 Beds
500+ Beds
# Hospitals Both Years 11 22 55 85 57 30 17 29
# Respondents Most Recent 914 3,275 15,441 48,200 44,111 28,319 23,317 64,853
Previous 911 3,565 14,643 42,783 41,437 25,460 22,050 61,825
Organizational Learning – Continuous Improvement
A6. We are actively doing things to improve patient safety. Most Recent 87% 84% 85% 84% 83% 84% 83% 82% Previous 84% 88% 85% 84% 83% 82% 82% 82% Change 3% -4% 0% 0% 0% 2% 1% 0%
A9. Mistakes have led to positive changes here. Most Recent 66% 64% 66% 64% 63% 61% 64% 62% Previous 64% 68% 66% 64% 63% 62% 64% 62% Change 2% -4% 0% 0% 0% -1% 0% 0%
A13. After we make changes to improve patient safety, we evaluate their effectiveness.
Most Recent 71% 72% 72% 72% 70% 69% 71% 68% Previous 68% 74% 71% 72% 69% 68% 69% 68% Change 3% -2% 1% 0% 1% 1% 2% 0%
Management Support for Patient Safety
F1. Hospital management provides a work climate that promotes patient safety.
Most Recent 86% 86% 83% 83% 80% 80% 80% 76% Previous 87% 88% 84% 83% 80% 78% 78% 77% Change -1% -2% -1% 0% 0% 2% 2% -1%
F8. The actions of hospital management show that patient safety is a top priority.
Most Recent 81% 80% 78% 78% 75% 75% 76% 71% Previous 82% 83% 77% 77% 74% 72% 73% 72% Change -1% -3% 1% 1% 1% 3% 3% -1%
F9R. Hospital management seems interested in patient safety only after an adverse event happens.
Most Recent 67% 69% 63% 62% 58% 57% 58% 53% Previous 68% 71% 63% 62% 59% 56% 57% 53% Change -1% -2% 0% 0% -1% 1% 1% 0%
Note: The item’s survey location is shown to the left. An “R” indicates a negatively worded item, where the percent positive response is based on those who responded “Strongly disagree” or “Disagree,” or “Never” or “Rarely” (depending on the response category used for the item).

62
Table C-2. Trending: Item-Level Average Percent Positive Response by Bed Size – 2018 Database Hospitals (Page 3 of 6)
Bed Size
Survey Items by Composite Database
Year 6-24 Beds
25-49 Beds
50-99 Beds
100-199 Beds
200-299 Beds
300-399 Beds
400-499 Beds
500+ Beds
# Hospitals Both Years 11 22 55 85 57 30 17 29
# Respondents Most Recent 914 3,275 15,441 48,200 44,111 28,319 23,317 64,853
Previous 911 3,565 14,643 42,783 41,437 25,460 22,050 61,825
Feedback & Communication About Error
C1. We are given feedback about changes put into place based on event reports.
Most Recent 61% 60% 63% 63% 62% 61% 63% 59% Previous 62% 62% 61% 63% 60% 59% 63% 59% Change -1% -2% 2% 0% 2% 2% 0% 0%
C3. We are informed about errors that happen in this unit. Most Recent 72% 71% 69% 71% 70% 70% 71% 67% Previous 71% 71% 69% 70% 68% 67% 70% 67% Change 1% 0% 0% 1% 2% 3% 1% 0%
C5. In this unit, we discuss ways to prevent errors from happening again. Most Recent 79% 77% 78% 77% 76% 75% 75% 73% Previous 78% 78% 76% 76% 74% 73% 75% 72% Change 1% -1% 2% 1% 2% 2% 0% 1%
Frequency of Events Reported
D1. When a mistake is made, but is caught and corrected before affecting the patient, how often is this reported?
Most Recent 61% 64% 63% 65% 62% 61% 63% 60% Previous 61% 65% 60% 63% 59% 59% 63% 59% Change 0% -1% 3% 2% 3% 2% 0% 1%
D2. When a mistake is made, but has no potential to harm the patient, how often is this reported?
Most Recent 65% 65% 63% 65% 62% 62% 63% 60% Previous 63% 68% 63% 64% 61% 60% 63% 59% Change 2% -3% 0% 1% 1% 2% 0% 1%
D3. When a mistake is made that could harm the patient, but does not, how often is this reported?
Most Recent 76% 79% 77% 77% 75% 75% 75% 72% Previous 76% 80% 76% 76% 73% 73% 75% 72% Change 0% -1% 1% 1% 2% 2% 0% 0%
Note: The item’s survey location is shown to the left. An “R” indicates a negatively worded item, where the percent positive response is based on those who responded “Strongly disagree” or “Disagree,” or “Never” or “Rarely” (depending on the response category used for the item).

63
Table C-2. Trending: Item-Level Average Percent Positive Response by Bed Size – 2018 Database Hospitals (Page 4 of 6)
Bed Size
Survey Items by Composite Database
Year 6-24 Beds
25-49 Beds
50-99 Beds
100-199 Beds
200-299 Beds
300-399 Beds
400-499 Beds
500+ Beds
# Hospitals Both Years 11 22 55 85 57 30 17 29
# Respondents Most Recent 914 3,275 15,441 48,200 44,111 28,319 23,317 64,853
Previous 911 3,565 14,643 42,783 41,437 25,460 22,050 61,825
Overall Perceptions of Patient Safety
A10R. It is just by chance that more serious mistakes don’t happen around here.
Most Recent 70% 72% 66% 63% 60% 59% 59% 56% Previous 66% 72% 65% 61% 60% 59% 58% 57% Change 4% 0% 1% 2% 0% 0% 1% -1%
A15. Patient safety is never sacrificed to get more work done. Most Recent 72% 72% 66% 65% 61% 61% 61% 59% Previous 73% 72% 67% 65% 61% 59% 59% 59% Change -1% 0% -1% 0% 0% 2% 2% 0%
A17R. We have patient safety problems in this unit. Most Recent 74% 73% 68% 67% 62% 62% 62% 58% Previous 72% 74% 67% 66% 62% 61% 60% 59% Change 2% -1% 1% 1% 0% 1% 2% -1%
A18. Our procedures and systems are good at preventing errors from happening.
Most Recent 77% 78% 76% 74% 73% 72% 73% 70% Previous 78% 79% 75% 75% 72% 72% 71% 70% Change -1% -1% 1% -1% 1% 0% 2% 0%
Communication Openness
C2. Staff will freely speak up if they see something that may negatively affect patient care.
Most Recent 82% 83% 81% 79% 78% 76% 77% 75% Previous 82% 82% 79% 78% 77% 75% 76% 74% Change 0% 1% 2% 1% 1% 1% 1% 1%
C4. Staff feel free to question the decisions or actions of those with more authority.
Most Recent 54% 51% 51% 51% 50% 48% 49% 48% Previous 51% 52% 49% 49% 48% 46% 48% 47% Change 3% -1% 2% 2% 2% 2% 1% 1%
C6R. Staff are afraid to ask questions when something does not seem right. Most Recent 72% 71% 70% 69% 68% 66% 67% 65% Previous 65% 69% 66% 66% 65% 63% 65% 63% Change 7% 2% 4% 3% 3% 3% 2% 2%
Note: The item’s survey location is shown to the left. An “R” indicates a negatively worded item, where the percent positive response is based on those who responded “Strongly disagree” or “Disagree,” or “Never” or “Rarely” (depending on the response category used for the item).

64
Table C-2. Trending: Item-Level Average Percent Positive Response by Bed Size – 2018 Database Hospitals (Page 5 of 6)
Bed Size
Survey Items by Composite Database
Year 6-24 Beds
25-49 Beds
50-99 Beds
100-199 Beds
200-299 Beds
300-399 Beds
400-499 Beds
500+ Beds
# Hospitals Both Years 11 22 55 85 57 30 17 29
# Respondents Most Recent 914 3,275 15,441 48,200 44,111 28,319 23,317 64,853
Previous 911 3,565 14,643 42,783 41,437 25,460 22,050 61,825
Teamwork Across Units
F2R. Hospital units do not coordinate well with each other. Most Recent 55% 60% 51% 50% 46% 44% 48% 42% Previous 58% 60% 50% 49% 45% 44% 46% 42% Change -3% 0% 1% 1% 1% 0% 2% 0%
F4. There is good cooperation among hospital units that need to work together.
Most Recent 69% 72% 64% 62% 60% 58% 61% 57% Previous 70% 72% 64% 62% 59% 58% 58% 57% Change -1% 0% 0% 0% 1% 0% 3% 0%
F6R. It is often unpleasant to work with staff from other hospital units. Most Recent 65% 71% 65% 64% 61% 60% 62% 58% Previous 68% 70% 65% 63% 61% 59% 61% 57% Change -3% 1% 0% 1% 0% 1% 1% 1%
F10. Hospital units work well together to provide the best care for patients. Most Recent 77% 81% 74% 73% 70% 69% 72% 66% Previous 79% 81% 74% 72% 69% 67% 69% 66% Change -2% 0% 0% 1% 1% 2% 3% 0%
Staffing
A2. We have enough staff to handle the workload. Most Recent 63% 57% 56% 51% 49% 49% 50% 44% Previous 65% 62% 55% 51% 49% 46% 47% 45% Change -2% -5% 1% 0% 0% 3% 3% -1%
A5R. Staff in this unit work longer hours than is best for patient care. Most Recent 58% 56% 52% 48% 47% 45% 46% 43% Previous 59% 59% 53% 49% 49% 48% 47% 45% Change -1% -3% -1% -1% -2% -3% -1% -2%
A7R. We use more agency/temporary staff than is best for patient care. Most Recent 72% 67% 69% 65% 63% 62% 62% 57% Previous 73% 73% 68% 65% 65% 64% 63% 62% Change -1% -6% 1% 0% -2% -2% -1% -5%
A14R. We work in “crisis mode,” trying to do too much, too quickly. Most Recent 63% 60% 54% 51% 46% 45% 47% 42% Previous 60% 61% 52% 50% 46% 43% 45% 42% Change 3% -1% 2% 1% 0% 2% 2% 0%
Note: The item’s survey location is shown to the left. An “R” indicates a negatively worded item, where the percent positive response is based on those who responded “Strongly disagree” or “Disagree,” or “Never” or “Rarely” (depending on the response category used for the item).

65
Table C-2. Trending: Item-Level Average Percent Positive Response by Bed Size – 2018 Database Hospitals (Page 6 of 6)
Bed Size
Survey Items by Composite Database
Year 6-24 Beds
25-49 Beds
50-99 Beds
100-199 Beds
200-299 Beds
300-399 Beds
400-499 Beds
500+ Beds
# Hospitals Both Years 11 22 55 85 57 30 17 29
# Respondents Most Recent 914 3,275 15,441 48,200 44,111 28,319 23,317 64,853
Previous 911 3,565 14,643 42,783 41,437 25,460 22,050 61,825
Handoffs & Transitions
F3R. Things “fall between the cracks” when transferring patients from one unit to another.
Most Recent 53% 57% 44% 43% 38% 36% 39% 36% Previous 55% 56% 44% 43% 37% 37% 39% 36% Change -2% 1% 0% 0% 1% -1% 0% 0%
F5R. Important patient care information is often lost during shift changes. Most Recent 59% 64% 54% 55% 51% 50% 52% 50% Previous 65% 63% 54% 53% 51% 50% 51% 49% Change -6% 1% 0% 2% 0% 0% 1% 1%
F7R. Problems often occur in the exchange of information across hospital units.
Most Recent 56% 59% 49% 47% 43% 41% 43% 40% Previous 54% 59% 48% 47% 43% 42% 43% 40% Change 2% 0% 1% 0% 0% -1% 0% 0%
F11R. Shift changes are problematic for patients in this hospital. Most Recent 59% 59% 50% 48% 46% 44% 46% 42% Previous 61% 60% 49% 47% 45% 43% 44% 41% Change -2% -1% 1% 1% 1% 1% 2% 1%
Nonpunitive Response to Error
A8R. Staff feel like their mistakes are held against them. Most Recent 55% 60% 58% 54% 51% 48% 52% 48% Previous 56% 61% 53% 51% 49% 47% 49% 46% Change -1% -1% 5% 3% 2% 1% 3% 2%
A12R. When an event is reported, it feels like the person is being written up, not the problem.
Most Recent 52% 56% 54% 51% 49% 46% 50% 46% Previous 51% 54% 49% 49% 47% 45% 48% 45% Change 1% 2% 5% 2% 2% 1% 2% 1%
A16R. Staff worry that mistakes they make are kept in their personnel file. Most Recent 45% 47% 43% 41% 37% 34% 38% 35% Previous 43% 46% 38% 37% 34% 32% 35% 32% Change 2% 1% 5% 4% 3% 2% 3% 3%
Note: The item’s survey location is shown to the left. An “R” indicates a negatively worded item, where the percent positive response is based on those who responded “Strongly disagree” or “Disagree,” or “Never” or “Rarely” (depending on the response category used for the item).

66
Table C-3. Trending: Average Percentage of Respondents Giving Their Work Area/Unit a Patient Safety Grade by Bed Size – 2018 Database Hospitals
Bed Size
Work Area/Unit Patient Safety Grade Database
Year 6-24 Beds
25-49 Beds
50-99 Beds
100-199 Beds
200-299 Beds
300-399 Beds
400-499 Beds
500+ Beds
# Hospitals Both Years 11 22 55 85 57 30 17 29
# Respondents Most Recent 914 3,275 15,441 48,200 44,111 28,319 23,317 64,853
Previous 911 3,565 14,643 42,783 41,437 25,460 22,050 61,825
Excellent or Very Good Most Recent 84% 82% 80% 79% 76% 75% 75% 72%
Previous 82% 84% 79% 76% 74% 69% 72% 70%
Change 2% -2% 1% 3% 2% 6% 3% 2%
A = Excellent Most Recent 39% 41% 36% 37% 33% 32% 33% 30%
Previous 36% 38% 35% 34% 31% 28% 31% 28%
Change 3% 3% 1% 3% 2% 4% 2% 2%
B = Very Good Most Recent 45% 41% 44% 42% 43% 43% 42% 42%
Previous 46% 46% 45% 42% 43% 41% 41% 42%
Change -1% -5% -1% 0% 0% 2% 1% 0%
C = Acceptable Most Recent 14% 15% 16% 17% 19% 20% 19% 22%
Previous 15% 13% 17% 18% 20% 22% 21% 22%
Change -1% 2% -1% -1% -1% -2% -2% 0%
D = Poor Most Recent 2% 3% 3% 3% 4% 4% 5% 5%
Previous 2% 2% 3% 4% 5% 6% 5% 6%
Change 0% 1% 0% -1% -1% -2% 0% -1%
E = Failing Most Recent 0% 1% 1% 1% 1% 1% 1% 1%
Previous 0% 0% 1% 1% 1% 2% 1% 2%
Change 0% 1% 0% 0% 0% -1% 0% -1%
Note: Percentages may not add to 100 due to rounding. Excellent and Very Good may not add to the subtotal for Excellent or Very Good due to rounding.
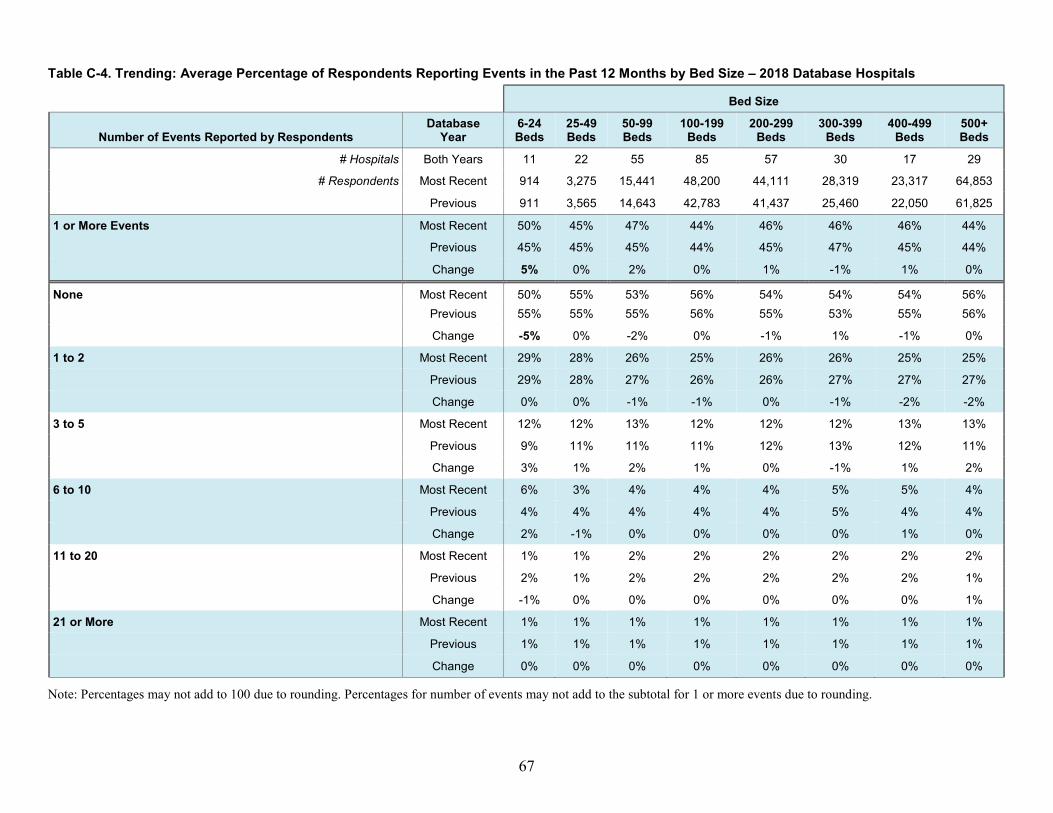
67
Table C-4. Trending: Average Percentage of Respondents Reporting Events in the Past 12 Months by Bed Size – 2018 Database Hospitals
Bed Size
Number of Events Reported by Respondents Database
Year 6-24 Beds
25-49 Beds
50-99 Beds
100-199 Beds
200-299 Beds
300-399 Beds
400-499 Beds
500+ Beds
# Hospitals Both Years 11 22 55 85 57 30 17 29
# Respondents Most Recent 914 3,275 15,441 48,200 44,111 28,319 23,317 64,853
Previous 911 3,565 14,643 42,783 41,437 25,460 22,050 61,825
1 or More Events Most Recent 50% 45% 47% 44% 46% 46% 46% 44%
Previous 45% 45% 45% 44% 45% 47% 45% 44%
Change 5% 0% 2% 0% 1% -1% 1% 0%
None Most Recent 50% 55% 53% 56% 54% 54% 54% 56% Previous 55% 55% 55% 56% 55% 53% 55% 56%
Change -5% 0% -2% 0% -1% 1% -1% 0%
1 to 2 Most Recent 29% 28% 26% 25% 26% 26% 25% 25%
Previous 29% 28% 27% 26% 26% 27% 27% 27%
Change 0% 0% -1% -1% 0% -1% -2% -2%
3 to 5 Most Recent 12% 12% 13% 12% 12% 12% 13% 13%
Previous 9% 11% 11% 11% 12% 13% 12% 11%
Change 3% 1% 2% 1% 0% -1% 1% 2%
6 to 10 Most Recent 6% 3% 4% 4% 4% 5% 5% 4%
Previous 4% 4% 4% 4% 4% 5% 4% 4%
Change 2% -1% 0% 0% 0% 0% 1% 0%
11 to 20 Most Recent 1% 1% 2% 2% 2% 2% 2% 2%
Previous 2% 1% 2% 2% 2% 2% 2% 1%
Change -1% 0% 0% 0% 0% 0% 0% 1%
21 or More Most Recent 1% 1% 1% 1% 1% 1% 1% 1%
Previous 1% 1% 1% 1% 1% 1% 1% 1%
Change 0% 0% 0% 0% 0% 0% 0% 0%
Note: Percentages may not add to 100 due to rounding. Percentages for number of events may not add to the subtotal for 1 or more events due to rounding.

68
Appendix C: Trending Results by Hospital Characteristics (2) Teaching Status and (3) Ownership NOTE: Results are from 306 hospitals. The number of hospitals and respondents in each teaching status or ownership category is shown in each table. However, the precise number of hospitals and respondents corresponding to each data cell in a table will vary because hospitals may have omitted a specific survey item and because of individual nonresponse/missing data.

69
Table C-5. Trending: Composite-Level Average Percent Positive Response by Teaching Status and Ownership – 2018 Database Hospitals (Page 1 of 2)
Teaching Status Ownership
Patient Safety Culture Composites Database
Year Teaching Nonteaching Government Not for Profit For Profit
# Hospitals Both Years 123 183 42 238 26
# Respondents Most Recent 138,009 90,421 19,705 187,330 21,395
Previous 129,006 83,668 15,945 180,740 15,989
1. Teamwork Within Units Most Recent 81% 83% 81% 82% 83%
Previous 81% 82% 81% 82% 81%
Change 0% 1% 0% 0% 2%
2. Supv/Mgr Expectations & Actions Promoting Patient Safety Most Recent 79% 81% 79% 80% 78%
Previous 78% 79% 77% 79% 77%
Change 1% 2% 2% 1% 1%
3. Organizational Learning – Continuous Improvement Most Recent 72% 74% 71% 73% 72%
Previous 72% 73% 71% 73% 71%
Change 0% 1% 0% 0% 1%
4. Management Support for Patient Safety Most Recent 71% 74% 72% 73% 72%
Previous 71% 74% 73% 73% 69%
Change 0% 0% -1% 0% 3%
5. Feedback & Communication About Error Most Recent 68% 70% 66% 70% 69%
Previous 67% 69% 67% 69% 66%
Change 1% 1% -1% 1% 3%
6. Frequency of Events Reported Most Recent 66% 68% 65% 68% 66%
Previous 64% 68% 64% 67% 65%
Change 2% 0% 1% 1% 1%
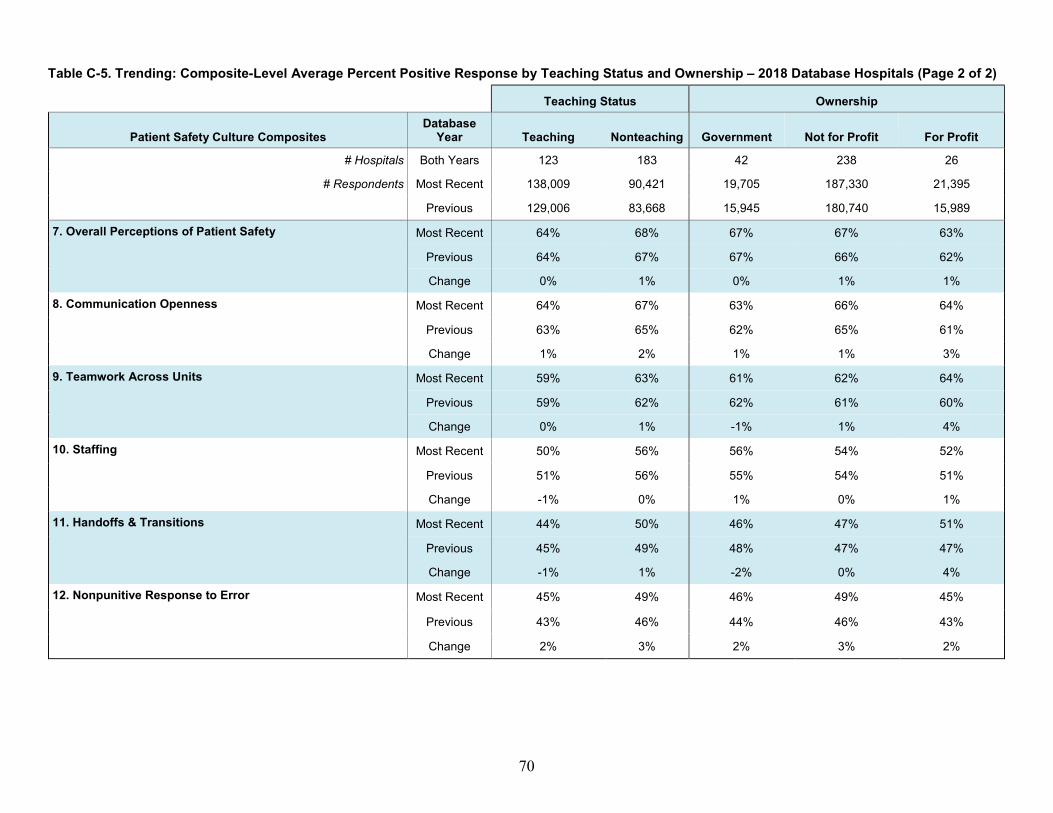
70
Table C-5. Trending: Composite-Level Average Percent Positive Response by Teaching Status and Ownership – 2018 Database Hospitals (Page 2 of 2)
Teaching Status Ownership
Patient Safety Culture Composites Database
Year Teaching Nonteaching Government Not for Profit For Profit
# Hospitals Both Years 123 183 42 238 26
# Respondents Most Recent 138,009 90,421 19,705 187,330 21,395
Previous 129,006 83,668 15,945 180,740 15,989
7. Overall Perceptions of Patient Safety Most Recent 64% 68% 67% 67% 63%
Previous 64% 67% 67% 66% 62%
Change 0% 1% 0% 1% 1%
8. Communication Openness Most Recent 64% 67% 63% 66% 64%
Previous 63% 65% 62% 65% 61%
Change 1% 2% 1% 1% 3%
9. Teamwork Across Units Most Recent 59% 63% 61% 62% 64%
Previous 59% 62% 62% 61% 60%
Change 0% 1% -1% 1% 4%
10. Staffing Most Recent 50% 56% 56% 54% 52%
Previous 51% 56% 55% 54% 51%
Change -1% 0% 1% 0% 1%
11. Handoffs & Transitions Most Recent 44% 50% 46% 47% 51%
Previous 45% 49% 48% 47% 47%
Change -1% 1% -2% 0% 4%
12. Nonpunitive Response to Error Most Recent 45% 49% 46% 49% 45%
Previous 43% 46% 44% 46% 43%
Change 2% 3% 2% 3% 2%

71
Table C-6. Trending: Item-Level Average Percent Positive Response by Teaching Status and Ownership – 2018 Database Hospitals (Page 1 of 6)
Teaching Status Ownership
Survey Items by Composite Database
Year Teaching Nonteaching Government Not for Profit For Profit
# Hospitals Both Years 123 183 42 238 26
# Respondents Most Recent 138,009 90,421 19,705 187,330 21,395
Previous 129,006 83,668 15,945 180,740 15,989
Teamwork Within Units
A1. People support one another in this unit. Most Recent 87% 88% 86% 87% 88% Previous 87% 88% 86% 88% 86% Change 0% 0% 0% -1% 2%
A3. When a lot of work needs to be done quickly, we work together as a team to get the work done.
Most Recent 86% 88% 87% 87% 87% Previous 86% 88% 87% 87% 85% Change 0% 0% 0% 0% 2%
A4. In this unit, people treat each other with respect. Most Recent 81% 82% 80% 82% 83% Previous 80% 81% 79% 81% 82% Change 1% 1% 1% 1% 1%
A11. When one area in this unit gets really busy, others help out.
Most Recent 71% 73% 71% 73% 72% Previous 70% 73% 71% 72% 70% Change 1% 0% 0% 1% 2%
Supv/Mgr Expectations & Actions Promoting Patient Safety
B1. My supv/mgr says a good word when he/she sees a job done according to established patient safety procedures.
Most Recent 79% 81% 77% 80% 80% Previous 77% 79% 76% 79% 78% Change 2% 2% 1% 1% 2%
B2. My supv/mgr seriously considers staff suggestions for improving patient safety.
Most Recent 80% 82% 79% 81% 80% Previous 79% 81% 78% 80% 78% Change 1% 1% 1% 1% 2%
B3R. Whenever pressure builds up, my supv/mgr wants us to work faster, even if it means taking shortcuts.
Most Recent 77% 80% 79% 80% 76% Previous 76% 77% 77% 77% 76% Change 1% 3% 2% 3% 0%
B4R. My supv/mgr overlooks patient safety problems that happen over and over.
Most Recent 79% 81% 80% 81% 76% Previous 78% 79% 78% 80% 76% Change 1% 2% 2% 1% 0%
Note: The item’s survey location is shown to the left. An “R” indicates a negatively worded item, where the percent positive response is based on those who responded “Strongly disagree” or “Disagree,” or “Never” or “Rarely” (depending on the response category used for the item).

72
Table C-6. Trending: Item-Level Average Percent Positive Response by Teaching Status and Ownership – 2018 Database Hospitals (Page 2 of 6)
Teaching Status Ownership
Survey Items by Composite Database
Year Teaching Nonteaching Government Not for Profit For Profit
# Hospitals Both Years 123 183 42 238 26 # Respondents Most Recent 138,009 90,421 19,705 187,330 21,395
Previous 129,006 83,668 15,945 180,740 15,989
Organizational Learning – Continuous Improvement
A6. We are actively doing things to improve patient safety. Most Recent 83% 84% 83% 84% 85% Previous 83% 84% 83% 84% 82% Change 0% 0% 0% 0% 3%
A9. Mistakes have led to positive changes here. Most Recent 63% 64% 63% 64% 62% Previous 64% 64% 63% 64% 63% Change -1% 0% 0% 0% -1%
A13. After we make changes to improve patient safety, we evaluate their effectiveness.
Most Recent 69% 72% 69% 71% 70%Previous 69% 71% 68% 71% 69%Change 0% 1% 1% 0% 1%
Management Support for Patient Safety
F1. Hospital management provides a work climate that promotes patient safety.
Most Recent 80% 83% 82% 82% 82% Previous 80% 83% 82% 82% 78% Change 0% 0% 0% 0% 4%
F8. The actions of hospital management show that patient safety is a top priority.
Most Recent 75% 78% 75% 77% 76% Previous 75% 77% 76% 76% 73% Change 0% 1% -1% 1% 3%
F9R. Hospital management seems interested in patient safety only after an adverse event happens.
Most Recent 58% 62% 59% 61% 57% Previous 59% 62% 60% 61% 55% Change -1% 0% -1% 0% 2%
Note: The item’s survey location is shown to the left. An “R” indicates a negatively worded item, where the percent positive response is based on those who responded “Strongly disagree” or “Disagree,” or “Never” or “Rarely” (depending on the response category used for the item).

73
Table C-6. Trending: Item-Level Average Percent Positive Response by Teaching Status and Ownership – 2018 Database Hospitals (Page 3 of 6)
Teaching Status Ownership
Survey Items by Composite Database
Year Teaching Nonteaching Government Not for Profit For Profit
# Hospitals Both Years 123 183 42 238 26
# Respondents Most Recent 138,009 90,421 19,705 187,330 21,395
Previous 129,006 83,668 15,945 180,740 15,989
Feedback & Communication About Error
C1. We are given feedback about changes put into place based on event reports.
Most Recent 60% 63% 56% 63% 61% Previous 60% 62% 58% 62% 58% Change 0% 1% -2% 1% 3%
C3. We are informed about errors that happen in this unit. Most Recent 69% 71% 67% 70% 69% Previous 67% 70% 68% 69% 67% Change 2% 1% -1% 1% 2%
C5. In this unit, we discuss ways to prevent errors from happening again.
Most Recent 75% 77% 74% 77% 75% Previous 74% 76% 74% 76% 72% Change 1% 1% 0% 1% 3%
Frequency of Events Reported
D1. When a mistake is made, but is caught and corrected before affecting the patient, how often is this reported?
Most Recent 61% 64% 59% 63% 63% Previous 59% 62% 58% 62% 61% Change 2% 2% 1% 1% 2%
D2. When a mistake is made, but has no potential to harm the patient, how often is this reported?
Most Recent 61% 64% 61% 64% 62% Previous 60% 64% 60% 63% 62% Change 1% 0% 1% 1% 0%
D3. When a mistake is made that could harm the patient, but does not, how often is this reported?
Most Recent 74% 77% 75% 76% 74% Previous 74% 76% 74% 76% 73% Change 0% 1% 1% 0% 1%
Note: The item’s survey location is shown to the left. An “R” indicates a negatively worded item, where the percent positive response is based on those who responded “Strongly disagree” or “Disagree,” or “Never” or “Rarely” (depending on the response category used for the item).

74
Table C-6. Trending: Item-Level Average Percent Positive Response by Teaching Status and Ownership – 2018 Database Hospitals (Page 4 of 6)
Teaching Status Ownership
Survey Items by Composite Database
Year Teaching Nonteaching Government Not for Profit For Profit
# Hospitals Both Years 123 183 42 238 26
# Respondents Most Recent 138,009 90,421 19,705 187,330 21,395
Previous 129,006 83,668 15,945 180,740 15,989
Overall Perceptions of Patient Safety
A10R. It is just by chance that more serious mistakes don’t happen around here.
Most Recent 60% 64% 63% 63% 59% Previous 60% 63% 61% 62% 58% Change 0% 1% 2% 1% 1%
A15. Patient safety is never sacrificed to get more work done. Most Recent 62% 66% 66% 64% 61% Previous 62% 66% 67% 64% 59% Change 0% 0% -1% 0% 2%
A17R. We have patient safety problems in this unit. Most Recent 62% 67% 66% 65% 61% Previous 62% 66% 66% 65% 61% Change 0% 1% 0% 0% 0%
A18. Our procedures and systems are good at preventing errors from happening.
Most Recent 72% 75% 73% 74% 72% Previous 72% 75% 74% 74% 71% Change 0% 0% -1% 0% 1%
Communication Openness
C2. Staff will freely speak up if they see something that may negatively affect patient care.
Most Recent 77% 80% 77% 79% 76% Previous 76% 79% 77% 78% 74% Change 1% 1% 0% 1% 2%
C4. Staff feel free to question the decisions or actions of those with more authority.
Most Recent 49% 51% 46% 51% 51% Previous 48% 49% 46% 49% 47% Change 1% 2% 0% 2% 4%
C6R. Staff are afraid to ask questions when something does not seem right.
Most Recent 67% 69% 66% 69% 66% Previous 65% 66% 64% 66% 63% Change 2% 3% 2% 3% 3%
Note: The item’s survey location is shown to the left. An “R” indicates a negatively worded item, where the percent positive response is based on those who responded “Strongly disagree” or “Disagree,” or “Never” or “Rarely” (depending on the response category used for the item).

75
Table C-6. Trending: Item-Level Average Percent Positive Response by Teaching Status and Ownership – 2018 Database Hospitals (Page 5 of 6)
Teaching Status Ownership
Survey Items by Composite Database
Year Teaching Nonteaching Government Not for Profit For Profit # Hospitals Both Years 123 183 42 238 26
# Respondents Most Recent 138,009 90,421 19,705 187,330 21,395
Previous 129,006 83,668 15,945 180,740 15,989
Teamwork Across Units F2R. Hospital units do not coordinate well with each other. Most Recent 46% 51% 48% 49% 52%
Previous 46% 50% 50% 48% 47% Change 0% 1% -2% 1% 5%
F4. There is good cooperation among hospital units that need to work together.
Most Recent 59% 64% 63% 62% 65% Previous 60% 63% 63% 62% 61% Change -1% 1% 0% 0% 4%
F6R. It is often unpleasant to work with staff from other hospital units.
Most Recent 62% 64% 62% 63% 65% Previous 61% 64% 62% 63% 64% Change 1% 0% 0% 0% 1%
F10. Hospital units work well together to provide the best care for patients.
Most Recent 70% 74% 72% 72% 74% Previous 70% 73% 73% 71% 69% Change 0% 1% -1% 1% 5%
Staffing A2. We have enough staff to handle the workload. Most Recent 48% 54% 55% 51% 54%
Previous 48% 53% 55% 51% 46% Change 0% 1% 0% 0% 8%
A5R. Staff in this unit work longer hours than is best for patient care.
Most Recent 45% 51% 50% 49% 46% Previous 47% 52% 51% 50% 48% Change -2% -1% -1% -1% -2%
A7R. We use more agency/temporary staff than is best for patient care.
Most Recent 62% 66% 65% 65% 61% Previous 65% 67% 65% 66% 64% Change -3% -1% 0% -1% -3%
A14R. We work in “crisis mode,” trying to do too much, too quickly.
Most Recent 46% 53% 53% 50% 48% Previous 46% 51% 50% 49% 45% Change 0% 2% 3% 1% 3%
Note: The item’s survey location is shown to the left. An “R” indicates a negatively worded item, where the percent positive response is based on those who responded “Strongly disagree” or “Disagree,” or “Never” or “Rarely” (depending on the response category used for the item).

76
Table C-6. Trending: Item-Level Average Percent Positive Response by Teaching Status and Ownership – 2018 Database Hospitals (Page 6 of 6)
Teaching Status Ownership
Survey Items by Composite Database
Year Teaching Nonteaching Government Not for Profit For Profit
# Hospitals Both Years 123 183 42 238 26
# Respondents Most Recent 138,009 90,421 19,705 187,330 21,395
Previous 129,006 83,668 15,945 180,740 15,989
Handoffs & Transitions
F3R. Things “fall between the cracks” when transferring patients from one unit to another.
Most Recent 39% 45% 42% 42% 45% Previous 39% 44% 43% 42% 41% Change 0% 1% -1% 0% 4%
F5R. Important patient care information is often lost during shift changes.
Most Recent 52% 55% 52% 54% 56% Previous 52% 54% 53% 53% 53% Change 0% 1% -1% 1% 3%
F7R. Problems often occur in the exchange of information across hospital units.
Most Recent 43% 49% 46% 46% 49% Previous 44% 48% 47% 46% 46% Change -1% 1% -1% 0% 3%
F11R. Shift changes are problematic for patients in this hospital. Most Recent 45% 50% 46% 48% 53% Previous 45% 49% 48% 47% 49% Change 0% 1% -2% 1% 4%
Nonpunitive Response to Error
A8R. Staff feel like their mistakes are held against them. Most Recent 50% 55% 52% 54% 51%
Previous 48% 53% 50% 51% 49% Change 2% 2% 2% 3% 2%
A12R. When an event is reported, it feels like the person is being written up, not the problem.
Most Recent 49% 52% 48% 51% 47% Previous 47% 49% 46% 49% 46% Change 2% 3% 2% 2% 1%
A16R. Staff worry that mistakes they make are kept in their personnel file.
Most Recent 37% 41% 38% 40% 37% Previous 34% 38% 36% 37% 35% Change 3% 3% 2% 3% 2%
Note: The item’s survey location is shown to the left. An “R” indicates a negatively worded item, where the percent positive response is based on those who responded “Strongly disagree” or “Disagree,” or “Never” or “Rarely” (depending on the response category used for the item).

77
Table C-7. Trending: Average Percentage of Respondents Giving Their Work Area/Unit a Patient Safety Grade by Teaching Status and Ownership – 2018 Database Hospitals
Teaching Status Ownership
Work Area/Unit Patient Safety Grade Database
Year Teaching Nonteaching Government Not for Profit For Profit
# Hospitals Both Years 123 183 42 238 26
# Respondents Most Recent 138,009 90,421 19,705 187,330 21,395
Previous 129,006 83,668 15,945 180,740 15,989
Excellent or Very Good Most Recent 76% 79% 77% 78% 77%
Previous 73% 78% 73% 77% 72%
Change 3% 1% 4% 1% 5%
A = Excellent Most Recent 33% 37% 33% 35% 36%
Previous 30% 35% 31% 33% 30%
Change 3% 2% 2% 2% 6%
B = Very Good Most Recent 43% 42% 44% 43% 41%
Previous 43% 43% 42% 43% 42%
Change 0% -1% 2% 0% -1%
C = Acceptable Most Recent 19% 17% 19% 17% 18%
Previous 20% 18% 19% 18% 21%
Change -1% -1% 0% -1% -3%
D = Poor Most Recent 4% 3% 4% 4% 4%
Previous 5% 4% 6% 4% 6%
Change -1% -1% -2% 0% -2%
E = Failing Most Recent 1% 1% 1% 1% 1%
Previous 2% 1% 2% 1% 1%
Change -1% 0% -1% 0% 0%
Note: Percentages may not add to 100 due to rounding. Excellent and Very Good may not add to the subtotal for Excellent or Very Good due to rounding.

78
Table C-8. Trending: Average Percent Positive of Respondents Reporting Events in the Past 12 Months by Teaching Status and Ownership – 2018 Database Hospitals Teaching Status Ownership
Number of Events Reported by Respondents Database
Year Teaching Nonteaching Government Not for Profit For Profit
# Hospitals Both Years 123 183 42 238 26
# Respondents Most Recent 138,009 90,421 19,705 187,330 21,395
Previous 129,006 83,668 15,945 180,740 15,989
1 or More Events Most Recent 45% 45% 45% 45% 47%
Previous 46% 44% 45% 44% 48%
Change -1% 1% 0% 1% -1%
None Most Recent 55% 55% 55% 55% 53% Previous 54% 56% 55% 56% 52%
Change 1% -1% 0% -1% 1%
1 to 2 Most Recent 26% 26% 27% 26% 26%
Previous 27% 26% 27% 27% 26%
Change -1% 0% 0% -1% 0%
3 to 5 Most Recent 13% 12% 12% 12% 13%
Previous 12% 11% 11% 11% 13%
Change 1% 1% 1% 1% 0%
6 to 10 Most Recent 4% 4% 4% 4% 5%
Previous 4% 4% 5% 4% 5%
Change 0% 0% -1% 0% 0%
11 to 20 Most Recent 2% 2% 2% 2% 2%
Previous 2% 2% 2% 2% 2%
Change 0% 0% 0% 0% 0%
21 or More Most Recent 1% 1% 1% 1% 1%
Previous 1% 1% 1% 1% 1%
Change 0% 0% 0% 0% 0%
Note: Percentages may not add to 100 due to rounding. Percentages for number of events may not add to the subtotal for 1 or more events due to rounding.

79
Appendix C: Trending Results by Hospital Characteristics (4) Geographic Region NOTE 1: Results are from 306 hospitals. The number of hospitals and respondents in each geographic region is shown in each table. However, the precise number of hospitals and respondents corresponding to each data cell in a table will vary because hospitals may have omitted a specific survey item and because of individual nonresponse/missing data.
NOTE 2: States and territories are categorized into regions defined by the American Hospital Association as follows:
• New England: CT, MA, ME, NH, RI, VT • Mid-Atlantic: NJ, NY, PA • South Atlantic/Associated Territories: DC, DE, FL, GA, MD, NC, SC, VA, WV, Puerto
Rico, Virgin Islands • East North Central: IL, IN, MI, OH, WI • East South Central: AL, KY, MS, TN • West North Central: IA, KS, MN, MO, ND, NE, SD • West South Central: AR, LA, OK, TX • Mountain: AZ, CO, ID, MT, NM, NV, UT, WY • Pacific/Associated Territories: AK, CA, HI, OR, WA, American Samoa, Guam, Marshall
Islands, Northern Mariana Islands

80
Table C-9. Trending: Composite-Level Average Percent Positive Response by Geographic Region – 2018 Database Hospitals (Page 1 of 2)
Geographic Region
Patient Safety Culture Composites Database
Year New
England Mid-
Atlantic South
Atlantic
East North
Central
East South
Central
West North
Central
West South
Central Mountain Pacific
# Hospitals Both Years 15 26 100 68 19 15 23 18 22
# Respondents Most Recent 10,227 30,119 79,294 41,230 11,398 7,329 17,500 12,695 18,638
Previous 8,251 32,056 75,243 35,458 8,231 8,206 19,405 10,363 15,461
1. Teamwork Within Units Most Recent 81% 78% 83% 83% 83% 81% 79% 84% 79%
Previous 79% 77% 83% 82% 83% 82% 81% 83% 80%
Change 2% 1% 0% 1% 0% -1% -2% 1% -1%
2. Supv/Mgr Expectations & Actions Promoting Patient Safety Most Recent 78% 76% 82% 81% 80% 80% 80% 79% 74%
Previous 74% 73% 81% 78% 80% 79% 79% 78% 76%
Change 4% 3% 1% 3% 0% 1% 1% 1% -2%
3. Organizational Learning – Continuous Improvement Most Recent 67% 69% 76% 73% 73% 71% 71% 72% 69%
Previous 66% 68% 76% 72% 74% 74% 72% 69% 71%
Change 1% 1% 0% 1% -1% -3% -1% 3% -2%
4. Management Support for Patient Safety Most Recent 69% 67% 76% 74% 73% 73% 72% 70% 69%
Previous 68% 65% 76% 73% 73% 76% 72% 69% 70%
Change 1% 2% 0% 1% 0% -3% 0% 1% -1%
5. Feedback & Communication About Error Most Recent 62% 67% 73% 68% 69% 66% 70% 67% 66%
Previous 59% 64% 72% 68% 70% 67% 70% 66% 67%
Change 3% 3% 1% 0% -1% -1% 0% 1% -1%
6. Frequency of Events Reported Most Recent 62% 68% 70% 65% 68% 63% 68% 65% 67%
Previous 60% 64% 69% 65% 68% 64% 68% 65% 67%
Change 2% 4% 1% 0% 0% -1% 0% 0% 0%

81
Table C-9. Trending: Composite-Level Average Percent Positive Response by Geographic Region – 2018 Database Hospitals (Page 2 of 2)
Geographic Region
Patient Safety Culture Composites Database
Year New
England Mid-
Atlantic South
Atlantic
East North
Central
East South
Central
West North
Central
West South
Central Mountain Pacific
# Hospitals Both Years 15 26 100 68 19 15 23 18 22
# Respondents Most Recent 10,227 30,119 79,294 41,230 11,398 7,329 17,500 12,695 18,638
Previous 8,251 32,056 75,243 35,458 8,231 8,206 19,405 10,363 15,461
7. Overall Perceptions of Patient Safety Most Recent 64% 61% 67% 69% 68% 69% 66% 64% 60%
Previous 63% 61% 68% 67% 68% 71% 66% 62% 61%
Change 1% 0% -1% 2% 0% -2% 0% 2% -1%
8. Communication Openness Most Recent 64% 64% 68% 65% 66% 67% 65% 66% 60%
Previous 62% 61% 66% 63% 64% 65% 65% 63% 61%
Change 2% 3% 2% 2% 2% 2% 0% 3% -1%
9. Teamwork Across Units Most Recent 56% 54% 64% 63% 62% 62% 62% 62% 59%
Previous 54% 54% 64% 60% 63% 64% 61% 62% 60%
Change 2% 0% 0% 3% -1% -2% 1% 0% -1%
10. Staffing Most Recent 51% 47% 54% 57% 58% 58% 54% 54% 47%
Previous 54% 47% 55% 56% 58% 60% 53% 53% 47%
Change -3% 0% -1% 1% 0% -2% 1% 1% 0%
11. Handoffs & Transitions Most Recent 40% 40% 50% 49% 49% 49% 50% 45% 44%
Previous 40% 40% 50% 46% 50% 50% 48% 46% 44%
Change 0% 0% 0% 3% -1% -1% 2% -1% 0%
12. Nonpunitive Response to Error Most Recent 48% 42% 49% 49% 50% 52% 48% 46% 41%
Previous 45% 40% 48% 44% 46% 51% 44% 43% 40%
Change 3% 2% 1% 5% 4% 1% 4% 3% 1%

82
Table C-10. Trending: Item-Level Average Percent Positive Response by Geographic Region – 2018 Database Hospitals (Page 1 of 6)
Geographic Region
Survey Items by Composite Database
Year New
England Mid-
Atlantic South
Atlantic East North
Central East South
Central West North
Central West South
Central Mountain Pacific
# Hospitals Both Years 15 26 100 68 19 15 23 18 22
# Respondents Most Recent 10,227 30,119 79,294 41,230 11,398 7,329 17,500 12,695 18,638
Previous 8,251 32,056 75,243 35,458 8,231 8,206 19,405 10,363 15,461
Teamwork Within Units
A1. People support one another in this unit. Most Recent 88% 84% 89% 88% 88% 86% 83% 89% 85% Previous 86% 83% 89% 88% 89% 88% 86% 88% 86% Change 2% 1% 0% 0% -1% -2% -3% 1% -1%
A3. When a lot of work needs to be done quickly, we work together as a team to get the work done.
Most Recent 87% 84% 88% 89% 88% 87% 84% 88% 83% Previous 85% 83% 88% 88% 89% 88% 86% 86% 84% Change 2% 1% 0% 1% -1% -1% -2% 2% -1%
A4. In this unit, people treat each other with respect. Most Recent 80% 76% 83% 83% 82% 78% 79% 85% 80% Previous 79% 74% 83% 80% 83% 80% 81% 83% 81% Change 1% 2% 0% 3% -1% -2% -2% 2% -1%
A11. When one area in this unit gets really busy, others help out.
Most Recent 70% 69% 74% 74% 73% 72% 69% 74% 68% Previous 68% 67% 73% 73% 72% 73% 71% 73% 69% Change 2% 2% 1% 1% 1% -1% -2% 1% -1%
Supv/Mgr Expectations & Actions Promoting Patient Safety
B1. My supv/mgr says a good word when he/she sees a job done according to established patient safety procedures.
Most Recent 76% 76% 83% 79% 78% 79% 79% 79% 77% Previous 71% 72% 82% 77% 77% 77% 79% 78% 78% Change 5% 4% 1% 2% 1% 2% 0% 1% -1%
B2. My supv/mgr seriously considers staff suggestions for improving patient safety.
Most Recent 79% 77% 83% 81% 80% 80% 80% 83% 76% Previous 76% 74% 83% 79% 80% 81% 80% 81% 78% Change 3% 3% 0% 2% 0% -1% 0% 2% -2%
B3R. Whenever pressure builds up, my supv/mgr wants us to work faster, even if it means taking shortcuts.
Most Recent 77% 75% 80% 81% 79% 80% 80% 78% 73% Previous 75% 71% 80% 76% 78% 79% 76% 75% 74% Change 2% 4% 0% 5% 1% 1% 4% 3% -1%
B4R. My supv/mgr overlooks patient safety problems that happen over and over.
Most Recent 78% 77% 82% 82% 83% 80% 81% 78% 72% Previous 76% 74% 82% 79% 83% 79% 79% 76% 74% Change 2% 3% 0% 3% 0% 1% 2% 2% -2%
Note: The item’s survey location is shown to the left. An “R” indicates a negatively worded item, where the percent positive response is based on those who responded “Strongly disagree” or “Disagree,” or “Never” or “Rarely” (depending on the response category used for the item).

83
Table C-10. Trending: Item-Level Average Percent Positive Response by Geographic Region – 2018 Database Hospitals (Page 2 of 6) Geographic Region
Survey Items by Composite Database
Year New
England Mid-
Atlantic South
Atlantic East North
Central
East South
Central
West North
Central
West South
Central Mountain Pacific
# Hospitals Both Years 15 26 100 68 19 15 23 18 22
# Respondents Most Recent 10,227 30,119 79,294 41,230 11,398 7,329 17,500 12,695 18,638
Previous 8,251 32,056 75,243 35,458 8,231 8,206 19,405 10,363 15,461
Organizational Learning – Continuous Improvement
A6. We are actively doing things to improve patient safety.
Most Recent 78% 81% 86% 85% 85% 83% 82% 85% 82% Previous 78% 79% 86% 84% 85% 85% 84% 82% 82% Change 0% 2% 0% 1% 0% -2% -2% 3% 0%
A9. Mistakes have led to positive changes here. Most Recent 61% 59% 66% 64% 63% 64% 62% 64% 60% Previous 61% 58% 68% 62% 64% 69% 63% 61% 63% Change 0% 1% -2% 2% -1% -5% -1% 3% -3%
A13. After we make changes to improve patient safety, we evaluate their effectiveness.
Most Recent 63% 67% 75% 71% 73% 66% 70% 67% 66% Previous 59% 66% 75% 69% 72% 69% 71% 66% 68% Change 4% 1% 0% 2% 1% -3% -1% 1% -2%
Management Support for Patient Safety
F1. Hospital management provides a work climate that promotes patient safety.
Most Recent 78% 76% 84% 83% 83% 84% 81% 79% 80% Previous 76% 74% 84% 82% 84% 84% 82% 78% 80% Change 2% 2% 0% 1% -1% 0% -1% 1% 0%
F8. The actions of hospital management show that patient safety is a top priority.
Most Recent 72% 71% 79% 78% 77% 75% 75% 74% 75% Previous 71% 69% 79% 76% 75% 78% 75% 73% 75% Change 1% 2% 0% 2% 2% -3% 0% 1% 0%
F9R. Hospital management seems interested in patient safety only after an adverse event happens.
Most Recent 58% 55% 64% 62% 61% 61% 60% 56% 54% Previous 58% 53% 65% 61% 60% 65% 58% 57% 56% Change 0% 2% -1% 1% 1% -4% 2% -1% -2%
Note: The item’s survey location is shown to the left. An “R” indicates a negatively worded item, where the percent positive response is based on those who responded “Strongly disagree” or “Disagree,” or “Never” or “Rarely” (depending on the response category used for the item).

84
Table C-10. Trending: Item-Level Average Percent Positive Response by Geographic Region – 2018 Database Hospitals (Page 3 of 6) Geographic Region
Survey Items by Composite Database
Year New
England Mid-
Atlantic South
Atlantic
East North
Central
East South
Central
West North
Central
West South
Central Mountain Pacific
# Hospitals Both Years 15 26 100 68 19 15 23 18 22
# Respondents Most Recent 10,227 30,119 79,294 41,230 11,398 7,329 17,500 12,695 18,638
Previous 8,251 32,056 75,243 35,458 8,231 8,206 19,405 10,363 15,461
Feedback & Communication About Error
C1. We are given feedback about changes put into place based on event reports.
Most Recent 51% 58% 67% 61% 61% 58% 63% 59% 58% Previous 50% 54% 66% 61% 62% 59% 62% 57% 59% Change 1% 4% 1% 0% -1% -1% 1% 2% -1%
C3. We are informed about errors that happen in this unit.
Most Recent 62% 70% 74% 68% 71% 66% 70% 68% 67% Previous 58% 66% 72% 67% 72% 66% 72% 68% 68% Change 4% 4% 2% 1% -1% 0% -2% 0% -1%
C5. In this unit, we discuss ways to prevent errors from happening again.
Most Recent 73% 73% 79% 76% 76% 75% 76% 75% 73% Previous 68% 70% 78% 74% 76% 76% 76% 74% 73% Change 5% 3% 1% 2% 0% -1% 0% 1% 0%
Frequency of Events Reported
D1. When a mistake is made, but is caught and corrected before affecting the patient, how often is this reported?
Most Recent 55% 63% 67% 59% 62% 58% 64% 61% 64% Previous 53% 59% 65% 57% 62% 59% 63% 61% 64% Change 2% 4% 2% 2% 0% -1% 1% 0% 0%
D2. When a mistake is made, but has no potential to harm the patient, how often is this reported?
Most Recent 57% 64% 66% 60% 64% 58% 64% 60% 63% Previous 56% 61% 65% 61% 64% 60% 65% 61% 64% Change 1% 3% 1% -1% 0% -2% -1% -1% -1%
D3. When a mistake is made that could harm the patient, but does not, how often is this reported?
Most Recent 74% 76% 77% 76% 78% 74% 75% 73% 75% Previous 71% 73% 76% 76% 78% 74% 76% 73% 75% Change 3% 3% 1% 0% 0% 0% -1% 0% 0%
Note: The item’s survey location is shown to the left. An “R” indicates a negatively worded item, where the percent positive response is based on those who responded “Strongly disagree” or “Disagree,” or “Never” or “Rarely” (depending on the response category used for the item).

85
Table C-10. Trending: Item-Level Average Percent Positive Response by Geographic Region – 2018 Database Hospitals (Page 4 of 6) Geographic Region
Survey Items by Composite Database
Year New
England Mid-
Atlantic South
Atlantic East North
Central
East South
Central
West North
Central
West South
Central Mountain Pacific
# Hospitals Both Years 15 26 100 68 19 15 23 18 22
# Respondents Most Recent 10,227 30,119 79,294 41,230 11,398 7,329 17,500 12,695 18,638
Previous 8,251 32,056 75,243 35,458 8,231 8,206 19,405 10,363 15,461
Overall Perceptions of Patient Safety
A10R. It is just by chance that more serious mistakes don’t happen around here.
Most Recent 62% 56% 63% 67% 64% 68% 61% 61% 54% Previous 61% 55% 63% 64% 64% 70% 58% 59% 53% Change 1% 1% 0% 3% 0% -2% 3% 2% 1%
A15. Patient safety is never sacrificed to get more work done.
Most Recent 63% 61% 65% 65% 67% 66% 64% 61% 61% Previous 62% 61% 65% 64% 65% 67% 65% 60% 64% Change 1% 0% 0% 1% 2% -1% -1% 1% -3%
A17R. We have patient safety problems in this unit. Most Recent 62% 59% 65% 69% 67% 69% 68% 62% 58% Previous 61% 59% 66% 67% 68% 70% 65% 61% 57% Change 1% 0% -1% 2% -1% -1% 3% 1% 1%
A18. Our procedures and systems are good at preventing errors from happening.
Most Recent 70% 68% 76% 77% 74% 74% 73% 73% 68% Previous 68% 69% 77% 75% 75% 76% 74% 70% 70% Change 2% -1% -1% 2% -1% -2% -1% 3% -2%
Communication Openness
C2. Staff will freely speak up if they see something that may negatively affect patient care.
Most Recent 77% 78% 80% 79% 79% 80% 77% 78% 73% Previous 74% 75% 80% 78% 78% 78% 78% 76% 74% Change 3% 3% 0% 1% 1% 2% -1% 2% -1%
C4. Staff feel free to question the decisions or actions of those with more authority.
Most Recent 48% 50% 53% 48% 49% 52% 50% 51% 48% Previous 45% 45% 52% 46% 48% 50% 50% 48% 49% Change 3% 5% 1% 2% 1% 2% 0% 3% -1%
C6R. Staff are afraid to ask questions when something does not seem right.
Most Recent 67% 65% 70% 69% 69% 69% 69% 69% 60% Previous 66% 63% 68% 63% 66% 67% 67% 65% 60% Change 1% 2% 2% 6% 3% 2% 2% 4% 0%
Note: The item’s survey location is shown to the left. An “R” indicates a negatively worded item, where the percent positive response is based on those who responded “Strongly disagree” or “Disagree,” or “Never” or “Rarely” (depending on the response category used for the item).

86
Table C-10. Trending: Item-Level Average Percent Positive Response by Geographic Region – 2018 Database Hospitals (Page 5 of 6) Geographic Region
Survey Items by Composite Database
Year New
England Mid-
Atlantic South
Atlantic East North
Central
East South
Central
West North
Central
West South
Central Mountain Pacific
# Hospitals Both Years 15 26 100 68 19 15 23 18 22
# Respondents Most Recent 10,227 30,119 79,294 41,230 11,398 7,329 17,500 12,695 18,638
Previous 8,251 32,056 75,243 35,458 8,231 8,206 19,405 10,363 15,461
Teamwork Across Units F2R. Hospital units do not coordinate well with each
other. Most Recent 38% 39% 52% 51% 50% 50% 51% 48% 46%
Previous 37% 40% 52% 48% 51% 52% 49% 49% 45% Change 1% -1% 0% 3% -1% -2% 2% -1% 1%
F4. There is good cooperation among hospital units that need to work together.
Most Recent 55% 54% 65% 63% 64% 63% 62% 63% 60% Previous 54% 54% 64% 60% 64% 65% 62% 62% 62% Change 1% 0% 1% 3% 0% -2% 0% 1% -2%
F6R. It is often unpleasant to work with staff from other hospital units.
Most Recent 61% 57% 66% 64% 62% 62% 63% 64% 61% Previous 61% 57% 65% 62% 63% 64% 61% 64% 63% Change 0% 0% 1% 2% -1% -2% 2% 0% -2%
F10. Hospital units work well together to provide the best care for patients.
Most Recent 68% 65% 74% 74% 73% 73% 71% 72% 70% Previous 66% 64% 74% 71% 73% 74% 72% 71% 70% Change 2% 1% 0% 3% 0% -1% -1% 1% 0%
Staffing
A2. We have enough staff to handle the workload. Most Recent 50% 43% 51% 54% 57% 57% 52% 53% 47% Previous 53% 43% 51% 53% 52% 60% 52% 52% 49% Change -3% 0% 0% 1% 5% -3% 0% 1% -2%
A5R. Staff in this unit work longer hours than is best for patient care.
Most Recent 46% 41% 49% 51% 53% 54% 50% 49% 39% Previous 50% 44% 51% 53% 55% 56% 47% 50% 42% Change -4% -3% -2% -2% -2% -2% 3% -1% -3%
A7R. We use more agency/temporary staff than is best for patient care.
Most Recent 63% 62% 63% 69% 68% 68% 63% 65% 58% Previous 65% 60% 67% 69% 74% 70% 62% 63% 55% Change -2% 2% -4% 0% -6% -2% 1% 2% 3%
A14R. We work in “crisis mode,” trying to do too much, too quickly.
Most Recent 46% 41% 52% 52% 54% 53% 53% 48% 43% Previous 47% 41% 51% 50% 50% 53% 50% 46% 43% Change -1% 0% 1% 2% 4% 0% 3% 2% 0%
Note: The item’s survey location is shown to the left. An “R” indicates a negatively worded item, where the percent positive response is based on those who responded “Strongly disagree” or “Disagree,” or “Never” or “Rarely” (depending on the response category used for the item).

87
Table C-10. Trending: Item-Level Average Percent Positive Response by Geographic Region – 2018 Database Hospitals (Page 6 of 6) Geographic Region
Survey Items by Composite Database
Year New
England Mid-
Atlantic South
Atlantic
East North
Central
East South
Central
West North
Central
West South
Central Mountain Pacific
# Hospitals Both Years 15 26 100 68 19 15 23 18 22
# Respondents Most Recent 10,227 30,119 79,294 41,230 11,398 7,329 17,500 12,695 18,638
Previous 8,251 32,056 75,243 35,458 8,231 8,206 19,405 10,363 15,461
Handoffs & Transitions
F3R. Things “fall between the cracks” when transferring patients from one unit to another.
Most Recent 34% 34% 45% 43% 44% 45% 44% 39% 39% Previous 34% 34% 45% 40% 46% 45% 44% 40% 39% Change 0% 0% 0% 3% -2% 0% 0% -1% 0%
F5R. Important patient care information is often lost during shift changes.
Most Recent 47% 48% 56% 55% 54% 54% 55% 51% 51% Previous 48% 48% 56% 52% 55% 55% 53% 53% 50% Change -1% 0% 0% 3% -1% -1% 2% -2% 1%
F7R. Problems often occur in the exchange of information across hospital units.
Most Recent 39% 39% 49% 48% 48% 49% 48% 44% 43% Previous 40% 39% 49% 45% 49% 49% 47% 45% 43% Change -1% 0% 0% 3% -1% 0% 1% -1% 0%
F11R. Shift changes are problematic for patients in this hospital.
Most Recent 39% 40% 51% 49% 48% 48% 51% 48% 44% Previous 39% 39% 51% 47% 51% 49% 47% 49% 45% Change 0% 1% 0% 2% -3% -1% 4% -1% -1%
Nonpunitive Response to Error
A8R. Staff feel like their mistakes are held against them.
Most Recent 54% 46% 55% 54% 55% 58% 54% 54% 46% Previous 51% 44% 54% 50% 52% 57% 50% 49% 45% Change 3% 2% 1% 4% 3% 1% 4% 5% 1%
A12R. When an event is reported, it feels like the person is being written up, not the problem.
Most Recent 51% 46% 53% 51% 52% 54% 50% 47% 44% Previous 49% 44% 51% 46% 48% 54% 45% 46% 43% Change 2% 2% 2% 5% 4% 0% 5% 1% 1%
A16R. Staff worry that mistakes they make are kept in their personnel file.
Most Recent 40% 33% 41% 40% 42% 45% 41% 38% 32% Previous 36% 31% 39% 35% 39% 43% 38% 34% 30% Change 4% 2% 2% 5% 3% 2% 3% 4% 2%
Note: The item’s survey location is shown to the left. An “R” indicates a negatively worded item, where the percent positive response is based on those who responded “Strongly disagree” or “Disagree,” or “Never” or “Rarely” (depending on the response category used for the item).

88
Table C-11. Trending: Average Percentage of Respondents Giving Their Work Area/Unit a Patient Safety Grade by Geographic Region – 2018 Database Hospitals
Geographic Region
Work Area/Unit Patient Safety Grade Database
Year New
England Mid-
Atlantic South
Atlantic East North
Central
East South
Central
West North
Central
West South
Central Mountain Pacific
# Hospitals Both Years 15 26 100 68 19 15 23 18 22
# Respondents Most Recent 10,227 30,119 79,294 41,230 11,398 7,329 17,500 12,695 18,638
Previous 8,251 32,056 75,243 35,458 8,231 8,206 19,405 10,363 15,461
Excellent or Very Good Most Recent 77% 72% 78% 81% 78% 80% 78% 76% 72%
Previous 74% 69% 77% 78% 77% 81% 77% 74% 67%
Change 3% 3% 1% 3% 1% -1% 1% 2% 5%
A = Excellent Most Recent 32% 30% 38% 35% 35% 33% 37% 33% 31%
Previous 28% 27% 37% 31% 35% 33% 34% 32% 28%
Change 4% 3% 1% 4% 0% 0% 3% 1% 3%
B = Very Good Most Recent 45% 42% 40% 46% 42% 47% 42% 43% 42%
Previous 46% 42% 41% 46% 42% 48% 43% 43% 39%
Change -1% 0% -1% 0% 0% -1% -1% 0% 3%
C = Acceptable Most Recent 18% 22% 17% 15% 18% 16% 18% 18% 22%
Previous 21% 24% 18% 18% 19% 16% 19% 20% 20%
Change -3% -2% -1% -3% -1% 0% -1% -2% 2%
D = Poor Most Recent 4% 5% 4% 3% 3% 3% 3% 4% 4%
Previous 5% 6% 4% 4% 3% 3% 4% 5% 9%
Change -1% -1% 0% -1% 0% 0% -1% -1% -5%
E = Failing Most Recent 1% 1% 1% 1% 1% 1% 1% 1% 1%
Previous 1% 1% 1% 1% 1% 1% 1% 1% 3%
Change 0% 0% 0% 0% 0% 0% 0% 0% -2%
Note: Percentages may not add to 100 due to rounding. Excellent and Very Good may not add to the subtotal for Excellent or Very Good due to rounding.

89
Table C-12. Trending: Average Percentage of Respondents Reporting Events in the Past 12 Months by Geographic Region – 2018 Database Hospitals
Geographic Region
Number of Events Reported by Respondents Database
Year New
England Mid-
Atlantic South
Atlantic East North
Central
East South
Central
West North
Central
West South
Central Mountain Pacific
# Hospitals Both Years 15 26 100 68 19 15 23 18 22
# Respondents Most Recent 10,227 30,119 79,294 41,230 11,398 7,329 17,500 12,695 18,638
Previous 8,251 32,056 75,243 35,458 8,231 8,206 19,405 10,363 15,461
1 or More Events Most Recent 43% 45% 44% 48% 44% 50% 41% 50% 43%
Previous 47% 44% 44% 46% 40% 49% 39% 48% 48%
Change -4% 1% 0% 2% 4% 1% 2% 2% -5%
None Most Recent 57% 55% 56% 52% 56% 50% 59% 50% 57% Previous 53% 56% 56% 54% 60% 51% 61% 52% 52%
Change 4% -1% 0% -2% -4% -1% -2% -2% 5%
1 to 2 Most Recent 26% 24% 24% 29% 26% 27% 24% 27% 27%
Previous 28% 24% 26% 28% 25% 29% 23% 27% 28%
Change -2% 0% -2% 1% 1% -2% 1% 0% -1%
3 to 5 Most Recent 11% 13% 13% 12% 12% 14% 11% 13% 11%
Previous 12% 11% 11% 11% 9% 13% 10% 13% 12%
Change -1% 2% 2% 1% 3% 1% 1% 0% -1%
6 to 10 Most Recent 4% 5% 4% 4% 4% 6% 4% 6% 4%
Previous 4% 5% 4% 4% 4% 5% 3% 5% 5%
Change 0% 0% 0% 0% 0% 1% 1% 1% -1%
11 to 20 Most Recent 2% 2% 2% 2% 1% 2% 2% 2% 1%
Previous 1% 2% 2% 2% 1% 2% 1% 2% 2%
Change 1% 0% 0% 0% 0% 0% 1% 0% -1%
21 or More Most Recent 1% 2% 1% 1% 1% 1% 1% 2% 1%
Previous 1% 1% 1% 1% 1% 1% 1% 1% 1%
Change 0% 1% 0% 0% 0% 0% 0% 1% 0%
Note: Percentages may not add to 100 due to rounding. Percentages for number of events may not add to the subtotal for 1 or more events due to rounding.

90
Part III
Appendix D: Trending Results by Respondent Characteristics (1) Work Area/Unit NOTE 1: Results are from 306 hospitals. The number of hospitals and respondents in each work area/unit category is shown in each table. However, the precise number of hospitals and respondents corresponding to each data cell in a table will vary because hospitals may have omitted a specific survey item and because of individual nonresponse/missing data.
NOTE 2: Respondents who selected “Many different work areas/No specific work area” or “Other” or who did not answer (missing) are not included.

91
Table D-1. Trending: Composite-Level Average Percent Positive Response by Work Area/Unit – 2018 Database Hospitals (Page 1 of 2)
Work Area/Unit
Patient Safety Culture Composites Database
Year
Anes- thesi- ology
Emer- gency
ICU (Any Type) Lab
Med- icine
Obstet- rics
Pedia- trics
Phar- macy
Psych/ Mentl Hlth
Radi- ology
Reha- bili-
tation Surg- ery
# Hospitals Both Years 46 245 229 236 225 190 71 221 99 242 214 247
# Respondents Most Recent 1,156 13,662 15,024 8,852 25,244 8,868 4,428 5,933 4,486 11,035 8,299 21,382
Previous 1,107 11,923 13,428 9,156 22,712 8,070 3,668 5,846 4,546 10,275 7,257 20,889
1. Teamwork Within Units Most Recent 81% 81% 86% 76% 81% 84% 87% 79% 80% 81% 88% 79%
Previous 81% 80% 85% 76% 81% 83% 85% 78% 79% 82% 87% 78%
Change 0% 1% 1% 0% 0% 1% 2% 1% 1% -1% 1% 1%
2. Supv/Mgr Expectations & Actions Promoting Patient Safety
Most Recent 78% 76% 78% 77% 80% 77% 78% 81% 77% 79% 84% 77%
Previous 78% 74% 75% 77% 77% 77% 79% 79% 76% 77% 83% 75%
Change 0% 2% 3% 0% 3% 0% -1% 2% 1% 2% 1% 2%
3. Organizational Learning – Continuous Improvement
Most Recent 70% 68% 71% 70% 74% 73% 72% 78% 70% 72% 77% 73%
Previous 71% 67% 71% 71% 73% 72% 73% 77% 69% 73% 75% 72%
Change -1% 1% 0% -1% 1% 1% -1% 1% 1% -1% 2% 1%
4. Management Support for Patient Safety
Most Recent 60% 63% 63% 73% 69% 69% 67% 75% 68% 74% 78% 69%
Previous 59% 64% 61% 75% 67% 70% 70% 74% 67% 74% 77% 68%
Change 1% -1% 2% -2% 2% -1% -3% 1% 1% 0% 1% 1%
5. Feedback & Communication About Error
Most Recent 63% 63% 65% 65% 70% 66% 67% 73% 66% 69% 75% 68%
Previous 66% 61% 63% 65% 67% 65% 66% 72% 65% 68% 74% 66%
Change -3% 2% 2% 0% 3% 1% 1% 1% 1% 1% 1% 2%
6. Frequency of Events Reported Most Recent 57% 61% 63% 71% 68% 68% 68% 67% 69% 66% 68% 68%
Previous 59% 59% 61% 72% 65% 66% 69% 64% 67% 65% 69% 67%
Change -2% 2% 2% -1% 3% 2% -1% 3% 2% 1% -1% 1%

92
Table D-1. Trending: Composite-Level Average Percent Positive Response by Work Area/Unit – 2018 Database Hospitals (Page 2 of 2)
Work Area/Unit
Patient Safety Culture Composites Database
Year
Anes- thesi- ology
Emer- gency
ICU (Any Type) Lab
Med- icine
Obstet- rics
Pedia- trics
Phar- macy
Psych/ Mentl Hlth
Radi- ology
Reha- bili-
tation Surg-
ery
# Hospitals Both Years 46 245 229 236 225 190 71 221 99 242 214 247
# Respondents Most Recent 1,156 13,662 15,024 8,852 25,244 8,868 4,428 5,933 4,486 11,035 8,299 21,382
Previous 1,107 11,923 13,428 9,156 22,712 8,070 3,668 5,846 4,546 10,275 7,257 20,889
7. Overall Perceptions of Patient Safety
Most Recent 61% 55% 59% 68% 61% 64% 65% 69% 61% 74% 79% 66%
Previous 63% 55% 58% 69% 60% 63% 66% 68% 58% 74% 78% 65%
Change -2% 0% 1% -1% 1% 1% -1% 1% 3% 0% 1% 1%
8. Communication Openness Most Recent 65% 62% 64% 62% 64% 64% 66% 69% 62% 66% 74% 65%
Previous 69% 59% 61% 61% 60% 64% 65% 68% 59% 64% 72% 63%
Change -4% 3% 3% 1% 4% 0% 1% 1% 3% 2% 2% 2%
9. Teamwork Across Units Most Recent 52% 50% 59% 57% 60% 60% 62% 61% 55% 63% 65% 57%
Previous 52% 50% 58% 56% 59% 60% 61% 61% 54% 62% 65% 57%
Change 0% 0% 1% 1% 1% 0% 1% 0% 1% 1% 0% 0%
10. Staffing Most Recent 52% 45% 51% 49% 49% 57% 59% 59% 54% 60% 62% 53%
Previous 59% 47% 52% 52% 49% 58% 59% 59% 52% 61% 62% 53%
Change -7% -2% -1% -3% 0% -1% 0% 0% 2% -1% 0% 0%
11. Handoffs & Transitions Most Recent 39% 49% 51% 40% 46% 56% 52% 36% 45% 50% 43% 44%
Previous 38% 50% 51% 38% 45% 57% 53% 35% 42% 48% 43% 43%
Change 1% -1% 0% 2% 1% -1% -1% 1% 3% 2% 0% 1%
12. Nonpunitive Response to Error Most Recent 44% 40% 44% 40% 46% 47% 46% 56% 48% 46% 63% 47%
Previous 42% 37% 40% 39% 42% 43% 44% 53% 45% 43% 60% 44%
Change 2% 3% 4% 1% 4% 4% 2% 3% 3% 3% 3% 3%

93
Table D-2. Trending: Item-Level Average Percent Positive Response by Work Area/Unit – 2018 Database Hospitals (Page 1 of 6)
Work Area/Unit
Survey Items by Composite Database
Year
Anes- thesi- ology
Emer- gency
ICU (Any Type) Lab
Med- icine
Obstet- rics
Pedia- trics
Phar- macy
Psych/ Mentl Hlth
Radi- ology
Reha- bili-
tation Surg- ery
# Hospitals Both Years 46 245 229 236 225 190 71 221 99 242 214 247
# Respondents Most Recent 1,156 13,662 15,024 8,852 25,244 8,868 4,428 5,933 4,486 11,035 8,299 21,382
Previous 1,107 11,923 13,428 9,156 22,712 8,070 3,668 5,846 4,546 10,275 7,257 20,889
Teamwork Within Units
A1. People support one another in this unit. Most Recent 88% 86% 90% 81% 88% 90% 91% 83% 85% 87% 92% 86% Previous 89% 86% 90% 82% 89% 89% 91% 83% 83% 88% 92% 85% Change -1% 0% 0% -1% -1% 1% 0% 0% 2% -1% 0% 1%
A3. When a lot of work needs to be done quickly, we work together as a team to get the work done.
Most Recent 88% 88% 91% 82% 84% 91% 92% 83% 84% 88% 91% 87% Previous 88% 86% 91% 82% 84% 91% 90% 83% 83% 89% 91% 87% Change 0% 2% 0% 0% 0% 0% 2% 0% 1% -1% 0% 0%
A4. In this unit, people treat each other with respect. Most Recent 81% 78% 83% 74% 83% 82% 86% 76% 79% 82% 90% 76% Previous 81% 77% 82% 74% 82% 81% 85% 75% 77% 83% 89% 75% Change 0% 1% 1% 0% 1% 1% 1% 1% 2% -1% 1% 1%
A11. When one area in this unit gets really busy, others help out.
Most Recent 66% 71% 80% 66% 71% 72% 78% 72% 73% 68% 80% 67% Previous 66% 70% 78% 66% 70% 73% 74% 70% 72% 69% 78% 66% Change 0% 1% 2% 0% 1% -1% 4% 2% 1% -1% 2% 1%
Supv/Mgr Expectations & Actions Promoting Patient Safety
B1. My supv/mgr says a good word when he/she sees a job done according to established patient safety procedures.
Most Recent 76% 77% 77% 74% 81% 77% 76% 78% 78% 77% 82% 77% Previous 77% 76% 75% 73% 77% 77% 77% 77% 76% 75% 81% 74% Change -1% 1% 2% 1% 4% 0% -1% 1% 2% 2% 1% 3%
B2. My supv/mgr seriously considers staff suggestions for improving patient safety.
Most Recent 79% 76% 79% 75% 81% 77% 78% 81% 79% 80% 86% 78% Previous 81% 76% 76% 76% 78% 78% 80% 79% 76% 78% 85% 77% Change -2% 0% 3% -1% 3% -1% -2% 2% 3% 2% 1% 1%
B3R. Whenever pressure builds up, my supv/mgr wants us to work faster, even if it means taking shortcuts.
Most Recent 76% 73% 77% 80% 78% 76% 79% 83% 76% 79% 83% 75% Previous 75% 71% 74% 80% 75% 74% 78% 81% 76% 77% 81% 73% Change 1% 2% 3% 0% 3% 2% 1% 2% 0% 2% 2% 2%
B4R. My supv/mgr overlooks patient safety problems that happen over and over.
Most Recent 80% 77% 78% 77% 79% 77% 77% 82% 77% 82% 86% 79% Previous 81% 76% 76% 79% 77% 77% 79% 79% 76% 80% 85% 78% Change -1% 1% 2% -2% 2% 0% -2% 3% 1% 2% 1% 1%
Note: The item’s survey location is shown to the left. An “R” indicates a negatively worded item, where the percent positive response is based on those who responded “Strongly disagree” or “Disagree,” or “Never” or “Rarely” (depending on the response category used for the item).

94
Table D-2. Trending: Item-Level Average Percent Positive Response by Work Area/Unit – 2018 Database Hospitals (Page 2 of 6)
Work Area/Unit
Survey Items by Composite Database
Year
Anes- thesi- ology
Emer- gency
ICU (Any Type) Lab
Med- icine
Obstet- rics
Pedia- trics
Phar- macy
Psych/ Mentl Hlth
Radi- ology
Reha- bili-
tation Surg-
ery
# Hospitals Both Years 46 245 229 236 225 190 71 221 99 242 214 247
# Respondents Most Recent 1,156 13,662 15,024 8,852 25,244 8,868 4,428 5,933 4,486 11,035 8,299 21,382
Previous 1,107 11,923 13,428 9,156 22,712 8,070 3,668 5,846 4,546 10,275 7,257 20,889
Organizational Learning – Continuous Improvement
A6. We are actively doing things to improve patient safety.
Most Recent 84% 78% 83% 81% 85% 84% 86% 89% 82% 85% 91% 85% Previous 86% 79% 83% 81% 85% 84% 85% 88% 80% 86% 90% 84% Change -2% -1% 0% 0% 0% 0% 1% 1% 2% -1% 1% 1%
A9. Mistakes have led to positive changes here. Most Recent 60% 59% 60% 64% 63% 65% 61% 76% 60% 62% 64% 64% Previous 63% 58% 61% 65% 62% 63% 64% 76% 59% 63% 61% 64% Change -3% 1% -1% -1% 1% 2% -3% 0% 1% -1% 3% 0%
A13. After we make changes to improve patient safety, we evaluate their effectiveness.
Most Recent 65% 66% 71% 66% 74% 71% 70% 70% 69% 70% 77% 70% Previous 66% 65% 69% 67% 72% 69% 72% 68% 68% 69% 75% 69% Change -1% 1% 2% -1% 2% 2% -2% 2% 1% 1% 2% 1%
Management Support for Patient Safety
F1. Hospital management provides a work climate that promotes patient safety.
Most Recent 68% 73% 72% 81% 77% 78% 77% 83% 77% 83% 87% 79% Previous 71% 73% 69% 83% 75% 78% 80% 81% 75% 83% 87% 78% Change -3% 0% 3% -2% 2% 0% -3% 2% 2% 0% 0% 1%
F8. The actions of hospital management show that patient safety is a top priority.
Most Recent 62% 68% 67% 77% 73% 72% 72% 79% 72% 78% 81% 73% Previous 61% 67% 65% 78% 72% 73% 73% 77% 69% 78% 80% 72% Change 1% 1% 2% -1% 1% -1% -1% 2% 3% 0% 1% 1%
F9R. Hospital management seems interested in patient safety only after an adverse event happens.
Most Recent 49% 50% 51% 62% 58% 58% 53% 61% 55% 61% 65% 56% Previous 44% 51% 50% 63% 55% 58% 58% 62% 56% 61% 65% 56% Change 5% -1% 1% -1% 3% 0% -5% -1% -1% 0% 0% 0%
Note: The item’s survey location is shown to the left. An “R” indicates a negatively worded item, where the percent positive response is based on those who responded “Strongly disagree” or “Disagree,” or “Never” or “Rarely” (depending on the response category used for the item).

95
Table D-2. Trending: Item-Level Average Percent Positive Response by Work Area/Unit – 2018 Database Hospitals (Page 3 of 6)
Work Area/Unit
Survey Items by Composite Database
Year
Anes- thesi- ology
Emer- gency
ICU (Any Type) Lab
Med- icine
Obstet- rics
Pedia- trics
Phar- macy
Psych/ Mentl Hlth
Radi- ology
Reha- bili-
tation Surg-
ery
# Hospitals Both Years 46 245 229 236 225 190 71 221 99 242 214 247
# Respondents Most Recent 1,156 13,662 15,024 8,852 25,244 8,868 4,428 5,933 4,486 11,035 8,299 21,382
Previous 1,107 11,923 13,428 9,156 22,712 8,070 3,668 5,846 4,546 10,275 7,257 20,889
Feedback & Communication About Error
C1. We are given feedback about changes put into place based on event reports.
Most Recent 55% 57% 59% 56% 63% 59% 59% 63% 57% 61% 68% 60% Previous 58% 57% 57% 56% 60% 59% 61% 63% 59% 60% 66% 57% Change -3% 0% 2% 0% 3% 0% -2% 0% -2% 1% 2% 3%
C3. We are informed about errors that happen in this unit.
Most Recent 62% 62% 65% 67% 70% 64% 66% 76% 68% 71% 74% 69% Previous 62% 60% 62% 68% 67% 64% 64% 75% 65% 70% 74% 67% Change 0% 2% 3% -1% 3% 0% 2% 1% 3% 1% 0% 2%
C5. In this unit, we discuss ways to prevent errors from happening again.
Most Recent 72% 68% 73% 72% 76% 75% 78% 79% 74% 76% 84% 76% Previous 78% 67% 71% 71% 73% 73% 73% 78% 72% 75% 81% 74% Change -6% 1% 2% 1% 3% 2% 5% 1% 2% 1% 3% 2%
Frequency of Events Reported
D1. When a mistake is made, but is caught and corrected before affecting the patient, how often is this reported?
Most Recent 52% 55% 57% 67% 63% 62% 63% 59% 64% 60% 65% 64% Previous 55% 53% 54% 67% 58% 59% 62% 54% 63% 59% 65% 63% Change -3% 2% 3% 0% 5% 3% 1% 5% 1% 1% 0% 1%
D2. When a mistake is made, but has no potential to harm the patient, how often is this reported?
Most Recent 52% 58% 59% 66% 64% 63% 64% 64% 65% 61% 62% 65% Previous 54% 56% 58% 67% 62% 63% 67% 60% 64% 61% 64% 64% Change -2% 2% 1% -1% 2% 0% -3% 4% 1% 0% -2% 1%
D3. When a mistake is made that could harm the patient, but does not, how often is this reported?
Most Recent 66% 70% 73% 81% 76% 78% 78% 79% 77% 77% 77% 76% Previous 68% 69% 72% 81% 74% 77% 79% 77% 75% 75% 77% 76% Change -2% 1% 1% 0% 2% 1% -1% 2% 2% 2% 0% 0%
Note: The item’s survey location is shown to the left. An “R” indicates a negatively worded item, where the percent positive response is based on those who responded “Strongly disagree” or “Disagree,” or “Never” or “Rarely” (depending on the response category used for the item).
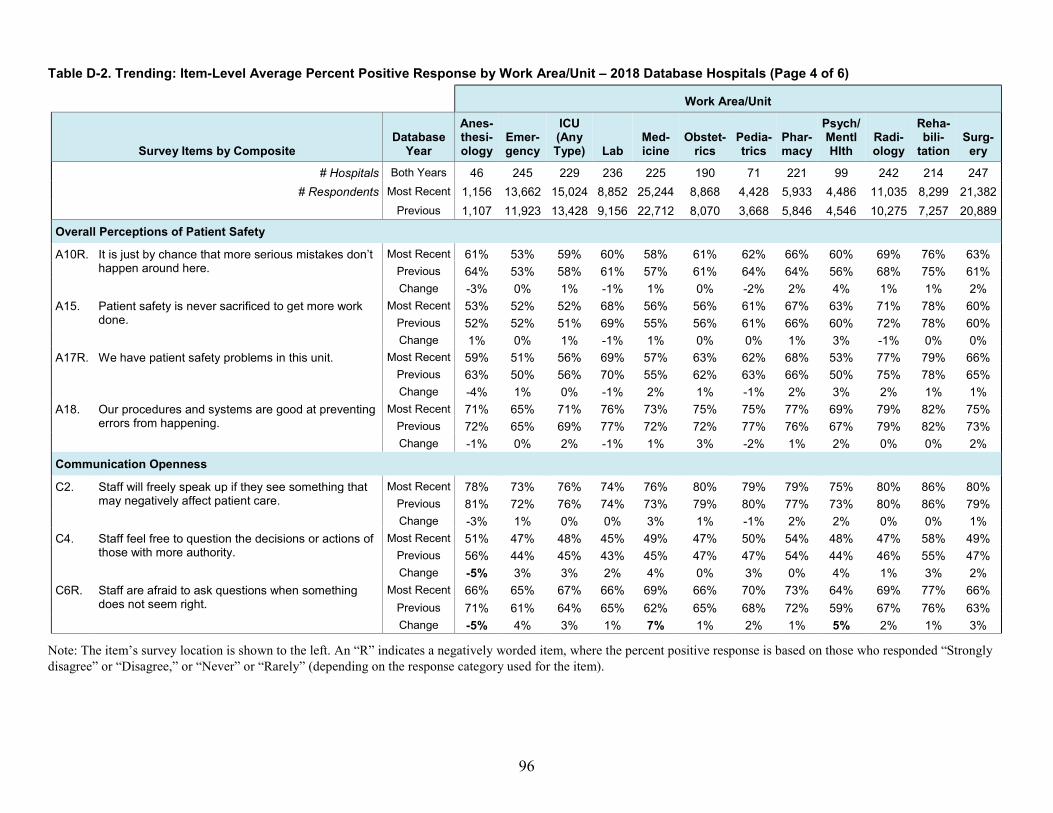
96
Table D-2. Trending: Item-Level Average Percent Positive Response by Work Area/Unit – 2018 Database Hospitals (Page 4 of 6)
Work Area/Unit
Survey Items by Composite Database
Year
Anes- thesi- ology
Emer- gency
ICU (Any Type) Lab
Med- icine
Obstet- rics
Pedia- trics
Phar- macy
Psych/ Mentl Hlth
Radi- ology
Reha- bili-
tation Surg-
ery
# Hospitals Both Years 46 245 229 236 225 190 71 221 99 242 214 247
# Respondents Most Recent 1,156 13,662 15,024 8,852 25,244 8,868 4,428 5,933 4,486 11,035 8,299 21,382
Previous 1,107 11,923 13,428 9,156 22,712 8,070 3,668 5,846 4,546 10,275 7,257 20,889
Overall Perceptions of Patient Safety
A10R. It is just by chance that more serious mistakes don’t happen around here.
Most Recent 61% 53% 59% 60% 58% 61% 62% 66% 60% 69% 76% 63% Previous 64% 53% 58% 61% 57% 61% 64% 64% 56% 68% 75% 61% Change -3% 0% 1% -1% 1% 0% -2% 2% 4% 1% 1% 2%
A15. Patient safety is never sacrificed to get more work done.
Most Recent 53% 52% 52% 68% 56% 56% 61% 67% 63% 71% 78% 60% Previous 52% 52% 51% 69% 55% 56% 61% 66% 60% 72% 78% 60% Change 1% 0% 1% -1% 1% 0% 0% 1% 3% -1% 0% 0%
A17R. We have patient safety problems in this unit. Most Recent 59% 51% 56% 69% 57% 63% 62% 68% 53% 77% 79% 66% Previous 63% 50% 56% 70% 55% 62% 63% 66% 50% 75% 78% 65% Change -4% 1% 0% -1% 2% 1% -1% 2% 3% 2% 1% 1%
A18. Our procedures and systems are good at preventing errors from happening.
Most Recent 71% 65% 71% 76% 73% 75% 75% 77% 69% 79% 82% 75% Previous 72% 65% 69% 77% 72% 72% 77% 76% 67% 79% 82% 73% Change -1% 0% 2% -1% 1% 3% -2% 1% 2% 0% 0% 2%
Communication Openness
C2. Staff will freely speak up if they see something that may negatively affect patient care.
Most Recent 78% 73% 76% 74% 76% 80% 79% 79% 75% 80% 86% 80% Previous 81% 72% 76% 74% 73% 79% 80% 77% 73% 80% 86% 79% Change -3% 1% 0% 0% 3% 1% -1% 2% 2% 0% 0% 1%
C4. Staff feel free to question the decisions or actions of those with more authority.
Most Recent 51% 47% 48% 45% 49% 47% 50% 54% 48% 47% 58% 49% Previous 56% 44% 45% 43% 45% 47% 47% 54% 44% 46% 55% 47% Change -5% 3% 3% 2% 4% 0% 3% 0% 4% 1% 3% 2%
C6R. Staff are afraid to ask questions when something does not seem right.
Most Recent 66% 65% 67% 66% 69% 66% 70% 73% 64% 69% 77% 66% Previous 71% 61% 64% 65% 62% 65% 68% 72% 59% 67% 76% 63% Change -5% 4% 3% 1% 7% 1% 2% 1% 5% 2% 1% 3%
Note: The item’s survey location is shown to the left. An “R” indicates a negatively worded item, where the percent positive response is based on those who responded “Strongly disagree” or “Disagree,” or “Never” or “Rarely” (depending on the response category used for the item).

97
Table D-2. Trending: Item-Level Average Percent Positive Response by Work Area/Unit – 2018 Database Hospitals (Page 5 of 6)
Work Area/Unit
Survey Items by Composite Database
Year
Anes- thesi- ology
Emer- gency
ICU (Any Type) Lab
Med- icine
Obstet- rics
Pedia- trics
Phar- macy
Psych/ Mentl Hlth
Radi- ology
Reha- bili-
tation Surg-
ery
# Hospitals Both Years 46 245 229 236 225 190 71 221 99 242 214 247
# Respondents Most Recent 1,156 13,662 15,024 8,852 25,244 8,868 4,428 5,933 4,486 11,035 8,299 21,382
Previous 1,107 11,923 13,428 9,156 22,712 8,070 3,668 5,846 4,546 10,275 7,257 20,889
Teamwork Across Units
F2R. Hospital units do not coordinate well with each other. Most Recent 35% 38% 44% 45% 45% 47% 48% 48% 41% 51% 52% 44% Previous 37% 39% 43% 43% 45% 48% 46% 47% 39% 50% 51% 43% Change -2% -1% 1% 2% 0% -1% 2% 1% 2% 1% 1% 1%
F4. There is good cooperation among hospital units that need to work together.
Most Recent 51% 48% 58% 58% 58% 61% 61% 60% 54% 65% 66% 58% Previous 53% 49% 57% 58% 58% 60% 63% 61% 53% 64% 66% 57% Change -2% -1% 1% 0% 0% 1% -2% -1% 1% 1% 0% 1%
F6R. It is often unpleasant to work with staff from other hospital units.
Most Recent 58% 52% 66% 55% 65% 62% 67% 62% 60% 63% 69% 59% Previous 60% 52% 65% 55% 64% 62% 66% 64% 60% 61% 68% 59% Change -2% 0% 1% 0% 1% 0% 1% -2% 0% 2% 1% 0%
F10. Hospital units work well together to provide the best care for patients.
Most Recent 64% 60% 68% 70% 69% 70% 72% 71% 63% 74% 75% 69% Previous 60% 60% 67% 69% 68% 71% 70% 71% 63% 72% 75% 67% Change 4% 0% 1% 1% 1% -1% 2% 0% 0% 2% 0% 2%
Staffing
A2. We have enough staff to handle the workload. Most Recent 52% 38% 47% 40% 44% 53% 54% 51% 48% 55% 57% 52% Previous 61% 37% 46% 44% 42% 52% 54% 51% 44% 55% 59% 51% Change -9% 1% 1% -4% 2% 1% 0% 0% 4% 0% -2% 1%
A5R. Staff in this unit work longer hours than is best for patient care.
Most Recent 43% 46% 47% 49% 45% 52% 55% 61% 49% 59% 55% 44% Previous 49% 48% 49% 54% 47% 53% 55% 60% 50% 61% 56% 46% Change -6% -2% -2% -5% -2% -1% 0% 1% -1% -2% -1% -2%
A7R. We use more agency/temporary staff than is best for patient care.
Most Recent 65% 60% 62% 64% 62% 72% 69% 71% 65% 73% 71% 66% Previous 70% 63% 68% 66% 65% 76% 74% 71% 66% 73% 71% 69% Change -5% -3% -6% -2% -3% -4% -5% 0% -1% 0% 0% -3%
A14R. We work in “crisis mode,” trying to do too much, too quickly.
Most Recent 48% 37% 48% 43% 44% 52% 57% 52% 51% 54% 65% 48% Previous 55% 37% 45% 43% 42% 51% 54% 52% 47% 53% 63% 46% Change -7% 0% 3% 0% 2% 1% 3% 0% 4% 1% 2% 2%
Note: The item’s survey location is shown to the left. An “R” indicates a negatively worded item, where the percent positive response is based on those who responded “Strongly disagree” or “Disagree,” or “Never” or “Rarely” (depending on the response category used for the item).

98
Table D-2. Trending: Item-Level Average Percent Positive Response by Work Area/Unit – 2018 Database Hospitals (Page 6 of 6)
Work Area/Unit
Survey Items by Composite Database
Year
Anes- thesi- ology
Emer- gency
ICU (Any Type) Lab
Med- icine
Obstet- rics
Pedia- trics
Phar- macy
Psych/ Mentl Hlth
Radi- ology
Reha- bili-
tation Surg-
ery
# Hospitals Both Years 46 245 229 236 225 190 71 221 99 242 214 247
# Respondents Most Recent 1,156 13,662 15,024 8,852 25,244 8,868 4,428 5,933 4,486 11,035 8,299 21,382
Previous 1,107 11,923 13,428 9,156 22,712 8,070 3,668 5,846 4,546 10,275 7,257 20,889
Handoffs & Transitions
F3R. Things “fall between the cracks” when transferring patients from one unit to another.
Most Recent 35% 44% 41% 29% 39% 47% 44% 25% 36% 47% 39% 41% Previous 32% 45% 40% 27% 37% 49% 43% 24% 35% 46% 39% 40% Change 3% -1% 1% 2% 2% -2% 1% 1% 1% 1% 0% 1%
F5R. Important patient care information is often lost during shift changes.
Most Recent 46% 59% 60% 49% 53% 65% 60% 42% 55% 55% 47% 52% Previous 46% 59% 59% 46% 53% 65% 62% 41% 51% 52% 47% 50% Change 0% 0% 1% 3% 0% 0% -2% 1% 4% 3% 0% 2%
F7R. Problems often occur in the exchange of information across hospital units.
Most Recent 40% 46% 47% 39% 45% 50% 46% 37% 40% 50% 46% 44% Previous 37% 48% 46% 37% 44% 52% 50% 37% 38% 47% 45% 43% Change 3% -2% 1% 2% 1% -2% -4% 0% 2% 3% 1% 1%
F11R. Shift changes are problematic for patients in this hospital.
Most Recent 37% 48% 58% 42% 48% 65% 57% 40% 49% 47% 40% 41% Previous 36% 48% 57% 40% 46% 64% 58% 39% 45% 47% 41% 40% Change 1% 0% 1% 2% 2% 1% -1% 1% 4% 0% -1% 1%
Nonpunitive Response to Error
A8R. Staff feel like their mistakes are held against them. Most Recent 51% 46% 49% 45% 52% 52% 53% 60% 52% 51% 67% 51% Previous 46% 43% 45% 45% 46% 49% 49% 57% 50% 48% 64% 48% Change 5% 3% 4% 0% 6% 3% 4% 3% 2% 3% 3% 3%
A12R. When an event is reported, it feels like the person is being written up, not the problem.
Most Recent 43% 42% 47% 44% 49% 51% 48% 61% 51% 50% 65% 50% Previous 45% 39% 44% 43% 45% 47% 47% 56% 50% 46% 64% 47% Change -2% 3% 3% 1% 4% 4% 1% 5% 1% 4% 1% 3%
A16R. Staff worry that mistakes they make are kept in their personnel file.
Most Recent 39% 33% 35% 31% 37% 37% 39% 48% 41% 37% 57% 38% Previous 36% 29% 31% 29% 33% 33% 35% 46% 36% 33% 52% 36% Change 3% 4% 4% 2% 4% 4% 4% 2% 5% 4% 5% 2%
Note: The item’s survey location is shown to the left. An “R” indicates a negatively worded item, where the percent positive response is based on those who responded “Strongly disagree” or “Disagree,” or “Never” or “Rarely” (depending on the response category used for the item).

99
Table D-3. Trending: Average Percentage of Respondents Giving Their Work Area/Unit a Patient Safety Grade by Work Area/Unit – 2018 Database Hospitals
Work Area/Unit
Work Area/Unit Patient Safety Grade Database
Year
Anes- thesi- ology
Emer- gency
ICU (Any Type) Lab
Med- icine
Obstet- rics
Pedia- trics
Phar- macy
Psych/ Mentl Hlth
Radi- ology
Reha- bili-
tation Surg- ery
# Hospitals Both Years 46 245 229 236 225 190 71 221 99 242 214 247
# Respondents Most Recent 1,156 13,662 15,024 8,852 25,244 8,868 4,428 5,933 4,486 11,035 8,299 21,382
Previous 1,107 11,923 13,428 9,156 22,712 8,070 3,668 5,846 4,546 10,275 7,257 20,889
Excellent or Very Good Most Recent 75% 66% 73% 75% 72% 76% 78% 78% 70% 82% 87% 77%
Previous 76% 63% 68% 74% 68% 74% 77% 75% 65% 80% 86% 75%
Change -1% 3% 5% 1% 4% 2% 1% 3% 5% 2% 1% 2%
A = Excellent Most Recent 38% 23% 28% 31% 27% 32% 32% 35% 27% 42% 48% 35%
Previous 37% 21% 25% 30% 24% 30% 30% 33% 25% 40% 43% 33%
Change 1% 2% 3% 1% 3% 2% 2% 2% 2% 2% 5% 2%
B = Very Good Most Recent 37% 43% 45% 43% 46% 44% 46% 43% 43% 40% 39% 42%
Previous 38% 42% 44% 44% 44% 43% 47% 43% 40% 40% 42% 42%
Change -1% 1% 1% -1% 2% 1% -1% 0% 3% 0% -3% 0%
C = Acceptable Most Recent 19% 25% 20% 20% 22% 19% 18% 17% 21% 15% 11% 18%
Previous 18% 27% 23% 20% 25% 19% 17% 19% 23% 16% 11% 19%
Change 1% -2% -3% 0% -3% 0% 1% -2% -2% -1% 0% -1%
D = Poor Most Recent 4% 7% 5% 4% 5% 5% 3% 3% 8% 3% 2% 4%
Previous 5% 8% 6% 5% 6% 6% 4% 5% 9% 3% 2% 5%
Change -1% -1% -1% -1% -1% -1% -1% -2% -1% 0% 0% -1%
E = Failing Most Recent 1% 2% 1% 1% 1% 1% 1% 1% 1% 0% 0% 1%
Previous 1% 2% 2% 1% 1% 1% 2% 1% 2% 1% 1% 1%
Change 0% 0% -1% 0% 0% 0% -1% 0% -1% -1% -1% 0%
Note: Percentages may not add to 100 due to rounding. Excellent and Very Good may not add to the subtotal for Excellent or Very Good due to rounding.

100
Table D-4. Trending: Average Percentage of Respondents Reporting Events in the Past 12 Months by Work Area/Unit – 2018 Database Hospitals
Work Area/Unit
Number of Events Reported by Respondents Database
Year
Anes- thesi- ology
Emer- gency
ICU (Any Type) Lab
Med- icine
Obstet- rics
Pedia- trics
Phar- macy
Psych/ Mentl Hlth
Radi- ology
Reha- bili-
tation Surg-
ery # Hospitals Both Years 46 245 229 236 225 190 71 221 99 242 214 247
# Respondents Most Recent 1,156 13,662 15,024 8,852 25,244 8,868 4,428 5,933 4,486 11,035 8,299 21,382
Previous 1,107 11,923 13,428 9,156 22,712 8,070 3,668 5,846 4,546 10,275 7,257 20,889
1 or More Events Most Recent 48% 50% 62% 51% 54% 58% 57% 58% 50% 46% 41% 53% Previous 48% 50% 63% 52% 56% 54% 57% 57% 50% 46% 40% 51%
Change 0% 0% -1% -1% -2% 4% 0% 1% 0% 0% 1% 2%
None Most Recent 52% 50% 38% 49% 46% 42% 43% 42% 50% 54% 59% 47%
Previous 52% 50% 37% 48% 44% 46% 43% 43% 50% 54% 60% 49%
Change 0% 0% 1% 1% 2% -4% 0% -1% 0% 0% -1% -2%
1 to 2 Most Recent 32% 28% 35% 23% 30% 35% 32% 19% 26% 30% 31% 30%
Previous 32% 29% 37% 25% 33% 35% 36% 21% 27% 32% 30% 30%
Change 0% -1% -2% -2% -3% 0% -4% -2% -1% -2% 1% 0%
3 to 5 Most Recent 11% 14% 19% 14% 16% 16% 18% 17% 16% 11% 7% 15%
Previous 12% 12% 17% 14% 16% 14% 15% 16% 15% 10% 7% 15%
Change -1% 2% 2% 0% 0% 2% 3% 1% 1% 1% 0% 0%
6 to 10 Most Recent 3% 5% 5% 7% 5% 4% 5% 11% 6% 3% 2% 5%
Previous 4% 5% 6% 6% 5% 4% 5% 10% 6% 3% 2% 5%
Change -1% 0% -1% 1% 0% 0% 0% 1% 0% 0% 0% 0%
11 to 20 Most Recent 1% 2% 2% 4% 2% 2% 2% 7% 2% 1% 0% 2%
Previous 1% 2% 2% 4% 2% 1% 1% 7% 2% 1% 1% 2%
Change 0% 0% 0% 0% 0% 1% 1% 0% 0% 0% -1% 0%
21 or More Most Recent 0% 1% 1% 3% 1% 0% 1% 5% 1% 1% 0% 1%
Previous 0% 1% 1% 3% 0% 0% 0% 4% 1% 0% 0% 1%
Change 0% 0% 0% 0% 1% 0% 1% 1% 0% 1% 0% 0%
Note: Percentages may not add to 100 due to rounding. Percentages for number of events may not add to the subtotal for 1 or more events due to rounding.

101
Appendix D: Trending Results by Respondent Characteristics (2) Staff Position NOTE 1: Results are from 306 hospitals. The number of hospitals and respondents in each staff position category is shown in each table. However, the precise number of hospitals and respondents corresponding to each data cell in a table will vary because hospitals may have omitted a specific survey item and because of individual nonresponse/missing data.
NOTE 2: Respondents who selected “Other” or did not answer (missing) are not included.

102
Table D-5. Trending: Composite-Level Average Percent Positive Response by Staff Position – 2018 Database Hospitals (Page 1 of 2)
Staff Position
Patient Safety Culture Composites Database
Year Admin/ Mgmt
Attending/ Physician/ Resident/
PA or NP Dietitian
Pat. Care Asst/ Aide/ Care
Partner Pharm-
acist
RN/ LVN/ LPN
Tech (EKG, Lab,
Radiol)
Therapist (Respir, Phys,
Occup, Speech)
Unit Asst/ Clerk/
Secretary
# Hospitals Both Years 275 169 48 259 184 300 279 263 250
# Respondents Most Recent 14,967 12,260 473 13,270 3,387 78,435 23,635 10,432 9,709
Previous 13,851 10,475 933 11,622 3,193 72,513 22,033 9,142 9,538
1. Teamwork Within Units Most Recent 90% 85% 84% 77% 80% 83% 78% 86% 82%
Previous 90% 85% 85% 77% 80% 83% 78% 87% 80%
Change 0% 0% -1% 0% 0% 0% 0% -1% 2%
2. Supv/Mgr Expectations & Actions Promoting Patient Safety
Most Recent 91% 79% 83% 78% 81% 78% 78% 81% 83%
Previous 90% 79% 82% 77% 80% 77% 77% 81% 81%
Change 1% 0% 1% 1% 1% 1% 1% 0% 2%
3. Organizational Learning – Continuous Improvement Most Recent 85% 71% 71% 74% 77% 73% 72% 72% 74%
Previous 84% 71% 75% 74% 77% 73% 71% 72% 73%
Change 1% 0% -4% 0% 0% 0% 1% 0% 1%
4. Management Support for Patient Safety Most Recent 87% 70% 77% 74% 72% 66% 75% 74% 78%
Previous 87% 69% 75% 73% 72% 66% 73% 74% 77%
Change 0% 1% 2% 1% 0% 0% 1% 0% 1%
5. Feedback & Communication About Error Most Recent 82% 63% 70% 73% 71% 66% 68% 70% 74%
Previous 82% 63% 71% 72% 71% 65% 68% 69% 72%
Change 0% 0% -1% 1% 0% 1% 0% 1% 2%
6. Frequency of Events Reported Most Recent 75% 58% 64% 71% 60% 67% 68% 60% 73%
Previous 74% 58% 59% 70% 57% 66% 67% 62% 71%
Change 1% 0% 5% 1% 3% 1% 1% -2% 2%

103
Table D-5. Trending: Composite-Level Average Percent Positive Response by Staff Position – 2018 Database Hospitals (Page 2 of 2)
Staff Position
Patient Safety Culture Composites Database
Year Admin/ Mgmt
Attending/ Physician/ Resident/
PA or NP Dietitian
Pat. Care Asst/ Aide/ Care
Partner Pharm-
acist
RN/ LVN/ LPN
Tech (EKG, Lab,
Radiol)
Therapist (Respir, Phys,
Occup, Speech)
Unit Asst/ Clerk/
Secretary
# Hospitals Both Years 275 169 48 259 184 300 279 263 250
# Respondents Most Recent 14,967 12,260 473 13,270 3,387 78,435 23,635 10,432 9,709
Previous 13,851 10,475 933 11,622 3,193 72,513 22,033 9,142 9,538
7. Overall Perceptions of Patient Safety Most Recent 78% 65% 72% 63% 67% 61% 71% 73% 69%
Previous 78% 65% 68% 62% 66% 61% 70% 73% 68%
Change 0% 0% 4% 1% 1% 0% 1% 0% 1%
8. Communication Openness Most Recent 80% 69% 68% 61% 70% 64% 64% 70% 65%
Previous 80% 66% 68% 59% 69% 63% 62% 69% 63%
Change 0% 3% 0% 2% 1% 1% 2% 1% 2%
9. Teamwork Across Units Most Recent 71% 63% 69% 61% 60% 58% 60% 66% 63%
Previous 71% 62% 66% 61% 60% 58% 59% 66% 61%
Change 0% 1% 3% 0% 0% 0% 1% 0% 2%
10. Staffing Most Recent 63% 52% 55% 47% 59% 53% 54% 60% 54%
Previous 63% 54% 52% 47% 60% 55% 55% 61% 52%
Change 0% -2% 3% 0% -1% -2% -1% -1% 2%
11. Handoffs & Transitions Most Recent 50% 45% 43% 52% 34% 48% 46% 46% 50%
Previous 50% 45% 39% 52% 34% 48% 44% 45% 48%
Change 0% 0% 4% 0% 0% 0% 2% 1% 2%
12. Nonpunitive Response to Error Most Recent 68% 45% 55% 40% 59% 48% 44% 56% 44%
Previous 65% 42% 49% 37% 56% 45% 41% 53% 41%
Change 3% 3% 6% 3% 3% 3% 3% 3% 3%

104
Table D-6. Trending: Item-Level Average Percent Positive Response by Staff Position – 2018 Database Hospitals (Page 1 of 6)
Staff Position
Survey Items by Composite Database
Year Admin/ Mgmt
Attending/ Physician/ Resident/
PA or NP Dietitian
Pat. Care Asst/ Aide/ Care
Partner Pharm-
acist
RN/ LVN/ LPN
Tech (EKG, Lab,
Radiol)
Therapist (Respir, Phys,
Occup, Speech)
Unit Asst/ Clerk/
Secretary # Hospitals Both Years 275 169 48 259 184 300 279 263 250
# Respondents Most Recent 14,967 12,260 473 13,270 3,387 78,435 23,635 10,432 9,709
Previous 13,851 10,475 933 11,622 3,193 72,513 22,033 9,142 9,538
Teamwork Within Units A1. People support one another in this unit. Most Recent 95% 91% 89% 83% 86% 89% 84% 91% 86%
Previous 94% 91% 91% 82% 86% 89% 84% 92% 86% Change 1% 0% -2% 1% 0% 0% 0% -1% 0%
A3. When a lot of work needs to be done quickly, we work together as a team to get the work done.
Most Recent 94% 88% 89% 80% 84% 88% 85% 89% 87% Previous 94% 89% 88% 80% 85% 88% 85% 90% 86% Change 0% -1% 1% 0% -1% 0% 0% -1% 1%
A4. In this unit, people treat each other with respect.
Most Recent 91% 88% 83% 76% 79% 83% 77% 87% 80% Previous 90% 88% 83% 75% 78% 82% 77% 87% 78% Change 1% 0% 0% 1% 1% 1% 0% 0% 2%
A11. When one area in this unit gets really busy, others help out.
Most Recent 82% 73% 77% 69% 70% 73% 67% 78% 74% Previous 81% 72% 77% 68% 71% 72% 68% 78% 72% Change 1% 1% 0% 1% -1% 1% -1% 0% 2%
Supv/Mgr Expectations & Actions Promoting Patient Safety B1. My supv/mgr says a good word when
he/she sees a job done according to established patient safety procedures.
Most Recent 91% 77% 82% 80% 78% 78% 75% 79% 83% Previous 89% 77% 81% 78% 77% 77% 74% 79% 81% Change 2% 0% 1% 2% 1% 1% 1% 0% 2%
B2. My supv/mgr seriously considers staff suggestions for improving patient safety.
Most Recent 92% 83% 86% 79% 81% 79% 77% 83% 84% Previous 92% 83% 86% 79% 80% 79% 77% 84% 82% Change 0% 0% 0% 0% 1% 0% 0% -1% 2%
B3R. Whenever pressure builds up, my supv/mgr wants us to work faster, even if it means taking shortcuts.
Most Recent 90% 76% 80% 78% 82% 76% 80% 80% 82% Previous 88% 75% 78% 75% 82% 75% 77% 79% 79% Change 2% 1% 2% 3% 0% 1% 3% 1% 3%
B4R. My supv/mgr overlooks patient safety problems that happen over and over.
Most Recent 91% 80% 83% 76% 82% 78% 80% 84% 82% Previous 89% 80% 80% 76% 81% 78% 79% 82% 81% Change 2% 0% 3% 0% 1% 0% 1% 2% 1%
Note: The item’s survey location is shown to the left. An “R” indicates a negatively worded item, where the percent positive response is based on those who responded “Strongly disagree” or “Disagree,” or “Never” or “Rarely” (depending on the response category used for the item).

105
Table D-6. Trending: Item-Level Average Percent Positive Response by Staff Position – 2018 Database Hospitals (Page 2 of 6)
Staff Position
Survey Items by Composite Database
Year Admin/ Mgmt
Attending/ Physician/ Resident/
PA or NP Dietitian
Pat. Care Asst/ Aide/ Care
Partner Pharm-
acist
RN/ LVN/ LPN
Tech (EKG, Lab,
Radiol)
Therapist (Respir, Phys,
Occup, Speech)
Unit Asst/ Clerk/
Secretary
# Hospitals Both Years 275 169 48 259 184 300 279 263 250
# Respondents Most Recent 14,967 12,260 473 13,270 3,387 78,435 23,635 10,432 9,709
Previous 13,851 10,475 933 11,622 3,193 72,513 22,033 9,142 9,538
Organizational Learning – Continuous Improvement
A6. We are actively doing things to improve patient safety.
Most Recent 91% 84% 84% 86% 88% 83% 83% 86% 86% Previous 90% 84% 86% 86% 88% 84% 83% 86% 85% Change 1% 0% -2% 0% 0% -1% 0% 0% 1%
A9. Mistakes have led to positive changes here. Most Recent 81% 66% 57% 61% 78% 63% 63% 60% 63% Previous 82% 65% 66% 61% 78% 62% 63% 61% 63% Change -1% 1% -9% 0% 0% 1% 0% -1% 0%
A13. After we make changes to improve patient safety, we evaluate their effectiveness.
Most Recent 82% 63% 73% 76% 65% 72% 68% 70% 73% Previous 80% 63% 75% 75% 65% 71% 68% 70% 73% Change 2% 0% -2% 1% 0% 1% 0% 0% 0%
Management Support for Patient Safety
F1. Hospital management provides a work climate that promotes patient safety.
Most Recent 93% 79% 87% 83% 80% 74% 83% 84% 87% Previous 93% 78% 85% 83% 79% 75% 83% 84% 86% Change 0% 1% 2% 0% 1% -1% 0% 0% 1%
F8. The actions of hospital management show that patient safety is a top priority.
Most Recent 90% 73% 81% 79% 77% 69% 77% 77% 82% Previous 90% 72% 80% 78% 75% 69% 77% 77% 81% Change 0% 1% 1% 1% 2% 0% 0% 0% 1%
F9R. Hospital management seems interested in patient safety only after an adverse event happens.
Most Recent 77% 57% 62% 60% 59% 55% 61% 61% 65% Previous 77% 58% 62% 59% 61% 55% 61% 61% 64% Change 0% -1% 0% 1% -2% 0% 0% 0% 1%
Note: The item’s survey location is shown to the left. An “R” indicates a negatively worded item, where the percent positive response is based on those who responded “Strongly disagree” or “Disagree,” or “Never” or “Rarely” (depending on the response category used for the item).

106
Table D-6. Trending: Item-Level Average Percent Positive by Staff Position – 2018 Database Hospitals (Page 3 of 6)
Staff Position
Survey Items by Composite Database
Year Admin/ Mgmt
Attending/ Physician/ Resident/
PA or NP Dietitian
Pat. Care Asst/ Aide/ Care
Partner Pharm-
acist
RN/ LVN/ LPN
Tech (EKG, Lab,
Radiol)
Therapist (Respir, Phys,
Occup, Speech)
Unit Asst/ Clerk/
Secretary
# Hospitals Both Years 275 169 48 259 184 300 279 263 250
# Respondents Most Recent 14,967 12,260 473 13,270 3,387 78,435 23,635 10,432 9,709
Previous 13,851 10,475 933 11,622 3,193 72,513 22,033 9,142 9,538
Feedback & Communication About Error
C1. We are given feedback about changes put into place based on event reports.
Most Recent 75% 54% 64% 65% 62% 60% 59% 63% 67% Previous 75% 55% 65% 65% 62% 59% 59% 63% 64% Change 0% -1% -1% 0% 0% 1% 0% 0% 3%
C3. We are informed about errors that happen in this unit.
Most Recent 82% 61% 68% 75% 74% 65% 71% 70% 76% Previous 82% 61% 70% 73% 74% 64% 70% 68% 74% Change 0% 0% -2% 2% 0% 1% 1% 2% 2%
C5. In this unit, we discuss ways to prevent errors from happening again.
Most Recent 89% 74% 79% 78% 77% 74% 74% 77% 80% Previous 89% 73% 77% 77% 78% 73% 73% 76% 78% Change 0% 1% 2% 1% -1% 1% 1% 1% 2%
Frequency of Events Reported
D1. When a mistake is made, but is caught and corrected before affecting the patient, how often is this reported?
Most Recent 71% 53% 60% 70% 48% 60% 64% 57% 71%
Previous 70% 53% 58% 68% 45% 58% 62% 58% 68% Change 1% 0% 2% 2% 3% 2% 2% -1% 3%
D2. When a mistake is made, but has no potential to harm the patient, how often is this reported?
Most Recent 71% 51% 54% 67% 55% 64% 64% 54% 69% Previous 69% 52% 54% 67% 52% 63% 63% 56% 68% Change 2% -1% 0% 0% 3% 1% 1% -2% 1%
D3. When a mistake is made that could harm the patient, but does not, how often is this reported?
Most Recent 84% 69% 78% 76% 75% 76% 78% 70% 80% Previous 82% 69% 69% 76% 73% 76% 77% 71% 77% Change 2% 0% 9% 0% 2% 0% 1% -1% 3%
Note: The item’s survey location is shown to the left. An “R” indicates a negatively worded item, where the percent positive response is based on those who responded “Strongly disagree” or “Disagree,” or “Never” or “Rarely” (depending on the response category used for the item).

107
Table D-6. Trending: Item-Level Average Percent Positive by Staff Position – 2018 Database Hospitals (Page 4 of 6)
Staff Position
Survey Items by Composite Database
Year Admin/ Mgmt
Attending/ Physician/ Resident/
PA or NP Dietitian
Pat. Care Asst/ Aide/ Care
Partner Pharm-
acist
RN/ LVN/ LPN
Tech (EKG, Lab,
Radiol)
Therapist (Respir, Phys,
Occup, Speech)
Unit Asst/ Clerk/
Secretary
# Hospitals Both Years 275 169 48 259 184 300 279 263 250
# Respondents Most Recent 14,967 12,260 473 13,270 3,387 78,435 23,635 10,432 9,709
Previous 13,851 10,475 933 11,622 3,193 72,513 22,033 9,142 9,538
Overall Perceptions of Patient Safety
A10R. It is just by chance that more serious mistakes don’t happen around here.
Most Recent 76% 67% 65% 53% 65% 62% 64% 71% 60% Previous 76% 66% 65% 51% 66% 61% 63% 70% 58% Change 0% 1% 0% 2% -1% 1% 1% 1% 2%
A15. Patient safety is never sacrificed to get more work done.
Most Recent 76% 60% 72% 64% 62% 54% 70% 69% 71% Previous 76% 61% 66% 63% 60% 55% 70% 71% 70% Change 0% -1% 6% 1% 2% -1% 0% -2% 1%
A17R. We have patient safety problems in this unit.
Most Recent 77% 62% 73% 62% 65% 57% 72% 73% 70% Previous 77% 63% 67% 61% 65% 57% 71% 74% 70% Change 0% -1% 6% 1% 0% 0% 1% -1% 0%
A18. Our procedures and systems are good at preventing errors from happening.
Most Recent 82% 73% 78% 74% 74% 72% 77% 77% 76% Previous 82% 71% 75% 73% 75% 72% 77% 78% 75% Change 0% 2% 3% 1% -1% 0% 0% -1% 1%
Communication Openness
C2. Staff will freely speak up if they see something that may negatively affect patient care.
Most Recent 88% 78% 79% 76% 79% 77% 78% 83% 80% Previous 88% 75% 81% 75% 77% 76% 78% 83% 78% Change 0% 3% -2% 1% 2% 1% 0% 0% 2%
C4. Staff feel free to question the decisions or actions of those with more authority.
Most Recent 73% 59% 52% 43% 55% 49% 46% 54% 47% Previous 72% 55% 54% 42% 56% 47% 45% 52% 46% Change 1% 4% -2% 1% -1% 2% 1% 2% 1%
C6R. Staff are afraid to ask questions when something does not seem right.
Most Recent 80% 71% 73% 65% 75% 67% 67% 72% 69% Previous 79% 68% 70% 61% 74% 64% 65% 71% 65% Change 1% 3% 3% 4% 1% 3% 2% 1% 4%
Note: The item’s survey location is shown to the left. An “R” indicates a negatively worded item, where the percent positive response is based on those who responded “Strongly disagree” or “Disagree,” or “Never” or “Rarely” (depending on the response category used for the item).

108
Table D-6. Trending: Item-Level Average Percent Positive by Staff Position – 2018 Database Hospitals (Page 5 of 6)
Staff Position
Survey Items by Composite Database
Year Admin/ Mgmt
Attending/ Physician/ Resident/
PA or NP Dietitian
Pat. Care Asst/ Aide/ Care
Partner Pharm-
acist
RN/ LVN/ LPN
Tech (EKG, Lab,
Radiol)
Therapist (Respir, Phys,
Occup, Speech)
Unit Asst/ Clerk/
Secretary # Hospitals Both Years 275 169 48 259 184 300 279 263 250
# Respondents Most Recent 14,967 12,260 473 13,270 3,387 78,435 23,635 10,432 9,709
Previous 13,851 10,475 933 11,622 3,193 72,513 22,033 9,142 9,538
Teamwork Across Units F2R. Hospital units do not coordinate well with
each other. Most Recent 61% 50% 54% 49% 48% 45% 48% 53% 52%
Previous 61% 49% 52% 48% 46% 45% 46% 52% 50% Change 0% 1% 2% 1% 2% 0% 2% 1% 2%
F4. There is good cooperation among hospital units that need to work together.
Most Recent 73% 63% 72% 62% 58% 57% 61% 67% 64% Previous 72% 62% 69% 61% 59% 58% 60% 68% 62% Change 1% 1% 3% 1% -1% -1% 1% -1% 2%
F6R. It is often unpleasant to work with staff from other hospital units.
Most Recent 70% 66% 74% 61% 64% 62% 59% 71% 64% Previous 70% 67% 66% 62% 67% 62% 59% 70% 61% Change 0% -1% 8% -1% -3% 0% 0% 1% 3%
F10. Hospital units work well together to provide the best care for patients.
Most Recent 81% 73% 77% 74% 69% 68% 72% 75% 75% Previous 80% 70% 77% 72% 69% 67% 71% 76% 73% Change 1% 3% 0% 2% 0% 1% 1% -1% 2%
Staffing A2. We have enough staff to handle the
workload. Most Recent 66% 53% 53% 42% 51% 49% 48% 55% 52%
Previous 66% 56% 54% 41% 52% 49% 49% 55% 48% Change 0% -3% -1% 1% -1% 0% -1% 0% 4%
A5R. Staff in this unit work longer hours than is best for patient care.
Most Recent 57% 47% 47% 40% 63% 49% 52% 56% 46% Previous 58% 48% 46% 41% 62% 52% 55% 58% 47% Change -1% -1% 1% -1% 1% -3% -3% -2% -1%
A7R. We use more agency/temporary staff than is best for patient care.
Most Recent 70% 55% 63% 60% 73% 68% 68% 72% 63% Previous 70% 60% 59% 61% 74% 72% 68% 72% 63% Change 0% -5% 4% -1% -1% -4% 0% 0% 0%
A14R. We work in “crisis mode,” trying to do too much, too quickly.
Most Recent 59% 52% 56% 47% 51% 46% 50% 58% 54% Previous 58% 52% 50% 45% 51% 46% 49% 58% 52% Change 1% 0% 6% 2% 0% 0% 1% 0% 2%
Note: The item’s survey location is shown to the left. An “R” indicates a negatively worded item, where the percent positive response is based on those who responded “Strongly disagree” or “Disagree,” or “Never” or “Rarely” (depending on the response category used for the item).

109
Table D-6. Trending: Item-Level Average Percent Positive by Staff Position – 2018 Database Hospitals (Page 6 of 6)
Staff Position
Survey Items by Composite Database
Year Admin/ Mgmt
Attending/ Physician/ Resident/
PA or NP Dietitian
Pat. Care Asst/ Aide/ Care
Partner Pharm-
acist
RN/ LVN/ LPN
Tech (EKG, Lab,
Radiol)
Therapist (Respir, Phys,
Occup, Speech)
Unit Asst/ Clerk/
Secretary
# Hospitals Both Years 275 169 48 259 184 300 279 263 250
# Respondents Most Recent 14,967 12,260 473 13,270 3,387 78,435 23,635 10,432 9,709
Previous 13,851 10,475 933 11,622 3,193 72,513 22,033 9,142 9,538
Handoffs & Transitions
F3R. Things “fall between the cracks” when transferring patients from one unit to another.
Most Recent 45% 43% 38% 49% 22% 41% 40% 40% 46% Previous 46% 42% 33% 48% 22% 42% 38% 40% 44% Change -1% 1% 5% 1% 0% -1% 2% 0% 2%
F5R. Important patient care information is often lost during shift changes.
Most Recent 55% 49% 45% 61% 40% 55% 53% 48% 57% Previous 55% 48% 40% 60% 39% 55% 51% 49% 54% Change 0% 1% 5% 1% 1% 0% 2% -1% 3%
F7R. Problems often occur in the exchange of information across hospital units.
Most Recent 51% 46% 47% 48% 36% 46% 45% 48% 50% Previous 51% 45% 44% 49% 35% 46% 43% 47% 48% Change 0% 1% 3% -1% 1% 0% 2% 1% 2%
F11R. Shift changes are problematic for patients in this hospital.
Most Recent 50% 44% 44% 52% 37% 49% 47% 47% 47% Previous 50% 44% 37% 51% 38% 50% 44% 45% 45% Change 0% 0% 7% 1% -1% -1% 3% 2% 2%
Nonpunitive Response to Error
A8R. Staff feel like their mistakes are held against them.
Most Recent 73% 51% 61% 46% 62% 53% 49% 61% 50% Previous 70% 49% 54% 42% 59% 51% 46% 59% 47% Change 3% 2% 7% 4% 3% 2% 3% 2% 3%
A12R. When an event is reported, it feels like the person is being written up, not the problem.
Most Recent 74% 48% 57% 41% 64% 52% 47% 57% 46% Previous 72% 46% 50% 38% 62% 50% 44% 55% 43% Change 2% 2% 7% 3% 2% 2% 3% 2% 3%
A16R. Staff worry that mistakes they make are kept in their personnel file.
Most Recent 56% 35% 49% 33% 51% 39% 36% 49% 35% Previous 52% 32% 42% 30% 47% 36% 33% 46% 33% Change 4% 3% 7% 3% 4% 3% 3% 3% 2%
Note: The item’s survey location is shown to the left. An “R” indicates a negatively worded item, where the percent positive response is based on those who responded “Strongly disagree” or “Disagree,” or “Never” or “Rarely” (depending on the response category used for the item).
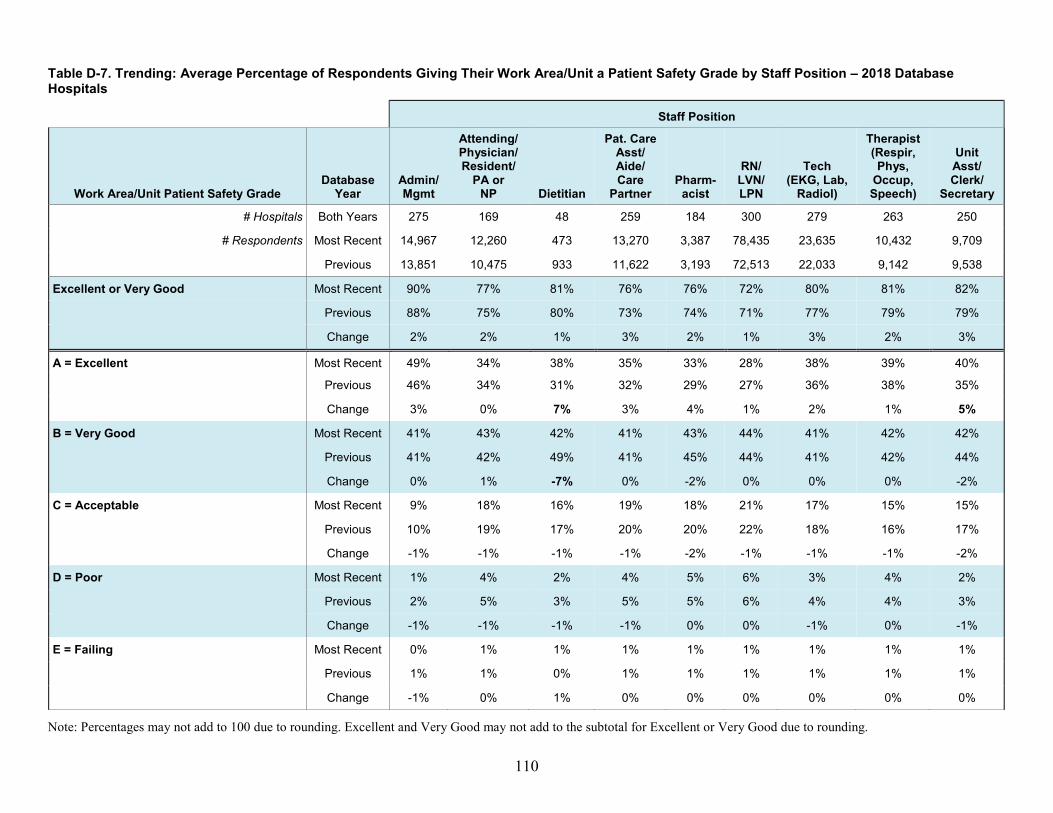
110
Table D-7. Trending: Average Percentage of Respondents Giving Their Work Area/Unit a Patient Safety Grade by Staff Position – 2018 Database Hospitals
Staff Position
Work Area/Unit Patient Safety Grade Database
Year Admin/ Mgmt
Attending/ Physician/ Resident/
PA or NP Dietitian
Pat. Care Asst/ Aide/ Care
Partner Pharm-
acist
RN/ LVN/ LPN
Tech (EKG, Lab,
Radiol)
Therapist (Respir, Phys,
Occup, Speech)
Unit Asst/ Clerk/
Secretary
# Hospitals Both Years 275 169 48 259 184 300 279 263 250
# Respondents Most Recent 14,967 12,260 473 13,270 3,387 78,435 23,635 10,432 9,709
Previous 13,851 10,475 933 11,622 3,193 72,513 22,033 9,142 9,538
Excellent or Very Good Most Recent 90% 77% 81% 76% 76% 72% 80% 81% 82%
Previous 88% 75% 80% 73% 74% 71% 77% 79% 79%
Change 2% 2% 1% 3% 2% 1% 3% 2% 3%
A = Excellent Most Recent 49% 34% 38% 35% 33% 28% 38% 39% 40%
Previous 46% 34% 31% 32% 29% 27% 36% 38% 35%
Change 3% 0% 7% 3% 4% 1% 2% 1% 5%
B = Very Good Most Recent 41% 43% 42% 41% 43% 44% 41% 42% 42%
Previous 41% 42% 49% 41% 45% 44% 41% 42% 44%
Change 0% 1% -7% 0% -2% 0% 0% 0% -2%
C = Acceptable Most Recent 9% 18% 16% 19% 18% 21% 17% 15% 15%
Previous 10% 19% 17% 20% 20% 22% 18% 16% 17%
Change -1% -1% -1% -1% -2% -1% -1% -1% -2%
D = Poor Most Recent 1% 4% 2% 4% 5% 6% 3% 4% 2%
Previous 2% 5% 3% 5% 5% 6% 4% 4% 3%
Change -1% -1% -1% -1% 0% 0% -1% 0% -1%
E = Failing Most Recent 0% 1% 1% 1% 1% 1% 1% 1% 1%
Previous 1% 1% 0% 1% 1% 1% 1% 1% 1%
Change -1% 0% 1% 0% 0% 0% 0% 0% 0%
Note: Percentages may not add to 100 due to rounding. Excellent and Very Good may not add to the subtotal for Excellent or Very Good due to rounding.

111
Table D-8. Trending: Average Percentage of Respondents Reporting Events in the Past 12 Months by Staff Position – 2018 Database Hospitals
Staff Position
Number of Events Reported by Respondents
Database Year
Admin/ Mgmt
Attending/ Physician/Resident/
PA or NP Dietitian
Pat. Care Asst/ Aide/
Care Partner Pharm-
acist RN/LVN/LPN
Tech (EKG, Lab,
Radiol)
Therapist (Respir, Phys,
Occup, Speech)
Unit Asst/ Clerk/
Secretary
# Hospitals Both Years 275 169 48 259 184 300 279 263 250
# Respondents Most Recent 14,967 12,260 473 13,270 3,387 78,435 23,635 10,432 9,709
Previous 13,851 10,475 933 11,622 3,193 72,513 22,033 9,142 9,538
1 or More Events Most Recent 52% 36% 27% 20% 78% 69% 42% 38% 17%
Previous 50% 35% 23% 20% 76% 67% 41% 38% 16%
Change 2% 1% 4% 0% 2% 2% 1% 0% 1%
None Most Recent 48% 64% 73% 80% 22% 31% 58% 62% 83% Previous 50% 65% 77% 80% 24% 33% 59% 62% 84%
Change -2% -1% -4% 0% -2% -2% -1% 0% -1%
1 to 2 Most Recent 21% 25% 18% 15% 22% 38% 26% 29% 12%
Previous 21% 23% 15% 15% 25% 39% 26% 30% 12%
Change 0% 2% 3% 0% -3% -1% 0% -1% 0%
3 to 5 Most Recent 16% 8% 6% 3% 23% 21% 10% 7% 3%
Previous 15% 8% 4% 3% 21% 19% 9% 6% 3%
Change 1% 0% 2% 0% 2% 2% 1% 1% 0%
6 to 10 Most Recent 8% 2% 1% 1% 16% 6% 4% 1% 1%
Previous 9% 2% 2% 1% 15% 6% 3% 1% 1%
Change -1% 0% -1% 0% 1% 0% 1% 0% 0%
11 to 20 Most Recent 4% 1% 1% 1% 10% 3% 2% 0% 1%
Previous 3% 1% 1% 0% 9% 2% 2% 0% 0%
Change 1% 0% 0% 1% 1% 1% 0% 0% 1%
21 or More Most Recent 3% 0% 0% 0% 7% 1% 1% 0% 0%
Previous 3% 0% 0% 0% 6% 1% 1% 0% 0%
Change 0% 0% 0% 0% 1% 0% 0% 0% 0%
Note: Percentages may not add to 100 due to rounding. Percentages for number of events may not add to the subtotal for 1 or more events due to rounding.

112
Appendix D: Trending Results by Respondent Characteristics (3) Interaction With Patients NOTE 1: Results are from 306 hospitals. The number of hospitals and respondents in each interaction with patients category is shown in each table. However, the precise number of hospitals and respondents corresponding to each data cell in a table will vary because hospitals may have omitted a specific survey item and because of individual nonresponse/missing data.
NOTE 2: Respondents who did not answer (missing) are not included.

113
Table D-9. Trending: Composite-Level Average Percent Positive Response by Interaction With Patients – 2018 Database Hospitals (Page 1 of 2)
Interaction With Patients
Patient Safety Culture Composites Database
Year WITH
Direct Interaction WITHOUT
Direct Interaction
# Hospitals Both Years 304 291
# Respondents Most Recent 162,777 47,239
Previous 149,516 44,513
1. Teamwork Within Units Most Recent 82% 83%
Previous 82% 82%
Change 0% 1%
2. Supv/Mgr Expectations & Actions Promoting Patient Safety Most Recent 79% 83%
Previous 78% 81%
Change 1% 2%
3. Organizational Learning – Continuous Improvement Most Recent 73% 75%
Previous 73% 74%
Change 0% 1%
4. Management Support for Patient Safety Most Recent 71% 80%
Previous 71% 79%
Change 0% 1%
5. Feedback & Communication About Error Most Recent 69% 73%
Previous 68% 72%
Change 1% 1%
6. Frequency of Events Reported Most Recent 67% 71%
Previous 66% 69%
Change 1% 2%

114
Table D-9. Trending: Composite-Level Average Percent Positive Response by Interaction With Patients – 2018 Database Hospitals (Page 2 of 2)
Interaction With Patients
Patient Safety Culture Composites Database
Year WITH
Direct Interaction WITHOUT
Direct Interaction
# Hospitals Both Years 304 291
# Respondents Most Recent 162,777 47,239
Previous 149,516 44,513
7. Overall Perceptions of Patient Safety Most Recent 66% 70%
Previous 66% 69%
Change 0% 1%
8. Communication Openness Most Recent 65% 69%
Previous 63% 67%
Change 2% 2%
9. Teamwork Across Units Most Recent 61% 64%
Previous 61% 63%
Change 0% 1%
10. Staffing Most Recent 54% 54%
Previous 55% 53%
Change -1% 1%
11. Handoffs & Transitions Most Recent 49% 44%
Previous 48% 42%
Change 1% 2%
12. Nonpunitive Response to Error Most Recent 47% 52%
Previous 45% 49%
Change 2% 3%

115
Table D-10. Trending: Item-Level Average Percent Positive Response by Interaction With Patients – 2018 Database Hospitals (Page 1 of 6)
Interaction With Patients
Survey Items by Composite Database
Year WITH
Direct Interaction WITHOUT
Direct Interaction
# Hospitals Both Years 304 291
# Respondents Most Recent 162,777 47,239
Previous 149,516 44,513 Teamwork Within Units
A1. People support one another in this unit. Most Recent 88% 87% Previous 88% 87% Change 0% 0%
A3. When a lot of work needs to be done quickly, we work together as a team to get the work done. Most Recent 87% 88% Previous 87% 88% Change 0% 0%
A4. In this unit, people treat each other with respect. Most Recent 82% 82% Previous 81% 81% Change 1% 1%
A11. When one area in this unit gets really busy, others help out. Most Recent 72% 73% Previous 72% 72% Change 0% 1%
Supv/Mgr Expectations & Actions Promoting Patient Safety
B1. My supv/mgr says a good word when he/she sees a job done according to established patient safety procedures.
Most Recent 79% 84% Previous 77% 82% Change 2% 2%
B2. My supv/mgr seriously considers staff suggestions for improving patient safety. Most Recent 80% 84% Previous 79% 83% Change 1% 1%
B3R. Whenever pressure builds up, my supv/mgr wants us to work faster, even if it means taking shortcuts. Most Recent 78% 83% Previous 76% 80% Change 2% 3%
B4R. My supv/mgr overlooks patient safety problems that happen over and over. Most Recent 80% 83% Previous 79% 81% Change 1% 2%
Note: The item’s survey location is shown to the left. An “R” indicates a negatively worded item, where the percent positive response is based on those who responded “Strongly disagree” or “Disagree,” or “Never” or “Rarely” (depending on the response category used for the item).

116
Table D-10. Trending: Item-Level Average Percent Positive Response by Interaction With Patients – 2018 Database Hospitals (Page 2 of 6)
Interaction With Patients
Survey Items by Composite Database
Year WITH
Direct Interaction WITHOUT
Direct Interaction
# Hospitals Both Years 304 291
# Respondents Most Recent 162,777 47,239
Previous 149,516 44,513 Organizational Learning – Continuous Improvement
A6. We are actively doing things to improve patient safety. Most Recent 84% 84% Previous 84% 83% Change 0% 1%
A9. Mistakes have led to positive changes here. Most Recent 63% 69% Previous 63% 69% Change 0% 0%
A13. After we make changes to improve patient safety, we evaluate their effectiveness. Most Recent 71% 71% Previous 71% 70% Change 0% 1%
Management Support for Patient Safety
F1. Hospital management provides a work climate that promotes patient safety. Most Recent 80% 88% Previous 80% 88% Change 0% 0%
F8. The actions of hospital management show that patient safety is a top priority. Most Recent 75% 84% Previous 74% 83% Change 1% 1%
F9R. Hospital management seems interested in patient safety only after an adverse event happens. Most Recent 59% 68% Previous 59% 68% Change 0% 0%
Note: The item’s survey location is shown to the left. An “R” indicates a negatively worded item, where the percent positive response is based on those who responded “Strongly disagree” or “Disagree,” or “Never” or “Rarely” (depending on the response category used for the item).

117
Table D-10. Trending: Item-Level Average Percent Positive Response by Interaction With Patients – 2018 Database Hospitals (Page 3 of 6) Interaction With Patients
Survey Items by Composite Database
Year WITH
Direct Interaction WITHOUT
Direct Interaction
# Hospitals Both Years 304 291 # Respondents Most Recent 162,777 47,239 Previous 149,516 44,513 Feedback & Communication About Error C1. We are given feedback about changes put into place based on event reports. Most Recent 61% 65%
Previous 61% 65% Change 0% 0%
C3. We are informed about errors that happen in this unit. Most Recent 69% 75% Previous 68% 74% Change 1% 1%
C5. In this unit, we discuss ways to prevent errors from happening again. Most Recent 76% 80% Previous 74% 79% Change 2% 1%
Frequency of Events Reported D1. When a mistake is made, but is caught and corrected before affecting the patient, how often is this
reported? Most Recent 62% 68%
Previous 60% 65% Change 2% 3%
D2. When a mistake is made, but has no potential to harm the patient, how often is this reported? Most Recent 63% 66% Previous 62% 65% Change 1% 1%
D3. When a mistake is made that could harm the patient, but does not, how often is this reported? Most Recent 75% 79% Previous 75% 77% Change 0% 2%
Note: The item’s survey location is shown to the left. An “R” indicates a negatively worded item, where the percent positive response is based on those who responded “Strongly disagree” or “Disagree,” or “Never” or “Rarely” (depending on the response category used for the item).
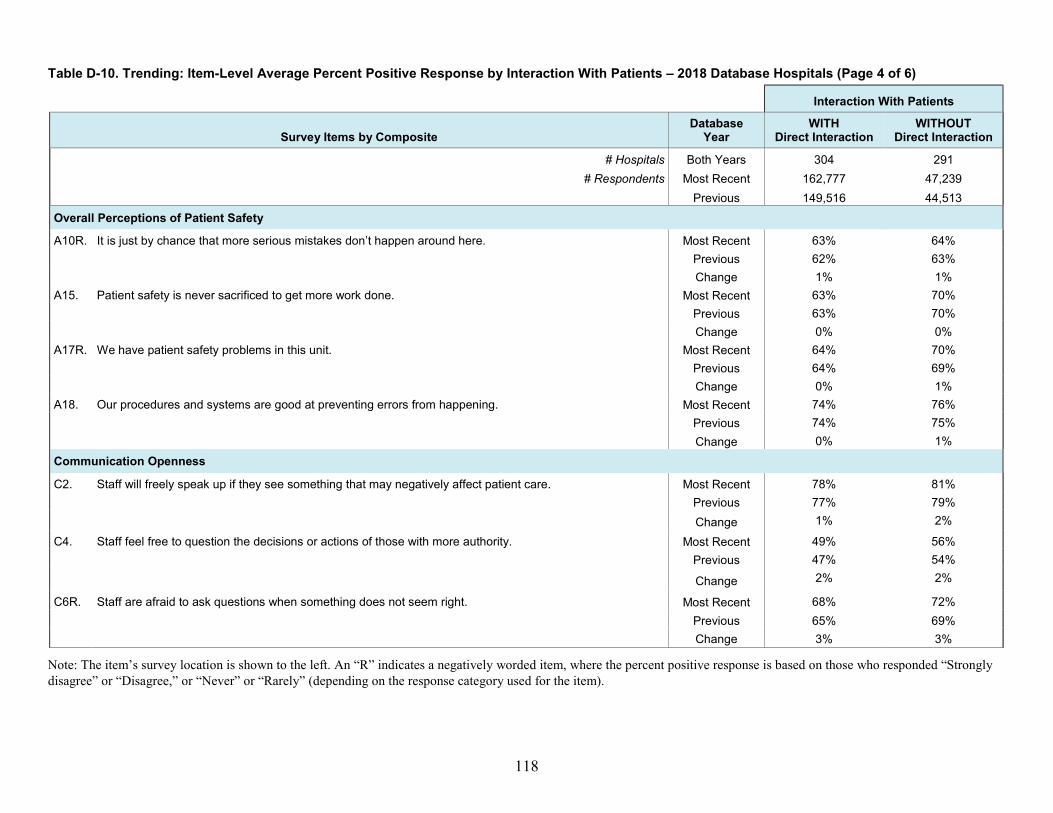
118
Table D-10. Trending: Item-Level Average Percent Positive Response by Interaction With Patients – 2018 Database Hospitals (Page 4 of 6)
Interaction With Patients
Survey Items by Composite Database
Year WITH
Direct Interaction WITHOUT
Direct Interaction
# Hospitals Both Years 304 291
# Respondents Most Recent 162,777 47,239
Previous 149,516 44,513 Overall Perceptions of Patient Safety
A10R. It is just by chance that more serious mistakes don’t happen around here. Most Recent 63% 64% Previous 62% 63% Change 1% 1%
A15. Patient safety is never sacrificed to get more work done. Most Recent 63% 70% Previous 63% 70% Change 0% 0%
A17R. We have patient safety problems in this unit. Most Recent 64% 70% Previous 64% 69% Change 0% 1%
A18. Our procedures and systems are good at preventing errors from happening. Most Recent 74% 76% Previous 74% 75% Change 0% 1%
Communication Openness
C2. Staff will freely speak up if they see something that may negatively affect patient care. Most Recent 78% 81% Previous 77% 79% Change 1% 2%
C4. Staff feel free to question the decisions or actions of those with more authority. Most Recent 49% 56% Previous 47% 54%
Change 2% 2%
C6R. Staff are afraid to ask questions when something does not seem right. Most Recent 68% 72% Previous 65% 69% Change 3% 3%
Note: The item’s survey location is shown to the left. An “R” indicates a negatively worded item, where the percent positive response is based on those who responded “Strongly disagree” or “Disagree,” or “Never” or “Rarely” (depending on the response category used for the item).

119
Table D-10. Trending: Item-Level Average Percent Positive Response by Interaction With Patients – 2018 Database Hospitals (Page 5 of 6)
Interaction With Patients
Survey Items by Composite Database
Year WITH
Direct Interaction WITHOUT
Direct Interaction
# Hospitals Both Years 304 291
# Respondents Most Recent 162,777 47,239
Previous 149,516 44,513 Teamwork Across Units
F2R. Hospital units do not coordinate well with each other. Most Recent 48% 53% Previous 48% 51% Change 0% 2%
F4. There is good cooperation among hospital units that need to work together. Most Recent 61% 65% Previous 61% 64% Change 0% 1%
F6R. It is often unpleasant to work with staff from other hospital units. Most Recent 64% 63% Previous 63% 61% Change 1% 2%
F10. Hospital units work well together to provide the best care for patients. Most Recent 71% 76% Previous 71% 74% Change 0% 2%
Staffing
A2. We have enough staff to handle the workload. Most Recent 50% 57% Previous 51% 54% Change -1% 3%
A5R. Staff in this unit work longer hours than is best for patient care. Most Recent 49% 49% Previous 51% 49% Change -2% 0%
A7R. We use more agency/temporary staff than is best for patient care. Most Recent 66% 61% Previous 68% 60% Change -2% 1%
A14R. We work in “crisis mode,” trying to do too much, too quickly. Most Recent 50% 51% Previous 49% 49% Change 1% 2%
Note: The item’s survey location is shown to the left. An “R” indicates a negatively worded item, where the percent positive response is based on those who responded “Strongly disagree” or “Disagree,” or “Never” or “Rarely” (depending on the response category used for the item).

120
Table D-10. Trending: Item-Level Average Percent Positive Response by Interaction With Patients – 2018 Database Hospitals (Page 6 of 6)
Interaction With Patients
Survey Items by Composite Database
Year WITH
Direct Interaction WITHOUT
Direct Interaction
# Hospitals Both Years 304 291
# Respondents Most Recent 162,777 47,239
Previous 149,516 44,513 Handoffs & Transitions
F3R. Things “fall between the cracks” when transferring patients from one unit to another. Most Recent 43% 38% Previous 43% 36% Change 0% 2%
F5R. Important patient care information is often lost during shift changes. Most Recent 55% 49% Previous 55% 47% Change 0% 2%
F7R. Problems often occur in the exchange of information across hospital units. Most Recent 47% 44% Previous 47% 42% Change 0% 2%
F11R. Shift changes are problematic for patients in this hospital. Most Recent 49% 44% Previous 49% 42% Change 0% 2%
Nonpunitive Response to Error
A8R. Staff feel like their mistakes are held against them. Most Recent 53% 58% Previous 50% 55% Change 3% 3%
A12R. When an event is reported, it feels like the person is being written up, not the problem. Most Recent 50% 55% Previous 48% 52% Change 2% 3%
A16R. Staff worry that mistakes they make are kept in their personnel file. Most Recent 39% 43% Previous 36% 40% Change 3% 3%
Note: The item’s survey location is shown to the left. An “R” indicates a negatively worded item, where the percent positive response is based on those who responded “Strongly disagree” or “Disagree,” or “Never” or “Rarely” (depending on the response category used for the item).
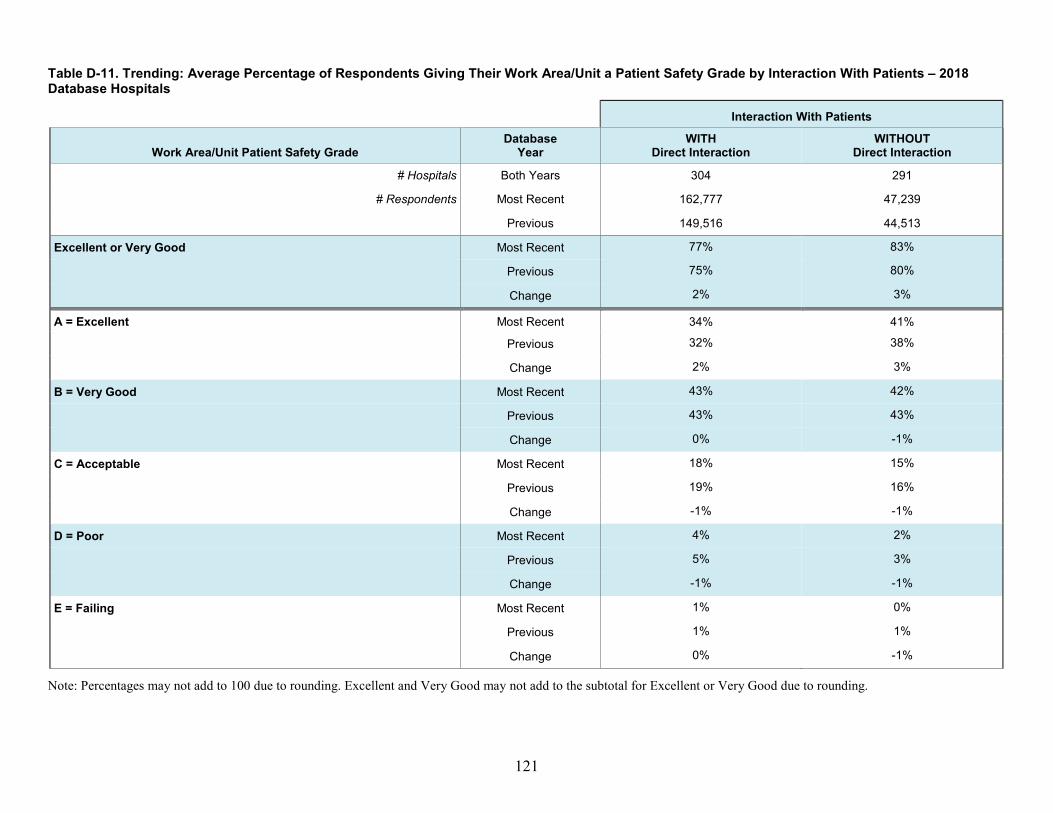
121
Table D-11. Trending: Average Percentage of Respondents Giving Their Work Area/Unit a Patient Safety Grade by Interaction With Patients – 2018 Database Hospitals
Interaction With Patients
Work Area/Unit Patient Safety Grade Database
Year WITH
Direct Interaction WITHOUT
Direct Interaction
# Hospitals Both Years 304 291
# Respondents Most Recent 162,777 47,239
Previous 149,516 44,513
Excellent or Very Good Most Recent 77% 83%
Previous 75% 80%
Change 2% 3%
A = Excellent Most Recent 34% 41%
Previous 32% 38%
Change 2% 3%
B = Very Good Most Recent 43% 42%
Previous 43% 43%
Change 0% -1%
C = Acceptable Most Recent 18% 15%
Previous 19% 16%
Change -1% -1%
D = Poor Most Recent 4% 2%
Previous 5% 3%
Change -1% -1%
E = Failing Most Recent 1% 0%
Previous 1% 1%
Change 0% -1%
Note: Percentages may not add to 100 due to rounding. Excellent and Very Good may not add to the subtotal for Excellent or Very Good due to rounding.

122
Table D-12. Trending: Average Percent Positive of Respondents Reporting Events in the Past 12 Months by Interaction With Patients – 2018 Database Hospitals Interaction With Patients
Number of Events Reported by Respondents Database
Year WITH
Direct Interaction WITHOUT
Direct Interaction
# Hospitals Both Years 304 291
# Respondents Most Recent 162,777 47,239
Previous 149,516 44,513
1 or More Events Most Recent 50% 31%
Previous 49% 30%
Change 1% 1%
None Most Recent 50% 69% Previous 51% 70%
Change -1% -1%
1 to 2 Most Recent 29% 15%
Previous 30% 15%
Change -1% 0%
3 to 5 Most Recent 14% 9%
Previous 12% 8%
Change 2% 1%
6 to 10 Most Recent 4% 4%
Previous 4% 4%
Change 0% 0%
11 to 20 Most Recent 2% 2%
Previous 2% 2%
Change 0% 0%
21 or More Most Recent 1% 2%
Previous 1% 1%
Change 0% 1%
Note: Percentages may not add to 100 due to rounding. Percentages for number of events may not add to the subtotal for 1 or more events due to rounding.

123
Appendix D: Trending Results by Respondent Characteristics (4) Tenure in Current Work Area/Unit NOTE 1: Results are from 306 hospitals. The number of hospitals and respondents in each tenure in current work area/unit category is shown in each table. However, the precise number of hospitals and respondents corresponding to each data cell in a table will vary because hospitals may have omitted a specific survey item and because of individual nonresponse/missing data.
NOTE 2: Respondents who did not answer (missing) are not included.

124
Table D-13. Trending: Composite-Level Average Percent Positive Response by Tenure in Current Work Area/Unit – 2018 Database Hospitals (Page 1 of 2)
Tenure in Current Work Area/Unit
Patient Safety Culture Composites Database
Year
Less Than
1 Year 1 to 5 Years
6 to 10 Years
11 to 15 Years
16 to 20 Years
21 Years or More
# Hospitals Both Years 268 275 271 254 242 239
# Respondents Most Recent 34,572 78,870 34,823 21,162 13,019 13,919
Previous 27,830 69,902 38,236 20,722 10,533 13,648
1. Teamwork Within Units Most Recent 86% 82% 81% 82% 82% 84%
Previous 86% 81% 81% 82% 83% 84%
Change 0% 1% 0% 0% -1% 0%
2. Supv/Mgr Expectations & Actions Promoting Patient Safety Most Recent 84% 80% 79% 79% 80% 81%
Previous 84% 78% 77% 78% 79% 80%
Change 0% 2% 2% 1% 1% 1%
3. Organizational Learning – Continuous Improvement Most Recent 75% 72% 72% 74% 75% 77%
Previous 74% 72% 72% 73% 75% 77%
Change 1% 0% 0% 1% 0% 0%
4. Management Support for Patient Safety Most Recent 79% 71% 71% 73% 74% 77%
Previous 78% 71% 71% 73% 74% 77%
Change 1% 0% 0% 0% 0% 0%
5. Feedback & Communication About Error Most Recent 76% 68% 67% 68% 69% 70%
Previous 75% 68% 67% 67% 69% 70%
Change 1% 0% 0% 1% 0% 0%
6. Frequency of Events Reported Most Recent 70% 67% 66% 68% 68% 69%
Previous 68% 66% 66% 67% 68% 68%
Change 2% 1% 0% 1% 0% 1%

125
Table D-13. Trending: Composite-Level Average Percent Positive Response by Tenure in Current Work Area/Unit – 2018 Database Hospitals (Page 2 of 2)
Tenure in Current Work Area/Unit
Patient Safety Culture Composites Database
Year
Less Than
1 Year 1 to 5 Years
6 to 10 Years
11 to 15 Years
16 to 20 Years
21 Years or More
# Hospitals Both Years 268 275 271 254 242 239
# Respondents Most Recent 34,572 78,870 34,823 21,162 13,019 13,919
Previous 27,830 69,902 38,236 20,722 10,533 13,648
7. Overall Perceptions of Patient Safety Most Recent 71% 65% 65% 66% 68% 70%
Previous 70% 65% 65% 66% 67% 69%
Change 1% 0% 0% 0% 1% 1%
8. Communication Openness Most Recent 71% 64% 64% 66% 67% 68%
Previous 70% 63% 63% 64% 65% 68%
Change 1% 1% 1% 2% 2% 0%
9. Teamwork Across Units Most Recent 68% 60% 60% 62% 63% 66%
Previous 66% 59% 59% 61% 62% 65%
Change 2% 1% 1% 1% 1% 1%
10. Staffing Most Recent 55% 53% 54% 55% 55% 56%
Previous 56% 53% 54% 55% 56% 56%
Change -1% 0% 0% 0% -1% 0%
11. Handoffs & Transitions Most Recent 54% 47% 45% 46% 48% 48%
Previous 53% 46% 45% 46% 46% 48%
Change 1% 1% 0% 0% 2% 0%
12. Nonpunitive Response to Error Most Recent 48% 48% 48% 48% 49% 50%
Previous 46% 45% 45% 45% 47% 48%
Change 2% 3% 3% 3% 2% 2%

126
Table D-14. Trending: Item-Level Average Percent Positive Response by Tenure in Current Work Area/Unit – 2018 Database Hospitals (Page 1 of 6)
Tenure in Current Work Area/Unit
Survey Items by Composite Database
Year Less Than
1 Year 1 to 5 Years
6 to 10 Years
11 to 15 Years
16 to 20 Years
21 Years or More
# Hospitals Both Years 268 275 271 254 242 239
# Respondents Most Recent 34,572 78,870 34,823 21,162 13,019 13,919
Previous 27,830 69,902 38,236 20,722 10,533 13,648
Teamwork Within Units
A1. People support one another in this unit. Most Recent 91% 87% 86% 87% 88% 89% Previous 90% 87% 87% 87% 88% 90% Change 1% 0% -1% 0% 0% -1%
A3. When a lot of work needs to be done quickly, we work together as a team to get the work done.
Most Recent 90% 86% 87% 88% 88% 90% Previous 89% 86% 87% 88% 88% 90% Change 1% 0% 0% 0% 0% 0%
A4. In this unit, people treat each other with respect. Most Recent 86% 81% 81% 81% 82% 83% Previous 86% 80% 80% 80% 83% 84% Change 0% 1% 1% 1% -1% -1%
A11. When one area in this unit gets really busy, others help out.
Most Recent 79% 72% 71% 71% 71% 73% Previous 78% 71% 69% 71% 71% 73% Change 1% 1% 2% 0% 0% 0%
Supv/Mgr Expectations & Actions Promoting Patient Safety
B1. My supv/mgr says a good word when he/she sees a job done according to established patient safety procedures.
Most Recent 86% 80% 78% 79% 80% 80% Previous 85% 78% 77% 77% 78% 79% Change 1% 2% 1% 2% 2% 1%
B2. My supv/mgr seriously considers staff suggestions for improving patient safety.
Most Recent 86% 80% 79% 80% 81% 83% Previous 85% 79% 78% 79% 81% 82% Change 1% 1% 1% 1% 0% 1%
B3R. Whenever pressure builds up, my supv/mgr wants us to work faster, even if it means taking shortcuts.
Most Recent 83% 79% 78% 77% 79% 81% Previous 82% 76% 75% 75% 77% 78% Change 1% 3% 3% 2% 2% 3%
B4R. My supv/mgr overlooks patient safety problems that happen over and over.
Most Recent 83% 80% 80% 80% 81% 83% Previous 82% 78% 78% 79% 80% 83% Change 1% 2% 2% 1% 1% 0%
Note: The item’s survey location is shown to the left. An “R” indicates a negatively worded item, where the percent positive response is based on those who responded “Strongly disagree” or “Disagree,” or “Never” or “Rarely” (depending on the response category used for the item).

127
Table D-14. Trending: Item-Level Average Percent Positive Response by Tenure in Current Work Area/Unit – 2018 Database Hospitals (Page 2 of 6)
Tenure in Current Work Area/Unit
Survey Items by Composite Database
Year Less Than
1 Year 1 to 5 Years
6 to 10 Years
11 to 15 Years
16 to 20 Years
21 Years or More
# Hospitals Both Years 268 275 271 254 242 239
# Respondents Most Recent 34,572 78,870 34,823 21,162 13,019 13,919
Previous 27,830 69,902 38,236 20,722 10,533 13,648
Organizational Learning – Continuous Improvement
A6. We are actively doing things to improve patient safety.
Most Recent 88% 84% 83% 84% 85% 87% Previous 87% 84% 83% 84% 85% 86% Change 1% 0% 0% 0% 0% 1%
A9. Mistakes have led to positive changes here. Most Recent 62% 63% 64% 66% 68% 71% Previous 62% 63% 65% 66% 68% 70% Change 0% 0% -1% 0% 0% 1%
A13. After we make changes to improve patient safety, we evaluate their effectiveness.
Most Recent 75% 70% 69% 71% 72% 74% Previous 73% 70% 69% 70% 71% 74% Change 2% 0% 0% 1% 1% 0%
Management Support for Patient Safety
F1. Hospital management provides a work climate that promotes patient safety.
Most Recent 88% 81% 79% 81% 82% 84% Previous 87% 80% 79% 81% 82% 84% Change 1% 1% 0% 0% 0% 0%
F8. The actions of hospital management show that patient safety is a top priority.
Most Recent 83% 75% 75% 76% 78% 81% Previous 81% 74% 74% 76% 77% 80% Change 2% 1% 1% 0% 1% 1%
F9R. Hospital management seems interested in patient safety only after an adverse event happens.
Most Recent 65% 58% 59% 61% 63% 68% Previous 64% 58% 59% 61% 64% 68% Change 1% 0% 0% 0% -1% 0%
Note: The item’s survey location is shown to the left. An “R” indicates a negatively worded item, where the percent positive response is based on those who responded “Strongly disagree” or “Disagree,” or “Never” or “Rarely” (depending on the response category used for the item).

128
Table D-14. Trending: Item-Level Average Percent Positive Response by Tenure in Current Work Area/Unit – 2018 Database Hospitals (Page 3 of 6)
Tenure in Current Work Area/Unit
Survey Items by Composite Database
Year Less Than
1 Year 1 to 5 Years
6 to 10 Years
11 to 15 Years
16 to 20 Years
21 Years or More
# Hospitals Both Years 268 275 271 254 242 239
# Respondents Most Recent 34,572 78,870 34,823 21,162 13,019 13,919
Previous 27,830 69,902 38,236 20,722 10,533 13,648
Feedback & Communication About Error
C1. We are given feedback about changes put into place based on event reports.
Most Recent 70% 61% 59% 60% 62% 64% Previous 69% 60% 60% 60% 61% 65% Change 1% 1% -1% 0% 1% -1%
C3. We are informed about errors that happen in this unit.
Most Recent 76% 70% 68% 69% 69% 69% Previous 75% 69% 67% 67% 70% 69% Change 1% 1% 1% 2% -1% 0%
C5. In this unit, we discuss ways to prevent errors from happening again.
Most Recent 82% 75% 75% 75% 77% 78% Previous 80% 74% 74% 75% 76% 77% Change 2% 1% 1% 0% 1% 1%
Frequency of Events Reported
D1. When a mistake is made, but is caught and corrected before affecting the patient, how often is this reported?
Most Recent 67% 62% 62% 63% 63% 64% Previous 64% 60% 61% 62% 62% 62% Change 3% 2% 1% 1% 1% 2%
D2. When a mistake is made, but has no potential to harm the patient, how often is this reported?
Most Recent 66% 62% 62% 64% 64% 64% Previous 64% 62% 62% 63% 64% 64% Change 2% 0% 0% 1% 0% 0%
D3. When a mistake is made that could harm the patient, but does not, how often is this reported?
Most Recent 78% 75% 74% 76% 77% 78% Previous 76% 74% 75% 75% 77% 78% Change 2% 1% -1% 1% 0% 0%
Note: The item’s survey location is shown to the left. An “R” indicates a negatively worded item, where the percent positive response is based on those who responded “Strongly disagree” or “Disagree,” or “Never” or “Rarely” (depending on the response category used for the item).

129
Table D-14. Trending: Item-Level Average Percent Positive Response by Tenure in Current Work Area/Unit – 2018 Database Hospitals (Page 4 of 6)
Tenure in Current Work Area/Unit
Survey Items by Composite Database
Year Less Than
1 Year 1 to 5 Years
6 to 10 Years
11 to 15 Years
16 to 20 Years
21 Years or More
# Hospitals Both Years 268 275 271 254 242 239
# Respondents Most Recent 34,572 78,870 34,823 21,162 13,019 13,919
Previous 27,830 69,902 38,236 20,722 10,533 13,648
Overall Perceptions of Patient Safety
A10R. It is just by chance that more serious mistakes don’t happen around here.
Most Recent 65% 62% 62% 62% 64% 66% Previous 65% 61% 60% 62% 62% 65% Change 0% 1% 2% 0% 2% 1%
A15. Patient safety is never sacrificed to get more work done.
Most Recent 70% 63% 62% 64% 65% 67% Previous 70% 62% 62% 64% 64% 67% Change 0% 1% 0% 0% 1% 0%
A17R. We have patient safety problems in this unit. Most Recent 70% 64% 64% 65% 66% 68% Previous 69% 64% 63% 65% 66% 67% Change 1% 0% 1% 0% 0% 1%
A18. Our procedures and systems are good at preventing errors from happening.
Most Recent 77% 73% 73% 75% 76% 79% Previous 77% 72% 73% 75% 76% 78% Change 0% 1% 0% 0% 0% 1%
Communication Openness
C2. Staff will freely speak up if they see something that may negatively affect patient care.
Most Recent 82% 77% 77% 79% 80% 81% Previous 82% 76% 77% 78% 79% 82% Change 0% 1% 0% 1% 1% -1%
C4. Staff feel free to question the decisions or actions of those with more authority.
Most Recent 54% 48% 49% 51% 52% 54% Previous 53% 47% 48% 50% 53% 54% Change 1% 1% 1% 1% -1% 0%
C6R. Staff are afraid to ask questions when something does not seem right.
Most Recent 76% 68% 66% 67% 68% 69% Previous 74% 65% 63% 64% 65% 67% Change 2% 3% 3% 3% 3% 2%
Note: The item’s survey location is shown to the left. An “R” indicates a negatively worded item, where the percent positive response is based on those who responded “Strongly disagree” or “Disagree,” or “Never” or “Rarely” (depending on the response category used for the item).

130
Table D-14. Trending: Item-Level Average Percent Positive Response by Tenure in Current Work Area/Unit – 2018 Database Hospitals (Page 5 of 6)
Tenure in Current Work Area/Unit
Survey Items by Composite Database
Year Less Than
1 Year 1 to 5 Years
6 to 10 Years
11 to 15 Years
16 to 20 Years
21 Years or More
# Hospitals Both Years 268 275 271 254 242 239
# Respondents Most Recent 34,572 78,870 34,823 21,162 13,019 13,919
Previous 27,830 69,902 38,236 20,722 10,533 13,648
Teamwork Across Units
F2R. Hospital units do not coordinate well with each other. Most Recent 56% 46% 48% 50% 52% 54% Previous 54% 46% 46% 49% 50% 53% Change 2% 0% 2% 1% 2% 1%
F4. There is good cooperation among hospital units that need to work together.
Most Recent 68% 60% 60% 63% 64% 67% Previous 67% 59% 60% 63% 63% 67% Change 1% 1% 0% 0% 1% 0%
F6R. It is often unpleasant to work with staff from other hospital units.
Most Recent 68% 62% 61% 62% 64% 67% Previous 68% 62% 60% 62% 63% 66% Change 0% 0% 1% 0% 1% 1%
F10. Hospital units work well together to provide the best care for patients.
Most Recent 78% 70% 71% 72% 73% 76% Previous 77% 69% 69% 71% 72% 75% Change 1% 1% 2% 1% 1% 1%
Staffing
A2. We have enough staff to handle the workload. Most Recent 57% 49% 51% 53% 53% 54% Previous 57% 48% 50% 52% 53% 54% Change 0% 1% 1% 1% 0% 0%
A5R. Staff in this unit work longer hours than is best for patient care.
Most Recent 48% 48% 50% 50% 51% 52% Previous 49% 49% 51% 52% 53% 52% Change -1% -1% -1% -2% -2% 0%
A7R. We use more agency/temporary staff than is best for patient care.
Most Recent 61% 64% 66% 67% 66% 68% Previous 63% 65% 68% 68% 69% 68% Change -2% -1% -2% -1% -3% 0%
A14R. We work in “crisis mode,” trying to do too much, too quickly.
Most Recent 56% 50% 48% 49% 50% 50% Previous 55% 48% 47% 48% 49% 49% Change 1% 2% 1% 1% 1% 1%
Note: The item’s survey location is shown to the left. An “R” indicates a negatively worded item, where the percent positive response is based on those who responded “Strongly disagree” or “Disagree,” or “Never” or “Rarely” (depending on the response category used for the item).

131
Table D-14. Trending: Item-Level Average Percent Positive Response by Tenure in Current Work Area/Unit – 2018 Database Hospitals (Page 6 of 6)
Tenure in Current Work Area/Unit
Survey Items by Composite Database
Year Less Than
1 Year 1 to 5 Years
6 to 10 Years
11 to 15 Years
16 to 20 Years
21 Years or More
# Hospitals Both Years 268 275 271 254 242 239
# Respondents Most Recent 34,572 78,870 34,823 21,162 13,019 13,919
Previous 27,830 69,902 38,236 20,722 10,533 13,648
Handoffs & Transitions
F3R. Things “fall between the cracks” when transferring patients from one unit to another.
Most Recent 49% 41% 40% 42% 42% 43% Previous 48% 40% 40% 42% 41% 42% Change 1% 1% 0% 0% 1% 1%
F5R. Important patient care information is often lost during shift changes.
Most Recent 61% 54% 51% 51% 54% 54% Previous 60% 53% 50% 52% 52% 53% Change 1% 1% 1% -1% 2% 1%
F7R. Problems often occur in the exchange of information across hospital units.
Most Recent 52% 46% 45% 46% 47% 48% Previous 52% 45% 44% 46% 45% 48% Change 0% 1% 1% 0% 2% 0%
F11R. Shift changes are problematic for patients in this hospital.
Most Recent 55% 47% 45% 46% 47% 49% Previous 54% 47% 45% 46% 46% 47% Change 1% 0% 0% 0% 1% 2%
Nonpunitive Response to Error
A8R. Staff feel like their mistakes are held against them. Most Recent 55% 53% 53% 54% 54% 56% Previous 54% 51% 50% 50% 52% 54% Change 1% 2% 3% 4% 2% 2%
A12R. When an event is reported, it feels like the person is being written up, not the problem.
Most Recent 48% 50% 52% 52% 54% 56% Previous 47% 48% 49% 50% 52% 53% Change 1% 2% 3% 2% 2% 3%
A16R. Staff worry that mistakes they make are kept in their personnel file.
Most Recent 40% 40% 40% 39% 39% 40% Previous 38% 37% 36% 35% 37% 36% Change 2% 3% 4% 4% 2% 4%
Note: The item’s survey location is shown to the left. An “R” indicates a negatively worded item, where the percent positive response is based on those who responded “Strongly disagree” or “Disagree,” or “Never” or “Rarely” (depending on the response category used for the item).

132
Table D-15. Trending: Average Percentage of Respondents Giving Their Work Area/Unit a Patient Safety Grade by Tenure in Current Work Area/Unit – 2018 Database Hospitals
Tenure in Current Work Area/Unit
Work Area/Unit Patient Safety Grade Database
Year
Less Than
1 Year 1 to 5 Years
6 to 10 Years
11 to 15 Years
16 to 20 Years
21 Years or More
# Hospitals Both Years 268 275 271 254 242 239
# Respondents Most Recent 34,572 78,870 34,823 21,162 13,019 13,919
Previous 27,830 69,902 38,236 20,722 10,533 13,648
Excellent or Very Good Most Recent 84% 76% 76% 77% 79% 80%
Previous 82% 74% 74% 76% 77% 79%
Change 2% 2% 2% 1% 2% 1%
A = Excellent Most Recent 42% 34% 34% 35% 36% 37%
Previous 39% 32% 32% 33% 34% 35%
Change 3% 2% 2% 2% 2% 2%
B = Very Good Most Recent 42% 43% 42% 42% 43% 43%
Previous 42% 42% 42% 43% 43% 44%
Change 0% 1% 0% -1% 0% -1%
C = Acceptable Most Recent 14% 19% 19% 18% 17% 16%
Previous 15% 20% 20% 18% 19% 17%
Change -1% -1% -1% 0% -2% -1%
D = Poor Most Recent 2% 4% 4% 4% 3% 3%
Previous 3% 5% 5% 5% 4% 3%
Change -1% -1% -1% -1% -1% 0%
E = Failing Most Recent 0% 1% 1% 1% 1% 1%
Previous 1% 1% 1% 1% 1% 1%
Change -1% 0% 0% 0% 0% 0%
Note: Percentages may not add to 100 due to rounding. Excellent and Very Good may not add to the subtotal for Excellent or Very Good due to rounding.

133
Table D-16. Trending: Average Percentage of Respondents Reporting Events in the Past 12 Months by Tenure in Current Work Area/Unit – 2018 Database Hospitals
Tenure in Current Work Area/Unit
Number of Events Reported by Respondents Database
Year Less Than
1 Year 1 to 5 Years
6 to 10 Years
11 to 15 Years
16 to 20 Years
21 Years or More
# Hospitals Both Years 268 275 271 254 242 239
# Respondents Most Recent 34,572 78,870 34,823 21,162 13,019 13,919
Previous 27,830 69,902 38,236 20,722 10,533 13,648
1 or More Events Most Recent 31% 48% 50% 49% 47% 49%
Previous 31% 46% 48% 47% 47% 47%
Change 0% 2% 2% 2% 0% 2%
None Most Recent 69% 52% 50% 51% 53% 51% Previous 69% 54% 52% 53% 53% 53%
Change 0% -2% -2% -2% 0% -2%
1 to 2 Most Recent 21% 28% 26% 27% 25% 26%
Previous 21% 28% 27% 27% 26% 27%
Change 0% 0% -1% 0% -1% -1%
3 to 5 Most Recent 7% 13% 15% 13% 13% 13%
Previous 7% 12% 12% 13% 12% 12%
Change 0% 1% 3% 0% 1% 1%
6 to 10 Most Recent 2% 4% 6% 5% 5% 5%
Previous 2% 4% 5% 5% 5% 5%
Change 0% 0% 1% 0% 0% 0%
11 to 20 Most Recent 1% 2% 2% 3% 2% 2%
Previous 1% 1% 2% 2% 2% 2%
Change 0% 1% 0% 1% 0% 0%
21 or More Most Recent 0% 1% 1% 1% 1% 2%
Previous 0% 1% 1% 1% 1% 2%
Change 0% 0% 0% 0% 0% 0%
Note: Percentages may not add to 100 due to rounding. Percentages for number of events may not add to the subtotal for 1 or more events due to rounding.
Related Documents