CHAPTER 5 HOSPITAL CARE FOR PERSONS WITH AIDS IN THE EUROPEAN UNION M.J. Postma K. Tolley R.M. Leidl A.M. Downs E.J. Beck A. Tramarin Y.A. Flori M. Santin F. Antonanzas H. Kornarou V.C. Paparizos M.G. Dijkgraaf J. Borleffs A.J. Luijben J.C. Jager Published in Health Policy (1997) 41:157-76

Welcome message from author
This document is posted to help you gain knowledge. Please leave a comment to let me know what you think about it! Share it to your friends and learn new things together.
Transcript

CHAPTER 5
HOSPITAL CARE FOR PERSONS WITH AIDS IN THEEUROPEAN UNION
M.J. PostmaK. TolleyR.M. LeidlA.M. DownsE.J. BeckA. TramarinY.A. FloriM. SantinF. AntonanzasH. KornarouV.C. PaparizosM.G. DijkgraafJ. BorleffsA.J. LuijbenJ.C. Jager
Published in Health Policy (1997) 41:157-76


113
Abstract
This study estimates the current and future hospital resources for AIDSpatients in the European Union (EU), using multinational scenario analysis(EU concerted Action BMH1-CT-941723). In collaboration with anotherEU-project (“Managing the Costs of HIV Infection”), six national Europeanstudies on the utilization of hospital care for AIDS have been selected toprovide the data for our analysis. The selection criteria involve recentness,quality, comparability, accessibility and representativeness. Baselinehospital resource utilization is estimated for hospital inpatient days andoutpatient contacts, using a standardized approach controlling for twoseverity stages of AIDS (chronic stage and late stage). The epidemiologicalpart of the study is based on standard models for back calculating HIVincidence and projecting AIDS incidence, prevalence and mortality. In thenext step, baseline resource utilization is linked to epidemiologicalinformation in a mixed prevalence and mortality-based approach. Severalscenarios render different future epidemiological developments and hospitalresource needs. For the year 1999, hospital bed needs of 10 000-12 700 inthe EU are indicated, representing an increase of 20-60% compared to theestimated current (1995) level. The projected range for 1999 corresponds toa maximum of 0.65% of all hospital beds available in the EU. The growth inthe number of outpatient hospital contacts is projected to possibly exceedthat of inpatient days up to 1.82 million in 1999. Our methodologyillustrates that estimation of current and future hospital care for AIDS has tobe controlled for severity stages, to prevent biases. Further application of themultinational approach is demonstrated through a “what-if” analysis of thepotential impact of combination triple therapy for HIV/AIDS. Estimation ofthe economic impact of other diseases could as well benefit from theseverity-stages approach.
Introduction
Several studies in the European Union (EU) have produced projections ofthe future costs of HIV/AIDS [1-6]. To date, such economic impactestimation has been limited to the level of an individual region or country.Only one study has attempted to go beyond the national level by developingseveral scenarios of the future bed needs and hospital costs for the EU as awhole [7]. Recently, an EU Concerted Action was initiated for thedevelopment of multinational scenarios to estimate the epidemiological andsocio-economic impacts of AIDS [8,9]. In this paper we report on the impacts

114
of AIDS on the hospital care systems. Estimation of this impact at themultinational level must be based on a standardized approach towardsanalysing available national information on health care resource utilizationand costs, as has been developed in a parallel EU-project [10-12]. In addition,standardized surveillance and modelling of the national HIV/AIDSepidemics is needed, since the expected number of AIDS cases is thestarting point of any estimation of the national burden on health careresources [13,14].
Scenario analysis provides techniques for estimating disease impact underuncertain future conditions in terms of epidemiology, prevention, medicaltreatment and health care technology. It involves the definition of a genericset of future projections, representing different “what-if” scenarios whichare compared to a specifically defined baseline including the referencescenario [15]. Our previous analysis [7] suggested that hospital bed needs ofpersons with AIDS (PWAs) in 1995 would range from 5000 to 10 000 forthe EU as a whole, based on reported average intensities of care in the fewEuropean studies on hospital resource utilization that were available at thattime. It was impossible to specify the care intensities according to patientcharacteristics, such as severity level of AIDS. Since this time, more datahave become available and further progress has been made in themethodology of multinational scenarios through the EU Concerted Action.In the present paper, we report on methodological improvements in thescenarios on hospital care and present updated multinational scenarioresults. In particular, we are now able to apply an approach that allows thespecification of relevant stages of disease severity. The choice for an actualseverity staging is related to differences in health care utilization within theAIDS stage, between the AIDS stage and pre-AIDS stages and to effects ofrecently introduced new therapies to HIV/AIDS (for example combinationtriple therapy).
In the next paragraph we focus a standardized approach for comparing datafrom international databases resource on hospital resource utilization ofPWAs, accounting for stages of disease severity. Furthermore, theincorporation of severity stages in the projection/scenario methodology isdescribed. In the Section 3 a baseline set of scenarios is presented forhospital bed needs and outpatient hospital facilities until 1999 for the EU,using a standardized model for the past, current and future development ofnational HIV/AIDS epidemics. Finally, a “what-if” analysis of the potentialimpact of combination triple therapy is presented and an application of our
115
approach to other diseases is discussed. In general, this study can benefit theplanning of hospital care facilities for PWAs in the next years at the EU-level .
Data and methods
Backcalculation and epidemiological information
In the framework of a previous [16,17] and the current EU-Concerted Actionan empirical backcalculation methodology has been developed and appliedas a standard approach for epidemiological estimations in all Europeancountries [18,19]. Our latest application [20] was based on AIDS surveillancedata as of 31 March 1994 according to the 1987 AIDS surveillance casedefinition [21,22]. A staged model is used for disease progression [23] thattakes into account under-reporting, delays in reporting [24] and possibleeffects of pre-AIDS treatments [25]. Work to improve and update theepidemiological model is still ongoing in the Concerted Action. Thereforethe estimates used in this paper should be considered as preliminary.
For each individual EU member state, the output of the epidemiologicalmodel comprises estimated (1978-1993) and projected (1994-1999) annualadult transmission-group-specific incidence of HIV and AIDS1. In thesecalculations, two assumptions for the post-1993 HIV incidence were used topredict post-1993 AIDS incidence. In one, annual HIV incidence is constantfrom 1994 onwards at the estimated average 1990-1993 level. In the secondno new infections occur after 1993, and thus provides an estimation of theunavoidable future AIDS epidemic given the prevailing treatment standards.Linking both assumptions with hospital care given rise to respectively thereference scenario (R) and the unavoidable scenario (R). In the presentanalysis, prevalence and mortality of PWAs have been estimated from anassumed exponential survival distribution in the AIDS stage with a mean of2 years for PWAs diagnosed in 1987 or later, and 1 year for those diagnosedearlier [7]. In view of ongoing developments in AIDS therapies and relatedsurvival improvements [26,27], we investigate a third scenario labelledtherapy scenario (T). This scenario indicates the impact on prevalence andhospital care of prolonging survival to a mean of 3 years. 1 Because of small numbers the method was not applied to Luxembourg. In the presentanalysis we do not consider Luxembourg since the contribution to EU-totals on incidence,prevalence and health care needs can be neglected. The three countries who joined th EU in1995 (Austria, Finland and Sweden) are not included.

116
Information on hospital care in the EU: study selection
Several reviews summarize studies on the impact of AIDS on Europeanhealth care systems [28-31]. In addition, several new studies in this field havereported results in the last 3 years. In total 22 studies have reported resultsfor hospital care utilization: one for Belgium [32], France [33] and Portugal[34], two for Germany [35,36] and Spain [1, 37], three for Greece [38-40], Italy [41-
43] and four for The Netherlands [2,44,45] and the UK [46-49]. Of the studies50% refer to the 1980s, the rest include 1990 or later. In general, sizes anddistributions of the patient populations in these studies do not yet allow theassessment of differences between transmission groups. Inclusion of studiesin this list is based on minimum technical standards on quality andcomparability, related to the sample size, registration period and reporting(for example of disease stage) [11].
For the present purpose of linking epidemiology and health care in futurescenarios a further selection of studies was necessary. Three criteria wereadopted. Firstly, information should be recent (1900 or later) reflectingcurrent efficiency of practices in hospital care. During the 1980s and intothe 1990s, efficiency has changed due to increasing experience withmanaging PWAs [50,51]. Furthermore, resource utilization has beencontrolled by more effective use; for example the substitution of lessexpensive outpatient care for hospital inpatient care [52]. Secondly, selectedstudies should include data that can be assumed to be representative of thenational situations. We consider the representativeness of study estimates tobe safeguarded in multicenter studies. Thirdly, the resource utilization dataof selected studies should be patient-based, enabling resource utilization tobe linked to individual patients, patient groups and disease stages, such asHIV infection and specific opportunistic illnesses. The studies satisfyingmost of these criteria are summarized in Table 1 [53-61].
Country andreference source Period Hospitals PWAs PYCS PYLS
France[54,55] 1992-1993 9 1384 922 237
Greece[39,55-57] 1990-1991a 2 101 86 36
Italy[43,58] 1994 10 264 104 40

117
The Netherlands[2,59] 1991-1992 4 182 145 39
Spain[60] 1990-1993 1 97 30 21
UK[47,61] 1990-1991 1 122 67 25
a In the Greek study some pre-1990 registration could not be excluded.
Table 1. Selected studies on hospital resource utilization for scenarioanalysis. The table includes the estimation period, number of hospitalinvolved, number of person with AIDS (PWAs), number of person-year inthe late stage (PYCS ) and number of person-year in the late stage (PYLS )
The severity-staging concept
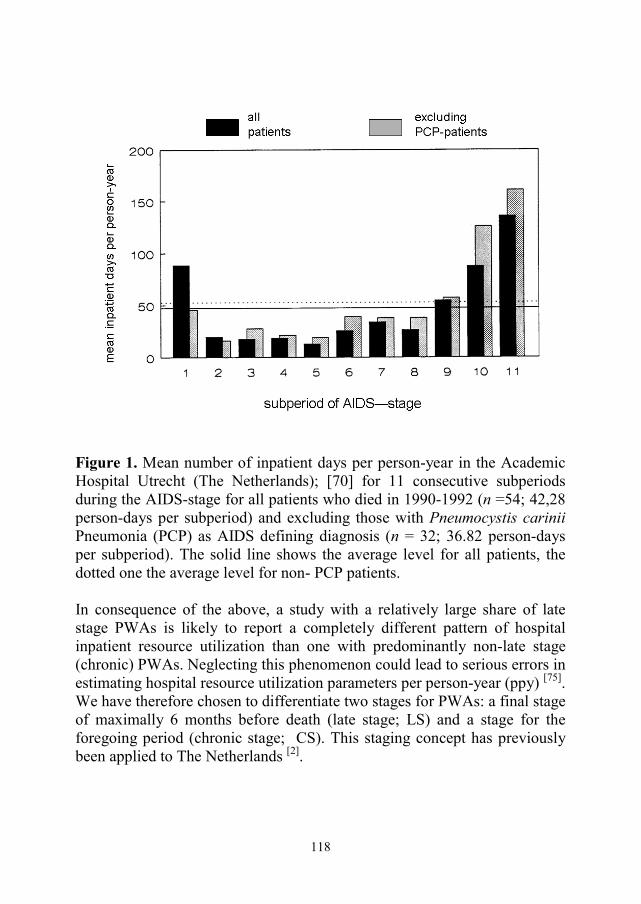
Several studies have indicated the importance of severity of illness forresource utilization of PWAs [62-67]. In some studies a U-shaped relationshipbetween AIDS-related resource utilization and disease progression has beenhypothesized [68-70]: high resource utilization immediately following theAIDS diagnosis and during the late terminal stage and low resourceutilization during the intermediate period. This pattern describes thedevelopment of economically defined severity levels. Fig. 1 presentsinformation for hospital inpatient days using data from one Dutch study [70].Clearly, the rise in resource utilization intensity is more pronounced for thelate phase and extends over several subperiods, whereas the rise in intensityafter AIDS diagnosis seems to exist only in the first subperiod. Furtheranalysis excluding PWAs with Pneumocystis carinii pneumonia (PCP) asAIDS-defining diagnosis, demonstrated intensities of hospital inpatient daysutilization below the average level in both the period following the onset ofthe disease and the intermediate phase (Fig. 1). The availability of PCPprophylaxis in recent years supposedly contributed to “a shift in inpatientdays utilization from the time near date of diagnosis toward the time ofdeath” [71]. Compared to other periods, almost 4-fold hospital inpatientresource utilization or costs during the last 6 months of life is reported forThe Netherlands and the USA in the early 1990s [2,72-74].
118
Figure 1. Mean number of inpatient days per person-year in the AcademicHospital Utrecht (The Netherlands); [70] for 11 consecutive subperiodsduring the AIDS-stage for all patients who died in 1990-1992 (n =54; 42,28person-days per subperiod) and excluding those with Pneumocystis cariniiPneumonia (PCP) as AIDS defining diagnosis (n = 32; 36.82 person-daysper subperiod). The solid line shows the average level for all patients, thedotted one the average level for non- PCP patients.
In consequence of the above, a study with a relatively large share of latestage PWAs is likely to report a completely different pattern of hospitalinpatient resource utilization than one with predominantly non-late stage(chronic) PWAs. Neglecting this phenomenon could lead to serious errors inestimating hospital resource utilization parameters per person-year (ppy) [75].We have therefore chosen to differentiate two stages for PWAs: a final stageof maximally 6 months before death (late stage; LS) and a stage for theforegoing period (chronic stage; CS). This staging concept has previouslybeen applied to The Netherlands [2].

119
The severity-mix modelling approach
Standardized data on person-years, inpatient days and outpatient contacts(out-patient visits or day-care treatments) were collected from the selectedstudies, in order to estimate resource utilization ppy in CS and LS. Person-years and resource utilization were attributed to LS if they occurred duringthe final 6 months of AIDS preceding death2 and were attributed to CS, ifthey occurred before the final 6 months preceding death (for deceasedpatients) or before the last 6 months of their registration (for patients aliveby the end of the registration or follow-up period). The last column in Table1 shows person-years in CS and LS in the selected studies. In the next stepepidemiological information was linked with ppy hospital resource needs ofPWAs. Estimated ppy hospital resource utilization was used as anapproximate for resource needs, implicitly assuming that recorded resourceutilization reflects actual care needs. The approach adopted for linking was amixed prevalence and mortality-based approach.
Annual resource needs for CS were estimated by multiplying the annualperiod-prevalence in CS by the appropriate ppy resource-need for CS3.Annual resource needs for LS were estimated by multiplying annualmortality by the duration of stay in LS (6 months or less) by the appropriateppy resource-need parameters4. It was assumed that ppy resource need
2 If the period between AIDS diagnosis – or the start of the registration – and death was lessthan half a year, the whole period was attributed to LS.3 Period prevalence of PWAs was measured in terms of person-years. For simplicity, wemodelled the AIDS incidence to occur halfway the year. The formula for the number ofperson- year in CS in year t is:
PYCS (t) = (P(t) – I(t) * P[S > 0.5]) * 1.0 + I(t) * P[S > 1.0] * 0.5+ I(t) * P[0.5 < S < 1.0] * E[S –0.5 | 0.5 < S < 1.0]
Where P(t) is the end- of-the- year prevalence; I(t) the incidence in year t; P[S >0.5] is theprobability of a PWA surviving longer than half year after AIDS diagnosis; P[S > 1.0] isthe probability of a PWA surviving longer than one year after AIDS diagnosis; P[0.5 < S <0.1] the expected survival in CS of PWAs surviving between a half and one year (slightlyless than 0.25 years due to the characteristics of the exponential distribution). The factors1.0 and 0.5 represent the duration of stay in CS of respectively the non-incident and theincident part of end-of-the-year prevalence.4 The formula for the person-years in the late stage in year t is:
PYLS( t) = (M(t) – P[S < 0.5] * I(t)) * 0.5 + P[S < 0.5] * I(t) * E[S| S < 0.5]With M(t) mortality in year t; P[S < 0.5] reflects the probability of a PWA surviving lessthan half year after AIDS diagnosis and E[S| S < 0.5] the expected survival of PWAs dying

120
remains stable over calendar time in each stage so that the effect of changesin epidemiology can be isolated. Estimates are presented for the years 1990,1995 and 1999, using computer simulation and a spreadsheet. The year 1990was chosen as the baseline year since epidemiological estimates are reliableand the economic data used are centered around 1990 in the original studies.The year 1995was included to enable comparison with our previousestimates.
Generalization to the whole EU
Table 1 provides a partial picture of AIDS hospital resource utilizationpatterns in the EU. No adequate hospital resource utilization informationcould be selected for Ireland (no studies available), Belgium (most recentavailable study was from 1988), Denmark (most recent study was from1986) and Germany (most recent stydy available was from 1987) andPortugal (no patient-based and no information on ambulatory hospitalservices available). To generalize our results to the whole EU, we calculatedaverage ppy resource needs in CS and LS for each year in the countries ofTable 1, and applied these to the countries with missing information. Toindicate some of the sensitivity of the results with regard to this assumption,as an alternative we applied data of neighboring countries to the missingcountries (Dutch data for Germany and Denmark; French data for Belgium;Spanish data for Portugal; UK data for Ireland).
Results
Table 2 presents estimated hospital resource utilization per person-year forthe two severity stages of PWAs. Inpatient days ppy vary between 4(Greece; CS) and 160 (Spain; LS). Inpatient days ppy in the late stage areseveral times those in the chronic stage. In Greece relatively frequent use ismade of outpatient services for CS patients (one of the two Greek hospitalsspecializes in dermatology, involving a high intensity of outpatient caremanagement). In both Italy and Greece total hospital contacts ppy are rathersimilar for CS and LS6. France and Spain exhibit the opposite pattern of ahigh proportion of inpatient resource utilization (up to 93% for LS patientsin France). Furthermore, in these two countries and The Netherlands and the
within a half year after AIDS diagnosis. The latter duration is smaller than 0.25 year due tothe characteristics of the exponential distribution used. The factor 0.5 in the first part of theformula reflects the duration of stay in LS of PWAs surviving half a year or longer.

121
UK total hospital contacts ppy exhibit greater care intensity for LS than forCS. Total hospital contacts ppy in CS are around 70-80 for France, Greeceand Italy and around 35-45 for The Netherlands, Spain and UK. Estimatedppy outpatient contacts don’t provide an obvious pattern: lower for CS thanLS in Spain and the UK, similar in France and The Netherlands and higherfor CS than LS in Greece and Italy.
Country Stage IPD OPD THC
FranceCSLS
57.2143.4
12.711.0
69.9154.4
GreeceCSLS
4.344.1
75.633.8
79.977.9
Italy aCSLS
32.659.8
44.128.5
76.788.3
TheNetherlands
CSLS
23.579.7
21.022.9
44.5102.6
Spain bCSLS
22.6159.8
13.622.9
36.2182.7
UKCSLS
26.865.1
14.922.8
41.787.9
Table 2. Hospital resource utilization per person-year of AIDS by countryand patient group (chronic versus late; see text)
Reference source as in Table 1CS, chronic stage; LS, late stage; IPD, inpatient days; OPD, outpatient contacts; TOC, totalhospital contacts (inpatient days and outpatient contacts).a Due to the relatively short registration period of 7 months we did not discard the last 6months before registration closure of surviving patients, who have left only 1 months persurviving patient. Instead, we attributed all person-year and resource utilization of patientswith a relatively low life expectancy to LS, in particular of those diagnosed in the mostsevere Turner stage (estimated median survival: 7 months [63]. The Italian one is the onlyselected database that includes information on the Turner stage.b Since the registration is based on episodes of disease, the last 6 months had to beapproximately by taking the last or last few episodes.
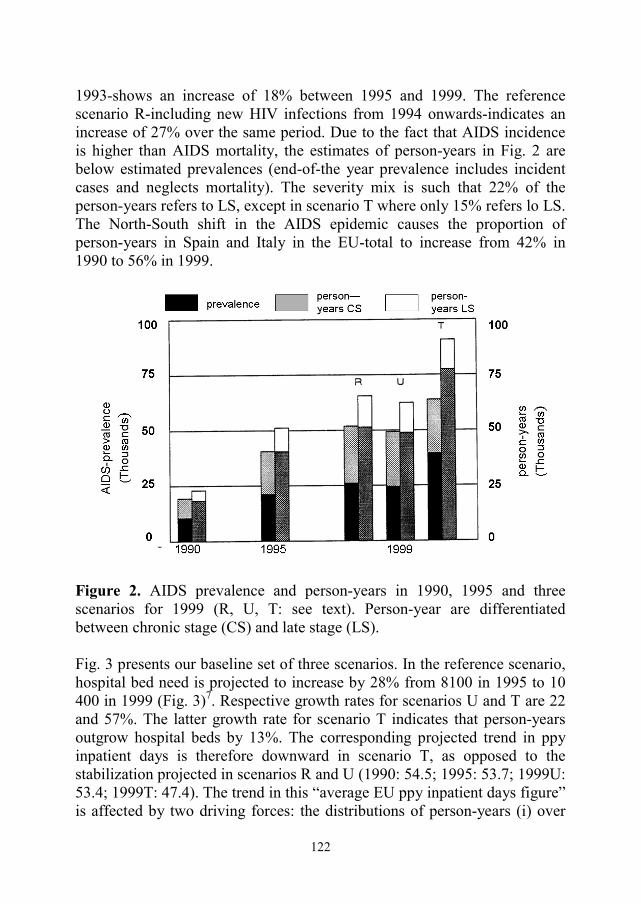
Fig. 2 presents some of the epidemiological results for the EU used as abasis for estimating total current hospital resources for PWAs and producingfuture resource needs scenarios. End-of-the-year prevalence is estimated tohave grown from 25 000 PWAs in 1990 to 49 000 in 1995. Projectionscorresponding to the three scenarios all demonstrate a higher prevalence inthe year 1999 (up to 86 000 PWAs for the therapy scenario T). Theprojection for the unavoidable scenario U-without new HIV infections since
122
1993-shows an increase of 18% between 1995 and 1999. The referencescenario R-including new HIV infections from 1994 onwards-indicates anincrease of 27% over the same period. Due to the fact that AIDS incidenceis higher than AIDS mortality, the estimates of person-years in Fig. 2 arebelow estimated prevalences (end-of-the year prevalence includes incidentcases and neglects mortality). The severity mix is such that 22% of theperson-years refers to LS, except in scenario T where only 15% refers lo LS.The North-South shift in the AIDS epidemic causes the proportion ofperson-years in Spain and Italy in the EU-total to increase from 42% in1990 to 56% in 1999.
Figure 2. AIDS prevalence and person-years in 1990, 1995 and threescenarios for 1999 (R, U, T: see text). Person-year are differentiatedbetween chronic stage (CS) and late stage (LS).
Fig. 3 presents our baseline set of three scenarios. In the reference scenario,hospital bed need is projected to increase by 28% from 8100 in 1995 to 10400 in 1999 (Fig. 3)7. Respective growth rates for scenarios U and T are 22and 57%. The latter growth rate for scenario T indicates that person-yearsoutgrow hospital beds by 13%. The corresponding projected trend in ppyinpatient days is therefore downward in scenario T, as opposed to thestabilization projected in scenarios R and U (1990: 54.5; 1995: 53.7; 1999U:53.4; 1999T: 47.4). The trend in this “average EU ppy inpatient days figure”is affected by two driving forces: the distributions of person-years (i) over

123
countries (geographical development) and (ii) over CS and LS (severity-mixdevelopment). The increasing relative importance of the Spanish and Italianepidemics in the EU causes a downward pressure on total EU ppy inpatientdays due to the relatively low ppy inpatient days for CS in Spain and LS inItaly. Reductions in overall ppy inpatient days for scenarios R and U can beexplained by the dominance of the geographical development. The severity-mix development dominates scenario T where the explicit assumption ofincreasing survival inflates the relative importance of CS with relatively lowppy inpatient days. Ppy inpatient days for CS and for LS are respectively34-37 and 118-119. Except for scenario T, there exits a tendency of agrowing contribution of LS to EU bed needs, towards 50% in 1999. Becausethe intensity of care in terms of nursing, specialist consultations and drugs isprobably higher for PWAs in LS, the average inpatient day in 1999 carries ahigher burden of care. As an important consequence, in two of the scenariosa higher average burden of care per inpatient day adds to the projectedgrowth in the number of inpatient days.
Figure3. Hospital bed needs (left axis) for AIDS in 1990, 1995 and threescenarios for 1999 (R, U and T: see text). Contributions to resource needsare differentiated in chronic stage (CS) and late stage (LS).

124
In the reference scenario, hospital outpatient contacts are projected toincrease by 28% from 990 000 in 1995 to 1.3 million in 1999 (Fig.3).Respective growth rates for scenarios U and T are 22 and 78%. For allscenarios, growth rates are identical to those for total person-years.Therefore, corresponding projected ppy outpatient contacts are stable overtime and between scenarios with a range from 20.9 in 1990 to 21.8 in lateryears. The increase from 1990 onwards can be explained by the increasingimportance of the Italian epidemic in the total EU-epidemic, with relativelyhigh ppy outpatient contacts in Italy. Ppy outpatient needs differ littlebetween CS and LS (respectively 22 versus 21). As for person-years,approximately 80% (85% in scenario T) of outpatient contacts areassociated with CS. In general, the share of outpatient contacts in totalhospital contacts is projected to increase slightly from 29% of 3.5 millioncontacts in 1995 to up to 31 % of 5.8 million contacts in scenario T in 1999.
Discussion and conclusions
The severity-mix approach
To make relevant comparisons and projections, resource utilization studieshave to be standardized with respect to the severity mix of the patientpopulation. Neglecting the severity mix would overestimate resourceutilization of the “average PWA” in a study with a relative high proportionof severe patients. As mentioned above, our severity-weighted EU-averagein 1990 for ppy inpatient days amounts to 54.5. Its unweighted counterpartwould be 62.6 ppy inpatient days that same year, illustrating the importanceto account for severity mix. Our operationalization of the severity concept inchronic and late stages (CS and LS) has been chosen in accordance withmajor European resource utilization studies and with the outcomes ofepidemiological modelling. The estimates demonstrate a significantly higherppy inpatient days utilization in LS than in CS. Our findings on therelatively high resource utilization in the late stage of AIDS resemble resultsof US-studies on health care resource utilization in the late stage of anydisease [76-79]. In 1961 it was assessed that hospitalisation costs of adultswho died in that year were 3-times those of survivors [80]. Lubitz andPrihoda [81] found that 5.9% of Medicare insured (primarily elderly) patientswho died in 1978 accounted for 27.8% of total Medicare expenditures. Ingeneral, ppy costs in the final year of life are 6.8-times those for patientswho were prevalent at the end of the year, ranging from 5.2 to 10.3 timesdepending on the underlying cause of death [82-84]. Hospital inpatient days
125
ppy exhibit a similar factor of 6.8 on average. Up to 80% of costs in thefinal year of life appear in the final 6 months of life (for example, in 1998ppy Medicare expenditures in the last 6 months of life were 11.1-times ppyexpenditures excluding relevant to other diseases as well. Furthermore, ourseverity staging can easily be extended to other diseases since it is relativelystraightforward, based on time-distance to the point of death.
Several studies have registered decreasing trends in ppy hospital inpatientdays [45,47,49]. We have shown that an important factor for explaining thesetrends is a shift in the severity-mix in factor of CS if survival increases.Extending our model backwards gives ppy inpatient days for the pre-1990period, for example, 1986 in Fig. 4. In 1986 the patient group with 1 yearaverage survival dominated and ppy inpatient days to an ongoing increase insurvival from 1 year in 1986, 2 years in 1995 to 3 years in 1999 in scenarioT. The country-specific results of our severity-staging model are in line withthe reported trends in the Netherlands and the UK [45,47,49]. Similarmechanisms can be assumed for other countries as well (for example,Spain).
Comparative analysis
To compare the scenarios in this paper with our previously publishedprojections [7], we substitute our current estimate of 54.5 ppy inpatient daysin the EU in 1990 into the previous methodology. This would haveproduced a bed need of 3700 in 1990 and projections for 1995 ranging from3800 to 5000. Our current estimates for those years are slightly higher for1990 (3900) and significantly higher for 1995 (8200). Our previousapproach to estimating person-years was based on the assumption that eachAIDS case prevalent at the end of the year accounts for the whole of therespective year. Our current approach involves specific estimates of person-years for incident patients, patients who were prevalent during the wholeyear and for mortality. In addition, the correction for under-reporting ofAIDS cases was undertaken for the current scenarios only, increasing theestimated prevalence by 18.5% for the whole EU in 1990 and 1995. Thesetwo factors together can explain the slight increase that we find for 1990.The major explanation for the significant difference in 1995 is a drasticchange in epidemiological projection, previously showing a decrease inAIDS incidence to a low level in 1994 and 1995. Based on more recentAIDS incidence data [20], our current estimate shows an increasing orlevelling AIDS incidence in the period 1990-1995, corresponding to a

126
current AIDS prevalence estimate for 1995 of 48 500. This is 66% higherthan the maximum estimate (29300) in [7]. Obviously, there are severalfactors causing underestimation of the future health care impact. The recent(1993) extension of the AIDS case definition to include pulmonarytuberculosis will increase the number of new AIDS cases. Furthermore, wedid not include resource needs for pre-AIDS stages, which might becomemore important if prophylactic treatment and preventing the onset of AIDSbecomes increasingly effective. Though the AIDS stage is certainly the mostresource demanding stage, further work should include multinationalresearch into resource needs of pre-AIDS stages.
In three scenarios hospital bed needs in 1999 are projected to increase by upto 57% compared to 1995. This corresponds to 0.40% in 1995 and up to0.65% in 1999 of all EU-beds currently available [85]. Even in scenario U,reflecting the unavoidable future burden of AIDS on hospital care in 1999, agrowth in hospital care needs of over 20% is indicated compared to 1995.Associated to survival improvements, the share of outpatient contacts intotal hospital contacts is projected to rise from 28 to 31% in scenario T. Thevalidity of such results is significantly extended by the severity-staging usedin this paper. Employment of this concept enables dynamic modelling ofimportant model parameters, such as ppy inpatient days. Time-distance tothe point of death has been used as the severity indicator. The relevance ofthis indicator for health care utilization and costs has long been recognizedin the analysis of patient-based data across all diseases [76-84]. It has beenused here to analyze the impacts of one specific disease on the health caresystems. The indicator can obviously only be measured ex-post, and cannotbe used to stage individual, living patients. In the scenario analysispresented, the ex-post measurement proved to be useful and feasible,because historical data on resource utilization developments preceding deathwere available for individual patients, and because future AIDS prevalencesand mortalities could be described by an epidemiological model.
Further application of the multinational AIDS-model
Our method involves the extrapolation of average results for France, Greece,Italy, The Netherlands, Spain and the UK to Belgium, Denmark, Germany,Ireland and Portugal. We could question the representativeness of ourselected countries for the rest of the EU. The share in total person-years ofthe six EU-countries included in the scenario analysis is 84% of the wholeEU in 1990, with an expected increase to 89% in 1999. The potential

127
impact on the whole EU of the countries for which we have no resourceutilization information is therefore only limited. For the “unknown” part ofthe EU, Germany constitutes 50-75% of the person-years of AIDS. As analternative we have evaluated the situation where ppy hospital resource needparameters in LS and CS are applied to neighboring countries. Generally,this lowers the resource needs by approximately 10% in 1990, 6% in 1995and 4% in 1999 for both hospital beds and outpatient contacts. The decreaseof this percentage in time supports the robustness of our EU scenariosbased from six countries. In two of these six countries we have used datafrom one hospital only to describe the national situation. As has been shownfor France [53] great differences between hospitals exits, implying that ourestimates for Spain and the UK might not be representative. Further researchis needed in these countries. Therefore, we should conceive the absolutelevel of our scenario results with great caution. Our baseline set of threescenarios projects the future course of hospital care needs based on the mostrecent analyses of survival patterns and standardized multinationalinformation on resource utilization. Recently, preliminary evaluations ofnew anti-retroviral combination triple therapy have given rise tospeculations on drastic improvements of survival and correspondingprolongation of the chronic stages of HIV/AIDS [86]. The actual effect onsurvival is as yet highly uncertain and the effectiveness will depend on otherfactors, such as the acceptance, availability, patient and doctor complianceand costs of the new therapy. In particular, the costs are considered to berelatively high-approximately 15 000 ECUs per year of combination tripletherapy. However, significant cuts in HIV/AIDS hospitalisations inconsequence of the new therapy have been suggested [87] and might impacton hospital resource needs for HIV/AIDS in the EU. This impact willinvolve structural effects due to increases in HIV/AIDS prevalence andtransient effects due to the sudden introduction of the new therapy. Inparticular, a transient drop in hospital resource needs might currently takeplace because of the delay in progression to the resource-intensive late stageof AIDS. A similar phenomenon was previously observed when pre-AIDSAZT-treatment was introduced in the early 1990s [88]. At the moment thestandardized information to estimate the full impact on resource utilizationpatterns and costs is lacking, in particular at the multinational EU-level. Asour scenario analytic design specifies the relevant parameters involved inthe impact of the new therapy, it does provide the setting for a “what-if”investigation into this impact on the short-term. Table 3 shows a range forthe change in hospital bed needs in 1999, assuming extensions ofHIV/AIDS survival due to combination triple therapy of 3 and 5 years. As a

128
first variant, ppy inpatient days estimates for the chronic AIDS stage (CS)are used for the years gained by the new therapy. As chronic-AIDS-stage’sfigures might not be representative here we have included lower levels ofppy inpatient days, in line with reported levels for pre-AIDS stages [11].Table 3 suggests that a larger number of patients will be alive and intreatment than the reference scenario indicates, bed needs vary betweenlevels of + 15 and – 35% of the reference scenario. Momentarily, theseindicative results are investigated in depth by using the French and UKdatabases [47,53]. As assessments of the cost-effectiveness of new therapies isbecoming more and more the vogue [89], our reference scenario is crucial inproviding the point of departure to measure the impact of the newcombination triple therapy.The scenarios on the health care impact of AIDS presented provideinformation that can be used to support health policy decisions in the fieldof AIDS. First, scenario results give an order of magnitude of future healthcare needs in terms of total hospital capacity planning, the multinationalEU-scenarios also provide background information for the further planningof EU AIDS research and prevention programs. At the national level andeven at lower levels, the scenarios provide an indication of the change inseverity-mix that can be expected within total hospital need for AIDSpatients, which under certain circumstances has been shown to varysignificantly and which can pose new management tasks. Internationalcomparison has further made clear that future analyses, either at the nationalor at lower levels, must account for severity-mix in order to avoid bias inany projections. Future research work could further refine the staging-mechanism in case of AIDS, and would certainly require to continue, extendand validate the national databases used. This paper has presented scenarioinformation for health policy making at the EU-level and at the nationallevels on the case of AIDS. It is also obvious that comparable informationon other diseases which are in the special focus of EU policy, such ascardiovascular diseases and cancer, is lagging behind as compared to theinformation now available for AIDS.

129
References
1. Rovira J, Leidl R. Projecting individual healthcare costs ofHIV/AIDS patients in Catalonia. In: Fitzsimons D, Hardy V, TolleyK, editors. The Economic and Social Impact of AIDS in Europe.London: Cassell, 1995:82-89.
2. Postma MJ, Jager JC, Dijkgraaf MGW, Borleffs JCC, Tolley K,Leidl R. AIDS scenarios for The Netherlands; the economic impacton hospitals. Health Policy 1995; 31:127-50.
3. Antonanzas F, Anton F, Juarez C, Tomas, C. Simulation models forthe costs of AIDS in Spain. In: RoviraJ, editor. Proc Xth Int Conf ofthe Applied Econometrics Association “The Econometrics ofAIDS”. University of Barcelona, Barcelona: 1993:51-52.
4. Kyriopoulos J, Georgoussi E, Gennimata D, Niakas D, Skoutelis G.AIDS cost in Greece: 1989-1993-macroeconomic approach andestimations. Health Rev 1992 ; 4:35-8.
5. Ministèredes Affaires Sociales de la Santè et de la Ville,Prospectives SIDA 2010; Le SIDA en France Etat des connaissancesen 1994 (AIDS in France: prospectives for 2010 and the state of ourKnowledge in 1994) (in French). Agence Nationale de Recherchessur le SIDA, Paris, 1994.
6. Milocchi F. Scenari Futuri dell’AIDS nel Veneto (Future Scenarioson AIDS for the Veneto Region) (in Italian). In: de Lalla F, editor.AIDS Prospettive Sociosanitarie ed Organizzazione dei Servizi.Rome: Arti Grafiche Jasillo, 1992:75-94.
7. Postma MJ, Leidl RM, Downs AM, Rovina J, Tolley K, GyldmarkM, Jager JC. Economic impact of the AIDS epidemic in theEuropean Community; towards multinational scenarios on hospitalcare and costs AIDS 1993; 7:541-53.
8. Jager JC, Achterberg PW, Postma MJ, Houweling H. Comparativeimpact assessment of AIDS: between doomsday and complacency[letter]. AIDS 1996; 10:238-40.
9. Jager JC, Postma MJ, Tolley K, Kennelly, J. assessment of theSocio-economic Impact of AIDS: from national towardsmultinational scenarios. In: Fitzsimons D, Hardy V, Tolley K,editors. The Economic and Social Impact of AIDS in Europe.London: Cassell, 1995: 40-53.
10. Tolley K, Gyldmark M. The treatment and care costs of people withHIV infection or AIDS: development of a standardised costframework for Europe. Health Policy 1993; 24:55-70.

130
11. Tolley K, Gyldmark M. A Standardised Costing Framework forHIV/AIDS Hospital Care in the European Union, The University ofNotthingham, Notthingham, 1995.
12. Tolley K, Gyldmark M. A Standardised framework for costing HIVand AIDS treatment and care in Europe. In: Fitzsimons D, Hardy V,Tolley K, editors. The Economic and Social Impact of AIDS inEurope. London: Cassell, 1995: 54-62.
13. Brookmeyer R, Liao J. Statistical modelling of the AIDS epidemicfor forecasting health care needs. Biometrics 1990; 46:1151-63.
14. Jager JC, Heisterkamp SH, Brookmeyer R. AIDS surveillance andprediction of the HIV and AIDS epidemic; methodologicaldevelopments. AIDS 1993; 7(Suppl.):S67-S71.
15. Jager JC, Van Den Boom FMLG. Scenario analysis, health policy,and decision making. In: Kaplan EH, Brandeau ML, editors.Modelling the AIDS Epidemic. New York: Raven Press, 1994: 237-252.
16. Jager JC, Ruitenberg EJ, editors. Statistical Analysis andMathematical Modelling of AIDS. Oxford: Oxford University Press,1988.
17. Jager JC, Ruitenberg EJ, editors. AIDS Impact Assessment:Modelling and Scenario Analysis. Amsterdam: Elsevier, 1992.
18. Downs AM. Heisterkamp SH, Brunet J-B, Hamers FF.Reconstruction and prediction of the HIV/AIDS epidemic amongadults in the European Union and in the low prevalence countries ofCentral and Eastern Europe. AIDS 1997; 11:649-662.
19. Heisterkamp SH, Downs AM, Ancelle-Park R, Brunet J-B, VanHouwelingen JC. Empirical Bayesian estimators for reconstructionof HIV incidence and prevalence and forecasting of AIDS; IIapplication to the European Community. In: Heisterkamp SH, editor(thesis). Quantitative Analysis of AIDS/HIV: Development ofMethods to Support Policy Making for Infectious Disease Control.Elinkwijk BV. The Netherlands: Utreach, 1995:99-125.
20. European Centre For the Epidemiological Monitoring of AIDS.Back-calculated Estimates of HIV Cumulative Incidence andPrevalence to 31 December and Predicted Annual Numbers of AIDSCases to 1998 among Adults and Adolescents, AIDS Surveillance inthe European Community and COST countries.Quarterly report,1994; 32.

131
21. Centers for Disease Control, Revision of the CDC surveillance casedefinition for acquired immunodeficiency syndrome. MMWR 1987;36 Suppl 1:S1-S15.
22. Centers for Disease Control, Acquired immunodeficiency syndrome(AIDS) 1987 revision of CDC/WHO case definition for AIDS.Weekly Epidemiol Rec 1988; 63:1-7.
23. Longini IM, Byers RH, Hessol NA, Tan WY. Estimating the stage-specific number of HIV infection using a Markov model and backcalculation. Stat Med 1992;11:831-43.
24. Heisterkamp SH; Jager JC, Ruitenberg EJ, van Druten JAM, DownsAM. Correcting reported AIDS incidence a statistical approach. StatMed 1989; 8:963-76.
25. Longini IM, Scott Clark W, Karon JM. Effect of routine use oftherapy in slowing down the clinical course of humanimmunodeficiency virus (HIV) infection in a population-basedcohort. AM J Epidemiol 1993; 137:1229-40.
26. Paltiel AD. The human and economic costs of AIDS therapies. Riskin Perspective 1995; 3:10-1.
27. Choo V. Combination superior to zidovudine in Delta trial. Lancet1995; 34:895.
28. Schwefel D, Leidl R, Rovira J, Drummond MF, editors. EconomicAspects of AIDS and HIV Infection. Berlin: Springer-Verlag, 1990.
29. Kyriopoulos J, Kornarou H, Gitona M, editors. AIDS Economics;Cost Analysis, Management and Prospective Financing. NationalSchool of Public Health, Athens:,1996.
30. Drummond MF, Davies LM, editors. AIDS; The Challenge ForEconomic Analysis. Birmingham: The University of Birmingham,1990.
31. Fitzsimons D, Hardy V, Tolley, K, editors. The Economic and SocialImpact of AIDS in Europe. London: Cassell Pubblishers, 1995.
32. Lambert J, Carrin G. The direct and indirect costs of AIDS inBelgium; a preliminary analysis. In: Schwefel D, Leidl R, Rovira J,Drummond MF, editors. Economic Aspects of AIDS and HIVInfection. Berlin: Springer-Verlag, 1990:151-159.
33. Flori YA, Bauchet E. Prospective SIDA 2010 ; projet de based’analyse (AIDS Prospectives for 2010 ; baseline analysis) (inFrench), Centre de Recherches en Economie de la Santè. INSERMUnitè 357, Paris, 1995.

132
34. Giraldes M, Cortes E. Simulation model of the cost of the treatmentof AIDS patients in Portugal by the year 2000. In: Rovira J, editor.Proc Int Conf Econometrics of AIDS. University of Barcelona,Barcelona, 1993.
35. Hanpft R, Reinecke F, Beske F. Comparing inpatient and outpatientcosts for HIV, LAS and AIDS; methodology, results andconsequences from a study in Germany. In: Schwefel D, Leidl R,Rovira J, Drummond, MF, editors. Economic Aspects of AIDS andHIV Infection. Berlin: Springer-Verlag, 1990:164-171.
36. Koock-Walewski A, Stille W. Was Kostet AIDS ? Eine Kosten-Leistungs-Analyse stationarer Falle (The Costs of AIDS; a cost-benefit analysis of stationary cases). Stuttgart: Schwer-Verlag, 1989.
37. Ginestal J. The regional cost of AIDS in Spain. In: Schwefel D,Leidl R, Drummond MF. Economic Aspects of AIDS and HIVInfection. Berlin: Springer-Verlag, 1990:195-202.
38. Hatzakis A, Trichopoulos D. methodological and practical issues inestimating the direct cost of HIV/AIDS ; Greece. In: DrummondMF, Davies LM, editors. AIDS: The Challenge for EconomicAnalysis, Birmingham: University of Birmingham, 1990.
39. Kyriopoulos J, Kornarou H, Gitona M, Paparizos V. Estimates ofHIV/AIDS healthcare expenditure in Greece: an analytic approachfor prospective financing. In: Fitzsimons D, Hardy V, Tolley K,editors. The Economic and Social Impact of AIDS in Europe.London: Cassell, 1995: 54-62.
40. Papaevangelou G, Kornarou H, Roumeliotou A, Yfantopoulos J.Estimates of HIV/AIDS health-care expenditure in Greece: ananlytic approach for prospective financing. In: Fitzsimons D, HardyV, Tolley K, editors. The Economic and Social Impact of AIDS inEurope. London: Cassell, 1995: 54-62.
41. Calleri G, Macor A, Belloro S, Caramello P, Dirindin N. CostoOspedaliero del Malato di AIDS (Hospital Costs of AIDS Patients)(in Italian). Epidemiologic Prevenzione 1989; 39:47-51.
42. Visco-Comandini V. Il Trattamento Ospedaliero di Pazienti Affettida AIDS; un’analisi economica (Hospital Treatment of AIDSPatients; an economic analysis) (in Italian). Economia Pubblica1992; 6:285-95.
43. Tramarin A, Malocchi F, Tolley K, Vaglia A, Marcolini F, ManfrinV, de Lalla F. An economic evaluation of home-care assistance forAIDS patients, a pilot study in a town in Northen Italy. AIDS 1992;6:1377-83.

133
44. Postma MJ, Dijkgraaf MGW, Borleffs JCC, Reinking DP, Van DenBoom FMLG, Jager JC. Omvang en Kosten van Ziekenhuiszorgvoor HIV-geinfecteerden; vergelijking en integratie van Nederlandsestudies voor scenario-analyse (Hopsital Resource Utilization by HIVInfected Persons and Corresponding Costs; comparing andintegrating Dutch studies for scenario analysis) (in Dutch).Tijdschrift voor Sociale Gezondheidszorg 1992; 3:189-96.
45. Dijkgraaf MGW, Luijben AHP, Jager JC, Schrijvers AJP, BorleffsJCC. Trends in hospital resource utilization by HIV-infectedpersons, January 1987-June 1990. Health Policy 1994; 27: 175-91.
46. Johnson AM, Adler MW, Crown JM. The acquired immunedeficiency syndrome and epidemic of infection with humanimmunodeficiency virus: costs of care and prevention in an innerLondon district. BMJ 1986; 293: 489-92.
47. Beck EJ, Kennelly J, Mckevitt C, Whitaker L, Wadsworth J, MillerDL, Easmon C, Pinching AJ, Harris JRW. Changing use of hospitalservices and costs at a London AIDS referral centre , 1983-1989.AIDS 1994;8:367-77.
48. Kennelly J, Tolley K, Ghani ACH, Sabin CA. Maynard AK, LeeCA. Hospital costs of treating haemophiliac patients infected withHIV. AIDS 1995; 9: 787-93.
49. Johnson AM, Shergold C, Hawkins A, Miller R, Adler MW. Patternsof hospital care for patients with HIV infection and AIDS. JEpidemiol Community Health 1993; 46: 232-7.
50. Bennett CL, Deneffe D. Does experience improve hospitalperformance in treating patients with AIDS? Health Policy 1993;24:35-43.
51. Kitahata MM, Koepsell TD, Deyo RA, Maxwell CL, Dodge WT,Wagner EH. Physicians experience with the acquiredimmunodeficiency syndrome as a factor in patients’ survival. NEJM1996; 334: 701-6.
52. Widman M, Light DW, Platt JJ. Barries to out-of-hospital care forAIDS patients. AIDS Care 1994; 1:59-67.
53. Flori YA, Kerkleau M, Le Vaillant M. Analyse de l ‘ hètèrogènèitèdes Praqtiques Mèdicales dans la Prise en Charge des MaladesInfectès par le VIH ; une mèthode centrèe sur le DM12 (Analysis ofHeterogeneity in Medical Practice of Resource Utilization of HIV-infected Patients ; a method centered around DM ! ») (in French).Centre de Recherches en Economie de la Santè, INSERM Unitè 357,Paris, 1994.
134
54. Direction des Hopitaux, Mission SIDA, Hospital and AIDS ; Keyfigures. Ministere de la Santè et de l’Action Humanitaire, Paris,1993.
55. Paparizos V. Study on the Economic Cost of Hospital care forPatients in Greece (Doctoral thesis), University of Athens, Athens,1992.
56. Kornarou H. Direct and In direct Costs of AIDS in Greece (Doctoralthesis), University of Athens, Athens; 1992.
57. Niakas D, Kyriopoulos J. Methodological Problems in costestimations of AIDS in Greece and a framework for costmeasurement. In Kyriopoulos J, Kornarou H, Gitona M, editors.AIDS Economics; Cost Analysis, Management and ProspectiveFinancing Athens: Exandas, 1996:113-131.
58. Tramarin A, Tolley K, Campostrini S, de Lalla F. Efficiency andrationality in the planning of health care for people with AIDS; anapplication of the balance of care approach. AIDS 1997; 11:809-816.
59. Dijkgraaf MGW. Utilization of Hospital Resources and the Costsrelated to HIV Infection (Doctoral thesis). The Netherlands: Utrecht,1995.
60. Rovira J, Lopez G, Roman A, Santin M, Badia X. Els Costos del’Assistencia Sanitaria als Malats Infectats per VIH i la SIDA ; unaaproximacio empirica (Health Care Costs of HIV and AIDSPatients ; an empirical approach). Salut Catalunya 1992; 6:139-44.
61. Beck EJ. The cost of hospital care for HIV infected patients; theimpact of changing survival pattens and use of services in London inthe 1980s. In: Fitzsimons D., Hardy V, Tolley K, editors. Theeconomic and social Impact of AIDS in Europe. London: Cassel,London, 1995:90-98.
62. Kelly JV, Ball JK, Turner BJ. Duration and costs of AIDShospitalisations in New York: variations by patients severity ofillness and hospital type. Med Care 1989; 12:1085-98.
63. Turner BJ, Markson LE, McKee L, Houchens R, Fanning T. TheAIDS-defining diagnosis and subsequent complications: a survival-based severity index. J Acquired Immune Defic Syndr 1991; 4:1059-71.
64. Tolley K, Ghani A, KennellyJ, Lee C, Tramarin AM, de Lalla F.Comparing the costs of HIV/AIDS treatment and care:examining therelationship between diagnostic stages and costs. In: Rovira J, editor.Proc Int Conf Econometrics of AIDS. University of Barcelona.Barcelona: December 1993.
135
65. De Graeve D, Nonneman W. Prospective financing of health care forAIDS patients and HIV.seropositivies in Belgium. In: KyriopoulosH, Gitona M, editors. AIDS Economics; Cost Analysis, Managementand Prospective Financing. Athens: Exandas, 1996:52-69.
66. Kyriopoulos JE. Presentation and appraisal of the severityclassification of AIDS patients for the implementation of aprospective financing system. In: Kriopoulos j; Kornarou H, GitonaM, editors. AIDS Economics; Cost Analysis, Management andPropsective Financing. Athens: Exandas, 1996:13-24.
67. Dijkgraaf MGW, Luijben AHP, Jager JC, Schrijvers AJP, BorleffsJCC. In-patients care for symptomatic, HIV-infected persons: alongitudinal study of hospitalisations, in-patient drug use, andrelated costs. AIDS Care 1995;7:321-36.
68. Pascal A. Conceptual issues in assessing the economic effects of theHIV epidemic. Health Policy 1989;11:105-13.
69. Kizer KW, Rodriquez J, McHolland GF. An Updated QuantitativeAnalysis of AIDS in California. Department of Health Services,Sacramento, 1987.
70. Dijkgraaf MGW, Luijben AHP, Postma MJ, Borleffs JCC,Schrijvers AJP, Jager JC. Lifetime hospitalisation profiles forsymptomatic HIV infected persons. Health Policy 1996; 35:13-32.
71. Quesenberry ChP, Fireman B, Hiatt RA, Selby JV. A survivalanalysis of hospitalisation among patients with acquiredimmunodeficiency syndrome. Am J Public Health 1989; 79:1643-7.
72. Hellinger FJ, Fleishman JA, Hsia DC. AIDS treatment costs duringthe last months of life: evidence from the ACSUS. Health Sery Res1994;29:569-81.
73. Fleishman JA, Mor V, Laliberte LL. Longitudinal patterns ofmedical service use and costs among people with AIDS. Health ServRes 1995;3:403-24.
74. Bennett CL, Lubeck DP, McShane DJ, Mathews JK, Lipil WH.Costs of terminal care for people with AIDS. AIDS Patient Care1995;2:7-9.
75. Scitovsky AA, Over M. AIDS; costs of care in the developed anddeveloping world. AIDS 1988;2 Suppl 1:s71-S81.
76. Scitovsky AA. “The high costs of dying”: what do the data show?.The Milbank Quarterly 1984;62:591-608.
77. Scitovsky AA. Medical Care in the Last 12 Months of Life; therelation between age, unctional status and medical care expenditures.The Milbank Quarterly 1988;66:640-60.

136
78. Ginzberg E. The high costs of dying. Inquiry 1980;17:293-5.79. Temkin-Greener H, Meiners MR, Petty EA, Szydlowski JS. The use
and cost of health services prior to death; a comparison of Medicare-only and Medicare-Medicaid elderly populations. The MilbankQuarterly 1992;4:679-701.
80. Sutton GF. Hospitalization in the last year of life. United States-1961. Vital and Health Statistics 1965;22:19-33.
81. Lubitz J, Prihoda R. The use and costs of Medicare services in thelast 2 years of life. Health Care Finance Rev 1984;5:117-31.
82. Riley G, Lubitz J, Prihoda R, Rabey E. The use and costs ofMedicare services by cause of death. Inquiry 1987; 24:233-44.
83. Riley G, Lubitz J. Longitudinal patterns in Medicare costs for cancerdecendents. In: Schefflet RM, Andrews NC, editors. Cancer Careand Cost; DRGs and Beyond, Health Administration PressPerspectives. Ann Arbor, 1989:89-106.
84. Lubitz JD, Riley GF. Trends in Medicare payments in the last yearof life. New Engl J Med 1993; 328:1092-6.
85. OECD. Health Care Systems in Transition. OECD, Paris, 1990.86. Balter M. New hope in HIV disease. Science 1996; 274:1988-9.87. Anonymous. Update: trends in AIDS Incidence. Deaths and
Prevalence-United States 1996. MMWR 1997; 46:165-173.88. Heisterkamp SH, de Haan BJ, Jager JC, van Druten JAM, Hendriks
JCM. Short-term and medium-term projections of the AIDS/HIVepidemic by a dybamic model with an application to the risk groupof homosexual men in Amsterdam. Stat Med 1992; 11:1425-41.
89. Russel LB, Gold MR, Siegel JE, Daniels N, Weinstein MC. The roleof cost-effectiveness analysis in health and medicine. JAMA1996;276:1172-7.
Related Documents