Exclusive to Healthcare. Dedicated to People. SM Copyright 2013, INTEGRATED Healthcare Strategies. All rights reserved. HOSPITAL AND HEALTH SYSTEM STRATEGY 101 PRESENTED BY: PETE MITCHELL, CONSULTANT July 2014

Welcome message from author
This document is posted to help you gain knowledge. Please leave a comment to let me know what you think about it! Share it to your friends and learn new things together.
Transcript

Exclusive to Healthcare. Dedicated to People. SM
Copyright 2013, INTEGRATED Healthcare Strategies. All rights reserved.
HOSPITAL AND HEALTH SYSTEM STRATEGY 101
PRESENTED BY:
PETE MITCHELL, CONSULTANT
July 2014

Exclusive to Healthcare. Dedicated to People. SM
Table of contents
• Hospital Characteristics
– Ownership
– Size
– Market Dynamics
– Scope of Services
– Level of Integration
– Governance
• Hospital Economics
– Example Income Statement Mechanics and Productivity Measures
– Revenue: DRG payments
– Revenue: Payer Mix
– Expenses
1

Exclusive to Healthcare. Dedicated to People. SM
HOSPITAL CHARACTERISTICS
2

Exclusive to Healthcare. Dedicated to People. SM
Hospital Overview – Ownership Type
1. For-Profit, investor owned (~ 20% of Hospitals)
– Example: Hospital Corporation of America is the largest for-profit system
– 160+ Hospitals
– 110+ freestanding surgery centers
– Trades on NYSE: HCA
2. Not-for-Profit (Private), privately owned organizations (~ 56%)
– Example: Hospital Sisters Health System
– 13 Hospitals
– Clinic and outpatient network
– Religious affiliation
3. Public – State or local government owned (~20%)
– Example: Hennepin County Medical Center
– One Hospital in downtown Minneapolis
– Network of clinics in Minneapolis and select suburbs
4. Public – Federally owned (~4%)
– Example: 23 regional VA health care systems
– Minnesota is part of “VA Midwest Health Care Network”
– Over 150 hospitals
– Over 1700 facilities
3
Potential Source: Hospital and system websites or AHA

Exclusive to Healthcare. Dedicated to People. SM
Hospital Overview – Size
1. Beds
– Beds are the most common measure of size. Large hospitals have 500+ beds. Many hospitals have less than 25 beds.
– Hospitals with less than 25 beds and located 35 miles from any other facility may be eligible for “critical access” status
– Many hospitals report “licensed” beds, which can be misleading (a hospital can be licensed for 500 beds but have a floor of 100 beds completed dormant).
– The actual bed count is “staffed” beds, which are actively managed beds.
2. Admissions/Discharges/Days
– A more accurate measure of “size” is annual discharges (note: always exclude normal newborns from calculations)
• Admissions are the number of patients checked in to the hospital
• Discharges are the number of patients released from the hospital
• Annual Days represent the number of patient days over the course of the year.
• Average Daily Census (ADC) is the annual patient days / 365
• Average Length of Stay (ALOS) is a common statistic reviewed by administration and benchmarked nationally by patient condition. It is calculated by Total Days / Total Discharges
3. Occupancy
– Occupancy can be a good indicator of a hospital’s financial health. The occupancy rate is calculated by the ADC / average number of staffed beds.
• Occupancy rates from 66% to 80% is typically the “sweet spot” for financial performance
• Occupancy rates < 66% are typically under utilized facilities and can be challenging for financial performance
• Occupancy rates in > 80% are typically over utilized facilities and can be challenging for financial performance
4
Potential Source: Hospital and system websites or AHA

Exclusive to Healthcare. Dedicated to People. SM
Hospital Overview – Market Dynamics
(Developed Markets)
1. Drive Times / Primary Service Areas
2. Demographics
3. Competition
4. Market Share
5. Outmigration
5

Exclusive to Healthcare. Dedicated to People. SM
Market Dynamics - Drive times zones are established to
understand and segment the geographic market and
identify competitor proximity
Dignity Health
IASIS Healthcare
Mayo
Abrazo Health Care
Banner Health
All other (sub-acute & post-acute
excluded)
Health System Profiles
Note: 15 minute drive time zone represents 15 minutes from at least one JCL or SHC hospital. 30 minute drive time zones represent 16 - 30 minutes from at least one JCL or SHC hospital.
6
Source: Mapquest

Exclusive to Healthcare. Dedicated to People. SM
Market Dynamics - Population
2013 P
op
ula
tio
n b
y Z
ip C
od
e
2013 Population by Zone
2013 Population by Age Cohort
0%
10%
20%
30%
40%
50%
60%
70%
80%
90%
100%
85+
75-84
65-74
45-64
18-44
0-17
1,570,226
100,158 83,609
874,363 975,602
-
400,000
800,000
1,200,000
1,600,000
2,000,000
Po
pu
lati
on
Source: Claritas and Mapquest
7

Exclusive to Healthcare. Dedicated to People. SM
Market Dynamics – HH Income
2013 M
ed
ian
Ho
useh
old
In
co
me b
y Z
ip
2013 Median Household
Income by Zone
$-$10,000 $20,000 $30,000 $40,000 $50,000 $60,000 $70,000 $80,000 $90,000 $100,000
$-$10,000 $20,000 $30,000 $40,000 $50,000 $60,000 $70,000 $80,000 $90,000
$100,000
Me
dia
n H
H In
com
e
National Median Household Income
8
Source: Claritas and Mapquest

Exclusive to Healthcare. Dedicated to People. SM
Market Dynamics – Market Share (IP
Discharges)
15 Minute Drive Time Zone: Discharges by Hospital Year Ended 9/30/10 to 12/31/12
Potential Source: State Hospital Database
-10%
-8%
-6%
-4%
-2%
0%
2%
4%
6%
8%
10%
-
20,000
40,000
60,000
80,000
100,000
120,000
140,000
160,000
180,000
9/30/2010 12/31/2010 3/31/2011 6/30/2011 9/30/2011 12/31/2011 3/31/2012 6/30/2012 9/30/2012 12/31/2012
Cu
mu
lati
ve %
Ch
ange
Dis
char
ges
JCL (#3) SHC (#2) Banner (#1) Abrazo (#4) Dignity (#5)
All Other JCL Cum. % Change SHC Cum. % Change Banner Cum. % Change 15 Min Cum. % Change
9

Exclusive to Healthcare. Dedicated to People. SM
Market Dynamics – Inpatient Payer Mix
15 Min Zone Payer Mix CY 2010 and CY 2012
JCL Payer Mix CY 2010 and CY 2012
SHC Payer Mix CY 2010 and CY 2012
Potential Source: State Hospital Database
-
50,000
100,000
150,000
200,000
250,000
300,000
350,000
400,000
2010 2012
Medicare Medicare Advantage AHCCCS/Medicaid Commercial HMO Self pay/other
-
50,000
100,000
150,000
200,000
2010 2012
Dis
char
ges
-
5,000
10,000
15,000
20,000
25,000
2010 2012
Dis
char
ges
-
5,000
10,000
15,000
20,000
25,000
30,000
2010 2012
Dis
char
ges
10

Exclusive to Healthcare. Dedicated to People. SM
-
10,000
20,000
30,000
40,000
50,000
60,000
70,000
80,000
90,000
WEI
PA
s
Discharges OP Adjustment CMI Adjustment
Market Dynamics – WEIPAs (Alt. measure of
productivity)
WEIPA Calculation by Hospital
WEIPA = Weighted Equivalent Inpatient Admission Discharges x OP Adjustment x CMI Adjustment
0
20
40
60
80
100
120
-
10,000
20,000
30,000
40,000
50,000
60,000
70,000
80,000
90,000
Pai
d h
ou
rs /
WEI
PA
WEI
PA
s
Discharges OP Adjustment CMI Adjustment Paid hours / WEIPA
= Total gross charges / IP gross charges
11
Potential Source: State Hospital Database

Exclusive to Healthcare. Dedicated to People. SM
Market Dynamics – Example Hospital Profile
-
20,000
2010 2012
Self pay/other HMOCommercial AHCCCS/MedicaidMedicare Advantage Medicare
-
5,000
10,000
15,000
20,000
2010 2012
Primary/SecondaryTertiaryQuaternary
213
2,097
2,884
846
1,800
93
1,085
1,342 430
2,430
1,312
395 505
1,068
Behavioral Health Cardiovascular General Medicine General SurgeryGI Neonatology Neurosciences OB/GYNOncology Orthopedics Pulmonary RehabilitationSpine Trauma
CY 2012 Service Line Mix 2010 – 2012 r in Discharges
Payer Mix Acuity Level 2012 CMI = 1.49
CY 2012 Discharges by Zip = 12,301
(400) (200) - 200 400
-
2,000
4,000
6,000
8,000
10,000
12,000
14,000
2010 2012
-
2,000
4,000
6,000
8,000
10,000
12,000
14,000
2010 201215 Minute North 30 NE 30 SW 30 SE 30 Other AZ Outside AZ
70% 11% 0% 6% 1% 10% 3%
Percent of Discharges by Patient Origin Zone
70 2,344
2,789
767
2,778 11
547 80
403 768 1,619
- 67 58
12
Potential Source: State Hospital Database and Mapquest

Exclusive to Healthcare. Dedicated to People. SM
Market Dynamics – Outmigration
CY „12 Service Line Mix
Payer Mix
Acuity Level CMI = 1.37
Discharges originating in
15 min zone
Payer Mix Payer Mix
Acuity Level CMI = 1.47 Acuity Level CMI = 1.45
-
50
100
150
200
2010 2012
Dis
char
ges
(00
0s)
-
50
100
150
200
2010 2012
Dis
char
ges
(00
0s)
12,067
18,324
25,975
7,587
19,248 2,597
7,850
21,689
4,920
9,779
12,237
2,429 2,385 2,126
CY „12 Service Line Mix
Total Discharges
= 149,213
Remaining in Zone =
127,372 (85%)
Out-Migrating
= 21,841 (15%)
-
20
40
60
80
100
120
140
160
2010 2012
Dis
char
ges
(00
0s)
Other
Mayo
PhoenixChildren'sHosp.IASISHealthcare
MaricopaIntegratedHealth SystemDignity
Abrazo
Banner
SHC
JCL
-
5
10
15
20
25
2010 2012
Dis
char
ges
(00
0s)
CY „12 Service Line Mix
-
5
10
15
20
25
2010 2012
Dis
char
ges
(00
0s)
-
50
100
150
2010 2012D
isch
arge
s (0
00
s)
-
50
100
150
2010 2012
Dis
char
ges
(00
0s)
9,164
15,977
22,398
6,613
16,472
2,314
6,811
18,996
4,238
7,621
10,594
2,247 1,966 1,961
-
50
100
150
2010 2012
Dis
char
ges
(00
0s)
Quaternary
Tertiary
Primary/Secondary
9,164
15,977
22,398
6,613
16,472
2,314 6,811
18,996
4,238
7,621
10,594
2,247 1,966 1,961 Behavioral Health
CardiovascularGeneral MedicineGeneral SurgeryGINeonatologyNeurosciencesOB/GYNOncologyOrthopedicsPulmonaryRehabilitationSpineTrauma
2,903
2,347
3,577
974
2,776
283 1,039
2,693
682
2,158
1,643 182 419 165
-
50,000
100,000
150,000
200,000
1
Self pay/ other
HMO
Commercial
AHCCCS/ Medicaid
Medicare Advantage
Medicare
13
Potential Source: State Hospital Database

Exclusive to Healthcare. Dedicated to People. SM
Hospital Overview – Rural Markets: Critical
Access Hospitals
We just reviewed the situation in Phoenix, AZ where competition and access is plentiful. However, in many rural communities this is not the case. To promote coverage to these rural communities, in 1997 the government developed the designation of a “Critical Access Hospital.”
14
http://www.cms.gov/Outreach-and-Education/Medicare-Learning-Network-MLN/MLNProducts/downloads/CritAccessHospfctsht.pdf
Critical Access Hospitals are: 1. Over 35 miles from any other Inpatient
Facility
2. Less than 25 inpatient beds
3. Provide 24/7 emergency department
4. Typically the “first line” where patients are
stabilized and then transferred to trauma
centers
5. Receive financial support from CMS
through a separate payment method (paid
at 101% of costs)

Exclusive to Healthcare. Dedicated to People. SM
Emergency Department – 24/7/365 care for walk-in or ambulance
• Advanced emergency departments can receive a “trauma center” designation from the American College of Surgeons. Levels determine the sophistication and on-site presence of surgeons:
– Level I – Highest designation: Meets all the lower level requirement and includes 24/7 coverage of surgical specialists (e.g., orthopedic, neuro, plastic, anesthesia, critical care)
– Level III – Lowest designation: and includes 24/7 coverage of medical physicians (e.g., ED physicians, internal medicine, critical care)
Hospitals – Scope of Services
15
Intensive Care Unit (“ICU”) • ICUs are for patients who need some type of medical
intervention to maintain normal functions (i.e.,
breathing). These patients typically are in the ICU until
stabilized at which point they can be transferred to a
normal hospital bed or long term care facility. ICUs are
staffed by Critical Care/Intensivists and highly trained
APCs.
Specialty focused facilities • Pediatrics
• Orthopedic
• Heart and Vascular
• Women’s / Birthing Center
• Oncology
Potential Source: Hospital websites

Exclusive to Healthcare. Dedicated to People. SM
Hospitals expanding capabilities
Horizontal Integration
• Hospitals have merged to become systems, with major markets typically served by 2-4 major health systems
• Independent rural facilities and specialty hospitals still exist
• Drivers of horizontal integration
– Expense/cost savings
– Streamlining of service lines (e.g., Heart Center)
– Payer relationships
– Growth opportunities are limited in saturated markets (Certificate of need requirements)
– Financial restructuring / capital constraints
Vertical Integration
• Hospitals moving up (or down) the supply chain of patients
• Acquisitions include physician organizations, long term care facilities, home healthcare capabilities.
• Vertical integration is a pre-requisite for ACOs
– Payer/Hospital integration is on the rise
• Drivers of vertical integration
– Population health mentality
– Expense/cost savings
– Streamlining of service lines (e.g., Heart Center)
– Payer relationships / ACO positioning
16
Potential Source: Hospital websites, annual reports, and/or tax records, audit reports

Exclusive to Healthcare. Dedicated to People. SM
Decision Making / Governance - Hospital
17
Board of Directors
C-Suite Administrators
Medical Staff Committees
Medical (Physician) Service Line Leaders
Operational/ Department
(Business) Leaders
Potential Source: Hospital websites, annual reports, and/or tax records, audit reports

Exclusive to Healthcare. Dedicated to People. SM
Decision Making / Governance - Health
System
18
Health System
Region B Region A
Hospital B
Hospital A
Hospital D
Hospital C
Physician Group
Board of Directors
C-Suite
Decision Making Boards / Leadership at
every level of the organization
Potential Source: Hospital websites, annual reports, and/or tax records, audit reports

Exclusive to Healthcare. Dedicated to People. SM
Hospital Characteristics Overview
19
Hospital Characteristic Strategic Implication Financial Impact
Ownership (Type – for-profit vs.
nonprofit vs. gov’t)
Determine overall financial and
strategic goals
Determine overall financial and
strategic goals
Size (Capacity, Occupancy, ALOS,
Beds, Etc)
Determines the ability to serve the
patient community
Occupancy and ALOS are key drivers
of profitability
Primary service areas, demographics,
competition, market share,
outmigration
Hospitals must react to local
demographics and market conditions.
Competition, market share, and
outmigration are major strategic
initiatives.
Demographics and competitive
position determines payer mix
Scope of services (Trauma, ICU, ED,
specialty focus)
Services are required for licensing
and/or implemented to create a
leadership position within the market
(i.e., Heart Center of Excellence)
Service lines financial performance
vary by specialty
Level of integration Determines “integration” of services
and ability to manage population
health
The “physician organizations” are
typically subsidized by the hospitals
Governance
Within large systems, decision making
requires many levels of approval
Large systems can be less agile

Exclusive to Healthcare. Dedicated to People. SM
HOSPITAL ECONOMICS
20

Exclusive to Healthcare. Dedicated to People. SM
Gross Revenue 1,000,000$
Less: Contractual Allowances 600,000
Net Patient Service Revenue 400,000
Total Expenses 390,000
Operating Income (Loss) 10,000$
Operating Margin 2.5%
Hospital Profit and Loss Statement
Hospital Economics – Example P & L
21
Hospital’s typically operate
between (3.0%) to 3.0%
profitability

Exclusive to Healthcare. Dedicated to People. SM
Hospital Economics – Revenue: MS-DRG
Payment System
22
MS-DRG (Medicare Severity Diagnosis Related Groups ) payment system is how hospitals get paid for inpatient services. The DRG system was created by Yale School of Medicine and was adopted by Medicare as the reimbursement system for Inpatient Hospital Stays in 1982. The MS-DRG system was implemented in 2007. Private payers have also adopted the MS-DRG payment system.
• Trevor Jakubek authored a detailed presentation on this topic in June of 2013 (Saved on the P:)
The top Medicare procedures (by national volume) for 2012 are as follows:
Source: http://www.cms.gov/Research-Statistics-Data-and-Systems/Statistics-Trends-and-Reports/Medicare-Provider-Charge-Data/Inpatient2012.html
Rank DRG Definition Total
Discharges
Average
Covered
Charges
Average
Total
Payments
Average
Medicare
Payments
1 470 - MAJOR JOINT REPLACEMENT OR REATTACHMENT OF LOWER EXTREMITY W/O
MCC 432,007 $52,249.25 $14,469.80 $12,059.43
2 871 - SEPTICEMIA OR SEVERE SEPSIS W/O MV 96+ HOURS W MCC 347,249 $50,824.54 $13,867.78 $12,715.08
3 392 - ESOPHAGITIS, GASTROENT & MISC DIGEST DISORDERS W/O MCC 217,514 $21,988.72 $5,268.36 $4,127.22
4 292 - HEART FAILURE & SHOCK W CC 205,955 $26,084.52 $7,181.59 $6,296.91
5 690 - KIDNEY & URINARY TRACT INFECTIONS W/O MCC 197,146 $20,822.23 $5,503.43 $4,540.28
6 291 - HEART FAILURE & SHOCK W MCC 185,452 $39,370.72 $10,571.93 $9,687.82
7 194 - SIMPLE PNEUMONIA & PLEURISY W CC 181,714 $26,127.53 $6,965.02 $5,867.53
8 683 - RENAL FAILURE W CC 156,685 $25,745.19 $7,143.49 $6,155.45
9 190 - CHRONIC OBSTRUCTIVE PULMONARY DISEASE W MCC 143,163 $31,041.76 $8,031.95 $6,971.53
10 603 - CELLULITIS W/O MCC 142,752 $21,038.68 $6,007.25 $4,840.93

Exclusive to Healthcare. Dedicated to People. SM
Hospital Economics – Revenue: MS-DRG
Payment System
23
Payments vary by specialty - Hospitals focus on service line differentiation through providers, outreach locations, etc. to drive service line growth. The most profitable service lines typically include:
• Cardiology
• Orthopedics
• Neurosurgery (especially spine procedures)
• General Surgery
• Oncology
Whereas the least profitable service lines typically include:
• Women‟s health / OBGYN practices
• Psychiatry
• ICU / critical care unit
• Emergency Department
Exclusive to Healthcare. Dedicated to People. SM
Hospital Economics – Revenue: Payer Mix
Impact
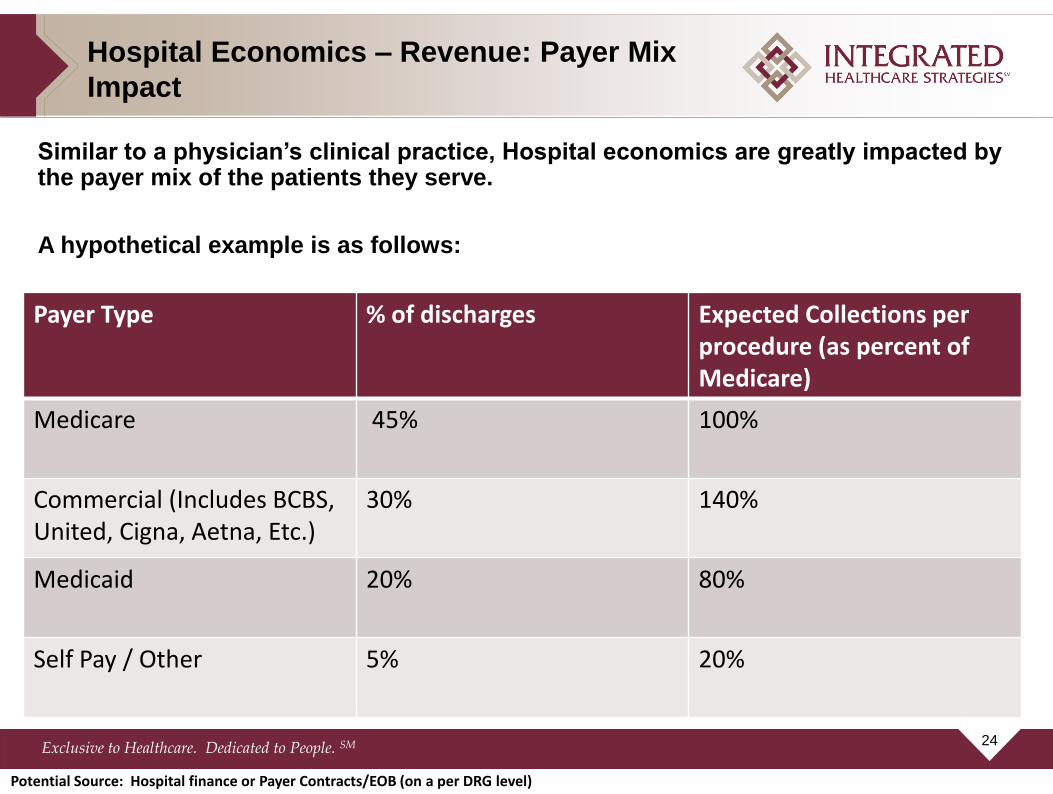
Similar to a physician‟s clinical practice, Hospital economics are greatly impacted by the payer mix of the patients they serve.
A hypothetical example is as follows:
24
Payer Type % of discharges Expected Collections per procedure (as percent of Medicare)
Medicare 45% 100%
Commercial (Includes BCBS, United, Cigna, Aetna, Etc.)
30% 140%
Medicaid 20% 80%
Self Pay / Other 5% 20%
Potential Source: Hospital finance or Payer Contracts/EOB (on a per DRG level)
Exclusive to Healthcare. Dedicated to People. SM
Hospital Economics – Revenue Snapshot
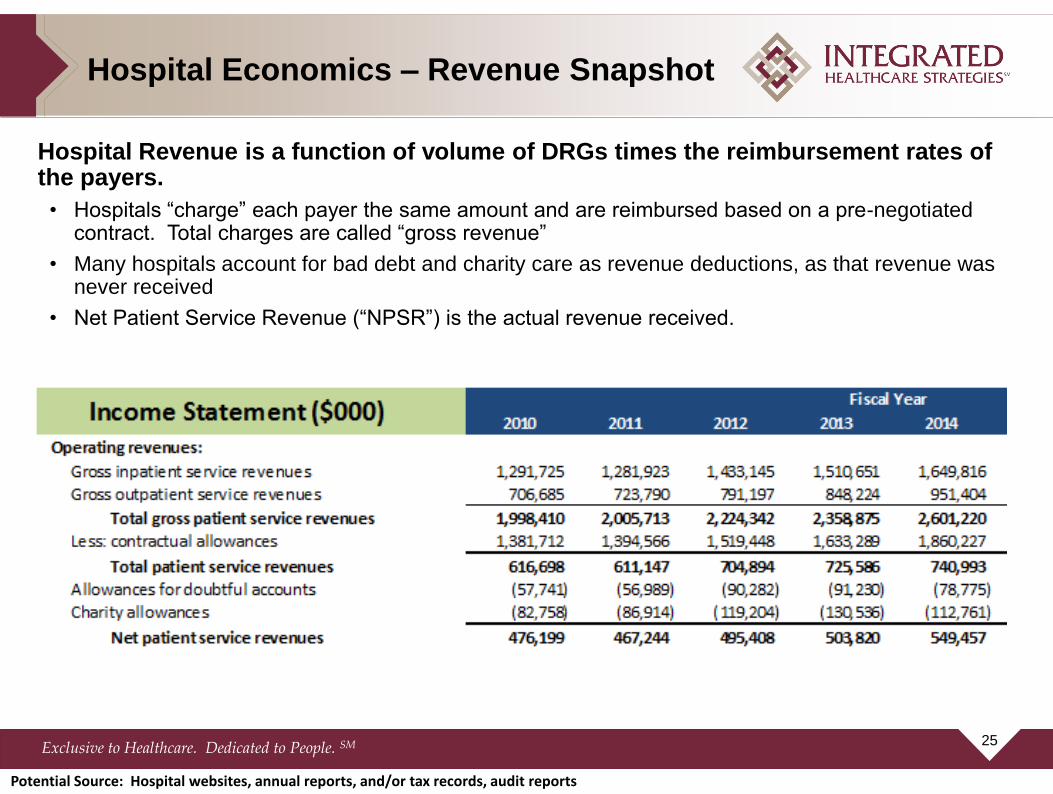
Hospital Revenue is a function of volume of DRGs times the reimbursement rates of the payers.
• Hospitals “charge” each payer the same amount and are reimbursed based on a pre-negotiated contract. Total charges are called “gross revenue”
• Many hospitals account for bad debt and charity care as revenue deductions, as that revenue was never received
• Net Patient Service Revenue (“NPSR”) is the actual revenue received.
25
Potential Source: Hospital websites, annual reports, and/or tax records, audit reports
Exclusive to Healthcare. Dedicated to People. SM
$5,977
$6,802 $6,432
$6,937 $7,011 $7,121 $6,994 $6,828
$8,430
$7,011
$5,606
$7,110
$9,630
$5,870
$6,769
$9,356
$7,223
$0
$2,000
$4,000
$6,000
$8,000
$10,000
$12,000
Net
Pa
tien
t S
erv
ice
Re
ve
nu
e p
er
WE
IPA
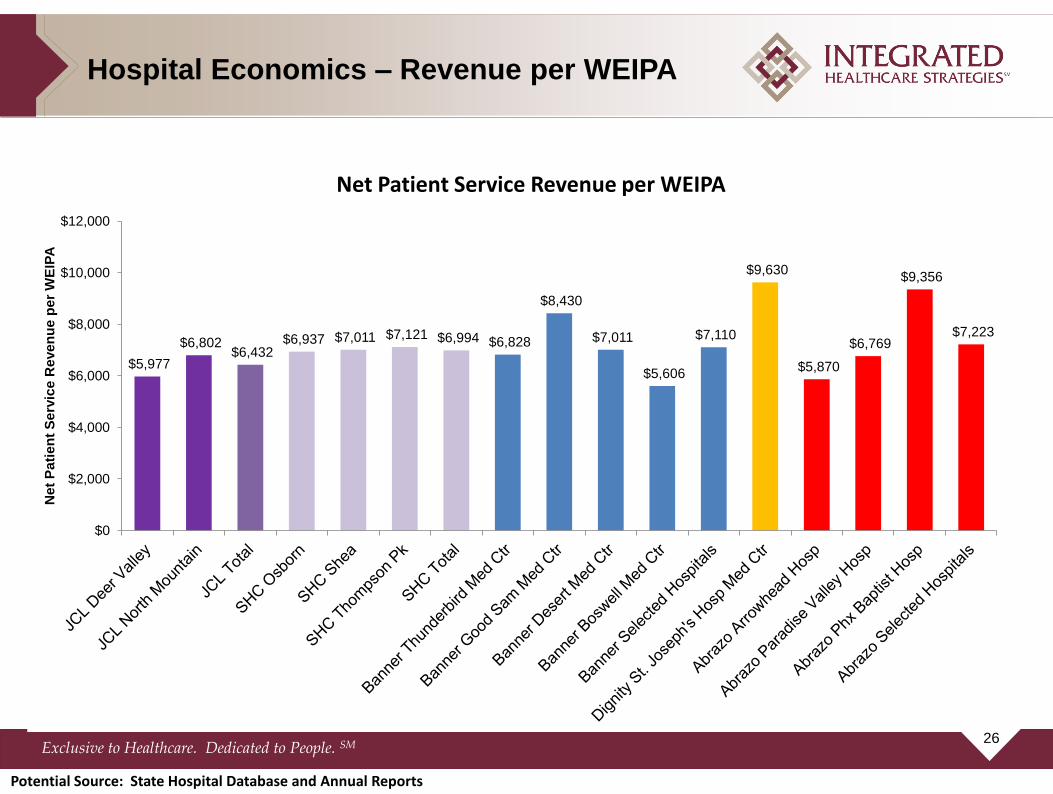
Hospital Economics – Revenue per WEIPA
Net Patient Service Revenue per WEIPA
26
Potential Source: State Hospital Database and Annual Reports

Exclusive to Healthcare. Dedicated to People. SM
Expenses are categorized into direct and indirect expenses:
• Direct expenses include labor, supplies, drugs, cleaning of the room, and other items directly correlated to patient care
• Indirect expenses include corporate overhead that is allocated to each department (and patient). Indirect expenses include the accounting department, HR expenses, general facilities maintenance, and other item that are not directly correlated to patient care
• Focus to “Break Even” at Medicare reimbursement
Hospital Economics – Expense Categories
27
Potential Source: Hospital websites, annual reports, and/or tax records, audit reports

Exclusive to Healthcare. Dedicated to People. SM
60.0
70.0
80.0
90.0
100.0
110.0
120.0
-
2,000
4,000
6,000
8,000
10,000
12,000
Pai
d h
ou
rs p
er
WEI
PA
Exp
en
ses
pe
r W
EIPA
Salaries, Wages, Benefits, Contract Labor All other non-capital expenses Depreciation Interest Paid hours per WEIPA
Hospital Economics – Expenses per
WEIPA
Operating Expenses per WEIPA
28
Potential Source: Hospital websites, annual reports, and/or tax records, audit reports

Exclusive to Healthcare. Dedicated to People. SM
DISCUSSION – IMPACT ON
PHYSICIAN SERVICES
29

Exclusive to Healthcare. Dedicated to People. SM
Market Strategies/Goals
Strategies Tactics
Improve Competitive Position
• Improve a service line (e.g. partner with orthopedic physicians) • Develop outreach clinics and satellite services • Programmatic growth incentives (through medical directorships, employment contracts, etc.)
Position organization for population health products
• Enhance primary care network including APCs, supervision, etc. • Ensure specialty specific coverage (employed or through coverage contracts) • Partner with payers (How should physician be paid for panel size?)
Cost per case (Break-even at Medicare)
• Service line co-management agreements • Supply utilization • Labor/staffing model optimization • Operational efficiency metrics (e.g. OR turnaround times) • ICU management and transfers
Ensuring physician coverage
• ED requirements 24/7 (e.g. Critical Access)
30
Related Documents