Copyright © 2019 University of Maryland. This material may not be reproduced or redistributed, in whole or in part, without written permission from Ross Salawitch. 1 HONR 229L: Climate Change: Science, Economics, and Governance Discussion #11: Impacts of Climate Change Ross Salawitch [email protected] Class Web Site: http://www.atmos.umd.edu/~rjs/class/honr229L ELMS Page: https://myelms.umd.edu/courses/1269254 8 October 2019 Kianteata Bwaurerei, 70, has decided not to replant his crops after they were inundated. https://www.nytimes.com/2016/07/03/world/asia/climate-change-kiribati.html

Welcome message from author
This document is posted to help you gain knowledge. Please leave a comment to let me know what you think about it! Share it to your friends and learn new things together.
Transcript

Copyright © 2019 University of Maryland. This material may not be reproduced or redistributed, in whole or in part, without written permission from Ross Salawitch. 1
HONR 229L: Climate Change: Science, Economics, and Governance
Discussion #11: Impacts of Climate Change
Ross [email protected]
Class Web Site: http://www.atmos.umd.edu/~rjs/class/honr229L
ELMS Page: https://myelms.umd.edu/courses/1269254
8 October 2019
Kianteata Bwaurerei, 70, has decided not to replant his crops after they were inundated.https://www.nytimes.com/2016/07/03/world/asia/climate-change-kiribati.html

Copyright © 2019 University of Maryland. This material may not be reproduced or redistributed, in whole or in part, without written permission from Ross Salawitch. 2
HONR 229L: Climate Change: Science, Economics, and Governance
In the news:
https://news.utexas.edu/2019/10/07/ancient-maya-canals-and-fields-show-early-and-extensive-impacts-on-tropical-forests/
• First study to combine airborne lidar imagery with excavation and dating for Maya• Wetland field complex to be five times larger than previously thought• Researchers hypothesized that from about 2000 to 1000 years ago:
− expanding wetland complexes added atmospheric CO2 through burning events− expanding wetland complexes added atmospheric CH4 through creation of wetland farming

Copyright © 2019 University of Maryland. This material may not be reproduced or redistributed, in whole or in part, without written permission from Ross Salawitch. 3
HONR 229L: Climate Change: Science, Economics, and GovernanceAT 10, Q1
Briefly and in your own words, what are the two findings from the 1990 IPCC report that Nate Silver describes as being absolutely certain?
The 1990 IPCC report concluded with absolute certainty that
1) there exists a natural greenhouse effect on Earth that helps it retain more heat than it otherwise would.
2) The report also concluded with certainty that:a) human activities are adding greenhouse gasses into the atmosphereb) which, on average, will warm the planetc) This atmospheric warming will increase the water vapor content in the atmosphere
which, since water vapor is a greenhouse gas, will cause further warming.
Please note this was all confidently known in 1990 !

Copyright © 2019 University of Maryland. This material may not be reproduced or redistributed, in whole or in part, without written permission from Ross Salawitch.
Lapse Rate Feedback
4
Troposphere
Stratosphere
Earth’s characteristic “black body”temperature is ~255 K (−18 °C or −0.67 °F).
If altitude above 255 K warmsthen energy will radiate to space
more effectively than in unperturbed state:negative feedback
RED: Perturbed temperature profile
Copyright © 2019 University of Maryland. This material may not be reproduced or redistributed, in whole or in part, without written permission from Ross Salawitch.
Lapse Rate Feedback
5
This figure shows warming at 10 kmis larger than warming at the surface
supporting notion that thelapse rate feedback is negative
Fig. 1.5, Paris Beacon of Hope

Copyright © 2019 University of Maryland. This material may not be reproduced or redistributed, in whole or in part, without written permission from Ross Salawitch.
Best Current Understanding
6
n AEROSOLSBB H2O+LapseRate Clouds, Ice +CO2 CH4+N2O O3+CFCv s, La d Co er
2 BB
T = λ (1 + + ) ( + )
where λ 0.3 K W m
Climate models that considering water vapor & lapse rate feedback find:
F F Ff f
/ −
∆ +∆ ∆
=
∆
H2O+LapseRate
2 2
0.45
Therefore, doubling of CO2 with only the water & lapse rate feedbackoperating will lead to a warming of: T = 0.3 K W m (1 + 0.45) (5.35 ln 2 W m ) =
f
/ − −
=
∆ (1.45) (1.1 K) 1.6 K× =

Copyright © 2019 University of Maryland. This material may not be reproduced or redistributed, in whole or in part, without written permission from Ross Salawitch. 7
HONR 229L: Climate Change: Science, Economics, and GovernanceAT 10, Q2
What are the "three prongs" of the critique of IPCC forecasts in the Armstrong and Green paper?
Armstrong and Green the IPCC forecasts on the grounds that:
1) Forecasters do not agree, which is more related to bias than accuracy2) Complex models are not better than simpler versions3) Forecasters may be overconfident is their model

Copyright © 2019 University of Maryland. This material may not be reproduced or redistributed, in whole or in part, without written permission from Ross Salawitch. 8
HONR 229L: Climate Change: Science, Economics, and GovernanceAT 10, Q3
Explain, in a short essay of 5 to 8 sentences one of these three prongs. Try to use a strong topic sentence.
Prong 1:
The first critique of IPCC Forecasts by Armstrong and Green is that agreement among forecasters is notrelated to accuracy. By this critique, Armstrong and Green are saying that just because a group of peopleagree on a forecast does not necessarily mean that the forecast is accurate. As Armstrong is quoted assaying, "voting...that's not the way that science progresses". Furthermore, the reading hints that consensusmay be a sign of bias more than anything, but this an especially true point that is worth mentioning. If agroup of forecasters get together and have to agree on a single forecast, some people will be afraid to speakup if they have an idea different than the group's idea, even if it may actually be correct. Thus, the group'sforecast will likely ultimately be representative of the thoughts of the majority, but that does mean that thisforecast will be accurate and may be missing key aspects that a minority of forecasters were afraid to orunwilling to bring up. (i.e. groupthink) Thus, Armstrong and Green accurately state that agreement amongforecasters is not necessarily related to accuracy.
Please note a key factor that has likely taken place in the real world of climate modeling is that groups thought they knew the "right answer" (i.e, how much the surface had warmed) for part of the recent past. Models were tuned to match these data. When it became apparent some of this change was due to natural variability of ocean circulation, rather than climate feedback, it was too late to revise the models. So many groups proceeded with climate models that warm too fast.!

Copyright © 2019 University of Maryland. This material may not be reproduced or redistributed, in whole or in part, without written permission from Ross Salawitch.
9
Empirical Model of Global Climate (EM-GC)
Canty et al., ACP, 2013 https://www.atmos-chem-phys.net/13/3997/2013/acp-13-3997-2013.htmlupdated by Austin Hope & Laura McBride
f TOTAL = 0.67 = 1.41

Copyright © 2019 University of Maryland. This material may not be reproduced or redistributed, in whole or in part, without written permission from Ross Salawitch. 10
HONR 229L: Climate Change: Science, Economics, and GovernanceAT 10, Q3
Explain, in a short essay of 5 to 8 sentences one of these three prongs. Try to use a strong topic sentence.
Prong 2:
The global warming problem is complex to predict, but that does not mean that prediction is impossible.Many wonder how can we predict the climate system decades from now if the weatherman can be wrongabout the weather tomorrow.
The further out in time one goes, the more likely one will need complex models that can factor in issues such as future drought, changes in the distribution of ecosystems brought about by climate change, or feedbacks that take a long time to manifest (i.e., the ice sheets do not melt instantly).

Copyright © 2019 University of Maryland. This material may not be reproduced or redistributed, in whole or in part, without written permission from Ross Salawitch. 11
HONR 229L: Climate Change: Science, Economics, and GovernanceAT 10, Q3
Explain, in a short essay of 5 to 8 sentences one of these three prongs. Try to use a strong topic sentence.
Prong 3:
Underestimating uncertainty related to global warming can produce overconfident forecasts. Climatescientists meticulously account for uncertainties in their models, yet there is still an uncertainty about thedegree of uncertainty. There is initial condition uncertainty, in which short-term factors can causetemperature fluctuations that make it harder to interpret warming caused by the greenhouse effect. There isalso scenario uncertainty, which increases over time and is associated with the level of greenhouse gases inthe atmosphere. However, the hardest uncertainty to quantify is structural uncertainty in climate models.This relates to our understanding of the climate system and how successful we can translate theseprocesses into model equations.
My research group has harped on the inability of the climate modeling world to come to grips with the structural uncertainties of their models, which should rise over time much more so than shown in Fig 12-3.

Copyright © 2019 University of Maryland. This material may not be reproduced or redistributed, in whole or in part, without written permission from Ross Salawitch. 12
HONR 229L: Climate Change: Science, Economics, and GovernanceAT 10, Q4. In a sentence or two, state what Fig 12-3 shows, and then state how the chosen figure relates to the debate about climate change. Feel free to draw upon the book, other material, or your own intuition.
Figure 12-3 depicts the random factors that are inherent in global warming forecasts, through the threedifferent types of uncertainty. The uncertainties are initial condition uncertainty, of short term naturalweather influxes, structural uncertainty, of consistently difficult calculations, and scenario uncertainty, oflong term atmospheric composition. This figure helps explain much of the skepticism revolving aroundclimate change, as well as how some climate models can seem like a drastic over or underestimation. Inclass, we discussed the structural uncertainty of climate change predictions, noting that because of theunknown effect of aerosols in the atmosphere, the [future] increase in global temperature is currently[difficult to accurately forecast]. Should the aerosols be playing a significant role in limiting the effect ofgreenhouse gases already in the atmosphere, when the aerosols disperse the climate will be muchwarmer than anticipated and vice versa.

Copyright © 2019 University of Maryland. This material may not be reproduced or redistributed, in whole or in part, without written permission from Ross Salawitch. 13
HONR 229L: Climate Change: Science, Economics, and GovernanceAT 10, Q4. In a sentence or two, state what Fig 12-7 shows, and then state how the chosen figure relates to the debate about climate change. Feel free to draw upon the book, other material, or your own intuition.
Figure 12.7 shows global temperatures from 1990 to 2011, relative to a baseline of temperatures from 1951to 1980. It also shows the IPCC's temperature forecasts from 1990, in the form of two lines showing thelow end and high end of the forecast. Since the statistical uncertainty of climate models levels off afterabout 20 years, and 2011 is 21 years after 1990, it was a good time to evaluate the IPCC's earliest forecast- and there was still a lot of year-to-year fluctuation, the average global temperature tended to tilt towardsthe lower line, suggesting that the IPCC's predictions were a bit high - though Silver does mention thatthe IPCC's 1990 forecast was based on a "business as usual" trajectory.

Copyright © 2019 University of Maryland. This material may not be reproduced or redistributed, in whole or in part, without written permission from Ross Salawitch. 14
HONR 229L: Climate Change: Science, Economics, and GovernanceAT 10, Q4. In a sentence or two, state what Fig 12-11 shows, and then state how the chosen figure relates to the debate about climate change. Feel free to draw upon the book, other material, or your own intuition.
Figure 12-11 shows the global temperatures between 1900 and 2011 with near-term flat-lines and downwardshifts highlighted. The figure mainly illustrates that global warming is not constantly increasing in a linearline. Instead, there are periods where temperatures flat-line or even decrease, but over time, globaltemperatures are still generally rising. This relates to the debate about climate change as some argue thatglobal temperatures are not rising and point to the periods of time when temperatures flat-line or decline.However, the issue of global temperature rise should not be looked at under a lens, but instead viewed asthe bigger picture. Even though temperatures might fluctuate, overall they follow an upward trend, whichmeans that global temperature rise is a long term problem that needs to be solved.

Copyright © 2019 University of Maryland. This material may not be reproduced or redistributed, in whole or in part, without written permission from Ross Salawitch.
HONR 229L: Climate Change: Science, Economics, and Governance
15
Impacts of Climate Change
Luke Lu
8 October 2019

Copyright © 2019 University of Maryland. This material may not be reproduced or redistributed, in whole or in part, without written permission from Ross Salawitch.
Impacts of Climate Change
16

Copyright © 2019 University of Maryland. This material may not be reproduced or redistributed, in whole or in part, without written permission from Ross Salawitch.
Impacts of Climate Change
Increased wildfires
17

Copyright © 2019 University of Maryland. This material may not be reproduced or redistributed, in whole or in part, without written permission from Ross Salawitch.
Impacts of Climate Change
Increased wildfires
Sea level rise
18

Copyright © 2019 University of Maryland. This material may not be reproduced or redistributed, in whole or in part, without written permission from Ross Salawitch.
Impacts of Climate Change
Increased wildfires
Sea level rise
Ocean acidification
19

Copyright © 2019 University of Maryland. This material may not be reproduced or redistributed, in whole or in part, without written permission from Ross Salawitch.
Impacts of Climate Change
Increased wildfires
Sea level rise
Ocean acidification
Spread of disease
20
Copyright © 2019 University of Maryland. This material may not be reproduced or redistributed, in whole or in part, without written permission from Ross Salawitch.
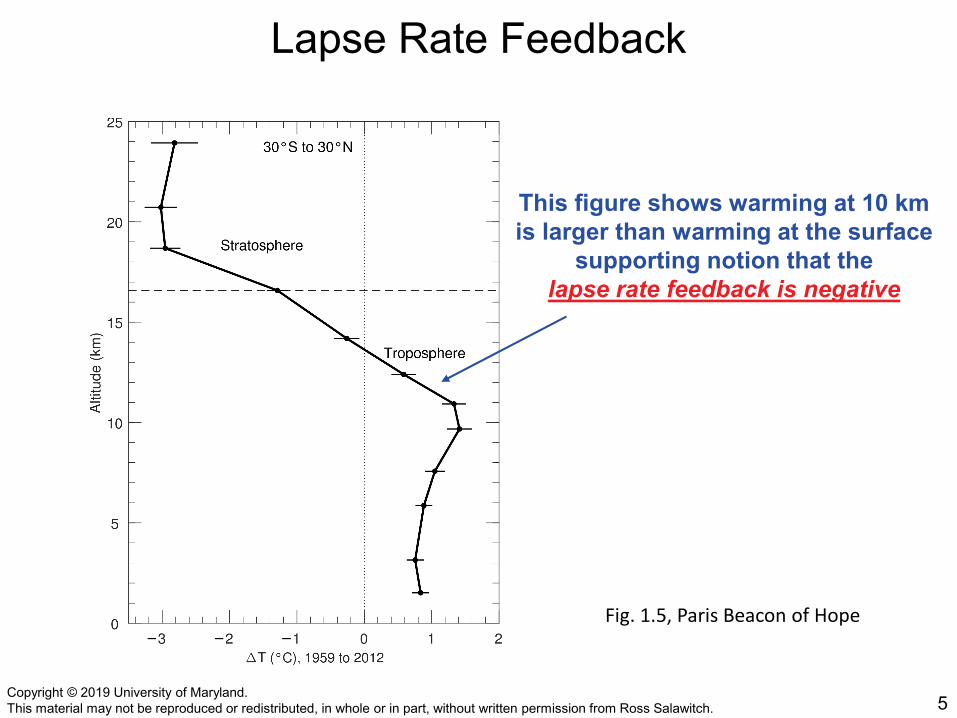
Impacts of Climate Change
Increased wildfires Sea level rise Ocean acidification Spread of diseases
https://www.ucsusa.org/our-work/global-warming/science-and-impacts/global-warming-impacts#.W4CXQ8PPyUk
Also: Increased droughts and
flooding Melting icecaps and
glaciers Destruction of marine
ecosystems Increased extreme
weather Agricultural disruption Water supply disruption Environmental migration
21

Copyright © 2019 University of Maryland. This material may not be reproduced or redistributed, in whole or in part, without written permission from Ross Salawitch.
Connection to Climate ChangeWWDD: Wet-gets-Wetter, Dry-gets-Drier (WWDD) paradigm
22
https://www.cnbc.com/2017/08/28/the-stunning-images-from-record-setting-flooding-in-houston-texas.html
Spatial Distribution of Precipitation Changes, 2081 −2100 relative to 1986−2005
Climate model projections, RCP 8.5 (aggressive growth of GHGs)IPCC 2013

Copyright © 2019 University of Maryland. This material may not be reproduced or redistributed, in whole or in part, without written permission from Ross Salawitch.
Connection to Climate ChangeWWDD: Wet-gets-Wetter, Dry-gets-Drier (WWDD) paradigm
23
http://www.windows2universe.org/vocals/images/HadleyCell_small.jpg

Copyright © 2019 University of Maryland. This material may not be reproduced or redistributed, in whole or in part, without written permission from Ross Salawitch.
Wildfires
24

Copyright © 2019 University of Maryland. This material may not be reproduced or redistributed, in whole or in part, without written permission from Ross Salawitch.
https://www.ucsusa.org/global-warming/science-and-impacts/impacts/infographic-wildfires-climate-change.html
25

Copyright © 2019 University of Maryland. This material may not be reproduced or redistributed, in whole or in part, without written permission from Ross Salawitch.
https://www.ucsusa.org/global-warming/science-and-impacts/impacts/infographic-wildfires-climate-change.html
26

Copyright © 2019 University of Maryland. This material may not be reproduced or redistributed, in whole or in part, without written permission from Ross Salawitch.
https://www.ucsusa.org/global-warming/science-and-impacts/impacts/infographic-wildfires-climate-change.html
27

Copyright © 2019 University of Maryland. This material may not be reproduced or redistributed, in whole or in part, without written permission from Ross Salawitch.
28

Copyright © 2019 University of Maryland. This material may not be reproduced or redistributed, in whole or in part, without written permission from Ross Salawitch.
Ocean Acidification
29

Copyright © 2019 University of Maryland. This material may not be reproduced or redistributed, in whole or in part, without written permission from Ross Salawitch.
30

Copyright © 2019 University of Maryland. This material may not be reproduced or redistributed, in whole or in part, without written permission from Ross Salawitch.
31
Caption: (a) Time series of CO2 (global mean as well as amount measured at Mauna Loa Observatory; (b) total anthropogenic emissions ofCO2 from fossil fuel & land use change (green bars) atmospheric growth (blue bars) and major volcanic eruptions (red triangle, for MtAgung, El Chichón, Fuego, and Mt Pinatubo); (c) tropical Pacific ENSO 3.4 index (red denotes El Niño events; blue denotes strong La Niñaconditions); and (d) Airborne Fraction of CO2 (i.e., amount that remains in the atmosphere each year), three 3 yr running mean of AF(black), and trend-line of a least squares fit to the 3 yr running mean (blue).

Copyright © 2019 University of Maryland. This material may not be reproduced or redistributed, in whole or in part, without written permission from Ross Salawitch.
32
Atmospheric CO2 280 ppmPre-Industrial
400 ppmPresent Day
560 ppm2 × Pre-Indus.
pH 8.32 8.19 8.06
https://www.pmel.noaa.gov/co2/story/Ocean%2BAcidification

Copyright © 2019 University of Maryland. This material may not be reproduced or redistributed, in whole or in part, without written permission from Ross Salawitch.
33
Doney, The Dangers of Ocean Acidification, Scientific American, March, 2006

Copyright © 2019 University of Maryland. This material may not be reproduced or redistributed, in whole or in part, without written permission from Ross Salawitch.
Also, coral: 34
https://www.youtube.com/watch?v=ccYvlbcBlTY

Copyright © 2019 University of Maryland. This material may not be reproduced or redistributed, in whole or in part, without written permission from Ross Salawitch.
Sea Level Rise
35

Copyright © 2019 University of Maryland. This material may not be reproduced or redistributed, in whole or in part, without written permission from Ross Salawitch.
36
https://nsidc.org/data/seaice_index

Copyright © 2019 University of Maryland. This material may not be reproduced or redistributed, in whole or in part, without written permission from Ross Salawitch.
What effect do you think floating ice has on sea level?
37

Copyright © 2019 University of Maryland. This material may not be reproduced or redistributed, in whole or in part, without written permission from Ross Salawitch.
What effect do you think floating ice has on sea level? It rises!
38

Copyright © 2019 University of Maryland. This material may not be reproduced or redistributed, in whole or in part, without written permission from Ross Salawitch.
What effect do you think floating ice has on sea level? It rises! Brine rejection – salt doesn’t freeze into ice crystals Salt water is denser than fresh water Ice is fresh Ice melts -> water becomes less salty -> water becomes
less dense -> water rises
39

Copyright © 2019 University of Maryland. This material may not be reproduced or redistributed, in whole or in part, without written permission from Ross Salawitch.
What effect do you think floating ice has on sea level? It rises! Brine rejection – salt doesn’t freeze into ice crystals Salt water is denser than fresh water Ice is fresh Ice melts -> water becomes less salty -> water becomes
less dense -> water risesHow much of sea level rise does melting sea ice contribute?
40

Copyright © 2019 University of Maryland. This material may not be reproduced or redistributed, in whole or in part, without written permission from Ross Salawitch.
What effect do you think floating ice has on sea level? It rises! Brine rejection – salt doesn’t freeze into ice crystals Salt water is denser than fresh water Ice is fresh Ice melts -> water becomes less salty -> water becomes
less dense -> water risesHow much of sea level rise does melting sea ice contribute? About 1.6%https://skepticalscience.com/Sea-level-rise-due-to-floating-ice.html
41

Copyright © 2019 University of Maryland. This material may not be reproduced or redistributed, in whole or in part, without written permission from Ross Salawitch.
What effect do you think floating ice has on sea level? It rises! Brine rejection – salt doesn’t freeze into ice crystals Salt water is denser than fresh water Ice is fresh Ice melts -> water becomes less salty -> water becomes
less dense -> water risesHow much of sea level rise does melting sea ice contribute? About 1.6% Most sea level rise comes from melting land ice and
thermal expansionhttps://skepticalscience.com/Sea-level-rise-due-to-floating-ice.html
42

Copyright © 2019 University of Maryland. This material may not be reproduced or redistributed, in whole or in part, without written permission from Ross Salawitch.
43
http://www.atmos.umd.edu/~rjs/class/honr229L/readings/WG1AR5_SPM_FINAL_carbon.pdf
By the way, how much would sea level rise if the entire Greenland ice sheet melted?

Copyright © 2019 University of Maryland. This material may not be reproduced or redistributed, in whole or in part, without written permission from Ross Salawitch.
44
http://www.atmos.umd.edu/~rjs/class/honr229L/readings/WG1AR5_SPM_FINAL_carbon.pdf
By the way, how much would sea level rise if the entire Greenland ice sheet melted?Answer: 7 meters

Copyright © 2019 University of Maryland. This material may not be reproduced or redistributed, in whole or in part, without written permission from Ross Salawitch.
45
http://www.atmos.umd.edu/~rjs/class/honr229L/readings/WG1AR5_SPM_FINAL_carbon.pdf
By the way, how much would sea level rise if the entire Greenland ice sheet melted?Answer: 7 meters
Note: collapse of the Greenland ice sheet causes sea level to rise because this ice sheet lies on top of land: i.e., Greenland is a continental sized land mass. Sea ice, on the other hand, lies on top of the ocean (is buoyant in water).

Copyright © 2019 University of Maryland. This material may not be reproduced or redistributed, in whole or in part, without written permission from Ross Salawitch.
46Sea level today:
Source: Jeremy Weiss and Jonathan Overpeck, University of Arizona

Copyright © 2019 University of Maryland. This material may not be reproduced or redistributed, in whole or in part, without written permission from Ross Salawitch.
47
Source: Jeremy Weiss and Jonathan Overpeck, University of Arizona
Sea level by 2100 (RCP 8.5 scenario)

Copyright © 2019 University of Maryland. This material may not be reproduced or redistributed, in whole or in part, without written permission from Ross Salawitch.
48
Source: Jeremy Weiss and Jonathan Overpeck, University of Arizona
Sea level if most of Greenland’s ice sheet melts:

Copyright © 2019 University of Maryland. This material may not be reproduced or redistributed, in whole or in part, without written permission from Ross Salawitch.
49
Water levels today, 5 feet higher than today, 12 feet, and 25 feet higher
https://www.washingtonpost.com/national/health-science/vulnerable-maryland-weighs-threat-of-sea-level-rise/2013/07/21/37201d50-efe9-11e2-bed3-b9b6fe264871_story.html

Copyright © 2019 University of Maryland. This material may not be reproduced or redistributed, in whole or in part, without written permission from Ross Salawitch.
Infectious Disease
50

Copyright © 2019 University of Maryland. This material may not be reproduced or redistributed, in whole or in part, without written permission from Ross Salawitch.
How does global warming increase the spread of disease?
51

Copyright © 2019 University of Maryland. This material may not be reproduced or redistributed, in whole or in part, without written permission from Ross Salawitch.
How does global warming increase the spread of disease?
Increased rainfall creates more potential breeding grounds for mosquitoes
Increased temperature extends transmission season for certain diseases
Increased droughts cause malnutrition Increased droughts and flooding affect clean
water supply (cholera) Habitat destruction brings animals closer to
humans
52

Copyright © 2019 University of Maryland. This material may not be reproduced or redistributed, in whole or in part, without written permission from Ross Salawitch.
Cholera
Caused by bacteria Vibrio cholerae Thrives in aquatic environments Can cause vomiting, fever and (extreme)
diarrhea Mainly affects regions with poor water sanitation
and crowded living conditions
53

Copyright © 2019 University of Maryland. This material may not be reproduced or redistributed, in whole or in part, without written permission from Ross Salawitch.
Cholera
Caused by bacteria Vibrio cholerae Thrives in aquatic environments Can cause vomiting, fever and (extreme)
diarrhea Mainly affects regions with poor water sanitation
and crowded living conditions High temperatures and rainfall create good
conditions for bacterial growth Rising seas contaminate clean water Droughts concentrate the bacteria Floods bring bacteria to new places
54
Copyright © 2019 University of Maryland. This material may not be reproduced or redistributed, in whole or in part, without written permission from Ross Salawitch.
Ebola
Caused by ebolaviruses Symptoms start about 2-3 weeks after infection,
with fever, headache, vomiting, and diarrhea Leads to internal and external bleeding Virus lives in apes and bats
55

Copyright © 2019 University of Maryland. This material may not be reproduced or redistributed, in whole or in part, without written permission from Ross Salawitch.
Ebola
Caused by ebolaviruses Symptoms start about 2-3 weeks after infection,
with fever, headache, vomiting, and diarrhea Leads to internal and external bleeding Virus lives in apes and bats Deforestation causes more animals to come in
contact with humans Habitat destruction causes animals to relocate
closer to humans
Global warming may be expanding bat ranges Agricultural disruption drives increased bushmeat
consumption
56

Copyright © 2019 University of Maryland. This material may not be reproduced or redistributed, in whole or in part, without written permission from Ross Salawitch.
Other diseases affected by climate change
Malaria Dengue fever Schistosomiasis Hantavirus Lyme disease West Nile virus Chikungunya Yellow fever Rift Valley fever
57

Copyright © 2019 University of Maryland. This material may not be reproduced or redistributed, in whole or in part, without written permission from Ross Salawitch. 58
HONR 229L: Climate Change: Science, Economics, and Governance
Impacts of Climate Change: The Last Word
Ross Salawitch
9 October 2018

Copyright © 2019 University of Maryland. This material may not be reproduced or redistributed, in whole or in part, without written permission from Ross Salawitch.
HONR 229L: Climate Change: Science, Economics, and Governance
59
Volume of Antarctic Ice Sheet ∼26.5 × 10⁶ km3 and volume of cubic Greenland Ice Sheet ∼2.85 × 10⁶ km3
https://en.wikipedia.org/wiki/Antarctic_ice_sheet & https://en.wikipedia.org/wiki/Greenland_ice_sheet
https://web.viu.ca/earle/geol305/The%20Greenland%20Ice%20Sheet.pdf
Radius of Earth = 6371 km; Surface area of Earth = 510 × 106 km2
70% of earth, or 357 × 106 km2 is covered by water.
The complete collapse of Greenland would lead to sea-level rise of2.85 × 106 km3 / 357 × 106 km2 = 8 meters according to these numbers.
Since more area would be covered by water following the collapse,the actual rise in sea level is closer to 7 meters … or 23 feet!

Copyright © 2019 University of Maryland. This material may not be reproduced or redistributed, in whole or in part, without written permission from Ross Salawitch.
HONR 229L: Climate Change: Science, Economics, and Governance
60
https://www.newsweek.com/sea-level-rise-could-reach-50-feet-2300-devastating-coastal-cities-globally-1160279
Copyright © 2019 University of Maryland. This material may not be reproduced or redistributed, in whole or in part, without written permission from Ross Salawitch.
HONR 229L: Climate Change: Science, Economics, and Governance
61
https://gracefo.jpl.nasa.gov/resources/33/greenland-ice-loss-2002-2016
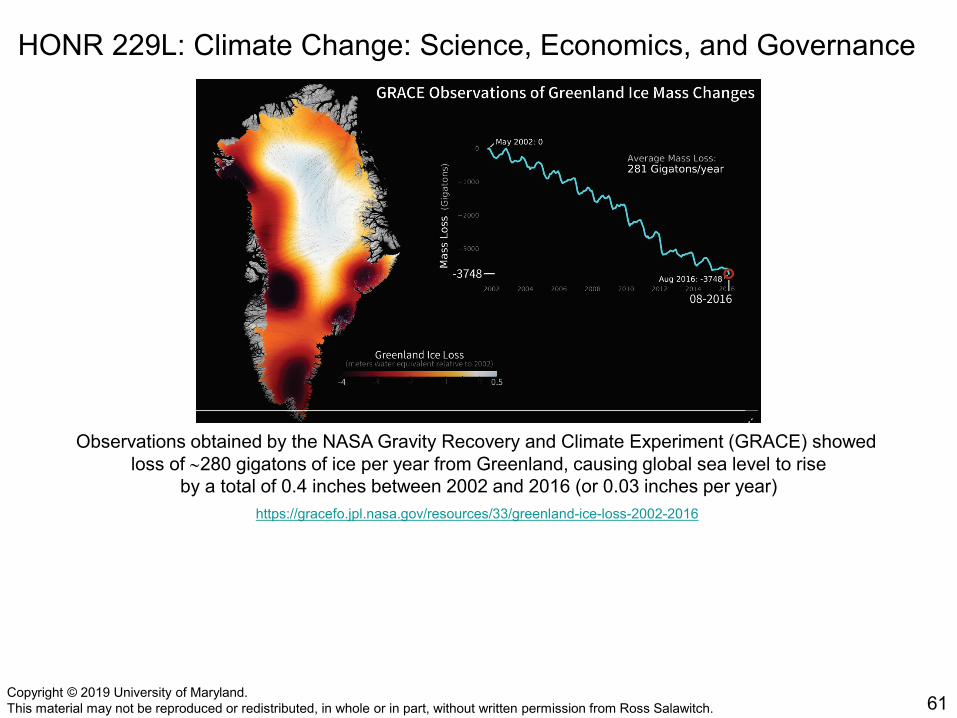
Observations obtained by the NASA Gravity Recovery and Climate Experiment (GRACE) showed loss of ∼280 gigatons of ice per year from Greenland, causing global sea level to rise
by a total of 0.4 inches between 2002 and 2016 (or 0.03 inches per year)

Copyright © 2019 University of Maryland. This material may not be reproduced or redistributed, in whole or in part, without written permission from Ross Salawitch.
HONR 229L: Climate Change: Science, Economics, and Governance
62
Observations obtained by the NASA Gravity Recovery and Climate Experiment (GRACE) showed loss of ∼125 gigatons of ice per year from Antarctica, causing global sea level to rise
by a total of 0.18 inches between 2002 and 2016 (or 0.014 inches per year)
−3 −2 −1 10
https://grace.jpl.nasa.gov/resources/31/antarctic-ice-loss-2002-2016

Copyright © 2019 University of Maryland. This material may not be reproduced or redistributed, in whole or in part, without written permission from Ross Salawitch.
HONR 229L: Climate Change: Science, Economics, and Governance
63
Observations obtained by the NASA Gravity Recovery and Climate Experiment (GRACE) showed loss of ∼125 gigatons of ice per year from Antarctica, causing global sea level to rise
by a total of 0.18 inches between 2002 and 2016 (or 0.014 inches per year)
Current rate of sea level rise from satellite altimetry 3.0 ± 0.4 millimetres (0.118 ± 0.016 in) per year, for 1993–2017.1.18 inch per decade or ~foot per century
https://en.wikipedia.org/wiki/Sea_level_rise
−3 −2 −1 10
https://grace.jpl.nasa.gov/resources/31/antarctic-ice-loss-2002-2016
Copyright © 2019 University of Maryland. This material may not be reproduced or redistributed, in whole or in part, without written permission from Ross Salawitch. 64
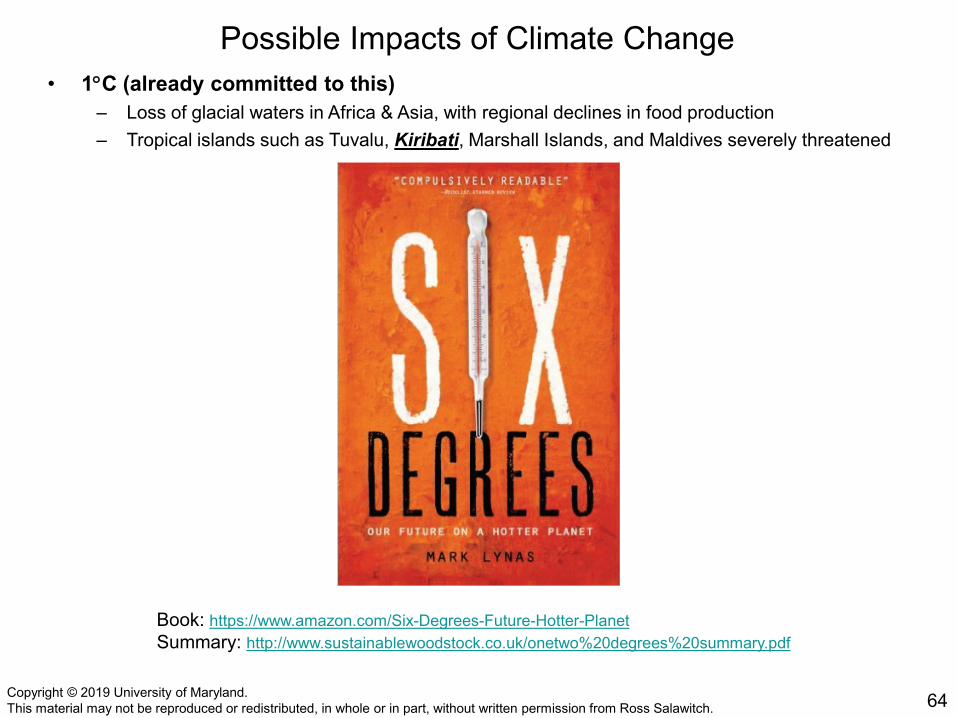
Possible Impacts of Climate Change• 1°C (already committed to this)
– Loss of glacial waters in Africa & Asia, with regional declines in food production– Tropical islands such as Tuvalu, Kiribati, Marshall Islands, and Maldives severely threatened
Book: https://www.amazon.com/Six-Degrees-Future-Hotter-PlanetSummary: http://www.sustainablewoodstock.co.uk/onetwo%20degrees%20summary.pdf

Copyright © 2019 University of Maryland. This material may not be reproduced or redistributed, in whole or in part, without written permission from Ross Salawitch. 65
Kiribati: Population 118,000 as of 2018
High tide keeps getting higher on the islands of the Republic of Kiribati – 33 coral atolls in the Pacific Ocean thatrest only a few feet above sea level. In Kiribati culture, Nareau the Creator scattered stones to the north andsouth to create this mosaic of coral and rock. But, today, the effects of climate change are closing in and there’sno higher land to move to. Even as the atolls shrink, Kiribati’s population grows. The country is experiencingbaki-aba: “land hunger”. In 2014, Kiribati president, Anote Tong purchased 20 square km on Vanua Levu,a Fiji island making this the first international land purchase intended for climate refugees.
For Kiribati, adapting to climate change might mean relocating entirely.
Pacific islanders’ identities are very much tied to their ancestral land, the physical islands on which they live.Migration may mean a national and cultural loss, especially when most traditions are preserved orally.
https://www.nytimes.com/2016/07/03/world/asia/climate-change-kiribati.htmlhttps://thewire.in/culture/kiribati-migration-climate-change
• Undergoing intrusion of salt water into freshwater supplies• Some farmers unable to grow food because of saltwater intrusion

Copyright © 2019 University of Maryland. This material may not be reproduced or redistributed, in whole or in part, without written permission from Ross Salawitch. 66
Possible Impacts of Climate Change• 1°C (already committed to this)
– Loss of glacial waters in Africa & Asia, with regional declines in food production– Tropical islands such as Tuvalu, Kiribati, Marshall Islands, and Maldives severely threatened
• 2°C (Paris Climate Agreement Upper Limit)– Polar bear habitat under severe threat– Glacial melt rate doubles; disappearance of glaciers will create water shortages in places such as
India, Peru, Ecuador, and Bolivia– Stability of Greenland ice sheet threatened Six Degrees: Our Future on a Hotter Planet by Mark Lynas
https://www.youtube.com/watch?time_continue=19&v=Yvkm9t7xRF4

Copyright © 2019 University of Maryland. This material may not be reproduced or redistributed, in whole or in part, without written permission from Ross Salawitch. 67
• 3°C (occurs in ~2050 according to IPCC climate models using RCP 8.5)– 80% of Arctic sea ice melted– Loss of Himalayan glaciers threaten water supply of Pakistan & China’s hydro-electric industry– Indian monsoon, essential to 60% or world’s population, more variable and possibly fails on a
persistent basis– Many plant species become extinct if they can not adapt, an ecological catastrophe but also another
source of atmospheric carbon• 4°C (occurs in ~2080 according to IPCC climate models using RCP 8.5)
– Mass displacement of populations from places such as Bangladesh, Egypt, etc– Major flooding in Mumbai, Shanghai, Boston, New York, London, etc– Australia supports little to no agriculture– Stability of Antarctic ice sheet threatened
• 5°C (possibly end of this century)– Stability of all of world’s ice sheets threatened, leading to drastic change in coast line geography– Risk of methane release from hydrates, a strong positive feedback that is considered one of several
tipping points– Possible massive decline in supportable, global population
• 6°C (next century)– Sea level rise could be 20 meters (65 feet!)– Dystopian world
Possible Impacts of Climate Change
Six Degrees: Our Future on a Hotter Planet by Mark Lynas

Copyright © 2019 University of Maryland. This material may not be reproduced or redistributed, in whole or in part, without written permission from Ross Salawitch. 68
HONR 229L: Climate Change: Science, Economics, and Governance
Reading for Thurs:
Please read either
a) Chapter 2 (30 pages; solar PV)
*OR*
b) Chapter 3 (29 pages; concentrated solar)
but everyone please read from the words “THESE PHOTOVOLTAIC INVENTORS”on pg 40 to the end of Chapter 2 (middle page 44), because this section on feed-in tariff, carbon tax, and cap-and-trade are vitally important for the rest of the semester.
Abhay will have to read both. This material is a breeze to read.
Have posted an AT for both chapters; please complete only one.
How many students need a copy of the reading from us?

Copyright © 2019 University of Maryland. This material may not be reproduced or redistributed, in whole or in part, without written permission from Ross Salawitch.
Energy and Power
69
Simple equation connects energy and power:
Energy = Power × Time
Size of a power plant is commonly measured in units of power:
kW (kilo: 103 Watts): Home solar
MW (mega: 106 Watts) Industrial
GW (giga: 109 Watts): Massive Hydroelectric
TW (terra: 1012 Watts): Large Nation and/or Global
(Footnote, pg 18, Krupp & Horn)
Output of a power plant in units of energy:
kWh (kilo: 103 W hour)
MWh (mega: 106 W hour)
GWh (gig: 109 W hour)
Capacity Factor: actual output of a power plant (energy) dividedby maximum output if plant could run 24/7/365 at full capacity
(Footnote, pg 47, Krupp & Horn)

Copyright © 2019 University of Maryland. This material may not be reproduced or redistributed, in whole or in part, without written permission from Ross Salawitch.
Capacity Factor, Various Forms of Energy
70
http://www.lightevolution.co.uk/blog/geothermal-visual-capacity-factors-for-assorted-energy-systems/
Related Documents