Homogenization of plant diversity, composition, and structure in North American urban yards WILLIAM D. PEARSE, 1,2,3,4, JEANNINE CAVENDER-BARES, 1,A SARAH E. HOBBIE, 1,A MEGHAN L. AVOLIO, 5,6 NEIL BETTEZ, 7 RINKU ROY CHOWDHURY , 8 LINDSAY E. DARLING, 9 PETER M. GROFFMAN, 7,10 J. MORGAN GROVE, 11 SHARON J. HALL, 12 JAMES B. HEFFERNAN, 13 JENNIFER LEARNED, 12,14 CHRISTOPHER NEILL, 15,16 KRISTEN C. NELSON, 17,18 DIANE E. PATAKI, 19 BENJAMIN L. RUDDELL, 20 MEREDITH K. STEELE, 21 AND TARA L. E. TRAMMELL 22 1 Department of Ecology, Evolution and Behavior, University of Minnesota, 140 Gortner Lab, 1479 Gortner Avenue, St. Paul, Minnesota 55108 USA 2 Department of Biology, McGill University, 1205 Dr Penfield Avenue, Montreal, Quebec H3A 1B1 Canada 3 D epartement des Sciences Biologiques, Universit e du Qu ebec a Montr eal, Pavillon des sciences biologiques (SB) 141 Avenue du Pr esident-Kennedy, Montreal, Quebec H2X 1Y4 Canada 4 Department of Biology & Ecology Center, Utah State University, 5305 Old Main Hill, Logan, Utah 84322 USA 5 National Socio-Environmental Synthesis Center, 1 Park Place, Annapolis, Maryland 21401 USA 6 Department of Earth& Planetary Sciences, John Hopkins University, Baltimore, Maryland 21218 USA 7 Cary Institute of Ecosystem Studies, Millbrook, New York 12545 USA 8 Department of Geography, Indiana University, Bloomington, Indiana 47405 USA 9 The Morton Arboretum, Lisle, Illinois 60532 USA 10 Advanced Science Research Center at the Graduate Center, City University of New York, 85 St. Nicholas Terrace, New York, New York 10031 USA 11 Forest Service, Northern Research Station, Suite 350, 5523 Research Park Drive, Baltimore, Maryland 21228 USA 12 School of Life Sciences, Arizona State University, Tempe, Arizona 85287 USA 13 Nicholas School of the Environment, Duke University, Durham, North Carolina 27708 USA 14 Research Corporation of the University of Hawaii, Honolulu, Hawaii 96822 USA 15 The Ecosystems Center, Marine Biological Laboratory, Woods Hole, Massachusetts, 02543 USA 16 Woods Hole Research Center, Falmouth, Massachusetts 02540 USA 17 Department of Forest Resources, University of Minnesota, Saint Paul, Minnesota 55108 USA 18 Department of Fisheries, Wildlife and Conservation Biology, University of Minnesota, 2003 Upper Buford Circle, Saint Paul, Minnesota 55108 USA 19 Department of Biology, University of Utah, 257 South 1400 East, Salt Lake City, Utah, 84112 USA 20 School of Informatics, Computing, and Cyber Systems, Northern Arizona University, Flagstaff, Arizona 86001 USA 21 Department of Crop and Soil Environmental Sciences, Virginia Polytechnic Institute and State University, Blacksburg, Virginia 24061 USA 22 Department of Plant and Soil Sciences, University of Delaware, 531 S College Avenue, Newark, Delaware 19716 USA Citation: Pearse, W. D., J. Cavender-Bares, S. E. Hobbie, M. L. Avolio,N. Bettez, R. Roy Chowdhury, L. E. Darling, P. M. Groffman, J. M. Grove, S. J. Hall, J. B. Heffernan, J. Learned, C. Neill, K. C. Nelson, D. E. Pataki, B. L. Ruddell, M. K. Steele, and T. L. E. Trammell. 2018. Homogenization of plant diversity, composition, and structure in North American urban yards. Ecosphere 9(2):e02105. 10.1002/ecs2.2105 Abstract. Urban ecosystems are widely hypothesized to be more ecologically homogeneous than natural ecosystems. We argue that urban plant communities assemble from a complex mix of horticultural and regional species pools, and evaluate the homogenization hypothesis by comparing cultivated and sponta- neously occurring urban vegetation to natural area vegetation across seven major U.S. cities. There was limited support for homogenization of urban diversity , as the cultivated and spontaneous yard flora had greater numbers of species than natural areas, and cultivated phylogenetic diversity was also greater. However, urban yards showed evidence of homogenization of composition and structure. Yards were com- positionally more similar across regions than were natural areas, and tree density was less variable in yards than in comparable natural areas. This homogenization of biodiversity likely reflects similar horticultural source pools, homeowner preferences, and management practices across U.S. cities. Key words: aridity; ecosystem services; functional traits; phylogenetic diversity; plants; urban ecology. ❖ www.esajournals.org 1 February 2018 ❖ Volume 9(2) ❖ Article e02105

Welcome message from author
This document is posted to help you gain knowledge. Please leave a comment to let me know what you think about it! Share it to your friends and learn new things together.
Transcript
Homogenization of plant diversity, composition, and structure inNorth American urban yards
WILLIAM D. PEARSE,1,2,3,4,� JEANNINE CAVENDER-BARES,1,A SARAH E. HOBBIE,1,A MEGHAN L. AVOLIO,5,6
NEIL BETTEZ,7 RINKU ROY CHOWDHURY,8 LINDSAY E. DARLING,9 PETER M. GROFFMAN,7,10 J. MORGAN GROVE,11
SHARON J. HALL,12 JAMES B. HEFFERNAN,13 JENNIFER LEARNED,12,14 CHRISTOPHER NEILL,15,16
KRISTEN C. NELSON,17,18 DIANE E. PATAKI,19 BENJAMIN L. RUDDELL,20
MEREDITH K. STEELE,21 AND TARA L. E. TRAMMELL22
1Department of Ecology, Evolution and Behavior, University of Minnesota, 140 Gortner Lab, 1479 Gortner Avenue,St. Paul, Minnesota 55108 USA
2Department of Biology, McGill University, 1205 Dr Penfield Avenue, Montreal, Quebec H3A 1B1 Canada3D�epartement des Sciences Biologiques, Universit�e du Qu�ebec �a Montr�eal, Pavillon des sciences biologiques (SB) 141 Avenue du
Pr�esident-Kennedy, Montreal, Quebec H2X 1Y4 Canada4Department of Biology & Ecology Center, Utah State University, 5305 Old Main Hill, Logan, Utah 84322 USA
5National Socio-Environmental Synthesis Center, 1 Park Place, Annapolis, Maryland 21401 USA6Department of Earth& Planetary Sciences, John Hopkins University, Baltimore, Maryland 21218 USA
7Cary Institute of Ecosystem Studies, Millbrook, New York 12545 USA8Department of Geography, Indiana University, Bloomington, Indiana 47405 USA
9The Morton Arboretum, Lisle, Illinois 60532 USA10Advanced Science Research Center at the Graduate Center, City University of New York, 85 St. Nicholas Terrace,
New York, New York 10031 USA11Forest Service, Northern Research Station, Suite 350, 5523 Research Park Drive, Baltimore, Maryland 21228 USA
12School of Life Sciences, Arizona State University, Tempe, Arizona 85287 USA13Nicholas School of the Environment, Duke University, Durham, North Carolina 27708 USA
14Research Corporation of the University of Hawaii, Honolulu, Hawaii 96822 USA15The Ecosystems Center, Marine Biological Laboratory, Woods Hole, Massachusetts, 02543 USA
16Woods Hole Research Center, Falmouth, Massachusetts 02540 USA17Department of Forest Resources, University of Minnesota, Saint Paul, Minnesota 55108 USA
18Department of Fisheries, Wildlife and Conservation Biology, University of Minnesota, 2003 Upper Buford Circle,Saint Paul, Minnesota 55108 USA
19Department of Biology, University of Utah, 257 South 1400 East, Salt Lake City, Utah, 84112 USA20School of Informatics, Computing, and Cyber Systems, Northern Arizona University, Flagstaff, Arizona 86001 USA
21Department of Crop and Soil Environmental Sciences, Virginia Polytechnic Institute and State University,Blacksburg, Virginia 24061 USA
22Department of Plant and Soil Sciences, University of Delaware, 531 S College Avenue, Newark, Delaware 19716 USA
Citation: Pearse, W. D., J. Cavender-Bares, S. E. Hobbie, M. L. Avolio, N. Bettez, R. Roy Chowdhury, L. E. Darling, P. M.Groffman, J. M. Grove, S. J. Hall, J. B. Heffernan, J. Learned, C. Neill, K. C. Nelson, D. E. Pataki, B. L. Ruddell, M. K.Steele, and T. L. E. Trammell. 2018. Homogenization of plant diversity, composition, and structure in North Americanurban yards. Ecosphere 9(2):e02105. 10.1002/ecs2.2105
Abstract. Urban ecosystems are widely hypothesized to be more ecologically homogeneous than naturalecosystems. We argue that urban plant communities assemble from a complex mix of horticultural andregional species pools, and evaluate the homogenization hypothesis by comparing cultivated and sponta-neously occurring urban vegetation to natural area vegetation across seven major U.S. cities. There waslimited support for homogenization of urban diversity, as the cultivated and spontaneous yard flora hadgreater numbers of species than natural areas, and cultivated phylogenetic diversity was also greater.However, urban yards showed evidence of homogenization of composition and structure. Yards were com-positionally more similar across regions than were natural areas, and tree density was less variable in yardsthan in comparable natural areas. This homogenization of biodiversity likely reflects similar horticulturalsource pools, homeowner preferences, and management practices across U.S. cities.
Key words: aridity; ecosystem services; functional traits; phylogenetic diversity; plants; urban ecology.
❖ www.esajournals.org 1 February 2018 ❖ Volume 9(2) ❖ Article e02105
Received 16 August 2017; accepted 23 August 2017; final version received 15 December 2017. Corresponding Editor:Debra P. C. Peters.Copyright: © 2018 Pearse et al. This is an open access article under the terms of the Creative Commons AttributionLicense, which permits use, distribution and reproduction in any medium, provided the original work is properly cited.a These authors contributed equally to this manuscript.� E-mail: [email protected]
INTRODUCTION
The majority of humans now live in urban envi-ronments, and both urban area and populationsize are projected to increase (UN 2014), creatinga pressing need to understand ecological pro-cesses within cities. Despite increasing urbaniza-tion, its potential impacts on communityassembly of organisms, biodiversity, and ecosys-tem function are unclear—urban ecosystems werethe least-studied in a recent review of over 11,500assemblages (Newbold et al. 2015). Compound-ing this uncertainty, any urban flora includes bothhuman-cultivated and spontaneously occurring(establishing without human assistance) species,each of which is subject to distinct ecological andhuman influences (Knapp et al. 2012). Althoughthere is evidence of high biodiversity within cities(McKinney 2006, Grimm et al. 2008, Knapp et al.2008, Newbold et al. 2015), few studies have dis-entangled these ecological and human influencesthat drive urban biodiversity. This knowledge gapmakes it difficult to interpret comparisons ofdiversity, both among different urban assem-blages and when comparing urban and naturalassemblages.
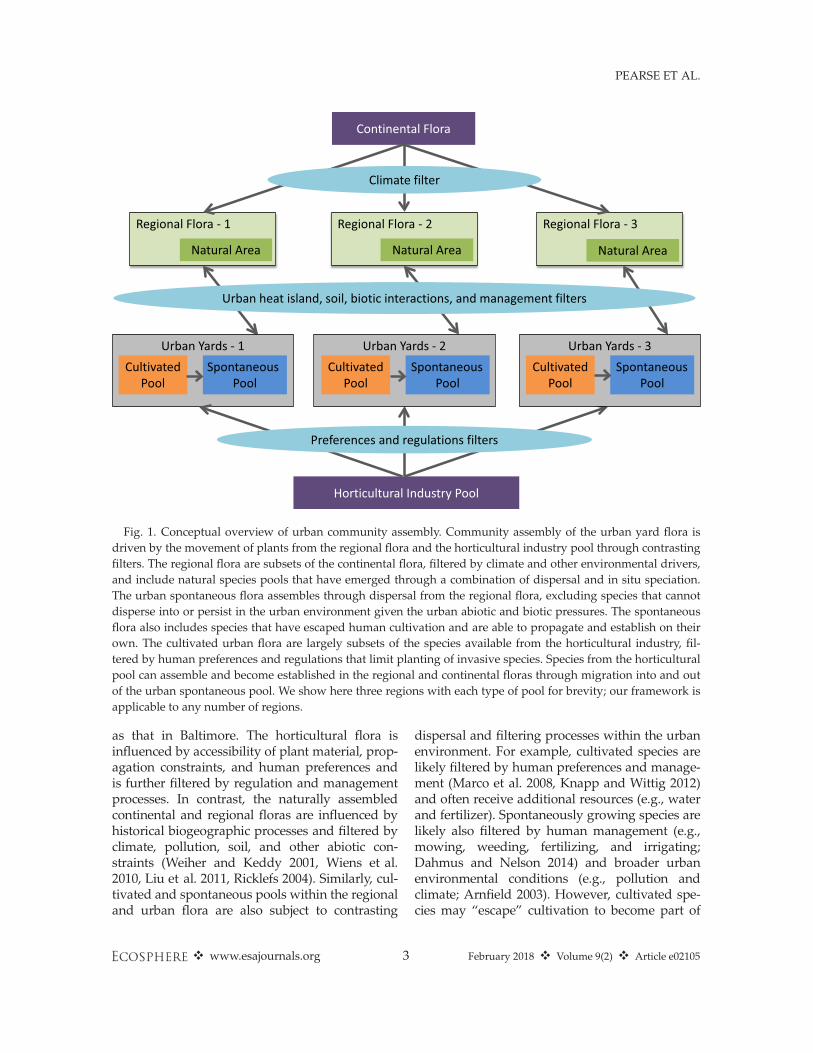
Urban plant communities arise from the ecologi-cal assembly processes that operate in naturalecosystems (e.g., habitat filtering—Mayfield et al.2005, Kraft et al. 2015; and species interactions—HilleRisLambers et al. 2012), as well as humandesires and influences (Aronson et al. 2016, Jener-ette et al. 2016). We propose a conceptual frame-work describing how various filters act on thenatural continental and horticultural industryplant species pools that together constitute thesource pool for the assembly of urban plant com-munities (Fig. 1). We consider a species pool to bethe set of species from which assemblages of agiven habitat type (an urban yard, a beech forest,etc.) are composed. In this manuscript, we treatthe term “flora” as synonymous with “plant spe-cies pool” and consider the “horticultural flora” tobe the species sold by the horticultural industry.
We focus on residential landscapes (i.e., yards),under the assumption that residents have thegreatest agency over, and frequency of interactionswith, their own yards, making yards a dynamicproduct of urban change. Yards are also a majorU.S. land-use type; turf grass (which is only onecomponent of yards) potentially covers an areathree times larger than any irrigated crops (ap-proximately 163,800 km2, or 1.6% of the surfacearea of the United States; Milesi et al. 2005). Weacknowledge that our framework draws strengthfrom a large literature of existing frameworks thatconsider ecological assembly as a series of filtersoperating across different spatial scales (Ricklefs1987, Williams et al. 2009, Vellend 2010, Aronsonet al. 2016). Our presentation differs in its consid-eration of different species pools (species cultivatedby humans in yards, spontaneous species that growin yards without direct human intervention, andspecies in natural areas; see Fig. 1), its considera-tion of different aspects of urban vegetation(Box 1), and its empirical application. We concen-trate on the species pools from which communitiesare assembled, and do not address local processesthat may be operating within communities. Wealso acknowledge that there is variation in com-munity and habitat type within urban environ-ments; while we feel our framework is applicableto many types of such community, in this manu-script we focus on urban yards.The major sources of urban flora are subject to
contrasting ecological filtering processes that wedescribe below, each of which varies with spatialscale and likely by geographic region (Fig. 1). Wedefine a region as a bounded area within whichassemblages containing species from one or moredifferent species pools can be found. Just as spe-cies pool definitions can vary with habitat defini-tions, regions can also vary within defined ranges:It is just as valid to talk of a region surroundingBoston as it is to talk of the continent of NorthAmerica. Species pools change across regions:There is no reason to assume that the horticulturalpool of plants sold in Boston would be the same
❖ www.esajournals.org 2 February 2018 ❖ Volume 9(2) ❖ Article e02105
PEARSE ET AL.
as that in Baltimore. The horticultural flora isinfluenced by accessibility of plant material, prop-agation constraints, and human preferences andis further filtered by regulation and managementprocesses. In contrast, the naturally assembledcontinental and regional floras are influenced byhistorical biogeographic processes and filtered byclimate, pollution, soil, and other abiotic con-straints (Weiher and Keddy 2001, Wiens et al.2010, Liu et al. 2011, Ricklefs 2004). Similarly, cul-tivated and spontaneous pools within the regionaland urban flora are also subject to contrasting
dispersal and filtering processes within the urbanenvironment. For example, cultivated species arelikely filtered by human preferences and manage-ment (Marco et al. 2008, Knapp and Wittig 2012)and often receive additional resources (e.g., waterand fertilizer). Spontaneously growing species arelikely also filtered by human management (e.g.,mowing, weeding, fertilizing, and irrigating;Dahmus and Nelson 2014) and broader urbanenvironmental conditions (e.g., pollution andclimate; Arnfield 2003). However, cultivated spe-cies may “escape” cultivation to become part of
Horticultural Industry Pool
Continental Flora
Regional Flora - 1
Natural Area
Regional Flora - 2
Natural Area
Regional Flora - 3
Natural Area
Climate filter
Urban Yards - 1Spontaneous
PoolCultivated
Pool
Urban heat island, soil, biotic interactions, and management filters
Preferences and regulations filters
Urban Yards - 2Spontaneous
PoolCultivated
Pool
Urban Yards - 3Spontaneous
PoolCultivated
Pool
Fig. 1. Conceptual overview of urban community assembly. Community assembly of the urban yard flora isdriven by the movement of plants from the regional flora and the horticultural industry pool through contrastingfilters. The regional flora are subsets of the continental flora, filtered by climate and other environmental drivers,and include natural species pools that have emerged through a combination of dispersal and in situ speciation.The urban spontaneous flora assembles through dispersal from the regional flora, excluding species that cannotdisperse into or persist in the urban environment given the urban abiotic and biotic pressures. The spontaneousflora also includes species that have escaped human cultivation and are able to propagate and establish on theirown. The cultivated urban flora are largely subsets of the species available from the horticultural industry, fil-tered by human preferences and regulations that limit planting of invasive species. Species from the horticulturalpool can assemble and become established in the regional and continental floras through migration into and outof the urban spontaneous pool. We show here three regions with each type of pool for brevity; our framework isapplicable to any number of regions.
❖ www.esajournals.org 3 February 2018 ❖ Volume 9(2) ❖ Article e02105
PEARSE ET AL.

Box 1.
Homogenization hypotheses
Understanding urban vegetation in the context of surrounding natural areas requires an understanding of the dif-ferent filters and processes that affect the assembly of cultivated and spontaneous species (Fig. 1). Below, we examinethree components of urban vegetation—diversity, composition, and structure—and hypothesize how each might varyacross the species pools we outline in our framework (Fig. 1). The major cities of North America span broad environ-mental gradients of temperature, precipitation, light availability, and many other factors. We focus here on waterstress (aridity), which is a major axis across which our seven cities are relatively evenly spread. Moreover, it can bequantified as a composite of both temperature and precipitation (Materials and methods), unifying two major axes ofvariation in one biologically meaningful variable. There is some empirical evidence that human irrigation patternsare homogenized across the United States (Polsky et al. 2014), making aridity an environmental gradient acrosswhich homeowners may have now homogenized conditions with respect to original natural areas.
DiversityHuman transport and management (e.g., irrigation) of vegetation enables cultivated species to overcome natural
dispersal and establishment barriers, such that we expect the species richness of the cultivated pool to be higher thanthat of urban spontaneous or nearby natural pools. Plant species richness of all species pools should positively corre-late with moisture availability, consistent with well-established relationships between species richness and climate(Currie 1991, Wiens and Donoghue 2004, Fine 2015). If regions show homogenized diversity, we would expect metricsof diversity such as species richness to be the same among regions (compare with homogenization of composition,below). If humans prefer variation and can irrigate to overcome water limitation, we might expect the cultivation of awide diversity of plant lineages to increase phylogenetic diversity in cultivated pools. Were humans cultivating a morelimited subset of the phylogeny of plants throughout urban areas in comparison with natural areas, this would repre-sent a form of phylogenetic homogenization (i.e., metrics of phylogenetic diversity would be the same).
CompositionIf climate is a strong filter on the composition of spontaneous and natural area species pools, we would expect
the species and phylogenetic clades of pools to vary across regions. Within regions, however, these pools are drawnfrom the regional flora and are subject to the same (or similar) climate filters, so we expect some compositional sim-ilarity within regions. By contrast, if human preferences, transport, or management (e.g., irrigation) relaxes the con-straints imposed by climate and dispersal barriers, we expect cultivated pools to be homogenized: They should bemore similar to one another among regions than the spontaneous or natural area pools. Thus, we predict thathuman preferences and management decisions should lead to greater similarity among cultivated species pools.We expect the spontaneous pool to be intermediate in composition (measured through the Sørensen and Phy-losørensen indices; Dice 1945, Sørensen 1948, Bryant et al. 2008) to the cultivated and natural pools if it receivespropagules from both pools and/or facilitates dispersal between the cultivated pool and the natural areas pool.
StructureGiven similar human preferences (e.g., for savanna-like yards; Balling and Falk 1982, Orians and Heerwagen 1992,
Falk and Balling 2009) and management to mitigate climatic constraints (e.g., irrigation), we expect cultivated poolsto have similar structures—as measured by tree height and density—across regions. By contrast, we suggest climatefilters will lead to divergence in the structure of natural area pools, with taller trees and greater tree density in wetterregions. Spontaneous pools could be intermediate between natural and cultivated pools if species are being activelyexchanged between them. Lower variance in structural attributes (greater structural similarity) among cultivated andspontaneous pools compared to natural pools would suggest less variation in urban vegetation structure and repre-sent a form of homogenization. Urban pools may also deviate from natural pools due to management practices. Forexample, we might expect to find plants with smaller, thicker, and more lobed leaves in the natural species pool inarid climates, but watering in urban yards could cause a deviation from this pattern, such that the flora in urbanyards is more similar across cities than the natural vegetation. Smaller leaf surface area is associated with arid envi-ronments because of the reduced evaporation and water loss associated with small leaves. A higher perimeter perarea would be expected in warmer climates because it is associated with either smaller leaves or more lobed leaves,both of which reduce boundary layer resistance and allowmore rapid leaf cooling (Sack et al. 2003).
We consider species’ functional traits to be structural, not compositional, characteristics of assemblages in thismanuscript. This is because there are many species (and phylogenetic clades) with the same functional traits, suchthat yards with different species compositions could have the same aggregate functional traits. Thus, there is not aunique mapping of trait structure onto species composition. In order to maximize consistency within structural cat-egories, we therefore designate functional traits as aspects of structure.
❖ www.esajournals.org 4 February 2018 ❖ Volume 9(2) ❖ Article e02105
PEARSE ET AL.

spontaneous urban, and surrounding natural,areas, and thus join the wider regional speciespool (Mack and Lonsdale 2001, Knapp et al.2008). Natural areas surrounding cities are thusmixed assemblages derived from these separatespecies pools and the interactions between them.
Urban areas are frequently described as homog-enized (i.e., urban areas in different regions aremore similar to each other than the natural areasthat they replace; K€uhn and Klotz 2006, McKin-ney 2006, Grimm et al. 2008, Lososov�a et al.2012, Ricotta et al. 2012b, Groffman et al. 2014),and it is widely accepted that urban species rich-ness is often higher than that in natural areas(Py�sek 1993, K€uhn et al. 2004, Pautasso 2007,Grimm et al. 2008). Yet there are many compo-nents to urban biodiversity besides species rich-ness (Purvis and Hector 2000), and it is unclearwhich of these components are subject to homog-enizing pressures, what factors contribute to suchpressures, and how we might define homoge-nization empirically. We consider three potentialaspects of urban vegetation that might exhibithomogenization—diversity, composition, and struc-ture—and hypothesize how urbanization mightinfluence these different aspects for both the culti-vated and spontaneous species pools (see alsoBox 1). In describing homogenization, we focuson urban cultivated and spontaneous speciespools in relation to natural area pools. Homoge-nization might be seen as a reduction in the num-ber of lineages represented in urban areas, moresimilar species compositions, or lesser variationacross urban areas in structural aspects of thevegetation such as overall density and height ofvegetation. Contrasting urban and natural speciespools is key to our framework: The extent of simi-larity among natural systems reflects natural cli-matic, ecological, and biogeographic processes,and it is critical to test whether urban systemsshow greater similarity than expected given thesefactors. Natural assemblages vary along bothmicro- and macro-scale environmental gradients(Levin 1992, Chave 2013); any response to gradi-ents (or lack thereof) within urban systemsshould therefore be placed within the context ofcomparable surveys of the surrounding vegeta-tion (see Box 1 for specific hypotheses).
Here, we present results from a survey ofurban plant diversity, composition, and structurein residential parcels (yards) in seven major U.S.
cities (Boston, Baltimore, Los Angeles, Miami,Minneapolis–St. Paul, Salt Lake City, and Phoe-nix). Our survey covered broad environmentalgradients and included comparable natural refer-ence sites, permitting us to compare natural area,spontaneous, and cultivated species pools inurban yards. By empirically evaluating ourframework, we shed light on the human contri-butions to ecological assembly processes inurban systems that influence biodiversity andecosystem function.
MATERIALS AND METHODS
The work described here was a component of acollaborative research project addressing the eco-logical homogenization of America (Groffmanet al. 2014, Polsky et al. 2014, Trammell et al.2016). Within each of seven major U.S. metropoli-tan areas (Boston, Baltimore, Los Angeles, Miami,Minneapolis–St. Paul, Salt Lake City, and Phoe-nix), we identified 21–30 urban household yardsand 3–6 natural area sites. Each of these majorU.S. cities, and the sites sampled surroundingthem form a region in our study. To select yardsfor study, we used PRISM and CLARITAS data toidentify households occupied by single families,with front and back yards, and owned by some-one over the age of 18. Of these, 9480 householdsagreed to participate in a related study (Polskyet al. 2014), and of the 5797 who agreed to takepart in a follow-up, we randomly selected partici-pants to take part in this study (see Hall et al.2016 for more details). The rationale underlyingthe selection of natural sites is outlined in Table 1.Within each metropolitan area, we collected thevegetation (species presence/absence), tree struc-tural trait, and leaf functional trait datasets asdescribed below. All software packages describedbelow are R (v3.2.2; R Core Team 2015) packagesunless otherwise stated.
Vegetation (species presence/absence) dataAn exhaustive presence/absence survey was
conducted in the yard of each household. Theentire area of each yard was surveyed exceptwhere there was an unmanaged vegetation orwoodland/woodlot component, which was sam-pled with a 2 m wide transect across the full yardor 100 m, whichever was shorter. Species weredesignated as spontaneous or cultivated based
❖ www.esajournals.org 5 February 2018 ❖ Volume 9(2) ❖ Article e02105
PEARSE ET AL.
on homeowner interviews and observations ofplacement; a given species could be documentedas both spontaneous and cultivated if differentindividuals of that species fell into different cate-gories (this is to be expected if, as Fig. 1 shows,species are exchanged between pools). Land useand land-use history were considered in the des-ignation. For example, species in woodlots andunmanaged parts of yards were generally con-sidered spontaneous.
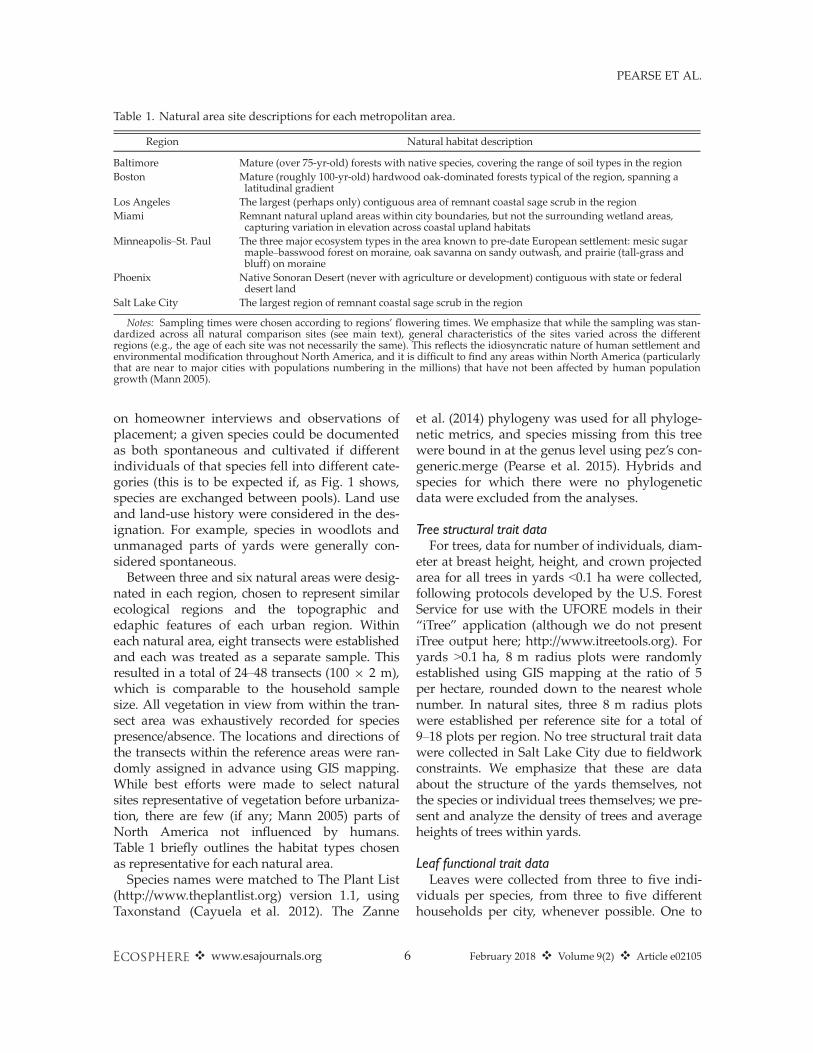
Between three and six natural areas were desig-nated in each region, chosen to represent similarecological regions and the topographic andedaphic features of each urban region. Withineach natural area, eight transects were establishedand each was treated as a separate sample. Thisresulted in a total of 24–48 transects (100 9 2 m),which is comparable to the household samplesize. All vegetation in view from within the tran-sect area was exhaustively recorded for speciespresence/absence. The locations and directions ofthe transects within the reference areas were ran-domly assigned in advance using GIS mapping.While best efforts were made to select naturalsites representative of vegetation before urbaniza-tion, there are few (if any; Mann 2005) parts ofNorth America not influenced by humans.Table 1 briefly outlines the habitat types chosenas representative for each natural area.
Species names were matched to The Plant List(http://www.theplantlist.org) version 1.1, usingTaxonstand (Cayuela et al. 2012). The Zanne
et al. (2014) phylogeny was used for all phyloge-netic metrics, and species missing from this treewere bound in at the genus level using pez’s con-generic.merge (Pearse et al. 2015). Hybrids andspecies for which there were no phylogeneticdata were excluded from the analyses.
Tree structural trait dataFor trees, data for number of individuals, diam-
eter at breast height, height, and crown projectedarea for all trees in yards <0.1 ha were collected,following protocols developed by the U.S. ForestService for use with the UFORE models in their“iTree” application (although we do not presentiTree output here; http://www.itreetools.org). Foryards >0.1 ha, 8 m radius plots were randomlyestablished using GIS mapping at the ratio of 5per hectare, rounded down to the nearest wholenumber. In natural sites, three 8 m radius plotswere established per reference site for a total of9–18 plots per region. No tree structural trait datawere collected in Salt Lake City due to fieldworkconstraints. We emphasize that these are dataabout the structure of the yards themselves, notthe species or individual trees themselves; we pre-sent and analyze the density of trees and averageheights of trees within yards.
Leaf functional trait dataLeaves were collected from three to five indi-
viduals per species, from three to five differenthouseholds per city, whenever possible. One to
Table 1. Natural area site descriptions for each metropolitan area.
Region Natural habitat description
Baltimore Mature (over 75-yr-old) forests with native species, covering the range of soil types in the regionBoston Mature (roughly 100-yr-old) hardwood oak-dominated forests typical of the region, spanning a
latitudinal gradientLos Angeles The largest (perhaps only) contiguous area of remnant coastal sage scrub in the regionMiami Remnant natural upland areas within city boundaries, but not the surrounding wetland areas,
capturing variation in elevation across coastal upland habitatsMinneapolis–St. Paul The three major ecosystem types in the area known to pre-date European settlement: mesic sugar
maple–basswood forest on moraine, oak savanna on sandy outwash, and prairie (tall-grass andbluff) on moraine
Phoenix Native Sonoran Desert (never with agriculture or development) contiguous with state or federaldesert land
Salt Lake City The largest region of remnant coastal sage scrub in the region
Notes: Sampling times were chosen according to regions’ flowering times. We emphasize that while the sampling was stan-dardized across all natural comparison sites (see main text), general characteristics of the sites varied across the differentregions (e.g., the age of each site was not necessarily the same). This reflects the idiosyncratic nature of human settlement andenvironmental modification throughout North America, and it is difficult to find any areas within North America (particularlythat are near to major cities with populations numbering in the millions) that have not been affected by human populationgrowth (Mann 2005).
❖ www.esajournals.org 6 February 2018 ❖ Volume 9(2) ❖ Article e02105
PEARSE ET AL.
three leaves were collected per individual,depending on the size of the plant. Sun leaveswere collected, if possible. All new speciesencountered in the reference sites were sampled;leaves were collected for three to five individualsper species across all reference sites, if possible.Leaves from a single individual were placed in acoin envelope placed on cardboard spacers fas-tened with rubber bands to press the leaves flatand absorb moisture prior to shipping to theUniversity of Minnesota. No leaf functional traitdata were collected in Salt Lake City due to field-work constraints; samples were collected inPhoenix, but were damaged in transit and couldnot be analyzed.
We developed a Python and R pipeline (stalk-less; http://willpearse.github.io/stalkless) to recordindividual leaf surface area, perimeter length, andleaf compactness (perimeter2/area). Briefly, wesegmented the individual leaves present withineach scanned image, identifying darker areas asobjects (in this case leaves) with reference to themean intensity of the image plus twice the stan-dard deviation of the image’s intensity. Using R,candidate leaf images containing too much back-ground noise or other objects in the scanner wereremoved by checking the dimensions of theimages. A preliminary Fourier analysis (usingeFourier in Momocs; Bonhomme et al. 2014) iso-lated remaining non-leaf images, grouping themtogether in a hierarchical cluster analysis of aEuclidean distance matrix of the Fourier parame-ters. We manually checked, verified, and super-vised this process, which all stalkless users arestrongly encouraged to do. These steps left uswith images of 8908 leaves from 754 species (outof a total 2224 in the dataset) for the final analysis.
Statistical analysisWe conducted separate analyses of diversity,
composition, and structure. For all analyses, weignored abundances in sampled assemblages andtreated a species as present in a pool if it wasrecorded at least once in an assemblage associatedwith that pool type. Our seven cities lie along amajor aridity gradient throughout continentalNorth America. To quantify this gradient, PalmerDrought Severity Index (PDSI) data were down-loaded from the National Centers for Environmen-tal Information (Vose et al. 2014) for each state; themean of the monthly values for each state across
the period January 2000–December 2012 was usedas an index of long-term climatic conditions in thebroad regions within which the assembly of ourspecies pools took place. Palmer Drought SeverityIndex is a composite temperature–precipitationindex that assesses how arid a particular region is;negative values indicate drier conditions (drought)and larger positive values wetter conditions. Ouranalysis is focused on broad species pools, not par-ticular assemblages, and as such, we make use ofenvironmental data averaged across each regionin order to better account for the general patternswithin a region. We use human-defined stateboundaries, not uniformly sized regions centeredon each set of sampled regions, because our analy-sis is focused around understanding variation inenvironments created by humans in comparisonwith natural regions. We note, however, that pre-liminary investigations found no qualitative differ-ence in the environmental values calculated foreach region depending upon different ways ofmeasuring study area.Diversity.—Species richness and phylogenetic
diversity (mean phylogenetic distance; MPD)were calculated for each pool using picante(Kembel et al. 2010). We regressed the diversitymetrics against aridity (as indicated by PDSI) ineach city, using mixed-effects models where thearidity gradient and habitat pool were fixedeffects and region was a random effect (usinglme4 and lmerTest; Bates and Maechler 2010,Kuznetsova et al. 2016). To test for differences inthe variation of the diversity metrics within poolsamong regions, we used Levene’s tests as imple-mented in car (Fox and Weisberg 2011).Composition.—We calculated the Sørensen’s
index of species compositional difference (usingvegan; Oksanen et al. 2013) and the Phylosør-ensen’s metric of phylogenetic distance (also usingpicante; Bryant et al. 2008, Kembel et al. 2010) forall the parcels. We modeled the Sørensen’s dis-tances among all pools as a function of whetherthose pools were of the same type (e.g., sponta-neous vs. cultivated) or region (e.g., Boston vs.Phoenix). We then performed a non-metric multi-dimensional scaling analysis to visualize distancesamong the pools (constrained to two dimensions,also using vegan; Oksanen et al. 2013).Structure.—We analyzed four structural metrics:
tree height, tree density (total number of treesdivided by vegetative parcel area), leaf surface
❖ www.esajournals.org 7 February 2018 ❖ Volume 9(2) ❖ Article e02105
PEARSE ET AL.

area, and leaf perimeter:area (log10-transformed).We obtained medians of each of the structuralattribute either across all parcels in which a partic-ular species pool was measured (for tree densityand height) or across all individuals measured (forleaf surface area and perimeter:area). We then trea-ted and analyzed these pool-level aggregates inexactly the same way as we analyzed the diversitymetrics above. For the purposes of our tree struc-tural metrics, we treated all trees in urban areas ascultivated (i.e., none were spontaneous).
RESULTS
DiversityIn support of our hypothesis (Box 1), species
richness was greater in the cultivated pool than inthe spontaneous pool, and the spontaneous poolhad higher species richness than the natural areapool (Fig. 2a, c). In partial support of our hypoth-esis, both the spontaneous and cultivated poolshad higher species richness in the less aridregions, while richness of the natural species poolremained constant across regions (Fig. 2a). Therewas no evidence of homogenization of speciesrichness across regions: Species richness was noless variable among cities for the cultivated andspontaneous species in yards than for the naturalarea species. Despite higher species richness ofcultivated species in yards, phylogenetic diversity(MPD) was greater in the cultivated pool (Fig. 2c,d), although it did not vary across the aridity gra-dient (Fig. 2b). Thus, species in the cultivatedpools appear to be drawn from more lineagesthan species in the natural areas. Full statisticalsupport for these trends is given in Appendix S1.
CompositionIn support of our hypotheses (Box 1), species
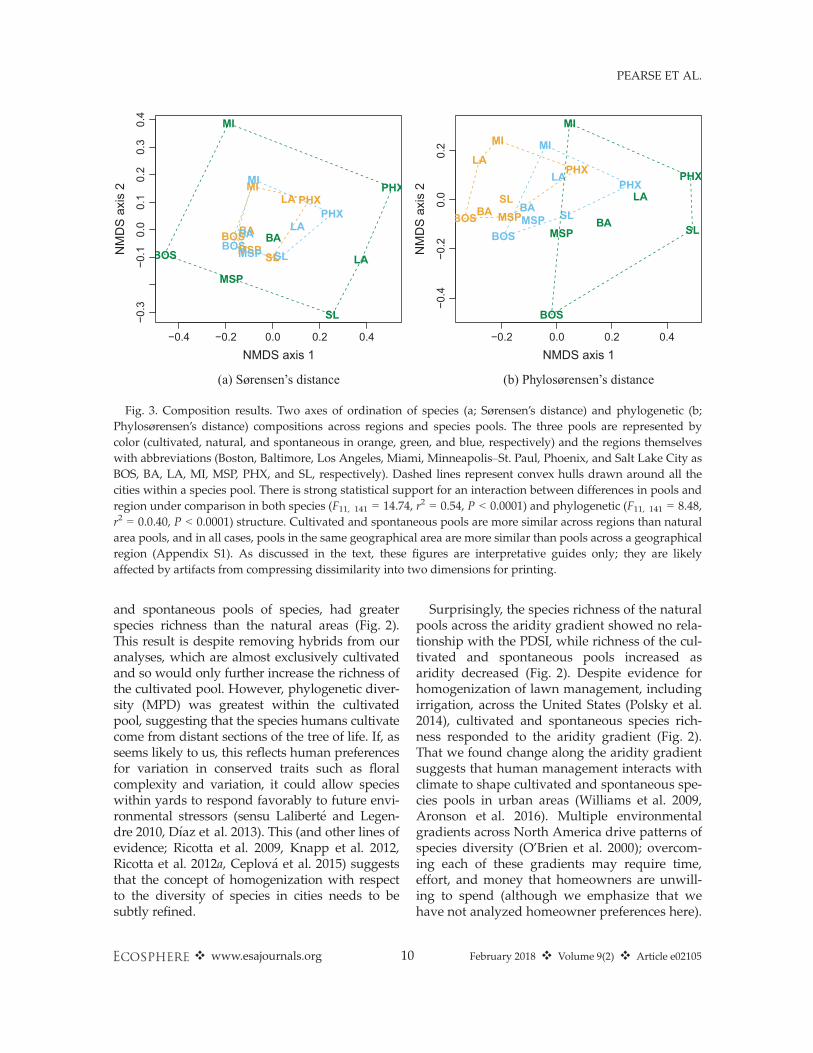
and phylogenetic composition of the cultivatedand spontaneous species in yards were moresimilar across regions than in the natural areapools (Fig. 3), which is evidence of compositionalhomogenization in urban yards.
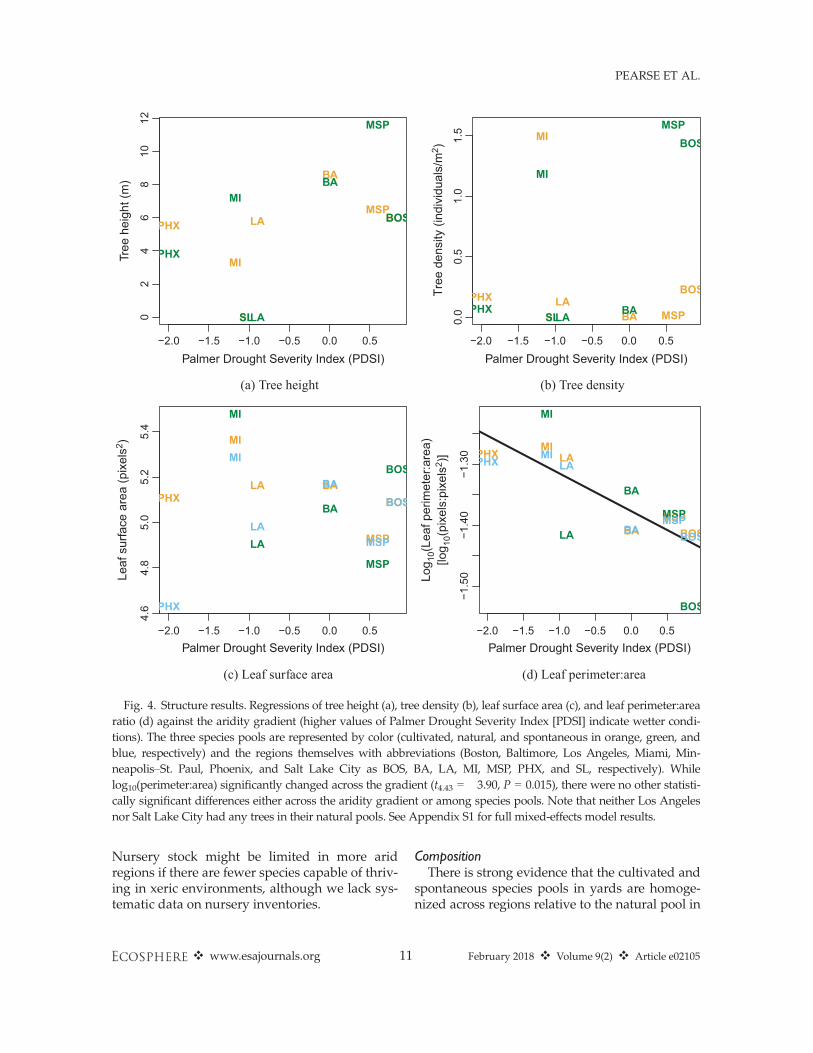
StructureAs expected, the ratio of leaf perimeter to sur-
face area significantly decreased across the PDSIgradient (higher ratios at lower, drier values ofthe index; Fig. 4). There was no significant inter-action between species pool and PDSI in overall
perimeter:area, suggesting both cultivated andnatural species responded to the aridity gradientsimilarly. However, in contrast to our hypotheses(Box 1), no other structural metrics (tree height,density, and leaf surface area) varied across thePDSI gradient (Fig. 4). Equally, there were nosignificant differences in variance in the struc-tural metrics between habitat pools (Fig. 5).However, in the natural surroundings of SaltLake City and Los Angeles there were no treeswhatsoever and there were very few trees in nat-ural areas around Phoenix, while yards in theseregions had tree densities greater than zero.Thus, yards are qualitatively more similar in treedensity across regions than natural areas, evi-dence of homogenization of vegetation structure.
DISCUSSION
Urban plant assemblages are typically describedas similar to one another, or “homogenized”(McKinney 2006, Grimm et al. 2008, Groffmanet al. 2014). Taking a species pool-based approachto plant diversity, we have confirmed that thecomposition of cultivated and, to a lesser degree,spontaneous urban plants is more similar amongurban areas than among comparable natural ref-erence areas. Despite this, cultivated species aremore phylogenetically distant to each other thannatural area species. Finally, tree density has atendency to be more similar in yards than in nat-ural areas across regions. However, despite man-agement actions such as irrigation, aspects ofplant structure (perimeter:area) in urban areascan vary across an aridity gradient, and, as mea-sured by leaf surface area (a structural metric),natural and urban plant pools are indistinguish-able. Below we discuss these results, and arguethat by distinguishing among plant diversity,structure, and composition, both variation andhomogenization can be detected within NorthAmerican urban flora. We emphasize, however,that our empirical results are based on data col-lected within urban yards, and not other habitatsor land-use categories within cities (and not, e.g.,urban forests; sensu Nock et al. 2013).
DiversityConsistent with other studies (reviewed in Pick-
ett et al. 2001, Grimm et al. 2008), we found thaturban vegetation, in terms of both the cultivated
❖ www.esajournals.org 8 February 2018 ❖ Volume 9(2) ❖ Article e02105
PEARSE ET AL.

−2.0 −1.5 −1.0 −0.5 0.0 0.5
200
400
600
800
Palmer Drought Severity Index (PDSI)
Spe
cies
rich
ness
BA
BA
BA
BOS
BOS
BOSLA
LA
LA
MI
MIMI
MSP
MSP
MSPPHX
PHXPHX
SL
SL
SL
(a) Species richness
−2.0 −1.5 −1.0 −0.5 0.0 0.5
340
360
380
400
420
440
Palmer Drought Severity Index (PDSI)
MP
D
BA
BA
BA
BOSBOSBOS
LA
LA
LAMIMI
MI
MSP
MSP
MSP
PHX
PHXPHX
SL
SL
SL
(b) Mean Phylogenetic Distance
Cultivated Spontaneous Natural
200
400
600
800
Spe
cies
rich
ness
(c) Species richness (boxplot)
Cultivated Spontaneous Natural
340
360
380
400
420
440
MP
D
(d) Mean Phylogenetic Distance (boxplot)
Fig. 2. Diversity results. Regressions of species richness (a; number of species) and mean phylogenetic distance(MPD; b) against the aridity gradient (higher values of Palmer Drought Severity Index [PDSI] indicate wetterconditions). The three species pools are represented by color (cultivated species in yards, natural area species,and spontaneous species in yards in orange, green, and blue, respectively) and the regions themselves withabbreviations (Boston, Baltimore, Los Angeles, Miami, Minneapolis–St. Paul, Phoenix, and Salt Lake City as BOS,BA, LA, MI, MSP, PHX, and SL, respectively). There is support for significant differences in species richnessamong the three pools (t9.986 = 46.50, P ≤ 0.0001), and a significantly different response to the aridity gradient inthe natural pool compared to the cultivated and spontaneous pools (t9.986 = �2.83, P = 0.012). There was no sup-port for change in MPD across the aridity gradient (t8.72 = �0.154, P = 0.88), but MPD was significantly higher inthe cultivated pool (t12.00 = �2.86, P = 0.014). Full mixed-effects model results are given in Appendix S1. Box-plots of the distributions of species richness (c) and MPD (d) in the three habitat pools (cultivated, natural, andspontaneous). The whiskers on the boxplots represent the limits of the data and the boxes the inter-quartilerange. There is no evidence for differences in variance across the species pools in species richness (Levene’s testF2,18 = 1.71, P = 0.21) or MPD F2,18 = 0.03, P = 0.98). Apparent differences in variance in the figure are likelydriven by non-normality of the data, which the Levene’s test is not sensitive to.
❖ www.esajournals.org 9 February 2018 ❖ Volume 9(2) ❖ Article e02105
PEARSE ET AL.
and spontaneous pools of species, had greaterspecies richness than the natural areas (Fig. 2).This result is despite removing hybrids from ouranalyses, which are almost exclusively cultivatedand so would only further increase the richness ofthe cultivated pool. However, phylogenetic diver-sity (MPD) was greatest within the cultivatedpool, suggesting that the species humans cultivatecome from distant sections of the tree of life. If, asseems likely to us, this reflects human preferencesfor variation in conserved traits such as floralcomplexity and variation, it could allow specieswithin yards to respond favorably to future envi-ronmental stressors (sensu Lalibert�e and Legen-dre 2010, D�ıaz et al. 2013). This (and other lines ofevidence; Ricotta et al. 2009, Knapp et al. 2012,Ricotta et al. 2012a, Ceplov�a et al. 2015) suggeststhat the concept of homogenization with respectto the diversity of species in cities needs to besubtly refined.
Surprisingly, the species richness of the naturalpools across the aridity gradient showed no rela-tionship with the PDSI, while richness of the cul-tivated and spontaneous pools increased asaridity decreased (Fig. 2). Despite evidence forhomogenization of lawn management, includingirrigation, across the United States (Polsky et al.2014), cultivated and spontaneous species rich-ness responded to the aridity gradient (Fig. 2).That we found change along the aridity gradientsuggests that human management interacts withclimate to shape cultivated and spontaneous spe-cies pools in urban areas (Williams et al. 2009,Aronson et al. 2016). Multiple environmentalgradients across North America drive patterns ofspecies diversity (O’Brien et al. 2000); overcom-ing each of these gradients may require time,effort, and money that homeowners are unwill-ing to spend (although we emphasize that wehave not analyzed homeowner preferences here).
−0.4 −0.2 0.0 0.2 0.4
−0.3
−0.1
0.0
0.1
0.2
0.3
0.4
NMDS axis 1
NM
DS
axi
s 2
BA BABABOSBOS
BOS
MI
MI
MI
LA
LA
LA
MSP
MSP
MSP
PHXPHX
PHX
SL
SL
SL
(a) Sørensen’s distance
−0.2 0.0 0.2 0.4
−0.4
−0.2
0.0
0.2
NMDS axis 1
NM
DS
axi
s 2
BABA
BABOS
BOS
BOS
MIMI
MILA
LA
LA
MSPMSP
MSP
PHX PHXPHX
SL
SLSL
(b) Phylosørensen’s distance
Fig. 3. Composition results. Two axes of ordination of species (a; Sørensen’s distance) and phylogenetic (b;Phylosørensen’s distance) compositions across regions and species pools. The three pools are represented bycolor (cultivated, natural, and spontaneous in orange, green, and blue, respectively) and the regions themselveswith abbreviations (Boston, Baltimore, Los Angeles, Miami, Minneapolis–St. Paul, Phoenix, and Salt Lake City asBOS, BA, LA, MI, MSP, PHX, and SL, respectively). Dashed lines represent convex hulls drawn around all thecities within a species pool. There is strong statistical support for an interaction between differences in pools andregion under comparison in both species (F11, 141 = 14.74, r2 = 0.54, P < 0.0001) and phylogenetic (F11, 141 = 8.48,r2 = 0.0.40, P < 0.0001) structure. Cultivated and spontaneous pools are more similar across regions than naturalarea pools, and in all cases, pools in the same geographical area are more similar than pools across a geographicalregion (Appendix S1). As discussed in the text, these figures are interpretative guides only; they are likelyaffected by artifacts from compressing dissimilarity into two dimensions for printing.
❖ www.esajournals.org 10 February 2018 ❖ Volume 9(2) ❖ Article e02105
PEARSE ET AL.
Nursery stock might be limited in more aridregions if there are fewer species capable of thriv-ing in xeric environments, although we lack sys-tematic data on nursery inventories.
CompositionThere is strong evidence that the cultivated and
spontaneous species pools in yards are homoge-nized across regions relative to the natural pool in
−2.0 −1.5 −1.0 −0.5 0.0 0.5
02
46
810
12
Palmer Drought Severity Index (PDSI)
Tree
hei
ght (
m) BABA
BOSBOSLA
LA
MI
MIMSP
MSP
PHX
PHX
SLSL
(a) Tree height
−2.0 −1.5 −1.0 −0.5 0.0 0.5
0.0
0.5
1.0
1.5
Palmer Drought Severity Index (PDSI)
Tree
den
sity
(ind
ivid
uals
/m2 )
BABA
BOS
BOS
LALA
MI
MI
MSP
MSP
PHXPHX
SLSL
(b) Tree density
−2.0 −1.5 −1.0 −0.5 0.0 0.5
4.6
4.8
5.0
5.2
5.4
Palmer Drought Severity Index (PDSI)
Leaf
sur
face
are
a (p
ixel
s2 )
BA
BA
BABOS
BOS
BOSLA
LALA
MI
MI
MI
MSP
MSP
MSP
PHX
PHX
(c) Leaf surface area
−2.0 −1.5 −1.0 −0.5 0.0 0.5
−1.5
0−1
.40
−1.3
0
Palmer Drought Severity Index (PDSI)
Log 10
(Lea
f per
imet
er:a
rea)
[log 10
(pix
els:
pixe
ls2 )
]
BA
BA
BA BOS
BOS
BOS
LA
LA
LA
MI
MI
MI
MSPMSPMSP
PHXPHX
(d) Leaf perimeter:area
Fig. 4. Structure results. Regressions of tree height (a), tree density (b), leaf surface area (c), and leaf perimeter:arearatio (d) against the aridity gradient (higher values of Palmer Drought Severity Index [PDSI] indicate wetter condi-tions). The three species pools are represented by color (cultivated, natural, and spontaneous in orange, green, andblue, respectively) and the regions themselves with abbreviations (Boston, Baltimore, Los Angeles, Miami, Min-neapolis–St. Paul, Phoenix, and Salt Lake City as BOS, BA, LA, MI, MSP, PHX, and SL, respectively). Whilelog10(perimeter:area) significantly changed across the gradient (t4.43 = �3.90, P = 0.015), there were no other statisti-cally significant differences either across the aridity gradient or among species pools. Note that neither Los Angelesnor Salt Lake City had any trees in their natural pools. See Appendix S1 for full mixed-effects model results.
❖ www.esajournals.org 11 February 2018 ❖ Volume 9(2) ❖ Article e02105
PEARSE ET AL.

terms of both species and phylogenetic composi-tion (Fig. 3), supporting the claim that specieswithin cities are similar (McKinney 2006, Grimmet al. 2008, Aronson et al. 2014). Our exclusion ofhybrids (almost all of which were cultivated inour data) likely makes this result conservative:There may be even greater homogenizationthan we report here. For the cultivated pools,this homogenization might arise because plant
nurseries offer a similar suite of species across thecountry, resulting in a homogeneous source pool,or because of similar human preferences acrossregions. For the spontaneous pool, homogeniza-tion might result from similar filtering processesimposed by cities across regions, such as mowing,irrigation, and the urban heat island effect. Inter-estingly, the cultivated and spontaneous poolswithin the same region were similar to each other
Cultivated Natural
02
46
810
12
Tree
hei
ght (
m)
(a) Tree height
Cultivated Natural
0.0
0.5
1.0
1.5
Tree
den
sity
(ind
ivid
uals
/m2 )
(b) Tree density
Cultivated Spontaneous Natural
4.6
4.8
5.0
5.2
5.4
Leaf
sur
face
are
a (p
ixel
s2)
(c) Leaf surface area
Cultivated Spontaneous Natural
−1.5
0−1
.40
−1.3
0
Log 1
0(Le
af p
erim
eter
:are
a)[lo
g 10(
pixe
ls:p
ixel
s2)]
(d) Leaf perimeter:area
Fig. 5. Structure—variance results. Boxplots of tree height (a), tree density (b), leaf surface area (c), and leafperimeter:area ratio (d) for the three species pools (cultivated, natural, and spontaneous). The whiskers on theboxplots represent the limits of the data and the boxes the inter-quartile range. Note that, as discussed in themain text, there are no tree structural metrics for the spontaneous pool. There is no statistical support for unequalvariances in any of these variables (all Levene’s test F1,12 < 1.71, P > 0.20). We note that the full distributions ofthese data and statistical analysis of differences in mean are given in Fig. 4.
❖ www.esajournals.org 12 February 2018 ❖ Volume 9(2) ❖ Article e02105
PEARSE ET AL.
(Fig. 3), perhaps reflecting the influence of filter-ing by the extreme climate variation acrossregions and possibly the escape of cultivated spe-cies into the spontaneous pool within cities. Weemphasize that, of course, there are many ecologi-cal processes that could lead to the empirical pat-terns we have found. More fundamentally, theseresults reflect the reality of the urban compositionof North America: in part homogenized, in partregionally variable, as a consequence of both envi-ronmental filtering processes (driven by factorssuch as aridity) and human preferences.
That the cultivated and spontaneous poolsshowed compositional similarity to other urbanareas and nearby natural areas implies a dis-assembly of natural ecosystems into hybrid ecosys-tems (Hobbs et al. 2009, Kowarik 2011): ecosys-tems containing some exotic and some naturalspecies. The predominant pattern of plant speciescomposition in North American cities is perhaps amixture of the previously unique and indepen-dent natural habitat pools surrounding urbanareas. Such mixing has profound implications forspecies’ future evolution by breaking down exist-ing species associations (essentially invasionalmeltdown; Simberloff and Von Holle 1999) andincreasing diffuse interactions, thus making theevolution of density-dependent competitive inter-actions and Janzen-Connell effects difficult (orimpossible; Zillio et al. 2005, Hubbell 2008). Suchhyper-diverse mixtures could therefore alter theecosystem services provided by species (beyondthe tree cover we measured in this study), interms of both their kind and their stability. Fur-ther, it is important to emphasize that our studydoes not examine plant assemblages, but ratherspecies pools from which assemblages are assem-bled. It is possible that the patterns we describehere could be stronger when species’ abundanceswithin assemblages are examined, and a deeperunderstanding of the interplay of density-dependent interactions would require such data.
StructureThe lack of statistically significant differences in
the means and variances in tree density and heightacross natural and cultivated pools is, we argue, aproduct of quantitatively incomparable data. Thethree cities surrounded by desert (Phoenix, SaltLake City, and Los Angeles) all had tree densitiesat or very nearly zero trees per hectare in natural
areas, whereas trees were common in yards inthese regions. We suggest that the placement oftrees in urban areas surrounded by desert is suffi-cient to argue for a homogenization of tree densityin our dataset. We also suggest our comparativelysmall sample size of cities (necessary given thescale of fieldwork required to survey majormetropolitan areas) means we have reduced sta-tistical power. Thus, we argue that these resultsreflect homogenization of urban vegetation on thebasis of properties such as tree cover that stake-holders perceive to regulate ecosystem services(e.g., climate regulation and aesthetics; Avolioet al. 2015, Larson et al. 2016). Homogeneous treedensities across regions likely arise from irrigationin arid regions and mowing, trimming, and thin-ning in more mesic regions, resulting from humanpreferences for savanna-like landscapes in urbanregions (Balling and Falk 1982, Orians and Heer-wagen 1992, Falk and Balling 2009).The ratio of leaf perimeter to surface area,
which has been empirically associated with leafhydraulic traits (Sack et al. 2003), increased withincreasing aridity. Larger values indicate eithermore lobed or smaller leaves, both of whichdecrease boundary layer resistance and allowleaves to cool more quickly in hot environments(Givnish and Vermeij 1976). Critically, we foundno evidence for systematic differences in how thistrait responded to the environment across differ-ent species pools. The cultivated and naturalpools responded equally to the aridity gradient,perhaps because the problem of excess heat loadon leaves is not alleviated by irrigation, and thecooling benefit from leaves with high values is rel-evant to all species pools. These results are notconsistent with a homogenization of traits. Wefound no evidence for differences in the varianceof any structural (or diversity) metrics withinurban and natural assemblages: Variation amongthe cultivated and spontaneous pools was compa-rable to variation among the natural pools. Thissuggests that urban species pools change inresponse to broad environmental gradients as dothe natural pools, likely through a combination ofenvironmental filtering (Kraft et al. 2015) andhuman choice. We emphasize, however, that wehave measured only three major classes of struc-tural data within this study: properties of trees(density and height), and properties of leaves (sur-face area and perimeter:area). Plants vary across
❖ www.esajournals.org 13 February 2018 ❖ Volume 9(2) ❖ Article e02105
PEARSE ET AL.

many more trait axes than we have measuredhere (Laughlin 2014, Reich 2014), as do urbanyards and the species within them (Groffmanet al. 2014).
Broader ImplicationsEvaluating whether urban floras are homoge-
nized requires explicit consideration of both thespecies pool (cultivated, spontaneous) relative tonatural reference areas and the attribute of thepool being evaluated (diversity, composition,structure). Across yards within regions, urbanspecies pools resemble each other more stronglythan do natural area pools in terms of species andphylogenetic composition, providing evidencefor homogenization. Yet species from the naturalpools were found within cultivated and sponta-neous pools, implying there is an exchange ofspecies between pools. Notably, spontaneouspools are intermediate in composition betweencultivated and natural pools (Fig. 3), indicatingthat they may operate as an exchange reservoirthat serves as a sink for cultivated species and asboth a source and a sink for species in naturalareas. Comparing urban ecosystems with naturalecosystems allows us to identify differentdimensions of urban biodiversity, unpacking theinfluence of human desires (for trees) and envi-ronmental drivers (for thinner leaves). To theextent that the natural and spontaneous poolshave species in common, urban areas can act asreservoirs of native biodiversity. At the sametime, natural areas will increasingly receive spe-cies from the cultivated and spontaneous pools,shifting the composition and diversity of theregional and continental floras to reflect the vege-tation preferred and readily cultivated byhumans. As air travel and technology increasesthe size of the pool of species available for humancultivation, further work will be required tounderstand whether the rate of exchangebetween these pools is slowing or increasing. Thismeans yards have the potential to play a greaterrole in applied conservation, functioning both asreservoirs of diversity and as novel ecosystems tobe managed and maintained.
ACKNOWLEDGMENTS
Funding for this research came from the NationalScience Foundation MacroSystems Biology Program in
the Emerging Frontiers Division of the Biological SciencesDirectorate and Long Term Ecological Research Program.The “Ecological Homogenization of Urban America”project was supported by a series of collaborative grantsfrom the Macrosystems program (EF-1065548, 1065737,1065740, 1065741, 1065772, 1065785, 1065831, 121238320).The work arose from research funded by grants from theNSF Long Term Ecological Research Program supportingwork in Baltimore (DEB-0423476), Phoenix (BCS-1026865, DEB-0423704, and DEB-9714833), Plum Island(Boston; OCE-1058747 and 1238212), Cedar Creek (Min-neapolis–St. Paul; DEB-0620652), and Florida CoastalEverglades (Miami; DBI-0620409). We are grateful to thebotanical field teams involved in yard sampling and dataorganization: BAL—Charlie Davis, Dan Dillon, ErinMellenthin, Charlie Nicholson, Hannah Saunders, andAvery Uslaner; BOS—Emma Dixon, Roberta Lom-bardiy, Pamela Polloni, Jehane Semaha, ElisabethWard, and Megan Wheeler; LA—Aprille Curtis andLa’Shaye Ervin; MIA–Bianca Bonilla, Stephen Hodges,Lawrence Lopez, and Gabriel Sone; MSP—ChrisBuyarksi, Emily Loberg, Alison Slaats, and KelseyThurow; PHX—Erin Barton and Miguel Morgan; andSL—Moumita Kundu.
LITERATURE CITED
Arnfield, A. J. 2003. Two decades of urban climateresearch: a review of turbulence, exchanges ofenergy and water, and the urban heat island. Inter-national Journal of Climatology 23:1–26.
Aronson, M. F., et al. 2014. A global analysis of theimpacts of urbanization on bird and plant diversityreveals key anthropogenic drivers. Proceedings ofthe Royal Society B: Biological Sciences 281:20133330.
Aronson, M. F., et al. 2016. Hierarchical filters deter-mine community assembly of urban species pools.Ecology 97:2952–2963.
Avolio, M., D. E. Pataki, T. Gillespie, G. D. Jenerette, H.R. McCarthy, S. Pincetl, and L. Weller-Clarke. 2015.Tree diversity in southern California’s urban forest:the interacting roles of social and environmentalvariables. Frontiers in Ecology and Evolution 3:73.
Balling, J. D., and J. H. Falk. 1982. Development ofvisual preference for natural environments. Envi-ronment and Behavior 14:5–28.
Bates, D., and M. Maechler. 2010. lme4: linear mixed-effects models using S4 classes. R package version0.999375-37. http://CRAN.R-project.org/package=lme4
Bonhomme, V., S. Picq, C. Gaucherel, and J. Claude.2014. Momocs: outline analysis using R. Journal ofStatistical Software, 56:1–24.
Bryant, J. A., C. Lamanna, H. Morlon, A. J. Kerkhoff, B. J.Enquist, and J. L. Green. 2008. Microbes on
❖ www.esajournals.org 14 February 2018 ❖ Volume 9(2) ❖ Article e02105
PEARSE ET AL.
mountainsides: contrasting elevational patterns ofbacterial and plant diversity. Proceedings of theNational Academy of Sciences USA 105:11505–11511.
Cayuela, L., �I. Granzow-de la Cerda, F. S. Albuquerque,and D. J. Golicher. 2012. Taxonstand: an R packagefor species names standardisation in vegetationdatabases. Methods in Ecology & Evolution 3:1078–1083.
Ceplov�a, N., Z. Lososov�a, D. Zelen�y, M. Chytr�y, J.Danihelka, K. Fajmon, D. Lanikova, Z. Preislerova,V. �Reho�rek, and L. Tich�y. 2015. Phylogenetic diver-sity of central-European urban plant communities:effects of alien species and habitat types. Preslia87:1–16.
Chave, J. 2013. The problem of pattern and scale inecology: What have we learned in 20 years? Ecol-ogy Letters 16:4–16.
Currie, D. J. 1991. Energy and large-scale patterns ofanimal-and plant-species richness. American Natu-ralist 137:27–49.
Dahmus, M. E., and K. C. Nelson. 2014. Yard stories:examining residents’ conceptions of their yards aspart of the urban ecosystem in Minnesota. UrbanEcosystems 17:173–194.
D�ıaz, S., A. Purvis, J. H. Cornelissen, G. M. Mace, M. J.Donoghue, R. M. Ewers, P. Jordano, and W. D.Pearse. 2013. Functional traits, the phylogeny offunction, and ecosystem service vulnerability. Ecol-ogy & Evolution 3:2958–2975.
Dice, L. R. 1945. Measures of the amount of ecologicassociation between species. Ecology 26:297–302.
Falk, J. H., and J. D. Balling. 2009. Evolutionary influ-ence on human landscape preference. Environmentand Behavior 42:479–493.
Fine, P. V. 2015. Ecological and evolutionary drivers ofgeographic variation in species diversity. AnnualReview of Ecology, Evolution, and Systematics 46:369–392.
Fox, J., and S. Weisberg. 2011. An R companion toapplied regression. Second edition. Sage, Thou-sand Oaks, California, USA.
Givnish, T. J., and G. J. Vermeij. 1976. Sizes and shapesof liane leaves. American Naturalist 110:743–778.
Grimm, N. B., S. H. Faeth, N. E. Golubiewski, C. L.Redman, J. Wu, X. Bai, and J. M. Briggs. 2008. Glo-bal change and the ecology of cities. Science319:756–760.
Groffman, P. M., et al. 2014. Ecological homogeniza-tion of urban USA. Frontiers in Ecology and theEnvironment 12:74–81.
Hall, S. J., et al. 2016. Convergence of microclimate inresidential landscapes across diverse cities in theUnited States. Landscape Ecology 31:101–117.
HilleRisLambers, J., P. Adler, W. Harpole, J. Levine,and M. Mayfield. 2012. Rethinking community
assembly through the lens of coexistence theory.Annual Review of Ecology, Evolution, and System-atics 43:227.
Hobbs, R. J., E. Higgs, and J. A. Harris. 2009. Novel eco-systems: implications for conservation and restora-tion. Trends in Ecology & Evolution 24:599–605.
Hubbell, S. P. 2008. Approaching ecological complexityfrom the perspective of symmetric neutral theory.Pages 143–159 in W. Carson and S. Schnitzer, edi-tors. Tropical forest community ecology. Wiley-Blackwell, Chichester, UK.
Jenerette, G. D., et al. 2016. Climate tolerances andtrait choices shape continental patterns of urbantree biodiversity. Global Ecology and Biogeogra-phy 25:1367–1376.
Kembel, S. W., P. D. Cowan, M. R. Helmus, W. K.Cornwell, H. Morlon, D. D. Ackerly, S. P. Blom-berg, and C. O. Webb. 2010. Picante: R tools forintegrating phylogenies and ecology. Bioinformat-ics 26:1463–1464.
Knapp, S., L. Dinsmore, C. Fissore, S. E. Hobbie, I.Jakobsdottir, J. Kattge, J. Y. King, S. Klotz, J. P.McFadden, and J. Cavender-Bares. 2012. Phyloge-netic and functional characteristics of householdyard floras and their changes along an urbaniza-tion gradient. Ecology 93:S83–S98.
Knapp, S., I. K€uhn, O. Schweiger, and S. Klotz. 2008.Challenging urban species diversity: contrastingphylogenetic patterns across plant functionalgroups in Germany. Ecology Letters 11:1054–1064.
Knapp, S., and R. Wittig. 2012. An analysis of temporalhomogenisation and differentiation in CentralEuropean village floras. Basic and Applied Ecology13:319–327.
Kowarik, I. 2011. Novel urban ecosystems, biodiver-sity, and conservation. Environmental Pollution159:1974–1983.
Kraft, N. J., O. Godoy, and J. M. Levine. 2015. Plantfunctional traits and the multidimensional natureof species coexistence. Proceedings of the NationalAcademy of Sciences USA 112:797–802.
K€uhn, I., R. Brandl, and S. Klotz. 2004. The flora ofGerman cities is naturally species rich. Evolution-ary Ecology Research 6:749–764.
K€uhn, I., and S. Klotz. 2006. Urbanization and homo-genization–comparing the floras of urban and ruralareas in Germany. Biological Conservation 127:292–300.
Kuznetsova, A., P. Bruun Brockhoff, and R. HauboBojesen Christensen. 2016. lmerTest: tests in linearmixed effects models. R package version 2.0-30.http://CRAN.R-project.org/package=lmerTest
Lalibert�e, E., and P. Legendre. 2010. A distance-basedframework for measuring functional diversity frommultiple traits. Ecology 91:299–305.
❖ www.esajournals.org 15 February 2018 ❖ Volume 9(2) ❖ Article e02105
PEARSE ET AL.
Larson, K. L., et al. 2016. Ecosystem services inmanaging residential landscapes: priorities, valuedimensions, and cross-regional patterns. UrbanEcosystems 19:95–113.
Laughlin, D. C. 2014. The intrinsic dimensionality ofplant traits and its relevance to community assem-bly. Journal of Ecology 102:186–193.
Levin, S. A. 1992. The problem of pattern and scale inecology: the Robert H. MacArthur award lecture.Ecology 73:1943–1967.
Liu, X., L. Duan, J. Mo, E. Du, J. Shen, X. Lu, Y. Zhang,X. Zhou, C. He, and F. Zhang. 2011. Nitrogendeposition and its ecological impact in China: anoverview. Environmental Pollution 159:2251–2264.
Lososov�a, Z., M. Chytr�y, L. Tich�y, J. Danihelka, K. Faj-mon, O. H�ajek, K. Kintrov�a, D. L�an�ıkov�a, Z.Ot�ypkov�a, and V. �Reho�rek. 2012. Biotic homoge-nization of Central European urban floras dependson residence time of alien species and habitattypes. Biological Conservation 145:179–184.
Mack, R. N., and W. M. Lonsdale. 2001. Humans asglobal plant dispersers: getting more than we bar-gained for: Current introductions of species for aes-thetic purposes present the largest single challengefor predicting which plant immigrants will becomefuture pests. BioScience 51:95–102.
Mann, C. C. 2005. 1491: New revelations of the Ameri-cans before Columbus. Knopf, New York, NewYork, USA.
Marco, A., T. Dutoit, M. Deschamps-Cottin, J.-F. Mauf-frey, M. Vennetier, and V. Bertaudi�ere-Montes.2008. Gardens in urbanizing rural areas reveal anunexpected floral diversity related to housing den-sity. Comptes Rendus Biologies 331:452–465.
Mayfield, M. M., M. F. Boni, G. C. Daily, and D. Ack-erly. 2005. Species and functional diversity ofnative and human-dominated plant communities.Ecology 86:2365–2372.
McKinney, M. L. 2006. Urbanization as a major causeof biotic homogenization. Biological Conservation127:247–260.
Milesi, C., S. W. Running, C. D. Elvidge, J. B. Dietz, B.T. Tuttle, and R. R. Nemani. 2005. Mapping andmodeling the biogeochemical cycling of turfgrasses in the United States. Environmental Man-agement 36:426–438.
Newbold, T., et al. 2015. Global effects of land use onlocal terrestrial biodiversity. Nature 520:45–50.
Nock, C. A., A. Paquette, M. Follett, D. J. Nowak, andC. Messier. 2013. Effects of urbanization on treespecies functional diversity in eastern North Amer-ica. Ecosystems 16:1487–1497.
O’Brien, E. M., R. Field, and R. J. Whittaker. 2000. Cli-matic gradients in woody plant (tree and shrub)
diversity: water-energy dynamics, residual varia-tion, and topography. Oikos 89:588–600.
Oksanen, J., F. G. Blanchet, R. Kindt, P. Legendre, P. R.Minchin, R. B. O’Hara, G. L. Simpson, P. Solymos,M. H. H. Stevens, and H. Wagner. 2013. Vegan:community ecology package. R package version2.0-10. http://CRAN.R-project.org/package=vegan
Orians, G. H., and J. H. Heerwagen. 1992. Evolvedresponses to landscapes. Pages 555–578 in J. H. Bar-kow, L. Cosmides, and J. Tooby, editors. Theadapted mind: evolutionary psychology and thegeneration of culture. Oxford University Press,Oxford, UK.
Pautasso, M. 2007. Scale dependence of the correlationbetween human population presence and verte-brate and plant species richness. Ecology Letters10:16–24.
Pearse, W. D., M. W. Cadotte, J. Cavender-Bares, A. R.Ives, C. M. Tucker, S. C. Walker, and M. R. Helmus.2015. pez: phylogenetics for the environmentalsciences. Bioinformatics 31:2888–2890.
Pickett, S. T. A., M. L. Cadenasso, J. M. Grove, C. H.Nilon, R. V. Pouyat, W. C. Zipperer, and R. Costanza.2001. Urban ecological systems: linking terrestrialecological, physical, and socioeconomic compo-nents of metropolitan areas. Annual Review ofEcology, Evolution, and Systematics 32:127–157.
Polsky, C., et al. 2014. Assessing the homogenizationof urban land management with an application toUS residential lawn care. Proceedings of theNational Academy of Sciences USA 111:4432–4437.
Purvis, A., and A. Hector. 2000. Getting the measure ofbiodiversity. Nature 405:212–219.
Py�sek, P. 1993. Factors affecting the diversity of floraand vegetation in central European settlements.Plant Ecology 106:89–100.
R Core Team. 2015. R: a language and environment forstatistical computing. R Foundation for StatisticalComputing, Vienna, Austria.
Reich, P. B. 2014. The world-wide ‘fast-slow’ plant eco-nomics spectrum: a traits manifesto. Journal ofEcology 102:275–301.
Ricklefs, R. E. 1987. Community diversity: relativeroles of local and regional processes. Science235:167–171.
Ricklefs, R. E. 2004. A comprehensive framework forglobal patterns in biodiversity. Ecology Letters 7:1–15.
Ricotta, C., F. A. La Sorte, P. Py�sek, G. L. Rapson, L.Celesti-Grapow, and K. Thompson. 2009. Phyloe-cology of urban alien floras. Journal of Ecology97:1243–1251.
Ricotta, C., D. Heathfield, S. Godefroid, and S. Maz-zoleni. 2012a. The effects of habitat filtering on the
❖ www.esajournals.org 16 February 2018 ❖ Volume 9(2) ❖ Article e02105
PEARSE ET AL.

phylogenetic structure of the urban flora of Brus-sels (Belgium). Community Ecology 13:97–101.
Ricotta, C., F. A. La Sorte, P. Py�sek, G. L. Rapson, L.Celesti-Grapow, and K. Thompson. 2012b. Phylo-genetic beta diversity of native and alien species inEuropean urban floras. Global Ecology and Bio-geography 21:751–759.
Sack, L., P. D. Cowan, N. Jaikumar, and N. M. Hol-brook. 2003. The ‘hydrology’ of leaves: co-ordina-tion of structure and function in temperate woodyspecies. Plant, Cell & Environment 26:1343–1356.
Simberloff, D., and B. Von Holle. 1999. Positive interac-tions of nonindigenous species: Invasional melt-down? Biological Invasions 1:21–32.
Sørensen, T. 1948. A method of establishing groups ofequal amplitude in plant sociology based on simi-larity of species and its application to analyses ofthe vegetation on Danish commons. BiologiskeSkrifter 5:1–34.
Trammell, T. L. E., D. E. Pataki, J. Cavender-Bares, P.M. Groffman, S. J. Hall, J. B. Heffernan, S. E. Hob-bie, J. L. Morse, C. Neill, and K. C. Nelson. 2016.Plant nitrogen concentration and isotopic composi-tion in residential lawns across seven US cities.Oecologia 181:271–285.
UN. 2014. World urbanization prospects: the 2014 revi-sion, highlights. Technical Report. United Nations,
Department of Economics and Social Affairs, Popu-lation Division, New York, New York, USA.
Vellend, M. 2010. Conceptual synthesis in communityecology. Quarterly Review of Biology 85:183–206.
Vose, R. S., S. Applequist, M. Squires, I. Durre, M. J.Menne, C. N. Williams, C. Fenimore, K. Gleason, andD. Arndt. 2014. Improved historical temperature andprecipitation time series for US climate divisions.Journal of Applied Meteorology 53:1232–1251.
Weiher, E., and P. Keddy. 2001. Ecological assemblyrules: perspectives, advances, retreats. CambridgeUniversity Press, Cambridge, UK.
Wiens, J. J., and M. J. Donoghue. 2004. Historical bio-geography, ecology and species richness. Trends inEcology & Evolution 19:639–644.
Wiens, J. J., et al. 2010. Niche conservatism as anemerging principle in ecology and conservationbiology. Ecology Letters 13:1310–1324.
Williams, N. S. G., et al. 2009. A conceptual frame-work for predicting the effects of urban environ-ments on floras. Journal of Ecology 97:4–9.
Zanne, A. E., et al. 2014. Three keys to the radiation ofangiosperms into freezing environments. Nature506:89–92.
Zillio, T., I. Volkov, J. R. Banavar, S. P. Hubbell, and A.Maritan. 2005. Spatial scaling in model plant com-munities. Physical Review Letters 95:098101.
SUPPORTING INFORMATION
Additional Supporting Information may be found online at: http://onlinelibrary.wiley.com/doi/10.1002/ecs2.2105/full
❖ www.esajournals.org 17 February 2018 ❖ Volume 9(2) ❖ Article e02105
PEARSE ET AL.
Related Documents