Home Bias, Foreign Mutual Fund Holdings, and the Voluntary Adoption of International Accounting Standards ◊ Vicentiu M. Covrig Department of Finance, Real Estate and Insurance College of Business and Economics California State University-Northridge Northridge, CA 91330 Mark L. DeFond* Leventhal School of Accounting Marshall School of Business University of Southern California Los Angeles, CA 90089-0441 Mingyi Hung Leventhal School of Accounting Marshall School of Business University of Southern California Los Angeles, CA 90089-0441 December 2005 ◊ Formerly titled “Cross-Border Investment and the Voluntary Adoption of International Accounting Standards” *Corresponding author. Acknowledgments: We thank the following for their helpful comments: Mort Pincus, Charles Shi and workshop participants at University of California at Irvine and University of California at Riverside.

Welcome message from author
This document is posted to help you gain knowledge. Please leave a comment to let me know what you think about it! Share it to your friends and learn new things together.
Transcript

Home Bias, Foreign Mutual Fund Holdings, and the Voluntary Adoption of International Accounting Standards◊
Vicentiu M. Covrig
Department of Finance, Real Estate and Insurance College of Business and Economics
California State University-Northridge Northridge, CA 91330
Mark L. DeFond*
Leventhal School of Accounting Marshall School of Business
University of Southern California Los Angeles, CA 90089-0441
Mingyi Hung
Leventhal School of Accounting Marshall School of Business
University of Southern California Los Angeles, CA 90089-0441
December 2005 ◊Formerly titled “Cross-Border Investment and the Voluntary Adoption of International
Accounting Standards” *Corresponding author. Acknowledgments: We thank the following for their helpful comments: Mort Pincus, Charles Shi and workshop participants at University of California at Irvine and University of California at Riverside.
Home Bias, Foreign Mutual Fund Holdings, and the Voluntary Adoption of International Accounting Standards
Abstract We test the assertion that a consequence of voluntarily adopting International Accounting Standards (IAS) is the enhanced ability to attract foreign capital. Using a unique database that reports firm-level holdings of over 25,000 mutual funds from around the world, our multivariate tests find that average foreign mutual fund ownership is 45% higher among firms using IAS. We also find that average foreign mutual fund ownership increases by 35% in the year following a switch from local accounting standards to IAS, consistent with IAS adoption leading to increased foreign ownership. In addition, our analyses suggest that increased disclosure helps explain why foreign mutual funds invest more heavily in IAS adopters. Taken together, our findings are consistent with voluntary IAS adoption reducing home bias among foreign investors and thereby improving capital allocation efficiency.
1
Home Bias, Foreign Mutual Fund Holdings, and the Voluntary Adoption of International Accounting Standards
1. Introduction
Widespread voluntary adoption of International Accounting Standards (IAS), together with
its mandatory adoption by the European Union in 2005, is quickly making IAS one of the most
popular accounting models in the world.1 Proponents of IAS commonly argue that an important
consequence of voluntarily adopting IAS is the enhanced ability to attract foreign capital,
consistent with IAS increasing disclosure levels that in turn reduce foreign investors’ home bias.
Despite these claims, however, there is no direct evidence supporting the assertion that foreign
investors prefer IAS users. Thus, the purpose of this paper is to empirically investigate whether
IAS adoption attracts greater foreign investment by testing whether firms that voluntarily adopt
IAS have higher levels of foreign mutual fund ownership.
Because voluntary IAS adoption is expected to result in increased information disclosure, we
hypothesize that firms using IAS have higher foreign ownership than firms using local standards.
Using a unique database that reports firm-level holdings of over 25,000 mutual funds from
around the world, we test our hypothesis on a sample of 24,592 firm-year observations
(including 1,315 firm-year IAS users) in 29 countries outside of the U.S. and Canada during the
period 1999 through 2002. While it would be ideal to have access to all cross-border
investments worldwide, mutual funds represent an important subset of investors, and since
mutual fund clients consist primarily of individual investors, the investment behavior of mutual
fund managers is likely to surrogate for the preferences of a large segment of the investment
community (Chan, Covrig and Ng [2005a]).
1 The International Accounting Standards (IAS) issued by the International Accounting Standards Committee
(IASC) are succeeded by the International Financial Reporting Standards (IFRS) issued by International Accounting Standards Board (IASB). For ease of exposition, we use the term IAS to refer to both IAS and IFRS.

2
Our primary hypothesis test consists of a firm-level regression where the dependent variable
is the proportion of shares held by foreign mutual funds, and the independent variable of interest
is a dummy variable indicating whether the firm uses IAS. We also include the following
control variables that are expected to be associated with mutual fund ownership: (1) the number
of analysts following and firm size, to capture the firm’s information environment; (2) a dummy
variable indicating whether the firm is included in the MSCI World Index, to capture the firm’s
visibility to investors; (3) a dummy variable indicating whether the firm is cross-listed on a
foreign stock exchange, to capture the firm’s trading environment; (4) a dummy variable
indicating whether the firm is audited by a Big Five auditor, to capture the credibility of the
accounting numbers; (5) several firm-specific financial variables (i.e., return on equity, stock
returns, volatility of stock returns, leverage, dividend yield, book-to-market ratio and earnings-
to-price ratio), to capture financial characteristics that are likely to influence mutual fund
managers’ investment preferences; and (6) dummy variables capturing industry, country and year
effects.
Our univariate tests find that foreign mutual fund ownership averages 2% among firms using
local accounting standards and 6% among firms using IAS. While this finding is consistent with
our hypothesis, it does not control for factors associated with higher foreign mutual fund
ownership that may be correlated with IAS adoption. Our multivariate analysis that controls for
factors expected to explain mutual fund ownership also is consistent with our hypothesis and
finds that foreign mutual fund ownership is 0.9% higher among firms using IAS compared to
firms using local standards. Using the average foreign mutual fund ownership of 2% among
local standard users as a baseline, this indicates that foreign mutual fund ownership is 45%
higher among IAS users (0.9% divided by 2%), suggesting that the increased level of foreign

3
ownership is economically as well as statistically significant.
We also conduct additional analyses that explore why IAS adopters have a higher proportion
of foreign mutual fund ownership. These additional tests find that foreign mutual fund
ownership is higher among IAS users in poorer information environments, where there is likely
to be less firm-specific data available to foreign investors (i.e., among firms followed by fewer
analysts or with lower market capitalization). This is consistent with firms in poorer information
environments adopting IAS as a mechanism for increasing the amount of information provided
to foreign investors, and with IAS adoption not significantly differentiating firms in richer
information environments. Further, our additional analyses find that foreign mutual fund
ownership is higher among IAS users in countries where IAS adoption results in a relatively
greater amount of additional disclosure compared to local standards. This result is consistent
with foreign investors preferring IAS because it reduces the information disadvantage associated
with cross-border investing.2
Our additional analyses also find that foreign mutual fund ownership in IAS users is higher
among mutual funds with a “regional” investment scope, which are funds specializing in
geographical regions (such as Asia or Europe), compared to funds with a “country” specific or
“global” investment scope. This is consistent with regional fund managers having a relatively
higher demand for greater firm-level disclosure than country fund managers (who tend to have
greater access to firm-specific local information) or global fund managers (who are generally
interested primarily in blue chip companies, and are not as interested in seeking out smaller new
investments). We also perform several robustness tests that find our primary results are not
sensitive to (1) restricting the sample countries to EU members, (2) restricting the sample
2 Our additional analyses fail to find that there are significant differences in foreign mutual fund ownership across
IAS users partitioned on a country’s legal environment for investor protection.
4
countries to those with a high proportion of IAS adopters, (3) deleting firms cross-listed on
foreign stock exchanges, (4) deleting German or U.S. mutual fund ownership, (5) deleting North
American fund ownership, (6) performing the analysis by-year, and (7) controlling for self-
selection bias.
In an attempt to corroborate our hypothesis test, we perform a multivariate analysis that tests
whether foreign mutual fund ownership increases during the year following a switch from local
standards to IAS. While we only have complete data on 78 firms that switch to IAS during our
sample period, this analysis finds that foreign mutual fund ownership increases by 0.7% in the
year following IAS adoption. This suggests that foreign mutual funds increase their ownership
by 35% in the year following IAS adoption (0.7% divided by the 2% baseline for firms using
local standards). Thus, we also provide evidence that IAS adoption leads to an economically
significant increase in foreign ownership during the year following adoption.
We also perform our hypothesis test on domestic mutual fund holdings, although we do not
have predictions for these tests. This analysis is interesting because IAS adoption also alters the
information disclosures upon which domestic market participants base their investment
decisions, and as such IAS adoption may influence the investment preferences of domestic
mutual fund managers. We find that domestic mutual fund ownership is 8% higher among firms
using IAS, consistent with IAS providing additional disclosure that informs domestic as well as
foreign investors. In addition, we perform our additional analyses on domestic mutual fund
ownership and find that domestic mutual fund ownership is higher in IAS firms that are followed
by fewer analysts, consistent with IAS helping overcome information asymmetry for domestic
(as well as foreign) investors in poorer information environments. However, in contrast to our
analysis of foreign mutual funds, we do not find that domestic mutual fund ownership changes
5
during the year following the adoption of IAS, suggesting that IAS adoption is more important
for foreign investors than for domestic investors.
Our study contributes to the literature in several ways. First, we add to the growing literature
on the impact of IAS adoption. Prior studies in this area focus on issues such as the influence of
IAS adoption on analyst forecasts, firm valuation and accounting quality (Ashbaugh and Pincus
[2001], Hung and Subramanyam [2004], Barth, Landsman and Lang [2005]), and on explaining
why countries adopt IAS (Hope, Jin and Kang [2005]). We add to this literature by investigating
the impact of IAS adoption on the investment preferences of foreign mutual funds. We find
evidence that an economic consequence of voluntary IAS adoption is the enhanced ability to
attract cross-border investment, consistent with IAS increasing disclosure levels that in turn
reduce the information disadvantage of foreign investors.3
Second, our findings are consistent with voluntary IAS adoption reducing home bias among
foreign investors, and thereby improving capital allocation efficiency (Young and Guenther
[2003], Ahearne, Griever and Warnock [2004]). While recent studies such as Bradshaw, Bushee
and Miller [2004] and Aggarwal, Klapper and Wysocki [2005] document that increased
accounting disclosure reduces home bias, these studies focus exclusively on U.S. investors and it
is unclear whether their results generalize beyond these investors. By using a comprehensive
database of worldwide mutual fund holdings we are the first study to document the effects of
accounting disclosure on foreign investment across a large cross-section of investors and
institutional environments.
Finally, we add to prior studies by documenting the similarities and differences in how
accounting disclosure is associated with both domestic and foreign mutual fund holdings. We
3 We acknowledge, however, that our analysis does not address the issue of whether mandatory IAS adoption is
likely to improve resource allocation.

6
contribute to Healy, Hutton and Palepu [1999], by finding that both domestic and foreign mutual
fund holdings increase with higher levels of accounting disclosure (as captured by the use of
IAS). We add to Covrig, Lau and Ng [2004] by documenting that domestic mutual fund
managers respond to IAS adoption differently than foreign mutual fund managers. Specifically,
our evidence suggests that foreign fund managers are more sensitive to IAS adoption than
domestic fund managers, consistent with foreign mutual fund managers suffering greater
information asymmetry.
The remainder of the paper is structured as follows. Section 2 develops our hypothesis
and section 3 presents the methodology for testing our hypothesis. Section 4 describes the
sample and presents the empirical results. Section 5 discusses the additional analyses and
Section 6 describes the results of several robustness tests. Section 7 summarizes our
investigation and discusses limitations to interpreting our findings.
2. Hypothesis Development
In a phenomenon commonly referred to as “home bias,” prior research finds that investors
tend to allocate a disproportionately large fraction of their capital to equities in their home
country (Dahlquist, Pinkowitz, Stulz and Williamson [2002], Karolyi and Stulz [2003]). Firms,
however, are likely to benefit from reducing home bias and attracting greater foreign investment.
For example, theoretical research predicts that foreign investment improves investor
diversification, which in turn lowers investors’ required risk premium, and thereby reduces the
cost of capital (Brealey, Cooper and Kaplanis [1999]). This prediction is consistent with the
evidence in several empirical studies, including Chan, Covrig and Ng [2005b], who find that
greater foreign mutual fund investment is associated with higher values of Tobin’s Q, suggesting
7
that increased investment by foreign mutual funds lowers firms’ cost of capital. In addition,
greater foreign investment can increase firms’ investor base, thereby increasing share liquidity.
Importantly, prior research also suggests that a major factor explaining home bias is the high
costs of obtaining information about foreign investments (Kang and Stulz [1997], Ahearne et al.
[2004], Chan et al. [2005a]). For example, Kang and Stulz [1997] document that U.S. investors
invest more heavily in Japanese firms with characteristics that are likely to reduce foreign
investors’ information costs. One way firms can reduce foreign investors’ information costs is
through increased accounting disclosure, because increased disclosure reduces investor demand
for costly private information (Diamond [1985]). This is consistent with Young and Guenther
[2003] who find that cross-border capital investments are higher in countries with greater
accounting disclosure, and with Bradshaw et al. [2004] who find that U.S. institutional investors
make larger investments in firms that use higher quality accounting standards. It is also
consistent with a recent survey that finds that more than 70% of global investors regard
accounting disclosures as a very important influence on their cross-border investment decisions
(McKinsey [2002]).
One mechanism firms can use to increase accounting disclosure is the adoption of IAS. IAS
adoption generally results in greater disclosure than local standards and, according to its
proponents, the increased disclosure attracts greater cross-border investment (Wild [2004],
McCreevy [2005]). Consistent with IAS adoption increasing disclosure, Leuz and Verrecchia
[2000] document that German firms adopting IAS experience a reduction in their cost of capital
as proxied by reduced bid-ask spreads and increased trading volume. The benefits attributable to
IAS adoption are also consistent with press release announcements of voluntary adoptions that
frequently claim the adoption is at least partially motivated by a desire to provide greater and
8
higher quality disclosure to investors. For example, Volkswagen reportedly adopted IAS in 2001
in response to criticism by institutional investors that its disclosure and communication policies
under German GAAP were deficient (Burt and Harnischfeger [2000]).
Based on the above arguments and evidence consistent with IAS increasing the level of
information disclosure, we expect IAS adoption to reduce foreign investors’ information
disadvantage and thereby increase cross-border investment in IAS users. Therefore, we
predict the following (in alternative form):
Hypothesis: Firms using IAS have higher foreign ownership than firms using local standards. 3. Research Design
We test our hypothesis by regressing firm-level foreign mutual fund holdings on a dummy
variable indicating whether the firm uses IAS.4 While foreign mutual fund holdings do not
capture the universe of foreign investors, we believe it is a reasonable surrogate for our analyses
because international mutual funds represent a large and important subset of global financial
investors (Khorana, Servaes and Tufano [2005]); and, since mutual fund investors consist
primarily of individuals, the investment preferences of mutual fund managers are likely to reflect
those of a large class of international investors (Chan et al. [2005a]).5
Our regression analysis includes several control variables expected to explain mutual fund
holdings (Bradshaw et al. [2004], Covrig et al. [2004], Leuz, Lins and Warnock [2005]).
Specifically, we include: (1) the number of analysts following the firm and firm size, Nanalyst
4 We use Compustat Global accounting standards ‘DI’ code — Domestic standards generally in accordance with
IASC to identify IAS firms because this applies to most of the firms adopting IAS. There are two other codes in Compustat Global that include references to IAS: (1) ‘DA’ — Domestic standards generally in accordance with IASC and OECD (Organization for Economic Cooperation and Development) guidelines; and (2) ‘DT’ — Domestic standards in accordance with principles generally accepted in the United States and generally in accordance with IASC and OECD guidelines. To explore whether our results are sensitive to the coding, we repeat our analysis in Table 4 after including firms with ‘DA’ and ‘DT’ codes and find results consistent with those reported in Table 4.
5 In addition, some research finds that mutual funds adopt investment strategies that are similar to those adopted by various other types of institutional investors (Dahlquist and Robertsson [2001], Gompers and Metrick [2001], Covrig et al. [2004], He, Ng and Wang [2004]).

9
and Size, to capture the firm’s information environment; (2) a dummy variable indicating
whether the firm is included in the MSCI World Index, Index, to capture the firm’s visibility to
investors; (3) a dummy variable indicating whether the firm is cross-listed on a foreign stock
exchange, X-list, to capture the firm’s trading environment; (4) a dummy variable indicating
whether the firm is audited by a Big Five auditor, BigFive, to partially capture the credibility of
the accounting numbers; (5) variables controlling for the financial characteristics of the sample
firms that may impact the investment preferences of mutual fund managers: ROE (return on
equity), Ret (stock return over the fiscal year), RetVar (volatility of monthly stock returns over
the fiscal year), Lev (leverage), DivYield (dividend yield), Book-market (ratio of book value of
equity to market value) and Earnings-price (ratio of earnings to stock price), and (6) dummy
variables controlling for industry, country, and year. Our formal regression model follows:
Holdings= β0+β1(IAS)+ β2(Nanalyst)+β3((Size) + β4(Index)+β5(X-list)+ β6(BigFive)+β7(ROE)+β8(Ret)+β9(RetVar)+β10(Lev)+ β11(DivYield)+β12(Book-market)+ β13 (Earnings-price)+ βm (DIndustry)+βn(DCountry)+ βo(DYear)+ε (1)
Where: Holdings = Percentage ownership by mutual funds, computed as the total number of shares
owned by the mutual funds divided by the total number of shares outstanding at yearend. Total holdings indicate the percentage ownership by all mutual funds; domestic holdings indicate the percentage ownership by mutual funds in the same country as the company, and foreign holdings indicate the percentage ownership by mutual funds in foreign countries.
IAS = Dummy variable equal to one if a firm prepares its financial statements based on IAS at yearend.
Nanalyst = Number of analysts following the firm at yearend. Size = The natural logarithm of the market value of equity in millions of U.S. dollars at yearend. Index = Dummy variable equal to one if a firm is included in MSCI World index as of December
2002.6 X-list = Dummy variable equal to one if a firm has securities cross-listed on foreign stock
exchanges as of 2001 according to Bloomberg. BigFive = Dummy variable equal to one if a firm is audited by a member of the Big Five at
yearend. ROE = Net income before extra-ordinary items divided by book value of equity at yearend.
6 We thank Darren Parker at Morgan Stanley Capital International (MSCI) for providing the constituent list of the MSCI World Index.
10
Ret = Stock return over the fiscal year. RetVar = Standard deviation of monthly stock returns over the fiscal year. Lev = Total liabilities divided by total assets at yearend. DivYield = Total dividends divided by market value of equity at yearend. Book-market = Book value of equity divided by market value of equity at yearend. Earnings-price = Net income divided by market value of equity at yearend. DIndustry = Dummy variables indicating a firm’s industry membership based on the
industry group classifications in Covrig et al. [2004]. DCountry = Dummies for countries. DYear = Dummies for years 1999 through 2001.
Our hypothesis predicts the coefficient on IAS to be positive when the dependent variable is
foreign holdings. We also estimate the above model using domestic mutual fund holdings as the
dependent variable, although we do not have a prediction for the sign of the coefficient on the
IAS dummy. This analysis is potentially interesting because IAS adoption also changes the
information available to domestic investors, and as such may influence the investment
preferences of domestic mutual fund managers.
4. Sample and Empirical Results
4.1 SAMPLE AND DESCRIPTIVE STATISTICS
Our sample consists of 24,592 firm-year observations (including 1,315 that use IAS) from
1999 to 2002 in 29 countries. We obtain our mutual fund holdings data from the Thomson
Financial Services (TFS) International mutual fund database that reports firm-level investments
outside of the U.S. and Canada for more than 25,000 mutual funds worldwide.7 The financial
statement and stock performance data are from Compustat Global Industrial/Commercial and
Issue files and the number of analysts following data are from I/B/E/S. We require our sample
observations to have the necessary data to compute the firm-level control variables, and our
sample countries to have foreign and domestic mutual fund investments as of 1999. In order to
7 The TFS international mutual fund database does not include mutual fund investments in U.S. and Canadian companies, but includes mutual funds located in the U.S. and Canada. For a detailed description of the TFS worldwide mutual fund holding data, see Covrig et al. [2004] and Chan et al. [2005a]. Since no companies use IAS in the U.S. and Canada, excluding U.S. and Canadian companies is not expected to be a limitation.

11
mitigate the influence of outliers we winsorize our scaled independent variables (return on
equity, stock return, standard deviation of stock returns, leverage, dividend yield, book-to-market
and earnings-to-price) at the top and bottom 1% of their respective distributions.
While our unit of analysis is the firm, Table 1 presents some country-level descriptive
information on IAS adoption and mutual fund ownership. Column two of Panel A reports the
number of total observations in each country and indicates that the number of observations varies
across our sample countries, with Argentina having the lowest total observations (85) and Japan
the largest total observations (8,475). The third and fourth columns report the proportion of
firm-years that use IAS in each country, and their proportion of the market value of the sample
firms in each country. The bottom row indicates that while 5% of our sample firm-years use
IAS, this represents 15% of our sample firms’ market value, suggesting that the firms using IAS
tend to be larger than the firms using local standards.
Column three also finds that there is a wide variation in the proportion of IAS users across
countries, with nine countries having 0% IAS users and six having 10% or more. This variation
may be explained partially by reporting regulations in some countries that impose higher costs on
IAS users by requiring all firms to use local reporting standards in their public financial reports.
Companies in these countries that wish to use IAS must either prepare two sets of financial
reports, or (if possible) use their discretion within local GAAP to choose accounting principles
that conform to IAS (Leuz and Verrecchia [2000], Alexander and Archer [2003]). Countries that
require all firms to use local standards in their public financial reports include Argentina,
Australia, Greece, Portugal and Sweden, where the proportion of IAS users is 4% or less
(Deloitte [2003]). This contrasts with regulations in some countries that allow firms to use IAS
in their public financial reports, making it relatively less costly to adopt IAS. Countries that
12
allow the use of IAS in their public reports include Belgium, Germany, South Africa and
Switzerland, where the proportion of IAS users is 10% or more.8
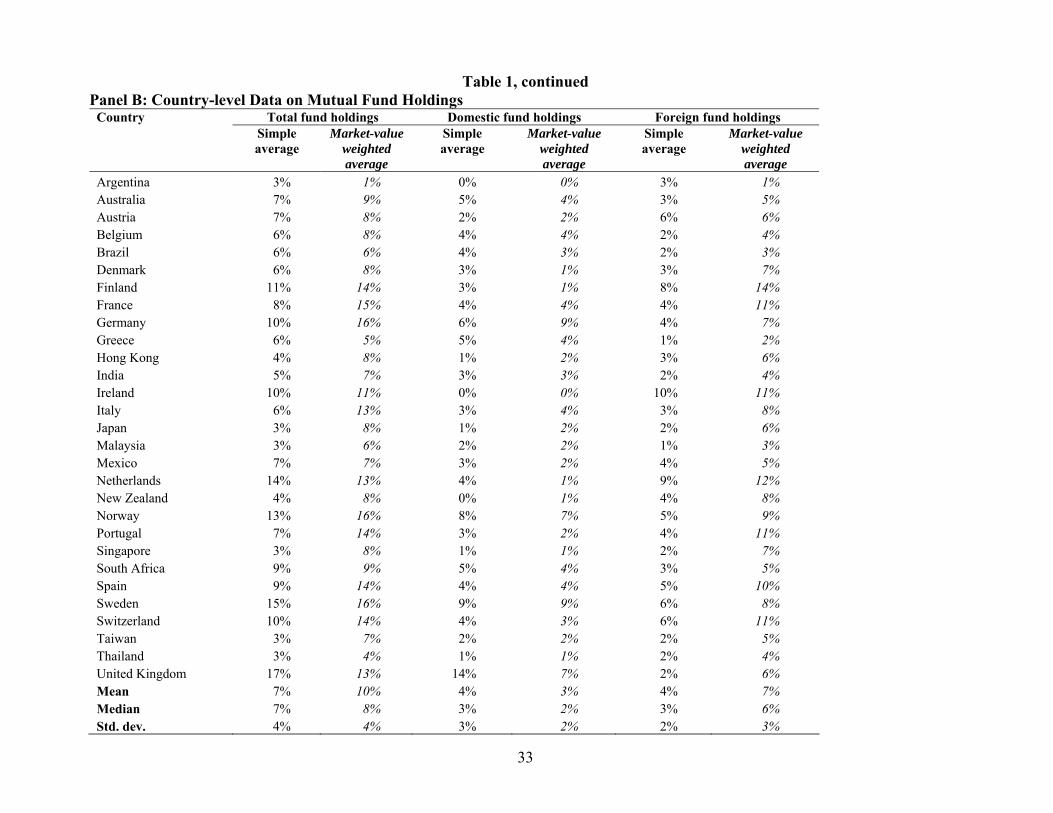
Panel B of Table 1 reports the simple average and market-value weighted average mutual
fund ownership by-country, partitioned on whether the fund is a domestic or foreign fund.9 The
bottom three rows of the panel present the mean, median and standard deviation for each
column.10 The mean values in columns two and three indicate that while the simple average total
ownership is 7%, the market-value weighted average total ownership is 10%, consistent with
mutual fund ownership being economically significant in our sample countries and with mutual
funds tending to invest in larger companies. Columns two and three also report a fairly large
variation in mutual fund ownership across countries, ranging from a market-value-weighted
average of 1% in Argentina to a simple average of 17% in the United Kingdom.11
Columns four and six of Panel B report that the mean simple average domestic and foreign
ownership is 4%, consistent with both types of funds owning an equal proportion of shares in the
markets we investigate. Columns five and seven, however, report that the mean market-value
weighted domestic and foreign ownership is 3%, and 7%, respectively, indicating that foreign
funds own more than twice the market value of the domestic funds. In addition, finding that the
simple average ownership is the same for both types of funds, while the market-value weighed
ownership is lower among the domestic funds and higher among the foreign funds, indicates that
8 Of course regulation is not the only determinant of IAS adoption choice. Research that models IAS choice includes Leuz and Verrecchia [2000], Ashbaugh [2001] and Hung and Subramanyam [2004].
9 To clarify what we mean by “simple average” versus “market-value weighted average” we provide the following example. Suppose a country has two mutual funds, Fund X and Fund Y, and that there are two firms in the country, Firm A and Firm B. Further assume that Firm A has a market capitalization of 80% of the market, that Firm B has a market capitalization of the remaining 20%; and that Fund X owns 5% of Firm A (and none of Firm B), and that Fund Y owns 15% of Firm B (and none of Firm A). Under this scenario, the simple average fund ownership in the country is 10% ([5%+15%]/2), and the weighted average fund ownership is 7% ([5%*80%]+[15%*20%]).
10 The sum of the domestic and foreign holdings does not always equal the total holdings in each row due to rounding.
11 Prior research also finds that international mutual funds have substantial investments in a large number of countries around the world (Covrig et al. [2004]). Khorana et al. [2005] explain cross-country differences in the size of mutual fund industries.
13
the domestic funds tend to invest in relatively smaller firms, while the foreign funds tend to
invest in relatively larger firms.
Table 2 presents descriptive statistics for our firm-level variables, partitioned by whether the
firm-year observation uses IAS. The far right column presents univariate tests with p-values for
t-tests of the mean differences and Wilcoxon two-sample tests of the median differences between
the firm-year observations using IAS versus those using local standards. The first and second
rows of the table indicate that total fund holdings average 7% of the firms using local standards,
and 11% of the firms using IAS, with the difference significant at p<1% (two-tailed). While the
third through the sixth rows report that this difference is also statistically significant for both the
domestic and foreign funds alone, the fifth and sixth rows show that most of this difference is
explained by foreign mutual fund holdings. Specifically, the fifth and sixth rows report that
foreign mutual funds own an average of 2% of the firms using local standards and an average of
6% of the firms using IAS, indicating that average foreign mutual fund ownership is three times
larger among IAS users. While this difference is consistent with our hypothesized prediction, the
univariate analysis in Table 2 does not control for factors that influence mutual fund managers’
investment preferences that may be correlated with IAS adoption. Thus, we rely on our
multivariate analysis presented in Table 4 to assess the magnitude of the difference in ownership
between firms adopting IAS and those using local standards.
Table 2 also indicates that the IAS users have richer information environments (i.e., they
attract higher numbers of analysts following and are larger in size) and are more visible (i.e.,
they are more often included in the MSCI World index). In addition, the IAS firms are more
frequently cross-listed and likely to use Big Five auditors. We also find that the IAS users

14
generally have lower and more volatile stock returns, higher leverage, lower dividend yields,
lower book-to-market ratios and lower earnings-to-price ratios.
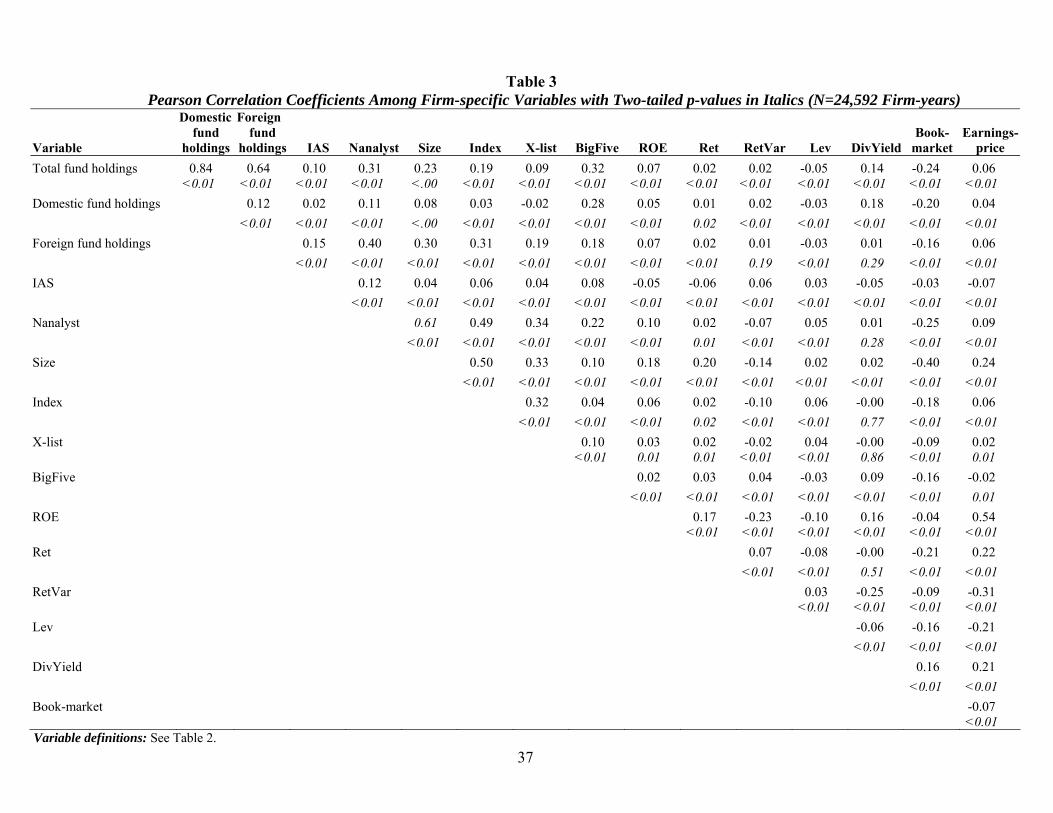
Table 3 presents Pearson correlation coefficients for the associations among the firm-specific
variables. The first three rows of the table present the correlations between the mutual fund
ownership measures (total, domestic and foreign) and each of our independent variables. We
find that all three mutual fund ownership measures are significantly positively correlated with
IAS users at p<1% (two-tailed). In addition, consistent with Covrig et al. [2004], we find that
foreign mutual fund ownership levels are positively correlated with richer information
environments (as captured by number of analysts and size) and higher visibility (as captured by
the MSCI World index membership), at p<1% (two-tailed). We also find that foreign mutual
fund ownership is positively correlated with cross-listing, Big Five auditors, higher return on
equity, lower leverage, lower book-to-market ratios and higher earnings-to-price ratios, at p<1%
(two-tailed).
4.2 EMPIRICAL RESULTS
Table 4 reports the results of the OLS regression that tests our hypothesis. Models One, Two
and Three regress total holdings, domestic holdings and foreign holdings on a dummy variable
indicating IAS adoption and our control variables. Consistent with our hypothesis, Model Three
finds that the coefficient on the IAS adoption dummy variable is significantly positive at p<1%
(two-tailed). In addition, the magnitude of the coefficient on the IAS dummy of 0.009 indicates
that foreign mutual funds’ average ownership is 0.9% higher among IAS users when compared
to firms using local standards. Using the mean foreign mutual fund ownership of 2% among
local standard users reported in Table 2 (fifth row) as a baseline, this suggests that foreign
mutual funds have 45% (0.9% divided by 2%) higher ownership among IAS users. Thus, the

15
higher ownership levels of IAS users by foreign mutual funds appear to be economically as well
as statistically significant.
With respect to the control variables in Model Three, we find that foreign mutual fund
ownership is higher in companies with more analyst following (Nanalyst), that are larger (Size),
that are in the MSCI World Index (Index), that are cross-listed (X-list), that have Big Five
auditors (BigFive), that have higher returns on equity (ROE), that have greater returns variability
(RetVar), and that have higher book-to-market ratios (Book-market); and that foreign fund
ownership is lower in companies with higher leverage (Lev) and higher dividend yields
(DivYield). In general, these associations are consistent with foreign fund managers preferring
companies with more information availability, greater visibility, more credible accounting
numbers, better accounting performance, greater return volatility, higher book-to-market ratios,
lower leverage and lower dividend yields.12
While many of the associations with our control variables are also consistent with prior
studies such as Bradshaw et al. [2004] and Covrig et al. [2004], it is difficult to make direct
comparisons due to differences across these studies in the time period analyzed, variables used,
and the characteristics of the foreign investors. For example, Covrig et al. [2004] only look at
associations during the 1999-2000 period, and the foreign investors in Bradshaw et al. [2004]
consist exclusively of U.S. investors.
Models One and Two in Table 4 also find that the coefficient on the IAS adoption dummy
variable is significantly positive (at p<10%, two-tailed). Further, the magnitude of the
coefficient on the IAS dummy of 0.003 in Model Two indicates that domestic mutual funds’
average ownership is 0.3% higher among IAS users when compared to firms using local
12 Although it might seem surprising that foreign fund managers prefer companies with greater return volatility, this finding is consistent with Falkenstein [1996], who finds that mutual funds are averse to companies with low volatility.

16
standards. Using the mean domestic mutual fund ownership of 4% among local standard users
reported in Table 2 (third row) as a baseline, this suggests that domestic mutual funds have an
8% (0.3% divided by 4%) higher ownership among IAS users. Thus, just as with foreign mutual
funds, the higher ownership levels of IAS users by domestic mutual funds appear to be
economically as well as statistically significant.
Similar to foreign fund managers, the control variables in Model Two indicate that domestic
fund managers also invest more heavily in companies with higher analyst following, larger size,
more credible accounting numbers, higher accounting performance, higher return volatility and
lower leverage. However, unlike foreign fund managers, Model Two shows that domestic fund
managers do not prefer companies with global visibility and trading environments but instead
prefer companies with high dividend yields, low book-to-market ratios and high earnings-to-
price ratios.
5. Additional Analyses
5.1 THE INFORMATION ENVIRONMENT
In this section we explore why IAS users have a higher proportion of foreign mutual fund
ownership. The results of our hypothesis test are consistent with the notion that IAS adoption
helps foreign investors overcome their information disadvantage, which in turn reduces their
home bias. To gather further evidence on this inference, we examine the association between
IAS adoption and mutual fund holdings across firms with different information environments. If
firm managers are successful in using IAS adoption to overcome poor information environments,
then we expect the association between IAS use and foreign investment to be relatively higher
among firms in poorer information environments.
We begin this analysis by partitioning the sample based on proxies for the firm’s information

17
environment: analyst following and firm size. We expect firms with more analyst following and
higher market values to have richer information environments, because such firms are more
closely tracked by the investment community. Thus, following Bradshaw et al. [2004], we
partition our sample into firms with high analyst following (top quartile of analysts following)
and all others; and large firms (top quartile of market value) and all others.13 We then estimate
equation (1) and test whether the coefficients on IAS differ across each partition.14
Table 5 summarizes the results of this analysis and for simplicity we report only the statistics
for the coefficient on the IAS dummy. Consistent with our prediction, the foreign mutual funds
in Panels A and B report coefficients on IAS adoption that are significantly positive (at p<1%,
two-tailed) in the partitions with lower analysts following and smaller market values, and
insignificantly different from zero in the partitions with higher analysts following and higher
market values. In addition, the difference between the coefficients in each panel is significant at
p<1% (two-tailed). While similar associations are found in the tests that examine domestic
holdings, the coefficients on IAS adoption are only significant at p<5% (two-tailed), and the
difference in the coefficients is significant at p=5% (two-tailed) across the analysts following
partitions, and insignificantly different from zero across the size partitions.
Thus, the results in Table 5 suggest that firms in poorer information environments attract
higher levels of mutual fund investment when they use IAS, and that the effect is relatively
13 As in Bradshaw et al. [2004], we partition based upon the top quartile because the distribution of analyst
following and firm size is skewed. 14 An alternative approach to the above research design is to include both the number of analysts and firm size in a
single regression and interact these terms with the IAS adoption dummy. When we run this regression, however, we find serious multicollinearity problems with the model. Specifically, using the diagnostics suggested in Belsley, Kuh and Welsch [1980] we find that several variables have tolerance statistics below the commonly used cutoff of 0.4. Thus, as in prior literature, such as Bradshaw et al. [2004], we instead partition the sample based on our variables of interest and run two separate regressions. An advantage of this approach is that the models are less restrictive and allow the coefficients on the control variables to vary across the partitions. A potential limitation of this approach, however, is that we cannot distinguish whether the number of analysts and firm size have distinctive associations with mutual fund ownership. However, we do not believe this is a significant concern because we are using both variables to capture the same underlying concept: the firm’s information environment.

18
stronger in attracting foreign investment. Overall, this is consistent with the results of our
hypothesis test, and suggests that IAS adoption helps firms in poorer information environments
attract more foreign investment.
5.2 COUNTRY-LEVEL FACTORS AND MUTUAL FUND INVESTMENT IN IAS ADOPTERS
In this section we examine the association between mutual fund investment in firms using
IAS, and two country-level factors we expect to influence investor preferences for IAS adopters:
the country’s investor protection environment (the measure of shareholder rights and law and
order tradition used in La Porta, Lopez-de-Silanes, Shleifer and Vishny [1998]) and the
disclosure environment (the number of additional disclosures required by IAS when compared to
local accounting standards, constructed from GAAP [2001]). Specifically, we repeat the
regression in equation (1) after partitioning our data into countries with strong investor
protection (countries where the investor protection measure falls into the top quartile of sample
countries) and all others; and countries with many additional disclosures (countries where the
number of additional disclosures falls into the top quartile of sample countries) and all others.
As explained below, there are several reasons why these country-level factors might influence
how IAS adoption impacts disclosure.
Following Doidge, Karolyi and Stulz [2004], we capture a country’s investor protection
environment as the product of anti-director rights and rule of law, as measured in La Porta et al.
[1998]. Prior research finds that investor protection institutions are associated with numerous
aspects of a country’s information environment, including the reliability of reported financial
information, level of corporate transparency and quality of corporate governance (Hung [2001],
Bushman, Piotroski and Smith [2004], DeFond and Hung [2004]). It is difficult, however, to
predict how these factors impact foreign investors’ preferences for IAS adopters. For example,
19
while stronger investor protection institutions are likely to make the information produced by
IAS users more credible, they also obviate the usefulness of IAS information vis-à-vis local
standards, because the level of financial disclosure in these countries is likely to be relatively
high even in the absence of IAS adoption. Similarly, while weak investor protection institutions
are likely to make IAS adoption result in a relatively larger increase in firm disclosure, the
reduced credibility of information in these countries is likely to attenuate the benefits of IAS
adoption.
In addition to investor protection, we also consider a measure that focuses more narrowly on
firm disclosure. Specifically, we use the information reported in GAAP [2001] to construct a
measure of the amount of additional disclosure required by IAS that is not required under local
GAAP.15 While our measure does not consider the nature of the additional disclosures, we
believe it provides a reasonable surrogate for the extent to which IAS provides increased
disclosure to foreign investors in each of our sample countries. If using IAS helps overcome
home bias, we expect IAS adoption to have a greater impact in countries where IAS results in
more additional disclosures.
Table 6 reports the results from this additional analysis. Panel A reports descriptive statistics
on the investor protection and additional disclosure variables, and Panels B and C report the
results of the regressions in each of the partitions. The second column of Panel A discloses the
investor protection score of each of our sample countries and reports that Belgium has the lowest
score and the United Kingdom has the highest. The third column reports the number of
additional disclosures required by IAS (compared to local GAAP) in each country, and indicates
15 GAAP [2001] presents an analysis, by country, of the differences between IAS and local GAAP, including a list
of the disclosures that are required under IAS but not under local GAAP (under the heading “There are no specific rules requiring the disclosure of”). Our disclosure measure reported in Panel A of Table 6 is computed as the number of differences reported in this list.
20
that the median number of additional disclosures is four. This column also reports that Ireland,
Mexico and the United Kingdom require the fewest additional disclosures under IAS (zero), and
that Greece and Spain require the most additional disclosures under IAS (nine).
For simplicity, we report only the statistics for the coefficient on the IAS dummy in Panels B
and C. Panel B of Table 6 reports that when we run our analysis after partitioning on the
strength of investor protection, the coefficient on the IAS dummy among the foreign mutual
funds is insignificant in the strong investor protection partition and significantly positive at
p<1% (two-tailed) in the other partition, but that the difference between the two coefficients is
insignificant. Thus, investor protection does not significantly influence foreign mutual fund
investments among companies that use IAS. In contrast, Panel C of Table 6 reports that when
we run our analysis after partitioning on whether IAS requires many additional disclosures, the
coefficients on the IAS dummy among the foreign mutual funds are significantly positive in both
partitions, and the coefficient in the partition with many additional disclosures is significantly
larger (at p<10%, two-tailed) than the coefficient in the other partition. Thus, Panel C suggests
that IAS is relatively more attractive to foreign funds when IAS adoption results in greater
disclosure, consistent with foreign investors preferring IAS because it reduces the information
disadvantage associated with cross-border investing.16
For the domestic mutual funds, Panel B reports that the coefficient on the IAS dummy in the
16 While an alternative measure for investor protection is a country’s legal origin (code law versus common law),
we do not use this measure because the strength of investor protection depends on both laws and their enforcement (Ball, Kothari and Robin [2000], Ball, Robin and Wu [2003]). Nonetheless, we repeat the analysis in Panel B of Table 6 using common-law origin (code-law origin) to proxy for strong (weak) investor protection. The analysis (not tabled) finds that our results for the foreign mutual funds remain unchanged. However, for the domestic mutual funds, the coefficient on the IAS dummy in the common-law partition is negative at p<1% (two-tailed), the coefficient on the IAS dummy in the code-law partition is positive at p<5% (two-tailed), and the difference is significant at p<1% (two-tailed). This suggests that domestic fund managers in common-law countries invest more heavily in companies that use local standards while domestic fund managers in code-law countries invest more heavily in companies that use IAS. While speculative, this finding is consistent with disclosure quality being better in common-law countries, resulting in domestic fund managers finding it easier to identify good substitute investments for firms that become more visible (and hence potentially costlier) due to IAS adoption.
21
strong investor protection partition is not statistically significant, that the coefficient on the IAS
dummy in the other partition is positive at p<1% (two-tailed), and that the difference is not
statistically significant. This suggests that investor protection does not significantly influence
domestic fund investment in companies using IAS. Similarly, Panel C reports that the coefficient
on the IAS dummy for the domestic mutual funds in the partition with many additional
disclosures is not statistically significant and that the coefficient on the IAS dummy in the other
partition is positive at p<1% (two-tailed), but that the difference between the two is not
statistically significant. Thus, the number of additional disclosures under IAS does not
significantly influence domestic mutual fund investment in companies that use IAS.
5.3 MUTUAL FUND HOLDINGS AND IAS ADOPTION ACROSS FOREIGN MUTUAL FUNDS PARTITIONED ON THEIR INVESTMENT SCOPE
In this section we examine the relation between IAS adoption and foreign mutual fund
holdings partitioned on the fund’s investment scope. Following Covrig et al. [2004] we partition
foreign mutual funds into the following three categories: (1) “country” funds which are foreign
mutual funds investing at least 80% of their equity holdings in the investee firm’s country; (2)
“regional” funds which are foreign mutual funds investing at least 80% of their equity holdings
in the investee firm’s region (where the geographical regions are defined as in the Morgan
Stanley Capital International indexes -- North America, Europe, Asia, Latin America, and
Africa/Middle East); and (3) “global” funds which are foreign mutual funds with holdings that
are not concentrated in a specific country or region.
We predict that the association between IAS adoption and foreign mutual fund holdings is
likely to be the strongest for regional funds because (1) regional fund managers are likely to be
less informed about local companies than country fund managers (who specialize in
understanding the companies in a single country), and therefore are more likely to benefit from

22
increased disclosure and (2) regional fund managers are likely to have a greater demand for
information about local companies than global funds managers (who generally invest in blue
chip companies worldwide). To test this prediction we estimate equation (1) for the foreign
mutual funds, partitioned on each of the three types of funds, and then test whether the
coefficients on IAS adoption differ across the three partitions.
Consistent with our prediction, Table 7 reports that the coefficient on IAS adoption is
significantly positive in the regression for the regional funds at p <1% (two-tailed) while the
coefficient on IAS adoption is insignificant at conventional levels in the regressions for the
country and global funds. Thus, this analysis is consistent with foreign fund managers benefiting
relatively more from IAS adoption when they are less informed and have a greater demand for
firm-specific information.
5.4 LEAD-LAG ANALYSES OF THE CHANGE IN MUTUAL FUND HOLDINGS FOLLOWING IAS ADOPTION
While only a small number of firms switch to IAS during our sample period, this section
examines the lead-lag relation between IAS adoption and changes in mutual fund holdings.
Specifically, using a reduced sample with complete information on changes, we regress the next-
period change in mutual fund holdings on two dummy variables: one for the 78 firms in our
sample that switch to IAS from local standards, and one for the 11 firms that switch from IAS to
local standards.17 In addition, we include variables capturing changes in the firm-level control
variables used in equation (1), and a variable capturing the level of mutual fund holdings in our
regression model because future changes in fund holdings may depend upon current holding
17 While conducting this test, we find that there are frequent data errors in Compustat Global for companies that
adopt IAS and then switch back to local standards. According to their annual reports, most of these companies never adopt IAS. Thus, we examine the annual reports of all sample companies that are listed in Compustat Global as having adopted IAS and switched back to local standards and make corrections accordingly. Among the 13 firms with this pattern, we identified errors for seven. Sensitivity tests find that while the coefficient on ∆IAS+
t is qualitatively the same without this correction, the coefficient on ∆IAS-
t becomes significantly positive without this correction.
23
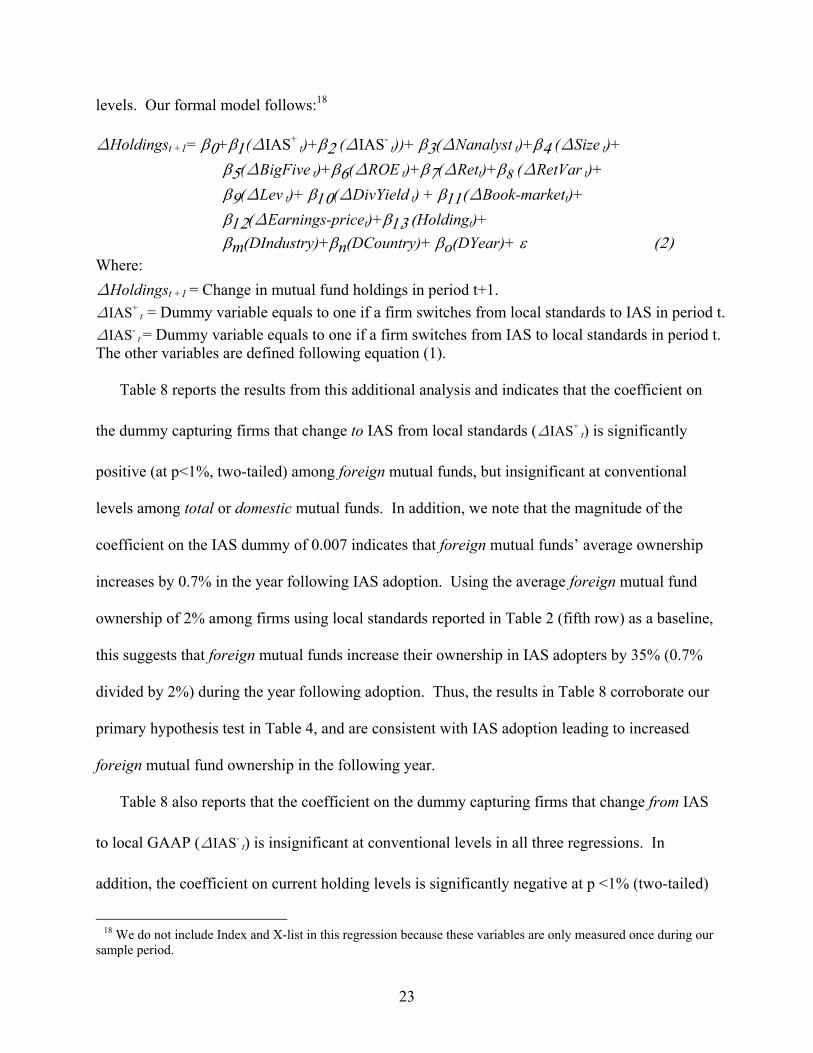
levels. Our formal model follows:18
∆Holdingst +1= β0+β1(∆IAS+ t)+β2 (∆IAS-
t))+ β3(∆Nanalyst t)+β4 (∆Size t)+ β5(∆BigFive t)+β6(∆ROE t)+β7(∆Rett)+β8 (∆RetVar t)+ β9(∆Lev t)+ β10(∆DivYield t) + β11(∆Book-markett)+ β12(∆Earnings-pricet)+β13 (Holdingt)+ βm(DIndustry)+βn(DCountry)+ βo(DYear)+ ε (2)
Where: ∆Holdingst +1 = Change in mutual fund holdings in period t+1. ∆IAS+
t = Dummy variable equals to one if a firm switches from local standards to IAS in period t. ∆IAS-
t = Dummy variable equals to one if a firm switches from IAS to local standards in period t. The other variables are defined following equation (1).
Table 8 reports the results from this additional analysis and indicates that the coefficient on
the dummy capturing firms that change to IAS from local standards (∆IAS+ t) is significantly
positive (at p<1%, two-tailed) among foreign mutual funds, but insignificant at conventional
levels among total or domestic mutual funds. In addition, we note that the magnitude of the
coefficient on the IAS dummy of 0.007 indicates that foreign mutual funds’ average ownership
increases by 0.7% in the year following IAS adoption. Using the average foreign mutual fund
ownership of 2% among firms using local standards reported in Table 2 (fifth row) as a baseline,
this suggests that foreign mutual funds increase their ownership in IAS adopters by 35% (0.7%
divided by 2%) during the year following adoption. Thus, the results in Table 8 corroborate our
primary hypothesis test in Table 4, and are consistent with IAS adoption leading to increased
foreign mutual fund ownership in the following year.
Table 8 also reports that the coefficient on the dummy capturing firms that change from IAS
to local GAAP (∆IAS- t) is insignificant at conventional levels in all three regressions. In
addition, the coefficient on current holding levels is significantly negative at p <1% (two-tailed)
18 We do not include Index and X-list in this regression because these variables are only measured once during our
sample period.

24
in all models, suggesting that higher current holding levels lead to lower future changes. While
not reported in a table, we also perform an analysis that regresses next period IAS adoption on
current period changes in mutual fund holdings (as well as changes in each of our control
variables). This analysis finds that the coefficient on the change in mutual fund holdings (for
both domestic and foreign) is insignificant at conventional levels. Thus, the adoption of IAS
leads to future increased investment by foreign mutual funds, and not the reverse.
6. Robustness Tests
6.1 RESTRICTING COUNTRIES TO EU MEMBERS
Since there is a great interest in the mandatory IAS adoption of European Union (EU)
member countries and most of the IAS users in our sample are located in EU countries, we test
whether our primary result in Table 4 is sensitive to restricting the countries to EU members
(Austria, Belgium, Denmark, Finland, France, Germany, Greece, Ireland, Italy, the Netherlands,
Portugal, Spain, Sweden and the U.K.). Thus, we repeat our Table 4 analysis after restricting the
sample to the EU countries and find (not tabled) that the coefficient on IAS remains significantly
positive in Model 3 (foreign fund holdings) at p<1% (two-tailed). Thus, our primary conclusion
is not sensitive to restricting our sample to EU member countries.
6.2 RESTRICTING COUNTRIES TO THOSE WITH A HIGH PROPORTION OF IAS ADOPTERS
Panel B of Table 1 indicates that there are several countries in our sample with few IAS
adopters. Thus, we test whether our primary result in Table 4 is robust to eliminating the
countries with low proportions of IAS users by repeating our Table 4 analysis after deleting
countries with a proportion of IAS users below or equal to the sample country median of 1%.
Our analysis (not tabled) finds that the coefficient on IAS remains significantly positive in Model

25
3 (foreign fund holdings) at p<5% (two-tailed). Thus, our primary conclusion is not sensitive to
dropping countries with low proportions of IAS adopters.
6.3 DELETING CROSS-LISTED COMPANIES
It is possible that IAS firms are more likely to issue shares on foreign stock exchanges and
therefore attract more foreign investors due to reduced trading costs derived from cross-listing.
While we include a control variable for cross-listing in our model, in this section we also test
whether our primary result is sensitive to excluding firms cross-listed on foreign stock
exchanges. Thus, we repeat our Table 4 analysis after restricting the sample to firms listed only
in local stock exchanges and find (not tabled) that the coefficient on IAS remains significantly
positive in Model 3 (foreign fund holdings) at p<1% (two-tailed). Thus, our primary conclusion
is not sensitive to deleting firms cross-listed on foreign stock exchanges.
6.4 DELETING GERMAN OR U.S. FUND OWNERSHIP
Chan et al. [2005a] document that the U.S. and Germany have the largest number of mutual
funds worldwide. To explore whether our results are driven by funds located in these countries,
we sequentially delete ownership by German and U.S. funds in our Table 4 analysis. This
analysis (not tabled) finds that the coefficient on IAS remains significantly positive in Model 3
(foreign fund holdings) at p<1% (two-tailed). Thus, our primary conclusion is not sensitive to
deleting ownership by German or U.S. funds.
6.5 DELETING NORTH AMERICAN FUND OWNERSHIP
Because our sample includes investments by U.S. and Canadian mutual funds, but does not
include U.S. and Canadian investees, we repeat our analysis in Table 4 after deleting ownership
by U.S. and Canadian funds. This analysis (not tabled) finds that the coefficient on IAS remains
26
significantly positive in Model 3 (foreign fund holdings) at p<1% (two-tailed). Thus, our
primary conclusion is not sensitive to deleting ownership by U.S. and Canadian funds.
6.6 BY-YEAR REGRESSION ANALYSIS
Because our data is pooled across four years, some of our sample firms may be
included in our analysis more than once, which may induce correlation among the error
terms in our regression test. In addition, it is possible that our results may not be robust
across the four years we analyze. Therefore, we repeat our analysis in Table 4 for each
year in our sample period. This analysis (not tabled) finds that the coefficient on IAS
remains significantly positive in Model 3 (foreign fund holdings) at p<10% (two-tailed)
in all four regressions. Thus, our primary conclusion is not affected by time series-
correlation among our error terms and holds during every year of our sample period.
6.7 CONTROLLING FOR SELF-SELECTION BIAS
Because IAS adoption is voluntary during our sample period, the firms in our analysis self
select to adopt IAS based on the perceived costs and benefits of adoption. Thus, the coefficient
on the IAS adoption dummy may suffer from self-selection bias. To assess the impact of self-
selection on our results, we implement the two-step estimation procedure in the Heckman
treatment effects model (Greene [1993]). In the first stage we use a probit model to analyze our
sample firms’ decisions to adopt IAS, where the dependent variable equals one for IAS-adopters
and zero for non-adopters. Following prior studies such as Leuz and Verrechia [2000] and Hung
and Subramanyam [2004], we predict that the decision to adopt IAS is a function of: (1) financial
performance, measured as return on assets, (2) leverage, measured as total liabilities divided by
total assets, (3) firm size, measured as the natural logarithm of the market value of equity, and
(4) financing needs, measured by cross-listing in a foreign stock exchanges and the current year
27
increase in common stock or long-term debt. In addition, we control for countries’ regulatory
environments by including a dummy variable equal to one if the country permits IAS for local
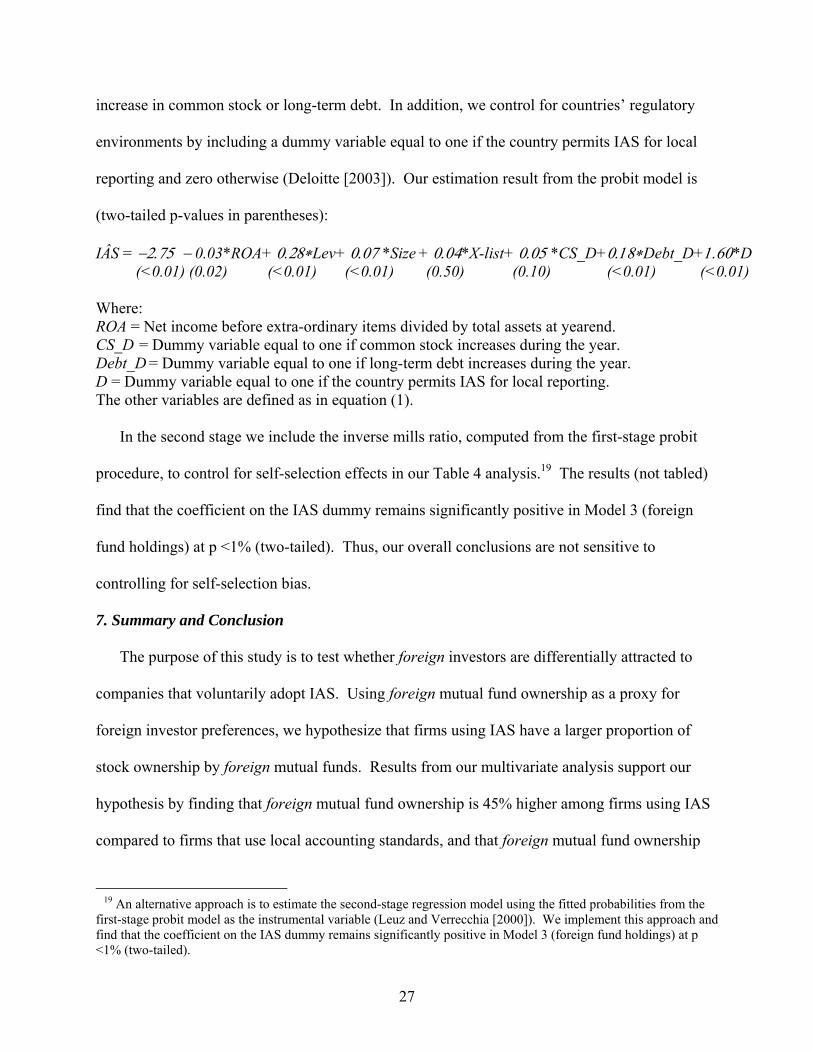
reporting and zero otherwise (Deloitte [2003]). Our estimation result from the probit model is
(two-tailed p-values in parentheses):
IÂS = −2.75 − 0.03*ROA+ 0.28∗Lev+ 0.07 *Size + 0.04*X-list+ 0.05 *CS_D+0.18∗Debt_D+1.60*D (<0.01) (0.02) (<0.01) (<0.01) (0.50) (0.10) (<0.01) (<0.01) Where: ROA = Net income before extra-ordinary items divided by total assets at yearend. CS_D = Dummy variable equal to one if common stock increases during the year. Debt_D = Dummy variable equal to one if long-term debt increases during the year. D = Dummy variable equal to one if the country permits IAS for local reporting. The other variables are defined as in equation (1).
In the second stage we include the inverse mills ratio, computed from the first-stage probit
procedure, to control for self-selection effects in our Table 4 analysis.19 The results (not tabled)
find that the coefficient on the IAS dummy remains significantly positive in Model 3 (foreign
fund holdings) at p <1% (two-tailed). Thus, our overall conclusions are not sensitive to
controlling for self-selection bias.
7. Summary and Conclusion
The purpose of this study is to test whether foreign investors are differentially attracted to
companies that voluntarily adopt IAS. Using foreign mutual fund ownership as a proxy for
foreign investor preferences, we hypothesize that firms using IAS have a larger proportion of
stock ownership by foreign mutual funds. Results from our multivariate analysis support our
hypothesis by finding that foreign mutual fund ownership is 45% higher among firms using IAS
compared to firms that use local accounting standards, and that foreign mutual fund ownership
19 An alternative approach is to estimate the second-stage regression model using the fitted probabilities from the
first-stage probit model as the instrumental variable (Leuz and Verrecchia [2000]). We implement this approach and find that the coefficient on the IAS dummy remains significantly positive in Model 3 (foreign fund holdings) at p <1% (two-tailed).
28
increases by 35% in the year following adoption.
We also find that foreign mutual fund investment among IAS adopters is concentrated: (1)
among firms that are followed by fewer analysts or with lower market capitalization, consistent
with firms in poorer information environments adopting IAS as a mechanism for increasing the
amount of information provided to foreign investors; (2) among countries where IAS adoption
results in a relatively greater amount of additional disclosure compared to local standards,
consistent with foreign investors preferring IAS because it reduces the information disadvantage
associated with cross-border investing; and (3) among foreign mutual funds with a “regional”
investment scope, which are funds specializing in geographical regions (such as Asia or Europe),
consistent with regional fund managers having a relatively higher demand for greater firm-level
disclosure than country fund managers (who tend to have greater access to firm-specific local
information) or global fund managers (who are generally interested primarily in blue chip
companies, and are not as interested in seeking out smaller new investments). Overall, our
findings are consistent with voluntary IAS adoption improving capital allocation efficiency by
reducing home bias among foreign investors.

29
References
Aggarwal, R.; L. Klapper; and P. Wysocki. “Portfolio Preferences of Foreign Institutional Investors.” Journal of Banking and Finance 29 (2005): 2919-2946.
Ahearne, A. G.; W. L Griever; and F. E. Warnock. “Information Costs and Home Bias: An
Analysis of U.S. Holdings of Foreign Equities.” Journal of International Economics 62 (2004): 313–36.
Alexander, D., and S. Archer. “European Accounting Guide.” 5th ed., Aspen Law & Business,
Gaithersbury, NY, 2003. Ashbaugh, H.. “Non-US Firms’ Accounting Standard Choices.” Journal of Accounting and
Public Policy 20 (2001): 129-153. Ashbaugh, H. and M. Pincus. “Domestic Accounting Standards, International Accounting
Standards, and the Predictability of Earnings.” Journal of Accounting Research 39 (2001): 417-434.
Ball, R.; S.P. Kothari; and A. Robin. “The Effect of International Institutional Factors on
Properties of Accounting Earnings.” Journal of Accounting and Economics 29 (2000): 1-51. Ball, R.; A. Robin; and J. S. Wu. “Incentives versus Standards: Properties of Accounting
Income in Four East Asian Countries.” Journal of Accounting and Economics 36 (2003): 235-270.
Barth, M.; W. Landsman; and M. Lang. “International Accounting Standards and Accounting
Quality.” Working paper, Stanford University and University of North Carolina, 2005. Belsley, D.A.; E. Kuh; and R.E. Welsch. “Regression Diagnostics.” Wiley, New York, NY,
1980. Bradshaw, M. T.; B. J. Bushee; and G. S. Miller. “Accounting Choice, Home Bias, and U.S.
Investment in Non-U.S. Firms.” Journal of Accounting Research 42 (2004): 795-841. Brealey, R.; I. Cooper; and E. Kaplanis. “What is International Dimension of International
Finance?” European Finance Review 3 (1999): 103-119. Burt, T., and U. Harnischfeger. “VW Switches Accounting Model.” Financial Times, 2/21/2000. Bushman, R.; J. Piotroski; and A. Smith. "What Determines Corporate Transparency?" Journal
of Accounting Research 42 (2004): 207-252. Chan, K.; V. Covrig; and L. Ng. “What Determines the Domestic Bias and Foreign Bias?
Evidence from Mutual Fund Equity Allocations Worldwide.” Journal of Finance 60 (2005a): 1495-1534.

30
Chan, K.; V. Covrig; and L. Ng. “Home Bias and the Cost of Capital.” Working paper, Hong
Kong University of Science and Technology, 2005b.
Covrig, V.; S. Lau; and L. Ng. “Do Domestic and Foreign Fund Managers Have Similar Preferences for Stock Characteristics? A Cross-country Analysis.” Working paper, University of Wisconsin-Milwaukee, 2004.
Dahlquist, M; L. Pinkowitz; R. Stulz; and R. Williamson. “Corporate Governance, Investor
Protection, and the Home Bias.” Journal of Financial Quantitative Analysis (2002): 87-110. Dahlquist, M., and G. Robertsson. “Direct Foreign Ownership, Institutional Investors, and Firm
Characteristics.” Journal of Financial Economics 59 (2001): 413-440. DeFond, M.L., and M. Hung. “Investor Protection and Corporate Governance: Evidence from
Worldwide CEO Turnover.” Journal of Accounting Research 42 (2004): 269-312. Deloitte. “IFRS in Your Pocket 2003.” Deloitte Touche Tohmatsu. 2003. Diamond, D. “Optimal Release of Information by Firms.” Journal of Finance (1985): 1071-
1094. Doidge, C.; A. Karolyi; and R. Stulz. "Why do Countries Matter so Much for Corporate
Governance?" NBER Working paper 10726, 2004. Falkenstein, E. “ Preferences for Stock Characteristics as Revealed by Mutual Fund Portfolio
Holdings.” Journal of Finance 51 (1996): 111-135. GAAP. “A Survey of National Accounting Rules Benchmarked against International Accounting
Standards.” Andersen, BDO, Deloitte Touche Tohmatsu, Ernst & Young, Grant Thornton, KPMG, PricewaterhouseCoopers, Editor Christopher W Nobes, 2001.
Gompers, P. A., and A. Metrick. “Institutional Investors and Equity Prices.” Quarterly Journal
of Economics 116 (2001): 229-259. Greene, W.E. “Econometric Analysis.” 2nd Edition, McMillan, New York, NY. 1993. He, J.; L. Ng; and Q. Wang. “Quarterly Trading Patterns of Financial Institutions.” Journal of
Business 77 (2004): 493-510. Healy, P.; A. Hutton; and K. Palepu. “Stock Performance and Intermediation Changes
Surrounding Sustained Increases in Disclosure.” Contemporary Accounting Research 16 (1999): 485-520.
Hope, O.; J. Jin; and T. Kang. “Empirical Evidence on Jurisdictions That Adopt IFRS.”
Working paper, University of Toronto and Singapore Management University, 2005.
31
Hung, M. “Accounting Standards and Value Relevance of Financial Statements: An International Analysis.” Journal of Accounting and Economics 30 (2001): 401-420.
Hung, M., and K.R. Subramanyam. “Financial Statement Effects of Adopting International
Accounting Standards: The Case of Germany.” Working paper, University of Southern California, 2004.
Kang, J. K., and R. Stulz. “Why Is There a Home Bias? An Analysis of Foreign Portfolio Equity
Ownership in Japan.” Journal of Financial Economics 46 (1997): 3-28. Karolyi, A., and R. Stulz. “Are Financial Assets Priced Locally or Globally?” in George
Constantinides, Milton Harris, and Rene M. Stulz, eds.: The Handbook of the Economics and Finance, North-Holland, New York, 2003.
Khorana, A.; H. Servaes; P. Tufano. “Explaining the Size of the Mutual Fund Industry Around
the World.” Journal of Financial Economics 78 (2005): 145-185. La Porta, R. ; F. Lopez-de-Silanes ; A. Shleifer ; and R.W. Vishny. “Law and Finance.” Journal
of Political Economy 106 (1998): 1113-1155. Leuz, C.; K. Lins; and F. Warnock. “Do Foreigners Invest Less in Poorly Governed Firms?”
Working paper, Universities of Pennsylvania, Utah and Virginia, 2005. Leuz, C., and T. Verrecchia;. “The Economic Consequences of Increased Disclosure.” Journal of
Accounting Research 38 (2000): 91-124. McCreevy, C. “IFRS – No Pain, No Gain?” Speech to the Fédération des Experts Comptables
Européens. Brussels, October 18, 2005. McKinsey & Co. Global Investor Opinion Survey: Key Findings, 2002. PricewaterhouseCoopers. International Financial Reporting Standards: Why U.S. Firms Need to
Get in the Game! PricewaterhouseCoopers, New York, New York, 2005. Wild, D. “IFRS, International Benefits.” TimesOnline, London, September 5, 2004. Young, D., and D.A. Guenther. “Financial Reporting Environments and International Capital
Mobility.” Journal of Accounting Research 41 (2003): 553-579.

32
Table 1 Country-level Sample Distribution and Descriptive Statistics
Panel A: Country-level Data on Numbers of Observations and Proportion of IAS Users
Country Total firm-years
Proportion of total firm- years using IAS
Proportion of market value using IAS
Argentina 85 0% 0% Australia 951 0% 0% Austria 218 48% 67% Belgium 252 10% 25% Brazil 399 0% 0% Denmark 307 7% 11% Finland 304 9% 73% France 1,439 8% 20% Germany 1,347 36% 54% Greece 200 1% 2% Hong Kong 417 1% 0% India 427 0% 0% Ireland 120 0% 0% Italy 506 31% 26% Japan 8,475 0% 0% Malaysia 1,464 1% 1% Mexico 168 1% 0% Netherlands 384 6% 5% New Zealand 185 2% 0% Norway 266 1% 0% Portugal 93 4% 1% Singapore 695 0% 0% South Africa 293 13% 33% Spain 395 1% 2% Sweden 574 4% 11% Switzerland 437 58% 91% Taiwan 563 0% 0% Thailand 324 1% 1% United Kingdom 3,304 0% 0% Total 24,592 5% 15%
33
Table 1, continued Panel B: Country-level Data on Mutual Fund Holdings
Country Total fund holdings Domestic fund holdings Foreign fund holdings Simple
average Market-value
weighted average
Simple average
Market-value weighted average
Simple average
Market-value weighted average
Argentina 3% 1% 0% 0% 3% 1% Australia 7% 9% 5% 4% 3% 5% Austria 7% 8% 2% 2% 6% 6% Belgium 6% 8% 4% 4% 2% 4% Brazil 6% 6% 4% 3% 2% 3% Denmark 6% 8% 3% 1% 3% 7% Finland 11% 14% 3% 1% 8% 14% France 8% 15% 4% 4% 4% 11% Germany 10% 16% 6% 9% 4% 7% Greece 6% 5% 5% 4% 1% 2% Hong Kong 4% 8% 1% 2% 3% 6% India 5% 7% 3% 3% 2% 4% Ireland 10% 11% 0% 0% 10% 11% Italy 6% 13% 3% 4% 3% 8% Japan 3% 8% 1% 2% 2% 6% Malaysia 3% 6% 2% 2% 1% 3% Mexico 7% 7% 3% 2% 4% 5% Netherlands 14% 13% 4% 1% 9% 12% New Zealand 4% 8% 0% 1% 4% 8% Norway 13% 16% 8% 7% 5% 9% Portugal 7% 14% 3% 2% 4% 11% Singapore 3% 8% 1% 1% 2% 7% South Africa 9% 9% 5% 4% 3% 5% Spain 9% 14% 4% 4% 5% 10% Sweden 15% 16% 9% 9% 6% 8% Switzerland 10% 14% 4% 3% 6% 11% Taiwan 3% 7% 2% 2% 2% 5% Thailand 3% 4% 1% 1% 2% 4% United Kingdom 17% 13% 14% 7% 2% 6% Mean 7% 10% 4% 3% 4% 7% Median 7% 8% 3% 2% 3% 6% Std. dev. 4% 4% 3% 2% 2% 3%

34
Table 1, continued Variable definitions: Total fund holdings = Percentage ownership by both domestic and foreign mutual funds. Domestic fund holdings = Percentage ownership by mutual funds located in the same country as the company. Foreign fund holdings = Percentage ownership by mutual funds in foreign countries.

35
Table 2 Descriptive Statistics on Firm-level Variables (N=24,592 Firm-years, with 1,315 IAS Firm-years)
Variable Accounting standards Mean Median Std. dev. t-test p-values a
Wilcoxon p-values b Total fund holdings Local standards 0.07 0.03 0.08 <0.01 IAS 0.11 0.08 0.10 <0.01 Domestic fund holdings Local standards 0.04 0.01 0.07 <0.01 IAS 0.05 0.03 0.05 <0.01 Foreign fund holdings Local standards 0.02 0.01 0.05 <0.01 IAS 0.06 0.03 0.07 <0.01 Nanalyst Local standards 4.00 1.00 5.68 <0.01 IAS 7.16 4.00 8.17 <0.01 Size Local standards 5.07 4.84 1.95 <0.01 IAS 5.42 5.30 2.20 <0.01 Index Local standards 0.10 0.00 0.30 <0.01 IAS 0.18 0.00 0.38 <0.01 X-list Local standards 0.07 0.00 0.25 0.02 IAS 0.09 0.00 0.28 0.01 BigFive Local standards 0.46 0.00 0.50 <0.01 IAS 0.62 1.00 0.48 <0.01 ROE Local standards -0.01 0.05 0.44 <0.01 IAS -0.10 0.06 0.58 0.10 Ret Local standards 0.05 -0.05 0.60 <0.01 IAS -0.11 -0.17 0.55 <0.01 RetVar Local standards 0.13 0.11 0.07 <0.01 IAS 0.15 0.12 0.09 <0.01 Lev Local standards 0.55 0.56 0.22 <0.01 IAS 0.58 0.60 0.20 <0.01

36
Table 2, continued
Variable Accounting standards Mean Median Std. dev. t-test p-values
Wilcoxon p-values DivYield Local standards 0.02 0.01 0.02 <0.01 IAS 0.01 0.00 0.02 <0.01 Book-market Local standards 1.08 0.85 0.92 <0.01 IAS 0.98 0.73 0.90 <0.01 Earnings-price Local standards -0.04 0.04 0.36 <0.01 IAS -0.16 0.03 0.57 <0.01
Variable definitions: Total fund holdings = Percentage ownership by both domestic and foreign mutual funds. Domestic fund holdings = Percentage ownership by mutual funds located in the same country as the company. Foreign fund holdings = Percentage ownership by mutual funds in foreign countries. IAS = Dummy variable equal to one if a firm prepares its financial statements based on IAS. Nanalyst = Number of analysts following the firm. Size = The natural logarithm of the market value of equity in millions of U.S. dollar. Index = Dummy variable equal to one if a firm is included in MSCI World index as of December 2002. X-list = Dummy variable equal to one if a firm has securities cross-listed on foreign stock exchanges as of 2001. BigFive = Dummy variable equal to one if a firm is audit by a member of Big Five audit firms. ROE = Net income before extra-ordinary items divided by book value of equity. Ret = Stock return over the fiscal year. RetVar = Standard deviation of monthly stock returns over the fiscal year. Lev =Total liabilities divided by total assets. DivYield = Total dividends divided by market values. Book-market = Book value of equity divided by market value of equity. Earnings-price = Net income divided by market value of equity.
a The t-test tests the null hypothesis that the mean difference between firms using IAS and those using local standards is zero. b The Wilcoxon test, a non-parametric statistical method, tests the null hypothesis that the median difference between firms using IAS and those using local standards is zero.
37
Table 3 Pearson Correlation Coefficients Among Firm-specific Variables with Two-tailed p-values in Italics (N=24,592 Firm-years)
Variable
Domestic fund
holdings
Foreign fund
holdings IAS Nanalyst Size Index X-list BigFive ROE Ret RetVar Lev DivYieldBook-
market
Earnings-
price Total fund holdings 0.84 0.64 0.10 0.31 0.23 0.19 0.09 0.32 0.07 0.02 0.02 -0.05 0.14 -0.24 0.06 <0.01 <0.01 <0.01 <0.01 <.00 <0.01 <0.01 <0.01 <0.01 <0.01 <0.01 <0.01 <0.01 <0.01 <0.01 Domestic fund holdings 0.12 0.02 0.11 0.08 0.03 -0.02 0.28 0.05 0.01 0.02 -0.03 0.18 -0.20 0.04 <0.01 <0.01 <0.01 <.00 <0.01 <0.01 <0.01 <0.01 0.02 <0.01 <0.01 <0.01 <0.01 <0.01 Foreign fund holdings 0.15 0.40 0.30 0.31 0.19 0.18 0.07 0.02 0.01 -0.03 0.01 -0.16 0.06 <0.01 <0.01 <0.01 <0.01 <0.01 <0.01 <0.01 <0.01 0.19 <0.01 0.29 <0.01 <0.01 IAS 0.12 0.04 0.06 0.04 0.08 -0.05 -0.06 0.06 0.03 -0.05 -0.03 -0.07 <0.01 <0.01 <0.01 <0.01 <0.01 <0.01 <0.01 <0.01 <0.01 <0.01 <0.01 <0.01 Nanalyst 0.61 0.49 0.34 0.22 0.10 0.02 -0.07 0.05 0.01 -0.25 0.09 <0.01 <0.01 <0.01 <0.01 <0.01 0.01 <0.01 <0.01 0.28 <0.01 <0.01 Size 0.50 0.33 0.10 0.18 0.20 -0.14 0.02 0.02 -0.40 0.24 <0.01 <0.01 <0.01 <0.01 <0.01 <0.01 <0.01 <0.01 <0.01 <0.01 Index 0.32 0.04 0.06 0.02 -0.10 0.06 -0.00 -0.18 0.06 <0.01 <0.01 <0.01 0.02 <0.01 <0.01 0.77 <0.01 <0.01 X-list 0.10 0.03 0.02 -0.02 0.04 -0.00 -0.09 0.02 <0.01 0.01 0.01 <0.01 <0.01 0.86 <0.01 0.01 BigFive 0.02 0.03 0.04 -0.03 0.09 -0.16 -0.02 <0.01 <0.01 <0.01 <0.01 <0.01 <0.01 0.01 ROE 0.17 -0.23 -0.10 0.16 -0.04 0.54 <0.01 <0.01 <0.01 <0.01 <0.01 <0.01 Ret 0.07 -0.08 -0.00 -0.21 0.22 <0.01 <0.01 0.51 <0.01 <0.01 RetVar 0.03 -0.25 -0.09 -0.31 <0.01 <0.01 <0.01 <0.01 Lev -0.06 -0.16 -0.21 <0.01 <0.01 <0.01 DivYield 0.16 0.21 <0.01 <0.01 Book-market -0.07 <0.01 Variable definitions: See Table 2.

38
Table 4
Regression of Mutual Fund Holdings on IAS Dummy and Control Variables (N=24,592 Firm-years)
Total(or Domestic or Foreign) fund holdings= β0+β1(IAS)+ β2 (Nanalyst)+β3((Size)+ β4(Index)+ β5(X-list)+β6(BigFive)+β7 (ROE)+β8 (Ret)+
β9 (RetVar)+β10(Lev)+ β11(DivYield)+β12(Book-market)+ β13 (Earnings-price)+ βm(DIndustry)+βn(DCountry)+ βo(DYear)+ ε
Independent variable Model One
Total fund holdings Model Two
Domestic fund holdings Model Three
Foreign fund holdings
Coeff. Two-tailed p-values Coeff. Two-tailed p-values Coeff. Two-tailed p-values
Intercept 0.106 <0.001 0.120 <0.001 -0.014 <0.001 IAS 0.012 <0.001 0.003 0.061 0.009 <0.001 Nanalyst 0.003 <0.001 0.001 <0.001 0.002 <0.001 Size 0.006 <0.001 0.002 <0.001 0.004 <0.001 Index 0.010 <0.001 -0.009 <0.001 0.019 <0.001 X-list -0.014 <0.001 -0.017 <0.001 0.004 0.001 BigFive 0.012 <0.001 0.007 <0.001 0.005 <0.001 ROE 0.009 <0.001 0.006 <0.001 0.003 <0.001 Ret -0.001 0.503 -0.001 0.361 0.000 0.967 RetVar 0.047 <0.001 0.012 0.020 0.035 <0.001 Lev -0.020 <0.001 -0.006 <0.001 -0.014 <0.001 DivYield 0.106 <0.001 0.127 <0.001 -0.021 0.093 Book-market -0.003 <0.001 -0.004 <0.001 0.001 0.008 Earnings-price 0.004 0.004 0.003 0.002 0.001 0.396 Industry dummies Included Included Included Country dummies Included Included Included Year dummies Included Included Included Adj. R2 0.43 0.45 0.29 Variable definitions: See Table 2.

39
Table 5
Coefficients on IAS from Regressing Mutual Fund Holdings on IAS Dummy and Control Variables, Partitioned on Firm Information Environment Sub-samples (N=24,592 Firm-years)
Panel A: Coefficients on IAS with Two-tailed p-values in Parentheses, Partitioned by Number of Analysts (6,357 Firm-years for Companies with High Analysts Following versus 18,235 for Other Companies) a
Independent variable Total fund holdings Domestic fund holdings Foreign fund holdings
High analysts
following Others Diff. High analysts
following Others Diff. High analysts
following Others Diff.
IAS
-0.004 (0.301)
0.018
(<0.001)
-0.022
(<0.001)
-0.002 (0.457)
0.005
(0.037)
-0.007 (0.050)
-0.002 (0.450)
0.013
(<0.001)
-0.015
(<0.001)
Other firm-control variables Included Included Included Included Included Included
Industry, country and year dummies Included Included Included Included Included Included
Panel B: Coefficients on IAS with Two-tailed p-values in Parentheses, Partitioned by Firm Size (6,160 Firm-years for Companies with High Market Values versus 18,432 for Other Companies) a
Independent variable Total fund holdings Domestic fund holdings Foreign fund holdings
High market
values Others Diff. High market
values Others Diff. High market
values Others Diff.
IAS
0.007 (0.077)
0.015
(<0.001)
-0.008 (0.076)
0.005
(0.111)
0.005
(0.025)
0.000
(0.991)
0.002
(0.371)
0.011
(<0.001)
-0.009 (0.004)
Other firm-control variables Included Included Included Included Included Included
Industry, country and year dummies Included Included Included Included Included Included
a The sample is classified into a high subgroup (top quartile) and others.
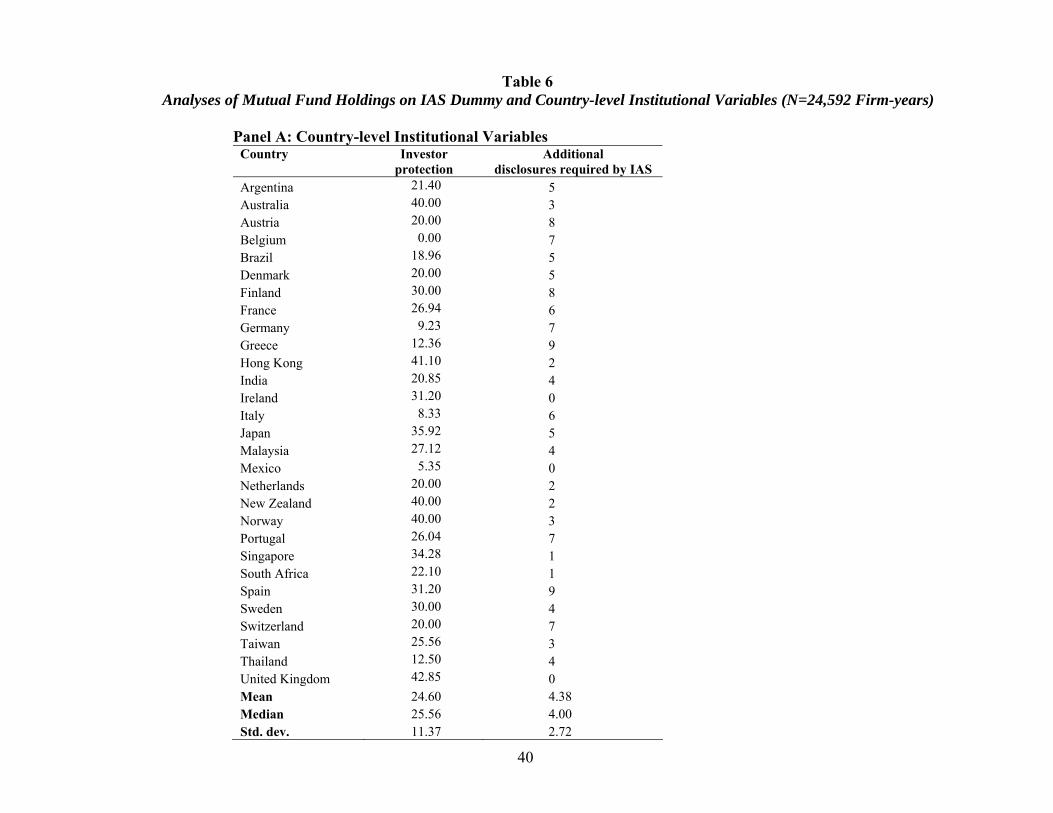
40
Table 6 Analyses of Mutual Fund Holdings on IAS Dummy and Country-level Institutional Variables (N=24,592 Firm-years)
Panel A: Country-level Institutional Variables
Country Investor protection
Additional disclosures required by IAS
Argentina 21.40 5 Australia 40.00 3 Austria 20.00 8 Belgium 0.00 7 Brazil 18.96 5 Denmark 20.00 5 Finland 30.00 8 France 26.94 6 Germany 9.23 7 Greece 12.36 9 Hong Kong 41.10 2 India 20.85 4 Ireland 31.20 0 Italy 8.33 6 Japan 35.92 5 Malaysia 27.12 4 Mexico 5.35 0 Netherlands 20.00 2 New Zealand 40.00 2 Norway 40.00 3 Portugal 26.04 7 Singapore 34.28 1 South Africa 22.10 1 Spain 31.20 9 Sweden 30.00 4 Switzerland 20.00 7 Taiwan 25.56 3 Thailand 12.50 4 United Kingdom 42.85 0 Mean 24.60 4.38 Median 25.56 4.00 Std. dev. 11.37 2.72
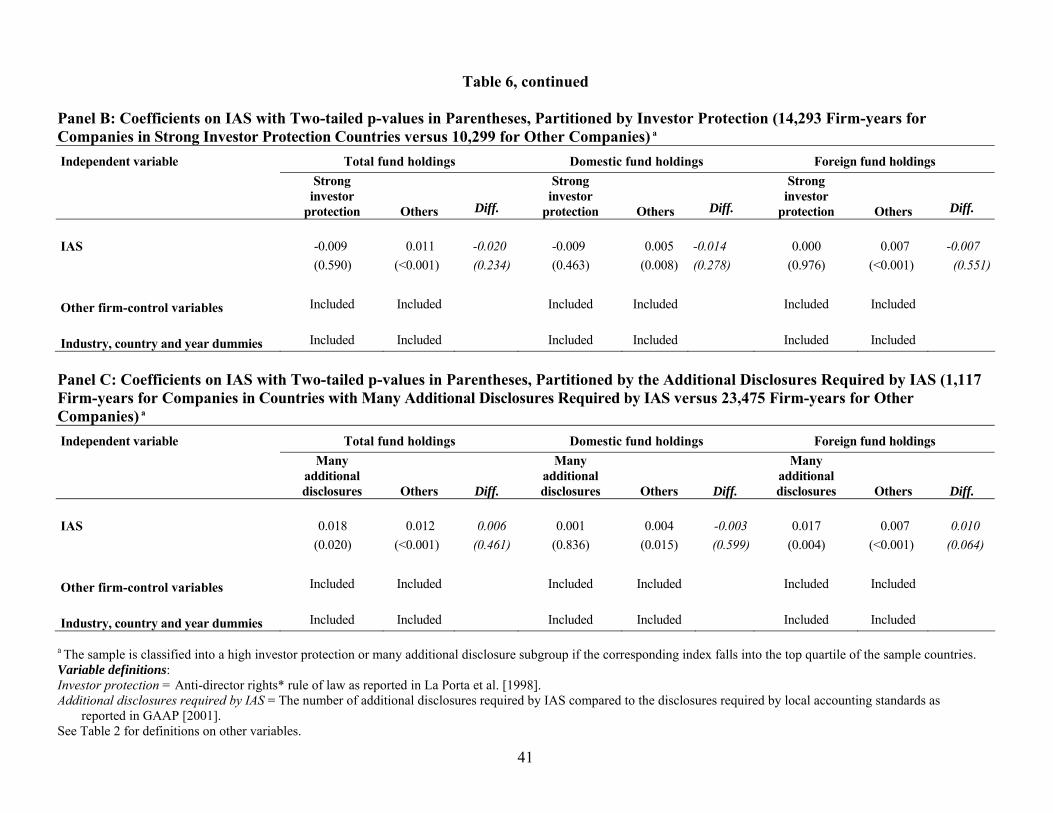
41
Table 6, continued
Panel B: Coefficients on IAS with Two-tailed p-values in Parentheses, Partitioned by Investor Protection (14,293 Firm-years for Companies in Strong Investor Protection Countries versus 10,299 for Other Companies) a Independent variable Total fund holdings Domestic fund holdings Foreign fund holdings
Strong investor
protection Others Diff.
Strong investor
protection Others Diff.
Strong investor
protection Others Diff.
IAS
-0.009 (0.590)
0.011
(<0.001)
-0.020 (0.234)
-0.009 (0.463)
0.005
(0.008)
-0.014 (0.278)
0.000
(0.976)
0.007
(<0.001)
-0.007 (0.551)
Other firm-control variables Included Included Included Included Included Included
Industry, country and year dummies Included Included Included Included Included Included
Panel C: Coefficients on IAS with Two-tailed p-values in Parentheses, Partitioned by the Additional Disclosures Required by IAS (1,117 Firm-years for Companies in Countries with Many Additional Disclosures Required by IAS versus 23,475 Firm-years for Other Companies) a Independent variable Total fund holdings Domestic fund holdings Foreign fund holdings
Many additional disclosures Others Diff.
Many additional disclosures Others Diff.
Many additional disclosures Others Diff.
IAS
0.018 (0.020)
0.012
(<0.001)
0.006
(0.461)
0.001
(0.836)
0.004
(0.015)
-0.003 (0.599)
0.017
(0.004)
0.007
(<0.001)
0.010
(0.064)
Other firm-control variables Included Included Included Included Included Included
Industry, country and year dummies Included Included Included Included Included Included
a The sample is classified into a high investor protection or many additional disclosure subgroup if the corresponding index falls into the top quartile of the sample countries. Variable definitions: Investor protection = Anti-director rights* rule of law as reported in La Porta et al. [1998]. Additional disclosures required by IAS = The number of additional disclosures required by IAS compared to the disclosures required by local accounting standards as
reported in GAAP [2001]. See Table 2 for definitions on other variables.
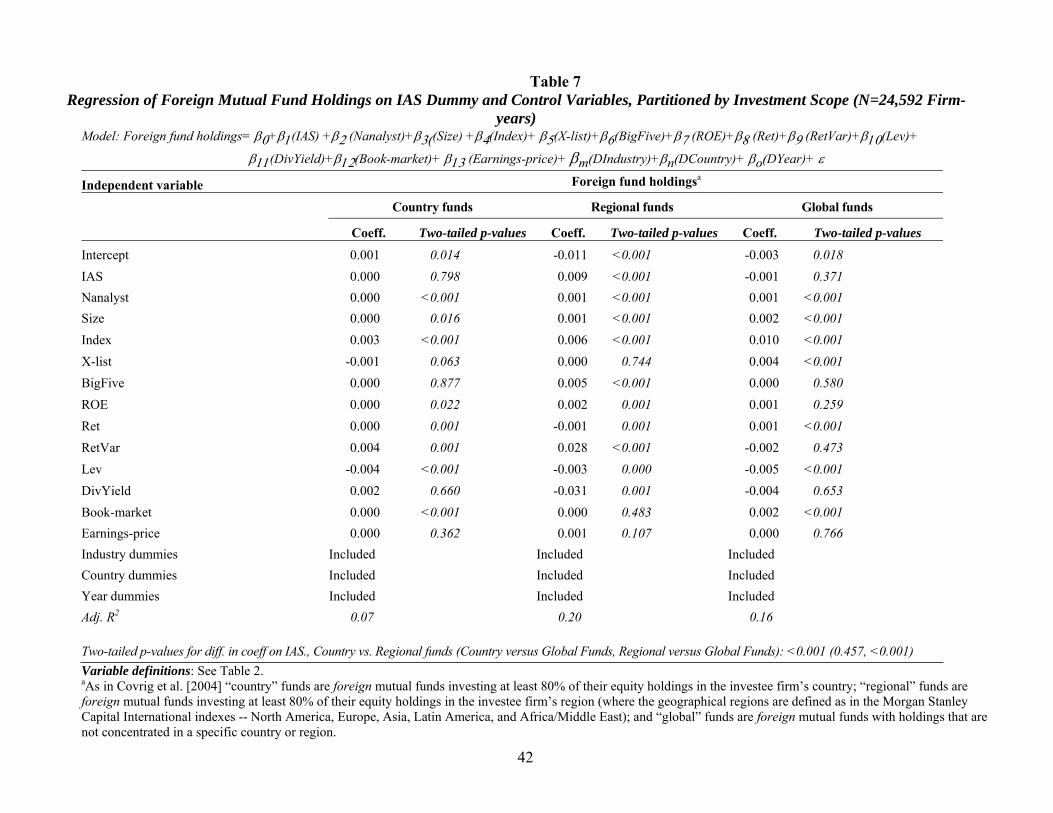
42
Table 7 Regression of Foreign Mutual Fund Holdings on IAS Dummy and Control Variables, Partitioned by Investment Scope (N=24,592 Firm-
years) Model: Foreign fund holdings= β0+β1(IAS) +β2 (Nanalyst)+β3((Size) +β4(Index)+ β5(X-list)+β6(BigFive)+β7 (ROE)+β8 (Ret)+β9 (RetVar)+β10(Lev)+
β11(DivYield)+β12(Book-market)+ β13 (Earnings-price)+ βm(DIndustry)+βn(DCountry)+ βo(DYear)+ ε
Independent variable Foreign fund holdingsa
Country funds Regional funds Global funds
Coeff. Two-tailed p-values Coeff. Two-tailed p-values Coeff. Two-tailed p-values
Intercept 0.001 0.014 -0.011 <0.001 -0.003 0.018 IAS 0.000 0.798 0.009 <0.001 -0.001 0.371 Nanalyst 0.000 <0.001 0.001 <0.001 0.001 <0.001 Size 0.000 0.016 0.001 <0.001 0.002 <0.001 Index 0.003 <0.001 0.006 <0.001 0.010 <0.001 X-list -0.001 0.063 0.000 0.744 0.004 <0.001 BigFive 0.000 0.877 0.005 <0.001 0.000 0.580 ROE 0.000 0.022 0.002 0.001 0.001 0.259 Ret 0.000 0.001 -0.001 0.001 0.001 <0.001 RetVar 0.004 0.001 0.028 <0.001 -0.002 0.473 Lev -0.004 <0.001 -0.003 0.000 -0.005 <0.001 DivYield 0.002 0.660 -0.031 0.001 -0.004 0.653 Book-market 0.000 <0.001 0.000 0.483 0.002 <0.001 Earnings-price 0.000 0.362 0.001 0.107 0.000 0.766 Industry dummies Included Included Included Country dummies Included Included Included Year dummies Included Included Included Adj. R2 0.07 0.20 0.16 Two-tailed p-values for diff. in coeff on IAS., Country vs. Regional funds (Country versus Global Funds, Regional versus Global Funds): <0.001 (0.457, <0.001) Variable definitions: See Table 2. aAs in Covrig et al. [2004] “country” funds are foreign mutual funds investing at least 80% of their equity holdings in the investee firm’s country; “regional” funds are foreign mutual funds investing at least 80% of their equity holdings in the investee firm’s region (where the geographical regions are defined as in the Morgan Stanley Capital International indexes -- North America, Europe, Asia, Latin America, and Africa/Middle East); and “global” funds are foreign mutual funds with holdings that are not concentrated in a specific country or region.
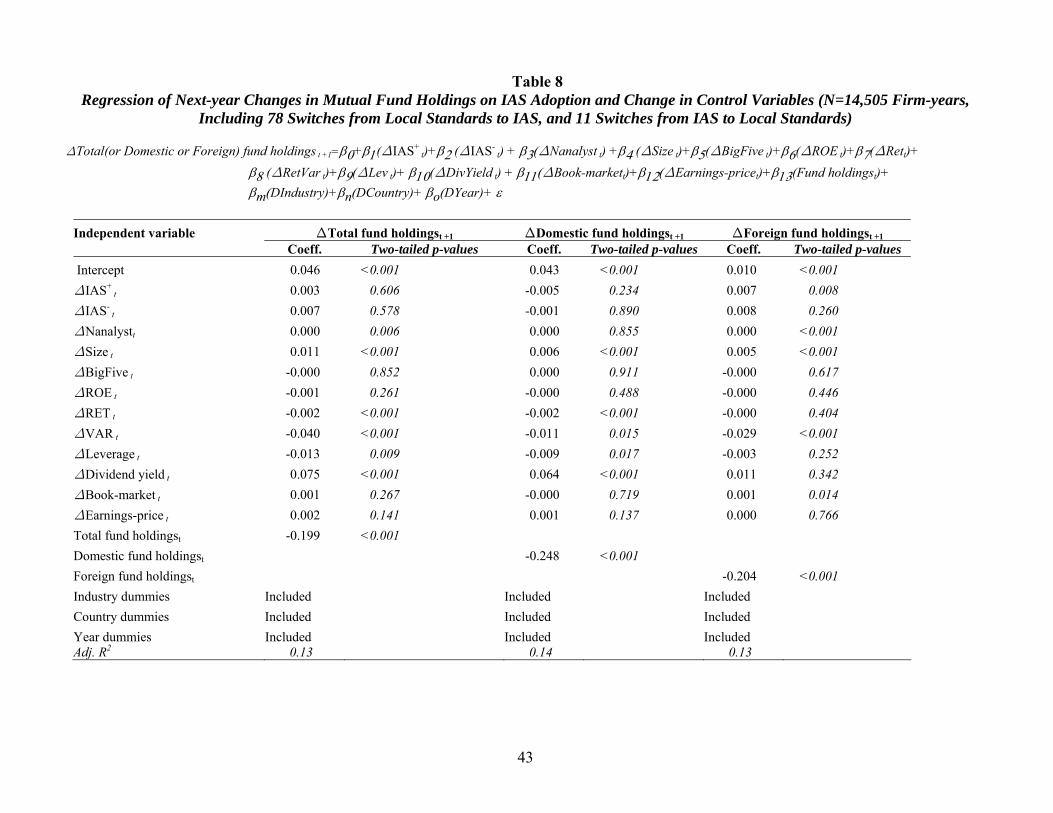
43
Table 8 Regression of Next-year Changes in Mutual Fund Holdings on IAS Adoption and Change in Control Variables (N=14,505 Firm-years,
Including 78 Switches from Local Standards to IAS, and 11 Switches from IAS to Local Standards) ∆Total(or Domestic or Foreign) fund holdings t +1=β0+β1(∆IAS+
t)+β2 (∆IAS- t) + β3(∆Nanalyst t) +β4 (∆Size t)+β5(∆BigFive t)+β6(∆ROE t)+β7(∆Rett)+
β8 (∆RetVar t)+β9(∆Lev t)+ β10(∆DivYield t) + β11(∆Book-markett)+β12(∆Earnings-pricet)+β13(Fund holdingst)+ βm(DIndustry)+βn(DCountry)+ βo(DYear)+ ε
Independent variable ∆Total fund holdingst +1 ∆Domestic fund holdingst +1 ∆Foreign fund holdingst +1 Coeff. Two-tailed p-values Coeff. Two-tailed p-values Coeff. Two-tailed p-values Intercept 0.046 <0.001 0.043 <0.001 0.010 <0.001 ∆IAS+
t 0.003 0.606 -0.005 0.234 0.007 0.008 ∆IAS-
t 0.007 0.578 -0.001 0.890 0.008 0.260 ∆Nanalystt 0.000 0.006 0.000 0.855 0.000 <0.001 ∆Size t 0.011 <0.001 0.006 <0.001 0.005 <0.001 ∆BigFive t -0.000 0.852 0.000 0.911 -0.000 0.617 ∆ROE t -0.001 0.261 -0.000 0.488 -0.000 0.446 ∆RET t -0.002 <0.001 -0.002 <0.001 -0.000 0.404 ∆VAR t -0.040 <0.001 -0.011 0.015 -0.029 <0.001 ∆Leverage t -0.013 0.009 -0.009 0.017 -0.003 0.252 ∆Dividend yield t 0.075 <0.001 0.064 <0.001 0.011 0.342 ∆Book-market t 0.001 0.267 -0.000 0.719 0.001 0.014 ∆Earnings-price t 0.002 0.141 0.001 0.137 0.000 0.766 Total fund holdingst -0.199 <0.001 Domestic fund holdingst -0.248 <0.001 Foreign fund holdingst -0.204 <0.001 Industry dummies Included Included Included Country dummies Included Included Included Year dummies Included Included Included Adj. R2 0.13 0.14 0.13

44
Table 8, continued
Variable definitions: ∆IAS+
t = Dummy variable equal to one if a firm switches from local standards to IAS in year t. ∆IAS-
t = Dummy variable equal to one if a firm switches from IAS to local standards in year t. See Table 2 for definitions on other variables.
Related Documents


