Holographic low concentration optical system increasing light collection efficiency of regular solar panels Jianbo Zhao , a, * Benjamin Chrysler, b and Raymond K. Kostuk a,b a University of Arizona, Electrical and Computer Engineering Department, Tucson, Arizona, United States b University of Arizona, James C Wyant College of Optical Sciences, Arizona, United States Abstract. Conventional photovoltaic (PV) modules (exclude interdigitated back contact mod- ules) with silicon or gallium arsenide PV cells often have significant inactive module surface area. This results from wafer cutting techniques and metal contacts that reduce the module’s collection area and the resultant power conversion efficiency. A holographic light collector (HLC) combining a low-cost holographic optical element and a diffuser into conventional PV modules is proposed and evaluated to collect the solar illumination over the inactive module area. The angular tolerance and extra annual energy yield (EY) of the HLC are analyzed. It is found that improvements in EY of 4.5%, 4.1%, and 3.8% can be obtained when PV panels are deployed with two-axis tracking systems, single-axis tracking systems, and without tracking systems, respectively. © 2021 Society of Photo-Optical Instrumentation Engineers (SPIE) [DOI: 10 .1117/1.JPE.11.027002] Keywords: photovoltaic module; holographic light collector; holographic optical element; dif- fuser; waveguide. Paper 21005 received Jan. 21, 2021; accepted for publication May 6, 2021; published online May 25, 2021. 1 Introduction During the past several decades, photovoltaic (PV) solar energy conversion has played an increasingly important role as a renewable energy source. 1 The $∕W PV costs of PV modules have dropped dramatically, primarily due to improved manufacturing methods and increased solar cell efficiency. 1,2 It has been reported that individual PV cell efficiencies are approaching 27%, 3 and the best module power conversion efficiency is about 23%. 4 However, the $∕W PV is not expected to decrease hugely due to the maturing wafer manufacturing industry and the small difference between the experimental efficiency and the theoretical efficiency limitation. 5 Thus in order to increase the energy yield (EY) of a regular PV module, new light collection techniques with low component and manufacturing costs need to be employed. 6 As efficient, lightweight, and low-cost methods, holographic solar concentration techniques such as holographic lens, planar holographic concentrator, and spectrum splitting have shown significant potential in increasing the EY of PV systems. 7–16 Many types of PV cells used in modules are not perfectly square in shape. 1,2 When assembled in modules, this results in a certain percentage of the module area not occupied by active PV cell material and solar illumination that is not collected for electrical conversion. Other factors, such as bus and finger contacts [exclude interdigitated back contact (IBC) cells] and the module pack- age configuration, also contribute to inactive module surface area (IMSA) that does not con- tribute to PV solar energy conversion. Even the new half-cell modules designed to minimize the space between cells still have an IMSA ratio of ∼6%. Table 1 shows several commercial solar panels’ specifications with the IMSA ratio varying from 6% (half-cell module) to 11% (old module). The IMSA ratio is defined by IMSAR ¼ A HLC ∕A M . A HLC and A M are the IMSA area and the whole PV module surface area, respectively. In this paper, a light management technique to capture the solar energy falling on the IMSA is described using a holographic light collector (HLC) consisting of a reflection type volume *Address all correspondence to Jianbo Zhao, [email protected] Journal of Photonics for Energy 027002-1 Apr–Jun 2021 • Vol. 11(2) Downloaded From: https://www.spiedigitallibrary.org/journals/Journal-of-Photonics-for-Energy on 10 Jan 2022 Terms of Use: https://www.spiedigitallibrary.org/terms-of-use

Welcome message from author
This document is posted to help you gain knowledge. Please leave a comment to let me know what you think about it! Share it to your friends and learn new things together.
Transcript
Holographic low concentration optical system increasinglight collection efficiency of regular solar panels
Jianbo Zhao ,a,* Benjamin Chrysler,b and Raymond K. Kostuka,b
aUniversity of Arizona, Electrical and Computer Engineering Department, Tucson,Arizona, United States
bUniversity of Arizona, James C Wyant College of Optical Sciences,Arizona, United States
Abstract. Conventional photovoltaic (PV) modules (exclude interdigitated back contact mod-ules) with silicon or gallium arsenide PV cells often have significant inactive module surfacearea. This results from wafer cutting techniques and metal contacts that reduce the module’scollection area and the resultant power conversion efficiency. A holographic light collector(HLC) combining a low-cost holographic optical element and a diffuser into conventionalPV modules is proposed and evaluated to collect the solar illumination over the inactive modulearea. The angular tolerance and extra annual energy yield (EY) of the HLC are analyzed. It isfound that improvements in EY of 4.5%, 4.1%, and 3.8% can be obtained when PV panels aredeployed with two-axis tracking systems, single-axis tracking systems, and without trackingsystems, respectively. © 2021 Society of Photo-Optical Instrumentation Engineers (SPIE) [DOI: 10.1117/1.JPE.11.027002]
Keywords: photovoltaic module; holographic light collector; holographic optical element; dif-fuser; waveguide.
Paper 21005 received Jan. 21, 2021; accepted for publication May 6, 2021; published onlineMay 25, 2021.
1 Introduction
During the past several decades, photovoltaic (PV) solar energy conversion has played anincreasingly important role as a renewable energy source.1 The $∕WPV costs of PV moduleshave dropped dramatically, primarily due to improved manufacturing methods and increasedsolar cell efficiency.1,2 It has been reported that individual PV cell efficiencies are approaching27%,3 and the best module power conversion efficiency is about 23%.4 However, the $∕WPV isnot expected to decrease hugely due to the maturing wafer manufacturing industry and the smalldifference between the experimental efficiency and the theoretical efficiency limitation.5 Thus inorder to increase the energy yield (EY) of a regular PV module, new light collection techniqueswith low component and manufacturing costs need to be employed.6 As efficient, lightweight,and low-cost methods, holographic solar concentration techniques such as holographic lens,planar holographic concentrator, and spectrum splitting have shown significant potential inincreasing the EY of PV systems.7–16
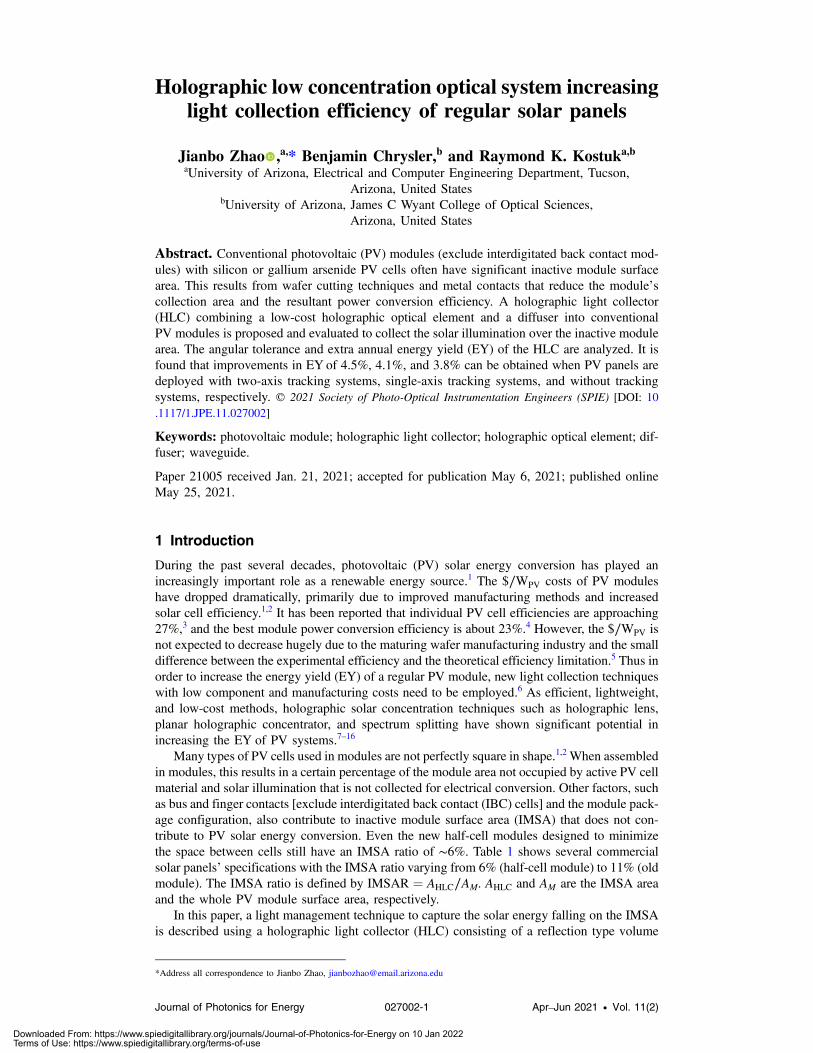
Many types of PV cells used in modules are not perfectly square in shape.1,2 When assembledin modules, this results in a certain percentage of the module area not occupied by active PV cellmaterial and solar illumination that is not collected for electrical conversion. Other factors, suchas bus and finger contacts [exclude interdigitated back contact (IBC) cells] and the module pack-age configuration, also contribute to inactive module surface area (IMSA) that does not con-tribute to PV solar energy conversion. Even the new half-cell modules designed to minimizethe space between cells still have an IMSA ratio of ∼6%. Table 1 shows several commercialsolar panels’ specifications with the IMSA ratio varying from 6% (half-cell module) to 11% (oldmodule). The IMSA ratio is defined by IMSAR ¼ AHLC∕AM. AHLC and AM are the IMSA areaand the whole PV module surface area, respectively.
In this paper, a light management technique to capture the solar energy falling on the IMSAis described using a holographic light collector (HLC) consisting of a reflection type volume
*Address all correspondence to Jianbo Zhao, [email protected]
Journal of Photonics for Energy 027002-1 Apr–Jun 2021 • Vol. 11(2)
Downloaded From: https://www.spiedigitallibrary.org/journals/Journal-of-Photonics-for-Energy on 10 Jan 2022Terms of Use: https://www.spiedigitallibrary.org/terms-of-use
holographic element combined with a diffuser. The system is analyzed to determine the addi-tional EY in a specific location (Tucson, Arizona) by considering the solar illumination’s variedincident angle at different times and seasons. The results show that 53% of the illuminationfalling onto the IMSA can be collected and converted into extra electricity when two-axistracking systems are deployed together with the PV systems. This corresponds to an increasein EY of 4.5% when the IMSA is 8.25% of the entire PV panel surface area. In addition, EYimprovements of 4.1% and 3.8% can be realized, respectively, with single-axis tracking andfixed solar arrays. In Sec. 2, the system design aspects, including the geometrical configurations,PV cell spectral responsivity (SR), and HOE properties, are discussed. The power collectionefficiency of the HLC is evaluated as a function of Sun angle changes during a day at differentseasons, and the resulting improvement in EY is presented in Sec. 3. The results for an exper-imental HOE are presented in Sec. 4. Section 5 summarizes the performance of the HLC and itspotential to increase the power collection efficiency of regular PV systems.
2 System Design
2.1 Design Configuration
Solar illumination falling onto the IMSA can be redirected onto the PV cells either by a trans-mission or reflection HOE.7 An advantage of a reflective type HOE is that it can be encapsulatedinto existing PV module packages without deploying another cover glass needed by the trans-mission HOE.17 Also, light diffracted from an HOE can be designed to exceed the critical angleof the module’s glass cover (Fig. 1). This effectively extends the distance over which light can becollected and transferred to the module’s PV cell regions.
Table 1 IMSA ratio of several commercial solar panels.
Company Cell typeNo. ofcells
Front glass(mm)
IMSA(%)
Jinko Eagle HC 70M 365 to 385 W 72 3.2 11.11
Jinko Eagle EP 60 280 to 300 W 60 3.2 10.79
Jinko Eagle 72HM G5B 515 to 535 W 2 × 72 3.2 6.60
Trina solar Tallmax Plus framed 60-cell module 60 3.2 9.93
Trina solar Tallmax Plus framed 72-cell module 72 3.2 9.01
Trina solar Tallmax Plus framed 144 half-cell module 2 × 72 3.2 7.80
Fig. 1 System layout of the HLC.
Zhao, Chrysler, and Kostuk: Holographic low concentration optical system increasing light collection. . .
Journal of Photonics for Energy 027002-2 Apr–Jun 2021 • Vol. 11(2)
Downloaded From: https://www.spiedigitallibrary.org/journals/Journal-of-Photonics-for-Energy on 10 Jan 2022Terms of Use: https://www.spiedigitallibrary.org/terms-of-use
A simplified diagram of the HLC is shown in Fig. 1. The thickness of the solar panel’sencapsulation glass is H, the width of the IMSA is L, and the refractive index of the glass coveris assumed to be 1.50. Holographic elements have both angular and spectral selectivity; there-fore, as the angle and wavelength differ from the design values, the diffraction efficiency willdecrease. A tracking system will keep the hologram at the design values resulting in a highcollection efficiency. In contrast, a Lambertian diffuser has a relatively low sensitivity to theangle and wavelength variation of the incident solar illumination. Therefore, combining a holo-graphic element with a diffuser can offer advantages for collecting solar illumination. In Fig. 1,the IMSA is covered with an HLC consisting of a reflection HOE constructed with wavelengthselectivity matched to the PV cell’s SR and angles and a Lambertian diffuser surface. For thisconfiguration, the solar illumination incident on the HOE surface is partly diffracted into anangle that is larger than the critical angle of the glass cover. The diffuser scatters the remaininglight that is not diffracted by the HOE. Some of this scattered light exceeding the cover glass’scritical angle is reflected onto the PV cell surface and converted into electrical power and energy.Multiple interactions of light scattered by the diffuser and diffracted by the hologram that make itto the PV cell surface are also considered in the simulation.
The HOE is designed to be symmetric about the center of the IMSA to increase the length ofthe effective light collection region. The left half of the HOE diffracts light to a PV cell on the leftside of the IMSA, and the right half of the HOE diffracts light to a cell on the right. The effectivelength describing the propagation distance of the diffracted/diffused light in the horizontal direc-tion is given by
EQ-TARGET;temp:intralink-;e001;116;484leff ¼ 4 · H · sinðθdÞ; (1)
where
EQ-TARGET;temp:intralink-;e002;116;441θd ≥ θCA ¼ sin−1ð1∕ngÞ: (2)
θd is the diffraction angle and H is the thickness of the encapsulation glass. The glass coverfunctions as a light waveguide to redirect light with angles larger than the glass cover’s criticalangle onto the cells. ng is the refractive index of the glass. θCA is the total internal reflection angleof the cover, which is around 41.8 deg for a glass with a refractive index of 1.50. Equation (1)indicates that the effective light collection area’s length is proportional to the cover glass’s thick-ness and the sinusoidal value of the redirected light’s angle. For the commercial PV panelsshown in Table 1, the shortest effective collection length is 8.53 mm when the thickness of thecover glass is 3.2 mm. This means part of the diffracted light can interact with the HLC a secondtime when the length of the IMSA is longer than 8.53 mm.
2.2 Current Responsivity of Silicon Cells
The SR characteristics vary significantly with different combinations of semiconductor materialssuch as GaAs, CIGS, and CdTe.1,2 To determine the appropriate peak wavelength of the HOE,the specific current responsivity (CR) of the PV cell needs to be evaluated by taking the productof the solar spectrum and the SR of the PV cells. The expression of the CR for a PV cell under theillumination with global standard AM1.5 spectrum is given by
EQ-TARGET;temp:intralink-;e003;116;202CRðλÞ ¼ EAM1.5ðλÞ · SRðλÞ: (3)
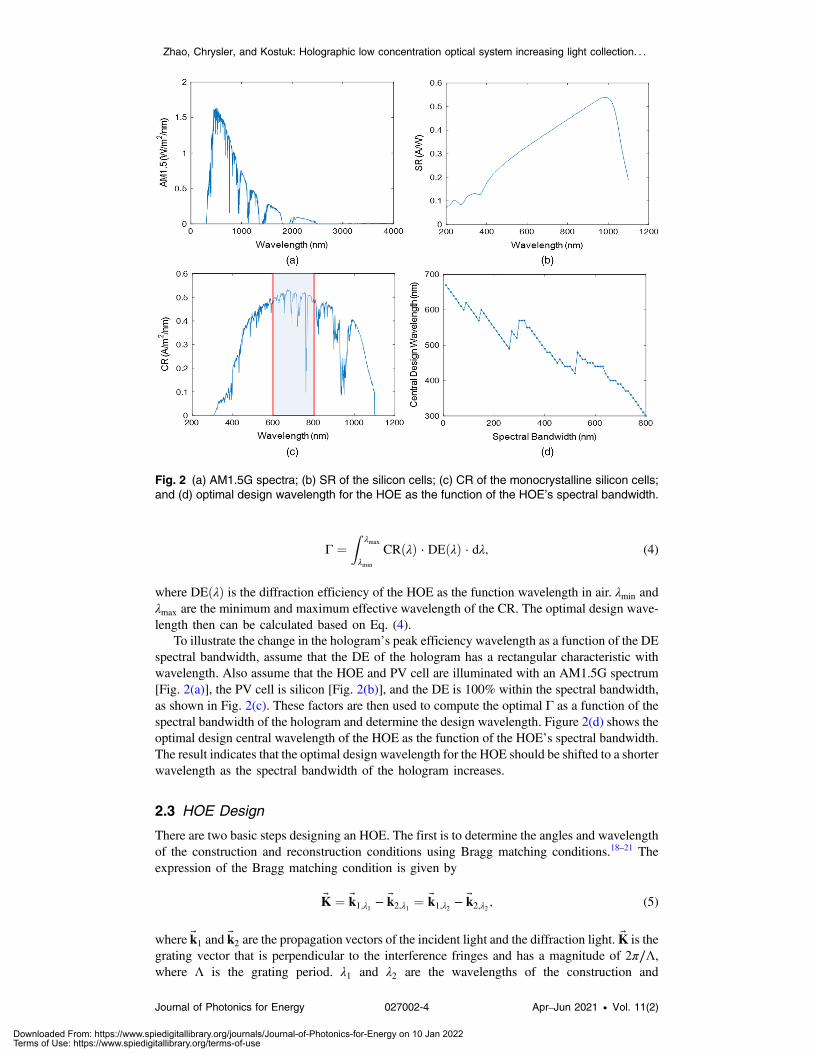
In this paper, the monocrystalline silicon cell is used as the target material for the HLCdesign. The standard AM1.5G spectrum is depicted in Fig. 2(a), and the SR of the silicon cellsis shown in Fig. 2(b). The CR of a monocrystalline silicon PV cell is shown in Fig. 2(c) whenilluminated with AM1.5G spectrum. It implies that the optimal spectral range for HOE designranges from 600 to 800 nm. With proper multiplexing, index modulation profile, and thickness,an HOE can be designed to have a high DE with >300 nm of spectral bandwidth. A function foroptimizing the spectral bandwidth of the HOE is given by
Zhao, Chrysler, and Kostuk: Holographic low concentration optical system increasing light collection. . .
Journal of Photonics for Energy 027002-3 Apr–Jun 2021 • Vol. 11(2)
Downloaded From: https://www.spiedigitallibrary.org/journals/Journal-of-Photonics-for-Energy on 10 Jan 2022Terms of Use: https://www.spiedigitallibrary.org/terms-of-use
EQ-TARGET;temp:intralink-;e004;116;394Γ ¼Z
λmax
λmin
CRðλÞ · DEðλÞ · dλ; (4)
where DEðλÞ is the diffraction efficiency of the HOE as the function wavelength in air. λmin andλmax are the minimum and maximum effective wavelength of the CR. The optimal design wave-length then can be calculated based on Eq. (4).
To illustrate the change in the hologram’s peak efficiency wavelength as a function of the DEspectral bandwidth, assume that the DE of the hologram has a rectangular characteristic withwavelength. Also assume that the HOE and PV cell are illuminated with an AM1.5G spectrum[Fig. 2(a)], the PV cell is silicon [Fig. 2(b)], and the DE is 100% within the spectral bandwidth,as shown in Fig. 2(c). These factors are then used to compute the optimal Γ as a function of thespectral bandwidth of the hologram and determine the design wavelength. Figure 2(d) shows theoptimal design central wavelength of the HOE as the function of the HOE’s spectral bandwidth.The result indicates that the optimal design wavelength for the HOE should be shifted to a shorterwavelength as the spectral bandwidth of the hologram increases.
2.3 HOE Design
There are two basic steps designing an HOE. The first is to determine the angles and wavelengthof the construction and reconstruction conditions using Bragg matching conditions.18–21 Theexpression of the Bragg matching condition is given by
EQ-TARGET;temp:intralink-;e005;116;141
~K ¼ ~k1;λ1 − ~k2;λ1 ¼ ~k1;λ2 − ~k2;λ2 ; (5)
where ~k1 and ~k2 are the propagation vectors of the incident light and the diffraction light. ~K is thegrating vector that is perpendicular to the interference fringes and has a magnitude of 2π∕Λ,where Λ is the grating period. λ1 and λ2 are the wavelengths of the construction and
Fig. 2 (a) AM1.5G spectra; (b) SR of the silicon cells; (c) CR of the monocrystalline silicon cells;and (d) optimal design wavelength for the HOE as the function of the HOE’s spectral bandwidth.
Zhao, Chrysler, and Kostuk: Holographic low concentration optical system increasing light collection. . .
Journal of Photonics for Energy 027002-4 Apr–Jun 2021 • Vol. 11(2)
Downloaded From: https://www.spiedigitallibrary.org/journals/Journal-of-Photonics-for-Energy on 10 Jan 2022Terms of Use: https://www.spiedigitallibrary.org/terms-of-use
reconstruction beams, respectively. The second step in designing the hologram is to determinethe index modulation (Δn) and thickness (d) to achieve the target DE requirements.
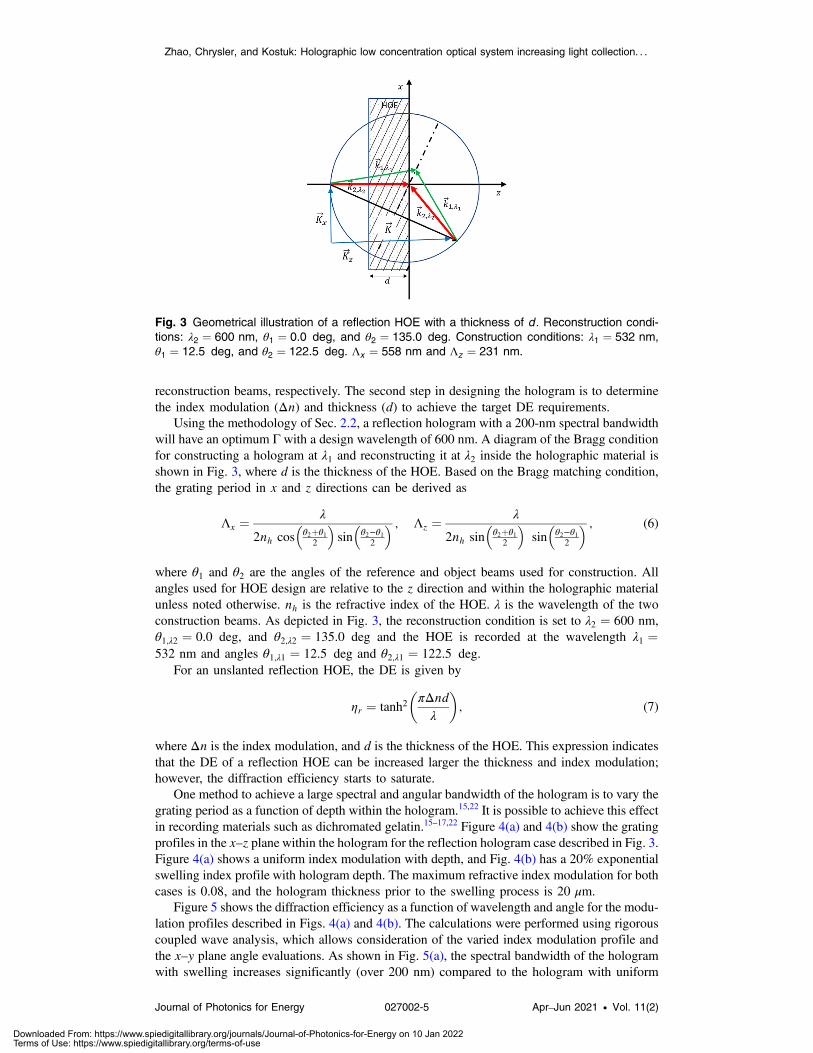
Using the methodology of Sec. 2.2, a reflection hologram with a 200-nm spectral bandwidthwill have an optimum Γ with a design wavelength of 600 nm. A diagram of the Bragg conditionfor constructing a hologram at λ1 and reconstructing it at λ2 inside the holographic material isshown in Fig. 3, where d is the thickness of the HOE. Based on the Bragg matching condition,the grating period in x and z directions can be derived as
EQ-TARGET;temp:intralink-;e006;116;424Λx ¼λ
2nh cos�θ2þθ1
2
�sin
�θ2−θ1
2
� ; Λz ¼λ
2nh sin�θ2þθ1
2
�sin
�θ2−θ1
2
� ; (6)
where θ1 and θ2 are the angles of the reference and object beams used for construction. Allangles used for HOE design are relative to the z direction and within the holographic materialunless noted otherwise. nh is the refractive index of the HOE. λ is the wavelength of the twoconstruction beams. As depicted in Fig. 3, the reconstruction condition is set to λ2 ¼ 600 nm,θ1;λ2 ¼ 0.0 deg, and θ2;λ2 ¼ 135.0 deg and the HOE is recorded at the wavelength λ1 ¼532 nm and angles θ1;λ1 ¼ 12.5 deg and θ2;λ1 ¼ 122.5 deg.
For an unslanted reflection HOE, the DE is given by
EQ-TARGET;temp:intralink-;e007;116;288ηr ¼ tanh2�πΔndλ
�; (7)
where Δn is the index modulation, and d is the thickness of the HOE. This expression indicatesthat the DE of a reflection HOE can be increased larger the thickness and index modulation;however, the diffraction efficiency starts to saturate.
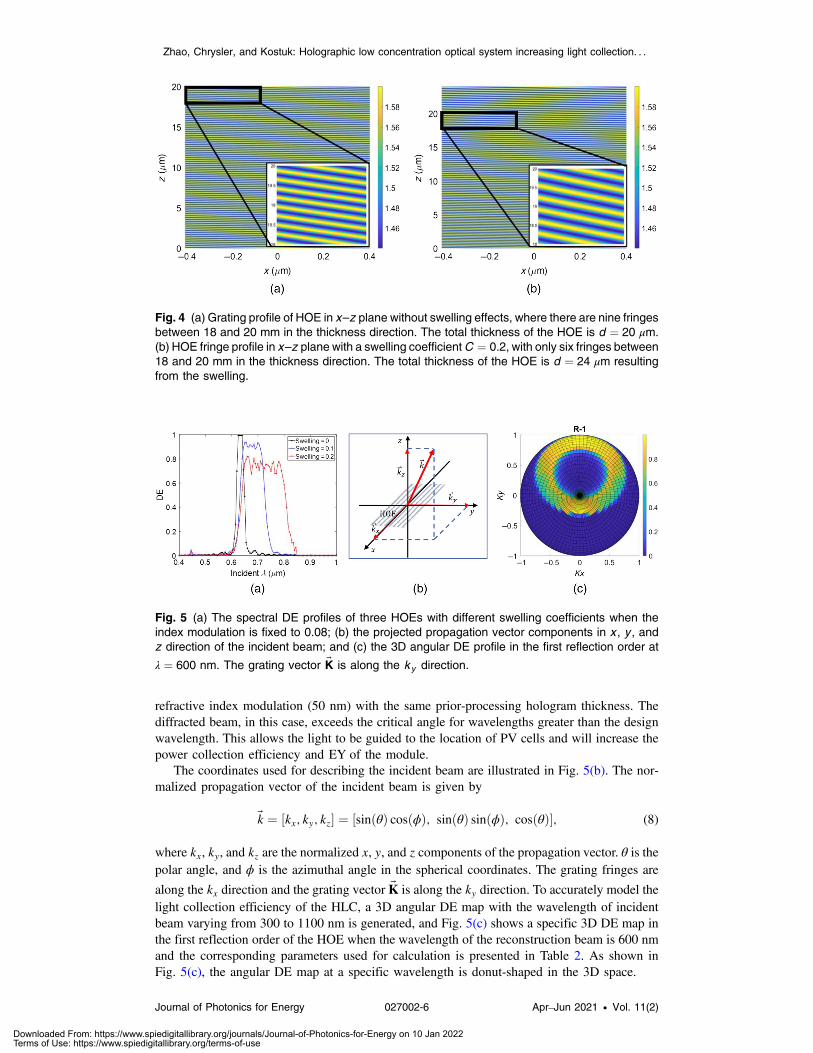
One method to achieve a large spectral and angular bandwidth of the hologram is to vary thegrating period as a function of depth within the hologram.15,22 It is possible to achieve this effectin recording materials such as dichromated gelatin.15–17,22 Figure 4(a) and 4(b) show the gratingprofiles in the x–z plane within the hologram for the reflection hologram case described in Fig. 3.Figure 4(a) shows a uniform index modulation with depth, and Fig. 4(b) has a 20% exponentialswelling index profile with hologram depth. The maximum refractive index modulation for bothcases is 0.08, and the hologram thickness prior to the swelling process is 20 μm.
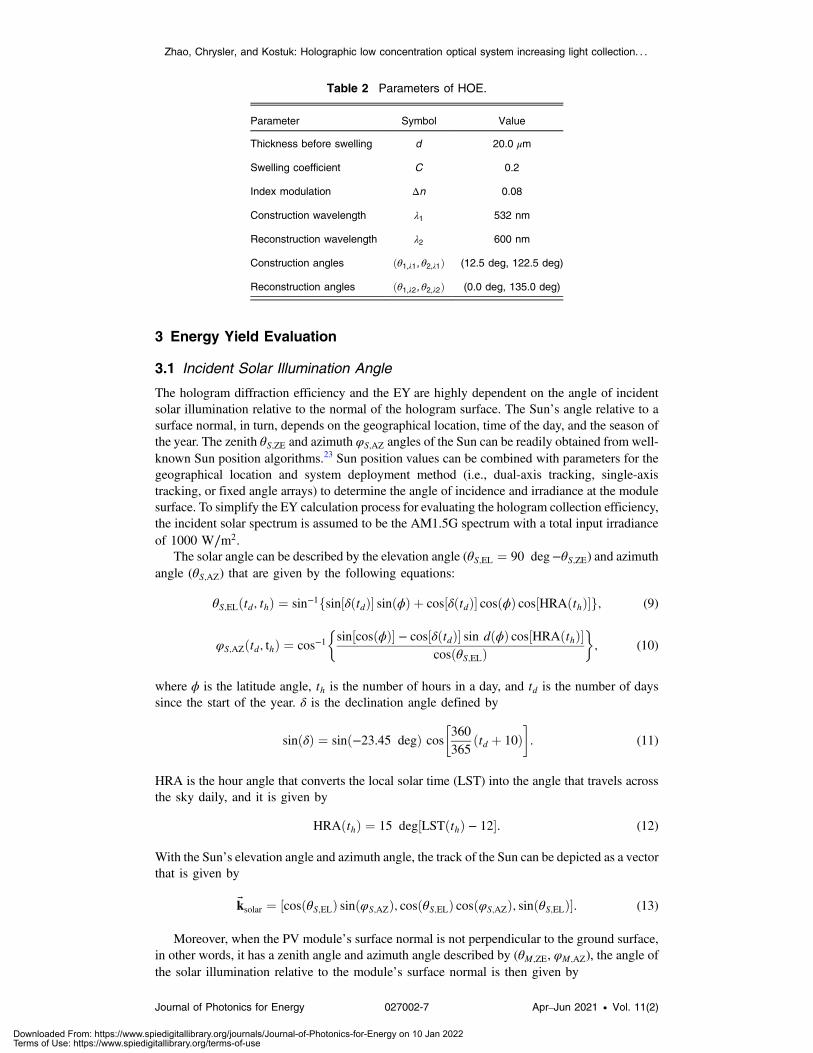
Figure 5 shows the diffraction efficiency as a function of wavelength and angle for the modu-lation profiles described in Figs. 4(a) and 4(b). The calculations were performed using rigorouscoupled wave analysis, which allows consideration of the varied index modulation profile andthe x–y plane angle evaluations. As shown in Fig. 5(a), the spectral bandwidth of the hologramwith swelling increases significantly (over 200 nm) compared to the hologram with uniform
Fig. 3 Geometrical illustration of a reflection HOE with a thickness of d . Reconstruction condi-tions: λ2 ¼ 600 nm, θ1 ¼ 0.0 deg, and θ2 ¼ 135.0 deg. Construction conditions: λ1 ¼ 532 nm,θ1 ¼ 12.5 deg, and θ2 ¼ 122.5 deg. Λx ¼ 558 nm and Λz ¼ 231 nm.
Zhao, Chrysler, and Kostuk: Holographic low concentration optical system increasing light collection. . .
Journal of Photonics for Energy 027002-5 Apr–Jun 2021 • Vol. 11(2)
Downloaded From: https://www.spiedigitallibrary.org/journals/Journal-of-Photonics-for-Energy on 10 Jan 2022Terms of Use: https://www.spiedigitallibrary.org/terms-of-use
refractive index modulation (50 nm) with the same prior-processing hologram thickness. Thediffracted beam, in this case, exceeds the critical angle for wavelengths greater than the designwavelength. This allows the light to be guided to the location of PV cells and will increase thepower collection efficiency and EY of the module.
The coordinates used for describing the incident beam are illustrated in Fig. 5(b). The nor-malized propagation vector of the incident beam is given by
EQ-TARGET;temp:intralink-;e008;116;198
~k ¼ ½kx; ky; kz� ¼ ½sinðθÞ cosðϕÞ; sinðθÞ sinðϕÞ; cosðθÞ�; (8)
where kx, ky, and kz are the normalized x, y, and z components of the propagation vector. θ is thepolar angle, and ϕ is the azimuthal angle in the spherical coordinates. The grating fringes are
along the kx direction and the grating vector ~K is along the ky direction. To accurately model thelight collection efficiency of the HLC, a 3D angular DE map with the wavelength of incidentbeam varying from 300 to 1100 nm is generated, and Fig. 5(c) shows a specific 3D DE map inthe first reflection order of the HOE when the wavelength of the reconstruction beam is 600 nmand the corresponding parameters used for calculation is presented in Table 2. As shown inFig. 5(c), the angular DE map at a specific wavelength is donut-shaped in the 3D space.
Fig. 5 (a) The spectral DE profiles of three HOEs with different swelling coefficients when theindex modulation is fixed to 0.08; (b) the projected propagation vector components in x , y , andz direction of the incident beam; and (c) the 3D angular DE profile in the first reflection order at
λ ¼ 600 nm. The grating vector ~K is along the ky direction.
Fig. 4 (a) Grating profile of HOE in x–z plane without swelling effects, where there are nine fringesbetween 18 and 20 mm in the thickness direction. The total thickness of the HOE is d ¼ 20 μm.(b) HOE fringe profile in x–z plane with a swelling coefficientC ¼ 0.2, with only six fringes between18 and 20 mm in the thickness direction. The total thickness of the HOE is d ¼ 24 μm resultingfrom the swelling.
Zhao, Chrysler, and Kostuk: Holographic low concentration optical system increasing light collection. . .
Journal of Photonics for Energy 027002-6 Apr–Jun 2021 • Vol. 11(2)
Downloaded From: https://www.spiedigitallibrary.org/journals/Journal-of-Photonics-for-Energy on 10 Jan 2022Terms of Use: https://www.spiedigitallibrary.org/terms-of-use
3 Energy Yield Evaluation
3.1 Incident Solar Illumination Angle
The hologram diffraction efficiency and the EY are highly dependent on the angle of incidentsolar illumination relative to the normal of the hologram surface. The Sun’s angle relative to asurface normal, in turn, depends on the geographical location, time of the day, and the season ofthe year. The zenith θS;ZE and azimuth φS;AZ angles of the Sun can be readily obtained from well-known Sun position algorithms.23 Sun position values can be combined with parameters for thegeographical location and system deployment method (i.e., dual-axis tracking, single-axistracking, or fixed angle arrays) to determine the angle of incidence and irradiance at the modulesurface. To simplify the EY calculation process for evaluating the hologram collection efficiency,the incident solar spectrum is assumed to be the AM1.5G spectrum with a total input irradianceof 1000 W∕m2.
The solar angle can be described by the elevation angle (θS;EL ¼ 90 deg−θS;ZE) and azimuthangle (θS;AZ) that are given by the following equations:
EQ-TARGET;temp:intralink-;e009;116;361θS;ELðtd; thÞ ¼ sin−1fsin½δðtdÞ� sinðϕÞ þ cos½δðtdÞ� cosðϕÞ cos½HRAðthÞ�g; (9)
EQ-TARGET;temp:intralink-;e010;116;316φS;AZðtd; thÞ ¼ cos−1�sin½cosðϕÞ� − cos½δðtdÞ� sin dðϕÞ cos½HRAðthÞ�
cosðθS;ELÞ�; (10)
where ϕ is the latitude angle, th is the number of hours in a day, and td is the number of dayssince the start of the year. δ is the declination angle defined by
EQ-TARGET;temp:intralink-;e011;116;268 sinðδÞ ¼ sinð−23.45 degÞ cos�360
365ðtd þ 10Þ
: (11)
HRA is the hour angle that converts the local solar time (LST) into the angle that travels acrossthe sky daily, and it is given by
EQ-TARGET;temp:intralink-;e012;116;199HRAðthÞ ¼ 15 deg½LSTðthÞ − 12�: (12)
With the Sun’s elevation angle and azimuth angle, the track of the Sun can be depicted as a vectorthat is given by
EQ-TARGET;temp:intralink-;e013;116;144
~ksolar ¼ ½cosðθS;ELÞ sinðφS;AZÞ; cosðθS;ELÞ cosðφS;AZÞ; sinðθS;ELÞ�: (13)
Moreover, when the PV module’s surface normal is not perpendicular to the ground surface,in other words, it has a zenith angle and azimuth angle described by (θM;ZE, φM;AZ), the angle ofthe solar illumination relative to the module’s surface normal is then given by
Table 2 Parameters of HOE.
Parameter Symbol Value
Thickness before swelling d 20.0 μm
Swelling coefficient C 0.2
Index modulation Δn 0.08
Construction wavelength λ1 532 nm
Reconstruction wavelength λ2 600 nm
Construction angles ðθ1;λ1; θ2;λ1Þ (12.5 deg, 122.5 deg)
Reconstruction angles ðθ1;λ2; θ2;λ2Þ (0.0 deg, 135.0 deg)
Zhao, Chrysler, and Kostuk: Holographic low concentration optical system increasing light collection. . .
Journal of Photonics for Energy 027002-7 Apr–Jun 2021 • Vol. 11(2)
Downloaded From: https://www.spiedigitallibrary.org/journals/Journal-of-Photonics-for-Energy on 10 Jan 2022Terms of Use: https://www.spiedigitallibrary.org/terms-of-use
EQ-TARGET;temp:intralink-;e014;116;735γ ¼ cos−1½cosðθM;ELÞ cosðθS;ELÞ cosðφM;AZ − φS;AZÞ þ sinðθM;ELÞ sinðθS;ELÞ�; (14)
where θM;EL is the elevation angle of the PV module’s surface normal, and it is related to itszenith angle by θM;EL ¼ 90 deg−θM;ZE.
3.2 Performance Evaluation
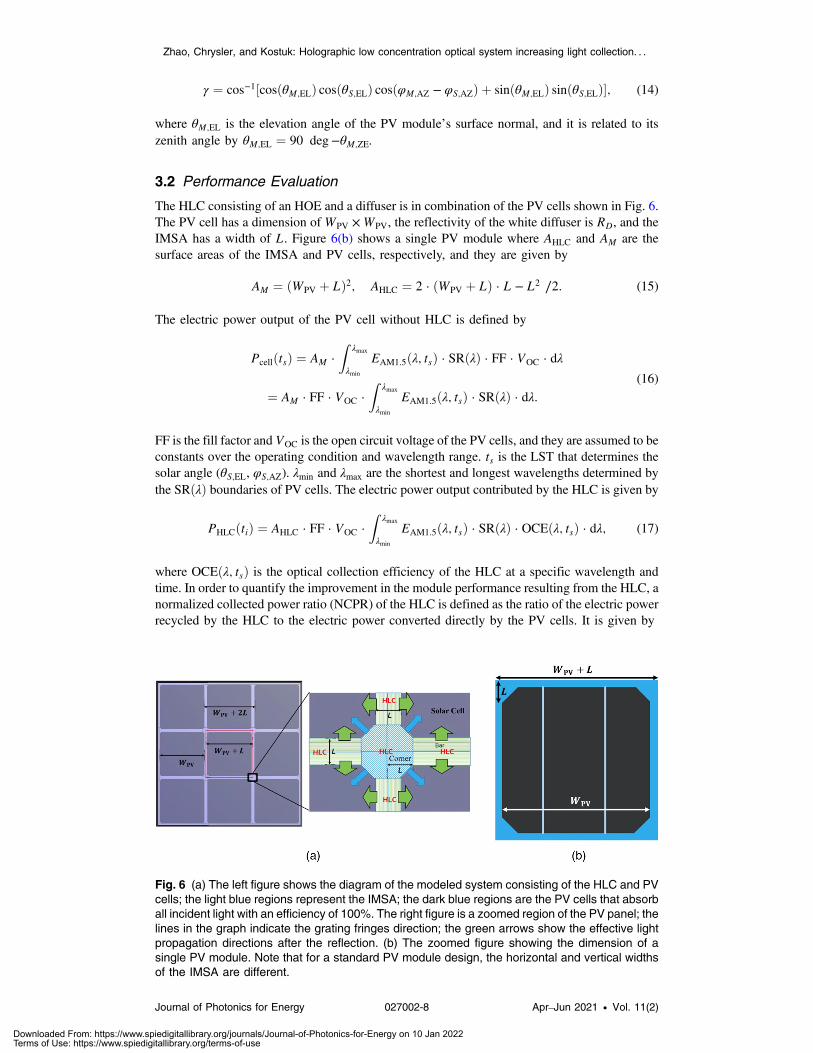
The HLC consisting of an HOE and a diffuser is in combination of the PV cells shown in Fig. 6.The PV cell has a dimension of WPV ×WPV, the reflectivity of the white diffuser is RD, and theIMSA has a width of L. Figure 6(b) shows a single PV module where AHLC and AM are thesurface areas of the IMSA and PV cells, respectively, and they are given by
EQ-TARGET;temp:intralink-;e015;116;602AM ¼ ðWPV þ LÞ2; AHLC ¼ 2 · ðWPV þ LÞ · L − L2 ∕2: (15)
The electric power output of the PV cell without HLC is defined by
EQ-TARGET;temp:intralink-;e016;116;559PcellðtsÞ ¼ AM ·Z
λmax
λmin
EAM1.5ðλ; tsÞ · SRðλÞ · FF · VOC · dλ
¼ AM · FF · VOC ·Z
λmax
λmin
EAM1.5ðλ; tsÞ · SRðλÞ · dλ:(16)
FF is the fill factor and VOC is the open circuit voltage of the PV cells, and they are assumed to beconstants over the operating condition and wavelength range. ts is the LST that determines thesolar angle (θS;EL, φS;AZ). λmin and λmax are the shortest and longest wavelengths determined bythe SRðλÞ boundaries of PV cells. The electric power output contributed by the HLC is given by
EQ-TARGET;temp:intralink-;e017;116;437PHLCðtiÞ ¼ AHLC · FF · VOC ·Z
λmax
λmin
EAM1.5ðλ; tsÞ · SRðλÞ · OCEðλ; tsÞ · dλ; (17)
where OCEðλ; tsÞ is the optical collection efficiency of the HLC at a specific wavelength andtime. In order to quantify the improvement in the module performance resulting from the HLC, anormalized collected power ratio (NCPR) of the HLC is defined as the ratio of the electric powerrecycled by the HLC to the electric power converted directly by the PV cells. It is given by
Fig. 6 (a) The left figure shows the diagram of the modeled system consisting of the HLC and PVcells; the light blue regions represent the IMSA; the dark blue regions are the PV cells that absorball incident light with an efficiency of 100%. The right figure is a zoomed region of the PV panel; thelines in the graph indicate the grating fringes direction; the green arrows show the effective lightpropagation directions after the reflection. (b) The zoomed figure showing the dimension of asingle PV module. Note that for a standard PV module design, the horizontal and vertical widthsof the IMSA are different.
Zhao, Chrysler, and Kostuk: Holographic low concentration optical system increasing light collection. . .
Journal of Photonics for Energy 027002-8 Apr–Jun 2021 • Vol. 11(2)
Downloaded From: https://www.spiedigitallibrary.org/journals/Journal-of-Photonics-for-Energy on 10 Jan 2022Terms of Use: https://www.spiedigitallibrary.org/terms-of-use
EQ-TARGET;temp:intralink-;e018;116;735NCPRðtsÞ ¼PHLCðtsÞPcellðtsÞ
¼ AHLC
AM − AHLC
R λmax
λminEAM1.5ðλ; tsÞ · SRðλÞ · OCEðλ; tsÞ · dλR λmax
λminEAM1.5ðλ; tsÞ · SRðλÞ · dλ
: (18)
The annual energy yield improvement (AEYI) can be obtained by taking the ratio of the EY ofHLC to the EY of regular PV cells without HLC and is given by the following equation:
EQ-TARGET;temp:intralink-;e019;116;669AEYI ¼ EYHLC
EYcell
¼P
PHLCðtsÞ · ΔtPPcellðtsÞ · Δt
¼P
PHLCðtsÞPPcellðtsÞ
; (19)
where Δt is the time interval between the adjacent solar times used for computation.
3.3 Influence of Thickness of the Cover Glass
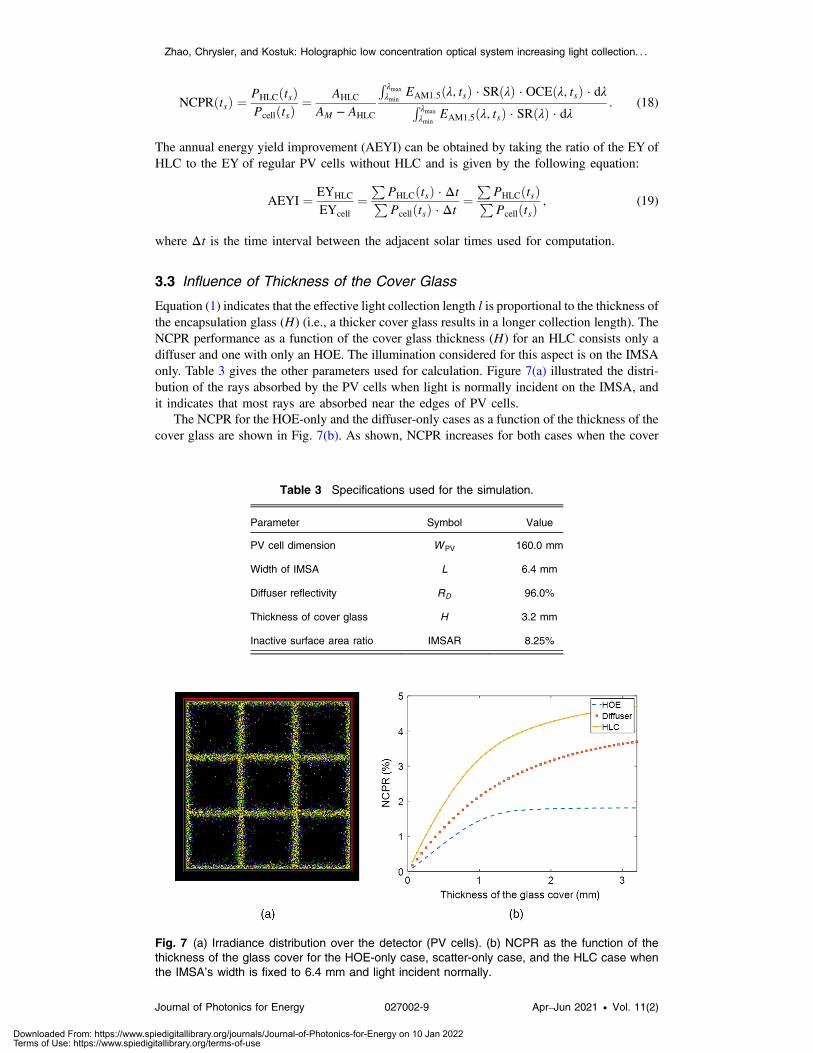
Equation (1) indicates that the effective light collection length l is proportional to the thickness ofthe encapsulation glass (H) (i.e., a thicker cover glass results in a longer collection length). TheNCPR performance as a function of the cover glass thickness (H) for an HLC consists only adiffuser and one with only an HOE. The illumination considered for this aspect is on the IMSAonly. Table 3 gives the other parameters used for calculation. Figure 7(a) illustrated the distri-bution of the rays absorbed by the PV cells when light is normally incident on the IMSA, andit indicates that most rays are absorbed near the edges of PV cells.
The NCPR for the HOE-only and the diffuser-only cases as a function of the thickness of thecover glass are shown in Fig. 7(b). As shown, NCPR increases for both cases when the cover
Table 3 Specifications used for the simulation.
Parameter Symbol Value
PV cell dimension WPV 160.0 mm
Width of IMSA L 6.4 mm
Diffuser reflectivity RD 96.0%
Thickness of cover glass H 3.2 mm
Inactive surface area ratio IMSAR 8.25%
Fig. 7 (a) Irradiance distribution over the detector (PV cells). (b) NCPR as the function of thethickness of the glass cover for the HOE-only case, scatter-only case, and the HLC case whenthe IMSA’s width is fixed to 6.4 mm and light incident normally.
Zhao, Chrysler, and Kostuk: Holographic low concentration optical system increasing light collection. . .
Journal of Photonics for Energy 027002-9 Apr–Jun 2021 • Vol. 11(2)
Downloaded From: https://www.spiedigitallibrary.org/journals/Journal-of-Photonics-for-Energy on 10 Jan 2022Terms of Use: https://www.spiedigitallibrary.org/terms-of-use
glass gets thicker. The NCPR of the diffuser-only case is higher than the NCPR of the HOE-onlycase due to its broader spectral bandwidth; however, the NCPR of the HOE-only case approachesthe saturation point much faster than the NCPR of the diffuser-only case resulting from theHOE’s higher angle selectivity. Thus for a solar panel with a thin (<3.2 mm) encapsulation glass,the combination of the HOE and diffuser can provide a better light redirecting than the HOE-onlyor diffuser-only case. Although a higher NCPR is expected when a thicker glass cover is used,the cover glass thickness is chosen to be 3.2 mm since this corresponds to the value for mostcommercial PV modules (Table 1).
3.4 AEYI for Dual-Axis and Single-Axis Tracking Systems with HLC
According to Sec. 3.1, the Sun’s angle at a specific location can be calculated using the cor-responding latitude and longitude coordinates and the local time and season values. For thisexample, the coordinates (32.2226° N, 110.9747° W) for Tucson, Arizona, are used. The solarangle is then expressed in the k-space described by kx and ky given in Eq. (13). The east–westdirection corresponds to the kx direction and the south–north direction corresponds to the kydirection. A dual-axis tracking system can dynamically track the Sun’s position and alwaysensure kx ¼ ky ¼ 0 to maintain the highest light collection efficiency. When employed witha dual-axis tracking system, the HLC keeps its highest NCPR (4.5%) at all times and seasons,resulting in an AEYI of 4.5% when the PV module has an IMSAR of 8.25%. This impliesthat for a system like that described in Table 3 which generates 100 kWh∕year, an extra4.5 kWh∕year can be achieved when an HLC and a dual-axis-tracking are used.
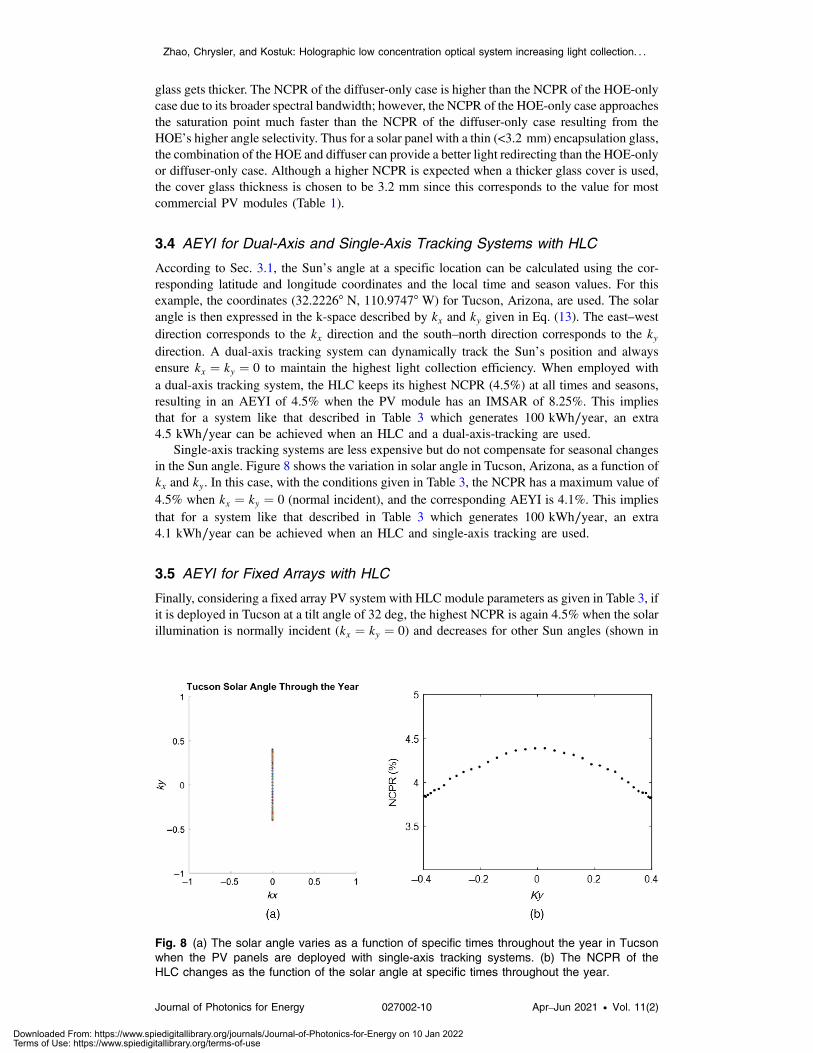
Single-axis tracking systems are less expensive but do not compensate for seasonal changesin the Sun angle. Figure 8 shows the variation in solar angle in Tucson, Arizona, as a function ofkx and ky. In this case, with the conditions given in Table 3, the NCPR has a maximum value of4.5% when kx ¼ ky ¼ 0 (normal incident), and the corresponding AEYI is 4.1%. This impliesthat for a system like that described in Table 3 which generates 100 kWh∕year, an extra4.1 kWh∕year can be achieved when an HLC and single-axis tracking are used.
3.5 AEYI for Fixed Arrays with HLC
Finally, considering a fixed array PV system with HLC module parameters as given in Table 3, ifit is deployed in Tucson at a tilt angle of 32 deg, the highest NCPR is again 4.5% when the solarillumination is normally incident (kx ¼ ky ¼ 0) and decreases for other Sun angles (shown in
Fig. 8 (a) The solar angle varies as a function of specific times throughout the year in Tucsonwhen the PV panels are deployed with single-axis tracking systems. (b) The NCPR of theHLC changes as the function of the solar angle at specific times throughout the year.
Zhao, Chrysler, and Kostuk: Holographic low concentration optical system increasing light collection. . .
Journal of Photonics for Energy 027002-10 Apr–Jun 2021 • Vol. 11(2)
Downloaded From: https://www.spiedigitallibrary.org/journals/Journal-of-Photonics-for-Energy on 10 Jan 2022Terms of Use: https://www.spiedigitallibrary.org/terms-of-use
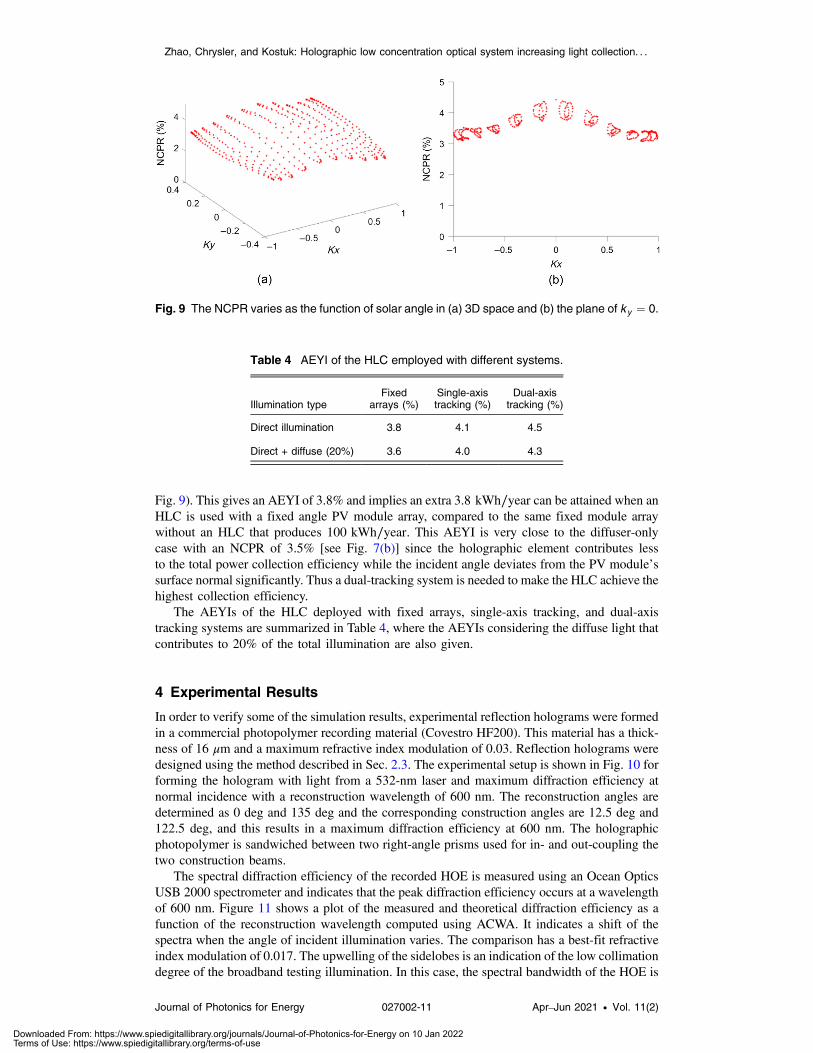
Fig. 9). This gives an AEYI of 3.8% and implies an extra 3.8 kWh∕year can be attained when anHLC is used with a fixed angle PV module array, compared to the same fixed module arraywithout an HLC that produces 100 kWh∕year. This AEYI is very close to the diffuser-onlycase with an NCPR of 3.5% [see Fig. 7(b)] since the holographic element contributes lessto the total power collection efficiency while the incident angle deviates from the PV module’ssurface normal significantly. Thus a dual-tracking system is needed to make the HLC achieve thehighest collection efficiency.
The AEYIs of the HLC deployed with fixed arrays, single-axis tracking, and dual-axistracking systems are summarized in Table 4, where the AEYIs considering the diffuse light thatcontributes to 20% of the total illumination are also given.
4 Experimental Results
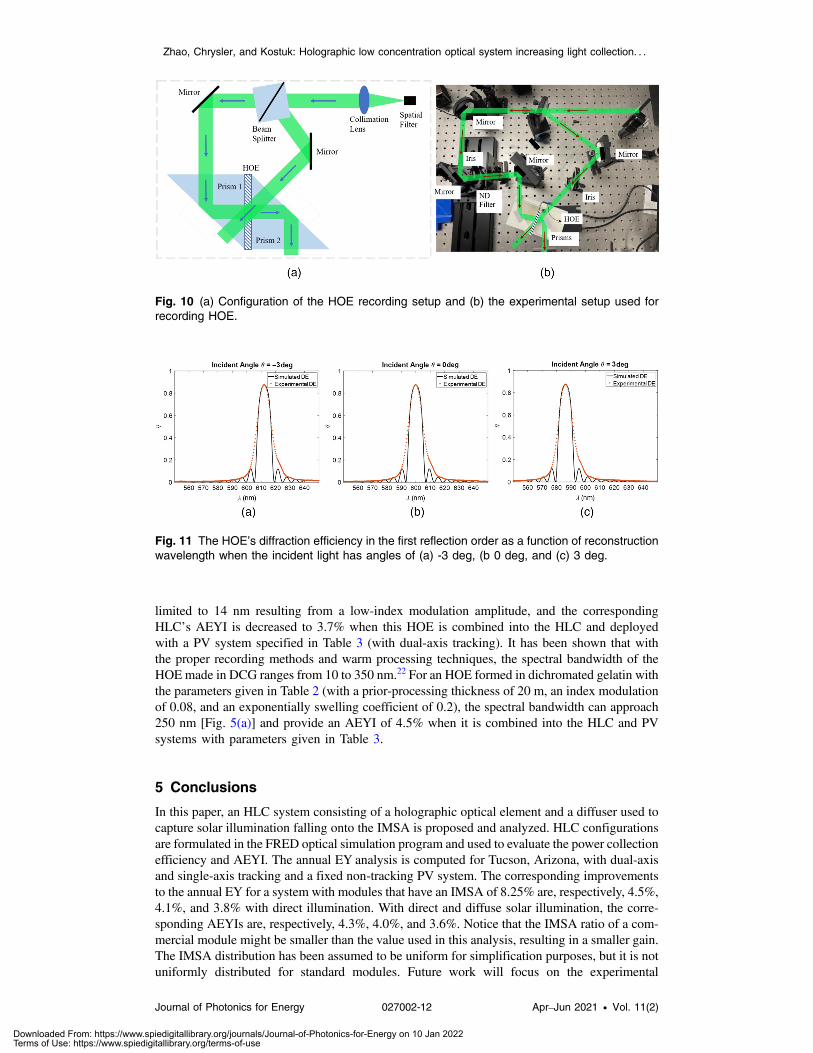
In order to verify some of the simulation results, experimental reflection holograms were formedin a commercial photopolymer recording material (Covestro HF200). This material has a thick-ness of 16 μm and a maximum refractive index modulation of 0.03. Reflection holograms weredesigned using the method described in Sec. 2.3. The experimental setup is shown in Fig. 10 forforming the hologram with light from a 532-nm laser and maximum diffraction efficiency atnormal incidence with a reconstruction wavelength of 600 nm. The reconstruction angles aredetermined as 0 deg and 135 deg and the corresponding construction angles are 12.5 deg and122.5 deg, and this results in a maximum diffraction efficiency at 600 nm. The holographicphotopolymer is sandwiched between two right-angle prisms used for in- and out-coupling thetwo construction beams.
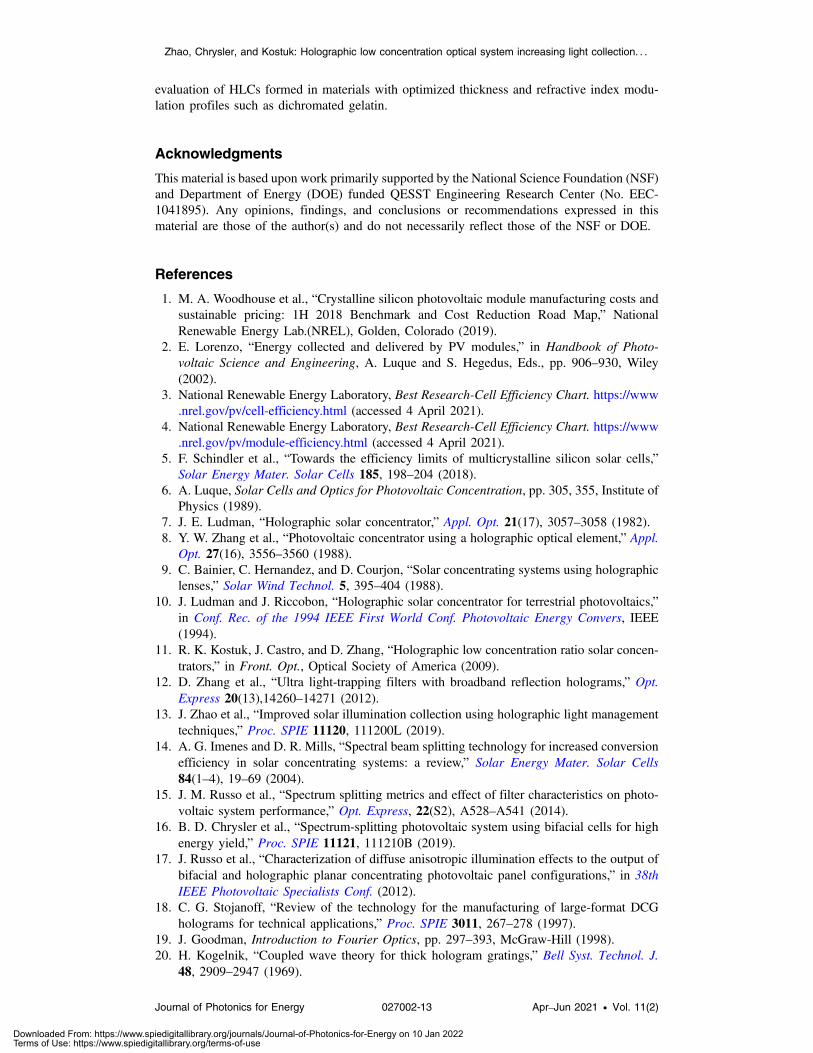
The spectral diffraction efficiency of the recorded HOE is measured using an Ocean OpticsUSB 2000 spectrometer and indicates that the peak diffraction efficiency occurs at a wavelengthof 600 nm. Figure 11 shows a plot of the measured and theoretical diffraction efficiency as afunction of the reconstruction wavelength computed using ACWA. It indicates a shift of thespectra when the angle of incident illumination varies. The comparison has a best-fit refractiveindex modulation of 0.017. The upwelling of the sidelobes is an indication of the low collimationdegree of the broadband testing illumination. In this case, the spectral bandwidth of the HOE is
Fig. 9 The NCPR varies as the function of solar angle in (a) 3D space and (b) the plane of ky ¼ 0.
Table 4 AEYI of the HLC employed with different systems.
Illumination typeFixed
arrays (%)Single-axistracking (%)
Dual-axistracking (%)
Direct illumination 3.8 4.1 4.5
Direct + diffuse (20%) 3.6 4.0 4.3
Zhao, Chrysler, and Kostuk: Holographic low concentration optical system increasing light collection. . .
Journal of Photonics for Energy 027002-11 Apr–Jun 2021 • Vol. 11(2)
Downloaded From: https://www.spiedigitallibrary.org/journals/Journal-of-Photonics-for-Energy on 10 Jan 2022Terms of Use: https://www.spiedigitallibrary.org/terms-of-use
limited to 14 nm resulting from a low-index modulation amplitude, and the correspondingHLC’s AEYI is decreased to 3.7% when this HOE is combined into the HLC and deployedwith a PV system specified in Table 3 (with dual-axis tracking). It has been shown that withthe proper recording methods and warm processing techniques, the spectral bandwidth of theHOE made in DCG ranges from 10 to 350 nm.22 For an HOE formed in dichromated gelatin withthe parameters given in Table 2 (with a prior-processing thickness of 20 m, an index modulationof 0.08, and an exponentially swelling coefficient of 0.2), the spectral bandwidth can approach250 nm [Fig. 5(a)] and provide an AEYI of 4.5% when it is combined into the HLC and PVsystems with parameters given in Table 3.
5 Conclusions
In this paper, an HLC system consisting of a holographic optical element and a diffuser used tocapture solar illumination falling onto the IMSA is proposed and analyzed. HLC configurationsare formulated in the FRED optical simulation program and used to evaluate the power collectionefficiency and AEYI. The annual EY analysis is computed for Tucson, Arizona, with dual-axisand single-axis tracking and a fixed non-tracking PV system. The corresponding improvementsto the annual EY for a system with modules that have an IMSA of 8.25% are, respectively, 4.5%,4.1%, and 3.8% with direct illumination. With direct and diffuse solar illumination, the corre-sponding AEYIs are, respectively, 4.3%, 4.0%, and 3.6%. Notice that the IMSA ratio of a com-mercial module might be smaller than the value used in this analysis, resulting in a smaller gain.The IMSA distribution has been assumed to be uniform for simplification purposes, but it is notuniformly distributed for standard modules. Future work will focus on the experimental
Fig. 11 The HOE’s diffraction efficiency in the first reflection order as a function of reconstructionwavelength when the incident light has angles of (a) -3 deg, (b 0 deg, and (c) 3 deg.
Fig. 10 (a) Configuration of the HOE recording setup and (b) the experimental setup used forrecording HOE.
Zhao, Chrysler, and Kostuk: Holographic low concentration optical system increasing light collection. . .
Journal of Photonics for Energy 027002-12 Apr–Jun 2021 • Vol. 11(2)
Downloaded From: https://www.spiedigitallibrary.org/journals/Journal-of-Photonics-for-Energy on 10 Jan 2022Terms of Use: https://www.spiedigitallibrary.org/terms-of-use
evaluation of HLCs formed in materials with optimized thickness and refractive index modu-lation profiles such as dichromated gelatin.
Acknowledgments
This material is based upon work primarily supported by the National Science Foundation (NSF)and Department of Energy (DOE) funded QESST Engineering Research Center (No. EEC-1041895). Any opinions, findings, and conclusions or recommendations expressed in thismaterial are those of the author(s) and do not necessarily reflect those of the NSF or DOE.
References
1. M. A. Woodhouse et al., “Crystalline silicon photovoltaic module manufacturing costs andsustainable pricing: 1H 2018 Benchmark and Cost Reduction Road Map,” NationalRenewable Energy Lab.(NREL), Golden, Colorado (2019).
2. E. Lorenzo, “Energy collected and delivered by PV modules,” in Handbook of Photo-voltaic Science and Engineering, A. Luque and S. Hegedus, Eds., pp. 906–930, Wiley(2002).
3. National Renewable Energy Laboratory, Best Research-Cell Efficiency Chart. https://www.nrel.gov/pv/cell-efficiency.html (accessed 4 April 2021).
4. National Renewable Energy Laboratory, Best Research-Cell Efficiency Chart. https://www.nrel.gov/pv/module-efficiency.html (accessed 4 April 2021).
5. F. Schindler et al., “Towards the efficiency limits of multicrystalline silicon solar cells,”Solar Energy Mater. Solar Cells 185, 198–204 (2018).
6. A. Luque, Solar Cells and Optics for Photovoltaic Concentration, pp. 305, 355, Institute ofPhysics (1989).
7. J. E. Ludman, “Holographic solar concentrator,” Appl. Opt. 21(17), 3057–3058 (1982).8. Y. W. Zhang et al., “Photovoltaic concentrator using a holographic optical element,” Appl.
Opt. 27(16), 3556–3560 (1988).9. C. Bainier, C. Hernandez, and D. Courjon, “Solar concentrating systems using holographic
lenses,” Solar Wind Technol. 5, 395–404 (1988).10. J. Ludman and J. Riccobon, “Holographic solar concentrator for terrestrial photovoltaics,”
in Conf. Rec. of the 1994 IEEE First World Conf. Photovoltaic Energy Convers, IEEE(1994).
11. R. K. Kostuk, J. Castro, and D. Zhang, “Holographic low concentration ratio solar concen-trators,” in Front. Opt., Optical Society of America (2009).
12. D. Zhang et al., “Ultra light-trapping filters with broadband reflection holograms,” Opt.Express 20(13),14260–14271 (2012).
13. J. Zhao et al., “Improved solar illumination collection using holographic light managementtechniques,” Proc. SPIE 11120, 111200L (2019).
14. A. G. Imenes and D. R. Mills, “Spectral beam splitting technology for increased conversionefficiency in solar concentrating systems: a review,” Solar Energy Mater. Solar Cells84(1–4), 19–69 (2004).
15. J. M. Russo et al., “Spectrum splitting metrics and effect of filter characteristics on photo-voltaic system performance,” Opt. Express, 22(S2), A528–A541 (2014).
16. B. D. Chrysler et al., “Spectrum-splitting photovoltaic system using bifacial cells for highenergy yield,” Proc. SPIE 11121, 111210B (2019).
17. J. Russo et al., “Characterization of diffuse anisotropic illumination effects to the output ofbifacial and holographic planar concentrating photovoltaic panel configurations,” in 38thIEEE Photovoltaic Specialists Conf. (2012).
18. C. G. Stojanoff, “Review of the technology for the manufacturing of large-format DCGholograms for technical applications,” Proc. SPIE 3011, 267–278 (1997).
19. J. Goodman, Introduction to Fourier Optics, pp. 297–393, McGraw-Hill (1998).20. H. Kogelnik, “Coupled wave theory for thick hologram gratings,” Bell Syst. Technol. J.
48, 2909–2947 (1969).
Zhao, Chrysler, and Kostuk: Holographic low concentration optical system increasing light collection. . .
Journal of Photonics for Energy 027002-13 Apr–Jun 2021 • Vol. 11(2)
Downloaded From: https://www.spiedigitallibrary.org/journals/Journal-of-Photonics-for-Energy on 10 Jan 2022Terms of Use: https://www.spiedigitallibrary.org/terms-of-use
21. M. G. Moharam and T. K. Gaylord, “Three-dimensional vector coupled-wave analysis ofplanar-grating diffraction,” J. Opt. Soc. Am. 73, 1105–1112 (1983).
22. L. Solymar and D. J. Cooke, Volume Holography and Volume Gratings, Academic (1981).23. I. Reda and A. Andreas, “SPA: solar position algorithm,” Astrophysics Source Code
Library, Ascl:1504.002 (2015).
Jianbo Zhao received his BS degree in physics from Nankai University and his MS degree inoptics from James C. Wyant College of Optical Sciences in 2015 and 2018. He is a PhD studentat the University of Arizona. He is working on improving solar and AR systems performanceby designing volume holographic elements under the supervision of Dr. Raymond K. Kostuk.
Biographies of the other authors are not available.
Zhao, Chrysler, and Kostuk: Holographic low concentration optical system increasing light collection. . .
Journal of Photonics for Energy 027002-14 Apr–Jun 2021 • Vol. 11(2)
Downloaded From: https://www.spiedigitallibrary.org/journals/Journal-of-Photonics-for-Energy on 10 Jan 2022Terms of Use: https://www.spiedigitallibrary.org/terms-of-use
Related Documents