Holocene delevelling of Devon Island, Arctic Canada: implications for ice sheet geometry and crustal response 1 Arthur S. Dyke Dyke Abstract: The raised beaches and deltas of Devon Island contain an abundance of dateable materials. A large set of radiocarbon dates (228), 154 of which are new, are used to construct relative sea level curves and isobase maps for the island. The best materials for this purpose are driftwood logs (61 dates) and bowhead whale bones (74 dates) from raised beaches and mollusc shells from marine-limit deltas (20 dates) or from altitudes close to marine limit (14 dates). During the last glacial maximum, the island is thought to have lain beneath the southeastern flank of the Innuitian Ice Sheet. The relative sea level history is congruent with that inferred ice configuration. The island spans half the ice sheet width. Relative sea level curves are of simple exponential form, except near the glacial limit where an early Holocene emergence proceeded to a middle Holocene lowstand below present sea level, which was followed by submergence attending the passage of the crustal forebulge. The response times of relative sea level curves and of crustal uplift decrease from the uplift centre toward the limit of loading, but the change appears strongest near the limit. The Innuitian uplift is separated from the Laurentide uplift to the south by a strong isobase embayment over Lancaster Sound. Hence, ice load irregularities with wavelengths of about 100 km were large enough to leave an isostatic thumbprint in this region of the continent. The apparent absence of a similar embayment over Jones Sound probably indicates a greater Late Wisconsinan ice load there, or a thicker crust than in Lancaster Sound. Résumé : Les plages soulevées et les deltas de l’île Devon renferment une abondante quantité de matériel apte à être datée. Un groupe de nombreuses datations au radiocarbone (228), incluant 154 nouvelles déterminations, a été utilisé pour tracer les courbes du niveau marin relatif et pour dresser les cartes des isobases de l’île. Les matériaux qui fournissent les meilleurs résultats pour cette étude sont les billes de bois échappé (61 âges) et les os de baleine franche (74 âges) dans les dépôts de plages soulevées et les coquilles de mollusques trouvées à la limite marine des deltas (20 âges) ou aux altitudes proches de la limite marine (14 âges). Nous croyons que durant le dernier maximum glaciaire l’île se trouvait sous le flanc sud-est de l’Inlandsis innuitien. L’histoire du niveau marin relatif est compatible avec la configuration déduite de l’étude de l’évolution de l’inlandsis. L’étendue de l’île représente la moitié de la largeur de la calotte glaciaire. Les courbes du niveau marin relatif prennent une simple forme exponentielle, sauf à la limite glaciaire où une émergence durant l’Holocène précoce a entretenu un stade de bas niveau durant l’Holocène moyen en dessous du niveau marin actuel qui fut suivi d’une submergence ennoyant le passage de la zone de bombement crustal. Les temps de réponse des courbes du niveau marin relatif et du soulèvement crustal décroissent en se déplaçant du centre de soulèvement vers la zone limite de charge des glaces, cependant le changement semble avoir été plus rapide à proximité de la limite. Le soulèvement innuitien est séparé du soulèvement laurentidien au sud par un enfoncement prononcé de l’isobase sur le détroit de Lancaster. Donc, les irrégularités de la charge glaciaire avec longueurs d’onde d’environ 100 km, étaient suffisamment importantes pour avoir laissé leur empreinte dans cette région du continent. L’absence apparente d’un enfoncement similaire de l’isobase sur le détroit de Jones indique que la charge glaciaire au Wisconsinien tardif était probablement plus élevée à cet endroit, ou bien la croûte était plus épaisse dans le détroit de Lancaster. [Traduit par la Rédaction] 904 Much of the discussion of the extent of glaciation during the Last Glacial Maximum (LGM) in the Queen Elizabeth Islands (Fig. 1) has involved postglacial rebound. Blake (1970), for example, proposed that the Innuitian Ice Sheet covered the Queen Elizabeth Islands to account for the broad, arch-like pattern of regional uplift. A similar, but more qualitative, assessment had been advanced earlier (Washburn 1947; Wickenden 1947). However, portrayals of the regional pattern of uplift have remained rather fluid, as reviewed by Dyke (1998). Furthermore, the interpretation of uplift became controversial when advances in the theory of glacioisostasy allowed nonunique ice load distributions to explain the uplift pattern. The critical recognition was that ice sheets depress the crust about 200 km beyond their mar- gins because of the stiffness of the crust (Walcott 1970). As a consequence, relative sea level (RSL) at an ice margin at Can. J. Earth Sci. 35: 885–904 (1998) © 1998 NRC Canada 885 Received November 29, 1997. Accepted April 1, 1998. A.S. Dyke. Terrain Sciences Division, Geological Survey of Canada, 601 Booth Street, Ottawa, ON K1A 0E8, Canada (e-mail: [email protected]). 1 Geological Survey of Canada Contribution 1997203; Polar Continental Shelf Project Contribution 00298.

Welcome message from author
This document is posted to help you gain knowledge. Please leave a comment to let me know what you think about it! Share it to your friends and learn new things together.
Transcript
Holocene delevelling of Devon Island, ArcticCanada: implications for ice sheet geometry andcrustal response1
Arthur S. Dyke
DykeAbstract: The raised beaches and deltas of Devon Island contain an abundance of dateable materials. A large set ofradiocarbon dates (228), 154 of which are new, are used to construct relative sea level curves and isobase maps for theisland. The best materials for this purpose are driftwood logs (61 dates) and bowhead whale bones (74 dates) fromraised beaches and mollusc shells from marine-limit deltas (20 dates) or from altitudes close to marine limit (14 dates).During the last glacial maximum, the island is thought to have lain beneath the southeastern flank of the Innuitian IceSheet. The relative sea level history is congruent with that inferred ice configuration. The island spans half the icesheet width. Relative sea level curves are of simple exponential form, except near the glacial limit where an earlyHolocene emergence proceeded to a middle Holocene lowstand below present sea level, which was followed bysubmergence attending the passage of the crustal forebulge. The response times of relative sea level curves and ofcrustal uplift decrease from the uplift centre toward the limit of loading, but the change appears strongest near thelimit. The Innuitian uplift is separated from the Laurentide uplift to the south by a strong isobase embayment overLancaster Sound. Hence, ice load irregularities with wavelengths of about 100 km were large enough to leave anisostatic thumbprint in this region of the continent. The apparent absence of a similar embayment over Jones Soundprobably indicates a greater Late Wisconsinan ice load there, or a thicker crust than in Lancaster Sound.
Résumé: Les plages soulevées et les deltas de l’île Devon renferment une abondante quantité de matériel apte à êtredatée. Un groupe de nombreuses datations au radiocarbone (228), incluant 154 nouvelles déterminations, a été utilisépour tracer les courbes du niveau marin relatif et pour dresser les cartes des isobases de l’île. Les matériaux quifournissent les meilleurs résultats pour cette étude sont les billes de bois échappé (61 âges) et les os de baleine franche(74 âges) dans les dépôts de plages soulevées et les coquilles de mollusques trouvées à la limite marine des deltas (20âges) ou aux altitudes proches de la limite marine (14 âges). Nous croyons que durant le dernier maximum glaciairel’île se trouvait sous le flanc sud-est de l’Inlandsis innuitien. L’histoire du niveau marin relatif est compatible avec laconfiguration déduite de l’étude de l’évolution de l’inlandsis. L’étendue de l’île représente la moitié de la largeur de lacalotte glaciaire. Les courbes du niveau marin relatif prennent une simple forme exponentielle, sauf à la limite glaciaireoù une émergence durant l’Holocène précoce a entretenu un stade de bas niveau durant l’Holocène moyen en dessousdu niveau marin actuel qui fut suivi d’une submergence ennoyant le passage de la zone de bombement crustal. Lestemps de réponse des courbes du niveau marin relatif et du soulèvement crustal décroissent en se déplaçant du centrede soulèvement vers la zone limite de charge des glaces, cependant le changement semble avoir été plus rapide àproximité de la limite. Le soulèvement innuitien est séparé du soulèvement laurentidien au sud par un enfoncementprononcé de l’isobase sur le détroit de Lancaster. Donc, les irrégularités de la charge glaciaire avec longueurs d’onded’environ 100 km, étaient suffisamment importantes pour avoir laissé leur empreinte dans cette région du continent.L’absence apparente d’un enfoncement similaire de l’isobase sur le détroit de Jones indique que la charge glaciaire auWisconsinien tardif était probablement plus élevée à cet endroit, ou bien la croûte était plus épaisse dans le détroit deLancaster.
[Traduit par la Rédaction] 904
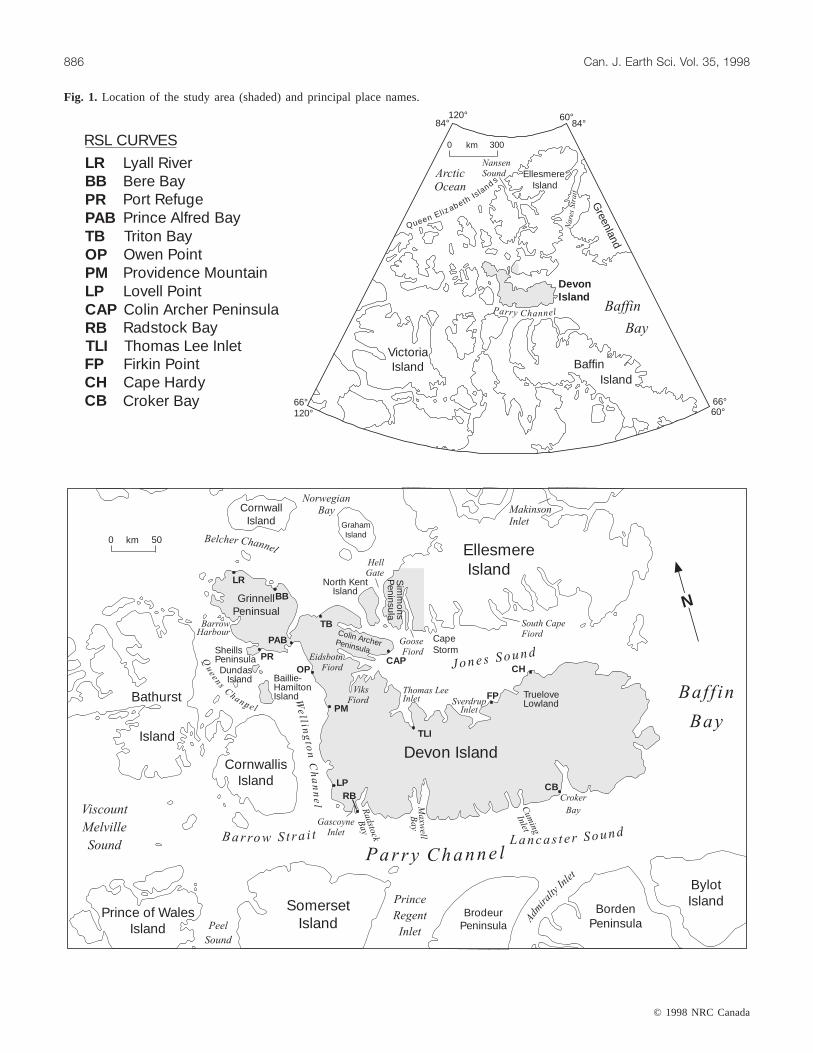
Much of the discussion of the extent of glaciation duringthe Last Glacial Maximum (LGM) in the Queen ElizabethIslands (Fig. 1) has involved postglacial rebound. Blake
(1970), for example, proposed that the Innuitian Ice Sheetcovered the Queen Elizabeth Islands to account for thebroad, arch-like pattern of regional uplift. A similar, butmore qualitative, assessment had been advanced earlier(Washburn 1947; Wickenden 1947). However, portrayals ofthe regional pattern of uplift have remained rather fluid, asreviewed by Dyke (1998). Furthermore, the interpretation ofuplift became controversial when advances in the theory ofglacioisostasy allowed nonunique ice load distributions toexplain the uplift pattern. The critical recognition was thatice sheets depress the crust about 200 km beyond their mar-gins because of the stiffness of the crust (Walcott 1970). Asa consequence, relative sea level (RSL) at an ice margin at
Can. J. Earth Sci.35: 885–904 (1998) © 1998 NRC Canada
885
Received November 29, 1997. Accepted April 1, 1998.
A.S. Dyke. Terrain Sciences Division, Geological Survey ofCanada, 601 Booth Street, Ottawa, ON K1A 0E8, Canada(e-mail: [email protected]).
1Geological Survey of Canada Contribution 1997203; PolarContinental Shelf Project Contribution 00298.
1I:\cjes\cjes35\cjes-08\E98-034tfh.vpThursday, December 03, 1998 11:30:39 AM
Color profile: DisabledComposite Default screen
© 1998 NRC Canada
886 Can. J. Earth Sci. Vol. 35, 1998
North KentIsland
CornwallIsland
SheillsPeninsula
Baillie-HamiltonIsland
BarrowHarbour
Sim
mo
nsP
eninsula
Colin ArcherPeninsula
Jones Sound
Croker
Bay
Cum
ing
Inlet
TrueloveLowland
GrinnellPeninsual
We
ll ing
ton
Ch
an
ne
l
L anc a s t e r S o undB a r row S t r a i t
CornwallisIsland
SomersetIsland
Prince of WalesIsland
BylotIsland
BordenPeninsula
BrodeurPeninsula
Devon Island
EllesmereIsland
NorwegianBay
Belcher Channel
Qu
eens
Channel
Maxw
ellB
ay
Radsto
ck
Bay
GascoyneInlet
Prince
Regent
Inlet
Adm
iral
tyIn
let
GrahamIsland
Baff in
Bay
Viscount
Melville
Sound
Peel
Sound
ViksFiord
EidsbotnFiord
GooseFiord
HellGate
SverdrupInlet
Thomas LeeInletBathurst
Island
km0 50
P a r r y C h a n n e l
N
DundasIsland
Queen Eliz abethIsland s
Bay
Baffin
ArcticOcean
Nare
sStr
ait
VictoriaIsland
DevonIsland
EllesmereIsland
Baffin
120° 60°
66°66°
84°
60°120°
84°
Island
0 km 300
Parry Channel
CH
FP
CAP
TB
BB
LR
PR
PAB
OP
PM
LPRB
CB
RSL CURVES
BayCrokerCBHardyCapeCHPointFirkinFP
BayRadstockRBPeninsulaArcherColinCAP
PointLovellLPMountainProvidencePM
PointOwenOPBayTritonTB
BayAlfredPrincePABRefugePortPRBayBereBBRiverLyallLR
TLI
TLI Thomas Lee Inlet
MakinsonInlet
South CapeFiordCape
Storm
Greenland
NansenSound
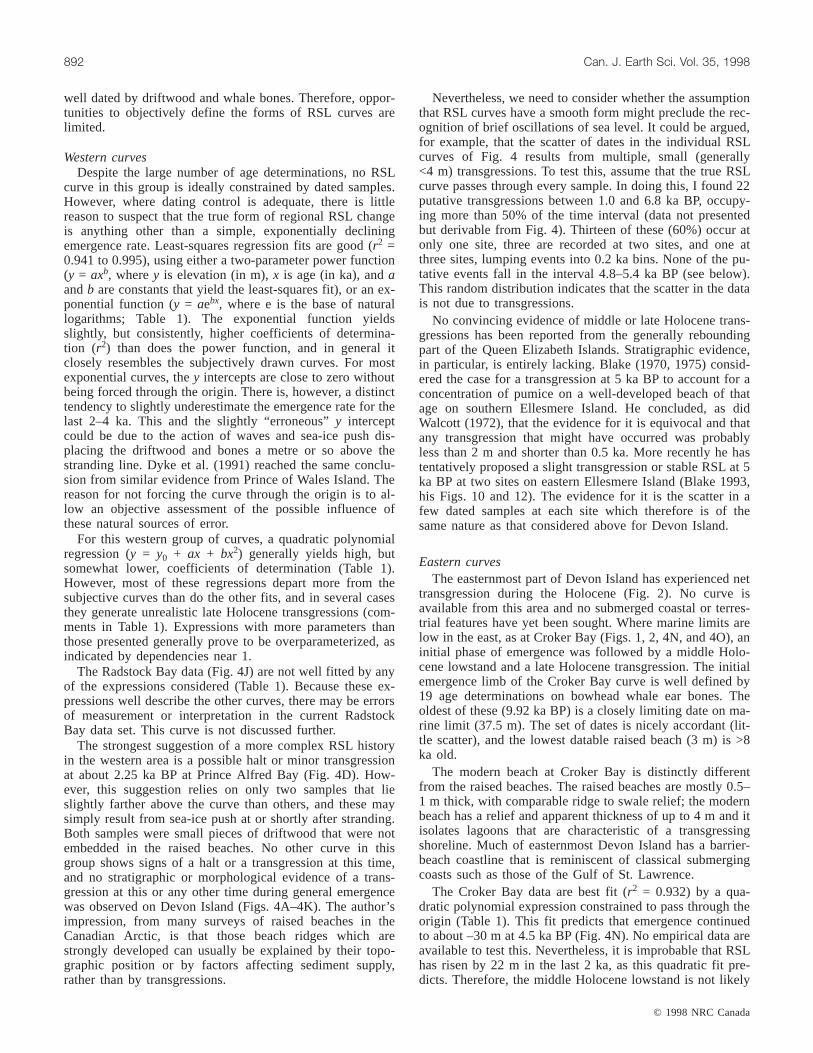
Fig. 1. Location of the study area (shaded) and principal place names.
2I:\cjes\cjes35\cjes-08\E98-034tfh.vpThursday, December 03, 1998 11:30:43 AM
Color profile: DisabledComposite Default screen
equilibrium depression can be on the order of 100 m. Partlyfor this reason, an alternative interpretation of thepostglacial uplift of the Queen Elizabeth Islands was pro-posed (England 1976a), wherein the Laurentide and Green-land ice sheets each depressed swaths of the QueenElizabeth Islands in their forefields and a series of noncon-tiguous intervening ice caps, named the Franklin Ice Com-plex, accounted for the rest of the observed crustaldeflection. Thereafter, the Queen Elizabeth Islands upliftpattern constituted inadequate proof of the general configu-ration of the LGM ice load (Tushingham 1991; England etal. 1991). Indeed, Boulton (1979) even went so far as to in-sist that the inference of ice sheet configuration from RSLdata, with specific reference to the Queen Elizabeth Islands,was a “misuse of data.” Clearly, therefore, more direct gla-cial geological evidence was required to demonstrate whatthis configuration might be. A further caution was raisedwhen England (1987; see also England 1997) proposed thatneotectonics may have influenced the Holocene uplift pat-tern. Similarly, Dyke et al. (1991) proposed that the strongridge pattern of early Holocene shoreline deformation overthe structural Boothia Arch and vicinity indicated a largetectonic complication of the glacial rebound pattern. Be-cause no alternative interpretation of that ridge or associatedfeatures has been advanced, we should remain cautious inassuming that Holocene uplift in glaciated Canada is every-where a simple glacioisostatic response.
In a companion paper, I have argued entirely from ice-flow and ice-recession evidence that the Innuitian Ice Sheetmodel is appropriate for at least the southeastern QueenElizabeth Islands (Dyke 1998). One purpose of this paper isto demonstrate that the postglacial rebound pattern in this re-gion is also congruent with the Innuitian model. If this is ac-cepted, the door is open for inverse modeling of RSLhistories as the most economical way of reconstructing theice thickness history from LGM onward for the Queen Eliz-abeth Islands in general. This would be a useful guide forthe next phase of research in regional glacial geology. RSLhistory is reconstructed herein from 228 radiocarbon dates,154 of which are previously unpublished. The Devon IslandRSL data are of further interest, because they record thecrustal response to unloading from the centre of uplift tonear the edge, and because well-constrained RSL curves al-low an evaluation of curve forms, response times, andforebulge migration.
Devon Island extends halfway across the Queen ElizabethIslands from Baffin Bay in the southeast toward the ArcticOcean in the northwest (Fig. 1). In Blake’s (1970) originalproposal, the western tip of the island lies near the centre ofthe Innuitian Ice Sheet. The glacial geology of Devon Islandand vicinity indicates that ice flow from the central part(s)of the Innuitian Ice Sheet and convergent flow from an icedivide over the axis of Devon Island, and possibly fromCornwallis and Bathurst islands, sustained an ice stream inWellington Channel at LGM. This ice stream extended alongLancaster Sound an undetermined distance beyond Gas-coyne Inlet. It presumably ended short of the Eclipse Mo-raines at the mouth of the sound because these have been
dated to the Early Wisconsinan (Klassen 1993; McCuaig1994). It possibly terminated in an ice shelf in LancasterSound (Dyke and Prest 1987). Similarly, the extent of LGMice in Jones Sound remains geologically undefined. How-ever, the RSL data presented below bear importantly on thisquestion.
Deglaciation was underway in the eastern coastal areas by10 000 radiocarbon years BP (10 ka BP). The sea had pene-trated to the head of Jones Sound by 9.3 ka BP and to Nor-wegian Bay by 9.2 ka BP. The Wellington Channel coastwas deglaciated about 8.2 ka BP. After clearing of the chan-nels, ice on Devon Island retreated to final remnants scat-tered along the LGM ice divide. These vanished about 8 kaBP. The Devon Ice Cap did not disappear during the earlyHolocene recession, but it probably shrank to become muchsmaller than its present size (Dyke 1998).
MethodsPrior to fieldwork, marine-limit deposits and features
were mapped from airphotos and the areas of best-developedraised beaches were identified. In the field, elevations weredetermined by Wallace and Tiernan surveying altimeters us-ing shortest possible closure times between sample sites andsea level (Dyke et al. 1991). Elevations errors are no morethan 5%.
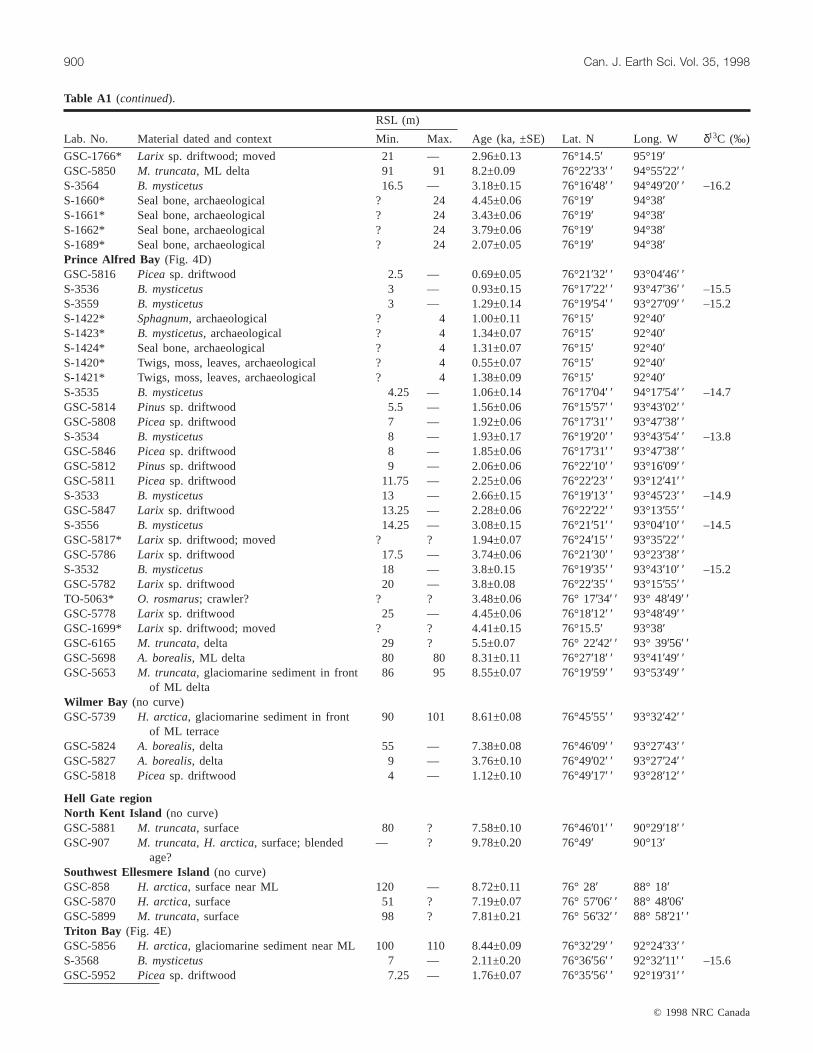
A variety of materials was collected for radiocarbon dat-ing. Marine mollusc shells proved to be the most abundantfossils associated with marine limit. Shells from 20 marine-limit deltas and a further 14 collections found closest to lo-cal marine limits have been dated. Several samples of shellsand terrestrial plant detritus from perched deltas below ma-rine limit were also dated. Sixty-one samples of driftwoodand 74 samples of bowhead whale (Balaena mysticetus) earbones from raised beaches were dated. Several walrus(Odobenus rosmarus) tusks from raised beaches were alsodated, but some of these are evidently from animals thatwandered inland and died. Ages of archaeological sites anda few basal peat deposits further constrain RSL interpreta-tions.
All pertinent radiocarbon age determinations are reportedin Appendix 1, Table A1. Age determinations for terrestrialmaterials are normalized toδ13CPDB = –25‰. Shell dates arereported with a –400 year marine reservoir correction afterthe same normalization. Bowhead whale bone collagen agesare reported in uncorrected form along with theδ13C mea-surements. In effect, this applies a reservoir correction ofabout –200 years, which seems appropriate on the basis ofcomparative datings of wood and bones and other criteria(Dyke et al. 1996). Subjective RSL curves (not presented)were drawn using all available data. Samples that poorlyconstrain the curve (e.g., a deep-water shell dates) were re-moved and least-squares regressions were fitted to the re-maining data.
Marine limitsA local marine limit can be recognized with certainty
where the highest marine features coincide with the lowestcontemporaneous subaerial features. On Devon Island, thiscondition is met in many places where ice-marginal (lateral)
© 1998 NRC Canada
Dyke 887
3I:\cjes\cjes35\cjes-08\E98-034tfh.vpThursday, December 03, 1998 11:30:43 AM
Color profile: DisabledComposite Default screen
meltwater channels descend to the highest raised beachesand where ice-contact or ice-proximal deltas occur, com-monly at the mouths of meltwater channels.
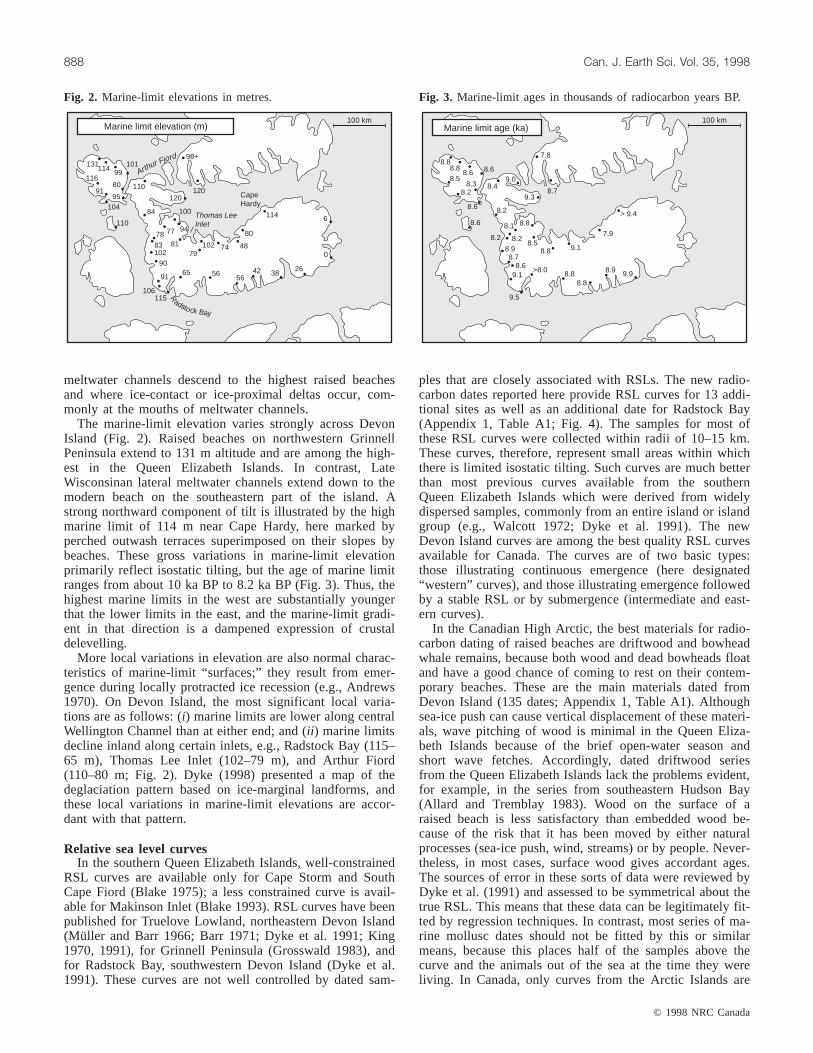
The marine-limit elevation varies strongly across DevonIsland (Fig. 2). Raised beaches on northwestern GrinnellPeninsula extend to 131 m altitude and are among the high-est in the Queen Elizabeth Islands. In contrast, LateWisconsinan lateral meltwater channels extend down to themodern beach on the southeastern part of the island. Astrong northward component of tilt is illustrated by the highmarine limit of 114 m near Cape Hardy, here marked byperched outwash terraces superimposed on their slopes bybeaches. These gross variations in marine-limit elevationprimarily reflect isostatic tilting, but the age of marine limitranges from about 10 ka BP to 8.2 ka BP (Fig. 3). Thus, thehighest marine limits in the west are substantially youngerthat the lower limits in the east, and the marine-limit gradi-ent in that direction is a dampened expression of crustaldelevelling.
More local variations in elevation are also normal charac-teristics of marine-limit “surfaces;” they result from emer-gence during locally protracted ice recession (e.g., Andrews1970). On Devon Island, the most significant local varia-tions are as follows: (i) marine limits are lower along centralWellington Channel than at either end; and (ii ) marine limitsdecline inland along certain inlets, e.g., Radstock Bay (115–65 m), Thomas Lee Inlet (102–79 m), and Arthur Fiord(110–80 m; Fig. 2). Dyke (1998) presented a map of thedeglaciation pattern based on ice-marginal landforms, andthese local variations in marine-limit elevations are accor-dant with that pattern.
Relative sea level curvesIn the southern Queen Elizabeth Islands, well-constrained
RSL curves are available only for Cape Storm and SouthCape Fiord (Blake 1975); a less constrained curve is avail-able for Makinson Inlet (Blake 1993). RSL curves have beenpublished for Truelove Lowland, northeastern Devon Island(Müller and Barr 1966; Barr 1971; Dyke et al. 1991; King1970, 1991), for Grinnell Peninsula (Grosswald 1983), andfor Radstock Bay, southwestern Devon Island (Dyke et al.1991). These curves are not well controlled by dated sam-
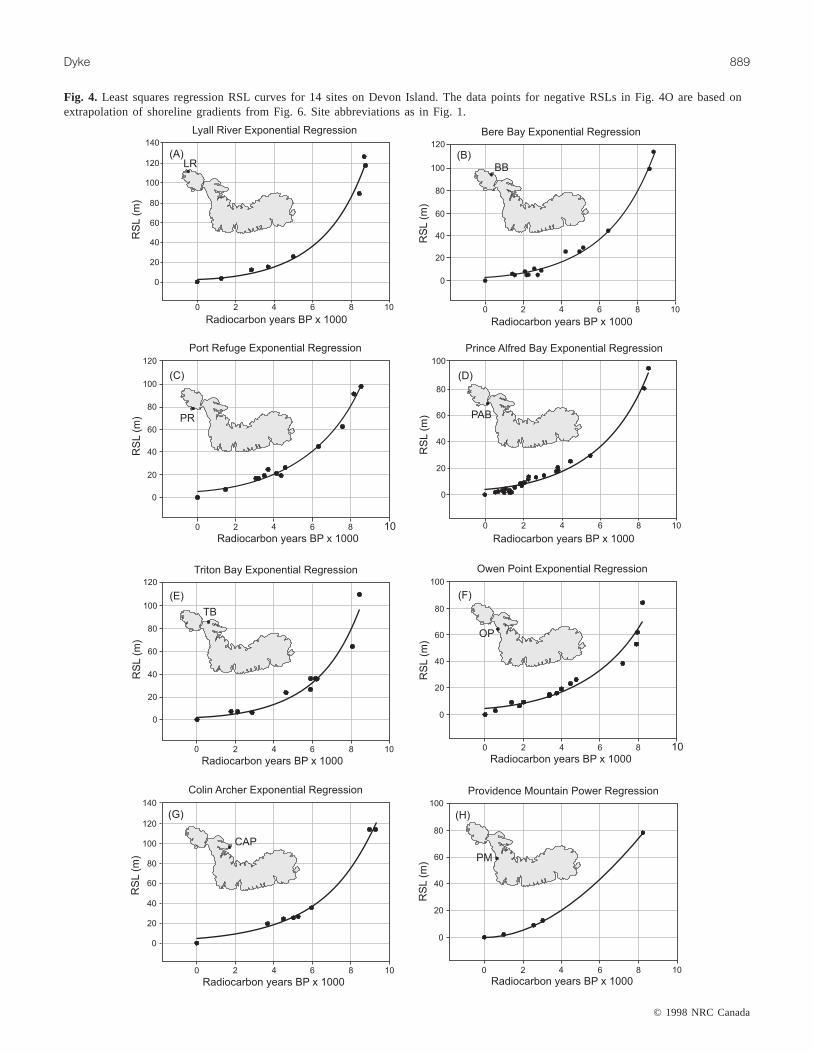
ples that are closely associated with RSLs. The new radio-carbon dates reported here provide RSL curves for 13 addi-tional sites as well as an additional date for Radstock Bay(Appendix 1, Table A1; Fig. 4). The samples for most ofthese RSL curves were collected within radii of 10–15 km.These curves, therefore, represent small areas within whichthere is limited isostatic tilting. Such curves are much betterthan most previous curves available from the southernQueen Elizabeth Islands which were derived from widelydispersed samples, commonly from an entire island or islandgroup (e.g., Walcott 1972; Dyke et al. 1991). The newDevon Island curves are among the best quality RSL curvesavailable for Canada. The curves are of two basic types:those illustrating continuous emergence (here designated“western” curves), and those illustrating emergence followedby a stable RSL or by submergence (intermediate and east-ern curves).
In the Canadian High Arctic, the best materials for radio-carbon dating of raised beaches are driftwood and bowheadwhale remains, because both wood and dead bowheads floatand have a good chance of coming to rest on their contem-porary beaches. These are the main materials dated fromDevon Island (135 dates; Appendix 1, Table A1). Althoughsea-ice push can cause vertical displacement of these materi-als, wave pitching of wood is minimal in the Queen Eliza-beth Islands because of the brief open-water season andshort wave fetches. Accordingly, dated driftwood seriesfrom the Queen Elizabeth Islands lack the problems evident,for example, in the series from southeastern Hudson Bay(Allard and Tremblay 1983). Wood on the surface of araised beach is less satisfactory than embedded wood be-cause of the risk that it has been moved by either naturalprocesses (sea-ice push, wind, streams) or by people. Never-theless, in most cases, surface wood gives accordant ages.The sources of error in these sorts of data were reviewed byDyke et al. (1991) and assessed to be symmetrical about thetrue RSL. This means that these data can be legitimately fit-ted by regression techniques. In contrast, most series of ma-rine mollusc dates should not be fitted by this or similarmeans, because this places half of the samples above thecurve and the animals out of the sea at the time they wereliving. In Canada, only curves from the Arctic Islands are
© 1998 NRC Canada
888 Can. J. Earth Sci. Vol. 35, 1998
100 kmMarine limit elevation (m)
115
110
110
104114
114116
131
106
120120
98+
91
8183
84
38
0
6
26
80
80
101
9591
99
79
78 77
102
Thomas LeeInlet
R
adstock Bay
CapeHardy
100
102
94
9065 56
5642
74 48
Arthur Fjord
Fig. 2. Marine-limit elevations in metres.
100 kmMarine limit age (ka)
8.88.8
8.8
8.88.8
>8.0
8.9
8.9
8.7
8.8
7.9
> 9.4
8.6
8.6
8.69.3
9.9
9.5
9.1
8.7
8.6
8.6
8.48.38.2
8.2
8.2 8.2
8.1
8.5
8.5
9.0
9.1
7.8
Fig. 3. Marine-limit ages in thousands of radiocarbon years BP.
4I:\cjes\cjes35\cjes-08\E98-034tfh.vpThursday, December 03, 1998 11:30:50 AM
Color profile: DisabledComposite Default screen
© 1998 NRC Canada
Dyke 889
Radiocarbon years BP x 1000
RS
L(m
)140
120
100
80
60
40
20
0
0 2 4 6 8 10
Lyall River Exponential Regression
120
100
80
60
40
20
0
0 2 4 6 8 10
Radiocarbon years BP x 1000
RS
L(m
)
Bere Bay Exponential Regression
(A) (B)LR BB
120
100
80
60
40
20
0
0 2 4 6 8 10
Port Refuge Exponential Regression
Radiocarbon years BP x 1000
RS
L(m
)
(C)
PR
100
80
60
40
20
0
0 2 4 6 8 10
Prince Alfred Bay Exponential Regression
Radiocarbon years BP x 1000
RS
L(m
)
(D)
PAB
120
100
80
60
40
20
0
0 2 4 6 8 10
Triton Bay Exponential Regression
Radiocarbon years BP x 1000
RS
L(m
)
(E)
TB
100
80
60
40
20
0
0 2 4 6 8 10
Owen Point Exponential Regression
Radiocarbon years BP x 1000
RS
L(m
)
(F)
OP
140
120
100
80
60
40
20
0
0 2 4 6 8 10
Colin Archer Exponential Regression
Radiocarbon years BP x 1000
RS
L(m
)
100
80
60
40
20
0
0 2 4 6 8 10
Providence Mountain Power Regression
Radiocarbon years BP x 1000
RS
L(m
)
(G) (H)
PM
CAP
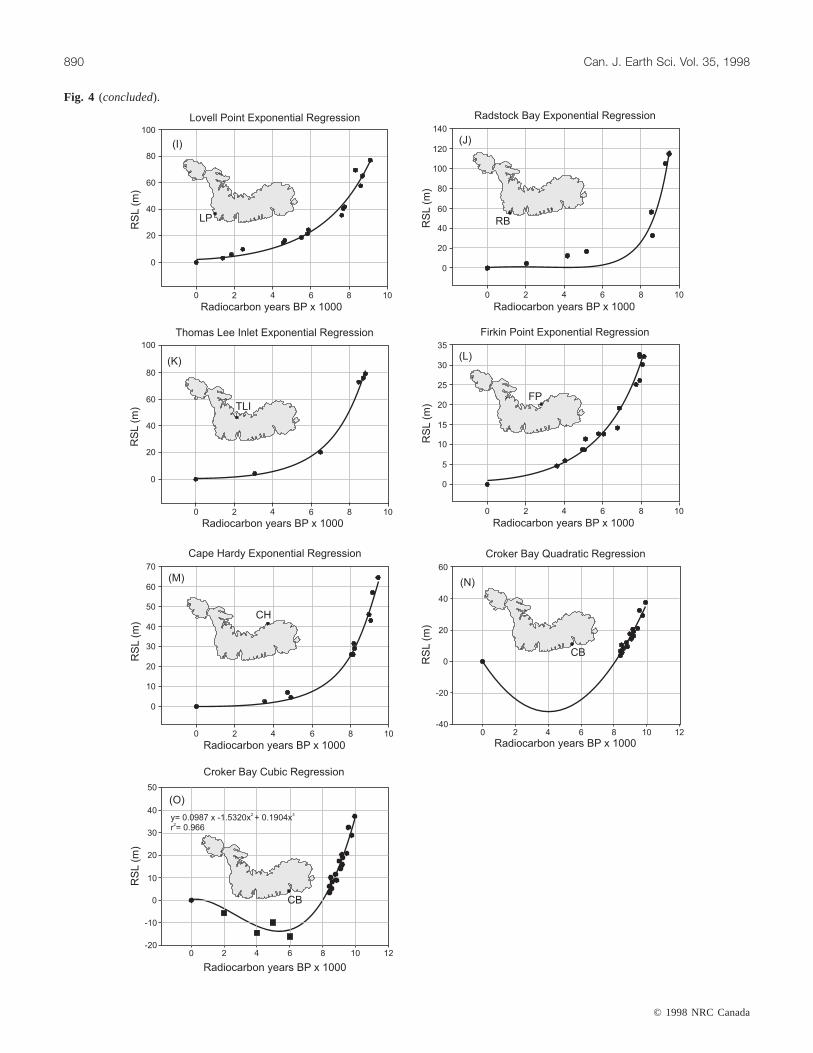
Fig. 4. Least squares regression RSL curves for 14 sites on Devon Island. The data points for negative RSLs in Fig. 4O are based onextrapolation of shoreline gradients from Fig. 6. Site abbreviations as in Fig. 1.
5I:\cjes\cjes35\cjes-08\E98-034tfh.vpThursday, December 03, 1998 11:30:56 AM
Color profile: DisabledComposite Default screen
© 1998 NRC Canada
890 Can. J. Earth Sci. Vol. 35, 1998
Radiocarbon years BP x 1000
100
80
60
40
20
0
0 2 4 6 8 10
Lovell Point Exponential Regression
Radiocarbon years BP x 1000
RS
L(m
)140
120
100
80
60
40
20
0
0 2 4 6 8 10
Radiocarbon years BP x 1000
Radstock Bay Exponential Regression
RS
L(m
)
100
80
60
40
20
0
0 2 4 6 8 10
Radiocarbon years BP x 1000
Thomas Lee Inlet Exponential Regression
RS
L(m
)
1086420
0
5
10
15
20
25
30
35
Firkin Point Exponential Regression
Radiocarbon years BP x 1000
RS
L(m
)
(I) (J)
(K)(L)
TLIFP
RBLP
70
60
50
40
30
20
10
0
0 2 4 6 8 10
Cape Hardy Exponential Regression
Radiocarbon years BP x 1000
RS
L(m
)
121086420-40
-20
0
20
40
60
Croker Bay Quadratic Regression
Radiocarbon years BP x 1000
RS
L(m
)
(M) (N)
0 2 4 6 8 10 12-20
-10
0
10
20
30
40
50
Croker Bay Cubic Regression
RS
L(m
)
(O)
y= 0.0987 x -1.5320x + 0.1904xr = 0.966
2 3
2
CH
CB
CB
Fig. 4 (concluded).
6I:\cjes\cjes35\cjes-08\E98-034tfh.vpThursday, December 03, 1998 11:31:01 AM
Color profile: DisabledComposite Default screen
©1
99
8N
RC
Ca
na
da
Dyke
891
Exponential (y = aebx) Power (y = axb) Quadratic (y = yo + ax + bx2)
RSL curve a b r2 T½ (ka) Similarity a b r2 Similarity a b r2 Similarity
Lyall River(Fig. 4A)
2.7182 0.4303 0.982(n = 8)
1.61 Very similar 0.4084 2.6020 0.977 Similar –4.3846 1.9483 0.968 False late transgression
Bere Bay(Fig. 4B)
3.4895 0.3919 0.991(n = 14)
1.768 Very similar 0.6225 2.3673 0.988 Very similar –4.1967 1.7745 0.960 False late transgression
Port Refuge(Fig. 4C)
5.0930 0.3446 0.984(n = 9)
2.011 Similar;y inter-cept 3 m
1.2859 1.9922 0.970 Similar –1.2328 1.3482 0.953 Too low last 5 ka
Prince AlfredBay(Fig. 4D)
3.9178 0.3694 0.981(n = 20)
1.867 Similar; too highlast 2 ka
1.6531 1.8532 0.980 Similar; too lowlast 3 ka
–0.0764 1.1913 0.974 Similar; too low last4 ka
Triton Bay(Fig. 4E)
2.1234 0.4523 0.944(n = 10)
1.532 Similar 0.1338 3.0752 0.932 Too low last 5 ka –7.2133 2.0007 0.859 False late transgression
Owen Point(Fig. 4F)
4.3556 0.3365 0.941(n = 14)
2.059 Similar;y inter-cept 3 m
1.6248 1.7581 0.926 Too low last 2 ka;overestimatesmarine limit age
–0.0827 0.9378 0.907 Too low throughout
Colin ArcherPeninsula(Fig. 4G)
4.3338 0.3583 0.991(n = 7)
1.934 Very similar 0.5024 2.4521 0.990 Similar; too lowlast 4 ka
–3.7562 1.7487 0.985 False late transgression
ProvidenceMountain(Fig. 4H)
2.9696 0.3973 0.995(n = 4)
1.744 Similar 1.5521 1.8583 0.999 Very similar 0.7713 1.0573 0.999 Very similar
Lovell Point(Fig. 4I)
2.1848 0.3882 0.966(n = 14)
1.785 Very similar 0.1664 2.7471 0.954 Too low last 5 ka –4.2109 1.2267 0.894 False late transgression
RadstockBay (Fig.4J)a
0.0077 1.0183 0.949(n = 6)
0.680 Too low last 8ka
0.0001 6.3853 0.919 Too low last 8 ka –8.3110 1.8293 0.892 False late transgression
Thomas LeeInlet(Fig. 4K)
0.6003 0.5566 0.994(n = 5)
1.245 Very similar 0.0076 4.2603 0.995 Similar; too lowlast 5 ka
–7.9087 1.8624 0.969 False late transgression
Firkin Point(Fig. 4L)
0.9820 0.4269 0.968(n = 15)
1.623 Very similar 0.0937 2.7675 0.962 Very similar –1.8623 0.6773 0.949 Similar; slight latetransgressionpossible
Cape Hardy(Fig. 4M)
0.1783 0.6222 0.983(n = 12)
1.113 Very similar 0.0004 5.3876 0.978 Very similar; toolow 3–6 ka
–5.7550 1.1775 0.902 Similar; too lowbefore 3 ka
Croker Bay(Fig. 4N)
0.0009 1.0705 0.923(n = 19)
0.647 Stable RSLlast 6 ka
0.0000 9.9202 0.926 Array illconditioned
–15.7180 1.9405 0.932 Very similar; lowstandtoo low
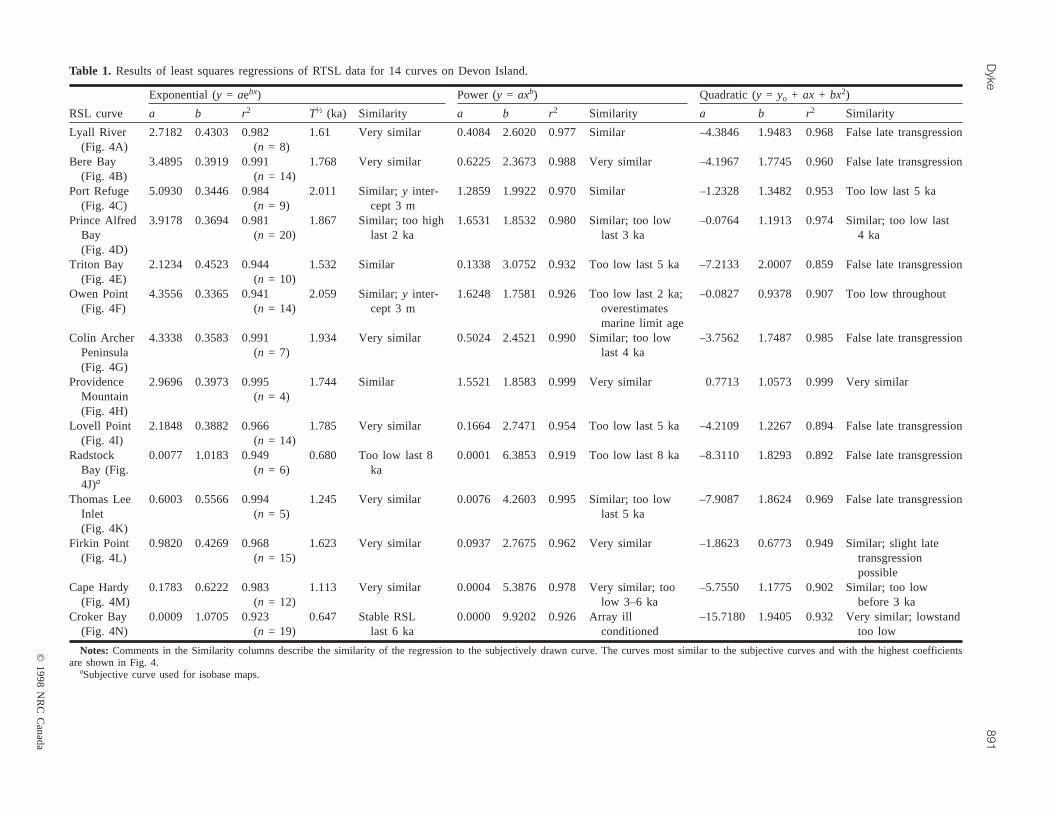
Notes: Comments in the Similarity columns describe the similarity of the regression to the subjectively drawn curve. The curves most similar to the subjective curves and with the highest coefficientsare shown in Fig. 4.
aSubjective curve used for isobase maps.
Table 1. Results of least squares regressions of RTSL data for 14 curves on Devon Island.
7I:\cjes\cjes35\cjes-08\E98-034tfh.vp
Thursday, December 03, 1998 11:31:02 AM
Color profile: Disabled
Composite Default screen
well dated by driftwood and whale bones. Therefore, oppor-tunities to objectively define the forms of RSL curves arelimited.
Western curvesDespite the large number of age determinations, no RSL
curve in this group is ideally constrained by dated samples.However, where dating control is adequate, there is littlereason to suspect that the true form of regional RSL changeis anything other than a simple, exponentially decliningemergence rate. Least-squares regression fits are good (r2 =0.941 to 0.995), using either a two-parameter power function(y = axb, wherey is elevation (in m),x is age (in ka), andaandb are constants that yield the least-squares fit), or an ex-ponential function (y = aebx, where e is the base of naturallogarithms; Table 1). The exponential function yieldsslightly, but consistently, higher coefficients of determina-tion (r2) than does the power function, and in general itclosely resembles the subjectively drawn curves. For mostexponential curves, they intercepts are close to zero withoutbeing forced through the origin. There is, however, a distincttendency to slightly underestimate the emergence rate for thelast 2–4 ka. This and the slightly “erroneous”y interceptcould be due to the action of waves and sea-ice push dis-placing the driftwood and bones a metre or so above thestranding line. Dyke et al. (1991) reached the same conclu-sion from similar evidence from Prince of Wales Island. Thereason for not forcing the curve through the origin is to al-low an objective assessment of the possible influence ofthese natural sources of error.
For this western group of curves, a quadratic polynomialregression (y = y0 + ax + bx2) generally yields high, butsomewhat lower, coefficients of determination (Table 1).However, most of these regressions depart more from thesubjective curves than do the other fits, and in several casesthey generate unrealistic late Holocene transgressions (com-ments in Table 1). Expressions with more parameters thanthose presented generally prove to be overparameterized, asindicated by dependencies near 1.
The Radstock Bay data (Fig. 4J) are not well fitted by anyof the expressions considered (Table 1). Because these ex-pressions well describe the other curves, there may be errorsof measurement or interpretation in the current RadstockBay data set. This curve is not discussed further.
The strongest suggestion of a more complex RSL historyin the western area is a possible halt or minor transgressionat about 2.25 ka BP at Prince Alfred Bay (Fig. 4D). How-ever, this suggestion relies on only two samples that lieslightly farther above the curve than others, and these maysimply result from sea-ice push at or shortly after stranding.Both samples were small pieces of driftwood that were notembedded in the raised beaches. No other curve in thisgroup shows signs of a halt or a transgression at this time,and no stratigraphic or morphological evidence of a trans-gression at this or any other time during general emergencewas observed on Devon Island (Figs. 4A–4K). The author’simpression, from many surveys of raised beaches in theCanadian Arctic, is that those beach ridges which arestrongly developed can usually be explained by their topo-graphic position or by factors affecting sediment supply,rather than by transgressions.
Nevertheless, we need to consider whether the assumptionthat RSL curves have a smooth form might preclude the rec-ognition of brief oscillations of sea level. It could be argued,for example, that the scatter of dates in the individual RSLcurves of Fig. 4 results from multiple, small (generally<4 m) transgressions. To test this, assume that the true RSLcurve passes through every sample. In doing this, I found 22putative transgressions between 1.0 and 6.8 ka BP, occupy-ing more than 50% of the time interval (data not presentedbut derivable from Fig. 4). Thirteen of these (60%) occur atonly one site, three are recorded at two sites, and one atthree sites, lumping events into 0.2 ka bins. None of the pu-tative events fall in the interval 4.8–5.4 ka BP (see below).This random distribution indicates that the scatter in the datais not due to transgressions.
No convincing evidence of middle or late Holocene trans-gressions has been reported from the generally reboundingpart of the Queen Elizabeth Islands. Stratigraphic evidence,in particular, is entirely lacking. Blake (1970, 1975) consid-ered the case for a transgression at 5 ka BP to account for aconcentration of pumice on a well-developed beach of thatage on southern Ellesmere Island. He concluded, as didWalcott (1972), that the evidence for it is equivocal and thatany transgression that might have occurred was probablyless than 2 m and shorter than 0.5 ka. More recently he hastentatively proposed a slight transgression or stable RSL at 5ka BP at two sites on eastern Ellesmere Island (Blake 1993,his Figs. 10 and 12). The evidence for it is the scatter in afew dated samples at each site which therefore is of thesame nature as that considered above for Devon Island.
Eastern curvesThe easternmost part of Devon Island has experienced net
transgression during the Holocene (Fig. 2). No curve isavailable from this area and no submerged coastal or terres-trial features have yet been sought. Where marine limits arelow in the east, as at Croker Bay (Figs. 1, 2, 4N, and 4O), aninitial phase of emergence was followed by a middle Holo-cene lowstand and a late Holocene transgression. The initialemergence limb of the Croker Bay curve is well defined by19 age determinations on bowhead whale ear bones. Theoldest of these (9.92 ka BP) is a closely limiting date on ma-rine limit (37.5 m). The set of dates is nicely accordant (lit-tle scatter), and the lowest datable raised beach (3 m) is >8ka old.
The modern beach at Croker Bay is distinctly differentfrom the raised beaches. The raised beaches are mostly 0.5–1 m thick, with comparable ridge to swale relief; the modernbeach has a relief and apparent thickness of up to 4 m and itisolates lagoons that are characteristic of a transgressingshoreline. Much of easternmost Devon Island has a barrier-beach coastline that is reminiscent of classical submergingcoasts such as those of the Gulf of St. Lawrence.
The Croker Bay data are best fit (r2 = 0.932) by a qua-dratic polynomial expression constrained to pass through theorigin (Table 1). This fit predicts that emergence continuedto about –30 m at 4.5 ka BP (Fig. 4N). No empirical data areavailable to test this. Nevertheless, it is improbable that RSLhas risen by 22 m in the last 2 ka, as this quadratic fit pre-dicts. Therefore, the middle Holocene lowstand is not likely
© 1998 NRC Canada
892 Can. J. Earth Sci. Vol. 35, 1998
8I:\cjes\cjes35\cjes-08\E98-034tfh.vpThursday, December 03, 1998 11:31:03 AM
Color profile: DisabledComposite Default screen
to have reached –30 m. The depth of this lowstand is as-sessed further below.
Intermediate curvesMarine limits along the northeast coast are higher than
those along the southeast coast, and the two new curvesfrom the northeast coast are of a form intermediate betweenthe eastern and western curves. On the Cape Hardy lowland(Fig. 4M), RSL had dropped to within a couple of metres ofpresent by 3.5 ka BP, according to an age determination onone of the lowest raised beaches (Appendix 1, Table A1). AtFirkin Point (Fig. 4L), farther west, RSL was no more than4 m above present at that time. These curves, which are wellfit by either of the expressions listed in Table 1, indicate thatRSL has been nearly stable for the last 2–3 ka and a slighttransgression may have commenced at Cape Hardy.
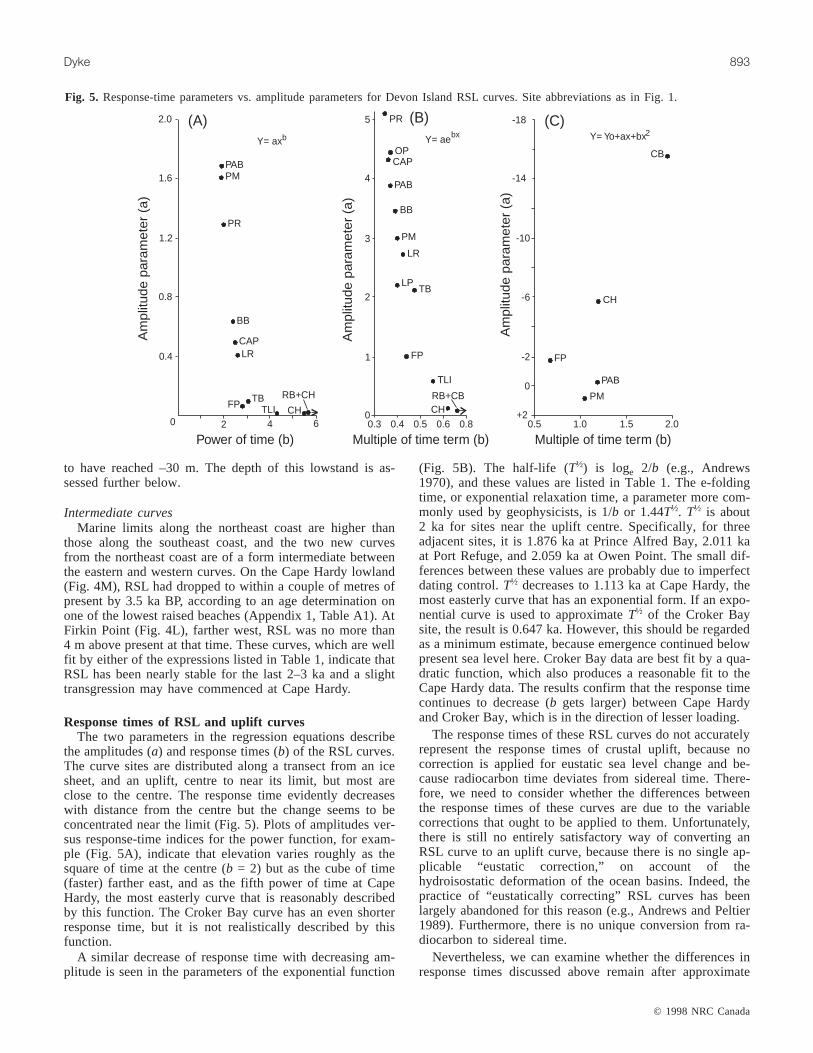
Response times of RSL and uplift curvesThe two parameters in the regression equations describe
the amplitudes (a) and response times (b) of the RSL curves.The curve sites are distributed along a transect from an icesheet, and an uplift, centre to near its limit, but most areclose to the centre. The response time evidently decreaseswith distance from the centre but the change seems to beconcentrated near the limit (Fig. 5). Plots of amplitudes ver-sus response-time indices for the power function, for exam-ple (Fig. 5A), indicate that elevation varies roughly as thesquare of time at the centre (b = 2) but as the cube of time(faster) farther east, and as the fifth power of time at CapeHardy, the most easterly curve that is reasonably describedby this function. The Croker Bay curve has an even shorterresponse time, but it is not realistically described by thisfunction.
A similar decrease of response time with decreasing am-plitude is seen in the parameters of the exponential function
(Fig. 5B). The half-life (T½) is loge 2/b (e.g., Andrews1970), and these values are listed in Table 1. The e-foldingtime, or exponential relaxation time, a parameter more com-monly used by geophysicists, is 1/b or 1.44T½. T½ is about2 ka for sites near the uplift centre. Specifically, for threeadjacent sites, it is 1.876 ka at Prince Alfred Bay, 2.011 kaat Port Refuge, and 2.059 ka at Owen Point. The small dif-ferences between these values are probably due to imperfectdating control.T½ decreases to 1.113 ka at Cape Hardy, themost easterly curve that has an exponential form. If an expo-nential curve is used to approximateT½ of the Croker Baysite, the result is 0.647 ka. However, this should be regardedas a minimum estimate, because emergence continued belowpresent sea level here. Croker Bay data are best fit by a qua-dratic function, which also produces a reasonable fit to theCape Hardy data. The results confirm that the response timecontinues to decrease (b gets larger) between Cape Hardyand Croker Bay, which is in the direction of lesser loading.
The response times of these RSL curves do not accuratelyrepresent the response times of crustal uplift, because nocorrection is applied for eustatic sea level change and be-cause radiocarbon time deviates from sidereal time. There-fore, we need to consider whether the differences betweenthe response times of these curves are due to the variablecorrections that ought to be applied to them. Unfortunately,there is still no entirely satisfactory way of converting anRSL curve to an uplift curve, because there is no single ap-plicable “eustatic correction,” on account of thehydroisostatic deformation of the ocean basins. Indeed, thepractice of “eustatically correcting” RSL curves has beenlargely abandoned for this reason (e.g., Andrews and Peltier1989). Furthermore, there is no unique conversion from ra-diocarbon to sidereal time.
Nevertheless, we can examine whether the differences inresponse times discussed above remain after approximate
© 1998 NRC Canada
Dyke 893
2.0
1.6
1.2
0.4
0
0.8
2 4 6
Am
plitu
de p
aram
eter
(a)
Power of time (b)
(A)Y= axb
PABPM
PR
BB
CAPLR
TBFP TLI CH
RB+CH
0.30
0.4 0.60.5 0.8
1
2
3
4
5 (B)Y= aebx
PR
OPCAP
PAB
BB
PM
LR
LPTB
FP
TLI
CHRB+CB
Multiple of time term (b) Multiple of time term (b)
Am
plitu
de p
aram
eter
(a)
Am
plitu
de p
aram
eter
(a)
-18
-14
-10
-6
-2
+2
0
0.5 1.0 1.5 2.0
CB
CH
FP
PAB
PM
(C)Y= Yo+ax+bx2
Fig. 5. Response-time parameters vs. amplitude parameters for Devon Island RSL curves. Site abbreviations as in Fig. 1.
9I:\cjes\cjes35\cjes-08\E98-034tfh.vpThursday, December 03, 1998 11:31:07 AM
Color profile: DisabledComposite Default screen
corrections are applied. Accordingly, two of the better-datedRSL curves (Prince Alfred Bay, west; Cape Hardy, east)were recalculated after applying the eustatic corrections in-dicated by the recent Barbados RSL curve (Fairbanks 1989)and after converting the radiocarbon ages to calendar yearsusing CALIB3 (Stuiver and Reimer 1993). TheT½ of thePrince Alfred Bay “uplift” curve is 1.870 ka (6 years less)and T½ of the Cape Hardy “uplift” curve is 1.219 ka (106years more). Thus the difference is reduced by only 15%,and theT½ of the Prince Alfred Bay RSL curve is on the lowside of the value of this parameter for central sites.
In evaluating the form of a true uplift curve, the amountof rebound that has yet to occur, so-called residual rebound(Andrews 1970), must also be considered. The residual re-bound at Cape Hardy is negligible, because RSL haschanged imperceptibly there during the last 3 ka. Theamount of residual rebound at the uplift centre is calculatedbelow as 6.25 m over the next 4 ka. When this quantity isincluded in the total postglacial uplift curve for Prince Al-fred Bay, that is, a curve with sea level at 0 m 4 ka in the fu-ture and the present shoreline raised to 6.25 m,T½ for thissite increases to 2.251 ka. Because the value for Cape Hardyremains unchanged, the difference inT½ between CapeHardy and Prince Alfred Bay is increased by nearly 0.4 ka.Hence, it appears that the decrease ofT½ from the centre ofuplift toward the margin is a persistent feature of the data.
Geophysicists have long described postglacial uplift as asimple exponential function (y = aebx) and have pointed outthat b, the proportionality constant, is related to mantle vis-cosity and to the size of the ice sheet (e.g., Andrews 1970,p. 37, cites a simple early model:b = (Pmg/2πη)L, wherePmis mantle density,g is acceleration due to gravity,η is mantleviscosity, andL is an ice sheet scale factor; this has beensuperceded by more elaborate models (Tushingham andPeltier 1991)). Using what in retrospect was a sparse RSLdata set, mainly shell dates, Andrews (1970) found that theproportionality constant of Canadian Arctic uplift curveswas essentially invariant. However, most of the data used inthat analysis were from heavily ice loaded sites; that is, siteswith appreciable recent and ongoing uplift. The Devon Is-land RSL curves also indicate closely similar response timesat such sites. However, the evident decrease in responsetimes near the ice sheet limit seems to be a novel feature ofthe Devon Island data. The geophysical implications of thisfinding deserve attention, and further scrutiny of RSL histo-ries near glacial limits is warranted to see if the pattern isspurious, regional, or general. Perhaps the shorter uplifthalf-lives of sites near the limit of ice loading, where totalcrustal depression was small, reflect a dominance of controlby the properties of the more elastic crust, and the longerhalf-lives of central sites, where depression was large andinvolved a greater volume of displaced mantle, reflect adominance of control by properties of the mantle.
The unquantified late Holocene regrowth of the Devon IceCap (Fisher 1979; Dyke 1998) may have partly counteredthe rebound from earlier deglaciation. Part of the late Holo-cene transgression at Croker Bay may thus be due to this re-loading. However, the contrast between the south and northsides of the ice cap (Croker Bay versus Cape Hardy) sug-gests that late Holocene reloading has had a minor effectand, given millennial response times, much of the new ice
load remains uncompensated. The substantial transgressionon southeast Devon Island, therefore, is more probably dueto inward migration of the glacial forebulge.
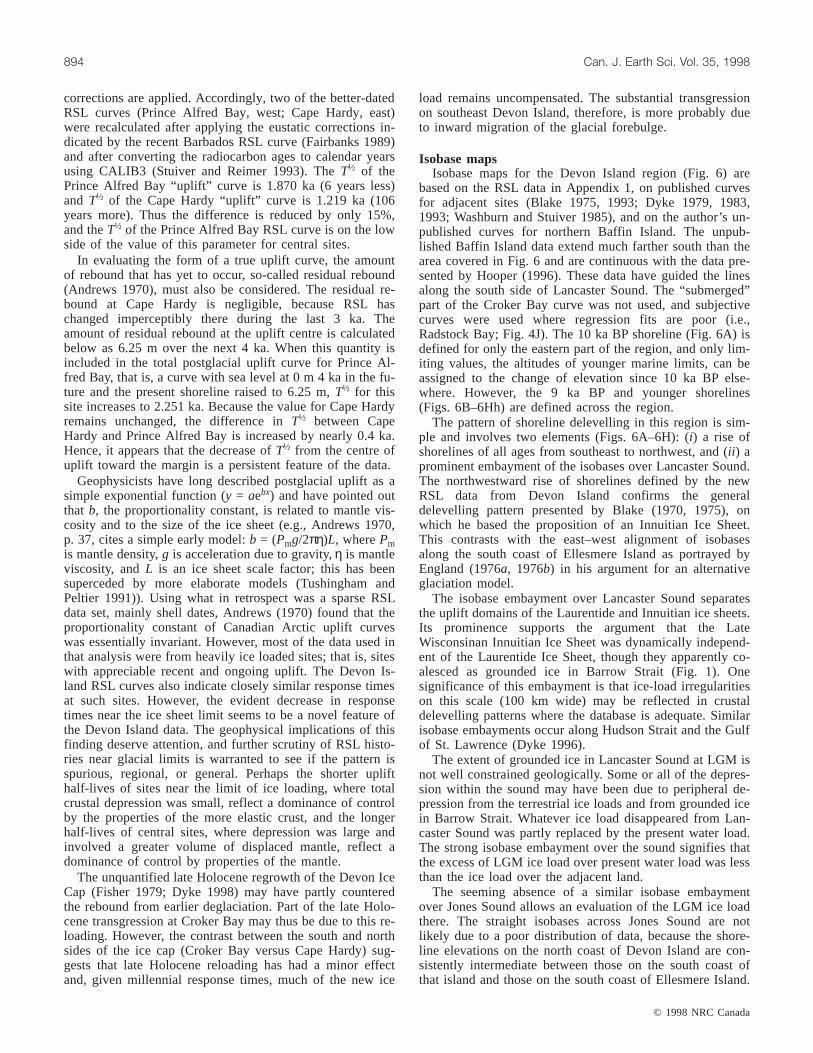
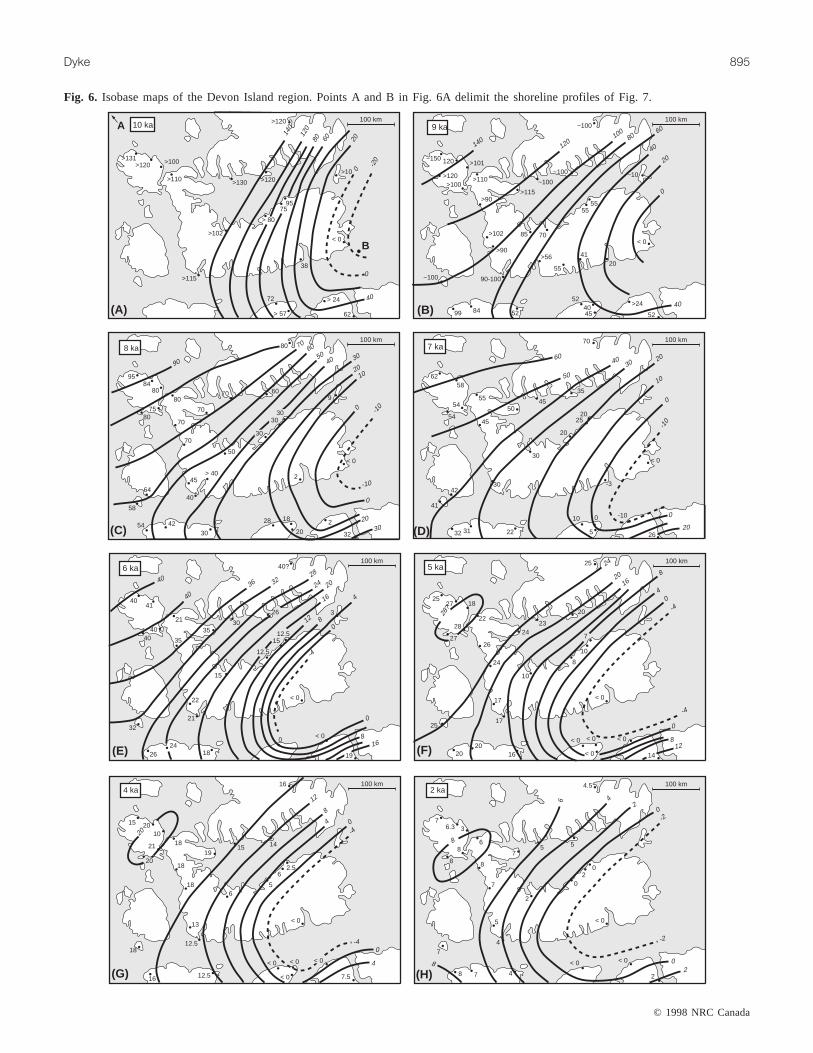
Isobase mapsIsobase maps for the Devon Island region (Fig. 6) are
based on the RSL data in Appendix 1, on published curvesfor adjacent sites (Blake 1975, 1993; Dyke 1979, 1983,1993; Washburn and Stuiver 1985), and on the author’s un-published curves for northern Baffin Island. The unpub-lished Baffin Island data extend much farther south than thearea covered in Fig. 6 and are continuous with the data pre-sented by Hooper (1996). These data have guided the linesalong the south side of Lancaster Sound. The “submerged”part of the Croker Bay curve was not used, and subjectivecurves were used where regression fits are poor (i.e.,Radstock Bay; Fig. 4J). The 10 ka BP shoreline (Fig. 6A) isdefined for only the eastern part of the region, and only lim-iting values, the altitudes of younger marine limits, can beassigned to the change of elevation since 10 ka BP else-where. However, the 9 ka BP and younger shorelines(Figs. 6B–6Hh) are defined across the region.
The pattern of shoreline delevelling in this region is sim-ple and involves two elements (Figs. 6A–6H): (i) a rise ofshorelines of all ages from southeast to northwest, and (ii ) aprominent embayment of the isobases over Lancaster Sound.The northwestward rise of shorelines defined by the newRSL data from Devon Island confirms the generaldelevelling pattern presented by Blake (1970, 1975), onwhich he based the proposition of an Innuitian Ice Sheet.This contrasts with the east–west alignment of isobasesalong the south coast of Ellesmere Island as portrayed byEngland (1976a, 1976b) in his argument for an alternativeglaciation model.
The isobase embayment over Lancaster Sound separatesthe uplift domains of the Laurentide and Innuitian ice sheets.Its prominence supports the argument that the LateWisconsinan Innuitian Ice Sheet was dynamically independ-ent of the Laurentide Ice Sheet, though they apparently co-alesced as grounded ice in Barrow Strait (Fig. 1). Onesignificance of this embayment is that ice-load irregularitieson this scale (100 km wide) may be reflected in crustaldelevelling patterns where the database is adequate. Similarisobase embayments occur along Hudson Strait and the Gulfof St. Lawrence (Dyke 1996).
The extent of grounded ice in Lancaster Sound at LGM isnot well constrained geologically. Some or all of the depres-sion within the sound may have been due to peripheral de-pression from the terrestrial ice loads and from grounded icein Barrow Strait. Whatever ice load disappeared from Lan-caster Sound was partly replaced by the present water load.The strong isobase embayment over the sound signifies thatthe excess of LGM ice load over present water load was lessthan the ice load over the adjacent land.
The seeming absence of a similar isobase embaymentover Jones Sound allows an evaluation of the LGM ice loadthere. The straight isobases across Jones Sound are notlikely due to a poor distribution of data, because the shore-line elevations on the north coast of Devon Island are con-sistently intermediate between those on the south coast ofthat island and those on the south coast of Ellesmere Island.
© 1998 NRC Canada
894 Can. J. Earth Sci. Vol. 35, 1998
10I:\cjes\cjes35\cjes-08\E98-034tfh.vpThursday, December 03, 1998 11:31:08 AM
Color profile: DisabledComposite Default screen
© 1998 NRC Canada
Dyke 895
100 km
(A)
100 km
(B)
100 km
(C)
100 km
(D)
100 km
4041
40?
15
18
12.5
1512.5
< 0
< 022
2426
32
0
21
4040
21
35
3530
26 3
-4
4
8
8
12
16
16
202428
3236
40
40
0
0
6 ka
19(E)
100 km
(F)
100 km
(G)
100 km
(H)
-20
2060
40
0
80
120
140
0
10 ka >120
>120>131
>120>130>110
>115
>100
>102
75
72
95
38
62
> 80
< 0
> 24
> 57
>10
B
A 9 ka ~100
~100
~100
~150
~100 90-100
>115
>110>100
>102
>120
120 >101
>90
>90>56
>24
52
52
5284994045
70< 0
5555
85
5520
41
~10
140120
10080
60
40
40
20
0
9584
80
80
50
30 3220
2
245> 40
42
64
54
58
28 18
40
7580
80
70
70
70
70 60
< 0
9
90
7060
5040
2010
-10
-10
0
0
30
3020
8 ka
30
3030
60
50
4030 20
10
0
0
20
-10
7 ka70
35
45
-3
45
5554
54
5862
42
223132
41
30
30
265
010 -10
20
25
< 0
2050
24
2016
8
812
0
40
-4
-4
5 ka 25
20
2324
26
22
18
28
27
2725
25
2020
16
10
8
7
17
17
14
< 0
< 0 < 0
< 0
< 0
10
24
28?
7.5
-4
-4
0
0
4
4
8
12
20
4 ka
< 0
< 0
< 0
< 0
< 0
12.5
12.5
16
13
18
18
1915
16
15
14
18
1821
20
20
10
6
62.5
5
2 ka
-2
-20
246
02
< 0< 0
< 0
24
4
5
7
7
7
755
4.5
2
20
0
7
8
8
8
8
6
6.3 3
8
8
Fig. 6. Isobase maps of the Devon Island region. Points A and B in Fig. 6A delimit the shoreline profiles of Fig. 7.
11I:\cjes\cjes35\cjes-08\E98-034tfh.vpThursday, December 03, 1998 11:31:18 AM
Color profile: DisabledComposite Default screen
Furthermore, the lack of deflection of isobases across JonesSound cannot be ascribed to the width of the sound, becauseit is as wide as Lancaster Sound. If the crust under JonesSound is considerably thicker than it is under LancasterSound, the isostatic effects of regional ice loads in andaround Jones Sound would have been more attenuated. Thusany regional contrasts in ice thickness might be muted in theisobase pattern. However, if crustal thicknesses are similar,and we have no evidence that they are not, the ice load inJones Sound was probably greater than that in LancasterSound. That inference is significant, because the ice config-uration in Jones Sound is poorly constrained otherwise. If anice stream filled Jones Sound, then ice thicknesses north ofit on Ellesmere Island were substantially greater than thosesouth of it on Devon Island. Possibly there was no icestream, and instead the sound was filled, or nearly filled, byice from both sides, but with Ellesmere ice dominating.
A better definition of ice loads in these sounds can be bestachieved through uplift modeling. The best replication tar-gets for inverse modeling of ice sheet history from RSL dataare isobase maps. They portray a spatially continuous re-sponse, they allow identification of outlier (misfit) data thatmight not appear anomalous on any RSL curve of averagequality, and they incorporate the full RSL database, not justthose spatially clustered samples which define RSL curves.For modeling purposes a complete time series of isobasemaps, as in Figs. 6A–6H, is best.
The zero isobaseThe zero isobase separates areas of emerged and sub-
merged paleoshorelines. It is thus a proxy of changes in theradius of an uplift. It is only an approximation, becauseearly in postglacial time eustatic sea level rise outpaced slowuplift at distal sites. Hence, the zero isobase for these times
falls inboard of the uplift margin and its migration reflectsthe combined effects of eustatic rise and migration of theforebulge. In the late Holocene, the latter effect dominates.A proper determination of changes in radius of the upliftwould require RSL curves with dated submerged shorelineseast of Croker Bay.
The position of the zero isobase in earliest postglacialtime is defined by the zero contour on marine-limit elevation(Fig. 2). Thereafter, its position can by estimated by extrapo-lation of the delevelled shoreline gradients (Fig. 6). The timeof its migration through formerly uplifted sites that are pres-ently submerging can be read from RSL curves such as theone for Croker Bay (Fig. 4). Between 9 and 2 ka BP, thezero isobase progressively shifted 220 km westward alongLancaster Sound (Figs. 6B–6H). In doing so, it crossed theentire Devon Ice Cap area. Although the Neoglacialregrowth of the ice cap has probably contributed to late Ho-locene submergence of eastern Devon Island, this cannotpresently be separated from the systematic shrinkage in theradius of the Holocene uplift.
Middle Holocene lowstandThe isobase maps provide an additional means of assess-
ing the amount of late Holocene submergence that has oc-curred at Croker Bay. Assuming a consistent spacing ofisobases beyond the lowest portrayed, the RSLs at CrokerBay are as follows: –16 m at 6 ka BP, –10 m at 5 ka BP, –14 mat 4 ka BP, and –5 m at 2 ka BP (Figs. 6E–6H). These areslight overestimates, because shoreline gradients should pro-gressively decrease toward the margin of the uplift. Never-theless, the isobase maps thus yield more conservative andmore realistic predictions, particularly for the last 4 ka, thandoes the RSL curve of Fig. 4N. Although these predictionscannot be considered primary data, they are based on datafrom neighbouring sites.
When these four estimates are added to the Croker BayRSL series, the quadratic polynomial expression provides alower coefficient of determination (r2 decreases from 0.932to 0.802) and the fit (not presented) to the early Holoceneraised-beach data becomes unrealistic: all samples fall abovethe curve. The extended series, however, is well fitted by acubic polynomial expression withr2 of 0.966 (Fig. 4O).
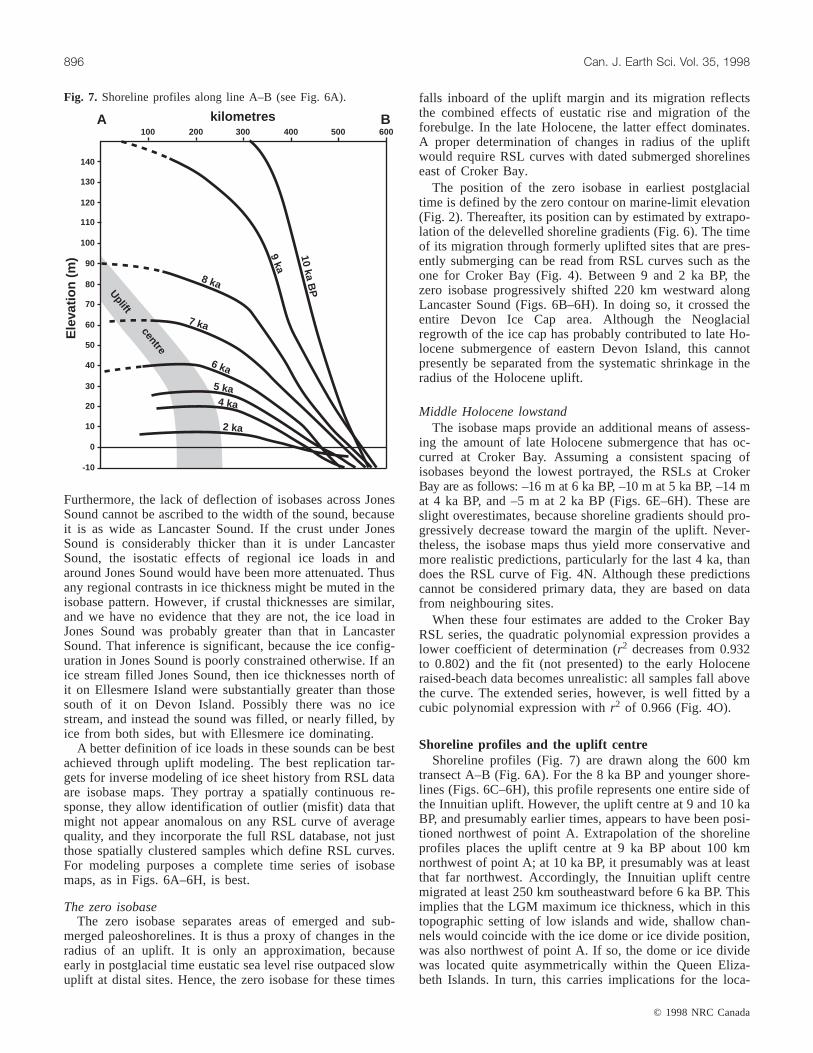
Shoreline profiles and the uplift centreShoreline profiles (Fig. 7) are drawn along the 600 km
transect A–B (Fig. 6A). For the 8 ka BP and younger shore-lines (Figs. 6C–6H), this profile represents one entire side ofthe Innuitian uplift. However, the uplift centre at 9 and 10 kaBP, and presumably earlier times, appears to have been posi-tioned northwest of point A. Extrapolation of the shorelineprofiles places the uplift centre at 9 ka BP about 100 kmnorthwest of point A; at 10 ka BP, it presumably was at leastthat far northwest. Accordingly, the Innuitian uplift centremigrated at least 250 km southeastward before 6 ka BP. Thisimplies that the LGM maximum ice thickness, which in thistopographic setting of low islands and wide, shallow chan-nels would coincide with the ice dome or ice divide position,was also northwest of point A. If so, the dome or ice dividewas located quite asymmetrically within the Queen Eliza-beth Islands. In turn, this carries implications for the loca-
© 1998 NRC Canada
896 Can. J. Earth Sci. Vol. 35, 1998
100
140
130
120
110
100
90
80
70
60
50
40
30
20
10
0
-10
200 300 400 500 600A Bkilometres
Ele
vatio
n (m
)
8 ka
7 ka
9 ka
10 ka BP
2 ka
6 ka
5 ka4 ka
Uplift centre
Fig. 7. Shoreline profiles along line A–B (see Fig. 6A).
12I:\cjes\cjes35\cjes-08\E98-034tfh.vpThursday, December 03, 1998 11:31:21 AM
Color profile: DisabledComposite Default screen
tion of the glacial limit along the polar margin of thearchipelago.
The migration of the uplift centre also suggests that thenorthwestern side of the Innuitian Ice Sheet ablated earlierand more rapidly than the southeastern side. An asymmetricablation pattern can be reasonably explained in two ways. Itcould be due to greater vulnerability of the northwesternside to eustatic sea-level rise, because most of that part ofthe ice sheet bed was below sea level. Alternatively or addi-tionally, it could be due to higher snow accumulation on thesoutheastern side. Higher southeastern accumulation wouldsignify Baffin Bay or North Atlantic moisture penetrating tothis area under regional (but not global) glacial maximalconditions.
The emergence of the point 200 km along profile A–B(Fig. 7), the late Holocene uplift centre on Grinnell Penin-sula, proceeded at 5.4 m per century at 8.5 ka, 2.2 m percentury at 7.5 ka, 1.8 m per century at 6.5 ka, 1.25 m percentury at 5.5 ka, 0.75 m per century at 4.5 ka, 0.6 m percentury at 3 ka, 0.45 m per century at 1.5 ka, and 0.35 m percentury at 0.5 ka BP. The current emergence rate is 0.3 mper century. Projecting this declining rate forward linearly,uplift at the centre will continue for another 4 ka and an-other 6.25 m of emergence will occur. This is a slightly min-imal estimate of residual uplift, because, in reality, the rateswill decrease asymptotically. The emergence rates derivedfrom the shoreline profiles are probably more reliable thanthose which might be derived from any of the RSL curves.
Early models of glaciation of the Queen Elizabeth Islandswere based to a large degree on regional uplift patterns.However, the reconstructed uplift patterns have remainedsomewhat fluid as RSL databases have evolved and muchwork remains to accurately characterize the entire uplift. Re-cently, uplift patterns in the Queen Elizabeth Islands havebeen regarded as insufficient evidence of any particular iceload configuration, because nonunique geophysical modelsolutions of the RSL history are possible. For this reason,the Devon Island project attempted to reconstruct LGM iceextent and configuration from primary glacial geological ev-idence. That evidence supports Blake’s (1970) Innuitian IceSheet hypothesis (Dyke 1998). Similar support for this hy-pothesis arises from reinterpretations of the glacial history ofNares Strait (England 1998) and Nansen Sound (Bednarski1998).
The Holocene RSL history of Devon Island encapsulates acomplete radius of the Innuitian Ice Sheet, and hence of theInnuitian uplift. This history is constrained by 154 new ra-diocarbon dates, many of these on driftwood and whalebones from raised beaches. Twelve of the 14 RSL curvesnow available are well described by simple exponentialregression fits. The eastern part of the island has a morecomplex curve incorporating early Holocene emergence, amiddle Holocene lowstand, the best estimate for which is –15 mat Croker Bay, and continuing late Holocene submergence.The zero isobase (roughly the proximal side of the crustalforebulge in the late Holocene) has migrated about 220 kmwestward since 9 ka BP, thus accounting for the eastern sub-mergence. The lack of any detectable century- to millennial-
scale transgressions during general Holocene emergence issignificant and is consistent with other results from the cen-tral and eastern Canadian Arctic, where only equivocal evi-dence of a small transgression at 5 ka has been presented(e.g., Blake 1975; Dyke et al. 1991). This may imply thatthe Holocene transgressions which are well documentedelsewhere in glaciated eastern Canada, such as along the St.Lawrence estuary (Dionne 1988; Dionne and Occhietti1996), have noneustatic origins.
The response times of the curves are similar at the heavilyloaded sites, with half-lives of about 2 ka, but evidently de-crease to about 1 ka near the ice margin. This pattern appar-ently has not been reported previously and runs counter tothe best earlier analysis (Andrews 1970). It needs to betested with further studies and its geophysical implicationsshould be addressed beyond the speculations offered above.
The regional pattern of delevelling involves two major el-ements: a consistent northwestward rise of paleoshorelinesand a strong embayment of isobases over Lancaster Sound.The former is congruent with the Innuitian ice load inferredby Blake (1970). The latter separates the Laurentide andInnuitian uplifts. The straight isobases across Jones Sound,in contrast, signify a greater load there than is otherwise evi-dent from the glacial geology. The centre (or axis) ofInnuitian uplift migrated at least 250 km southeastward be-tween 10 and 6 ka BP, presumably reflecting earlier ablationof the polar flank of the ice sheet. Residual rebound at theuplift centre on Grinnell Peninsula is not much more than6.25 m, which will be mostly accomplished in the next 4 ka.
Field surveys in 1993, 1994, and 1997 were supported bythe Polar Continental Shelf Project of Natural ResourcesCanada. C. Miller and M. Dance assisted in the field in 1993and 1994, respectively. J. England and C. O’Cofaigh (Uni-versity of Alberta) joined me in a two-day survey of marine-limit deltas in 1997. Analytical support was provided by theradiocarbon laboratories of the Geological Survey of Canada(GSC) (R. McNeely), Saskatchewan Research Council (J.Zimmer), and University of Toronto (R. Beukens). R.B. Tay-lor (GSC Atlantic) contributed unpublished radiocarbondates from Radstock Bay and comments on an early draft. Ialso appreciate informal reviews by Tom James (GSC Pa-cific), D.A. Hodgson and W. Blake, Jr. (GSC Ottawa), and J.Bednarski (GSC Calgary) along with the helpful formal re-views by J. Shaw (GSC Atlantic) and J. England.
Allard, M., and Tremblay, G. 1983. La dynamique littorale des îlesManitounuk durant l’Holocène. Zeitschrift fur Geomorphologie,Supplement-Band,47: 61–95.
Andrews, J.T. 1970. A geomorphological study of postglacial upliftwith particular reference to Arctic Canada. Institute of BritishGeographers, Special Publication 2.
Andrews, J.T., and Peltier, W.R. 1989. Quaternary geodynamics inCanada. In Quaternary geology of Canada and Greenland.Edited byR.J. Fulton. Geological Survey of Canada, Geology ofCanada, No. 1.
Barr, W. 1971. Postglacial isostatic movements in northeasternDevon Island: a reappraisal. Arctic,24: 249–268.
© 1998 NRC Canada
Dyke 897
13I:\cjes\cjes35\cjes-08\E98-034tfh.vpThursday, December 03, 1998 11:31:22 AM
Color profile: DisabledComposite Default screen
© 1998 NRC Canada
898 Can. J. Earth Sci. Vol. 35, 1998
Bednarski, J.M. 1998. Quaternary history of Axel Heiberg Island,bordering Nansen Sound, Northwest Territories, emphasizingthe last glacial maximum. Canadian Journal of Earth Sciences,35: 520–533.
Blake, W., Jr. 1970. Studies of glacial history in Arctic Canada I:pumice, radiocarbon dates, and differential postglacial uplift inthe eastern Queen Elizabeth Islands. Canadian Journal of EarthSciences,7: 634–664.
Blake, W., Jr. 1975. Radiocarbon age determinations andpostglacial emergence at Cape Storm, southern Ellesmere Is-land. Geografiska Annaler, Series A,57: 1–71.
Blake, W., Jr. 1987. Geological Survey of Canada radiocarbondates XXVI. Geological Survey of Canada, Paper 86-7.
Blake, W., Jr. 1988. Geological Survey of Canada radiocarbondates XXVII. Geological Survey of Canada, Paper 87-7.
Blake, W., Jr. 1993. Holocene emergence along the Ellesmere Is-land coasts of northernmost Baffin Bay. Norsk GeologiskTidsskrift, 73: 147–160.
Boulton, G.S. 1979. A model of Weichselian glacier variation inthe North Atlantic regions. Boreas,8: 373–395.
Dionne, J-C. 1988. Holocene relative sea-level fluctuations in theSt. Lawrence estuary, Québec, Canada. Quaternary Research,29: 233–244.
Dionne, J-C., and Occhietti, S. 1996. Aperçu du Quaternaire àl’embouchure du Saguenay, Québec. Géographie physique etQuaternaire,50: 5–34.
Dyke, A.S. 1979. Radiocarbon-dated Holocene emergence ofSomerset Island.In Current research, part B. Geological Surveyof Canada, Paper 79-1B, pp. 307–318.
Dyke, A.S. 1983. Quaternary geology of Somerset Island, centralCanadian Arctic. Geological Survey of Canada, Memoir 403.
Dyke, A.S. 1993. Glacial and sea level history of Lowther andGriffith islands, Northwest Territories: a hint of tectonics.Géographie physique et Quaternaire,47: 133–146.
Dyke, A.S. 1996. Preliminary paleogeographic maps of glaciatedNorth America. Geological Survey of Canada, Open File 3296.
Dyke, A.S. 1998. Last glacial maximum and deglaciation of DevonIsland, Arctic Canada: support for an Innuitian Ice Sheet. Qua-ternary Science Reviews. In press.
Dyke, A.S., and Prest, V.K. 1987. Late Wisconsinan and Holocenehistory of the Laurentide Ice Sheet. Géographie physique etQuaternaire,41: 237–263.
Dyke, A.S., Morris, T.F., and Green, D.E.C. 1991. Postglacial tec-tonic and sea level history of the central Canadian Arctic. Geo-logical Survey of Canada, Bulletin 397.
Dyke, A.S., McNeely, R.N., and Hooper, J. 1996. Marine reservoircorrections for bowhead whale radiocarbon age determinations.Canadian Journal of Earth Sciences,33: 1628–1637.
England, J. 1976a. Late Quaternary glaciation of the eastern QueenElizabeth Islands, northwest Territories, Canada: alternativemodels. Quaternary Research,6: 185–202.
England, J. 1976b. Postglacial isobases and uplift curves from theCanadian and Greenland High Arctic. Arctic and Alpine Re-search,8: 61–78.
England, J. 1987. Glaciation and the evolution of the Canadianhigh arctic landscape. Geology,15: 419–424.
England, J. 1997. Unusual rates and patterns of Holocene emer-gence, Ellesmere Island, Arctic Canada. Journal of the Geologi-cal Society, London,154: 781–792.
England, J. 1998. Coalescent Greenland and Innuitian ice duringthe last glacial maximum: revising the Quaternary of the Cana-dian High Arctic. Quaternary Science Reviews. In press.
England, J., Sharp, M., Lemmen, D.S., and Bednarski, J. 1991. Onthe extent and thickness of the Innuitian Ice Sheet: a postglacial-
adjustment approach: Discussion. Canadian Journal of EarthSciences,28: 1689–1695.
Fairbanks, R.G. 1989. A 17 000-year glacio-eustatic sea level re-cord: influence of glacial melting rates on the Younger Dryasevent and deep-ocean circulation. Nature (London),342: 637–642.
Fisher, D.A. 1979. Comparison of 105 years of oxygen isotope andinsoluble impurity profiles from the Devon Island and CampCentury ice cores. Quaternary Research,11: 299–305.
Glushankova, N.I., Parunin, O.B., Timashkova, T.A., Khait, V.Z.,and Shlukov, A.I. 1980. Moscow MV Lomonosov State Univer-sity radiocarbon dates I. Radiocarbon,22: 82–90.
Grosswald, M.G. 1983. Ice sheets on the continental shelves.InResults of researches on the international geophysical projects.Nauka, Moscow. (In Russian.)
Helmer, J.W. 1991. The paleo-eskimo prehistory of the northDevon lowlands. Arctic,44: 301–317.
Hooper, J.G. 1996. Glacial history and Holocene sea level regres-sion in the Foxe/Baffin sector of the Laurentide ice sheet, north-west Baffin Island, Arctic Canada. Ph.D. thesis, University ofAlberta, Edmonton.
King, R.H. 1970. An evaluation of postglacial isostatic rebound onDevon Island, Canadian Arctic Archipelago. Swansea Geogra-pher,8: 61–67.
King, R.H. 1991. Paleolimnology of a polar oasis, Truelove Low-land, Devon Island, N.W.T., Canada. Hydrobiologia,214: 317–325.
Klassen, R.A. 1993. Quaternary geology and glacial history ofBylot Island, Northwest Territories. Geological Survey of Can-ada, Memoir 429.
Lowdon, J.A., and Blake, W., Jr. 1975. Geological Survey of Can-ada radiocarbon dates XV. Geological Survey of Canada, Paper75-7.
Lowdon, J.A., Robertson, I.M., and Blake, W., Jr. 1971. GeologicalSurvey of Canada radiocarbon dates XI. Geological Survey ofCanada, Paper 71-7.
McCartney, P.H., and Helmer, J.W. 1989. Marine and terrestrialmammals in high arctic Paleoeskimo economy.Archaeozoologia,III/1, 2 : 143–159.
McCuaig, S.J. 1994. Glacial chronology of the south Bylot andSalmon River lowlands, N.W.T., using erratic dispersal patterns,cosmogenic dating, radiocarbon dating and lichenometry. M.Sc.thesis, Carleton University, Ottawa.
McGhee, R. 1976. Paleoeskimo occupations of central and higharctic Canada.In Eastern arctic prehistory: paleoeskimo prob-lems.Edited byM.S. Maxwell. Society for American Archaeol-ogy, Memoir 31, pp. 15–39.
McNeely, R. 1989. Geological Survey of Canada radiocarbon datesXXVIII. Geological Survey of Canada, Paper 88-7.
Müller, F., and Barr, W. 1966. Postglacial isostatic movement innortheastern Devon Island, Canadian Arctic Archipelago. Arc-tic, 19: 263–269.
Park, R.W. 1989. Porden Point: an intrasite approach to settlementsystem analysis. Ph.D. thesis, University of Alberta, Edmonton.
Stuiver, M., and Reimer, P.J. 1993. Extended14C data base and re-vised CALIB 3.0 radiocarbon age calibration program. Radio-carbon,35: 215–230.
Tushingham, A.M. 1991. On the extent and thickness of theInnuitian Ice Sheet: a postglacial-adjustment approach. Cana-dian Journal of Earth Sciences,28: 231–239.
Tushingham, A.M., and Peltier, W.R. 1991. Ice-3G: a new globalmodel of late Pleistocene deglaciation based on geophysical pre-dictions of post-glacial relative sea level change. Journal ofGeophysical Research, B,96: 4497–4523.
14I:\cjes\cjes35\cjes-08\E98-034tfh.vpThursday, December 03, 1998 11:31:23 AM
Color profile: DisabledComposite Default screen
Walcott, R.I. 1970. Isostatic response to loading of the crust inCanada. Canadian Journal of Earth Sciences,7: 716–726.
Walcott, R.I. 1972. Late Quaternary vertical movements in easternNorth America: quantitative evidence of glacio-isostatic re-bound. Reviews of Geophysics and Space Physics,10: 849–884.
Washburn, A.L. 1947. Reconnaissance geology of portions of Vic-toria Island and adjacent regions. Geological Society of Amer-ica, Memoir 22.
Washburn, A.L., and Stuiver, M. 1985. Radiocarbon dates fromCornwallis Island area, Arctic Canada—an interim report. Cana-dian Journal of Earth Sciences,22: 630–636.
Wickenden, R.T.D. 1947. Pleistocene glacial deposits.In Geologyand economic minerals of Canada. 3rd ed. Geological Survey ofCanada, Ottawa, pp. 325–346.
© 1998 NRC Canada
Dyke 899
RSL (m)
Lab. No. Material dated and context Min. Max. Age (ka, ±SE) Lat. N Long. W δ13C (‰)
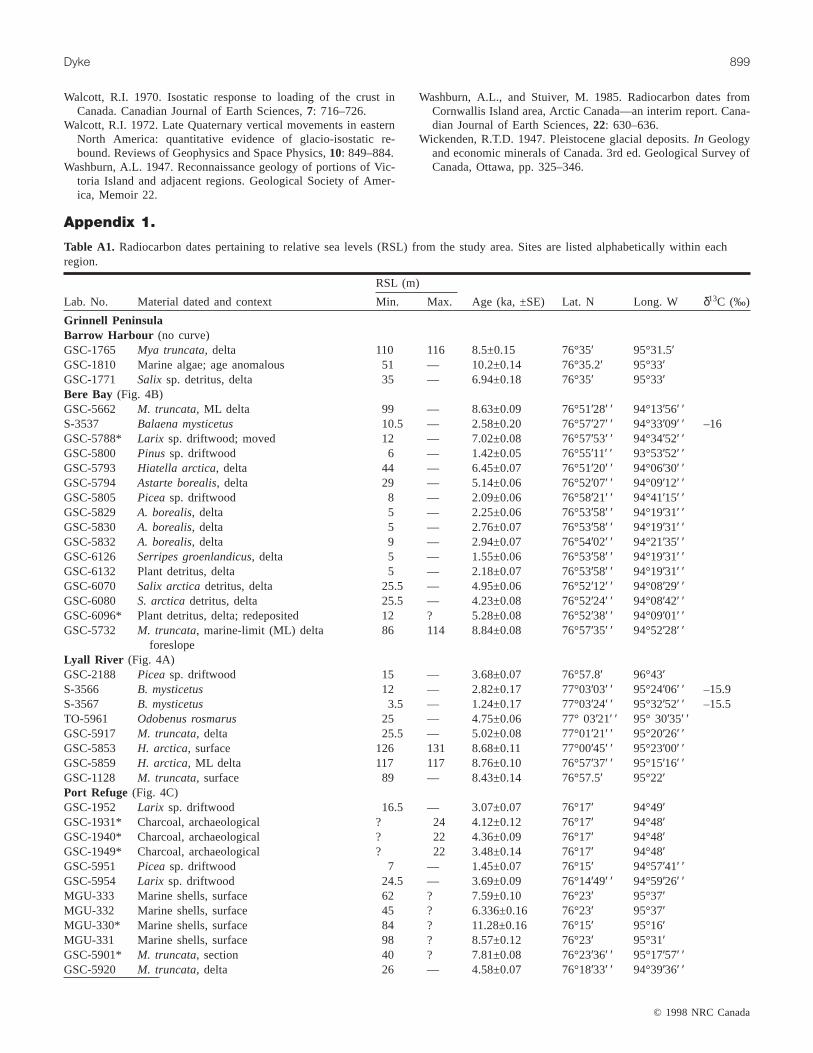
Grinnell PeninsulaBarrow Harbour (no curve)GSC-1765 Mya truncata, delta 110 116 8.5±0.15 76°35′ 95°31.5′GSC-1810 Marine algae; age anomalous 51 — 10.2±0.14 76°35.2′ 95°33′GSC-1771 Salix sp. detritus, delta 35 — 6.94±0.18 76°35′ 95°33′Bere Bay (Fig. 4B)GSC-5662 M. truncata, ML delta 99 — 8.63±0.09 76°51′28′ ′ 94°13′56′ ′S-3537 Balaena mysticetus 10.5 — 2.58±0.20 76°57′27′ ′ 94°33′09′ ′ –16GSC-5788* Larix sp. driftwood; moved 12 — 7.02±0.08 76°57′53′ ′ 94°34′52′ ′GSC-5800 Pinus sp. driftwood 6 — 1.42±0.05 76°55′11′ ′ 93°53′52′ ′GSC-5793 Hiatella arctica, delta 44 — 6.45±0.07 76°51′20′ ′ 94°06′30′ ′GSC-5794 Astarte borealis, delta 29 — 5.14±0.06 76°52′07′ ′ 94°09′12′ ′GSC-5805 Picea sp. driftwood 8 — 2.09±0.06 76°58′21′ ′ 94°41′15′ ′GSC-5829 A. borealis, delta 5 — 2.25±0.06 76°53′58′ ′ 94°19′31′ ′GSC-5830 A. borealis, delta 5 — 2.76±0.07 76°53′58′ ′ 94°19′31′ ′GSC-5832 A. borealis, delta 9 — 2.94±0.07 76°54′02′ ′ 94°21′35′ ′GSC-6126 Serripes groenlandicus, delta 5 — 1.55±0.06 76°53′58′ ′ 94°19′31′ ′GSC-6132 Plant detritus, delta 5 — 2.18±0.07 76°53′58′ ′ 94°19′31′ ′GSC-6070 Salix arcticadetritus, delta 25.5 — 4.95±0.06 76°52′12′ ′ 94°08′29′ ′GSC-6080 S. arcticadetritus, delta 25.5 — 4.23±0.08 76°52′24′ ′ 94°08′42′ ′GSC-6096* Plant detritus, delta; redeposited 12 ? 5.28±0.08 76°52′38′ ′ 94°09′01′ ′GSC-5732 M. truncata, marine-limit (ML) delta
foreslope86 114 8.84±0.08 76°57′35′ ′ 94°52′28′ ′
Lyall River (Fig. 4A)GSC-2188 Picea sp. driftwood 15 — 3.68±0.07 76°57.8′ 96°43′S-3566 B. mysticetus 12 — 2.82±0.17 77°03′03′ ′ 95°24′06′ ′ –15.9S-3567 B. mysticetus 3.5 — 1.24±0.17 77°03′24′ ′ 95°32′52′ ′ –15.5TO-5961 Odobenus rosmarus 25 — 4.75±0.06 77° 03′21′ ′ 95° 30′35′ ′GSC-5917 M. truncata, delta 25.5 — 5.02±0.08 77°01′21′ ′ 95°20′26′ ′GSC-5853 H. arctica, surface 126 131 8.68±0.11 77°00′45′ ′ 95°23′00′ ′GSC-5859 H. arctica, ML delta 117 117 8.76±0.10 76°57′37′ ′ 95°15′16′ ′GSC-1128 M. truncata, surface 89 — 8.43±0.14 76°57.5′ 95°22′Port Refuge (Fig. 4C)GSC-1952 Larix sp. driftwood 16.5 — 3.07±0.07 76°17′ 94°49′GSC-1931* Charcoal, archaeological ? 24 4.12±0.12 76°17′ 94°48′GSC-1940* Charcoal, archaeological ? 22 4.36±0.09 76°17′ 94°48′GSC-1949* Charcoal, archaeological ? 22 3.48±0.14 76°17′ 94°48′GSC-5951 Picea sp. driftwood 7 — 1.45±0.07 76°15′ 94°57′41′ ′GSC-5954 Larix sp. driftwood 24.5 — 3.69±0.09 76°14′49′ ′ 94°59′26′ ′MGU-333 Marine shells, surface 62 ? 7.59±0.10 76°23′ 95°37′MGU-332 Marine shells, surface 45 ? 6.336±0.16 76°23′ 95°37′MGU-330* Marine shells, surface 84 ? 11.28±0.16 76°15′ 95°16′MGU-331 Marine shells, surface 98 ? 8.57±0.12 76°23′ 95°31′GSC-5901* M. truncata, section 40 ? 7.81±0.08 76°23′36′ ′ 95°17′57′ ′GSC-5920 M. truncata, delta 26 — 4.58±0.07 76°18′33′ ′ 94°39′36′ ′
Table A1. Radiocarbon dates pertaining to relative sea levels (RSL) from the study area. Sites are listed alphabetically within eachregion.
15I:\cjes\cjes35\cjes-08\E98-034tfh.vpThursday, December 03, 1998 11:31:24 AM
Color profile: DisabledComposite Default screen
© 1998 NRC Canada
900 Can. J. Earth Sci. Vol. 35, 1998
RSL (m)
Lab. No. Material dated and context Min. Max. Age (ka, ±SE) Lat. N Long. W δ13C (‰)
GSC-1766* Larix sp. driftwood; moved 21 — 2.96±0.13 76°14.5′ 95°19′GSC-5850 M. truncata, ML delta 91 91 8.2±0.09 76°22′33′ ′ 94°55′22′ ′S-3564 B. mysticetus 16.5 — 3.18±0.15 76°16′48′ ′ 94°49′20′ ′ –16.2S-1660* Seal bone, archaeological ? 24 4.45±0.06 76°19′ 94°38′S-1661* Seal bone, archaeological ? 24 3.43±0.06 76°19′ 94°38′S-1662* Seal bone, archaeological ? 24 3.79±0.06 76°19′ 94°38′S-1689* Seal bone, archaeological ? 24 2.07±0.05 76°19′ 94°38′Prince Alfred Bay (Fig. 4D)GSC-5816 Picea sp. driftwood 2.5 — 0.69±0.05 76°21′32′ ′ 93°04′46′ ′S-3536 B. mysticetus 3 — 0.93±0.15 76°17′22′ ′ 93°47′36′ ′ –15.5S-3559 B. mysticetus 3 — 1.29±0.14 76°19′54′ ′ 93°27′09′ ′ –15.2S-1422* Sphagnum, archaeological ? 4 1.00±0.11 76°15′ 92°40′S-1423* B. mysticetus, archaeological ? 4 1.34±0.07 76°15′ 92°40′S-1424* Seal bone, archaeological ? 4 1.31±0.07 76°15′ 92°40′S-1420* Twigs, moss, leaves, archaeological ? 4 0.55±0.07 76°15′ 92°40′S-1421* Twigs, moss, leaves, archaeological ? 4 1.38±0.09 76°15′ 92°40′S-3535 B. mysticetus 4.25 — 1.06±0.14 76°17′04′ ′ 94°17′54′ ′ –14.7GSC-5814 Pinus sp. driftwood 5.5 — 1.56±0.06 76°15′57′ ′ 93°43′02′ ′GSC-5808 Picea sp. driftwood 7 — 1.92±0.06 76°17′31′ ′ 93°47′38′ ′S-3534 B. mysticetus 8 — 1.93±0.17 76°19′20′ ′ 93°43′54′ ′ –13.8GSC-5846 Picea sp. driftwood 8 — 1.85±0.06 76°17′31′ ′ 93°47′38′ ′GSC-5812 Pinus sp. driftwood 9 — 2.06±0.06 76°22′10′ ′ 93°16′09′ ′GSC-5811 Picea sp. driftwood 11.75 — 2.25±0.06 76°22′23′ ′ 93°12′41′ ′S-3533 B. mysticetus 13 — 2.66±0.15 76°19′13′ ′ 93°45′23′ ′ –14.9GSC-5847 Larix sp. driftwood 13.25 — 2.28±0.06 76°22′22′ ′ 93°13′55′ ′S-3556 B. mysticetus 14.25 — 3.08±0.15 76°21′51′ ′ 93°04′10′ ′ –14.5GSC-5817* Larix sp. driftwood; moved ? ? 1.94±0.07 76°24′15′ ′ 93°35′22′ ′GSC-5786 Larix sp. driftwood 17.5 — 3.74±0.06 76°21′30′ ′ 93°23′38′ ′S-3532 B. mysticetus 18 — 3.8±0.15 76°19′35′ ′ 93°43′10′ ′ –15.2GSC-5782 Larix sp. driftwood 20 — 3.8±0.08 76°22′35′ ′ 93°15′55′ ′TO-5063* O. rosmarus; crawler? ? ? 3.48±0.06 76° 17′34′ ′ 93° 48′49′ ′GSC-5778 Larix sp. driftwood 25 — 4.45±0.06 76°18′12′ ′ 93°48′49′ ′GSC-1699* Larix sp. driftwood; moved ? ? 4.41±0.15 76°15.5′ 93°38′GSC-6165 M. truncata, delta 29 ? 5.5±0.07 76° 22′42′ ′ 93° 39′56′ ′GSC-5698 A. borealis, ML delta 80 80 8.31±0.11 76°27′18′ ′ 93°41′49′ ′GSC-5653 M. truncata, glaciomarine sediment in front
of ML delta86 95 8.55±0.07 76°19′59′ ′ 93°53′49′ ′
Wilmer Bay (no curve)GSC-5739 H. arctica, glaciomarine sediment in front
of ML terrace90 101 8.61±0.08 76°45′55′ ′ 93°32′42′ ′
GSC-5824 A. borealis, delta 55 — 7.38±0.08 76°46′09′ ′ 93°27′43′ ′GSC-5827 A. borealis, delta 9 — 3.76±0.10 76°49′02′ ′ 93°27′24′ ′GSC-5818 Picea sp. driftwood 4 — 1.12±0.10 76°49′17′ ′ 93°28′12′ ′
Hell Gate regionNorth Kent Island (no curve)GSC-5881 M. truncata, surface 80 ? 7.58±0.10 76°46′01′ ′ 90°29′18′ ′GSC-907 M. truncata, H. arctica, surface; blended
age?— ? 9.78±0.20 76°49′ 90°13′
Southwest Ellesmere Island(no curve)GSC-858 H. arctica, surface near ML 120 — 8.72±0.11 76° 28′ 88° 18′GSC-5870 H. arctica, surface 51 ? 7.19±0.07 76° 57′06′ ′ 88° 48′06′GSC-5899 M. truncata, surface 98 ? 7.81±0.21 76° 56′32′ ′ 88° 58′21′ ′Triton Bay (Fig. 4E)GSC-5856 H. arctica, glaciomarine sediment near ML 100 110 8.44±0.09 76°32′29′ ′ 92°24′33′ ′S-3568 B. mysticetus 7 — 2.11±0.20 76°36′56′ ′ 92°32′11′ ′ –15.6GSC-5952 Picea sp. driftwood 7.25 — 1.76±0.07 76°35′56′ ′ 92°19′31′ ′
Table A1 (continued).
16I:\cjes\cjes35\cjes-08\E98-034tfh.vpThursday, December 03, 1998 11:31:26 AM
Color profile: DisabledComposite Default screen
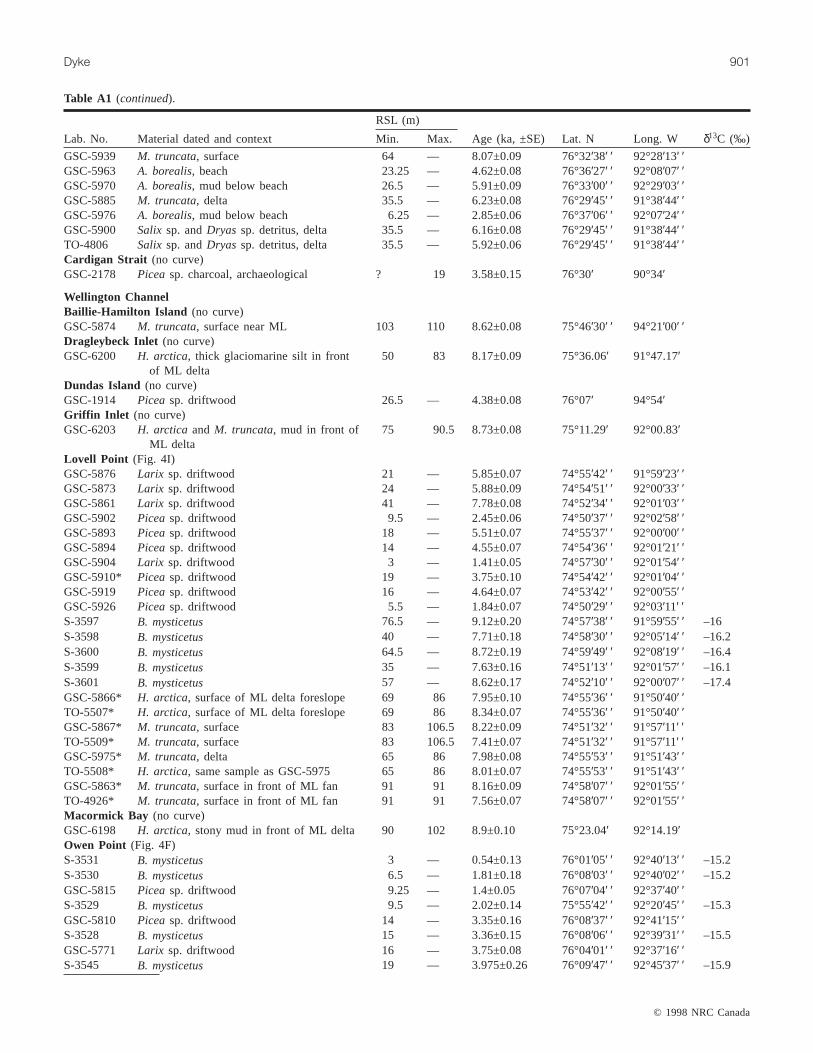
© 1998 NRC Canada
Dyke 901
RSL (m)
Lab. No. Material dated and context Min. Max. Age (ka, ±SE) Lat. N Long. W δ13C (‰)
GSC-5939 M. truncata, surface 64 — 8.07±0.09 76°32′38′ ′ 92°28′13′ ′GSC-5963 A. borealis, beach 23.25 — 4.62±0.08 76°36′27′ ′ 92°08′07′ ′GSC-5970 A. borealis, mud below beach 26.5 — 5.91±0.09 76°33′00′ ′ 92°29′03′ ′GSC-5885 M. truncata, delta 35.5 — 6.23±0.08 76°29′45′ ′ 91°38′44′ ′GSC-5976 A. borealis, mud below beach 6.25 — 2.85±0.06 76°37′06′ ′ 92°07′24′ ′GSC-5900 Salix sp. andDryas sp. detritus, delta 35.5 — 6.16±0.08 76°29′45′ ′ 91°38′44′ ′TO-4806 Salix sp. andDryas sp. detritus, delta 35.5 — 5.92±0.06 76°29′45′ ′ 91°38′44′ ′Cardigan Strait (no curve)GSC-2178 Picea sp. charcoal, archaeological ? 19 3.58±0.15 76°30′ 90°34′
Wellington ChannelBaillie-Hamilton Island (no curve)GSC-5874 M. truncata, surface near ML 103 110 8.62±0.08 75°46′30′ ′ 94°21′00′ ′Dragleybeck Inlet (no curve)GSC-6200 H. arctica, thick glaciomarine silt in front
of ML delta50 83 8.17±0.09 75°36.06′ 91°47.17′
Dundas Island (no curve)GSC-1914 Picea sp. driftwood 26.5 — 4.38±0.08 76°07′ 94°54′Griffin Inlet (no curve)GSC-6203 H. arctica and M. truncata, mud in front of
ML delta75 90.5 8.73±0.08 75°11.29′ 92°00.83′
Lovell Point (Fig. 4I)GSC-5876 Larix sp. driftwood 21 — 5.85±0.07 74°55′42′ ′ 91°59′23′ ′GSC-5873 Larix sp. driftwood 24 — 5.88±0.09 74°54′51′ ′ 92°00′33′ ′GSC-5861 Larix sp. driftwood 41 — 7.78±0.08 74°52′34′ ′ 92°01′03′ ′GSC-5902 Picea sp. driftwood 9.5 — 2.45±0.06 74°50′37′ ′ 92°02′58′ ′GSC-5893 Picea sp. driftwood 18 — 5.51±0.07 74°55′37′ ′ 92°00′00′ ′GSC-5894 Picea sp. driftwood 14 — 4.55±0.07 74°54′36′ ′ 92°01′21′ ′GSC-5904 Larix sp. driftwood 3 — 1.41±0.05 74°57′30′ ′ 92°01′54′ ′GSC-5910* Picea sp. driftwood 19 — 3.75±0.10 74°54′42′ ′ 92°01′04′ ′GSC-5919 Picea sp. driftwood 16 — 4.64±0.07 74°53′42′ ′ 92°00′55′ ′GSC-5926 Picea sp. driftwood 5.5 — 1.84±0.07 74°50′29′ ′ 92°03′11′ ′S-3597 B. mysticetus 76.5 — 9.12±0.20 74°57′38′ ′ 91°59′55′ ′ –16S-3598 B. mysticetus 40 — 7.71±0.18 74°58′30′ ′ 92°05′14′ ′ –16.2S-3600 B. mysticetus 64.5 — 8.72±0.19 74°59′49′ ′ 92°08′19′ ′ –16.4S-3599 B. mysticetus 35 — 7.63±0.16 74°51′13′ ′ 92°01′57′ ′ –16.1S-3601 B. mysticetus 57 — 8.62±0.17 74°52′10′ ′ 92°00′07′ ′ –17.4GSC-5866* H. arctica, surface of ML delta foreslope 69 86 7.95±0.10 74°55′36′ ′ 91°50′40′ ′TO-5507* H. arctica, surface of ML delta foreslope 69 86 8.34±0.07 74°55′36′ ′ 91°50′40′ ′GSC-5867* M. truncata, surface 83 106.5 8.22±0.09 74°51′32′ ′ 91°57′11′ ′TO-5509* M. truncata, surface 83 106.5 7.41±0.07 74°51′32′ ′ 91°57′11′ ′GSC-5975* M. truncata, delta 65 86 7.98±0.08 74°55′53′ ′ 91°51′43′ ′TO-5508* H. arctica, same sample as GSC-5975 65 86 8.01±0.07 74°55′53′ ′ 91°51′43′ ′GSC-5863* M. truncata, surface in front of ML fan 91 91 8.16±0.09 74°58′07′ ′ 92°01′55′ ′TO-4926* M. truncata, surface in front of ML fan 91 91 7.56±0.07 74°58′07′ ′ 92°01′55′ ′Macormick Bay (no curve)GSC-6198 H. arctica, stony mud in front of ML delta 90 102 8.9±0.10 75°23.04′ 92°14.19′Owen Point (Fig. 4F)S-3531 B. mysticetus 3 — 0.54±0.13 76°01′05′ ′ 92°40′13′ ′ –15.2S-3530 B. mysticetus 6.5 — 1.81±0.18 76°08′03′ ′ 92°40′02′ ′ –15.2GSC-5815 Picea sp. driftwood 9.25 — 1.4±0.05 76°07′04′ ′ 92°37′40′ ′S-3529 B. mysticetus 9.5 — 2.02±0.14 75°55′42′ ′ 92°20′45′ ′ –15.3GSC-5810 Picea sp. driftwood 14 — 3.35±0.16 76°08′37′ ′ 92°41′15′ ′S-3528 B. mysticetus 15 — 3.36±0.15 76°08′06′ ′ 92°39′31′ ′ –15.5GSC-5771 Larix sp. driftwood 16 — 3.75±0.08 76°04′01′ ′ 92°37′16′ ′S-3545 B. mysticetus 19 — 3.975±0.26 76°09′47′ ′ 92°45′37′ ′ –15.9
Table A1 (continued).
17I:\cjes\cjes35\cjes-08\E98-034tfh.vpThursday, December 03, 1998 11:31:27 AM
Color profile: DisabledComposite Default screen
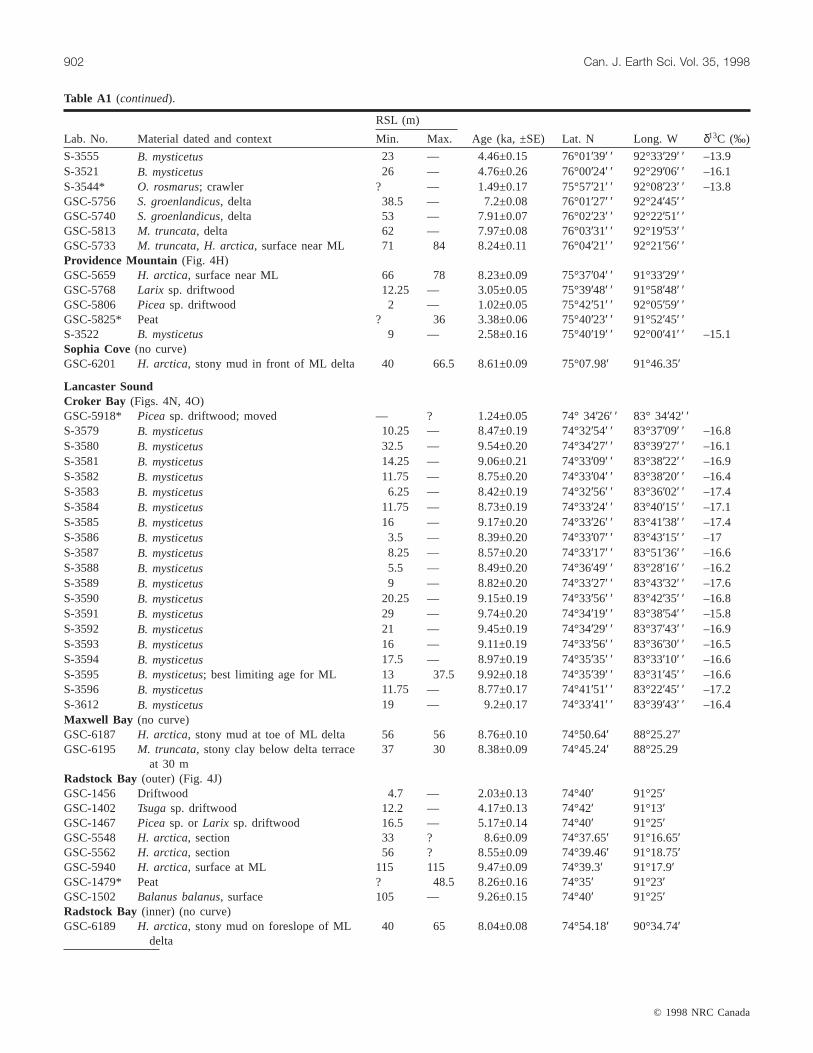
© 1998 NRC Canada
902 Can. J. Earth Sci. Vol. 35, 1998
RSL (m)
Lab. No. Material dated and context Min. Max. Age (ka, ±SE) Lat. N Long. W δ13C (‰)
S-3555 B. mysticetus 23 — 4.46±0.15 76°01′39′ ′ 92°33′29′ ′ –13.9S-3521 B. mysticetus 26 — 4.76±0.26 76°00′24′ ′ 92°29′06′ ′ –16.1S-3544* O. rosmarus; crawler ? — 1.49±0.17 75°57′21′ ′ 92°08′23′ ′ –13.8GSC-5756 S. groenlandicus, delta 38.5 — 7.2±0.08 76°01′27′ ′ 92°24′45′ ′GSC-5740 S. groenlandicus, delta 53 — 7.91±0.07 76°02′23′ ′ 92°22′51′ ′GSC-5813 M. truncata, delta 62 — 7.97±0.08 76°03′31′ ′ 92°19′53′ ′GSC-5733 M. truncata, H. arctica, surface near ML 71 84 8.24±0.11 76°04′21′ ′ 92°21′56′ ′Providence Mountain (Fig. 4H)GSC-5659 H. arctica, surface near ML 66 78 8.23±0.09 75°37′04′ ′ 91°33′29′ ′GSC-5768 Larix sp. driftwood 12.25 — 3.05±0.05 75°39′48′ ′ 91°58′48′ ′GSC-5806 Picea sp. driftwood 2 — 1.02±0.05 75°42′51′ ′ 92°05′59′ ′GSC-5825* Peat ? 36 3.38±0.06 75°40′23′ ′ 91°52′45′ ′S-3522 B. mysticetus 9 — 2.58±0.16 75°40′19′ ′ 92°00′41′ ′ –15.1Sophia Cove(no curve)GSC-6201 H. arctica, stony mud in front of ML delta 40 66.5 8.61±0.09 75°07.98′ 91°46.35′
Lancaster SoundCroker Bay (Figs. 4N, 4O)GSC-5918* Picea sp. driftwood; moved — ? 1.24±0.05 74° 34′26′ ′ 83° 34′42′ ′S-3579 B. mysticetus 10.25 — 8.47±0.19 74°32′54′ ′ 83°37′09′ ′ –16.8S-3580 B. mysticetus 32.5 — 9.54±0.20 74°34′27′ ′ 83°39′27′ ′ –16.1S-3581 B. mysticetus 14.25 — 9.06±0.21 74°33′09′ ′ 83°38′22′ ′ –16.9S-3582 B. mysticetus 11.75 — 8.75±0.20 74°33′04′ ′ 83°38′20′ ′ –16.4S-3583 B. mysticetus 6.25 — 8.42±0.19 74°32′56′ ′ 83°36′02′ ′ –17.4S-3584 B. mysticetus 11.75 — 8.73±0.19 74°33′24′ ′ 83°40′15′ ′ –17.1S-3585 B. mysticetus 16 — 9.17±0.20 74°33′26′ ′ 83°41′38′ ′ –17.4S-3586 B. mysticetus 3.5 — 8.39±0.20 74°33′07′ ′ 83°43′15′ ′ –17S-3587 B. mysticetus 8.25 — 8.57±0.20 74°33′17′ ′ 83°51′36′ ′ –16.6S-3588 B. mysticetus 5.5 — 8.49±0.20 74°36′49′ ′ 83°28′16′ ′ –16.2S-3589 B. mysticetus 9 — 8.82±0.20 74°33′27′ ′ 83°43′32′ ′ –17.6S-3590 B. mysticetus 20.25 — 9.15±0.19 74°33′56′ ′ 83°42′35′ ′ –16.8S-3591 B. mysticetus 29 — 9.74±0.20 74°34′19′ ′ 83°38′54′ ′ –15.8S-3592 B. mysticetus 21 — 9.45±0.19 74°34′29′ ′ 83°37′43′ ′ –16.9S-3593 B. mysticetus 16 — 9.11±0.19 74°33′56′ ′ 83°36′30′ ′ –16.5S-3594 B. mysticetus 17.5 — 8.97±0.19 74°35′35′ ′ 83°33′10′ ′ –16.6S-3595 B. mysticetus; best limiting age for ML 13 37.5 9.92±0.18 74°35′39′ ′ 83°31′45′ ′ –16.6S-3596 B. mysticetus 11.75 — 8.77±0.17 74°41′51′ ′ 83°22′45′ ′ –17.2S-3612 B. mysticetus 19 — 9.2±0.17 74°33′41′ ′ 83°39′43′ ′ –16.4Maxwell Bay (no curve)GSC-6187 H. arctica, stony mud at toe of ML delta 56 56 8.76±0.10 74°50.64′ 88°25.27′GSC-6195 M. truncata, stony clay below delta terrace
at 30 m37 30 8.38±0.09 74°45.24′ 88°25.29
Radstock Bay (outer) (Fig. 4J)GSC-1456 Driftwood 4.7 — 2.03±0.13 74°40′ 91°25′GSC-1402 Tsugasp. driftwood 12.2 — 4.17±0.13 74°42′ 91°13′GSC-1467 Picea sp. orLarix sp. driftwood 16.5 — 5.17±0.14 74°40′ 91°25′GSC-5548 H. arctica, section 33 ? 8.6±0.09 74°37.65′ 91°16.65′GSC-5562 H. arctica, section 56 ? 8.55±0.09 74°39.46′ 91°18.75′GSC-5940 H. arctica, surface at ML 115 115 9.47±0.09 74°39.3′ 91°17.9′GSC-1479* Peat ? 48.5 8.26±0.16 74°35′ 91°23′GSC-1502 Balanus balanus, surface 105 — 9.26±0.15 74°40′ 91°25′Radstock Bay (inner) (no curve)GSC-6189 H. arctica, stony mud on foreslope of ML
delta40 65 8.04±0.08 74°54.18′ 90°34.74′
Table A1 (continued).
18I:\cjes\cjes35\cjes-08\E98-034tfh.vpThursday, December 03, 1998 11:31:29 AM
Color profile: DisabledComposite Default screen
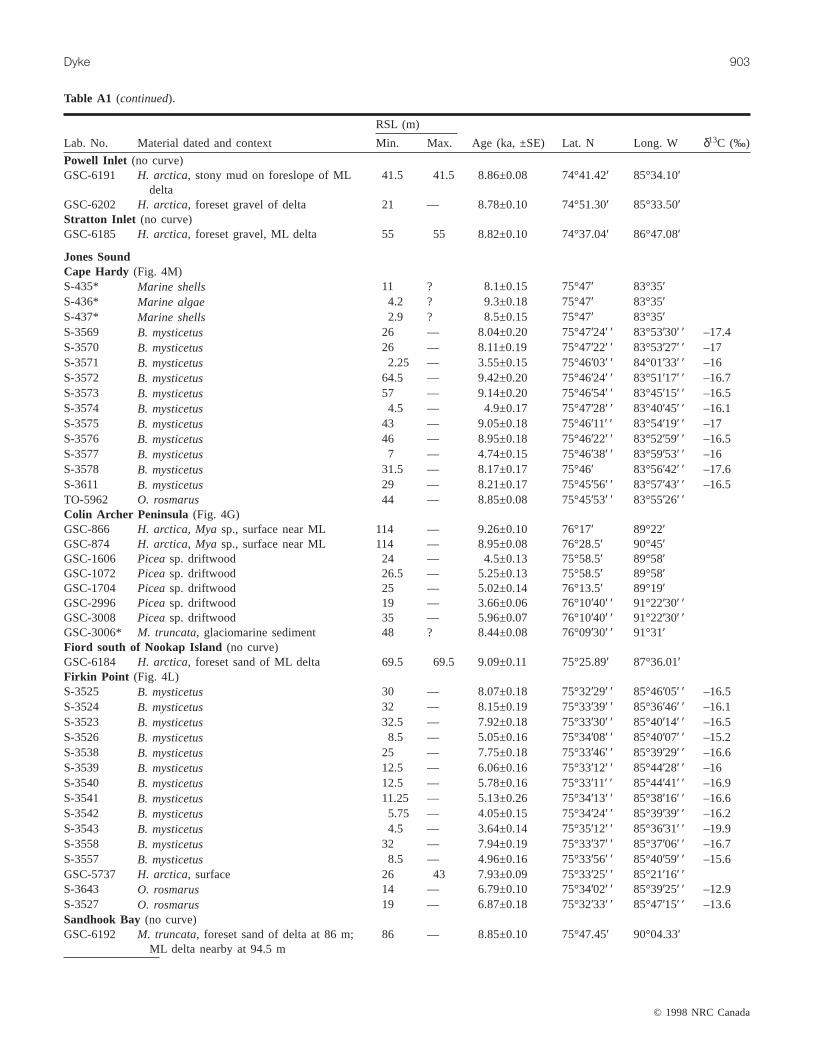
© 1998 NRC Canada
Dyke 903
RSL (m)
Lab. No. Material dated and context Min. Max. Age (ka, ±SE) Lat. N Long. W δ13C (‰)
Powell Inlet (no curve)GSC-6191 H. arctica, stony mud on foreslope of ML
delta41.5 41.5 8.86±0.08 74°41.42′ 85°34.10′
GSC-6202 H. arctica, foreset gravel of delta 21 — 8.78±0.10 74°51.30′ 85°33.50′Stratton Inlet (no curve)GSC-6185 H. arctica, foreset gravel, ML delta 55 55 8.82±0.10 74°37.04′ 86°47.08′
Jones SoundCape Hardy (Fig. 4M)S-435* Marine shells 11 ? 8.1±0.15 75°47′ 83°35′S-436* Marine algae 4.2 ? 9.3±0.18 75°47′ 83°35′S-437* Marine shells 2.9 ? 8.5±0.15 75°47′ 83°35′S-3569 B. mysticetus 26 — 8.04±0.20 75°47′24′ ′ 83°53′30′ ′ –17.4S-3570 B. mysticetus 26 — 8.11±0.19 75°47′22′ ′ 83°53′27′ ′ –17S-3571 B. mysticetus 2.25 — 3.55±0.15 75°46′03′ ′ 84°01′33′ ′ –16S-3572 B. mysticetus 64.5 — 9.42±0.20 75°46′24′ ′ 83°51′17′ ′ –16.7S-3573 B. mysticetus 57 — 9.14±0.20 75°46′54′ ′ 83°45′15′ ′ –16.5S-3574 B. mysticetus 4.5 — 4.9±0.17 75°47′28′ ′ 83°40′45′ ′ –16.1S-3575 B. mysticetus 43 — 9.05±0.18 75°46′11′ ′ 83°54′19′ ′ –17S-3576 B. mysticetus 46 — 8.95±0.18 75°46′22′ ′ 83°52′59′ ′ –16.5S-3577 B. mysticetus 7 — 4.74±0.15 75°46′38′ ′ 83°59′53′ ′ –16S-3578 B. mysticetus 31.5 — 8.17±0.17 75°46′ 83°56′42′ ′ –17.6S-3611 B. mysticetus 29 — 8.21±0.17 75°45′56′ ′ 83°57′43′ ′ –16.5TO-5962 O. rosmarus 44 — 8.85±0.08 75°45′53′ ′ 83°55′26′ ′Colin Archer Peninsula (Fig. 4G)GSC-866 H. arctica, Mya sp., surface near ML 114 — 9.26±0.10 76°17′ 89°22′GSC-874 H. arctica, Mya sp., surface near ML 114 — 8.95±0.08 76°28.5′ 90°45′GSC-1606 Picea sp. driftwood 24 — 4.5±0.13 75°58.5′ 89°58′GSC-1072 Picea sp. driftwood 26.5 — 5.25±0.13 75°58.5′ 89°58′GSC-1704 Picea sp. driftwood 25 — 5.02±0.14 76°13.5′ 89°19′GSC-2996 Picea sp. driftwood 19 — 3.66±0.06 76°10′40′ ′ 91°22′30′ ′GSC-3008 Picea sp. driftwood 35 — 5.96±0.07 76°10′40′ ′ 91°22′30′ ′GSC-3006* M. truncata, glaciomarine sediment 48 ? 8.44±0.08 76°09′30′ ′ 91°31′Fiord south of Nookap Island (no curve)GSC-6184 H. arctica, foreset sand of ML delta 69.5 69.5 9.09±0.11 75°25.89′ 87°36.01′Firkin Point (Fig. 4L)S-3525 B. mysticetus 30 — 8.07±0.18 75°32′29′ ′ 85°46′05′ ′ –16.5S-3524 B. mysticetus 32 — 8.15±0.19 75°33′39′ ′ 85°36′46′ ′ –16.1S-3523 B. mysticetus 32.5 — 7.92±0.18 75°33′30′ ′ 85°40′14′ ′ –16.5S-3526 B. mysticetus 8.5 — 5.05±0.16 75°34′08′ ′ 85°40′07′ ′ –15.2S-3538 B. mysticetus 25 — 7.75±0.18 75°33′46′ ′ 85°39′29′ ′ –16.6S-3539 B. mysticetus 12.5 — 6.06±0.16 75°33′12′ ′ 85°44′28′ ′ –16S-3540 B. mysticetus 12.5 — 5.78±0.16 75°33′11′ ′ 85°44′41′ ′ –16.9S-3541 B. mysticetus 11.25 — 5.13±0.26 75°34′13′ ′ 85°38′16′ ′ –16.6S-3542 B. mysticetus 5.75 — 4.05±0.15 75°34′24′ ′ 85°39′39′ ′ –16.2S-3543 B. mysticetus 4.5 — 3.64±0.14 75°35′12′ ′ 85°36′31′ ′ –19.9S-3558 B. mysticetus 32 — 7.94±0.19 75°33′37′ ′ 85°37′06′ ′ –16.7S-3557 B. mysticetus 8.5 — 4.96±0.16 75°33′56′ ′ 85°40′59′ ′ –15.6GSC-5737 H. arctica, surface 26 43 7.93±0.09 75°33′25′ ′ 85°21′16′ ′S-3643 O. rosmarus 14 — 6.79±0.10 75°34′02′ ′ 85°39′25′ ′ –12.9S-3527 O. rosmarus 19 — 6.87±0.18 75°32′33′ ′ 85°47′15′ ′ –13.6Sandhook Bay (no curve)GSC-6192 M. truncata, foreset sand of delta at 86 m;
ML delta nearby at 94.5 m86 — 8.85±0.10 75°47.45′ 90°04.33′
Table A1 (continued).
19I:\cjes\cjes35\cjes-08\E98-034tfh.vpThursday, December 03, 1998 11:31:30 AM
Color profile: DisabledComposite Default screen
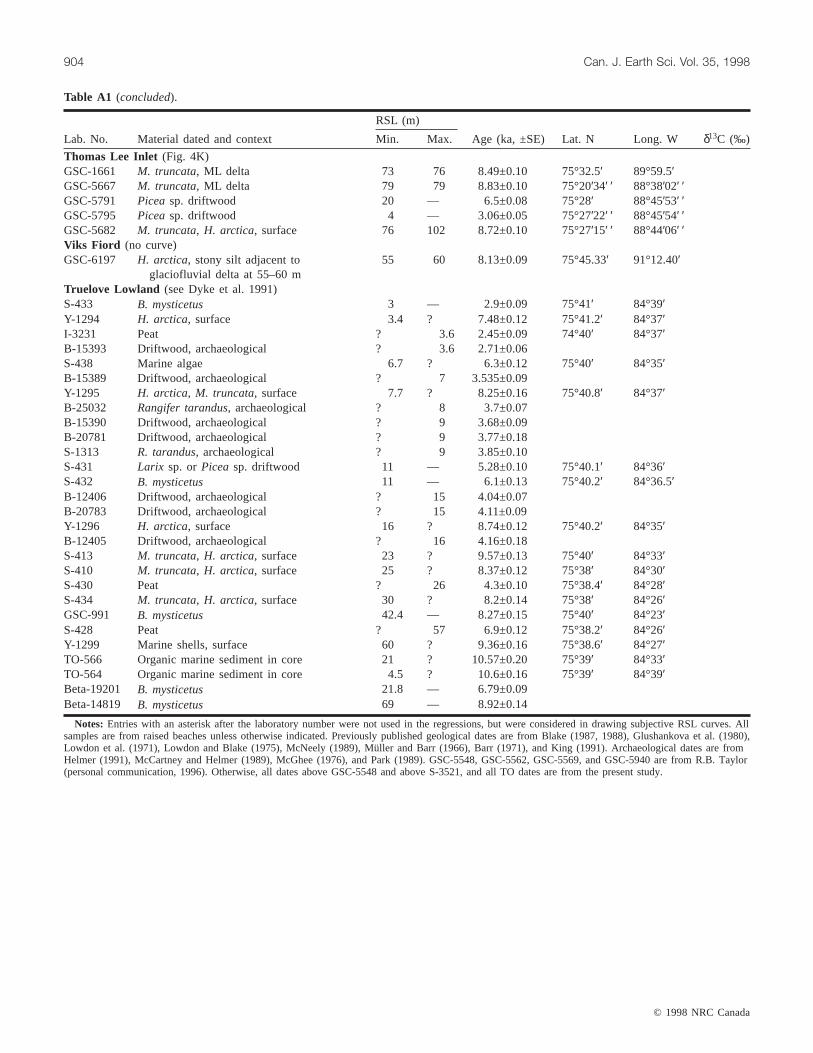
© 1998 NRC Canada
904 Can. J. Earth Sci. Vol. 35, 1998
RSL (m)
Lab. No. Material dated and context Min. Max. Age (ka, ±SE) Lat. N Long. W δ13C (‰)
Thomas Lee Inlet (Fig. 4K)GSC-1661 M. truncata, ML delta 73 76 8.49±0.10 75°32.5′ 89°59.5′GSC-5667 M. truncata, ML delta 79 79 8.83±0.10 75°20′34′ ′ 88°38′02′ ′GSC-5791 Picea sp. driftwood 20 — 6.5±0.08 75°28′ 88°45′53′ ′GSC-5795 Picea sp. driftwood 4 — 3.06±0.05 75°27′22′ ′ 88°45′54′ ′GSC-5682 M. truncata, H. arctica, surface 76 102 8.72±0.10 75°27′15′ ′ 88°44′06′ ′Viks Fiord (no curve)GSC-6197 H. arctica, stony silt adjacent to
glaciofluvial delta at 55–60 m55 60 8.13±0.09 75°45.33′ 91°12.40′
Truelove Lowland (see Dyke et al. 1991)S-433 B. mysticetus 3 — 2.9±0.09 75°41′ 84°39′Y-1294 H. arctica, surface 3.4 ? 7.48±0.12 75°41.2′ 84°37′I-3231 Peat ? 3.6 2.45±0.09 74°40′ 84°37′B-15393 Driftwood, archaeological ? 3.6 2.71±0.06S-438 Marine algae 6.7 ? 6.3±0.12 75°40′ 84°35′B-15389 Driftwood, archaeological ? 7 3.535±0.09Y-1295 H. arctica, M. truncata, surface 7.7 ? 8.25±0.16 75°40.8′ 84°37′B-25032 Rangifer tarandus, archaeological ? 8 3.7±0.07B-15390 Driftwood, archaeological ? 9 3.68±0.09B-20781 Driftwood, archaeological ? 9 3.77±0.18S-1313 R. tarandus, archaeological ? 9 3.85±0.10S-431 Larix sp. orPicea sp. driftwood 11 — 5.28±0.10 75°40.1′ 84°36′S-432 B. mysticetus 11 — 6.1±0.13 75°40.2′ 84°36.5′B-12406 Driftwood, archaeological ? 15 4.04±0.07B-20783 Driftwood, archaeological ? 15 4.11±0.09Y-1296 H. arctica, surface 16 ? 8.74±0.12 75°40.2′ 84°35′B-12405 Driftwood, archaeological ? 16 4.16±0.18S-413 M. truncata, H. arctica, surface 23 ? 9.57±0.13 75°40′ 84°33′S-410 M. truncata, H. arctica, surface 25 ? 8.37±0.12 75°38′ 84°30′S-430 Peat ? 26 4.3±0.10 75°38.4′ 84°28′S-434 M. truncata, H. arctica, surface 30 ? 8.2±0.14 75°38′ 84°26′GSC-991 B. mysticetus 42.4 — 8.27±0.15 75°40′ 84°23′S-428 Peat ? 57 6.9±0.12 75°38.2′ 84°26′Y-1299 Marine shells, surface 60 ? 9.36±0.16 75°38.6′ 84°27′TO-566 Organic marine sediment in core 21 ? 10.57±0.20 75°39′ 84°33′TO-564 Organic marine sediment in core 4.5 ? 10.6±0.16 75°39′ 84°39′Beta-19201 B. mysticetus 21.8 — 6.79±0.09Beta-14819 B. mysticetus 69 — 8.92±0.14
Notes: Entries with an asterisk after the laboratory number were not used in the regressions, but were considered in drawing subjective RSL curves. Allsamples are from raised beaches unless otherwise indicated. Previously published geological dates are from Blake (1987, 1988), Glushankova et al. (1980),Lowdon et al. (1971), Lowdon and Blake (1975), McNeely (1989), Müller and Barr (1966), Barr (1971), and King (1991). Archaeological dates are fromHelmer (1991), McCartney and Helmer (1989), McGhee (1976), and Park (1989). GSC-5548, GSC-5562, GSC-5569, and GSC-5940 are from R.B. Taylor(personal communication, 1996). Otherwise, all dates above GSC-5548 and above S-3521, and all TO dates are from the present study.
Table A1 (concluded).
20I:\cjes\cjes35\cjes-08\E98-034tfh.vpThursday, December 03, 1998 11:31:31 AM
Color profile: DisabledComposite Default screen
Related Documents