IN DEGREE PROJECT TECHNOLOGY, FIRST CYCLE, 15 CREDITS , STOCKHOLM SWEDEN 2020 Holistic KPIs for Sustainability Assessment of Residential Food Systems EMMA SVENSSON HANNA BORGEFELDT KTH ROYAL INSTITUTE OF TECHNOLOGY SCHOOL OF INDUSTRIAL ENGINEERING AND MANAGEMENT

Welcome message from author
This document is posted to help you gain knowledge. Please leave a comment to let me know what you think about it! Share it to your friends and learn new things together.
Transcript

IN DEGREE PROJECT TECHNOLOGY,FIRST CYCLE, 15 CREDITS
, STOCKHOLM SWEDEN 2020
Holistic KPIs for Sustainability Assessment of Residential Food Systems
EMMA SVENSSON
HANNA BORGEFELDT
KTH ROYAL INSTITUTE OF TECHNOLOGYSCHOOL OF INDUSTRIAL ENGINEERING AND MANAGEMENT

1
Abstract Food is one of the strongest influences affecting both human health and the environment. The food sector is responsible for a substantial share of greenhouse gas emissions in the world, and the demand for more sustainable diets has, therefore, increased. The individual is starting to realize one's own possibility to contribute to a more sustainable society, and people are willing to change their habits to become more sustainable. Therefore, the purpose of this study was to create holistic KPIs for sustainable food systems that encourage improvement. The KPIs aim to measure and quantify sustainability from three perspectives: environmental, economic and social sustainability. The methodology used is a framework consisting of five focus areas aiming to create sustainability indicators. The purpose of the five focus areas are to establish vision, indicator framework, indicator selection, stakeholder participation and lastly communication design and strategy. 13 KPIs have been developed, focusing on electricity usage, water usage, GHG emissions, waste management, well-being and expenses. The target group, aimed to use the KPIs, consists of students living in Sweden, making the KPIs adjusted to a student’s lifestyle. The KPIs range from 0-100 %, and a final sustainability ranking is provided through a weighted average of the 13 indicators. The indicators are presented in a radar chart to increase awareness of the students' everyday habits and aim to encourage improvement to increase the sustainability ranking. Keywords: Key performance indicator, KPI, sustainability, food system, health, evaluation.

2
Table of contents 1. Introduction 4
1.1 Background 4
1.2 Purpose 5
1.3 Problem Definition and Hypothesis 5
1.4 Project Boundaries and Delimitations 6
2. Theoretical Framework 7 2.1 Key Performance Indicators 7
2.2 System Dynamics of a Food System 8
2.3 Three Spheres of Sustainability 9
3. Method 9
4. Focus Area 1: Vision 10
5. Focus Area 2: Indicator Framework 11 5.1 Defining Economic Sustainability 11
5.2 Defining Environmental Sustainability 11
5.3 Defining Social Sustainability 12
5.4 Defining the Residential Food System 13
5.5 Evaluating Sustainability and Casualties in the Food System 14
6. Focus Area 3: Indicator Selection 18 6.1 Previous Studies on Selecting Sustainability KPIs 18
6.2 Selecting the KPIs Main Target 20
6.3 Electricity Usage 22
6.4 Water Usage 24
6.5 GHG emissions 24
6.6 Waste Management 25
6.7 Well-being 25
6.8 Expenses 26
6.9 Summary of all Measurements 26
7. Focus Area 4: Stakeholder Participation 27 7.1 Electrolux Interest in Measuring Sustainability 27
7.2 Students’ Interest in Measuring Sustainability 28
8. Focus Area 5: Communication Design and Strategy 29
9. Result 31
10. Discussion 34
11. Conclusion 39
12. References 40
13. Appendix 47

3
List of Figures Figure 1: The model describes the limitations of the food system. ......................................................................... 6 Figure 2: The three spheres of sustainability (Anderson, 2018) ............................................................................. 9 Figure 3: Showing a selection of the inputs and outputs from each system .......................................................... 13 Figure 4: Soft system dynamics of the food system .............................................................................................. 15 Figure 5: Radar chart showing the results of each KPI (Steiniger et.al., 2020) .................................................... 20 Figure 6: Annual consumption for cooking per person per family unit size. (Owen, 2012) ................................. 23 Figure 7: Summary of the results from the survey sent out to the students. ......................................................... 29 Figure 8: A fictional example of the KPIs results presented in a radar chart ........................................................ 33 Figure 9: Shows a scale presenting the individuals final sustainability ranking. .................................................. 34
List of Tables Table 1: Definitions of the four different systems. ................................................................................................ 14 Table 2: The table presents all categories and KPIs selected for the food system. ............................................... 21 Table 3: The table presents all KPIs and the index scale translated to its measuring unit. ................................... 26 Table 4: Presents the colors representing the final sustainability ranking. ........................................................... 31 Table 5: Table shows a summary of all final key performance indicators. ........................................................... 32 Table 6: Table shows a summary of all questions asked to the end user .............................................................. 33

4
1. Introduction
The importance of sustainability is undeniably growing, and actions need to be taken to be able to meet the Paris Agreement and the Sustainable Development Goals adopted by the United Nations (United Nations, n.d.a). Climate change is a crucial issue of today's society, (United Nations, n.d.b) and social movements on saving the planet are seen across the world (Sung, Cooper, Ketler, 2018; Harvard University, 2013). The food sector is responsible for a substantial share of the greenhouse gas emissions affecting climate change (FAO, 2015; Garnett, 2011) and people are starting to realize the importance of their own everyday habits in relation to climate change (Birnbacher, 2015; Strohmeier, Tenenbaum 2019). The interest, awareness and desire to contribute to the sustainability movement has made the demand for sustainable and healthy diets increase (FAO, 2019). Hence, a collaboration between KTH Live-In Lab and Electrolux has been established with the main objective to redesign how the residential food system is viewed in order to make it more sustainable with regards to the economic, environmental and social aspects. This study aims to contribute to the project by defining sustainability within the food system and to create key performance indicators (KPIs) to measure and evaluate sustainability.
1.1 Background
Food is one of the strongest influences to affect both human health and sustainability. The growing world population is challenging the food industry as we know it, and global food production threatens climate change, ecosystems and is the largest driver in environmental degradation (EAT-Lancet, 2019). Therefore, the need for a change of the global food systems is necessary. Food that is aligned with human health is often linked with environmental sustainability, e.g. diets rich in plant-based food improves both health and has environmental benefits. By changing the food habits and thereby food systems, not only do we contribute to a more sustainable world, but also a healthier world (EAT-Lancet, 2019).
In the same pace as sustainability is growing in both popularity and importance for the survival of our planet, so is the need for a way to measure sustainability. Many companies now include sustainability measurements in their annual reporting, and the adoption of sustainability reporting increased by 62 % from 2011 to 2016, solely looking at S&P 500 companies (Siew, 2017). The growing interest for measuring sustainability has led to the creation of several frameworks made to measure and rank corporate social responsibility (CSR) and environmental social governance (ESG) (Fatemi, Glaum, Kaiser, 2018). These frameworks are used by companies internally to improve their sustainability rankings and externally by investors.
However, the need to measure sustainability does not end here. It is of great influence that companies are starting to measure and evaluate sustainability, but it is also of importance that the whole community collectively improve their sustainability ranking; corporate organizations as well as individuals. As for individuals there are several ways to minimize the personal carbon

5
footprint, where one approach is changing the eating habits, e.g. what kind of food to consume, how to cook it and where the food has been imported from. Electrolux, a compliance company with substantial market share, has set high climate objectives (Electrolux, 2020) and is on the forefront of adapting to these new trends and needs in society; with a more demanding client base regarding both a growing need for sustainable cooking methods and healthy food choices, as well as a need for digitalization (Demartini et. al., 2018) and service design in kitchens. Due to their ambition, adaptation to clients' needs and the importance of everyone's partaking, Electrolux initiated a research project together with KTH Live-In Lab on sustainable food systems. KTH Live-In Lab offers several testbeds on KTH campus for a full-scale test environment collecting user data from tenants and students using the buildings (KTH Live-In Lab, 2020). The aim of the project is to define a service development methodology as well as creating a data driven service towards clients, which could lay the basis for strategic service analytics. The authors of this report have created a smaller project as part of their bachelor thesis to create KPIs as a way to measure sustainability in a holistic way. The KPIs will make it possible to quantify sustainability and scale up measurements of sustainability in food systems. The work and the results presented below will hopefully contribute to the larger project between Electrolux and KTH Live-in-Lab and a step towards integrating KPIs into their service.
1.2 Purpose
The purpose of this project is to create holistic KPIs for sustainable food systems adapted to the single student tenants. These KPIs will help measure and quantify sustainability in a holistic way, making it easier to scale up and analyze food systems from three perspectives; economic, environmental and social sustainability. The indicators should be considered as feedback loops for the end user, which might also encourage improvement, and the different aspects contributing to the final sustainability ranking should, therefore, be clearly presented.
1.3 Problem Definition and Hypothesis
The main question at issue is: How can KPIs be created to obtain a holistic measurement of sustainability in a food system adapted for single student tenants?
The expected outcome and hypothesis of this study is to obtain different KPIs for each of the three aspects of sustainability, but with a common index scale. In other words, to present the tenants with results for each aspect affecting the sustainability ranking, and then translating the results into a number on the sustainability scale. The hypothesis is mainly based on the desire to define sustainability in one common grade. It would be efficient and desirable to have these aspects measured and translated into a holistic grade automatically. This project is therefore aiming to find a way to quantify and measure sustainability of residential food system and provide the end user with one sustainability ranking.

6
1.4 Project Boundaries and Delimitations
This study will be based on the lifestyle of single student tenants living in Sweden, and mainly focus on the individual and the kitchen in the residential food system. The residential food system analyzed in this project includes different aspects; the physical infrastructure (kitchen), end user activities (grocery shopping, cooking, recycling), resource flows (food, water, energy, waste) and the end users’ emotions (personal feelings, perceived influence on decision making, health). Therefore, the residential food system is divided into the following four subsystems. System 1 (S1) is the system that surrounds the individual, which in this case is the single tenant being the student. The single tenant will interact with system 2 (S2), being the kitchen. What enters the kitchen comes from the grocery stores, being system three (S3). The grocery stores inflow is mainly coming from suppliers and distribution centers, which will be defined as “The world” in this study, in other words system four (S4). S4 also consists of trends affecting decisions made by the individual. For a more in-depth description of the residential food system as well as an analysis on causalities between the subsystems, see “5. Focus Area 2: Indicator Framework” In terms of project delimitations, the project will mainly focus on S1 and S2, while S3 and S4 will be regarded as in- and outflows. This is due to the aim of the project being to create KPIs of which the student can change and affect, and the KPIs should be conducted as feedback loops of which could encourage improvement. Therefore, the project will focus on the aspects of which the individual has the ability to control and change. Restaurant visits are not included in this study and will not be evaluated, this is mainly due to the fact that restaurants are not included in the residential food system.
Figure 1: The model describes the limitations of each system used to describe the food system used in this study.

7
Another delimitation of this study is that the analysis will only consider what to measure and not how. That means that the KPIs provided are focusing solely on what is interesting to measure to determine sustainability, foreseeing the technical parts on how to actually measure them. The part of finding reasonable ways to measure these findings comes in a later stage of a future process that will not be included in this study.
2. Theoretical Framework There are several ways to determine and analyze a framework for a food system. The terms and settings used for this study is presented below, as well as further findings laying the basis for the conducting of the KPIs wanted.
2.1 Key Performance Indicators
Performance indicators can be defined as “an item of information collected at regular intervals to track the performance of a system” (Fitz-Gibbon, 1990). Key performance indicators (KPI) are simply the indicators of which are found to be the most important for evaluating the performance of a system. In this study, the indicators are created to measure sustainability of the food system. The indicators present data of an underlying complex system and are used in order to provide an overview of the system and ease decision making. The way systems function depends on its underlying flows and choosing which indicators to use for measuring the system is, therefore, an important part. “A change of indicators can therefore change the system itself. It is the improvement of this cyclic relationship between the way systems function and the flows of information about those systems that is at the very core of any serious attempt to develop indicators for sustainable development” (Anderson, 2018) according to the author of the approach used in this study to create the performance indicators, see “Method”. Therefore, an in-depth analysis of the systems flows is made in this study, to make the KPIs as efficient as possible. In order for the KPIs to be as efficient as possible they should be SMART, Specific, Measurable, Attainable, Realistic and Time Sensitive (Shahin, Mahbod, 2007). The metrics should be as specific and detailed as possible. When the metric is specific, it is easier to evaluate the achievement. In order to determine if the indicator has been achieved, they should not be ambiguous, they should rather be clear and concrete and as well as each indicator should be measurable. It is important that the metrics are attainable, they should not be out of reach. However, they should at the same time be challenging and developing. The indicators should at the same time be realistic to prevent a loss of interest. Lastly, the metrics should have a time frame. Having a time frame provides a structure and makes the monitor easier (Shahin, Mahbod, 2007). When determining the KPIs, the analysis will be made from a perspective of traditional management control and principals. The main points of the theories emphasize the importance

8
of “what gets measured, gets done” as well as the importance of all parts of the organization, or in this part, the tenants and Electrolux, are being included in the process of setting up the objectives. Even though the main purpose with this study is to conduct KPIs of which will help measure sustainability holistically, it is of great importance that the indicators are aligned with the objective of the organization or entity; meaning that the KPIs should be well integrated with the audience for best results (Anthony et.al., 2007). It is important to withhold a clear vision of the holistic view, as earlier mentioned will the KPIs presented in this study take both the economic, environmental and social aspects of sustainability in consideration. The KPIs should also be beneficial for the food system today, yesterday, as well as in the future. In other words should the KPIs set not only be good today, but also in the long run (Anthony et.al., 2007). Additionally, in order to determine which KPI is of highest contribution for sustainability, the concept of Pareto principle, also known as 80/20-rule, will be used. The principle states that 20 % of the indicator’s accounts for 80 % of the project/organization outcome. The principle will be used in order to determine which of the KPIs is of greater importance and therefore will receive a higher weight in the final sustainability rating (Kerzner, 2017).
2.2 System Dynamics of a Food System
In order for the KPIs to become relevant and possible to define, it is important to set system boundaries and evaluate the dynamics within the system. As shown in the model above, figure 1, this study will mainly analyze system one and system two, and view system three and four mainly as inflows and outflows. To further analyze the system as well as setting up boundaries and evaluating patterns from within the system, a modelling according to Donella Meadows Soft system dynamics (SSD) will be made. Meadows created a framework for SSD which helps the user see causality and feedback loops between different happenings and aspects of a system (Meadows, 1977). Meadows describes her way of modelling a system, by using a framework of which is suitable for most system dynamics. The food system of this study will be set up and analyzed through feedback loops and positive versus negative causality arrows in accordance with Meadows framework. An arrow with a positive sign (+) will be drawn between two aspects in a system to show that a positive causality exists, meaning if one aspect increases, so will the following aspect. An arrow with a negative sign (-) will be drawn between aspects of which the authors find a negative causality, i.e if one aspect increases, the following will decrease. The arrows are consequently a way to show feedback loops and causality. There will also be arrows pointing back to itself ( ↺ ) in the cases of which one aspect would be in a feedback loop connected back to itself, in other words showing a positive or a negative spiral (Meadows, 1977). In conclusion the modeling of the system dynamics is an important step towards reaching an understanding of the food system, and consequently making it possible to define efficient and representative KPIs.

9
2.3 Three Spheres of Sustainability
One common definition of sustainable development is “development that meets the needs of the present without compromising the ability of future generations to meet their own needs” (United Nations, 1987). In this study, the definition of sustainability is even further defined and analyzed through the use of the three spheres; economic, environmental, and social sustainability, see figure 2 (Anderson, 2018). The purpose is, as earlier mentioned, to define indicators of which create a holistic way to measure sustainability, and holistic means to consider all three spheres. Therefore, all three aspects of sustainability will be defined and used in this study to finally present holistic indicators.
Figure 2: The three spheres of sustainability: environmental-, economic- and social sustainability. (Anderson, 2018)
3. Method The methodology used to answer the question at issue consists of a literature study as well as qualitative research. The qualitative research includes an interview with the stakeholder Electrolux and a survey sent out to the tenants living in KTH Live-in Lab testbed Einar Mattsson, which include 300 students’ apartments. The literature study is the main method used to answer the questions at issue. However, the literature study is complemented with an interview with Electrolux and a survey sent out to students. The interview provided the study with Electrolux’s objective of the project and their desired outcome. A survey will be sent out to tenants living in KTH Live-In Lab Einar Mattsson testbed. The survey is intended to understand the tenant’s interest in measuring sustainability and if willingness to become more sustainable exists. Consequently, the indirect purpose with the survey is to get the KPIs aligned with the students’ interest in order to create effective KPIs.

10
Throughout the whole project Lakin Anderson approach for assessing sustainable development indicators (SDI) for Municipality Governments will be used but adapted for the situation of this study. The approach is presented in the paper Measuring Sustainable Cities: An approach for assessing municipal-level sustainability indicator systems in Sweden (Anderson, 2018). Anderson’s approach is divided into five different focus areas; Focus Area 1: Vision, Focus Area 2: Indicator Framework, Focus Area 3: Indicator Selection, Focus Area 4: Stakeholder Participation and lastly Focus Area 5: Communication Design and Strategy. Focus Area 1: Vision. The first focus area contains the vision, objectives and purpose of creating the KPIs. Focus Area 2: Indicator Framework. In the second focus area the framework defined. The definition of the three aspects of sustainability is presented, and a system analysis is conducted. Focus Area 3: Indicator Selection. It is within this focus area that the indicators are selected, in accordance to the framework presented in the previous focus area. Focus Area 4: Stakeholder Participation. Relevant stakeholders’ input is gathered and evaluated to make the indicators aligned with their objectives and interests. Focus Area 5: Communication Design and Strategy. The focus area regards how the indicators should be communicated and visual techniques to present them towards the user.
4. Focus Area 1: Vision Focus Area 1 aims to present the vision and purpose of the KPI. The indicators are envisioned to be used to measure and quantify sustainability of the food system surrounding the student. The set of KPIs are created with the purpose to scale up measurements in an efficient way, but as well as they aim to encourage students to become more sustainable. The KPIs are intended to be easy to understand, and the different aspects of the final sustainability ranking should be easy for the student to comprehend. It is also important that the indicators created takes the entire food system into consideration. The KPIs should not only analyze what happens in the kitchen but also investigate the social aspects of the individual as well as examining how the individual is affected by the grocery stores assortments, availability and affordability and world trends etc. A further definition of the food system and how the aspects interact and affect the sustainability of the system is presented in Focus Area 2. Concludingly, the indicators purpose can be summarized as making it possible to measure the sustainability of the food system in a holistic way and to encourage improvement.

11
5. Focus Area 2: Indicator Framework The indicator framework will be domain based in accordance to the three spheres of sustainability earlier presented. The three different aspects of sustainability are to be discussed and defined, first on a general basis and then within the framework of the food system adapted to single student tenants in Sweden. Then, to further link the definition of sustainability in a food system, a soft system dynamic will be created in order to identify casualties between different aspects of the system.
5.1 Defining Economic Sustainability
The first definition of economic sustainability is economic development that does not have a negative impact on environmental or social sustainability. An increase in economic capital must therefore not be to the expense of natural or social capital. In the second definition, economic sustainability is equal to economic growth, which is considered sustainable as long as the total amount of capital increases. There is no uniform definition of economic sustainability and the main reason for the difference between the two main definitions is due to the different use of sustainability models. The difference is that in the second definition, increased economic capital can be allowed at the expense of a reduction in other assets, which in turn can affect natural and social capital. The two definitions are also recognized under the names strong and weak sustainability, whereas the first definition is strong sustainability and the later weak sustainability (Spangenberg, 2005). In this paper, economic sustainability will be defined aligned with strong sustainability since the purpose of this study is to create holistic KPIs of which regards the entire system. The aspiration as earlier mentioned to define indicators of which will benefit the entire food system as far as it is possible and thereby not only focus on increasing economic wealth. Economic sustainability in terms of the food system for a student is solely determined by monetary value. Since the scope is constrained, the economic aspect of sustainability cannot be broadened beyond the individual's income, costs and monetary value. Therefore, the economic sustainability for the student tenant is mainly the cash in- and outflows created and put in relation to environmental and social capital.
5.2 Defining Environmental Sustainability
The definition of environmental sustainability differs, but the definition used in this study is that environmental sustainability equals the “maintenance of natural capital”. This definition can be further defined by two rules; the output rule and the input rule. The output rule is as follows “Waste emissions from a project or action being considered should be kept within the assimilative capacity of the local environment without unacceptable degradation of its future waste absorptive capacity or other important services” (Goodland, 1995).

12
The input rule is “Input Rule: (a) Renewables: harvest rates of renewable resource inputs should be within regenerative capacities of the natural system that generates them. (b) Non-renewables: depletion rates of nonrenewable resource inputs should be set below the rate at which renewable substitutes are developed by human invention and investment (…). An easily calculable portion of the proceeds from liquidating non-renewables should be allocated to research in pursuit of sustainable substitutes” (Goodland, 1995). Concludingly, should the output of a system, such as waste emissions, not violate the current nor the future environment and its capacity of handling the output. Renewable input should be used at a rate of which is lower than the rate of which it is being produced. Regarding the non-renewable input, should the usage be set below the rate of which renewable substitutes are being made, and the proceeds used from liquidating (in terms of money) the non-renewables should be used to research new sustainable substitutes.
5.3 Defining Social Sustainability
In the same way as the definition of environmental- and economic sustainability differs, so does the definition of social sustainability. The definition of social sustainability used in this study is “In a socially sustainable society, people are not subject to structural obstacles to: (1) health, (2) influence, (3) competence, (4) impartiality and (5) meaning-making (Missimer, Robèrt, Broman, 2017). The first aspect, health, means that people shouldn't be in an environment of which there are conditions that undermine their health by putting people at risk for injuries regarding their physical health nor their mental and emotional health. The second aspect, influence, emphasizes the importance of people not being hindered to influence the social system of which they are in. The third aspect, competence, concerns the fact that people cannot be hindered to develop their personal competence, both as individuals as well as in groups. Impartiality, being the fourth aspect, means that people are not affected by partial treatment such as discrimination. The last aspect, meaning-making, means that people should not be hindered from creating individual or common meaning (Missimer, Robèrt, Broman, 2017). Concludingly, the well-being of the individual is a prominent part of social sustainability. When analyzing the food system presented in this study, the aspects of health and influence will be of great importance. Mainly due to the importance of a healthy diet and the possibility to choose. The possibility to choose, in this context, plays an important role in the aspects of a human's well-being. Freedom of choice is important for happiness and the individual's perception of control regulates how people value freedom of choice. A variable combining the freedom of choice and perceived ability to control the situation is efficient for predicting a human's feeling of life satisfaction (Paulo, 2009). The food system presented in this study will take the freedom of choice and the possibility to influence decision making into consideration when measuring social sustainability; both regarding eating company and regarding choice of diet.

13
5.4 Defining the Residential Food System
In order to define sustainability within the residential food system and create holistic KPIs to measure and evaluate sustainability of a student tenant, the boundaries of the residential food system need to be defined and limited. The residential food system has been divided into four different subsystems, S1, S2, S3 and S4. The first system (S1) involves the student and the students' decision making based on emotions and instincts. The second system (S2) is defined as the physical infrastructure being the kitchen and regards the in- and outflows of the kitchen related to the cooking of food, e.g. grocery shopping, food waste, water usage and electricity. The third system (S3) is grocery stores and the fourth system (S4) is defined as the world. Both S3 and S4 are limited in its scope due to this paper's focus on the individual's ability to change human behaviour in order to live more sustainably.
Figure 3: Showing a selection of the inputs and outputs from each system
S1 is the system based on the individual and the underlying factors on which the student bases their decisions on when, what and how food is going to be eaten and cooked. However, S1 is not only influenced by “soft” inputs such as human needs, but also fixed inputs e.g. money. The in and outputs of the S1 can thereby be defined and limited to; hunger, money, influence, cooking interest/competence and human well-being. While S1 is based on the underlying decisions of the individual, S2 are the implications and effects of cooking. How the kitchen is used, how the appliances are utilized, what resources are needed in order to cook food and what is the output result of cooking. Therefore, the in- and output of S2 can be defined as the usage and creation of the following; water, electricity and waste (e.g compostable, plastic, paper). S3 is limited to the in- and output of grocery stores. The groceries have been divided into four different categories; meat, pescatarian, vegetarian and vegan food in order to simplify the valuation of different food items. Food type also includes the aspects of whether it is healthy

14
or not, and if it brings the individual joy. The simple categorization facilitates valuation of food in both environmental sustainability (e.g. emitted carbon dioxide) and social sustainability (e.g. healthy food). S3 also takes into consideration food availability and affordability. The choice of which food to eat is limited by the grocery stores assortments (availability) and the price of a specific grocery (affordability). Food availability is also determined by the distance to the grocery stores. Lastly, S4 consists of the inputs to grocery stores from the world, by evaluating the origin of the grocery and thereby the distance the items have traveled, and the amount of carbon dioxide being emitted. The origin is divided into three categories; domestic, Scandinavian and international. S4 also includes food trends and norms in the world that influence individuals' decision making on which food to cook and eat. Table 1: Definitions of the four different systems.
S1: Student ❏ Hunger ❏ Money ❏ Influence ❏ Cooking interest/competence ❏ Human well-being
S2: Kitchen ❏ Water usage ❏ Electricity usage ❏ Waste (compostable, plastic, paper)
S3: Grocery Stores ❏ Food type (meat, pescatarian,
vegetarian, vegan, healthy, enjoyable) ❏ Food availability ❏ Food affordability
S4: World ❏ Trends ❏ Grocery origin (domestic, Scandinavian,
international)
5.5 Evaluating Sustainability and Casualties in the Food System
To further understand the food system and the linkage between the systems, a model in accordance to soft system dynamics (SSD) has been created, see figure 4. The colors represent each of the four systems presented above, where dark blue represents system 1, light blue is system 2, dark grey is system 3 and light grey is system 4. In order to create holistic KPIs, a holistic understanding is needed.

15
Figure 4: Soft system dynamics of the food system
An important part of social sustainability is human well-being and is achieved when people are not subject to structural obstacles to health, influence, competence, impartiality and meaning-making (Missimer, Robèrt, Broman, 2017). Several of these aspects are to be realized in the model presented, where many casualties have been identified. When the individual (S1) feels that they have control over the situation and has the possibility to choose, or in other words to influence the decision, their well-being increases (Paulo, 2009). The influence in the food system mainly regards influence over their diet and choice of groceries, which is also connected to the amount of available cash, see figure. Here a relation between economic and social sustainability is found. The amount of influence an individual has is affected by the amount of available cash they have, when the amount of cash increases, the variety of groceries purchased and influence on diet increases (French, Wall, Mitchell, 2010); a positive casualty. This is in other words related to the affordability of groceries provided in the stores, as well as the availability regarding the assortments in the store. Influence also regards the influence over own personal habits, e.g. whom the individual is eating with; alone, with friends and/or with family. The degree of social sustainability is, however, not automatically increased by eating together with others. Studies show that eating alone can be considered a pleasure among young adults (Giada, 2012). What is more important is the possibility to choose whether or not to eat alone; the possibility to influence the decision on your social environment and eating company is what increases human well-being. Social sustainability and human well-being is also affected by the individual's competence and interest (Missimer, Robèrt, Broman, 2017). There is a positive casualty identified between the individuals cooking competence/interest and the amount and degree of advanced cooking a

16
person will perform (Soliah, Walter, Jones, 2012). When home cooking increases, so does electricity and water usage, see figure. Here S2, being the kitchen, is strongly affected by S1 being the individual. The habits and needs performed by the individual, will affect the resource usage. Hunger is one of the human needs that will affect cooking, when hunger increases the cooking increases, and when the cooking increases, the hunger decreases. There are, in other words, both a positive causality and a negative causality between hunger and cooking and therefore a balance between the both aspects. There is also a positive casualty between cooking and waste, both regarding food waste and plastic waste. When cooking increases and groceries are turned to meals, waste is a consequence. Households generate more than half of the total food waste in the EU, and in industrial countries 40 % of the food waste comes from the retail and consumer level (European Commission, n.d.a). In other words, the individuals in the food system do have a big possible impact on the food waste produced. Food waste affects the environment due to its release of GHG emissions (European Commission, n.d.b) as well as it affects economic sustainability of the system, since food waste indirectly is a waste of money as well. Domestic household waste also includes plastic and non-edible waste. In Sweden approximately one third of all household waste is sent to material recycling. Domestic household waste as well as food waste can, however, become less harmful for the environment through efficient recycling (Avfall Sverige, 2018). Therefore, in terms of sustainability, it is of great importance to take recycling into consideration when measuring the sustainability of a kitchen. The act of cooking will also impact the amount of electricity and water used. Most appliances in a kitchen need electricity to operate, and there are several actions in a kitchen that can decrease the need for electricity (Energirådgivningen, 2018). Depending on the electricity source, the electricity production is more or less damaging for the environment. In Sweden, most of the electricity comes from renewable sources (Ekonomifakta, 2020). However, a system is only environmentally sustainable when the renewable input is being used at a rate of which is lower than the rate at which it is being produced (Goodland, 1995). Since the population is growing and given the increase in electrification of several business areas, resource efficient usage in the household is of great importance to obtain sustainable electricity access nationwide (IVA, 2016). In addition, the economic sustainability of the individual is dependent on its monthly expenses, and the individual could save money by decreasing their electricity usage; ideally without making the kitchen experience less functional or convenient. Therefore, electricity is an interesting aspect to measure in the food system.
The water usage in a kitchen is also dependent on the amount of cooking performed. The type of food being cooked is also contributing to water usage in the production phase in S4 and S3, but on the kitchen level the most prominent source of water usage is cooking and dishwashing (Svenskt Vatten, 2019). Water is a limited resource as well as it is a common pool resource for the entire world. Meaning, that the usage of water in Sweden will affect the available fresh water in the entire world, S4, in the long run. The United Nations expects a 40 % global gap between water supply and demand in ten years (WSP, 2020). For the current water usage to be sustainable, it should be in accordance with the definition of environmental sustainability;

17
“Renewables: harvest rates of renewable resource inputs should be within regenerative capacities of the natural system that generates them” (Goodland, 1995). It is of great importance to use water in a sustainable way, and to measure and evaluate water usage. To create a more holistic perspective, it is important to look beyond the kitchen boundaries. There are distinct correlations between food and well-being, and healthy food can improve well-being. As mentioned above, well-being is affected by both what type of food is being consumed but also how it is consumed concerning the social factors related to dining. Research shows that food intake, specifically fruits and vegetables increase our well-being (Holder, 2019). Other than that, plant-based food has several health advantages compared to a meat heavy diet. A plant-based diet reduces the risk of type 2 diabetes, coronary heart disease, stroke and certain cancer types. It is also known to protect against obesity (Schepers, Annemans, 2018). Diets with less animal proteins and more sustainable plant-based food can supply the needed macronutrients for humans, given that the consumed food varies. Increased consumption of plant-based foods and decreased consumption of animal protein is an efficient and important way to reduce humans’ impact on the environment and at the same time generally improve human health (Neacsu, Johnstone, 2017). Plant-based food, besides their health benefits, have great environmental benefits. Environmental impacts from food consumption are dominated by the consumption of meat, (Röös, Ekelund, Tjärnemo, 2014) and meat production accounts for between 15 % and 24 % of all greenhouse gas emissions (Fiala, 2008; Steinfeld et.al 2006). Out of the environmental perspective of food, besides looking at what type of food, the aspect of transportation takes on an important part. The carbon footprint related to food transportation varies from a few percent to more than half of the total carbon footprint from food production, distribution and storage (Wakeland, Cholette, Venkat, 2012). Others suggest that transportation as a whole only represents 11 % of food's lifecycle GHG emissions, and final delivery from producer to retailer only counts up to 4 % (Weber, Matthews, 2008). Dietary shifts can thereby be a more effective way to reduce GHG emissions within the food systems. One average red meat serving is around 150 % more GHG-intensive than fish (Ibid). Nevertheless, the distance food has been transported is a cause to GHG emissions and could further be combined with evaluating what type of food it is. In the fourth system of the SSD, the distance that the food can travel is to be divided into three different categories; domestic import, Scandinavian import and international import, in order to easily assess and evaluate the food commodities. Livsmedelsverket, The Swedish National Food Agency's, has created a label called “Nyckelhålsmärkning” translated to “The keyhole label”. The food label aims to make it easier and less time consuming for the individual to find healthier groceries in stores. Food with the Keyhole label contains more fiber and wholegrain, less salt and sugars and the groceries with the label are healthier or contain less fat than food of the same type without the symbol (Swedish Food Agency, 2019). In other words, food products in Swedish grocery stores that are labeled with the keyhole as well as plant-based food earlier mentioned can be interpreted as healthy food affecting the well-being in a positive way.

18
The individual's diet is, however, also strongly related to the grocery shopping habits. It is important, as earlier mentioned, to look at what type of food the individual consumes and how far the groceries have been transported, but it is also important to evaluate the relation between the individual and the grocery stores. The availability to the closest grocery store affects how frequently people tend to do grocery shopping. The student is more likely to do frequent grocery shopping if there is a store nearby, and studies show that grocery store accessibility is related to grocery stores habits; where greater healthy food accessibility is associated with a shorter distance to grocery stores (Li, Kim, 2020). The distance also affects the way people travel to the store, by foot, bike cycling, car or public transportation. Time spent on grocery shopping is also strongly related to the store distance, which affects the social sustainability of the system. Another important aspect of the grocery stores is the assortment of products provided in the store. During 2012-2013, 4692 shoppers' behavior was evaluated for one week, where 11472 purchases were analyzed. The results showed that purchases made in conventional supermarkets were less healthy than natural/gourmet stores (Chrisinger, Kallan, Whiteman, Hillier, 2018). Meaning that the assortment of healthy groceries in the stores affect what people buy. On the other hand, affordability is an important aspect of which could be strongly affected by the choice of stores and type of food. Meaning that the assortment and affordability both affect the food choice made by the individual. S4 also consists of food trends affecting the individual’s well-being. Food choices can help young people construct a self-image as well as it can open up possibilities of judging others, signal their own conformity with acceptable friendship and make the individual adjust to peer norms (Stead, McDermott, MacKintosh, Adamson, 2011). Vegetarianism is a diet as well as it can be seen as a food trend (Sifo, 2018) and affects identity formation and stabilization (Fox, Ward, 2008). In other words, diets can play an important part of the well-being of the individual and affect the social sustainability of the system. If the individual feels neglected by the peer pressure due to his/her diet, the well-being could decrease. Food trends can, however, also increase the well-being of the individual by strengthening group belonging and the identity formation of the individual.
6. Focus Area 3: Indicator Selection In this section, a literature study on previous works is presented and the KPIs are selected. Other studies on defining KPIs and selecting what to measure have been analyzed in order to take advantage of previous findings when defining the KPIs in this food system.
6.1 Previous Studies on Selecting Sustainability KPIs
A previous study on creating sustainability indicators for an energy system emphasizes the importance of finding indicators of which covers the three dimensions of sustainability. The energy system used in the study consists of an island with its own energy production, and the

19
authors use this energy system to present and define indicators by dividing them into the following categories: Resource indicator — RI, Environment indicator — EI, Social indicator — SI and the Efficiency indicator — FI (Afgan, Carvalho, Hovanov, 2000). Another study suggests that the problems behind sustainability indicators are that the chosen indicators are first, not truly reflective of all three aspects of sustainability and/or second, that they are too many and therefore difficult to apply (Martins et.al., 2007). Sustainability indicators, or metrics, should be small in numbers and as independent of each other as possible (Sikdar, 2004). The independence allows for change of the definition of some indicators, without affecting the others. A topology of sustainability indicators has been proposed, which takes all three spheres of sustainability into consideration (Martins et.al., 2007). There are three different kinds of indicators. (1) One-dimensional indicators (1D), which provides a metric that only takes one aspect of sustainability in account (economic, environmental and social). (2) Two-dimensional indicators (2D) which provides two aspects of sustainability into the metric (socio-ecological, socio-economic, and economic-ecological). The last indicator (3) is three-dimensional (3D) and considers all aspects of sustainability into the metric. The described topology suggests that to receive an overall rating and assessment of a systems sustainable development, first one must calculate the 3D metrics. If all the chosen metrics show an improvement of the system, there is no need to further look into and develop the metrics. On the other hand, if the results do not show a distinct improvement, it will be necessary to consider 2D metrics, and later 1D metrics for decision making (Martins et.al., 2007). The study concludes that the sustainability metrics must satisfy the following three conditions: (1) a coherent set of quantifiable variables that are consistent with the principles of sustainability, (2) the metrics must be clear, simple and unambiguous, and (3) they must be representative of the physical system under study (Martins et.al., 2007). Another study presents ways of which the Global Reporting Initiative (GRI) defines its sustainability indicators. GRI distingue three general types of ratio indicators. The first is productivity ratios (1), intensity ratios (2) and lastly percentages indicate ratios (3) (Székely, Knirsch, 2005). The productivity ratios put value in relation to impact, such as production units divided by waste units. Intensity ratios on the other hand put impact in relation to value, e.g. amount of waste per production unit. The third type of indicator compares measurements of the same unit, such as the number of recycled products divided by amount of waste. Ratio based indicators are beneficial since they relate the required input to the output, or the value created; in other words, by showing the relation between different aspects of the kitchen. Instead of only measuring the output, it also examines the required input. Another study suggests dividing the indicators into four categories, but with a common index scale ranging from 0 % to 100 %. The indicators presented in the study measures different aspects of sustainability but is converted to a percentage scale by being selected in a way which makes it possible to measure and express the KPI as a percentage scale, see figure 5 (Steiniger et.al., 2020). Since the KPIs created in the mentioned study are selected through a common index scale, it is possible to compare the results with other areas measured. The figure below

20
presents the four main categories from the study mentioned (Steiniger et.al., 2020) and the KPIs, which makes it easy for the user to understand which of their habits can be improved and to compare the results from different KPIs.
Figure 5: Radar chart showing the results of each KPI, 100 % is on the outer line of the graph. (Steiniger et.al., 2020)
6.2 Selecting the KPIs Main Target
The findings from Focus Area 1 and 2 as well as the findings made from the literature study presented above will lay the basis for the decision making on choosing which aspects of the food system to measure. The system analysis in Focus Area 2 presents how different aspects of the system are connected to each other and to the sustainability of the system, whereas the literature study presents ways of which the indicators can be selected. Concludingly, the findings from the literature study of which are helpful for defining the KPIs are the following criteria’s: Firstly, the KPIs should be small in numbers, simple, clear and unambiguous. Secondly, they should aim to be three-dimensional in order to reach a holistic view, and thereafter two or one dimensional. Moreover, should the indicators be presented in a common scale ranging from 0-100 % where 100 % is the wanted outcome. The common scales make it possible to present the results in a radar chart as seen in figure 5, making the results easy to compare as well as easy to understand. The KPIs will also be divided into categories to make them more understandable. Lastly, will some of the KPIs be presented as ratios, in order to truly present the created value and or resources used.

21
The findings from Focus Area 1 and 2, being the purpose of the study and the system analysis, lays the basis for selecting the following six categories: electricity usage, water usage, GHG emissions, waste management, well-being and expenses. These categories are holistic and take the entire food system into consideration. The categories are then divided into KPIs, where some are measured in absolute values, some are measured by self-evaluation and some are measured as ratios. All indicators are then translated into the common scale ranging from 0-100 %, in order to quantify sustainability. To achieve a final grade, an average of all KPIs results is calculated.
Table 2: The table presents all categories and KPIs selected for the food system in this study.
Category Indicator Variable(s) Dimension Unit Range
Electricity Usage
1. Cooking method Electricity driven appliances used
(2D) economic- environmental
Appliances used and how energy efficient is the usage
0-100%
2. Cooking efficiency How many meals the individual cooked per cooking session
(2D) economic- environmental
Number of meals made divided by cooking session
0-100%
Water Usage 3. Dishwashing method
Water used when dishwashing and efficiency of dishwasher
(1D) environmental
Hand wash: Water bath or running water per time unit Dishwasher: full or half empty dishwasher
0-100%
GHG -emissions
4. Type of food and distance it has been transported
Evaluating what type of food the main source of protein is and what the origin is
(2D) socio- environmental
Protein: Vegan, vegetarian, pescatarian or meat and cross referenced to origin: domestic, Scandinavian or international
0-100%
5. Method of transport to grocery store
Evaluating the transportation method used to get to grocery store or it the groceries are home delivered
(1D) environmental
By foot/bicycle, public transport, home delivery or car
0-100%
Waste management
6. Recycled waste Evaluating different kind of waste and if it is being recycled properly
(1D) environmental
None/same waste pin, compost, plastic and/or combustible
0-100%
7. Type of food waste Determining if the waste is old food or non edible residue
(2D) economic- environmental
Leftover/old food or non edible residue
0-100%
Well-being 8. Influence on eating company
The perceived power to decide/influence whom you are eating with or alone
(1D) social Full power, to some extent, no influence at all
0-100%
9. Influence on food choice
The perceived power to decide/influence over the type of food consumed
(2D) socio- economic
Full power, to some extent, no influence at all
0-100%

22
10. Trends Evaluating emotions caused by (potential) trends that are affecting the individual’s food choice(s)
(1D) social Yes there are trends making me feel better, worse or not affected
0-100%
11. Healthy food Is the food item Keyhole labeled
(1D) social Keyhole or no keyhole label 0-100%
12. Enjoyable food Did the meal bring pleasure
(1D) social Did not enjoy, passive, enjoyed 0-100%
Expenses 13. Food expenses How much money is spent on groceries
(1D) economic High, low, medium in comparison to personal budget
0-100%
There are three different measuring methods in these KPIs, absolute values, self evaluation and efficiency ratios. The individual will provide the needed information, in order to evaluate his/her sustainability. The aspects of which are easy to measure in absolute values are measured as such, but since the well-being of the individual plays an important part of social sustainability, it is important to evaluate emotions of the individual. To evaluate social sustainability will the individual self-evaluate their situation. In addition, presenting the KPIs as a ratio is valuable since it is important that the individual is able to control the situation and his/her habits, and seeing the required input related to the wanted outcome. KPI numbers 1-12 are evaluated for each meal, and number 13 is evaluated monthly. This will make it possible for the individual to see progress and frequently increase sustainability awareness. Number 13 is evaluated on a monthly basis since a student's income often is received on a monthly basis, e.g salary or student grant. There is no KPI explicitly evaluating the students monthly electricity bill, since KPIs should be exclusive and the electricity usage is already measured through KPI number 1 and 2. The food expenses are, on the other hand, evaluated through a KPI since the student can impact the food purchases made and choice of diet, e.g. vegetarian food is not necessarily more or less expensive than a vegan diet. Meaning that KPI nr 4, 11 and 12 can be kept at high sustainability ranking without automatically having to spend more money, causing KPI nr 13 to decrease. This is, in contrast to the electricity bill, a casualty that the student can control independently of diet choice.
6.3 Electricity Usage
KPI number 1 evaluates what cooking method that has been used. Presenting the electricity usage in absolute numbers of kWh is not as concrete and easy to grasp as evaluating which kitchen appliance that has been used. This, since the comprehension of the unit kWh often is lower than understanding that different kitchen appliances are more or less energy efficient. An ovens effect is around 1800-3000 kW depending on the setting used, while a stove requires around 1800-2500 kW. These appliances can be compared to smaller kitchen appliances such as microwave 900-1500 kW and a food blender 400-600 kW (Elskling, n.d.). Thereby KPI 1 will evaluate the methods of cooking and thereby indirectly the energy consumption. But the method of cooking also involves using the appliances in a energy efficient way, such as not

23
preheating the oven for a long time before using it or using a stove plate larger than the pot or pan used (Kreith, Goswami, 2016). Using a stove plate that has a one cm larger diameter than the pan requires about 20 % more energy than using the same sized pan (E.ON, n.d.). To encourage the individual towards more sustainable actions in the kitchen in terms of electricity, KPI number 1 evaluates both kitchen appliances used and how they are being used and the student can improve their ranking by using the appliances in a more energy efficient way. The KPI is two dimensional (2D) considering both the environmental and economic sustainability (economic-ecological). Since a decrease in energy consumption (environmental) will decrease the electricity bill and therefore have a positive impact on economic sustainability. KPI number 2 evaluates the cooking efficiency in terms of meal per cooking session, as a ratio KPI. In this study where the individual is a student, buying new, more energy efficient kitchen appliances may not be an option due to the rental agreement or their personal economy. Therefore will the KPI ratio look at how energy efficient the individual is, instead of looking at how energy efficient a kitchen appliance is. The KPI measures how many meals the student cooks per cooking session, in other words the electricity usage per meal, instead of solely looking at the absolute number of electricity usage in the kitchen. Cooking several meals at one cooking session requires less electricity than cooking one meal every time (Kreith, Goswami, 2016). This is mainly due to the fact that the larger electricity driven appliances such as the oven and stove only needs to be used once, instead of every time the individual needs to eat (Centre for Sustainable Energy, 2015). Heating an oven to 200 ℃ requires 0,5 kWh, while keeping the oven warm once it has been heated only requires 0,5 kWh per hour. Meaning that instead of heating the oven every time a meal needs to be cooked, several meals can be cooked during that session and consequently does the oven only need to be heated once. If the food is already prepared, the microwave can be used to reheat the food again meaning less energy needs to be used (Energirådgivningen, 2017).
In addition, a study analyzing 256 households in the UK found that the energy efficiency per serving is increasing. Meaning that the energy consumption from cooking decreases per person in the household up to six people (Owen, 2012). To define the limits of a KPI, an assumption is made that one person represents one serving. Therefore, five meals or more per cooking session will be considered the most sustainable when defining the KPI. KPI number 2 is 2D (economic-ecological) by the same reasoning as the first KPI. Figure 6: Annual consumption for cooking per person per family unit size. (Owen, 2012)

24
6.4 Water Usage
The same principle applies to dishwashing as well, KPI number 3, whereas the student may not afford a dishwasher but still has the possibility of dishwashing in a more sustainable way. 58 % of the tap water used in a kitchen was used for dishwashing, and single-person households consume more water per person than larger households (European Commission, 2012). Dishwashing under running water wastes a lot of energy and water compared to dishwashing in a sink. Washing dishes under running water for 15 minutes requires 90 liters of water. (Stockholm Vatten & Avfall, 2019) Therefore, the student should always aim to dishwash in a tub. If the student has a dishwasher, to be as energy efficient as possible, the student should always run the dishwasher full and not half empty. (Energimyndigheten, 2017) By using the dishwasher 20 % less often, as a consequence of only running it when it is full, 300 liters of water would be saved per year (Energimyndigheten, 2017). This KPI, is on the other hand one dimensional (1D) compared to KPI 1 and 2. This is due to the water expense often being included in the rent (HSB, n.d.). Being water efficient is therefore solely affecting the environmental sustainability.
6.5 GHG emissions
The decision on what to cook and eat is, however, something the student can control. Therefore KPI number 4 considers the diet of the individual, looking at what the student buys and eats. Evaluating if the main protein source is vegan, vegetarian, pescatarian or meat-based and looking at how far the food has traveled; either domestic, Scandinavian or international import. As presented earlier, increased levels of vegan food and the shorter distance the food has traveled increases sustainability ranking due to lower GHG emissions. Type of protein (meat, pescatarian, vegetarian, vegan) has been considered as more important than distance traveled when defining the KPI metrics, since studies show that the transportation is responsible for a smaller part of the GHG emissions compared to the type of food (Wakeland, Cholette, Venkat, 2012; Weber, Matthews, 2008). This KPI is 2D (economic-ecological) since plant-based food is positive both for the environment and the individual's health as earlier mentioned, and therefore positive for social sustainability. In the same way as the student seldomly can afford new kitchen appliances, moving to another apartment is seldomly an easy decision. The food availability is of importance to the sustainability of the system as earlier mentioned but is often hard for the individual to change and control. The method of transportation, is however, more often easy to change. Therefore, KPI number 5 does not measure distance to the grocery store but instead evaluates the method of transportation. Transportation by foot or bicycle is considered the most sustainable way of transportation in this study, because of zero GHG emissions. Public transportation is more energy efficient and contributes to lower emissions per person compared to transportation by car, (Miller, De Barros, Kattan, Wirasinghe, 2016) but is at the same time not as sustainable as walking and biking. The popularity for grocery home delivery services, e.g. Mathem, have increased in the past years (Svensk Dagligvaruhandel, 2020) and therefore needs to be viewed as an alternative way of transportation to grocery stores. Walking and biking is still the best

25
method seen from the emissions perspective, but grocery home delivery is more efficient than if every household would drive their cars to the closest stores (Wakeland, Cholette, Venkat, 2012). On the other hand, grocery home delivery requires energy to keep the items refrigerated and is therefore not as energy efficient as public transportation (Heldt, Matteis, von Schmidt, Heinrichs, 2019). Regarding public transportation, going by train or subway is more sustainable than going by bus in terms of GHG emissions per kilometer travelled per person. (Trafikverket, 2019) The KPI is 1D since the only aspect taken into consideration is GHG emissions (environmental).
6.6 Waste Management
KPI number 6 and 7 evaluates what type of waste the student produces and what and how it is being recycled. As presented earlier, recycling is an important part of waste management, since it can enable reusing of materials as well as it lessens the environmental impact of the waste (Avfall Sverige, 2018). Therefore, does KPI nr 6 measure how much recycling is made in terms of waste and is a 1D metric (environmental). KPI nr 7 emphasizes the importance of decreasing food waste. Not planning meals and thereby letting food get old and throwing it away is unnecessary and something the student could avoid, and therefore does such waste lower the sustainability score. Whereas waste from food packaging is harder to avoid and control by the student, and more focus is put on the recycling made. Food waste can be seen as an economic loss, since there is monetary value lost when not consuming bought food. KPI 7 is thereby 2D since it has an impact on both economic and environmental sustainability (economic-ecological).
6.7 Well-being
KPI number 8 and 9 evaluates the individuals perceived power to influence their eating company (nr 8) and food choice (nr 9). These KPIs are important since the possibility to influence once habits are of great importance for the social sustainability of the individual as presented earlier in this study, see “Social sustainability” as well as Focus Area 2. KPI number 8 is 1D (social) but KPI 9 is 2D (socio-economic) since food choice is, for instance, affected by the individual's economy and the choice of food can affect the individual's health. KPI number 10 regards food trends, due to the aspect of social sustainability being impartiality and the importance of food trends affecting the identity and well-being of the individual, as presented in Focus Area 2, and the KPI is thereby 1D (social). The student will self-evaluate whether or not they feel affected by food trends, and whether or not the trends make the individual feel better or worse about their meal and current situation. But the social sustainability is also affected by the student’s health and, therefore, regards KPI number 11 the health of the diet where food label with the “Keyhole” is considered the healthiest. This is a simplification as earlier mentioned, but a simplification detailed enough to create a reasonable measurement of one's diet. A plant-based diet is, as described, considered as a healthy diet. But since the KPIs should be unambiguous and exclusive, vegan food is not included in the health KPI and are solely present in KPI 4. However, the well-being of the

26
individual is also related to the pleasure of eating. If the individual enjoys the meal, his/her well-being tends to increase (Batat et.al, 2019). Therefore, KPI number 12 measures how enjoyable the meal is for the individual. Both KPI number 11 and 12 are 1D (social) since they are only regarding social sustainability.
6.8 Expenses
KPI number 13 focuses on the economic side of sustainability, 1D, with the purpose of highlighting the aspects of which the student can affect. The choice of food and grocery shopping habits affect the expenses of which the individual needs to pay. Therefore, a KPI regarding the controllable expenses have been made. The expenses are not measured in absolute values, due to the fact that the income of the student can vary as well as their own personal priorities. In other words, a certain amount of money spent on food can be seen as unsustainable for a student living with a high monthly rent, but that same amount can be sustainable for a student having a low monthly rent. Therefore, does KPI number 13 put the expenses in relation to individual budget.
6.9 Summary of all Measurements Table 3: The table presents all KPIs and the index scale translated to its measuring unit.
Level of sustainability / KPI
0 % 25 % 50 % 75 % 100%
1. Cooking method Used every electricity driven kitchen appliance I own
Used oven and stove Used oven or stove to cook my meal
Used oven and/or stove to cook my meal but used them in a energy efficient way*
Used no electricity driven appliances
2. Cooking efficiency
1 meal cooked per cooking session
2 meals cooked per cooking session
3 meals cooked per cooking session
4 meals per cooking session
5 meals or more cooked per cooking session
3. Dishwashing method
Under running water for more than 15 min, non full dishwasher
Under running water for more than 10 minutes but less than 15 min
Under running water for more than 5 min but less than 10 min
Under running water for less than 5 min
With water bath, Full dishwasher
4. Type of food and distance it has been transported
International meat International pesc, Scandinavian meat
Domestic meat, Domestic pesc, Scandinavian pesc, International veg,
Domestic veg, Scandinavian veg, International vegan
Domestic vegan Scandinavian vegan
5. Method of transport to grocery store
Car
Grocery home delivery
Bus Train, subway Bicycle, By foot

27
6. Recycled waste Threw all waste in same bin
Only one: compost, plastic, combustible
Two choices: compost, plastic, combustible
Three choices: compost, plastic, combustible
Everything is recycled properly no matter number of waste types
7. Type of recycled food waste
Waste consists of leftover/old food
The majority of the waste consist of leftover/old food
Half of the waste consist of leftover/old food
The majority of the waste is non edible residue
Waste consist of non edible residue
8. Influence on eating company
No influence, actually wanted to eat with someone/alone but could not
No influence, but still felt fine
Not affected Had some influence, and felt satisfied
Full influence, I chose the company or to eat alone
9. Influence on food choice
No influence, actually wanted to eat something else but I could not
No influence, but still felt fine
Not affected Had some influence, and felt satisfied
Full influence, I ate what I wanted to
10. Trends Yes there are trends making me feel worse about my meal
Yes there are trends making me feel a bit worse about my meal
Not affected Yes there are trends making me feel a bit better about my meal
Yes there are trends making me feel better about my meal
11. Healthy food The food products of the meal have no keyhole label
Some of the food products of the meal have a keyhole label
At least half of the food products of the meal have the keyhole label
More than half of the food products of the meal have the keyhole label
Every food product of the meal has the keyhole label
12. Enjoyable food Did not enjoy the meal
Did not enjoy the meal but it was okay
Passive attitude towards meal
Enjoyed the meal to some extent
Truly enjoyed my meal
13. Food expenses Too expensive for my own budget
A bit too expensive, I have to down prioritize other things to afford current food expenses
Food expenses are a bit high but i do not consider the expenses as a problem
Food expenses are a bit high but not affecting me much
Reasonable and fit for my own budget
*Energy efficient means not preheating the oven, not using a stove plate larger than pot/pan.
7. Focus Area 4: Stakeholder Participation This section covers the stakeholder’s interest in measuring sustainability. An interview was conducted with a representative from the project initiator Electrolux and a survey was sent out to students living in KTH Live-in Lab testbed Einar Mattsson. It is of importance to align the KPIs with the stakeholders in order for them to be effective.
7.1 Electrolux Interest in Measuring Sustainability
The interview with the representative from Electrolux took place over Zoom in mid-April with the purpose to understand the project initiator's purpose with measuring sustainability. The interviewee is working as a Design Strategy Specialist at Electrolux and is part of the main

28
project between KTH Live-In-Lab and Electrolux earlier mentioned. The questionnaires were the authors of this study. The questions asked were the following:
● Why did Electrolux start this project and collaboration with KTH Live-in-Lab? ○ What is the perfect outcome?
● What aspect of sustainability do you find important to measure (according to Electrolux)?
● Which part of Electrolux do you consider has the most potential to improve toward a more sustainable lifestyle?
● How do you view these KPIs? Is the purpose to create an understanding of the individuals behavior in the kitchen regarding how sustainable they are, or is the purpose to push people to become more sustainable?
The answers can be concluded into the following three findings. Firstly, the interviewee emphasized the importance of getting a greater understanding of the user. Electrolux initiated the project partly to understand the individual's behavior in the kitchen more in depth. Secondly, the interviewee described how important the usage phase of Electrolux life cycle analysis is in determining the sustainability of the products. In other words, is the sustainability ranking of the kitchen and the food system heavily affected by the individual’s habits and behavior. For example, was it mentioned during the interview how a lot of people preheat the oven, even though that is not needed with newer appliances. This behavior causes a lot of energy waste, mainly due to lack of knowledge and old habits. Lastly, the interviewee explained the company's target goal of making people eat more sustainable and to increase common knowledge about sustainable choices. The interview provided the authors with greater awareness of Electrolux desire to increase their understanding of the individual’s behavior. In addition, the stakeholders' interest in encouraging the users to become more sustainable also became clearer. It is, therefore, important that the communication of the indicators is aligned with these interests. The findings are already aligned with the definition of the KPIs presented above but will be further implemented in Focus Area 5.
7.2 Students’ Interest in Measuring Sustainability
To understand the students’ interest in measuring sustainability, a survey has been sent out and received 31 answers. The survey was also a part of the greater project, where only four questions out of the 47 questions will be evaluated in this study. The respondents are students living in the KTH Live-in Lab testbed Einar Mattsson. The testbeds are available for 305 students, but at the time of the survey there were 220 students living in the space and consequently received the survey. The purpose with these questions is to understand their attitude towards sustainability measurements, and to analyze which aspects of their habits of which they find interesting to improve. In order for the KPIs to be effective and provide incentives towards change, the participants must be willing to improve their lifestyle and habits

29
to become more sustainable (Parmenter, 2015). The results from the survey are presented below. The first finding from the survey is that 84 % of the participants are willing to change their lifestyle and the remaining are not sure yet, see question 1. This result gives comfort that the KPIs might have a great impact towards sustainability. In addition, the survey shows that 61 % of the students are open to improve their food habits and eat more healthy food, see question two. Since healthy food is an important part of sustainability, the results indicate a positive mind set towards becoming more sustainable. Moreover, 68 % are also interested in having help monitoring one's cooking habits, question 3. The indicators presented in this study aim to help the user understand their current behavior as well as increasing health and sustainability, which is aligned with the results of question 3. The majority of the recipients, 81 %, are willing to learn more about their CO2 emissions. This finding is beneficial for the future and potential usage of the KPIs presented in this study, since the KPIs are created in order to lessen the individuals GHG emission.
Figure 7: Summary of the results from the survey sent out to the students.
8. Focus Area 5: Communication Design and Strategy This section of the study is focusing on the communication design and strategy of the KPIs. In other words, to define their progress and determine the right level of complexity of

30
measurements as well as setting the visual representation. Since the implementation part of the KPIs is not in the scope of this project, the method of measuring won't be defined. The project's objective is to define and rank sustainability within the food system and to create KPIs. With that said, it is still important to ensure that the KPIs are effective and easy to grasp and understand and that the KPIs encourage increased sustainability. The communication of the KPIs are therefore of great importance. One of the main purposes of KPIs is to make the complexity behind the indicators more understandable (Anderson, 2013). Their visual form and how they are communicated is essential for their effectiveness as tools for improving sustainability within the food system. An overall score will be presented and the ability to see the score on all 13 KPIs will exist so that the student can see in which aspects they are lagging, in order to develop and increase the sustainability score. This will be made in accordance to the presentation of KPI results seen in the literature study earlier presented, by presenting the results in a radar chart. The center of the radar chart, or as more commonly known, the center of the spider web chart, will be equal to 0 % and the outer edge of the chart is 100 %. Consequently, will the individual's results be easy to understand and grasp as well as it will be easy to see which part of one's habits needs improvement. The six categories will outline the radar chart, for increased understanding of the different aspects of sustainability. Besides the importance of visual representation, it is important to consider how the KPIs are phrased. The KPIs should be phrased based on their audience, in this case students, but as well to encourage change (Anderson, 2013). Therefore, the questions will be phrased as questions for the end user to answer. Electrolux truly emphasized the importance of learning more about the individual as well as the individual learning more about sustainability, as presented in Focus Area 4. To capture the aspect of learning and understanding sustainability, the KPIs communication strategy are to be self-explanatory. The purpose of the KPIs is to create holistic measurement of sustainability, and consequently make it possible to increase sustainability. Therefore, the strategy is to make the KPIs presented in ways where they encourage the user towards increased sustainability. Additionally, the students were interested in becoming more aware of their CO2 emissions, and to eat healthier. These findings are important and should be communicated by the KPIs to align with the stakeholders. Moreover, Electrolux emphasized the importance of sustainable diets and making the individual understand their own habits. Therefore, will some of the KPIs be weighted twice when calculating the final sustainability ranking to align with stakeholders, and will consequently be communicated as more important. When selecting which of the 13 KPIs to weigh twice in accordance to the stakeholders’ interest, the KPIs regarding lessening GHG emissions, increasing health and having more sustainable diets will be chosen. The KPIs that are the closest to their interests are KPI number 4 (Type of food and distance it has been transported), number 6 (Recycled waste) and number 11 (Healthy food). This is aligned with the theoretical framework of the Pareto principle, which states 20 % of the actions theoretically stand for 80 % of the outcome (Engwall, Jerbrant, Karlson, Storm, 2017) since 20 % of 13 is close to 3 which represents the number of indicators of which will be weighted twice. Meaning

31
that if the student would change his/her behavior regarding these three KPIs, their overall sustainability would improve. Making three of the KPIs more influential will make the scale be more representative of the actual effects of changing the behavior. Concludingly, to make sure that the final ranking is still within the range of 0-100 % the final sustainability ranking is calculated as an weighted average with the base of 13 + 3 = 16, which represent the 13 KPIs + the extra weight being 3.
"#$%&()(*%#$%+#&#*,-%$.#$/ = %12-%/2(%&&456-2()&*() = (813
1
456-2()&*)/16
The overall and final sustainability ranking provides a metric of how sustainable the student is. In order to further make the results even more intuitive, a color scheme ranging from green to red will be used. The colors are commonly known, and its meaning tends to be easily recognized (Given, Hannigan, McGrath, 2016). See table below for the five different categories of which the final sustainability ranking is presented according to. The purpose of the color scheme is to increase the understanding of the individual’s sustainability ranking. Table 4: Presents the colors representing the final sustainability ranking.
Score How sustainable is the individual
100 % - 81 % Optimal
80 % - 61 % Satisfactory
60 % - 41 % Borderline
40 % - 21 % Unsatisfactory
20 % - 0 % Unacceptable
9. Result The findings in the five Focus Areas has led to the results presented below. The purpose of the KPIs is to create a holistic measurement of sustainability in the food system. 13 KPIs have been created, ranging from 0 - 100 %, whereas 100 % is the wanted outcome. The final sustainability ranking is a calculated average of all 13 KPIs, where three of the KPIs have been weighed twice due to their greater importance. The individual will provide the information needed to answer each of the KPIs, but the algorithm will calculate the final sustainability score.

32
Table 5: Table shows a summary of all final key performance indicators and their index scale.

33
Table 6: Table shows a summary of all questions asked to the end user to determine the KPI result.
The results from each KPI are then presented in a radar chart to provide the user with an understanding of which aspects in their everyday life that could be improved to increase their sustainability ranking. Each of the KPIs are presented as their own aspect in the graph, where 100 % result is on the outer line of the graph. This presentation aims to increase understanding and willingness to improve. The radar chart emphasizes the importance of KPI nr 4, 6 and 11 by adding stars and making the individual understand the importance of gaining and maintaining good scores in these areas.
Figure 8: A fictional example of the KPIs results presented in a radar chart for visual representation

34
The final sustainability ranking is as earlier mentioned calculated through a weighted average:
"#$%&()(*%#$%+#&#*,-%$.#$/ = %12-%/2(%&&456-2()&*() = (813
1
456-2()&*)/16
Figure 9: Shows a scale presenting the individuals final sustainability ranking.
10. Discussion
The purpose of this project was to create holistic KPIs for sustainable food systems adapted to students. The KPIs aim to measure and quantify sustainability from three perspectives; environmental, economic and social sustainability. This study is a part of a larger project collaboration between KTH Live-in Lab and Electrolux on sustainable food systems. The aim of the larger project is to define a service development methodology as well as creating a data driven service towards clients, in which the KPI presented in this study potentially could be integrated. This study aimed to find a way to measure sustainability and provide the end user with one final sustainability ranking. The framework used was mainly the concept of three aspects of sustainability as well as using a soft system dynamics (SSD) to model the food system. The food system in this study consists of four categories; the individual, the kitchen, the grocery stores and the world. The study’s scope mainly focused on the individual and the kitchen, in order to create suitable KPIs of which the individual can control. The methodology used consisted of Lakin Andersson five Focus Areas created to develop sustainable development indicators for municipalities. Anderson’s methodology was adapted to the food system presented in this study, in order to create holistic KPIs. The project resulted in 13 KPIs measuring the individual’s sustainability in regard to the food system, concluded as a final sustainability ranking. The final sustainability ranking is the average of the 13 KPI scores. The score for all 13 KPIs ranges between 0-100 %, where 100% represent the wanted outcome and the highest sustainability score. The 13 KPIs are categorized through the six categories; electricity usage, water usage, GHG emissions, waste management, well-being and expenses. Three of the 13 KPIs have been identified with higher importance, both due to the stakeholders’ interests and aspiration with the KPIs, but as well as their greater contribution to sustainability. Because of this, these three KPIs have been weighed twice in the calculation of the final sustainability ranking.

35
Out of the 13 KPIs presented in this study, the majority of them focus on the environmental aspect, five of the KPIs focus on the social aspect and only one KPI focuses on the economic aspect of sustainability. That sectioning can be found natural because due to the food systems considerably large role in the causing GHG emissions, as presented earlier in the project, and it is because of that the KPIs have a greater weight in environmental KPIs. The economic aspect of sustainability is the one aspect that receives least attention in terms of KPIs, this is because the economic aspect is often interconnected with the other aspects. For example, if the kitchen appliances are used in a more energy optimal way the electricity bill will automatically decrease, which will positively affect the economic sustainability. In the same way, if groceries are optimized, less food will be thrown away which, as well, will have a positive impact on the economic aspect. In the end, all three aspects of sustainability have been considered and included into the KPIs to get a holistic result. There exist many methods to calculate a person's sustainability index, many in form as applications but other as websites. To name a few Swedish examples, the application Deedster and the two websites klimatkalkylatorn.se created by World Wildlife Fund (WWF) and klimatkontot.se created by Konsumentverket. These three examples calculate the users average CO2 equivalents (CO2e) per year and their aim is beyond the food system and all three examples mentioned include for example flights and non-food consumption (WWF, n.d.; IVL, n.d.; Deedster, n.d.). The user is then provided with a final value for their CO2e emissions per year and the services compares the result with the average swede and the global average, but as well with the “goal” level for CO2e emissions in order to meet Agenda 2030 and keep the temperature increase below two degrees (United Nations, n.d.b). All three services provide examples to decrease the users carbon footprint. In addition, the application, Deedster, works as a social network where users can challenge each other and join groups in order to motivate each other (Deedster, n.d.). The main difference between these services and their questions/KPIs used to evaluate sustainability, compared to the KPIs presented in this study, is that the services only consider the environmental aspect of sustainability, and neglect the other two aspects of sustainability. The KPIs presented in this study provide a holistic view of the users sustainability by integrating the economic and social aspects of sustainability. The final result is presented in percentage, e.g. 80 % sustainable, compared to the other three services. Providing the final sustainability rating in terms of percentages gives an easy and quick overview of how sustainable the user is and the need for change is more distinct. Percentages are easier for the user to take in compared to CO2e because the latter is not as familiar as percentages and therefore harder to grasp, and is for the majority of the users incomprehensible if not compared to for example the average user and the goal. It is important that the KPI scale is recognizable for the user and easy to comprehend (Kerzner, 2017), and therefore was the scale chosen to range from 0-100 % in this study. Other studies on measuring sustainability include the amount of organic food an individual eats e.g “Measuring sustainable food consumption: A case study on organic food” (Azzurra, Massimiliano, Angela, 2019) and “Eat organic – Feel good?” (Apaolaza, Hartmann, D'Souz,
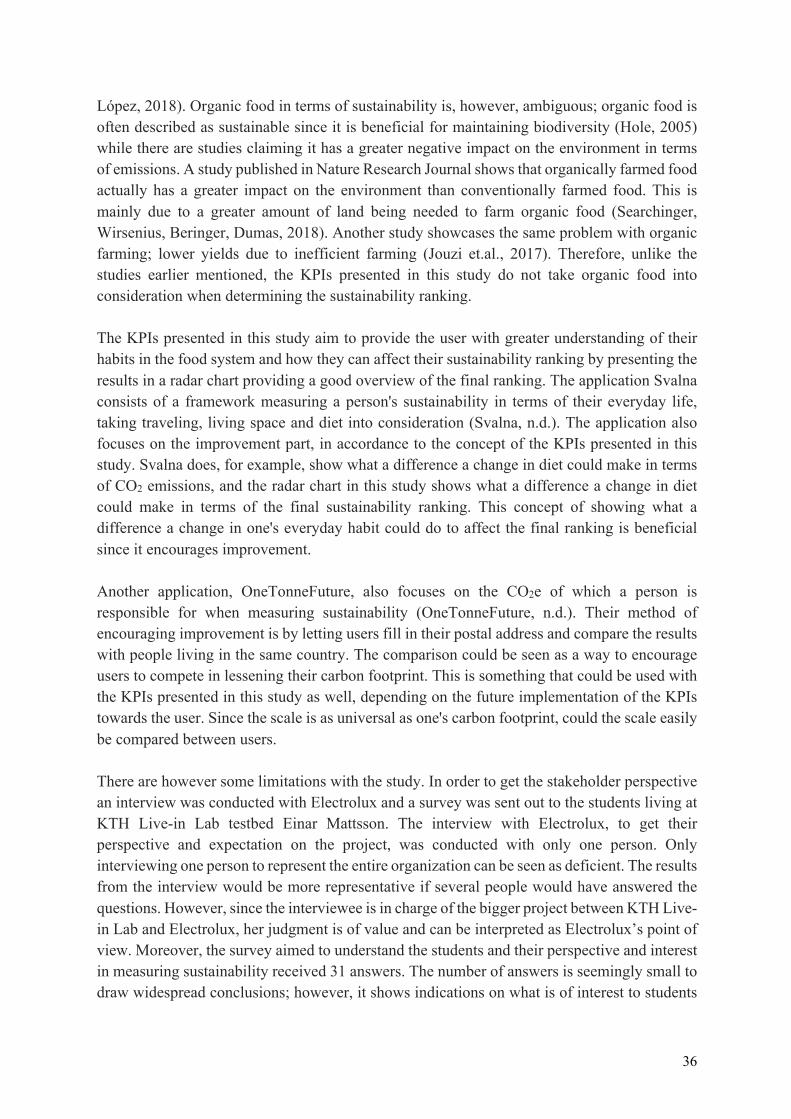
36
López, 2018). Organic food in terms of sustainability is, however, ambiguous; organic food is often described as sustainable since it is beneficial for maintaining biodiversity (Hole, 2005) while there are studies claiming it has a greater negative impact on the environment in terms of emissions. A study published in Nature Research Journal shows that organically farmed food actually has a greater impact on the environment than conventionally farmed food. This is mainly due to a greater amount of land being needed to farm organic food (Searchinger, Wirsenius, Beringer, Dumas, 2018). Another study showcases the same problem with organic farming; lower yields due to inefficient farming (Jouzi et.al., 2017). Therefore, unlike the studies earlier mentioned, the KPIs presented in this study do not take organic food into consideration when determining the sustainability ranking. The KPIs presented in this study aim to provide the user with greater understanding of their habits in the food system and how they can affect their sustainability ranking by presenting the results in a radar chart providing a good overview of the final ranking. The application Svalna consists of a framework measuring a person's sustainability in terms of their everyday life, taking traveling, living space and diet into consideration (Svalna, n.d.). The application also focuses on the improvement part, in accordance to the concept of the KPIs presented in this study. Svalna does, for example, show what a difference a change in diet could make in terms of CO2 emissions, and the radar chart in this study shows what a difference a change in diet could make in terms of the final sustainability ranking. This concept of showing what a difference a change in one's everyday habit could do to affect the final ranking is beneficial since it encourages improvement. Another application, OneTonneFuture, also focuses on the CO2e of which a person is responsible for when measuring sustainability (OneTonneFuture, n.d.). Their method of encouraging improvement is by letting users fill in their postal address and compare the results with people living in the same country. The comparison could be seen as a way to encourage users to compete in lessening their carbon footprint. This is something that could be used with the KPIs presented in this study as well, depending on the future implementation of the KPIs towards the user. Since the scale is as universal as one's carbon footprint, could the scale easily be compared between users. There are however some limitations with the study. In order to get the stakeholder perspective an interview was conducted with Electrolux and a survey was sent out to the students living at KTH Live-in Lab testbed Einar Mattsson. The interview with Electrolux, to get their perspective and expectation on the project, was conducted with only one person. Only interviewing one person to represent the entire organization can be seen as deficient. The results from the interview would be more representative if several people would have answered the questions. However, since the interviewee is in charge of the bigger project between KTH Live-in Lab and Electrolux, her judgment is of value and can be interpreted as Electrolux’s point of view. Moreover, the survey aimed to understand the students and their perspective and interest in measuring sustainability received 31 answers. The number of answers is seemingly small to draw widespread conclusions; however, it shows indications on what is of interest to students

37
and if they are willing to change their behavior to become more sustainable. In other words, is the result from the survey still considered valuable. Another limitation with the study is the fact that some of the KPIs are based on self-evaluation. The self-evaluation part makes the measurements subjective, since it is in the eye of the beholder. This means that, for example, one individual's perceived influence from food trends could be less prominent than another individual's perceived influence from food trends, but both are self-evaluating the influence equally on the sustainability scale. This requires self-reflection, everyone is not aware that trends and food norms affect the behavior and choice of eating habits. This means that influence from food trends can be neglected due to lack of self-reflection. This is, however, considered acceptable in this study due to the fact that social sustainability is strongly connected to the well-being of the individual, and therefore makes the perceived feeling of influence the cardinal aspect of sustainability. Moreover, does most of the KPIs require a self-conducted analysis of one's food system, such as cooking method and choice of transport to the grocery store. In other words, are these KPIs hard to automatically measure with today's technology and requires the user to manually fill in the information and measure sustainability. The implementation part of the KPIs are, however, outside the scope of the study and have therefore not been investigated further. The presented KPIs assume that there is willingness from the user to manually measure and evaluate his/her sustainability. One could argue that a more automated set of indicators would be better than self-monitoring, but several applications like Deedster and OneTonneFuture earlier mentioned also assume that there is willingness from the user to fill in their data manually (OneTonneFuture, n.d.; Deedster, n.d.). This is also aligned with the results from the survey presented in this study Focus Area 4 where the results showed that the majority of students wanted help monitoring their habits. Moreover, they were interested in decreasing their CO2 emissions, which further strengthen the thesis of students actually wanting to monitor and manually use the application. Another limitation with the self-monitoring is that it makes the KPIs subjective. The KPIs could have been measured in absolute values instead, e.g 100 kWh electricity usage per week would be seen as unsustainable etc. The perks with this type of measuring is that it allows a more objective way to measure sustainability without the aspects of self-evaluation. The disadvantages are, however, that it may be harder to grasp. Using more descriptive measurements could make the KPIs more applicable to a larger crowd. The decision behind not using absolute values as limits in this study when conducting the KPIs is that it is often hard to buy new, more electricity efficient kitchen appliances as a student, but everyone can use the existing appliances in a more energy efficient way and consequently use less electricity. Additionally, the methodology used to create the KPIs is created through Focus Areas of which were initially made to create sustainable development indicators (SDIs). This means that the methodology originally was created for larger systems such as municipalities, and not for a food system mainly surrounding the kitchens and the individual. The framework is, however, created with sustainability indicators in mind and was therefore possible to adjust to this study´s

38
food system. But it could have been beneficial to use a framework surrounding the human being and more soft values instead. This is a limitation of the study of which could be interesting to further evaluate by comparing it to a future study conducting KPIs in the food system by using another methodology.
In the future, it would be interesting to investigate how these KPIs should be implemented towards the user; should the measurements be done through a phone application or through an AI-based software monitoring the actions performed in the kitchen? As of today, the initial thought, as earlier mentioned, is that the individual will contribute with the information needed, e.g what the individual ate for dinner and then let the system calculate the sustainability ranking in accordance to the KPIs presented in this study. But looking ahead, it would be beneficial to analyze ways to further integrate the KPIs into automatic systems measuring the actions. The advantages of creating an AI-based software that monitors is that some of sustainability evaluation happens automatically. Which is more beneficial, because the human error factor behind filling in the different sustainability metrics is too high. It is easy to forget, manipulate data to achieve a higher score and it is easy to lose interest if the ranking requires that extent of input and work. Further work can be done on how to automatically measure the metrics in the students everyday life and therefore decreasing the effort needed from each individual. However, it can also be useful to conduct a further analysis on creating effective incentives. This project's scope does not include the implementation part of the KPIs, but a critical part of making the KPIs useful is to integrate them with efficient incentives for the students. There must exist incentives that are targeted for the audience in order for them to make the effort, of not only putting data in, but as well as improving their sustainability. To further exemplify this, a competition between neighbors with rewards could be provided to create incentives for the students. This is in other words, a part of the KPIs that should be further investigated in the future. To continue this work and make the KPIs more dependent, there needs to be more work done to make the KPIs less subjective. The KPIs that are the most subjective and therefore can cause problems and make sustainability rating less reliable are the KPIs concerning well-being. This problem is rooted back to the definition of social sustainability. The definition is to some extent subjective which affects the subjectivity of the KPIs. To further improve the KPIs, the suggestion is to work with trying to create a more objective definition of social sustainability and thus creating more objective KPIs. On the other hand, more work can be done creating more effective measuring methods, which in some extent can remove the human factor.
39
11. Conclusion The purpose of this study was to create holistic KPIs for sustainable residential food systems adapted to single student tenants. The KPIs aim to measure and quantify sustainability from three perspectives; environmental, economic and social sustainability. The conclusion is that the presented 13 KPIs measure the sustainability of the residential food system by focusing on electricity usage, water usage, GHG emissions, waste management, well-being and expenses. The resulting indicators are as follows; (1) Cooking optimization, (2) Number of meals per cooking session, (3) Dishwashing efficiency, (4) Food sustainability, (5) Sustainable transports, (6) Recycled waste, (7) Grocery optimization, (8) Influence on eating company, (9) Influence on food choice, (10) Positive influence from food trends, (11) Healthy food, (12) Enjoyable food and (13) Food affordability. The target group, aimed to use the KPIs, consist of students living in Sweden, and the KPIs are therefore adjusted for a student’s lifestyle. The KPIs range from 0-100 %, and a final sustainability ranking is provided through a weighted average of the 13 indicators. The indicators are presented in a radar chart to increase awareness of the students' everyday habits and aim to encourage improvement to increase their sustainability ranking.

40
12. References Afgan, N.H, Carvalho, M.G., Hovanov, N.V. (2000) Energy system assessment with
sustainability indicators. Energy Policy, 28, 603-612 https://www-sciencedirect-com.focus.lib.kth.se/science/article/pii/S030142150000 0458#BIB9
Anderson, Lakin. (2013) Measuring Sustainable Cities: An approach for assessing municipal-level sustainability indicator systems in Sweden. Uppsala Universitet. http://www.diva-portal.org/smash/get/diva2:658303/FULLTEXT01.pdf
Anthony, R.N., Govindarajan, V., Hartmann F.G., Kraus, K and Nilsson, G. (2007)
Management Control Systems, 12th ed. Boston: McGraw-Hill/Irwin. Apaolaza, V., Hartmann, P., D'Souz, C., López, C.M. (2018) Eat organic – Feel good? The
relationship between organic food consumption, health concern and subjective wellbeing Food Quality and Preference, 63, 51-62 https://www-sciencedirect-com.focus.lib.kth.se/science/article/pii/S0950329317 3017 2#b0020
Avfall Sverige (2018), Swedish Waste Management 2018. Retrived from
https://www.avfallsverige.se/fileadmin/user_upload/Publikationer/Avfallshantering_2018_EN.pdf
Azzurra, A., Massimiliano, A., Angela, M. (2019) Measuring sustainable food consumption:
A case study on organic food Sustainable Production and Consumption, 17, 95-107 https://www-sciencedirect-com.focus.lib.kth.se/science/article/pii/S23525509183 02070
Batat, W.,Peter, P., Moscato, E., Castro, L., Chan, S., Chugani, S., Muldrowe, A. (2019) The
experiential pleasure of food: A savoring journey to food well-being. Journal of Business Research Volume 100, 392-399. https://doi.org/10.1016/j.jbusres.2018.12.024.
Birnbacher, D., Thorseth, M. (2015). The Politics of Sustainability: Philosophical
perspectives, Routledge Centre for Sustainable Energy through OVO Energy (2015) How to save energy and money
in the kitchen, retrieved 2020-04-15 https://www.ovoenergy.com/blog/lifestyle/how-to-save-energy-and-money-in-the-kitchen.html
Chrisinger, B.W., Kallan, M.J., Whiteman, E.D, Hillier, A. (2018) Where do U.S. households
purchase healthy foods? An analysis of food-at-home purchases across different types of retailers in a nationally representative dataset Preventive Medicine, 112, 15-22 https://www-sciencedirect com.focus.lib.kth.se/science/article/pii/S009174351830104X

41
Danesi, G. (2012). Pleasures and Stress of Eating Alone and Eating Together among French
and German Young Adults. Menu. The journal of Eating and Hospitality Research. 1. 77-91. https://www.researchgate.net/publication/261361727_Pleasures_and_Stress_of_Eating_Alone_and_Eating_Together_among_French_and_German_Young_Adults
Deedster, (n.d.) version 2.0.10, Swedish Development Group 12 AB, [mobile application]
retrieved 2020-04-28 https://apps.apple.com/us/app/deedster/id1241207086
Demartini, M. Pinna, C., Tonelli, F., Terzi S., Sansone, C., Testa, C. (2018) Food industry
digitalization: from challenges and trends to opportunities and solutions IFAC-PapersOnLine, 51, Issue 11, 1371-1378 https://www-sciencedirect-com.focus.lib.kth.se/science/article/pii/S2405896318314617
EAT-Lancet, (2019) Systems Summary Report of the EAT Lancet-commission on Healthy
Diets From Sustainable Food Systems. https://eatforum.org/content/uploads/2019/07/EAT-Lancet_Commission_Summary_Report.pdf
Ekonomifakta (2020) Elproduktion, retrieved 2020-04-16
https://www.ekonomifakta.se/fakta/energi/energibalans-i-sverige/elproduktion/ Electrolux, (2020) Electrolux Annual Report 2019 https://www.electroluxgroup.com/en/wp-
content/uploads/sites/2/2018/12/electrolux-annual-report-2019.pdf Elskling AB, n.d, Energispartips, retrieved 2020-04-15
https://www.elskling.se/energispartips/koket/ Energirådgivningen, (2018) Faktablad Hushållsel. https://energiradgivningen.se/lagenhet/el-i-hemmet Energirådgivningen, (2017) Kök & Matlagning, retrieved 2020-04-15
https://energiradgivningen.se/smahus/kok-matlagning Engwall, E., Jerbrant, A. Karlson, B. Storm, P. (2017) Modern industriell ekonomi, (1. Ed.)
Studentlitteratur European Commission, (n.d.a). Stop food waste, retrieved 2020-03-14
https://ec.europa.eu/food/safety/food_waste/stop_en European Commission, (n.d.b). Food Waste, retrieved 2020-03-14
https://ec.europa.eu/food/safety/food_waste_en [1] European Commission, (2012) Kitchen sink study points the way to water conservation,
European Commission DG Environment News Alert Service, edited by SCU, The University of the West of England, Bristol. https://ec.europa.eu/environment/integration/research/newsalert/pdf/284na4_en.pdf

42
E.ON, (n.d). Lilla energisparboken, retrieved 2020-04-15 https://www.ystad.se/globalassets/dokument/lou/avd-f-strat-miljoarb/lilla-energisparboken.pdf
FAO Food and Agriculture Organization of the United Nations (2015). Food wastage
footprint & Climate Change http://www.fao.org/3/a-bb144e.pdf
FAO Food and Agriculture Organization of the United Nations, (2019). Sustainable healthy
diets: Guiding principles, World Health Organization. Food & Agriculture Org. Fatemi, A. Glaum, M., Kaiser, S. (2018) ESG performance and firm value: The moderating
role of disclosure Global Finance Journal, 38, 45-64 https://www-sciencedirect-com.focus.lib.kth.se/science/article/pii/S1044028316300680
Fiala, N. (2008) Meeting the demand: An estimation of potential future greenhouse gas
emissions from meat production, Ecological Economics, 67, Issue 3, 412-419 https://www.sciencedirect.com/science/article/pii/S0921800907006180
Fitz-Gibbon, C.T, (2019) Performance Indicators, Bera Dialogues Number 2
https://books.google.se/books?id=uxK0MUHeiI4C&printsec=frontcover&hl=sv#v=onepage&q&f=false
Fox, N., Ward, K. (2008) You are what you eat? Vegetarianism, health and identity. Social
science & medicine. https://www.sciencedirect.com/science/article/abs/pii/S027795360800097X
French, S.A., Wall, M. & Mitchell, N.R. (2010) Household income differences in food
sources and food items purchased. Int J Behav Nutr Phys Act 7, 77. https://doi.org/10.1186/1479-5868-7-77
Garnett, T. (2011). Where are the best opportunities for reducing greenhouse gas emissions in
the food system (including the food chain)? Food Policy, 36, Supplement 1, S23-S32 https://www.sciencedirect.com/science/article/abs/pii/S0306919210001132
Given, K., Hannigan, A., McGrath, D. (2016) Red, yellow and green: What does it mean?
How the progress test informs and supports student progress, Medical Teacher, 38:10, 1025-1032, DOI: 10.3109/0142159X.2016.1147533
Harvard University Center for Environment, n.d. Social Movements and Climate Change,
retrieved 2020-03-15 https://environment.harvard.edu/news/huce-headlines/social-movements-and-climate-change
Heldt, B., Matteis, T., von Schmidt, A., Heinrichs, M. (2019). Cool but dirty food? –
Estimating the impact of grocery home delivery on transport and CO2 emissions including cooling, Research in Transportation Economics. https://doi.org/10.1016/j.retrec.2019.100763 .
43
Helmi Risku-Norja, Sirpa Kurppa, Juha Helenius,. (2009). Dietary choices and greenhouse gas emissions - Assessment of impact of vegetarian and organic options at national scale. Progress in Industrial Ecology – An International Journal. 6. 340-354. 10.1504/PIE.2009.032323.
Hole, D.G., Perkins, A.J., Wilson, J.D., Alexander, I.H., Grice, P.V, Evans, A.D. (2005) Does
organic farming benefit biodiversity? Biological Conservation, 122, Issue 1, 113-130 Holder, M.D. (2019) The Contribution of Food Consumption to Well-Being, The University
of British Columbia, Kelowna, BC https://www.karger.com/Article/FullText/499147
HSB (n.d.) Att bo i hyresrätt, retrieved 2020-04-15
https://www.hsb.se/om-boende/bokunskap/din-bostad/att-bo-i-hyresratt/ IVA Kungl. Ingenjörsvetenskapsakademien (2016) Framtidens elanvändning: En delrapport.
https://www.iva.se/globalassets/info-trycksaker/vagval-el/vagvalel-framtidens-elanvandning-delrapport.pdf
IVL Svenska miljöinstitutet, Klimatkontot. Retrieved 2020-04-28 from
https://www.klimatkontot.se Jouzi, Z., Azadi, H., Taheri, F., Zarafshani, K., Gebrehiwot, K., Van, S. et. al. (2017)
Organic Farming and Small-Scale Farmers: Main Opportunities and Challenges, Ecological Economics, 132, 144-154 https://www-sciencedirect-com.focus.lib.kth.se/science/article/pii/S0921800915306212
Kerzner, H. (2017) Project Management Metrics, KPIs, and Dashboards: A Guide to
Measuring and Monitoring Project Performance, John Wiley & Sons Kreith, F., Goswami, D.Y. (2016) Energy Management and Conservation Handbook, Second
Edition, chapter 5.3.6 Cooking, CRC Press, 2016. KTH Live-In Lab, (2020). Our value propositions, retrieved 2020-03-04
https://www.liveinlab.kth.se/en/om-kth-live-in-lab/vara-vardeerbjudanden-1.894654
Li, J., Kim, C. (2020) Exploring relationships of grocery shopping patterns and healthy food accessibility in residential neighborhoods and activity space Applied Geography, 116, https://www-sciencedirect-com.focus.lib.kth.se/science/article/pii/S0143622819305776#bib80
Martins, A.A., Mata, T.M., Costa, C.A.V., Sikdar, S.K. (2007) Framework for Sustainability
Metrics. Industrial & Engineering Chemistry Research, 46, 2962-2973 DOI:10.1021/ie060692l
Meadows, D. A Philosophical Look at System Dynamics, videotaped lecture from 1977,
published 2017. Dartmouth College, Hanover https://www.youtube.com/watch?v=XL_lOoomRTA&feature=youtu.be

44
Miller, P., De Barros, A., Kattan, L., Wirasinghe, S.C. (2016). Public transportation and sustainability: A review. KSCE Journal of Civil Engineering. 20. p. 7
Missimer, M., Robèrt, K.H., Broman, G., (2017) A strategic approach to social sustainability
- Part 2: a principle-based definition, Journal of Cleaner Production, 1, 42-52 http://dx.doi.org/10.1016/j.jclepro.2016.04.059
Neacsu, M., McBey, D., Johnstone, A. (2017) Meat Reduction and Plant-Based Food:
Replacement of Meat: Nutritional, Health, and Social Aspects, Sustainable Protein Sources, 359-375 https://www-sciencedirect-com.focus.lib.kth.se/science/article/pii/B9780128027783000226
OneTonneFuture, (n.d.) version 3.2.1, Vattenfall AB [mobile application] retrieved 2020-05-
01 https://apps.apple.com/se/app/onetonnefuture/id1375424918 Owen, P. (2012) Powering the Nation: Household electricity-using habits revealed, Energy
Saving Trust Parmenter, D. (2015) Key Performance Indicators: Developing, Implementing, and Using
Winning KPIs, (3. Ed.) John Wiley & Sons. Paulo, V. (2009) Happiness, freedom and control Journal of Economic Behavior &
Organization, 71, Issue 2, 146-161 https://www-sciencedirect-com.focus.lib.kth.se/science/article/pii/S0167268109001164?via%3Dihub
Robert, G. (1995) The Concept of Environmental Sustainability, Environment Department,
The World Bank, Washington, DC https://www.annualreviews.org/doi/pdf/10.1146/annurev.es.26.110195.000245
Röös, E., Ekelund, L., Tjärnemo, H., (2014) Communicating the environmental impact of
meat production: challenges in the development of a Swedish meat guide, Journal of Cleaner Production, 73, 154-164 https://www.sciencedirect.com/science/article/pii/S0959652613007191
Schepers, J., Annemans, L. (2018) The potential health and economic effects of plant-based
food patterns in Belgium and the United Kingdom, Nutrition, 48, 24-32 https://www-sciencedirect com.focus.lib.kth.se/science/article/pii/S0899900717302861
Searchinger, T.D., Wirsenius, S., Beringer, T., Dumas, P. (2018) Assessing the efficiency of
changes in land use for mitigating climate change Nature, 564, 249–253 https://www.chalmers.se/en/departments/see/news/Pages/Organic-food-worse-for-the-climate.aspx
Shahin, A., Mahbod, M.A. (2007) Prioritization of key performance indicators: An
integration of analytical hierarchy process and goal setting. International Journal of Productivity and Performance Management.

45
Siew, R. (2017) Sustainability. We know it matters, but how do we measure it? World Economic Forum. https://www.weforum.org/agenda/2017/09/struggling-to-measure-sustainability/
Sifo (2018) Vegotrenden 2018: Mer och allt oftare. AxFood retrieved 2020-03-18
https://www.axfood.se/media-och-opinion/pressmeddelanden/2018/10/vegotrenden-2018-mer-och-allt-oftare/
Sikdar, S.K. (2004) Sustainable development and sustainability metrics, Office of Research
and Development, United States Environmental Protection Agency (EPA) https://aiche.onlinelibrary.wiley.com/doi/10.1002/aic.690490802
Soliah, L.A.L., Walter, J., Sheila, A.J, (2012). Benefits and Barriers to Healthful Eating:
What Are the Consequences of Decreased Food Preparation Ability?. American Journal of Lifestyle Medicine. 6. 152-158.
Spangenberg, J.H. (2015) Economic sustainability of the economy: concepts and indicators,
Int. J. Sustainable Development, 8, Nos. 1/2, 2005 Sustainable Europe Research Institute Bad Oeynhausen http://base.socioeco.org/docs/sustainabilityindicators.pdf
Stead, M., McDermott, L., Mackintosh, A., Adamson, A. (2011) Why healthy eating is bad
for young people's health: Identity, belonging and food. Social science & medicine https://www.sciencedirect.com/science/article/abs/pii/S0277953611000876
Steinfeld, H., Gerber, P., Wassenaar, T. D., Castel, V., Rosales, M., Rosales, M.M. et. al
(2006) Livestock's Long Shadow: Environmental Issues and Options, Food & Agriculture Org
Steiniger, S., Wagemann, E., de la Barrera, F., Molinos-Senante, M., Villegas, R., de la
Fuente, H. et. al. (2020) Localising urban sustainability indicators: The CEDEUS indicator set, and lessons from an expert-driven process https://www-sciencedirect-com.focus.lib.kth.se/science/article/pii/S0264275118305523#bb0030
Strohmeier, D., Tenenbaum, H. R. (2019). Young People's Visions and Worries for the
Future of Europe. Routledge, Sung, K., Cooper, T., Kettley, S. (2018). Emerging Social Movements for Sustainability:
Understanding and Scaling Up Upcycling in the UK. The Palgrave Handbook of Sustainability, Publisher, 299-312 https://www.researchgate.net/publication/324874940_Emerging_Social_Movements_for_Sustainability_Understanding_and_Scaling_Up_Upcycling_in_the_UK
Svalna (n.d.) version 3.3.9, Svalna AB, [mobile application] retrieved 2020-05-01
https://apps.apple.com/se/app/svalna/id1453075184 Svensk Dagligvaruhandel, (2020) 3,1 procents tillväxt för dagligvaruhandeln helåret 2019,
retrieved 2020-04-29 https://via.tt.se/pressmeddelande/31-procents-tillvaxt-for-dagligvaruhandeln-helaret
2019?publisherId=3235444&releaseId=3269761

46
Svenskt vatten (2019) Dricksvattenfakta, retrieved 2020-04-16
https://www.svensktvatten.se/fakta-om-vatten/dricksvattenfakta/ Swedish Food Agency (2019) The Keyhole, retrieved 2020-04-30
https://www.livsmedelsverket.se/en/food-and-content/labelling/nyckelhalet Székely, F., Knirsch, M., (2005) Responsible Leadership and Corporate Social
Responsibility:: Metrics for Sustainable Performance European Management Journal, 23, Issue 6, 628-647 https://www-sciencedirect-com.focus.lib.kth.se/science/article/pii/S0263237305001131#fn23
Trafikverket (2019) Jämför färdmedel - bil, flyg, tåg och buss, retrieved 2020-06-03
https://www.trafikverket.se/for-dig-i-branschen/miljo---for-dig-i-branschen/energi-och-klimat/jamfor-trafikslag/
United Nations, (n.d.a). Sustainable Development Goals, retrieved 2020-02-27
https://sustainabledevelopment.un.org/?menu=1300 United Nations, (n.d.b). Climate Change, retrieved 2020-02-27
https://www.un.org/en/sections/issues-depth/climate-change/ United Nations, (1987). Our Common Future; Brundtland Report
https://www.are.admin.ch/are/en/home/sustainable-development/international- coopertion/2030agenda/un-_-milestones-in-sustainable-development/1987-- brundtla d-report.html
Wakeland W., Cholette S., Venkat K. (2012) Food transportation issues and reducing carbon
footprint. Green Technologies in Food Production and Processing. Food Engineering Series. Springer, Boston, MA, 211-235 https://www.cleanmetrics.com/pages/Ch9_0923.pdf
Weber, C.L, Matthews, H.S, (2008) Food-Miles and the Relative Climate Impacts of Food
Choices in the United States, Environmental Science & Technology, 42 (10), 3508-3513 DOI: 10.1021/es702969f
WSP Sverige AB, (2020) Sverige och 20-talets vattenutmaningar
https://www.wsp.com/sv-SE/insikter/sverige-och-20-talets-vattenutmaningar WWF, Stockholm Environment Institute. Klimatkalkylatorn. Retrieved 2020-04-28 from
https://klimatkalkylatorn.se/

47
13. Appendix
1. Are you willing to improve your lifestyle towards more sustainability?
2. Would you like to improve your food habits and eat more healthy?
3. Would you like to have a help to monitor your cooking habits? (both individual health and environmental aspects)
4. Would you like to know more how your everyday activities impact CO2 emmisions?
Yes No Yes YesYes Yes No YesYes Yes Yes YesYes Yes Yes YesYes Yes No NoYes Yes Yes NoMaybe No No NoMaybe Maybe No YesYes Yes Yes YesYes No No YesYes Yes Yes YesYes Yes Yes YesYes No Yes YesYes Yes Yes YesYes Yes Yes YesYes Maybe Yes YesYes Yes Yes YesYes Maybe Yes NoYes No Yes YesYes Yes Yes YesYes Yes No YesMaybe Yes Yes YesMaybe No Yes YesYes Maybe Yes YesYes Yes Yes YesYes No No NoYes Yes No NoMaybe Maybe Yes YesYes Yes No YesYes Yes No YesYes Yes Yes Yes

TRITA ITM-EX 2020:111
www.kth.se
Related Documents