NA 0 00 40 P; u SA CONTRACTOR REPORT NASA CR-61 . ;7 ! \- . LQAN COPY: REtTURN TO AFWL (WLIL-2) KIRTLAND AFB, N MEX STUDY OF ELECTROLYTIC DISSOCIATION OF CO,-H,O USING A SOLID OXIDE ELECTROLYTE by J. Weissbnrt nnd W. H. Smwt P?zpzred b-y LOCKHEED MISSILES CL SPACE COMPANY Palo Alto, Calif. for Ames Resemcb Center NATIONAL AERONAUTICS AND SPACEADMINISTRATION l WASHINGTON,D. c. . FEBRUARY 1967

Welcome message from author
This document is posted to help you gain knowledge. Please leave a comment to let me know what you think about it! Share it to your friends and learn new things together.
Transcript
NA
0 00 40
P; u
SA CONTRACTOR
REPORT NASA CR-61 .
;7 ! \- .
LQAN COPY: REtTURN TO AFWL (WLIL-2)
KIRTLAND AFB, N MEX
STUDY OF ELECTROLYTIC DISSOCIATION OF CO,-H,O USING A SOLID OXIDE ELECTROLYTE
by J. Weissbnrt nnd W. H. Smwt
P?zpzred b-y
LOCKHEED MISSILES CL SPACE COMPANY
Palo Alto, Calif.
for Ames Resemcb Center
NATIONAL AERONAUTICS AND SPACE ADMINISTRATION l WASHINGTON, D. c. . FEBRUARY 1967
TECH LIBRARY KAFB, NM
llIllIllUlllllllllllllllllll lllJbO$~‘7
NASA CR-68O
STUDY OF ELECTROLYTIC DISSOCIATION OF C02-H20
USING A SOLID OXIDE ELECTROLYTE
By J. Weissbart and W. H. Smart
Distribution of this report is provided in the interest of information exchange. Responsibility for the contents resides in the author or organization that prepared it.
Prepared under Contract No. NAS 2-2810 by LOCKHEED MISSILES & SPACE COMPANY
Palo Alto, Calif.
for Ames Research Center
NATIONAL AERONAUTICS AND SPACE ADMINISTRATION
For sole by the Clearinghouse for Federal Scientific and Technical Information Springfield, Virginia 22151 - Price $2.50

FOREWORD
The research reported here was performed at the
Lockheed Palo Alto Research Laboratory, Palo Alto,
California, from 6 May 1965 to 6 May 1966, under
Contract No. NAS 2-2810. The work was done by
Dr. J. Weissbart, who was the project leader, Dr.
W. H. Smart, and Mr. L. S. Rowley. Dr. T. Wydeven,
Environmental Control Research Branch, NASA Ames
Research Center, Moffett Field, California, was the
technical monitor.
iii

- _.-_ --
ABSTRACT
Samples of the system (ZrO2)O . 85-x(Ce02)x(CaO)O . 15 in the range x = 0 to
x = 0.45 were prepared from solution and sintered at 1600” C in oxygen. Analysis
by x-ray diffraction indicates that a single-phase solid solution having the fluorite
structure is formed. Replacement of Zr +4 by the large Ce +4 ions produces a linear
increase of the lattice parameter from 5.133i (0 mole % CeO2) to 5.285i (45 mole %
Ce02). A comparison of densities measured pycnometrically with those calculated
from the lattice parameters indicates that the oxygen ion vacancy concentration remains
constant.
AC conductivity measurements were carried out at 400- 1200” C and oxygen partial
pressures of 1 atm (oxygen) to approximately 10 -30 atm (CO/CO, mixtures). From
plots of conductivity versus temperature (log IY vs. l/T) an activation energy of
1.14 eV was found for oxygen ion mobility in the O-45 mole % ceria range corroborat-
ing the constancy of the oxygen ion vacancy concentration.
Below PC2 N 10 -3 atm, an electronic component is present due to the reduction of
Ce +4 to Ce +3 in contrast to zirconia-calcia in the absence of ceria. In this pressure
range each curve of log (T vs. l/T at constant CO/CO, ratio consists of two approxi-
mately linear sections showing a transition from predominately ionic (high T) to
predominately electronic (low T) conductivity. The transition temperature is a function
of the mole % ceria and CO/CO, ratio. The temperature coefficient for electronic
conductivity decreases asymptotically with increasing mole % ceria approaching an
approximately constant value of 0.5 eV at 15 to 30 mole % ceria. Conductivity versus
PO2 isotherms show a constant value of conductivity in the high pressure region,
an increase to a conductivity maximum and then a decrease in u with decreasing
PO in the low pressure region. 2
V
The degree of reduction of Ce +4 to Ce +3 and the increase in oxygen vacancy concen-
tration was measured as a function of T and total ceria by a microweighing technique.
A linear relationship exists between n in CeO, and PC2. For reduced samples
(to 20.4 mole % Ce+3) the fluorite type structure is retained and the lattice param-
eter as a function of mole fraction of Ce +4 and Ce ‘3 found to be
a0 (A) = 5.134 + 0.00338 [ Cet4] + 0.00223 [ Ce+3]
For solid solutions containing Ce +3 5 0.2 (mole fraction) a disorder equilibrium
exists between Ce +4-Ce+3 . ions and oxygen ions, vacancies, and PC2. A value of
-133 kcal/mole O2 was found for the partial molar enthalpy of reaction at CeOl 83.
An equation was derived describing the experimental curves.
A tentative explanation for the appearance of electronic conductivity follows. In the
removal of oxygen from the lattice, electrons are trapped on Ce +4 sites forming
Ce+3. Electronic conduction occurs by a hopping mechanism between Ce +3 and Ce +4
while Zr +4 and Ca +2 are blocking to electron transfer. For a constant value of
ceria, a constant number of continuous paths for possible electron transfer exist
through the structure. Electronic o is proportional to the Ce +3 ion concentration
and to an exponential term containing an activation energy term. At 770” C and
15 mole % ceria, an approximately linear increase in electronic u with increase
of Ce +3 from 0 to 2 mole % takes place. From 2 to 4 mole % the electronic con-
ductivity is approximately constant and with further increase of Ce +3 the u decreases.
This decrease in conductivity is tentatively ascribed to an increase in the oxygen
vacancy concentration leading to a large drop in the ionic conductivity component.
Electrolysis of C02-HZ0 was carried out in a 15 mole % calcia-zirconia tube cell
at temperatures less than 800” C. The CO2 flow rate was varied between 5 and 15
ml/min and current densities of 50, 100 and 150 mA/cm’ for a 1 cm2 electrode area
were used. Runs were made in the absence of water and with additions of from 0.2
to 2.4 ml/min of water vapor to the CO2 stream. The beneficial catalytic influence
vi
of water vapor was demonstrated by an increase of oxygen current efficiency from
19% (no water) to 100% at 785” C and 50 n-A/cm’ and from 15% (no water) to 76%
at 790” C and 100mA/cm2. Because only small additions of water are required,
a calculation of the water shift equilibrium at 730-793” C shows that essentially
only reduction of CO2 should take place.
Cells were also constructed by the use of sealed oxide disks. Electrolysis using
0 and 3 mole 96 ceria disk cells indicate that loss in current efficiency resulting from
the component of electronic conductivity in 3 mole % ceria is compensated by the
lower voltage required.
Electrolysis of 6.5, 10 and 15 mole % ceria disks did not give reproducible values
of oxygen current efficiencies due to a variable back-flow of oxygen. The reasons
for these anomalous results are being investigated. The construction of a one-
eighth man laboratory model CO2 electrolyzer is discussed.
vii

CONTENTS
Section
FOREWORD
ABSTRACT
ILLUSTRATIONS
TABLES
1 INTRODUCTION
2 PREPARATION AND CHARACTERIZATION OF THE MIXED OXIDE SYSTEM tZro2jo . 85-x(Ce02)x(Ca0)o . 15 2.1 Introduction
2.2 Specimen Preparation
2.3 Structure and Phase Relationship
2.4 Electrical Conductivity
2.4.1 Experimental Procedure
2.4.2 Results
2.5 Disorder Equilibrium
2.5.1 Experimental Procedure
2.5.2 Results 2.6 Discussion of Electrical Conductivity and Disorder
Equilibrium
3 ELECTROLYSIS OF C02-H20 MIXTURES
3.1 Zirconia-Calcia Tube Cells
3.1.1 Experimental Results
3. 1.2 Water Shift Equilibrium
3.2 Zirconia-Calcia-Ceria Disk Cells
3.2.1 Apparatus
3.2.2 High-Temperature Seals
3.2.3 Results and Discussion
4 ONE-EIGHTH MAN LABORATORY MODEL CO2 ELECTROLYZER
5 REFERENCES
Page
iii V
X
xii l-1
2-l
2-l
2-3
2-5
2-12
2-12
2-17
2-27
2-27
2-32
2-41
3-l
3-l
3-l
3-7
3- 10
3-10
3-12
3-14
4-l
5-l
ix
ILLUSTRATIONS
Figure Page
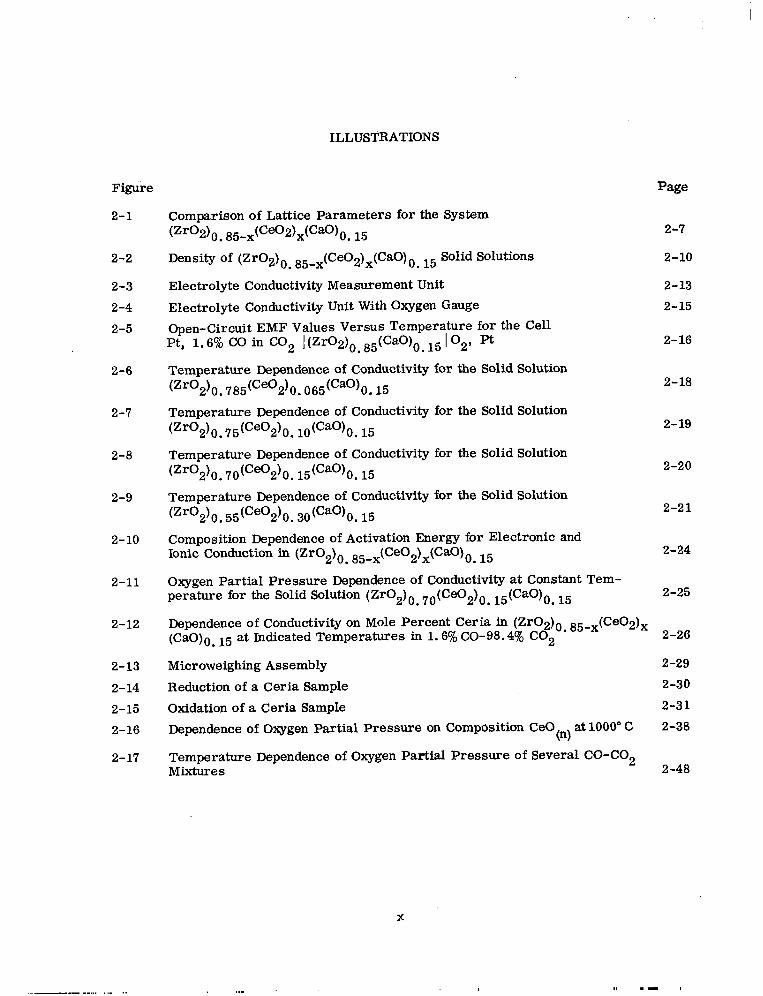
2-l Comparison of Lattice Parameters for the System (Zr02)0. 85-x(c~dx(cao)o, 15 2-7
2-2 mnsity Of (Zro2)om 85-x(Ce02)x(Cao)o, I5 Solid Solutions 2-10
2-3 Electrolyte Conductivity Measurement Unit 2-13
2-4 Electrolyte Conductivity Unit With Oxygen Gauge 2-15
2-5 Open-Circuit EMF Values Versus Temperature for the Cell Pt, 1.6% CO in CO2 I(Zr02)0 85(CaO)o. 15 1 02, Pt 2-16
.
2-6 Temperature Dependence of Conductivity for the Solid Solution
(Zro2)0.785(Ce02)0.065(cao~0,15 2-18
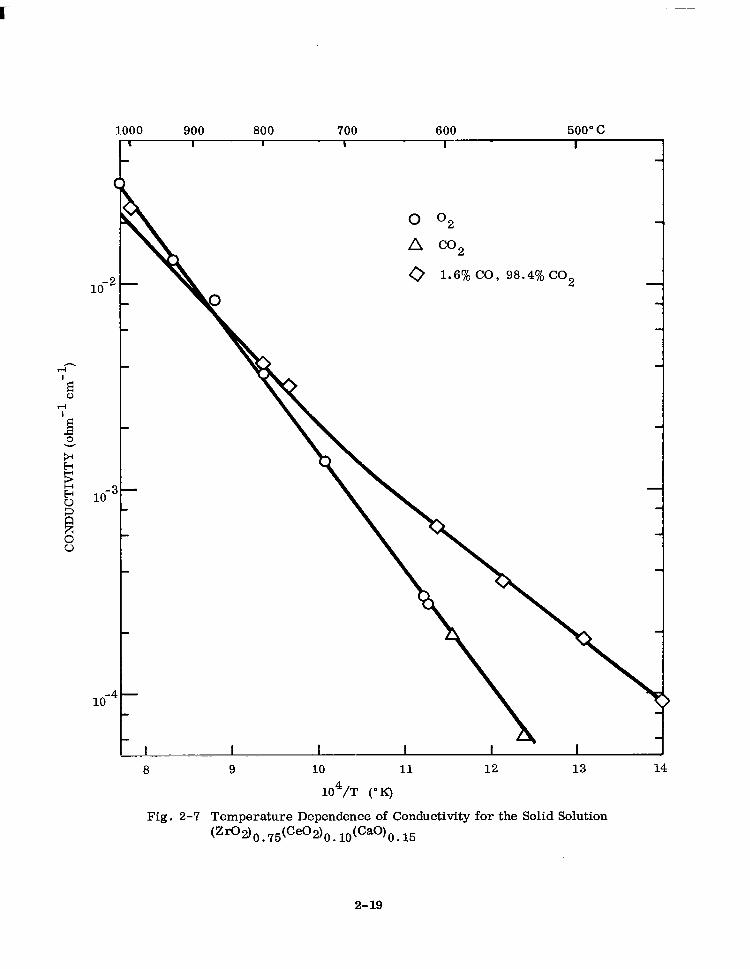
2-7 Temperature Dependence of Conductivity for the Solid Solution
(zro2)0.75(Ce02)0. 10(Ca0)0.15 2-19
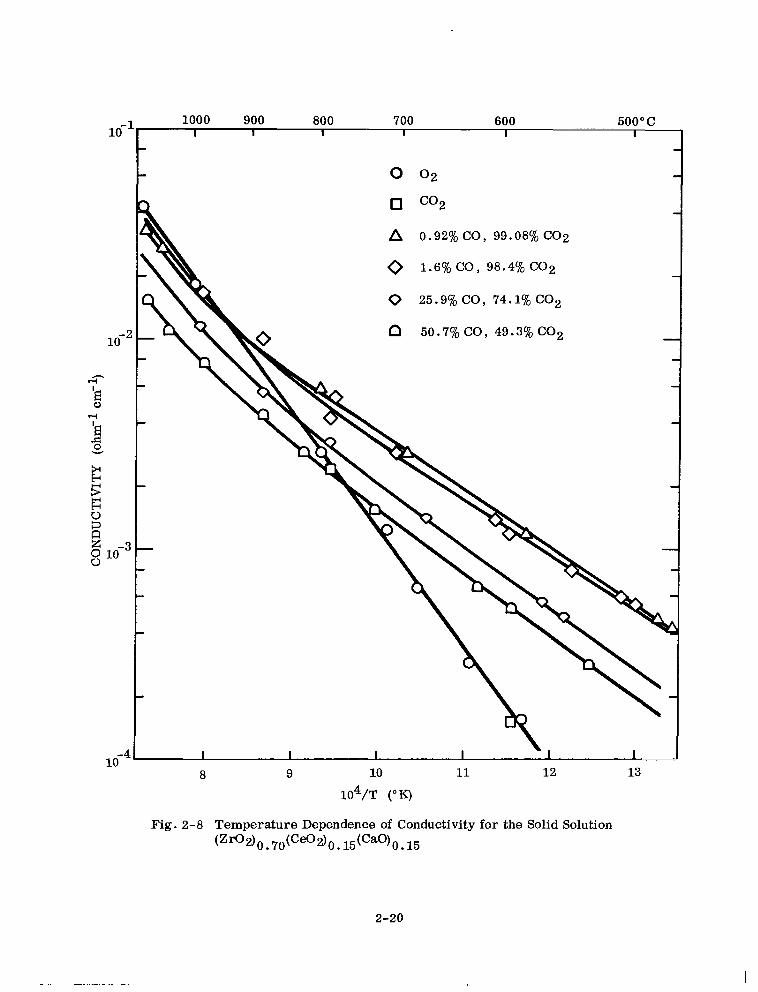
2-8 Temperature Dependence of Conductivity for the Solid Solution
(Zr02)0.70(Ce02)0.15(Ca0)0.15 2-20
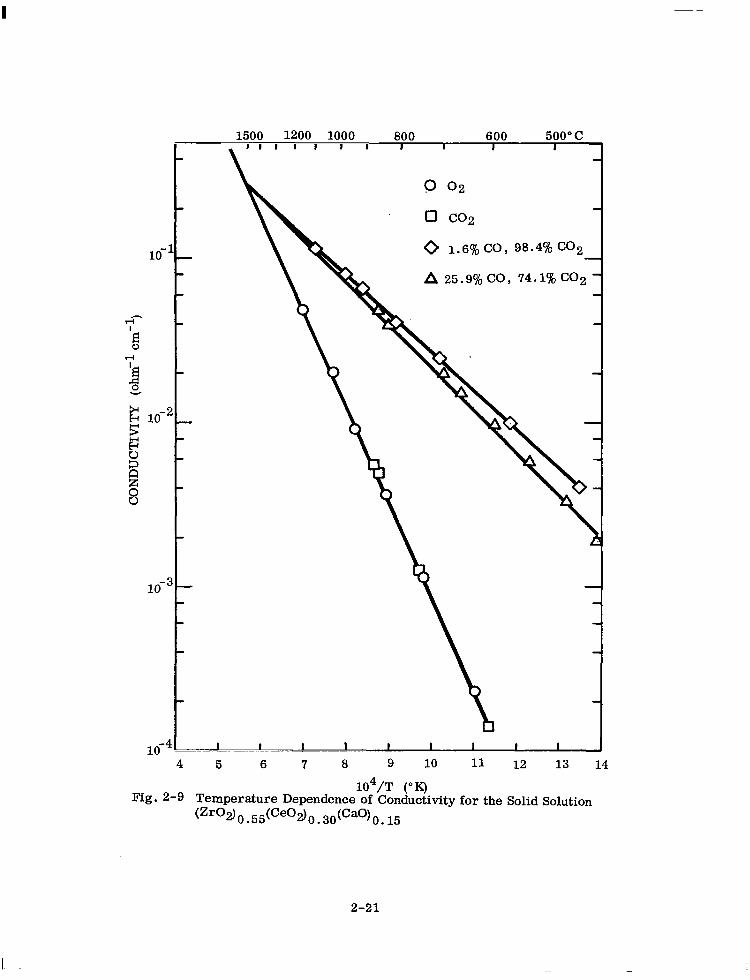
2-9 Temperature Dependence of Conductivity for the Solid Solution
(zro2)0.55(ceo2)0.30(Cao)0.15 2-21
2-10 Composition Dependence of Activation Energy for Electronic and Ionic Conduction in (Zr02)0 85-x(Ce02)x(CaO)0. I5 2-24
.
2-11 Oxygen Partial Pressure Dependence of Conductivity at Constant Tem- perature for the Solid Solution (Zr02)o. 70(Ce02)o . 15(Ca0)0 . 15 2-25
2-12 Dependence of Conductivity on Mole Percent Ceria in (Zr02)0. 85-x(Ce02)x (CaO),, 15 at Indicated Temperatures in 1.6% CO-98.4% CO2 2-26
2-13 Microweighing Assembly 2-29
2-14 Reduction of a Ceria Sample 2-30
2-15 Oxidation of a Ceria Sample 2-31
2-16 Dependence of Oxygen Partial Pressure on Composition CeO (4 at 1000’ C 2-38
2-17 Temperature Dependence of Oxygen Partial Pressure of Several CO-CO2 Mixtures 2-48
X
Page Figure
2-15
3-1
3-2
3-3
3-4
3-5
3-6
3-7
4-l
4-2
Dependence of Conductivity on Mole Percent Oxygen Vacancies and Ce+3 Ions in (Zr02)6 76(Ce02)6 15(CaO)o 15 at 727” and 977°C 2-51
. . .
Tube Cell 3-2
C02-H20 Electrolysis System 3-3
Flow Diagram 3-4
Calculated CO2 Current Efficiency on Electrolysis of H20-CO2 Mixtures at ‘73O”C, 100% Total Current Efficiency, 100 mA Current, CO2 Flow 6.0 ml/min 3-8
Sealed Disk Electrolyte Test Unit 3-11
E-I Plot for (Zr02)0q 85(CaO)o. 15 and C02-HZ0 at 982°C 3-20
E-I Plot for (Zr02)0. 82(CaO)o. 15 (Ceo2)0. 03 3-21
One-Eighth Man Laboratory Model Carbon Dioxide Electrolyzer With External Series Connection 4-2
One-Eighth Man Laboratory Model Carbon Dioxide Electrolyzer With Internal Series Connection 4-4
xi
TABLES
Table
2-1
2-2
2-3
2-4
Zr02-CaO Cubic Phase Region
Spectrochemical Analysis of Starting Materials
Lattice Parameters of Zirconia-Calcia Solid Solutions
Page
2-2
2-4
2-6 Lattice Parameters of (Zr02)0. 85-x(Ce02)x(CaO)0, 15 Solid Solutions
2-5
2-6
2-7
2-8
2-9
Calculated and Measured Densities
Comparison of Conductivity Data at 1000°C
Conductivity-Temperature Data
Ceria Content and Ionic Conductivity at 1000°C and PO2 = 1 Atm
Observed Weight Loss in the Reduction of Cerium Dioxide in Mixed Oxide Solid Solutions at 1000°C
2-6
2-11
2-12
2-22
2-23
2-33
2-10 Observed Weight Loss in the Reduction of Cerium Dioxide in Mixed Oxide Solid Solutions in 25.9% CO in CO2 2-34
2-11 Observed Weight Loss in the Reduction of Cerium Dioxide in Mixed Oxide Solid Solutions 2-35
2-12 E uilibrium The CeO2-Ce%. 5 q.
(cao)o. 15 Soli Solutions in the Reduction of (Ce02)x(Zr02)0. 85-x
2-36
2-13 The CeO2-CeOl. 5 q E uilibrium in the Reduction of Ce02 at 1000°C 2-36
2-14 Lattice Parameters of (Zr02)0 85-x(Ce02)y(CeOl 5)z(CaO)0 15 . . . 2-40
2-15 Densities of Oxidized and Reduced 30 mole % Ceria Solid Solutions 2-40
2-16 Calculated Equilibrium Constant Kl for Eq. (2-18) at 1000°C 2-45
3-l Summary of Electrolysis Runs 3-5
3-2 Catalytic Effect of Water Vapor 3-6
3-3 Current Efficiency vs. Current Density 3-7
3-4 Comparison of Experimental and Equilibrium Conditions 3-10
xii
Table Page
3-5 Electrolysis Runs in Chronological Order (Zr02)0 . 85(Ca0)0 . 15 3-15
3-6 Electrolysis Runs in Chronological Order (Zr02)0 . 82(Ca0)0 . 15 (ce02)o. 03 3-16
3-7 Comparison of Similar Electrolysis Runs (ZrO2)o. 82(CaO)(). 15 (Ce02)0. 03 3-18
3-8 Comparison of Performance of Ceria-Containing Electrolyte with Ceria-Free Electrolyte 3-22
xiii
Section 1 INTRODUCTION
An important problem in maintaining a closed ecological environment in a manned
space vehicle is the removal of respiratory carbon dioxide and the regeneration of its
oxygen content,
Several different approaches for the regeneration of oxygen from carbon dioxide are
under investigation in various laboratories. A method for the removal of CO2 and
regeneration of O2 that has many attractive features is that of electrolysis in a solid
oxide electrolyte cell. In addition, electrolysis of H20 and C02-H20 may also be
carried out in the same cell.
Serious disadvantages of present solid oxide electrolyte cells are the high operating
temperatures of around 1000°C needed to obtain 100% current efficiency and low
electrolyte resistance. Some of the problems of high temperature operation are
increased power consumption to maintain the operating temperature, increased weight
and volume due to insulation required, high temperature cell construction and opera-
tion problems and problems of reliability. It is, therefore, of importance for the
ultimate success of this method to be able to lower the operating temperature signifi-
cantly below 1000” C.
several approaches in the synthesis of oxygen ion conducting electrolytes and in the
electrolysis procedures may profitably be investigated in order to attain the goal of
high energy efficiencies at relatively low operating temperatures.
This program consists of a study of the electrochemical properties of oxygen ion solid
electrolytes having the imperfect fluorite structure. These studies are being made in
the temperature range 500 - 1000°C. The aim is to be able to operate cells made
from these electrolytes for the electrolytic dissociation of C02-H20 at temperatures
l-l
below lOOO”C, preferably in the region 600 - 750°C at high energy efficiencies. In
order to accomplish this objective, 100 percent oxygen ion conductors as well as
several conductors with compositionally built-m variable amounts of an electronic
component have been synthesized. In order to be able to optimize the electrolyte
electrochemical parameters for the required cell operating conditions, both types of
electrolytes were studied with respect to a number of important physical-chemical
factors.
There has been much progress in recent years in various applications of oxygen ion
solid conductors based on the investigations of the physical-chemical, structural, and
electrochemical properties of mixed oxide solid solutions. The criteria for electrolytes
with optimum properties are well understood, especially for open-circuit measure-
ments. This is true as well for open-circuit diffusion-migration phenomena, a-c
conductivity dependence on O2 partial pressure, the Nernst-Einstein relation between
electrical conductivity of an ionic species, and its self-diffusion coefficient, etc.
However, studies on the absolute specific conductance versus composition and tempera-
ture, and those carried out on galvanic and electrolytic cells with current flow through
the oxygen ion conducting electrolytes, have resulted in many contradictory data and
differing interpretations of the various phenomena observed. These problems may be
at least in part due to such factors as: impurities present in the oxide materials,
poorly-characterized and irreproducible experimental conditions (especially gas
phase compositions and current-voltage conditions - particularly electrode potentials),
insufficient attention paid to time-dependent effects and their cause or causes, and
difficulties associated with the theoretical interpretation of cell polarization effects
complicated by the presence of a variable electronic component in the electrolyte.
Interest in the use of solid oxide cells for the exchange of chemical and electrical
energy predates the turn of the century. Nernst (Ref. 1) first showed qualitatively that
oxygen can be transferred electrolytically in a (Zr02)0 85(Y203)o 15 electrolyte,
since known as Nernstmasse or Nernst glower. Quantitative measurements of oxygen
transferred versus current passed were made on Nernst glower material by Weininger
and Zemany (Ref. 2) who obtained 7-80 % current efficiency depending on many factors
in their experimental conditions. The validity of Faraday’s law to within 1% for
l-2
solid oxide conductors was first shown by Weissbart and Ruka (Ref. 3) for the compo-
sition (Zr02)0. 85(CaO)o. 15 near 1000°C. Following a recommendation by Schottky
(Ref. 4) for the use of solid oxygen ion conductors in fuel cells, Bauer and Preis
(Ref. 5) constructed the first solid oxide electrolyte fuel cell using Nernst glower
material. Small currents were obtained but according to the authors, cation con-
ductivity damaged the cell, and this work was discontinued. Further work was
carried out by Bauer and Preis (Ref. 5) on mixtures consisting of clay, cerium oxide,
and tungsten trioxide l’solidll electrolytes. These materials undergo irreversible
changes during cell operation, and a reinvestigation of these materials by Broers
(Ref. 6) showed that these electrolytes were molten salts held in a solid or seml-
solid matrix. A high temperature fuel cell with (Zr02)0 85(CaO)o 15 using H2 and
carbonaceous fuel was investigated in the temperature range 800- ;lOO “C by
Weissbart and Ruka (Ref. 7) and found to have a cell output limited essentially by
the electrolyte resistance. This cell was reinvestigated by Binder et al. (Ref. 8)
with essentially similar results. Activation polarization with gas mixtures consist-
ing only of CO-CO2 in oxide galvanic cells were observed at relatively high tem-
peratures by Neuimin and co-workers (Ref. 9) and at LMSC (Ref. 10). On
electrolysis of CO2 or the reversal of the fuel cell reaction, Chandler and Oser
(Ref. 11) found that the current efficiency was only 7.5 % at 750 “C with a Th02-
La203 solid electrolyte. More recent work by Chandler (Ref. 12) has shown that
100% current efficiency can be obtained at 1000 “C with Zr02-Y203 and other
electrolytes but that the efficiency drops and is time dependent at lower operating
temperatures.
Further improvement in our understanding of the physical and electrochemical
characteristics of solid oxide electrolytes resulting from this research program holds
the promise of developing a carbon dioxide reduction system having significant
advantages over other techniques. The most important of these advantages are:
l The oxygen produced is pure
l The electrolyzer is invariant in operation
l No liquids are involved, hence no zero-gravity separation problem
arises
l No electrolyte corrosion problems
l The CO produced may be used as an intermediate in food synthesis
l-3
.
Section 2
PREPARATION AND CHARACTERIZATION OF THE MMED OXIDE SYSTEM tZrO2)0 85-xtCe02)xGa~)0 . 15 .
2.1 INTRODUCTION
The startingmaterialof this ternary or pseudobinary oxide system is (Zr02)0 85(CaO)o
The mole % CaO is kept constant and the mole % Ce02 is varied from zero to 45%. .
i5.
Although no information on this system is available in the literature, the Zr02-CaO
oxide system with Zr02 as the host (solvent) oxide and CaO as the foreign (solute)
oxide has been extensi.vely studied in recent years. A host of information on the
physical-chemical properties as well as the electrochemical is available in the litera-
ture. A recent excellent review of the literature of the Zr02-CaO and other oxide
systems of interest as electrolyte materials is presented by Mobius (Ref. 13).
We are interested in Zr02-CaO solid solutions with the defect fluorite-type structure
as electrolyte materials because of their relatively high electrical conductivity at high
temperatures ascribed to the presence of oxygen ion vacancies in the anion sublattice.
Zr +4 +2 and Ca ions are statistically distributed over the cation sites of the cation
sublattice while anion vacancies are created in the anion sublattice to preserve
electrical neutrality. The number of vacancies is equal to the number of molecules
of solute CaO dissolved in the host oxide Zr02. This model, in contrast to the one
where excess i-t
Ca ions occupy interstitial sites, was first experimentally substantiated
by Hund (Ref. 14).
Considerable disagreement exists about the CaO composition limits of the cubic phase
region of this system. Table 2-l summarizes most of the available data.
2-1
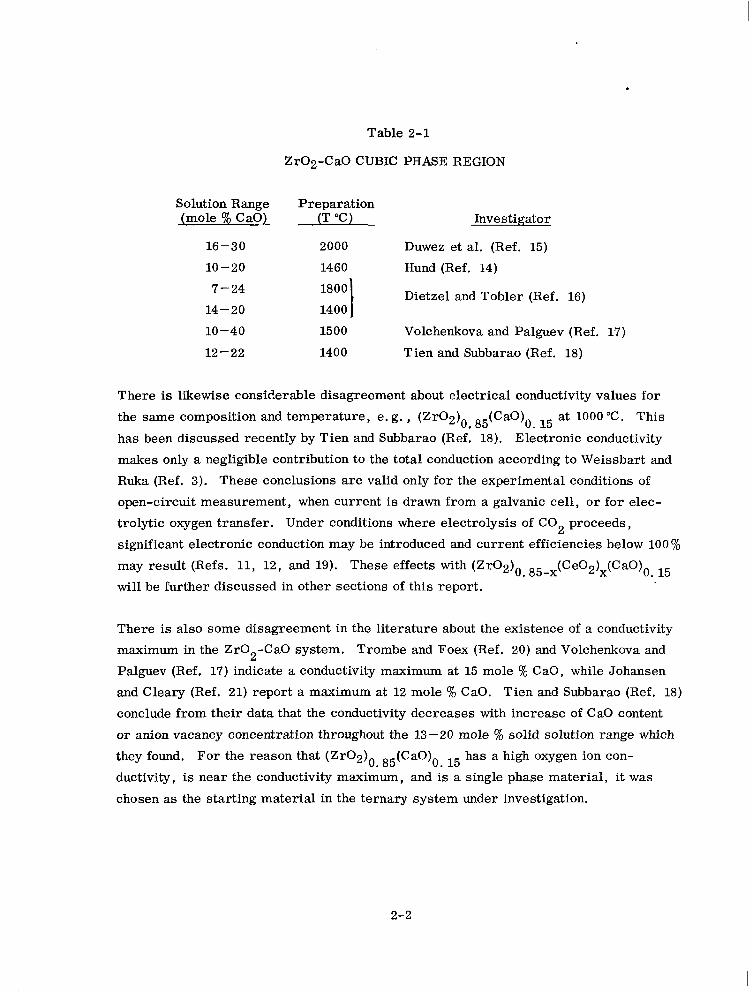
Table 2-l
Zr02-CaO CUBIC PHASE REGION
Solution Range Preparation (mole % CaO) (T “C)
16-30 2000
10-20 1460
Investigator
Duwez et al. (Ref. 15)
Hund (Ref. 14)
7-24
14-20
1800
I 1400 Dietzel and Tobler (Ref. 16)
10-40 1500 Volchenkova and Palguev (Ref. 17)
12-22 1400 Tien and Subbarao (Ref. 18)
There is likewise considerable disagreement about electrical conductivity values for
the same composition and temperature, e. g. , (Zr02)0 85(CaO)o 15 at 1000 “C. This
has been discussed recently by Tien and Subbarao (Ref: 18). Electronic conductivity
makes only a negligible contribution to the total conduction according to Weissbart and
Ruka (Ref. 3). These conclusions are valid only for the experimental conditions of
open-circuit measurement, when current is drawn from a galvanic cell, or for elec-
trolytic oxygen transfer. Under conditions where electrolysis of CO2 proceeds,
significant electronic conduction may be introduced and current efficiencies below 100%
may result (Refs. 11, 12, and 19). These effects with (Zr02)0 85-x(Ce02)x(CaO)0 15
will be further discussed in other sections of this report.
There is also some disagreement in the literature about the existence of a conductivity
maximum in the Zr02-CaO system. Trombe and Foex (Ref. 20) and Volchenkova and
Palguev (Ref. 17) indicate a conductivity maximum at 15 mole % CaO, while Johansen
and Cleary (Ref. 21) report a maximum at 12 mole % CaO. Tien and Subbarao (Ref. 18)
conclude from their data that the conductivity decreases with increase of CaO content
or anion vacancy concentration throughout the 13-20 mole % solid solution range which
they found. For the reason that (Zr02)0 85(CaO)o 15 has a high oxygen ion con-
ductivity, is near the conductivity maximum, and is a single phase material, it was
chosen as the starting material in the ternary system under investigation.
2-2
Phase studies of solid solutions of the fluorite-type structure with Ce02 as the host
oxide in the binary system CeC$ -CaO with up to 15 mole % CaO have been made by
Keler et al. (Ref. 22). Palguev and co-workers (Ref. 23) using an open-circuit cell
EMF method have shown that for the ternary system (Zro. 25Ce0. 7502)I-x(CaO)x in
reducing atmospheres appreciable electronic conductivity is introduced in the struc-
ture. The electrolyte disks become discolored due to formation of Ce203 and break
apart. In general, binary or ternary systems with large amounts of Ce02 as the
host or predominant oxide are unstable in reducing atmospheres such as would be
found at the CO2 electrode.
Duwez and Odell (Ref. 24) have examined the binary zirconia-ceria oxide system. They found that the solubility gap is narrowed by the addition of a third component. At
2000°C complete solubility occurs on the addition of 13.8 mole % magnesium oxide
to stabilize the zirconia. At lower temperatures the homogeneous phase decomposes
again into a tetragonal and solid solution phase. At 1375.C the solubility gap extends
approximately from 35 to 65 mole % ceria and at 1lOO“C the influence of MgO on the
solubility completely disappears. At lllO’C, solid solution specimens containing
10 mole % ceria decompose into monoclinic zirconia and a tetragonal solid solution.
These results may in large,part be ascribed to the presence of the relatively small
Mg+2 cation which leaves the cation sublattice and enters the interstitial positions of
the fluorite-type structure.
It is therefore of interest to examine the (Zr02)0 . 85-x(Ce02)x(CaO)0 . I5 electrolyte
system in order to determine that the solubility limits of the Ceti and Ce+3 oxides are
not exceeded and that decomposition to two phases and the destruction of the electrolyte
does not occur under the reducing conditions found at the CO/CO, electrode. The
determination of the structure and phase relationship by x-ray and pycnometric density
measurements on the mixed oxide system containing fully oxidized ceria, i. e. , Ce +4
,
is discussed below.
2.2 SPECIMEN PREPARATION
Chemically pure zirconium oxychloride and calcium carbonate, and cerium nitrate
code 277 obtained from the Lindsay Division of the American Potash and Chemical
2-3
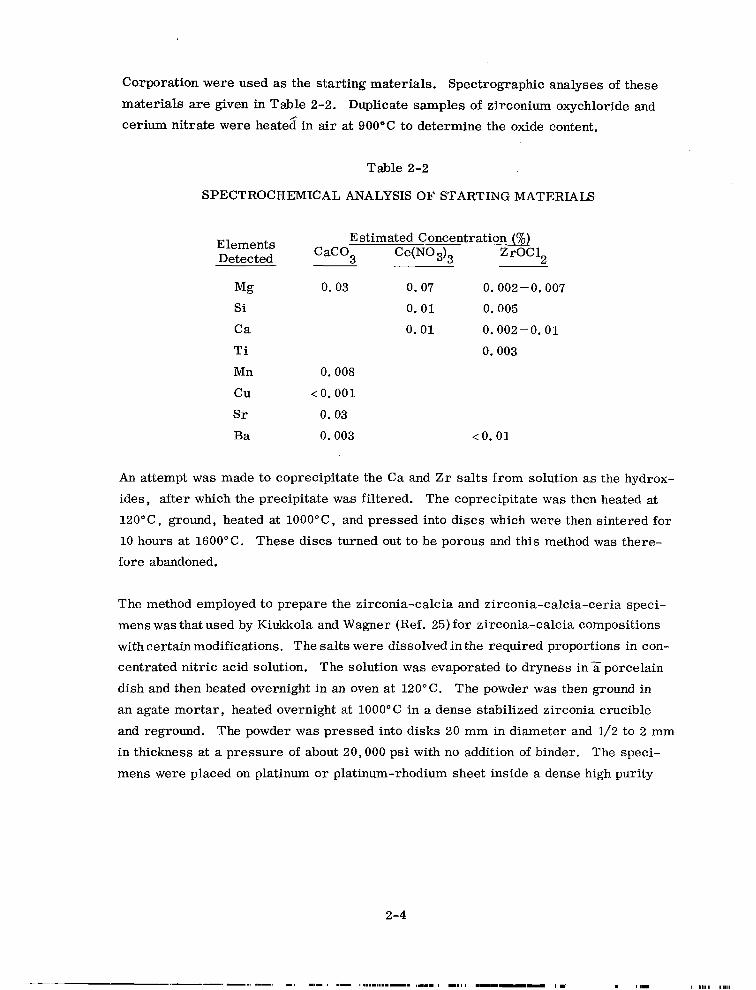
Corporation were used as the starting materials. Spectrographic analyses of these materials are given in Table 2-2. Duplicate samples of zirconium oxychloride and cerium nitrate were heated in air at 900°C to determine the oxide content.
Table 2-2
SPECTROCHEMICAL ANALYSIS OF STARTING MATERIALS
Elements Estimated Concentration fi)
Detected CaC03 CetN03)3 ZrOC12
Mg Si
Ca
Ti
Mn
cu
Sr
Ba
0. 03 0. 07 0.002-O. 007
0.01 0.005
0. 01 0.002-O. 01
0.003
0.008
< 0.001
0. 03
0.003 <O.Ol
An attempt was made to coprecipitate the Ca and Zr salts from solution as the hydrox-
ides, after which the precipitate was filtered. The coprecipitate was then heated at
I2O”C, ground, heated at lOOO”C, and pressed into discs which were then sintered for
10 hours at 1600°C. These discs turned out to be porous and this method was there-
fore abandoned.
The method employed to prepare the zirconia-calcia and zirconia-calcia-ceria speci-
mens was that used by Kiukkola and Wagner (Ref. 25) for zirconia-calcia compositions
with certain modifications. The salts were dissolved in the required proportions in con-
centrated nitric acid solution. The solution was evaporated to dryness in 5 porcelain
dish and then heated overnight in an oven at 120°C. The powder was then ground in
an agate mortar, heated overnight at 1000°C in a dense stabilized zirconia crucible
and reground. The powder was pressed into disks 20 mm in diameter and l/2 to 2 mm
in thickness at a pressure of about 20,000 psi with no addition of binder. The speci-
mens were placed on platinum or platinum-rhodium sheet inside a dense high purity
2-4
alumina tube and sintered in a flowing oxygen atmosphere at 1600°C for about 10 hr.
The powders appeared homogeneous after firing at 1000°C with the zirconia-calcia
powders being colored white while the powders containing ceria took on a yellowish
tinge with increasing content of ceria. Disks sintered at 1600°C containing ceria
appeared ivory white to yellow.
The disks were leak checked by placing them on a flat silicone rubber gasket resting
on a Forsterite tube (American Lava Corporation). The disk holder is evacuated by
means of a forepump and the pressure in the system is monitored by a Pirani gauge.
Disks pumped down to approximately 20 microns (the lower limit of this pump system)
and not penetrated by acetone sprayed on them were considered gas-tight. Porous disks
could not be pumped down to this pressure and penetration of acetone would deflect the
Pirani gauge meter. Only gas-tight disks were used for conductivity and cell measure-
ments. The apparent density of disk specimens in comparison with the pycnometric
density on powders is discussed below.
2.3 STRUCTURE AND PHASE RELATIONSHIP
Disk specimens sintered at 1600°C in oxygen were cooled in the furnace. The disks
were ground to a fine powder in an agate mortar for x-ray examination to determine
the phase or phases present and lattice parameters at ambient temperature. CuKo
radiation with a nickel filter was used and Debye-Scherrer patterns were obtained on
a GE XRD-5 x-ray diffractometer. Several samples were examined on a 57.3 mm
Debye-Scherrer camera.
In the zirconia-calcia solid solution region, the lattice parameters increase linearly
with increase of % CaO. Table 2-3 shows the lattice parameter values obtained for
15 and 20 mole % CaO and compares the change of lattice parameter A so/A mole %
CaC obtained from these two values with several literature values. The 15 mole %
CaO lattice constants in the literature tend to cluster around 5.130-5. 133 ialthough
several values 0.01 to 0.02 iunits lower are reported. Purity of the samples inves-
tigated and the sintering temperatures employed may account for this discrepancy.
2-5
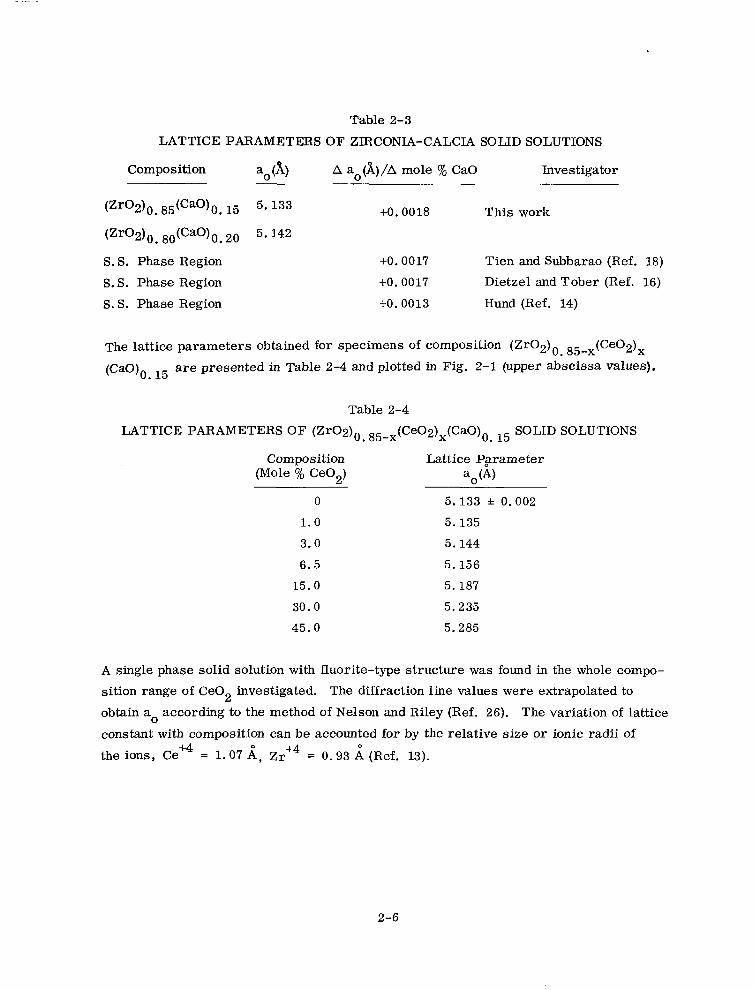
Table 2-3
LATTICE PARAMETERS OF ZlRCONIA-CALCIA SOLID SOLUTIONS
Composition a0 (A)
(zr02)o. 85(cao)o. I5 5. 133
(Zr02)0. 8otCao)om 26 5.142
S. S. Phase Region
S.S. Phase Region
S. S. Phase Region
A ao(A)/A mole % CaO Investigator
+O. 0018 This work
+o. 0017 Tien and Subbarao (Ref. 18)
+o. 0017 Dietzel and Tober (Ref. 16)
+o. 0013 Hund (Ref. 14)
The lattice parameters obtained for specimens of composition (Zr02)0 85-x(Ce02)x
(CaO), . 15 are presented in Table 2-4 and plotted in Fig. 2-l (upper abscissa values).
Table 2-4
LATTICE PARAMETERS OF (Zr02)0 85-x(Ce02)x(CaO)0 I5 SOLID SOLUTIONS . .
Composition Lattice Pgrameter (Mole % Ce02) a0 (4
0 5.133 f 0.002
1.0 5.135
3.0 5.144
6.5 5.156
15.0 5.187
30.0 5.235
45.0 5.285
A single phase solid solution with fluorite-type structure was found in the whole compo-
sition range of Ce02 investigated. The diffraction line values were extrapolated to
obtain a0 according to the method of Nelson and Riley (Ref. 26). The variation of lattice
constant with composition can be accounted for by the relative size or ionic radii of
the ions, Ce +4 = 1.07 h;, Zr+4 = 0.93 i (Ref. 13).
2-6
MOLE % CEm IN (Z~2)o.85-x(Ce02)x(CaO)o l5 .
15 30 45 60 75 I I I I I
0’ 0
0 0
0 0
0 0
0 0
I I I I I- I I I
I
0 10 20 30 40 50 60 70 80 90 100
(zro2)0.65(Ca0)0.~5 (Ceo2)O~65(Ca0)O~15
MOLE % (CeWO 85tCaO)o . . 15
c ) - - VEGARD’S LAW INTERPOLATION BETWEEN Pro21 0.85(Ca0)0.15AND lCeo2)0 . 85(cao)o 15
( ) q KELERetal. c 1 0 THIS WORK
Fig. 2-l Comparison of Lattice Parameters for the System
2-7
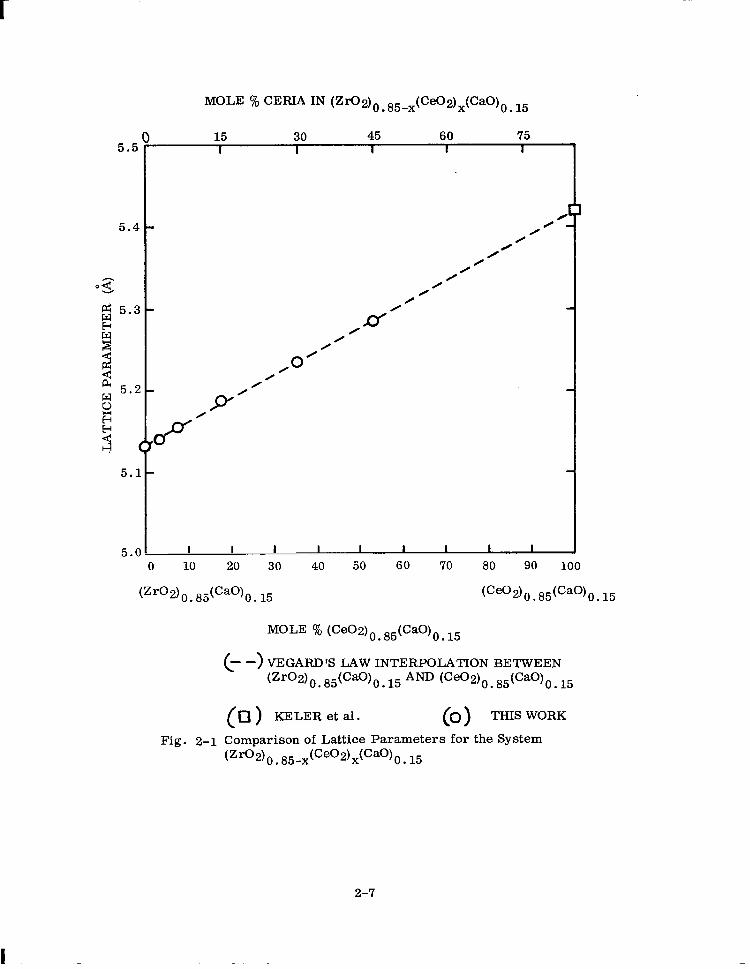
The lattice parameters were found to increase linearly from 5.133 i for the solid n
solution with no Ce02 to 5.285 A for the 45 mole y0 CeC2 solid solution. Electrolytes
m this composition range kept at temperatures of 1000°C and lower for long periods
of time should remain single phase materials with the-fluorite-type structure in con-
trast to magnesia stabilized zirconia-ceria solutions which are unstable at these
temperatures and decompose into two phases (Ref. 24).
A 30 mole ‘j$ ceria sample used for electrical resistance measurements and held at
temperatures between 1097 and 803°C for twenty-six days was subsequently examined
by x-rays. Only lines of the one phase fluorite structure were present. The lattice
parameter was found to be 5.230 f 0.005 %, in good agreement with 5.235 5 0.002 i found
with a similar sample heated to 1600” C and cooled to room temperature.
Keler and co-workers (Ref. 22) have reported a value of 5.420 i for the solid solution
(Ceo2)0. 85(cao)0. 15 which also has a fluorite-type structure. Vegard’s law holds
that the lattice cell dimensions should vary linearly with concentration of solute added
to the host solution. Assuming Vegard’s law is obeyed on mixing (Zr02)o 85(CaO)0 15 . and Ge02)0. 85(cao)o. 15 we draw a straight line between the two a0 values as shown
in Fig. 2-l. The lower and upper abscissa values are related to each other by the
equation
(1 - y) [(Zr02)o. 85(cao)0. 151 + y [tceo2)0. 85(Ca0)0. 15~
- (Zr02) 0. 85-x(Ce02)x(Cao)0. 15 (2 -1)
where y = x/O. 85 and x and y are mole fractions. The experimentally determined
a0 values for 3, 6.5, 15, 30, and 45 mole y0 ceria fall on the straight line agreeing
in a satisfactory fashion with the interpolated a0 values.
The type of defect structure, e.g., vacancy or interstitial present in a mixed oxide
crystal may be determined by comparison of the experimentally obtained pycnometric
density with that calculated from lattice parameters.
2-8
The anion defect structure of zirconia-calcia solid solutions was first experimentally +4 determined by Hund (Ref. 14) and confirmed by Rabenau (Ref. 27). When Zr ions are
replaced by +4 Ce ions in the cation sublattice, the anion defect structure should remain
unaltered. For a constant value of 15 mole % CaO, the number of oxygen ion vacancies
should remain constant at 15 mole %. For a completely filled cation sublattice consist-
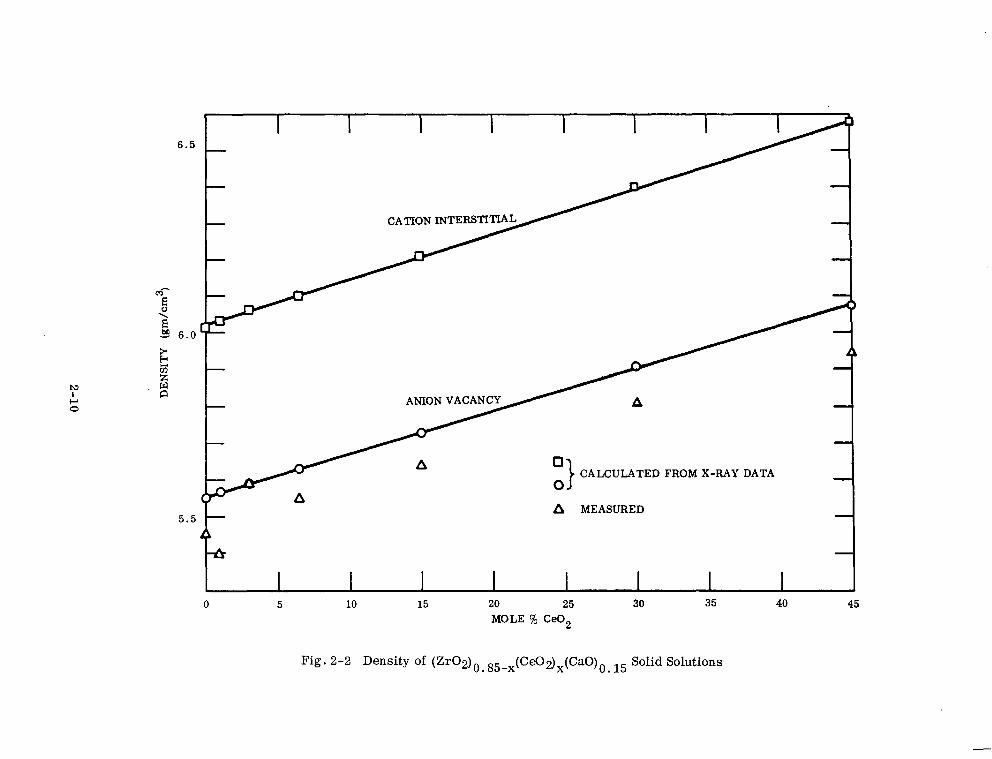
ing of 4 cations per unit cell in a fluorite-type structure the vacancy model density is
dv = 4[ (0.85-x) Zr02 + x Ce02 t- 0.15 CaO]
NV (2-2)
where (0.85-x) Zr02,x Ce02, and 0.15 CaO are the mole fractions of the molecular
weights of these species, N is Avogadro’s number, and V = a: ( ) is the unit cell
volume obtained from the lattice parameters in Table 2-4. For comparison, assuming
the anion sublattice of 8 oxygen ions per unit cell is complete and excess Ca* ’ ions
occupy interstitial sites, the interstitial model density is
dI = 4.33[(0.85-x) Zr02 + x Ce02 + 0.15 CaO]
NV (2 -3)
The calculated and measured densities are shown in Table 2-5 and Fig. 2-2. This
oxide system therefore has a structure whose unit cell edge and density increase
linearly with increasing mole % ceria while at the same time the number of oxygen
vacancies remains constant. Additional vacancies are created by the reduction of Ce +4
to Ce+3 ions. Reduction of ceria is discussed in the section on Disorder Equilibrium.
The reported densities were measured on powders from disks sintered at 1600°C in
oxygen for 10 hr, crushed and ground in an agate mortar.
The pycnometric fluid used was bicyclohexyl recommended by Ruby and Loveland (Ref. 28)
for the determination of densities on fine powders. The bicyclohexyl used gave a density
value of 0.8822 versus the literature value of 0.8825. All powder samples were first
degassed, the fluid was added, and then further degassed. It was observed that disk
2-9
* I I I I I I I
0 CALCULATED FROM X-RAY DATA
0
A MEASURED
0 5 10 15 20 25 30 35 40 45
MOLE % Ce02
Fig. 2-2 Density of (Zr02)0.85-x(Ce02)x(CaO)0 15 Solid Solutions
r
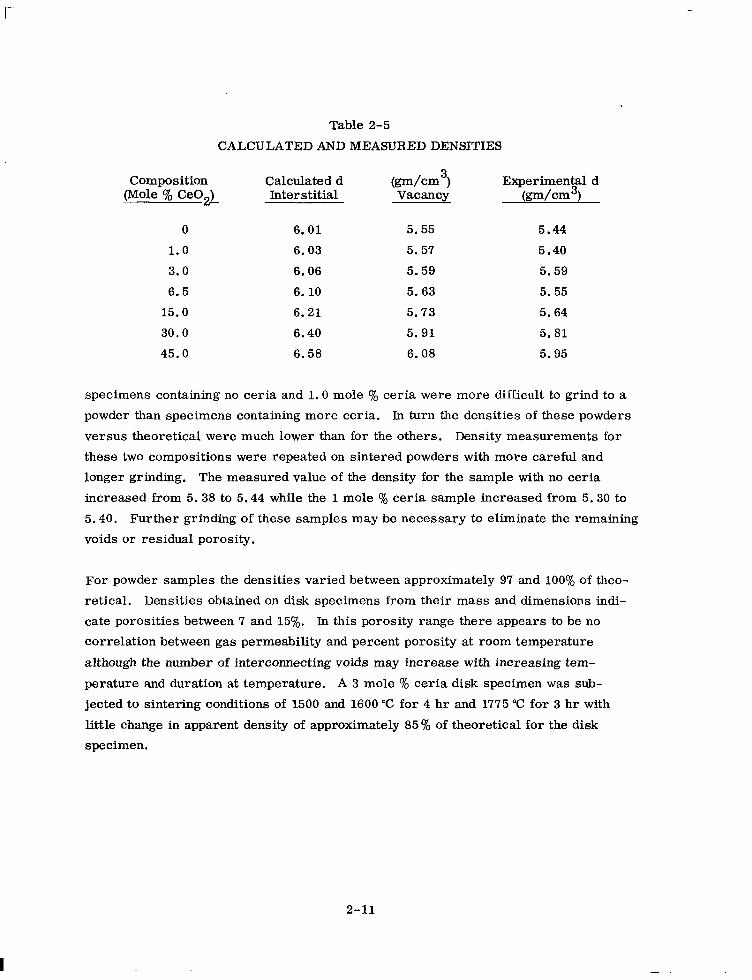
Table 2-5
CALCULATED AND MEASURED DENSITIES
Composition Calculated d (Mole % Ce02) Interstitial
(pm/cm3) Vacancy
Experimental d @-dcm3)
0 6.01 5.55 5.44
1.0 6.03 5.57 5.40
3.0 6.06 5.59 5.59
6.5 6.10 5.63 5.55
15.0 6.21 5.73 5.64
30.0 6.40 5.91 5.81
45.0 6.58 6.08 5.95
specimens containing no ceria and 1.0 mole y0 ceria were more difficult to grind to a
powder than specimens containing more ceria. ln turn the densities of these powders
versus theoretical were much lower than for the others. Density measurements for
these two compositions were repeated on sintered powders with more careful and
longer grinding. The measured value of the density for the sample with no ceria
increased from 5.38 to 5.44 while the 1 mole % ceria sample increased from 5.30 to
5.40. Further grinding of these samples may be necessary to eliminate the remaining
voids or residual porosity.
For powder samples the densities varied between approximately 97 and 100% of theo-
retical. Densities obtained on disk specimens from their mass and dimensions indi-
cate porosities between 7 and 15%. In this porosity range there appears to be no
correlation between gas permeability and percent porosity at room temperature
although the number of interconnecting voids may increase with increasing tem-
perature and duration at temperature. A 3 mole % ceria disk specimen was sub-
jected to sintering conditions of 1500 and 1600 “C for 4 hr and 1775 “C for 3 hr with
little change in apparent density of approximately 85% of theoretical for the disk
specimen.
2-11
2.4 ELECTRICAL CONDUCTIVITY
2.4.1 Experimental Procedure
The electrical conductivity was measured on disk specimens in the composition range
0 to 45 mole % ceria. The disks were 15 to 20 mm in diameter and approximately
1 mm thick. Specimens were sintered at 1600°C for 10 hr. The apparent densities
were 85 to 90% of the theoretical calculations. Measurements were made at 1000 cps
using a General Radio Impedance Bridge Model 1650A.
Platinum electrodes are prepared by brushing a first coat of Engelhard No. 6926 un-
fluxed paste on both faces and firing in air for 4 hr at 1000°C. A 6- to lo-cm piece
of 5-mil platinum wire in the form of a spiral is then embedded on each face in a
second coat of paste and reheated for 4 hr at 1000°C. Twenty-mil platinum wires are
then welded to l- and 2-cm extensions of 5-mil wires on the faces in the disk electro-
lyte cell assembly. (Figure 2-3. ) A final coat of platinum paste is then brushed on,
and the assembly is heated in oxygen at 1200°C with passage of 200 mA for l/2 hr in
each direction through the disk sample.
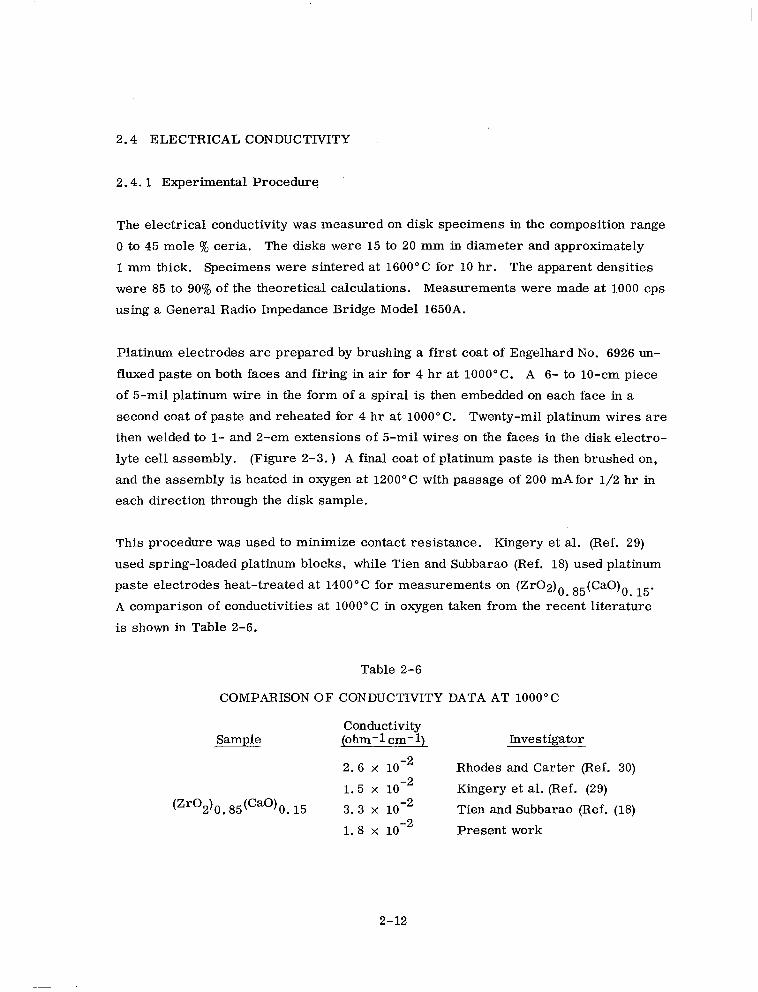
This procedure was used to minimize contact resistance. Kingery et al. (Ref. 29)
used spring-loaded platinum blocks, while Tien and Subbarao (Ref. 18) used platinum
paste electrodes heat-treated at 1400°C for measurements on (Zr02)0 85(Ca0)0 . 15.
A comparison of conductivities at 1000°C in oxygen taken from the recent literature
is shown in Table 2-6.
Table 2-6
COMPARISON OF CONDUCTIVITY DATA AT 1000°C
Sample Conductivity (ohm-i cm-i) Investigator
(Zro2)0. 85(Cao)0. 15
2.6 10 -2 x
1.5 x 10 -2
3.3 x 1o-2
1.8 x 1O-2
Rhodes and Carter (Ref. 30)
Kingery et al. (Ref. (29)
Tien and Subbarao (Ref. (18)
Present work
2-12
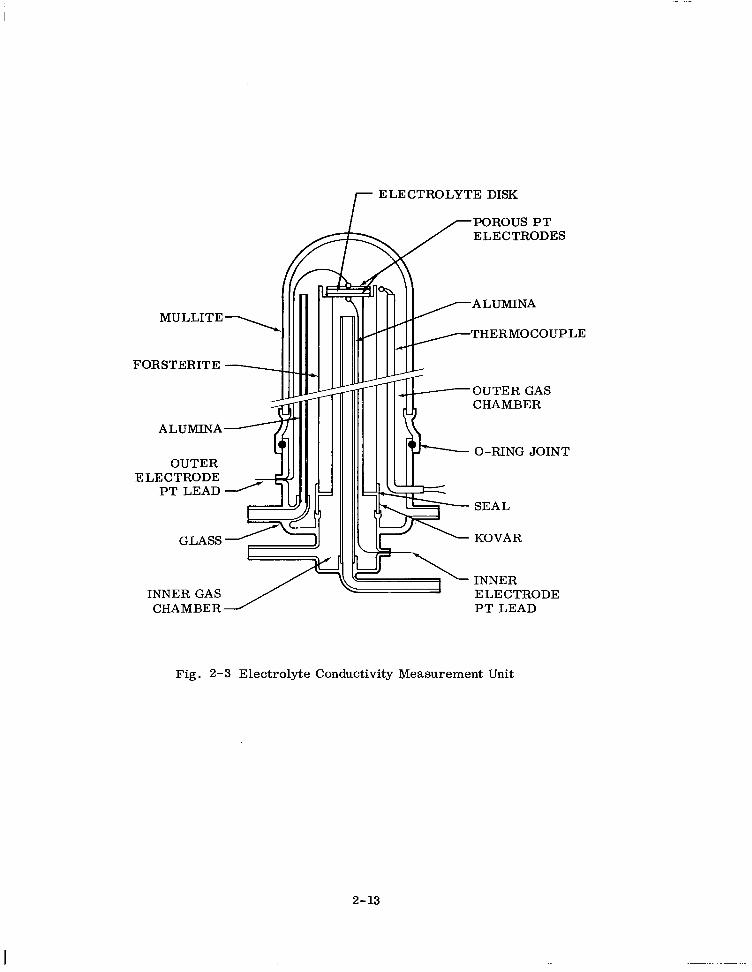
r ELECTROLYTE DISK
POROUS PT ELECTRODES
I I IllIlL
MULLITE \
FORSTERITE - I
ALUMINA
GLASS
ALUMINA
THERMOCOUPLE
OUTER GAS CHAMBER
OUTER ELECTRODE
PT LEAD
INNER GAS CHAMBER
O-RING JOINT
SEAL
KOVAR
INNER ELECTRODE PT LEAD
Fig. 2-3 Electrolyte Conductivity Measurement Unit
2-13
Despite such factors as purity of materials, density, electrode contact resistance,
lead resistance corrections, and order-disorder phenomena that can affect the values,
agreement appears to be good.
A gas stream was flowed over the samples at a rate of 10 ml/mm. The gas composi-
tions used were oxygen, carbon dioxide containing 0.035% 02, and 0.92, 1.60, 25.9,
and 50.7% CO in C02. The temperature interval was 450” to 1200°C. These compo-
sitions were analyzed by gas chromatography. For comparison purposes and for
determining the oxygen partial pressure of mixtures containing less than 0.92% CO
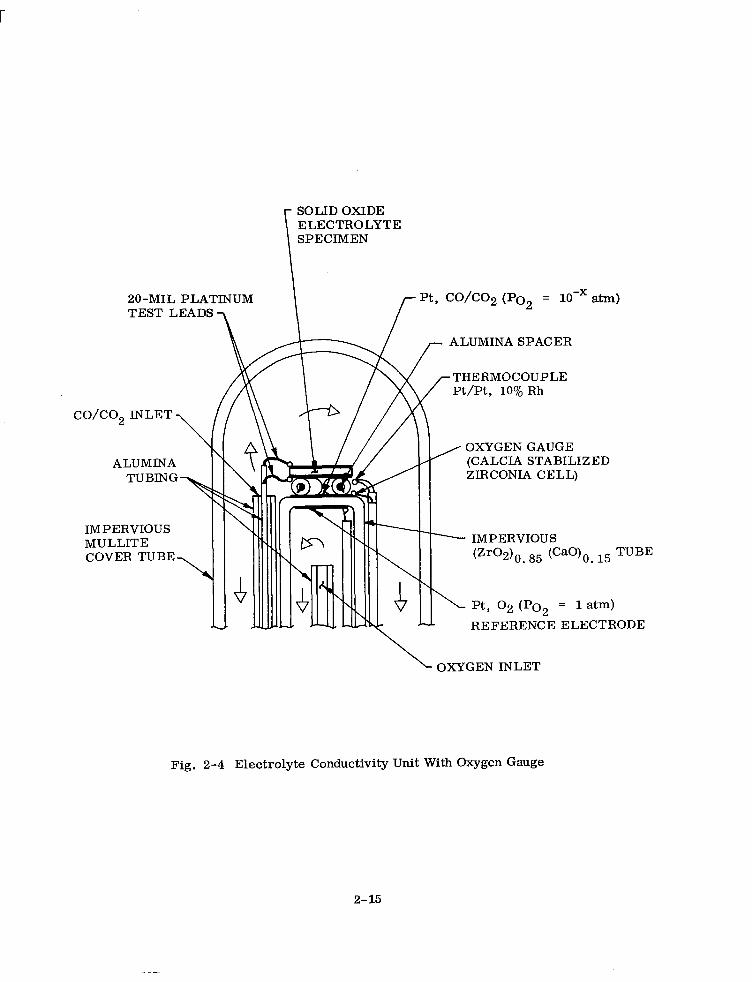
in CO2 and in 100% CO2 containing traces of oxygen a (Zr02)0 85(CaO)o 15 tube cell . . was constructed to serve as an oxygen gauge (Ref. 31). The gauge was inserted
directly into the disk electrolyte cell assembly. The disk specimen on which electrical
conductivity measurements were carried out was placed close to the anode surface of
the gauge and electrically isolated from it by two short pieces of 20-mil alumina rod
(Fig. 2-4). The disk specimen and the oxide cell of the gauge were at the same tem-
perature and the same gas stream bathing the sample flowed past the anode of the
oxide cell. The cell voltage was continuously monitored. A 0.92% CO in CO2 mixture
was diluted with 100% CO2 and fed into the cell.
From the measured EMF and the use of the Nernst equation
RT
E = 4Fh p02 (cathode)/Po (anode)
2 (2-4)
the oxygen partial pressure at the anode can be obtained directly, or the CO/CO, ratio
can be calculated from the measured EMF and the Nernst equation
E = E” + z III Pco/Pco + gb P (cathode) 2 O2
(2-5)
Oxygen at one atmosphere was used as the reference pressure at the cathode. E” is the
standard value for the CO/CO, reaction at the particular temperature and the other
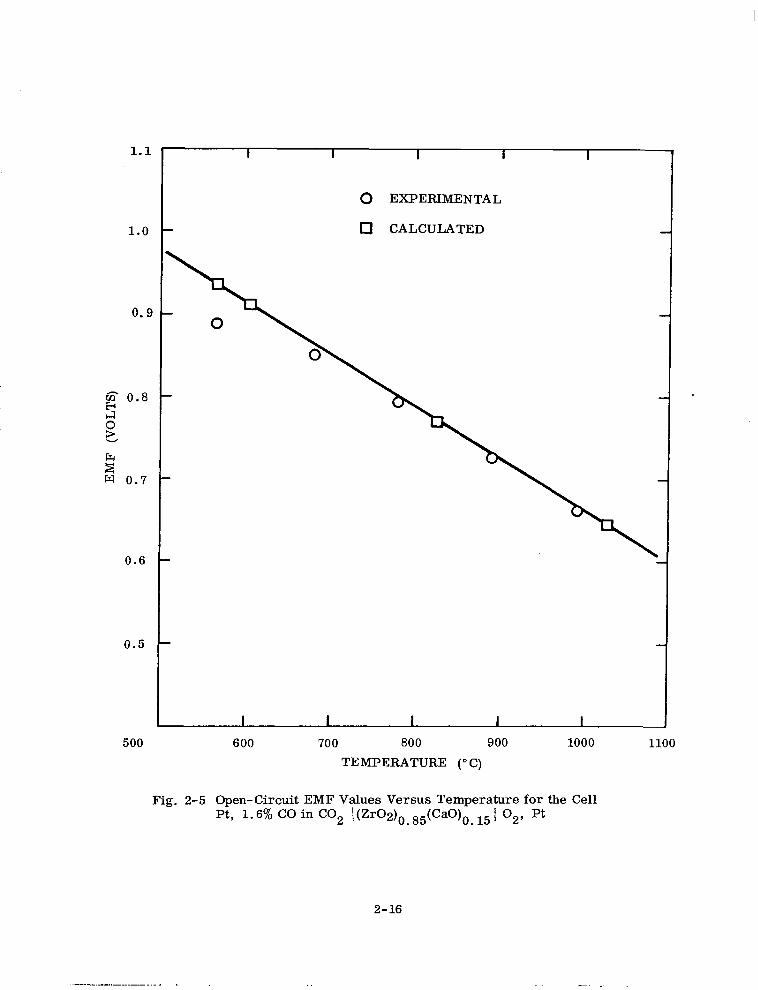
symbols have their usual meaning. A calibration of the gauge was made with 1.6%
2-14
co/co,
SOLID OXIDE ELECTROLYTE
Pt, CO/CO, (PO2 = 10sx atm)
ALUMINA SPACER
THERMOCOUPLE Pt/Pt, 10% Rh
OXYGENGAUGE (CALCIA STABILIZED ZIRCONIA CELL)
ALUMINA TUBING
IMPERVIOUS MULLITE COVER TUBE.
IMPERVIOUS (Zro2)om 85 (Cao)o. l5 TUBE
Pt, 02 (PO2 = 1 atm) REFERENCEELECTRODE
\ OXYGEN INLET
Fig. 2-4 Electrolyte Conductivity Unit With Oxygen Gauge
2-15
1.1
1.0
0.9
g 0.8
g
i2 w 0.7
0.6
0.5
500
0 EXPERIMENTAL
0 CALCULATED
600 700 800 900 TEMPERATURE (O C)
1000
Fig. 2-5 Open-Circuit EMF Values Versus Temperature for the Cell Pt, 1.6% CO in CO2 I(Zr02)0S 85(CaO)o 15 1 02, Pt .
2-16
CO in CO2 over a temperature range 560- 1000°C. The results are shown in Fig. 2-5.
At low CO/CO, ratios the platinum, CO/CO, electrode cannot be used with high
accuracy below approximately 700” C. Above 700°C this method can be used to mea-
sure the oxygen partial pressures or reducing conditions directly at the sample and at
temperature.
The oxide cell and disk specimen were located in the center of the constant tempera-
ture zone of the furnace. A 20-mil Pt/Pt, 10% Rh thermocouple placed between the
anode and disk served to measure the temperature.
2.4.2 Results
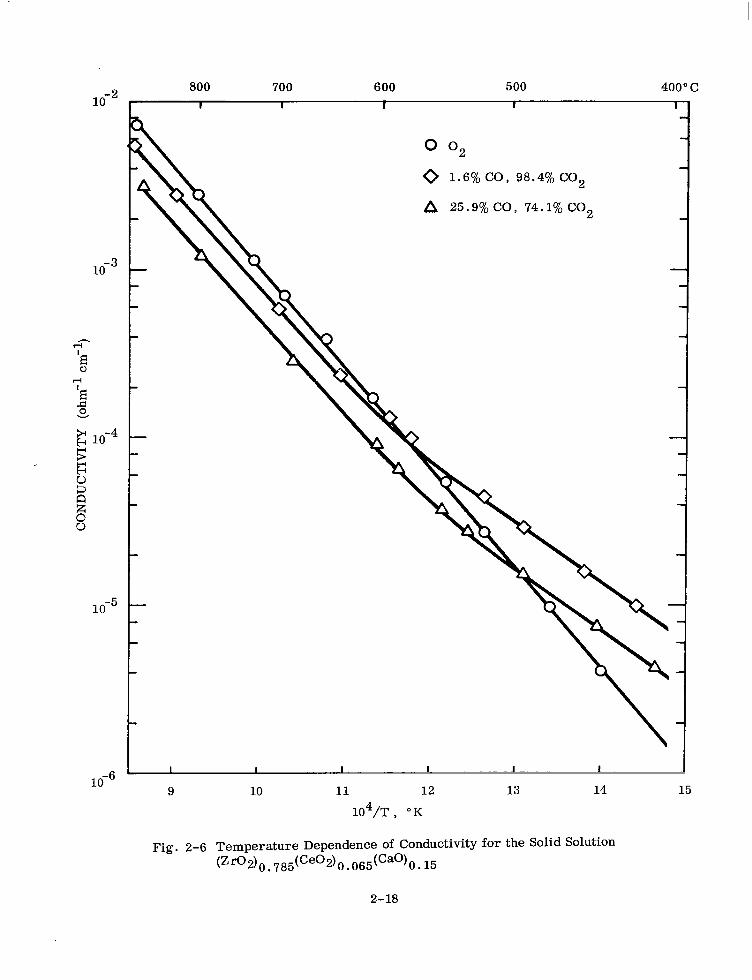
The results are presented as plots of log conductivity versus the reciprocal of the
absolute temperature so as’to give an over-all picture of the magnitude and tempera-
ture dependence of conductivity with respect to ceria concentration and CO/CO, com-
position or oxygen partial pressure. Figures 2-6, 2-7, 2-8, and 2-9 for 6.5, 10, 15,
and 30 mole Yo ceria present this data. For identification of samples only, total ceria
is expressed as mole % Ce02.
The temperature-dependence of the electrical conductivity can be represented by the
equation
CT = Aexp (-Q/kT)
where
Q = an energy term
u = the measured specific conductivity
T = the absolute temperature
k = Roltzmarm’s constant A = a pre-exponential factor
G-6)
Where a break in the curve occurs with a high-temperature and a low-temperature
linear portion, a sum of two terms of the form of Eq. (2-6) is required.
2-17
800 700 600 500 400” c -2 10
-3 10
lo-5
1o-6
I I I I
O O2
0 1.6% CO, 98.4% CO2
A zx.s%co, 74.1% co2
9 10 11 12 13 14
104/T , “K
I-
Fig. 2-6 Temperature Dependence of Conductivity for the Solid Solution (Zr02)O~785(Ce02+-)~065(Ca0)O~15
2-18
1000 900 800 700 600 500” c I I I I r
1o-2
t-ii
‘:
z 0
z
; -: u 10
E 8
lo-4
8 9 10 11 12 13
104/T (“K)
Fig. 2-7 Temperature Dependence of Conductivity for the Solid Solution
(Zfl2) 0. 75(Ce02)o. ldcao)O. 15
2-19
10-l 1000 900 800 700 600 500°C I I I I I I
0 02
Cl CO2
A o.92%co, SS.O8%CO2
0 l.S%CO, 98.4%CO2
0 25.9% co, 74.1% co2
0 50.7%CO, 49.3%CO2
8 9 10 11 12 13
104/T (“K)
Fig. 2-8 Temperature Dependence of Conductivity for the Solid Solution (Zfl2)0~7O(C~2)0~15(Ca0)0~15
2-20
1500 1200 1000 800 600 500” c T-l -r1 I I I
\
I I I I
lo- 0 1.6% CO, 98.4% CO2
A 25.9% co, 74.1% co:
lo-:
lo-’ I I I I I- I I I I
4 5 6 7 8 9 10 11 12 13 14
104/T (“K) Fig. 2-S Temperature Dependence of Conductivity for the Solid Solution
(Zr02)O~55(Ceo2)O~30(Cao)O~15
0 02
2-21
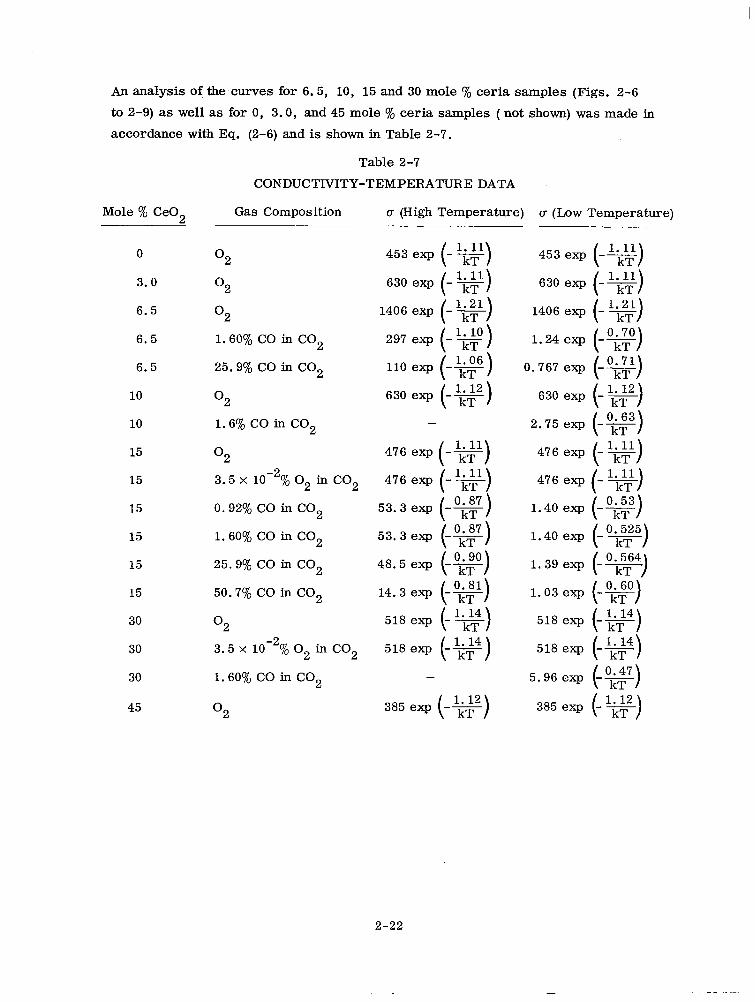
An analysis of thecurves for 6.5, 10, 15 and 30 mole % ceria samples (Figs. 2-6
to 2-9) as well as for 0, 3.0, and 45 mole % ceria samples ( not shown) was made in
accordance with Eq. (2-6) and is shown in Table 2-7.
Table 2-7
CONDUCTIVITY-TEMPERATURE DATA
Mole % Ce02 Gas Composition u (High Temperature) o (Low Temperature)
0
3.0
6.5
6.5
6.5
10
10
15
15
15
15
15
15
30
30
30
45
O2
O2
O2
1.60% CO in CO2
25.9% CO in CO2
O2
1.6% CO in CO2
O2
3.5 x 10⁻²% o2 in co2
0.92% co in co2
1.60% CO in CO2
25.9% CO in CO2
50.7% co in co2
O2
3.5 x lo-2% o2 in co2
1.60% CO in CO2
O2
453 exp (-9)
-
1.40 exp (- !??)
518 exp (-L&y
385 e, (-g)
2-22
Tien and Subbarao (Ref. 18) in their study of the zirconia-calcia system reported
that at 1000°C with increasing CaO content from 13 to 22 mole % the electrical con-
ductivity decreased from 5 x 10m2 to 6 x 10B3 ohm -‘cm-l and the activation energy
increased from 1.11 to 1.35 eV. They ascribed the decrease in conductivity to an
increase in activation energy for conduction (decrease in carrier mobility) due to the
increased size of the cation between which the oxygen ion as charge carrier has to +4 pass when the Zr ion (0.92& is replaced by the +2 Ca ion (1. lOi).
Replacement of the Zr +4 ion by the Ce i-4 ion (l-07& over a composition range of 0 -
45 mole % ceria resulted in a small decrease of conductivity at 1000” C in O2 at 1 atm
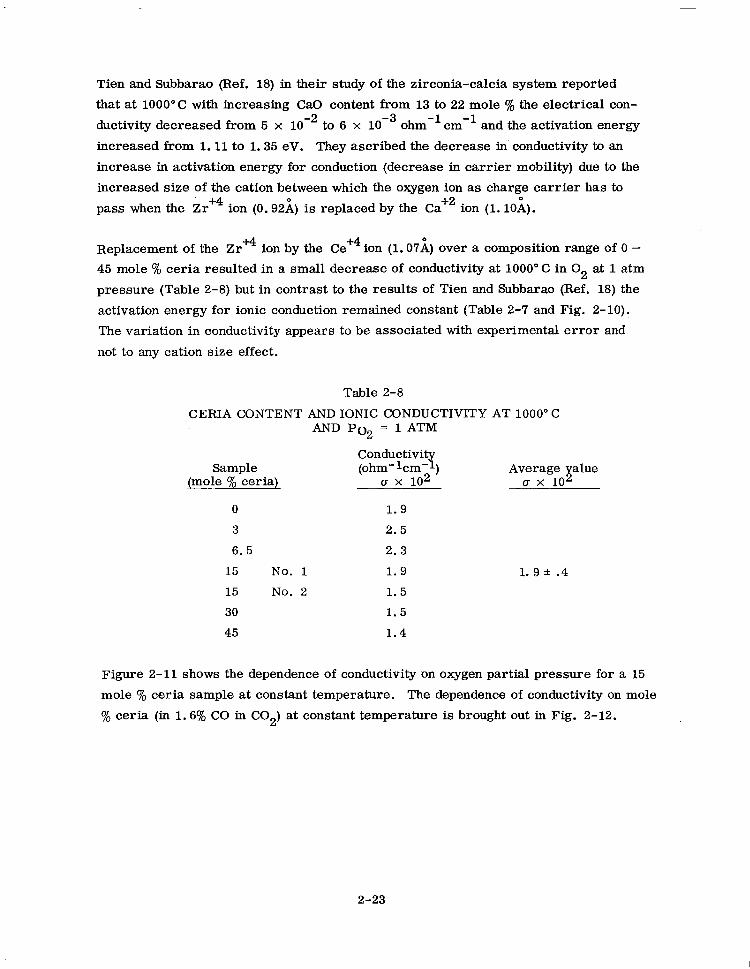
pressure (Table 2-8) but in contrast to the results of Tien and Subbarao (Ref. 18) the
activation energy for ionic conduction remained constant (Table 2-7 and Fig. 2-10).
The variation in conductivity appears to be associated with experimental error and
not to any cation size effect.
Table 2-8
CERIA CONTENT AND IONIC CONDUCTIVITY AT 1000” C AND PC2 = 1 ATM
Sample (mole % ceria)
Conductivit (ohm P -km- )
u x 102 Average value
u x 102
0 1.9
3 2.5
6.5 2.3
15 No. 1 1.9
15 No. 2 1.5
30 1.5
45 1.4
1.9 f .4
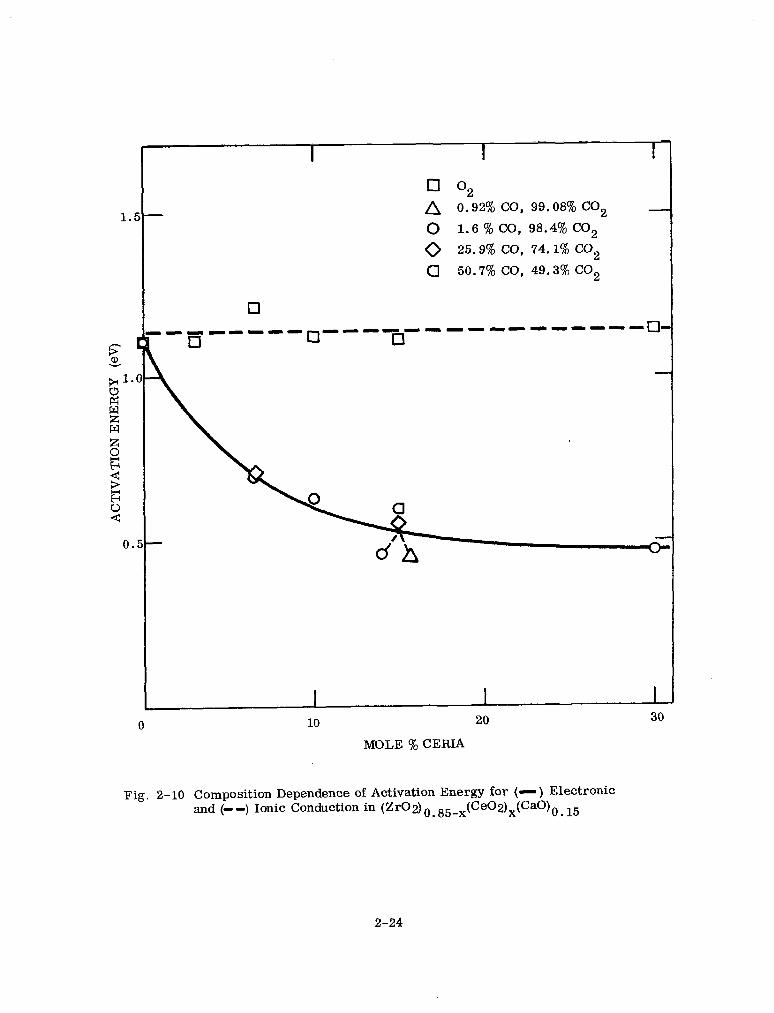
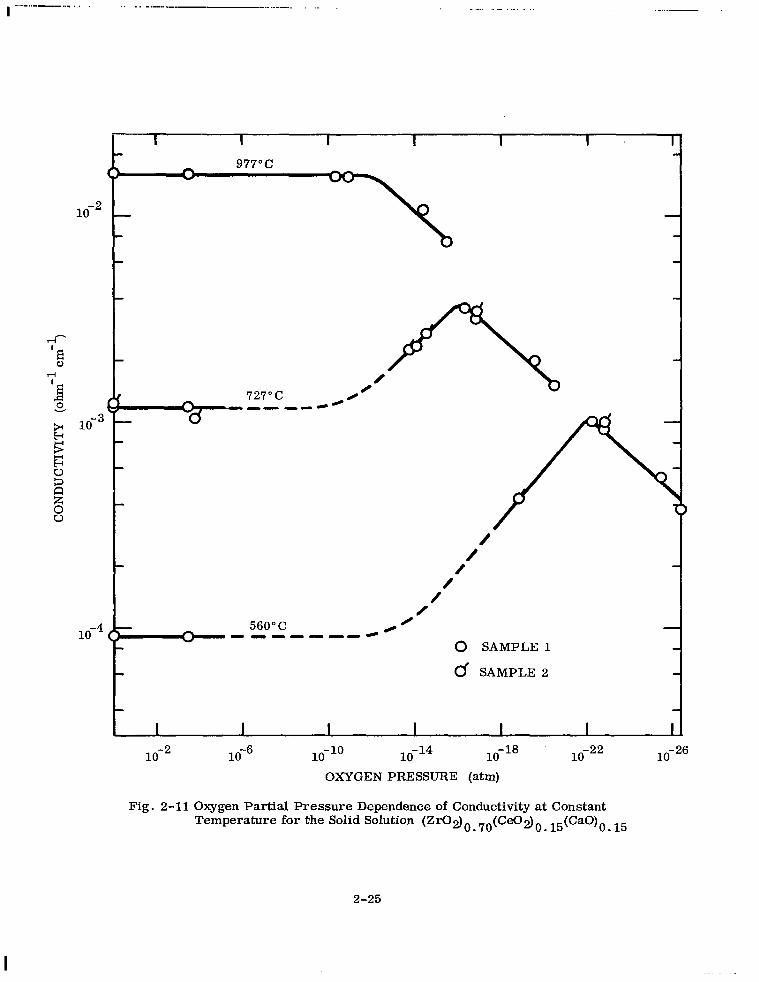
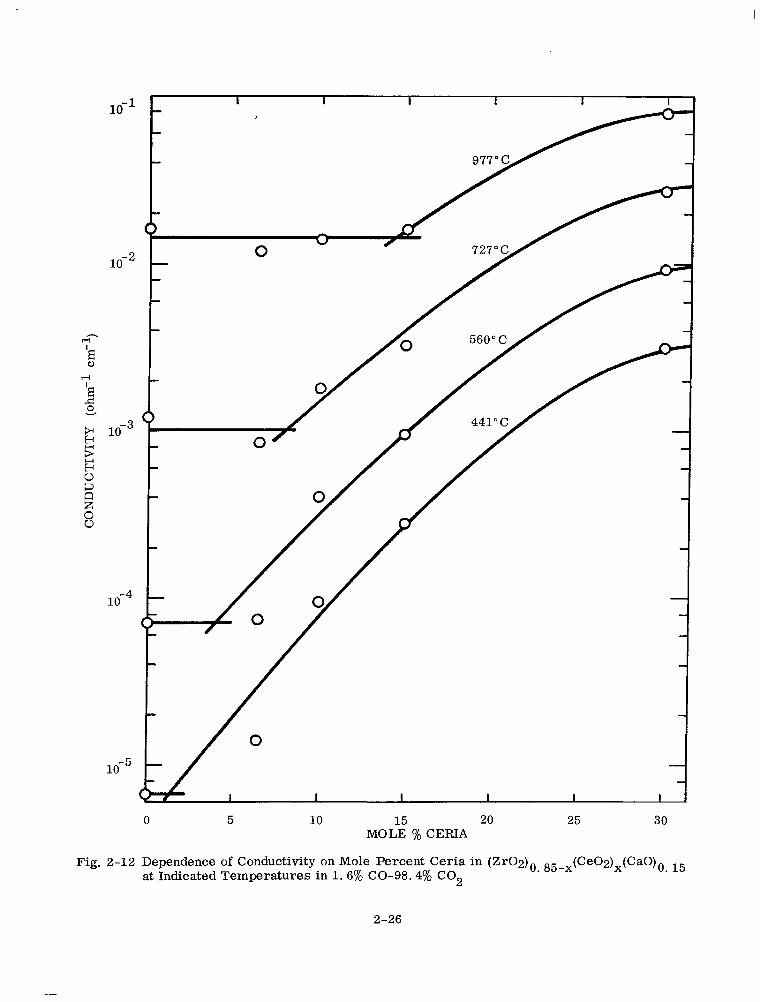
Figure 2-11 shows the dependence of conductivity on oxygen partial pressure for a 15
mole y0 ceria sample at constant temperature. The dependence of conductivity on mole
% ceria (in 1.6% CO in C02) at constant temperature is brought out in Fig. 2-12.
2-23
0
A 0.92% CO, 99.08% CO2 - - 0 1.6 % CO, 98.4% CO2
0 25.9% CO, 74.1% Co2
a 50.7% co, 49.3% co2
0
mLIw---- 0
--mb--I-L1LI--I-I q - q cl
30
MOLE % CERIA
Fig. 2-10 Composition Dependence of Activation Energy for (-) Electronic and (- -) Ionic Conduction in (ZrO2) o. 85-x(Ce02)x(CaO)0. 15
2-24
I . ..--..--__ ,... . _.-_....._._- _.... ._.. -._ __
1O-2
/ .’
-M ,’ 0 SAMPLE 1
d SAMPLE 2
1o-2 1o-6 lo-lo lo-l4 lo-l8 OXYGEN PRESSURE (atm)
1o-22
Fig. 2-11 Oxygen Partial Pressure Dependence of Conductivity at Constant Temperature for the Solid Solution (ZI%I~)~. 70(CeOz)o. 15(Ca0)0 15
.
2-25
0 5 10 15 20 25 30 MOLE % CERIA
Fig. 2-12 Dependence of Conductivity on Mole Percent Ceria in (Zr02)0 85-x(Ce02)x(CaO)0 15 at Indicated Temperatures in 1.6% CO-98.4% CO2
2-26
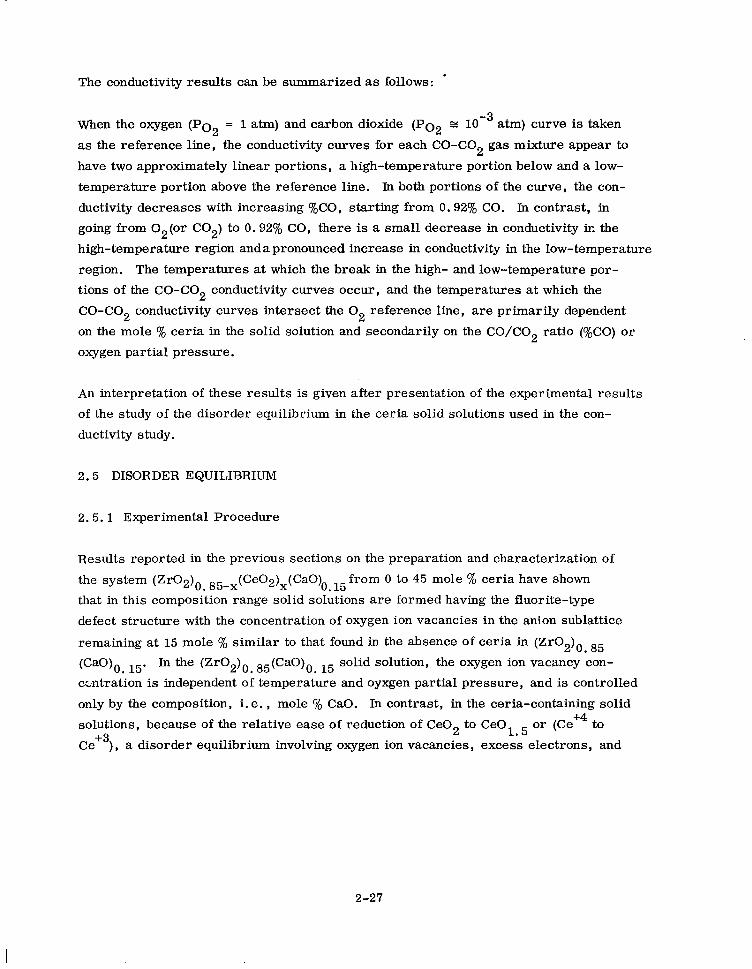
The conductivity results can be summarized as follows: .
When the oxygen (PO2 = 1 atm) and carbon dioxide (PO2 = 10 -3 atm) curve is taken
as the reference line, the conductivity curves for each CO-CO2 gas mixture appear to
have two approximately linear portions, a high-temperature portion below and a low-
temperature portion above the reference line. In both portions of the curve, the con-
ductivity decreases with increasing %CO, starting from 0.92% CO. In contrast, in
going from 02(or C02) to 0.92% CO, there is a small decrease in conductivity in the
high-temperature region and a pronounced increase in conductivity in the low-temperature
region. The temperatures at which the break in the high- and low-temperature por-
tions of the CO-CO2 conductivity curves occur, and the temperatures at which the
CO-CO2 conductivity curves intersect the O2 reference line, are primarily dependent
on the mole % ceria in the solid solution and secondarily on the CO/CO, ratio (%CO) or
oxygen partial pressure.
An interpretation of these results is given after presentation of the experimental results
of the study of the disorder equilibrium in the ceria solid solutions used in the con-
ductivity study.
2.5 DISORDER EQUILIBRIUM
2.5.1 Experimental Procedure
Results reported in the previous sections on the preparation and characterization of
the system (Zr02)o 85~x(Ce02)x(Cao)o 15 from 0 to 45 mole % ceria have shown
that in this composition range solid solutions are formed having the fluorite-type
defect structure with the concentration of oxygen ion vacancies in the anion sublattice
remaining at 15 mole % similar to that found in the absence of ceria in (Zr02)0 85 . (CaO), 15. h the WO2)O 85(cao)o 15 solid solution, the oxygen ion vacancy con- . ccntration is independent of temperature and oyxgen partial pressure, and is controlled
only by the composition, i.e., mole % CaO. In contrast, in the ceria-containing solid
solutions, because of the relative ease of reduction of Ce02 to CeOl 5 or (Ce +4 to
Ce+3), a disorder equilibrium involving oxygen ion vacancies, excess electrons, and
2-27
other structure defects is expecied to exist depending on the mole Y0 ceria, partial pressure
of oxygen, and temperature. The type and number of ionic and electronic defects and
their temperature and oxygen pressure dependence, profoundly affects the magnitude
and temperature dependence of conductivity, the electron and ion transport numbers,
and other electrochemical properties of interest in the use of these solid solutions as
electrolytes in the electrolysis of CO2 and C02-H20 mixture. Disorder equilibria
data involving ceria solutions in this composition range in zirconia-calcia or other
oxide systems are not available in the literature. Measurements of composition changes
and the Ce02-CeO 1 5 equilibrium as a function of oxygen partial pressure and tem- .
ture were undertaken using a microweighmg technique.
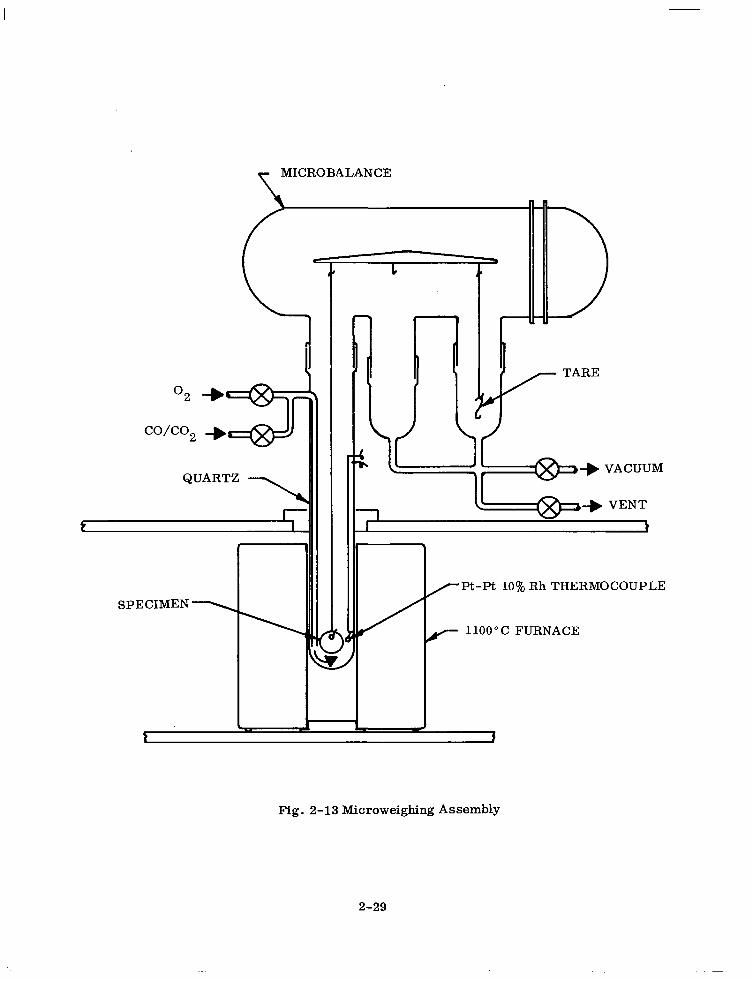
The experimental arrangement is shown in Fig. 2-13. The samples consisted of 30,
15 and 6.5 mole % ceria disks of approximately 1 - 2 mm thickness and 1.5 cm diameter.
An ultrasonic drill was used to cut a small hole near the edge of each disk sample
which was subsequently cleaned and dried in an oven. The sample was suspended from
the beam of a Cahn RG Electrobalance into a quartz hang-down tube by means of a
platinum wire. A tare weight was attached on the other end of the beam. A platinum/
platinum 10% rhodium thermocouple was positioned near the disk sample. An icebath
was used as the reference junction. A resistance-heated furnace surrounded the
quartz tube. The precision of the temperature measurements is estimated to be f 2”.
The whole system containing the balance and sample was purged by evacuating and
filling several times with the required gas. The gas was then adjusted to flow at a
rate of about 5 ml/mm circulating directly to the sample through a quartz side tube
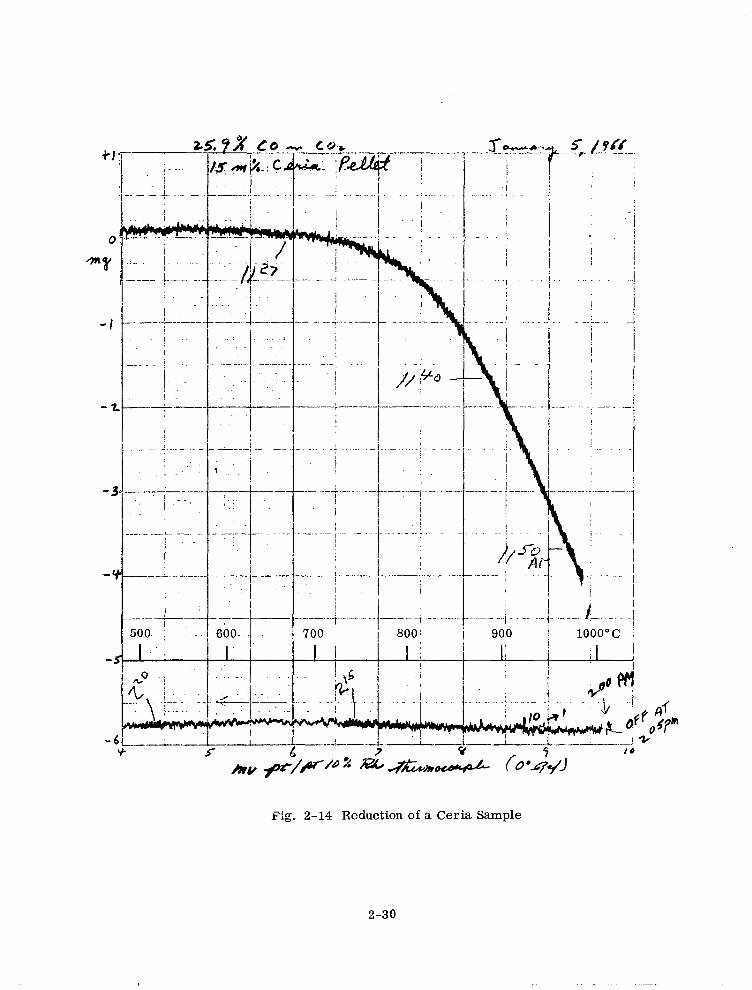
and then through the rest of the 2 to 3 liter system. Tank oxygen and CO-CO2 mix-
tures were used. A typical reduction curve for 15 mole ‘$I ceria using 25.9 ‘$I CO in CO2
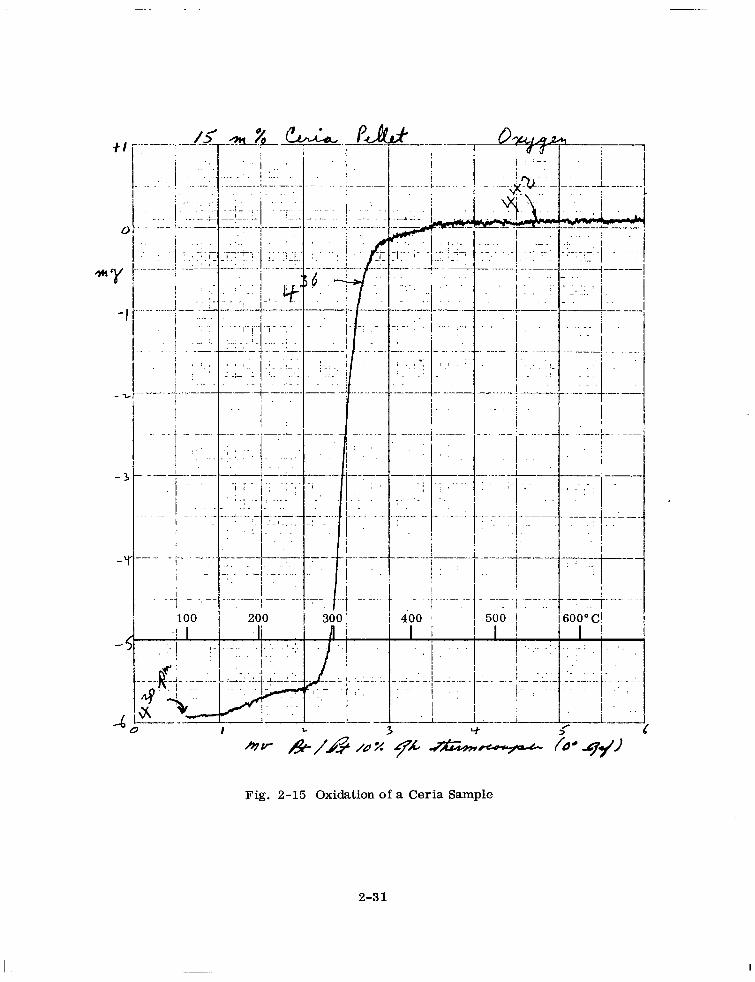
is shown in Fig. 2- 14. The curve for the reoxidation of this sample is shown in
Fig. 2- 15. A small zero point shift upward of about 0.1 mg above the room tempera-
ture value can be seen in these figures. All weight loss values have been corrected
for this effect. The approximate furnace heating and cooling rates can be gauged from
the time notations in Figs. 2- 14 and 2- 15. For some samples the temperature was
kept constant for a period of time at several potits to determine if equilibrium had
been attained. For one sample, 6.5 mole % Ce02 at 1000” C, the equilibrium point
was approached by means of reduction and by means of oxidation and the same value
2-28
T MICROBALANCE
QUARTZ \ 11 1
SPECIMEN <
I- \ ?
/Pt-Pt 10% Rh THERMOCOUPLE
/- 1100°C FURNACE
Fig. 2-13 Microweighing Assembly
2-29
i ._.. .-.. j - ._- i
1, I .
.I:
-3L-A;---.- I
!
I
---. - -7
- ---+ -- 1
-:
-+- 500. 1 .-.
I
,o.; &i.
_..-.. _T-t I---
-6l-- : a- 9
.I ..--i..--..-...;.. - ..- -,A-y;--. ---i.; 1 1 l
I ----I
I -_-_.- 6bO.- 1
t--- - I--- ---- 700 8001
j.- - . - - -. - . _ \ -.. .:. / -..- -_! -- __... ..I.. i Jfi
A i --- i - I
.-- -../ _ 900 &
_: -
5!!!is!
-_
I
I
I
I
I
__.. .-.-_
/ I !.
Fig. 2-14 Reduction of a Ceria Sample
2-30
_ _ _ _. _. P 3 ._ - __-
;
-/
- _i...- ._._
6 ,- --
..-- -.- 1. - ._ . : -- J
301
f
._.. _.~
---
_. _..
--_-- I --
-.I-;- ; _ .- _ .-_ .-.- .- . . . -_--.:
~
-.--+.. - ._____.: - _.---
: ..i.l-. --
.._
I~--- i---
.I. .
-..-_ .--.-..
,/ :., .:. T j,‘.;. i /
- ____ r--r----- --.
- . .._.-. /.-.--. .--;_ ..-- 1.. ~.-+. .---
--. .-.-t --.-.i.. _-.
’ 600~~C!
.;.. I:. . .
I ---l---L-- i I --
9 :
Fig. 2-15 Oxidation of a Ceria Sample
2-33
1.30 * 0.05 mg was obtained. The error as a fraction of the total weight change for
this value was 4%. The precision of the weight change measurements was f 0.05 mg.
The error as a fraction of total weight change for all other weight change measure-
ments was 2% or less.
2.5.2 Results
Microweighing
The microweighing runs are presented in chronological order for samples 6.5, 15, and
30 mole % ceria in Tables 2-9, 2-10, and 2-11. Shown are the sample weight, gas
composition, observed weight loss, time at temperature and % weight loss or degree
of reduction to CeOl 5. .
Reduced samples were always reoxidized to their original weight so that possible loss
of volatile oxide species was excluded. It may therefore be assumed that in the reduction-
oxidation process at temperatures of 1OOO’C or less the exchange of oxygen with the
crystal lattice occurs according to the over-all reaction
Ce02 + + CO = CeOl . 5 + go2
or
CeOl . 5 + $02 = Ce02
(2-7)
P-8)
The equilibrium weight loss values taken from Tables 2-9, 2-10, and 2-11 are recalcu-
lated (Table 2-12) in terms of oxygen partial pressure, temperature, original (Ce02)x
values and equilibrium Ce02 and CeOI 5 values where
We02)y + (CeOl.5)z = WeOJx P-9)
2-32
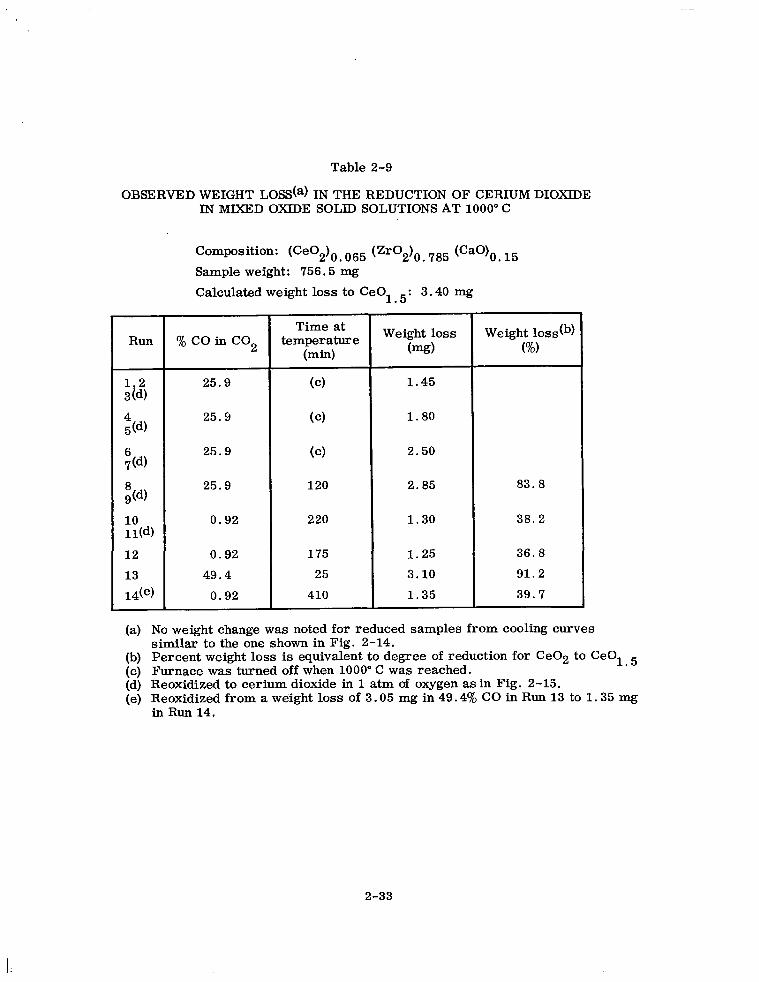
Table 2-9
OBSERVED WEIGHT LOSS(a) IN THE REDUCTION OF CERIUM DIOXIDE IN MIXED OXIDE SOLID SOLUTIONS AT 1000” C
Composition: (CeOdo 065 (Zr02)0 785 (CaO)O 15
Sample weight: 756.5 mg
Calculated weight loss to CeOl 5: 3.40 mg .
Run
hi 4 5(4
6 70%
$4
10 11(d)
12
13
14(e)
%coinco2
25.9
25.9
25.9
25.9
0.92
0.92
49.4
0.92
Time at temperature
Wd
(cl 1.45
(cl 1.80
(cl 2.50
120 2.85 83.8
220 1.30 38.2
175 1.25 36.8
25 3.10 91.2
410 1.35 39.7
Weight loss Weight losstb) (mg) (%I
(a) No weight change was noted for reduced samples from cooling curves similar to the one shown in Fig. 2-14.
(b) Percent weight loss is equivalent to degree of reduction for Ce02 to CeOl 5 (c) Furnace was turned off when 1000” C was reached. (d) Reoxidized to cerium dioxide in 1 atm of oxygen as in Fig. 2-15. (e) Reoxidized from a weight loss of 3.05 mg in 49.4y0 CO in Run 13 to 1.35 mg
in Run 14.
2-33
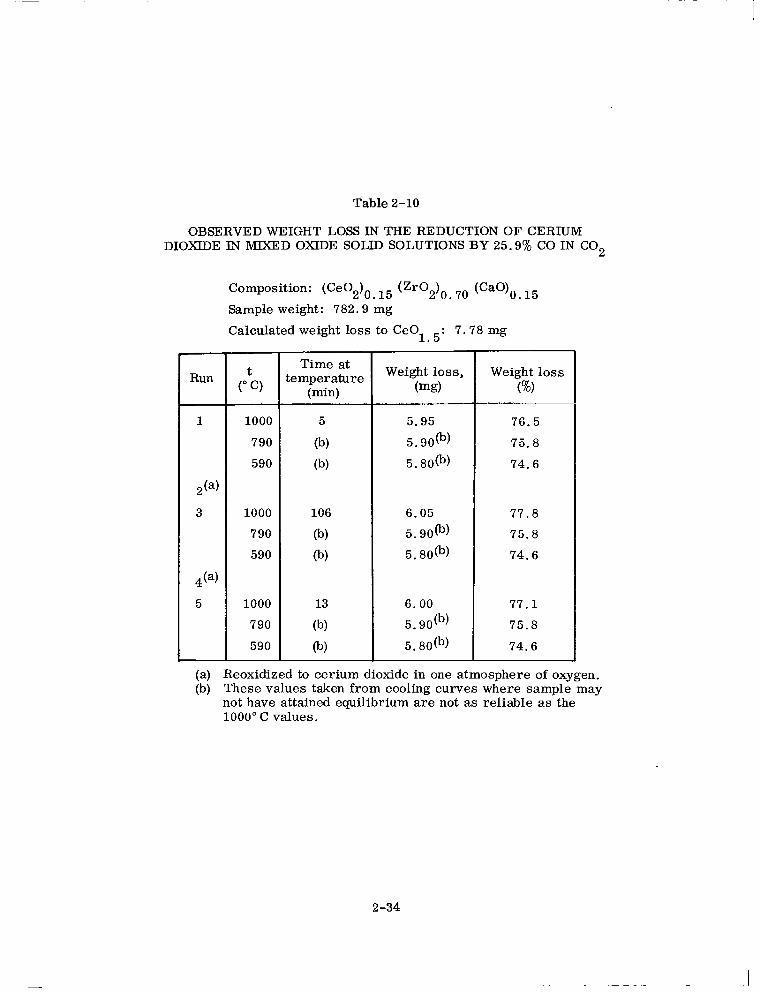
Table 2-10
OBSERVED WEIGHT LOSS IN THE REDUCTION OF CERIUM DIOXIDE IN MIXED OXIDE SOLID SOLUTIONS BY 25.9% CO IN CO,
Run
1
,(a)
3
,(a)
5
Composition: (Ce02)0 I5 (Zr02)0 7. (CaO)O 15
Sample weight: 782.9 mg
Calculated weight loss to CeOl 5: 7.78 mg
&, 1000
790
590
1000
790
590
1000
790
590
Time at temperature
(min)
5
@)
tb)
106
(b)
@I
13
(b)
@)
Weight loss, (mg)
5.95
5. 90tb)
5. 8O(b)
6.05
5.9003)
5. 8O(b)
6.00
5. 90tb)
5. 8O(b)
Weight loss (%)
76.5
75.8
74.6
77.8
75.8
74.6
77.1
75.8
74.6
(a) Reoxidized to cerium dioxide in one atmosphere of oxygen. (b) These values taken from cooling curves where sample may
not have attained equilibrium are not as reliable as the 1000” C values.
2-34
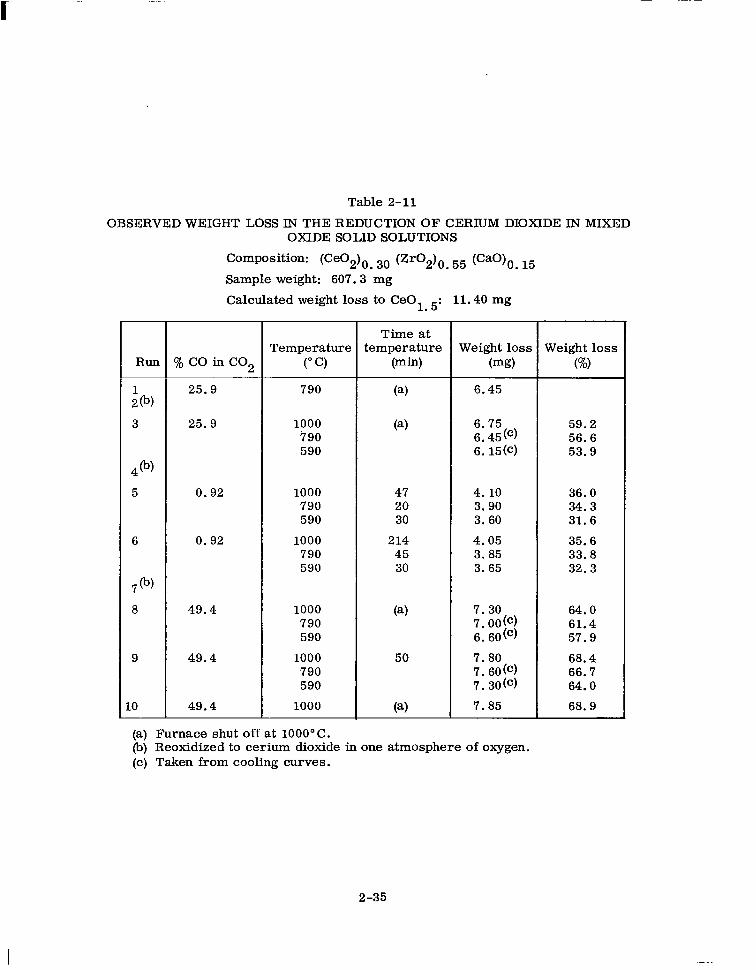
Table 2-11
OBSERVED WEIGHT LOSS IN THE REDUCTION OF CERIUM DIOXIDE IN MIXED OXIDE SOLID SOLUTIONS
Run
h
3
4(b)
5
6
7@)
8
9
LO
Sample weight: 607.3 mg
Calculated weight loss to CeOl 5: . .l. 40 mg
% co in co2
25.9
25.9
0.92
0.92
49.4
49.4
49.4
Temperature to C)
790
1000 790 590
1000 790 590
1000 790 590
1000 790 590
1000 790 590
1000
Time at temperature
WW
(4
(4
47 20 30
214 45 30
(a)
50
(4 7.85
Weight loss Weight loss Ow) (%I
6.45
59.2 56.6 53.9
4. 10 36.0 3. 90 34.3 3. 60 31.6
4.05 35.6 3.85 33.8 3.65 32.3
7.30 64.0 7.00(c) 6. SO(‘)
61.4 57.9
7.80
8. E13 C .
68.4 66.7 64.0
68.9
(a) Furnace shut off at 1000°C. (b) Reoxidized to cerium dioxide in one atmosphere of oxygen. (c) Taken from cooling curves.
2-35
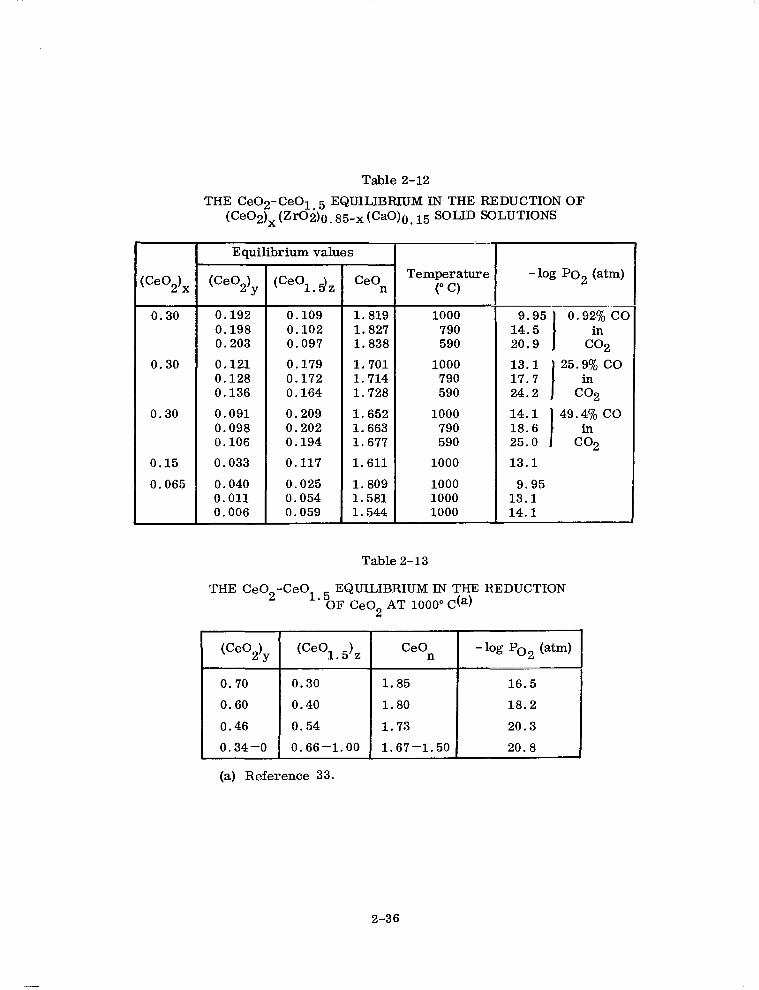
Table 2-12
THE CeO2-CeOl~5EQUILIBRIUMINTHEREDUCTIONOF (Ce02)x(Zr02)O~g5-x(CaO)O~15 SOLID SOLUTIONS
Equilibrium values
Pe02)x (Ce02)y (CeOl. dz CeO, Temr:yture -log PO2 (aW
.- 0.30 0.192 0.109 1.819 1000 9.95 0.92% cc
0.198 0.102 1.827 790 14.5
I
- 0.203 0.097 1.838 590 20.9 cg2
0.30 0.121 0.179 1.701 1000 13.1 25.9% CO 0.128 0.172 1.714 790 17.7 * 0.136 0.164 1.728 590 24.2
I
cE2
0.30 0.091 0.209 1.652 1000 14.1 0.098 0.202 1.663 790 18.6 0.106 0.194 1.677 590 25.0
I 49.4% co -
0.15 0.033 0.117 1.611 1000 13.1
0.065 0.040 0.025 1.809 1000 9.95 0.011 0.054 1.581 1000 13.1 0.006 0.059 1.544 1000 14.1
Table2-13
THE Ce02-CeOl 5 EQUILIBRIUMIN THE REDUCTION ' OF Ce02 AT 1000"C(a)
W02)y 1 (CeOl. 5)z 1 CeO, I
-log Po2 (atm) I
0.70 0.30 1.85 16.5
0.60 0.40 1.80 18.2
0.46 0.54 1.73 20.3
0.34-O 0.66-1.00 1.67-1.50 20.8
(a) Reference 33.
2-36
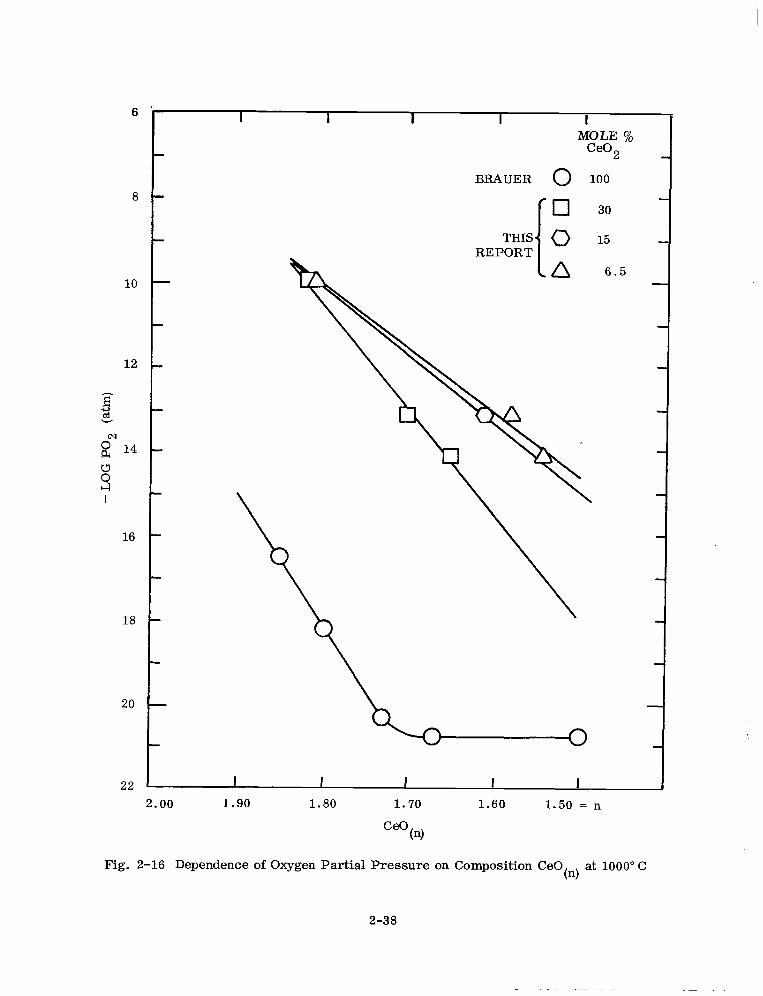
For purposes of comparison, several Ce02-CeOl 5 equilibrium points for the reduc- . tom of 100 mole % ceria at 1000°C taken from the work of Brauer et al. (Ref. 33) are
tabulated in Table 2-13. The values in Table 2-13 and the 1000°C values in Table 2-12
are plotted in Fig. 2-16 showing the overall oxygen content in CeO, in equilibrium
with the oxygen partial pressure for 6.5, 15, 30 and 100 mole Y0 ceria. It is obvious
from Fig. 2-16 that a large increase in the equilibrium oxygen partial pressure occurs
in going from 100% ceria to 6.5-30 mole 70 ceria solid solutions.
For 100 mole % ceria the solid solution range of CeO, extends to n = 1.67 and two
phases coexist from n = 1.67 to 1.50. In the reduction of the ceria dissolved in the
zirconia-calcia solid solutions the solid solution for CeO, appears to extend to
n = 1.50. The solid solution range for CeO, can be deduced from the oxygen partial
pressure dependence on n in CeO,. The phase relationship in pure ceria obtained
by Brauer et al. (Refs. 32,33) from oxygen equilibrium pressure measurements and high
temperature x-ray diffraction studies extends to -650°C. Below -650°C, a more
complicated phase relationship is present in 100 mole ‘% ceria. In contrast, our
oxygen equilibrium data for ceria dissolved in zirconia-calcia solid solutions indicates
that the solid solution fluorite-type one phase region for values of n to 1.50 appears
to extend to room temperature.
Lattice Parameters and Density
The ceria samples reduced in the microbalance apparatus (Section 2.5.1) were sub-
sequently examined by x-rays at room temperature. An additional 30 mole % ceria
sample of sufficient size for x-ray and pycnometric density examination was also
reduced in the microbalance apparatus according to the method described in
Section 2.5.1.
For fully oxidized ceria a single phase solid solution with the fluorite-type structure
was found in the 0 - 45 mole Y0 ceria region. From x-ray and pycnometric density
measurements it was concluded that the oxygen ion vacancy concentration remains
constant at 15 mole %. The increase in lattice parameter with increasing Ce +4
concentration was ascribed to the replacement of Zr ‘4 (0.92 i) by Ce+4 (1.07 i) in the
crystal lattice (Section 2. 3).
2-37
6
8
10
12
16
18
20
22
L
I I I I I 1 MOLE %
Ce02
BRAUER 0 100 i
I cl 30
15
IA 6.5
2.00 1.90 1.80 1.70 1.60 1.50 = n
c*(n)
-
Fig. 2-16 Dependence of Oxygen Partial Pressure on Composition CeO tn)
at 1000” C
2-38
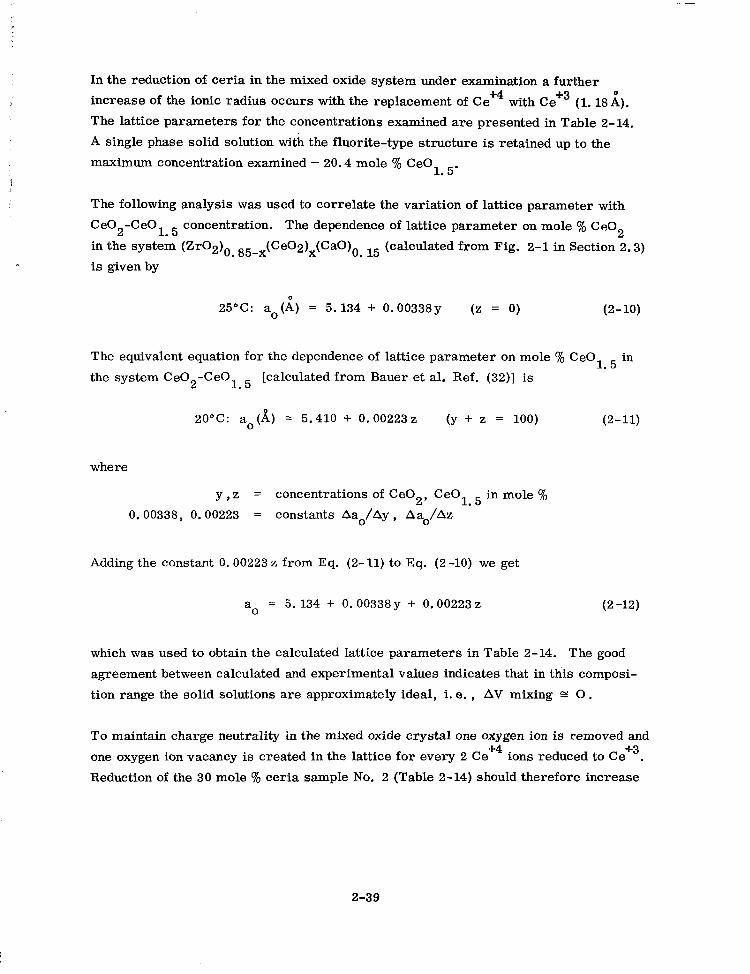
In the reduction of ceria in the mixed oxide system under examination a further
increase of the ionic radius occurs with the replacement of Ce +4 with Ce+3 (1.18 i). The lattice parameters for the concentrations examined are presented in Table 2-14.
A single phase solid solution with the fluorite-type structure is retained up to the
maximum concentration examined - 20.4 mole 70 CeOl 5. .
The following analysis was used to correlate the variation of lattice parameter with
Ce02-CeOl. 5 concentration. The dependence of lattice parameter on mole % Ce02
in the system (Zr02)0. 85-x (Ce02)x(CaO)0. 15 (calculated from Fig. 2-l in Section 2.3)
is given by
25°C: so(i) = 5.134 + 0.00338~ (z = 0) (2-10)
The equivalent equation for the dependence of lattice parameter on mole % CeOl 5 in .
the system Ce02-CeOl 5 [calculated from Bauer et al. Ref. (32)] is .
20°C: a,(A) = 5.410 + 0.00223 z (y + z = 100) (2-11)
where
Y,Z = concentrations of CeO 2, CeOl 5 in mole %
0.00338, 0.00223 = constants Aao/Ay , Aao/Az *
Adding the constant 0. 00223 z from Eq. (2- 11) to Eq. (2 -10) we get
a 0 = 5.134 + 0.00338~ + 0.00223 z (2 -12)
which was used to obtain the calculated lattice parameters in Table 2-14. The good
agreement between calculated and experimental values indicates that in this composi-
tion range the solid solutions are approximately ideal, i.e. , AV mixing E 0.
To maintain charge neutrality in the mixed oxide crystal one oxygen ion is removed and
one oxygen ion vacancy is created in the lattice for every 2 Ce +4 ions reduced to Ce +3 .
Reduction of the 30 mole % ceria sample No. 2 (Table 2-14) should therefore increase
2-39
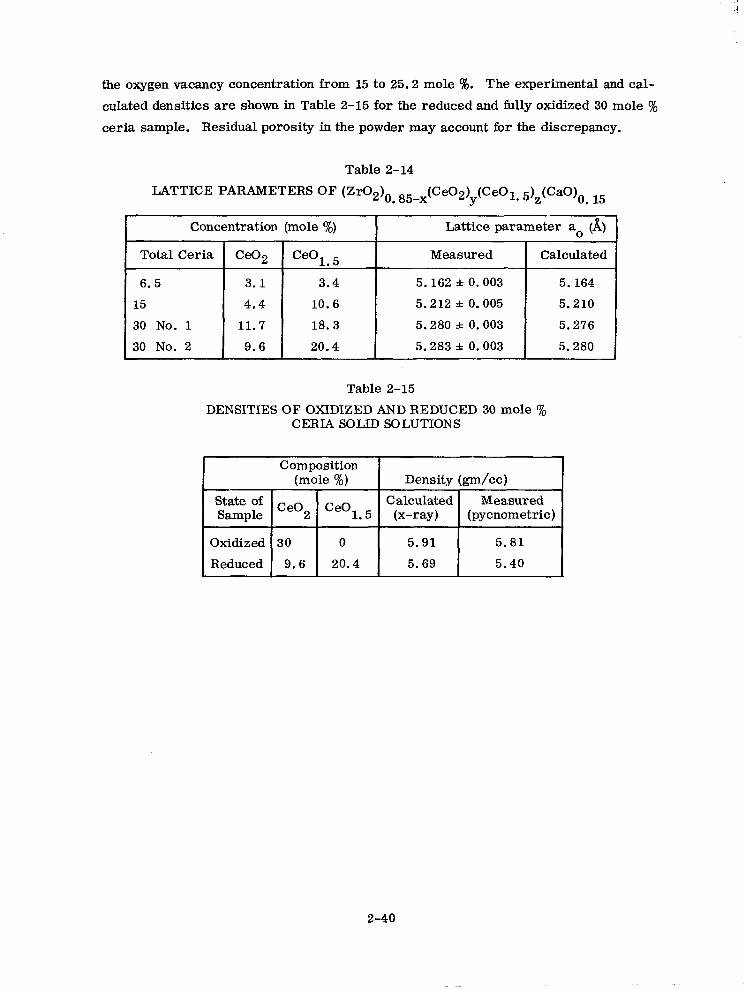
the oxygen vacancy concentration from 15 to 25.2 mole Q. The experimental and cal-
culated densities are shown in Table 2-15 for the reduced and fully oxidized 30 mole %
ceria sample. Residual porosity in the powder may account for the discrepancy.
Table 2-14
LATTICE PARAMETERS OF (Zr02)o . 85-x(Ce02)y(CeOl. 5)z(CaO)0 15
.
r Concentration (mole %) Lattice parameter ao (A)1
Total Ceria
6.5
15
30 No. 1
30 No. 2
C*2 Ceol. 5 Measured Calculated I I
Table 2-15
DENSITIES OF OXIDIZED AND REDUCED 30 mole % CERIA SOLID SOLUTIONS
Composition (mole %) Density &m/cc)
state Of Ce02 Ceol 5 Calculated Measured
Sample . (x-w) (pycnometric)
Oxidized 30 0 5.91 5.81
Reduced 9.6 20.4 5.69 5.40
2-40
2.6 DISCUSSION OF ELECTRICAL CONDUCTM’IY AND DISORDER EQUILIBRIUM
To interpret the results of the conductivity measurements in the CO-CO2 mixtures,
we separate the ionic and electronic contributions to the total conductivity process into
two terms
Ae -Qi/kT
CT = + B e-Qe’kT (2 -13)
where the Q’s are constants over a specified temperature range and characterize
the temperature coefficient of the conductivity and A and B are constant pre-
exponential terms.
The magnitude and temperature-dependence of conductivity is related to the concentra-
tion of defects found in oxide crystals such as vacancies, interstitial ions, excess
electrons, and electron holes. Qi or Qe , in general, contains a term or terms for
the energy required to form these defects, e. g. , energy or Helmholtz free energy,
and a term for the energy, i. e. , activation energy required for their migration or
diffusion through the crystal.
Ionic and electronic defects may arise due to thermal disorder resulting in intrinsic
electrical conductivity. Ionic defects may be produced by oxidation-reduction, due
to interaction of the oxide crystal with oxygen at different partial pressures. The
resultant ionic defects may act as donors or acceptors contributing electrons to the
conduction band or holes to the valence band thus leading to n or p-type semiconduction.
The concentration of ionic defects, e. g. , anion or cation vacancies, may also be
compositionally controlled.
At relatively high temperatures, the assumption that thermodynamic equilibrium is
established between the relative concentrations of ionic defects in the oxide crystal
and the oxygen partial pressure in the gas phase appears to be valid. The interaction
of electronic and ionic defects is therefore also governed by thermodynamic
2-41
considerations. Under these conditions, we may write equations relating the con-
centration of a particular defect species to oxygen partial pressure. By using the law
of mass action we obtain a particular oxygen pressure dependence on concentration or
electrical conductivity. The conductivity, U. , 1
of a charge carrier species is related
to its concentration by
cr. 3 = ‘jeUjCj (2 -14)
where
Z. J
= electrochemical valence of species j
e = electronic charge u. =
J mobility
‘j = concentration
Because of interaction of various defect species, the presence of defects at high con-
centrations where activity coefficients are necessary, the formation of defect complexes
and freezing in of defects below certain temperatures, it is usually difficult to separate
unambiguously the various processes and associated energies of all species contributing
to the electrical conductivity in Eq. (2-13).
The total conductivity at constant temperature may be expressed as a sum of terms of
the type given in Eq. (2-14). When a conductivity-oxygen pressure dependence exists
the total conductivity u may be appropriately given by the expression
(2 -15)
where K ion ’ Ke,Q, and the q’s are constants relating u to P02. for ions,
excess electrons 0 , and electron defects ~3 . In oxide crystals where the number
of oxygen ion vacancies is fixed by composition and is independent of temperature
2-42
and oxygen partial pressure, Eq. (2-15) simplifies to Eq. (2-14). The temperature
dependence of ionic conductivity is then determined solely by the activation energy
required for oxygen ion mobility. This situation appears to exist for zirconia-calcia
solid solutions containing O-45 mole % ceria in oxygen at 1 and 3.5 X 10B4 atm
pressure. The conductivity data (Table 2-7) are therefore in agreement with the
density data indicating that for fully oxidized ceria the number of oxygen ion vacancies
remains constant (Section 2.3). Furthermore, our experimental results indicate that
ace +4 ion size effect on oxygen ion mobility if present must be small (Section 2.4.2).
We can therefore use these results to calculate the ionic and electronic conductivity
components in mixed conduction where the oxygen ion vacancy concentration and thus
the ionic conductivity has remained approximately constant.
In this type of defect structure, further oxygen vacancies, Cl , may be formed by the
loss of an equivalent amount of oxygen on normal lattice sites, O= , to the gas phase,
02(g) , according to the equation 0= = + 02(g) + 0 + 20 (2 -16)
The oxygen vacancies act as donors and are able to contribute two electrons per
vacancy to the conduction band. However, the Ce +4 ions present have an electron
affinity such that the conduction electrons react with the Ce+4 lattice ions to form
Ce+3 . ions. The electron conduction is thus appreciably reduced.
The relative concentration of free conduction electrons depends on the relative energy
levels of the conduction band and the Ce +4 acceptor levels. The overall reaction for
the interaction of oxygen in the gas phase with the solid solution oxide crystal is
(2Ce+4 + O=)lattice see (2Ce+3 + q )latiice + + 02w (2 -17)
2-43
The equilibrium constant, Kl , can be obtained by applying the law of mass action:
K1 = ,,A/” # ‘ce+31; 2 [C e+4]
(2-18)
The constant Kl should be independent of composition at a particular temperature.
Generally in defect crystals these thermodynamic relations have been found to hold
for small defect concentrations.
Seven values of the thermodynamic constant K1 for the reaction Eq. (2-18) are cal-
culated from the microweighing data and presented in Table 2-16. The concentrations
of thevarious species are in mole fractions and no corrections for differences in
density are made. For a variation of oxygen pressure greater than 104, and for 6.5,
15, and 30 mole ‘j$ ceria 5 values of K1 are within a factor of 2 of each other for a
disorder equilibrium where AC, (mole fraction) C: 0.06. For the other two samples
AC,- = 0.09 and 0.11 and these K values are lower by a factor of 5 to 10 with respect
to the other 5 values. (Average value of K1 = 42 * 22 x lo-‘.) The deviation for the
2 samples may be due to the large ACo values leading to formation of defect com-
plexes and more tight bonding of lattice oxygen.
Another possibility is that sufficient time had not elapsed for equilibrium between the
gas phase and the oxide to have been achieved and thus not all the oxygen was removed
from the lattice.
Equation (2-18) should be applicable for reduction conditions where Ce +3 5 0.2.
Equation (2-18) therefore breaks down for 100% ceria although the oxygen partial
pressure dependence changes qualitatively in the right direction (Fig. 2-16).
2-44
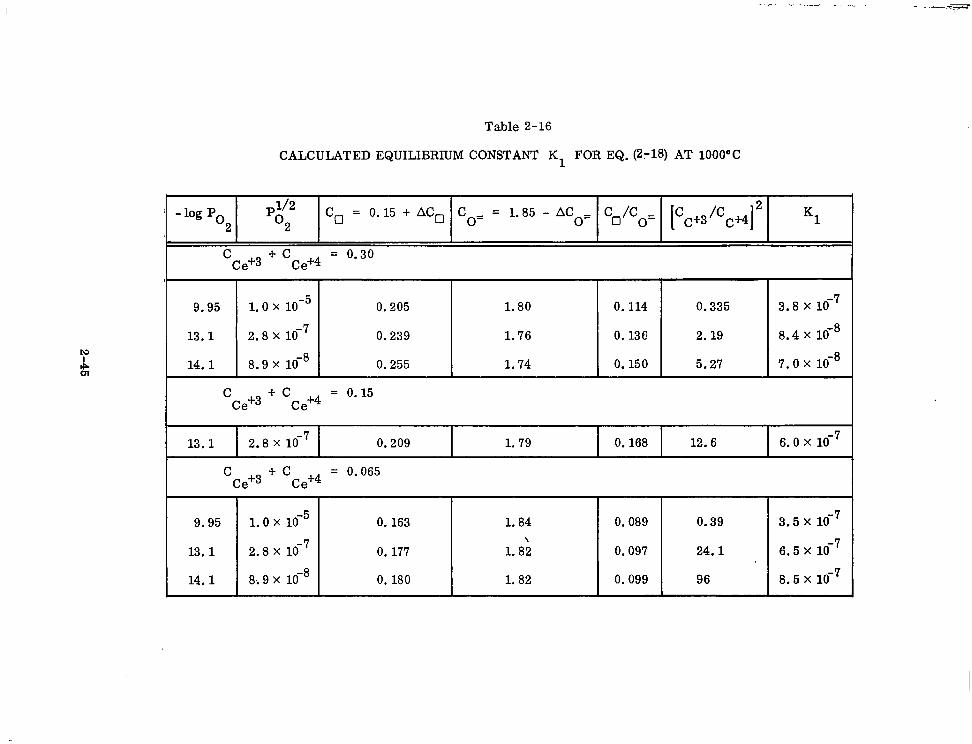
Table 2-16
CALCULATED EQUILIBRIUM CONSTANT K1 FOR EQ.(2:18) AT 1000°C
-log PO l/2
2 PO2 % = 0.15 + ACg Co= = 1.85 - ACo= C /C _
0 o- I C c+3/Cc+4]2 K1
C Ce+3 + Cce+4 = Oe30
9.95 1.0 x 1o-5 0.205 1.80 0.114 0.335 3.8 x 1O-7
13.1 2.8 x 1O-7 0.239 1.76 0.136 2.19 8.4 x 1O-8
14.1 8.9 x 1O-8 0.255 1.74 0.150 5.27 7.0 x lo-8
C Ce+3 + Cce+4 = 0*15
13.1 2.8 x 1O-7 0.209 1.79 0.168 12.6 6.0 x 1O-7
9.95 1.0 x 1o-5 0.163 1.84 0.089 0.39
13.1 2.8x -7 10 0.177 1.8‘2 0.097 24.1
14.1 8;9 x lo-' 0.180 1.82 0.099 96
3.5 x 1o-7
6.5 x 1O-7
8.5 x 1O-7 I
Brauer (Ref. 33) calculates a value of m = -180 kcal/mole O2 for the partial molar
enthalpy of reaction of oxygen with CeOl 83 solid solution at 850°C. From results of . Table 2-12for a 30 mole % ceria solid solution at CeOl 83 a value of -133 k&/mole 0 . was calculated between 1000 and 790°C from the equation
2
-
AH = RTlT2 *p2 - !nPpl
T2-T 1
(2-19)
where P is the equilibrium oxygen pressure at the particular temperature, and all
other symbols have their usual meaning. The same AH value was obtained for
Ceol. 71 and Ceol. 65 (30 mole % ceria) and should remain constant throughout CeO,.
Reaction 2-17 is therefore endothermic with AH1 = + 133 kcal/mole O2 (+5.76 eV).
As can be deduced from Eq. (2-19), the value of K1 decreases or PC2 over CeO,
decreases with decreasing temperature.
To obtain a term for the electronic conductivity component equivalent to the second
term in Eq. (2-13) we proceed as follows: from Eq. (2-18) the ratio C
given by Ce+3 / Cce+4 is
C /
C Ce+3 Ce +4
= K:/2(Co=/co)1’2P;);‘4 (2 -20)
Kl , the equilibrium constant, is given by the standard thermodynamic expression
K1 = exp (AS/kT) exp (-AHl/kT) (2-21)
where AS1 is the standard entropy and AHI is the standard enthalpy [m in
Eq. (2-19)] associated withReaction(2-17). We may also write
K1/2 1
= A;/’ exp (- AH l/2kT ) (2 -22)
where the pre-exponential term A1 = exp (ASl/k) .
2-46
The conductivity-temperature data is expressed in terms of constant values of % CO
co’pco2)~ -l/4 It is therefore desirable to relate PO2 Eq. (2-20) to
K2 for the reaction
co++02 = co2
is given by an expression equivalent to Eq. (2-22)
K1/2 2
= A;” exp (- AH2/2kT)
so that from K2 in reaction 2-23 and Eq. (2-24) we obtain
Pit’4 = [Pco/pco2)1~2 Aii2 exp ( - AH2/2kT)
(2-23)
(2-24)
(2-25)
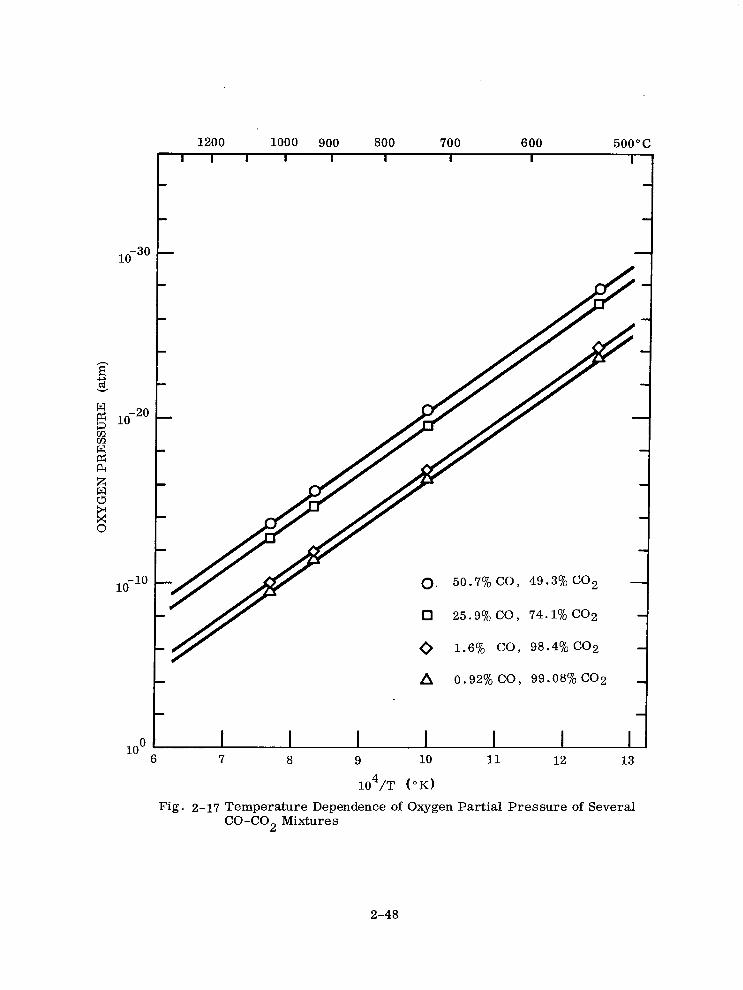
The temperature dependence of oxygen partial pressure for several CO-CO2 mixtures
calculated from K values given by Darken and Gurry (Ref. 34) is shown in Fig. 2-17.
From thermodynamic data (Ref. 36) AH2 = - 134.4 kcal/mole 02( - 5.82 eV) at
1200” K.
Substituting Eqs. (2-22) and (2-25) in Eq. (2-26) we obtain
C Ce+3 CCe+4 I
= A:‘2Ai’2(CO=/CO)1’2 (pco2/pco2)1’2 exp [ - (AH1 + AH2)/2kT]
(2-26)
For C Ce+3
5 0.2 Eq. (2-26) simplifies to Eq. (2-27)
cce+3/CCe+4 = k’ (pco~co2)l/z exp (- AH’/2kT) (2-27)
2-47
r 1200 1000 900 800 700 600 500°C
-10 10
A o.98, CO, 99.08% CO2
in 0 I I I I I I
1
*- 6 7 8 9 10 11 12 13
104/T (“K)
Fig. 2-17 Temperature Dependence of Oxygen Partial Pressure of Several CO-CO2 Mixtures
2-48
where
k’ = AlI2 ‘I2 1 A2 (co=/Co)l/z since (Co=/Co)1’2 = constant (Table 2-16) and
AH’ = AH1 + AH2 (2-28)
Since
AH1 + AH2 = AH’ M 0 (for x = 0.30)
the C Ce+3’CCe+4 ratio Or Cce+3 (for constant x) should be very nearly independent
of temperature and remain approximately constant at constant % CO in C02. This is verified experimentally.
A statistical distribution of Ce +4 and Ce +3 ions in reduced (Zr02)0S 85-x(Ce02)x
(CaO), 15 is expected to occur in the cation lattice. Very nearly all of the electrons . released from Reaction (2 -16) are trapped by Ce +3 ions. Ce+3 . ions can exchange
electrons with adjacent Ce +4 leading to a hopping mechanism of electron conduction.
Zr +4 +2 and Ca ions are blocking to electron transfer or exchange. The number of
continuous paths which exist for electron transfer through the crystal is therefore
proportional to x, the mole fraction of ceria (Ce +4 + Ce+3). For a constant x an
activation energy Q3 may be associated with the Ce +3 - Ce+4 electron hopping
mechanism and should be independent, at least to a first approximation, of CCe+3.
Experimentally the total activation energy for electronic conduction was found to be
approximately independent of CCe+3 for constant x (Fig. 2-10). As a function of x
the total activation energy decreases rapidly at low x, approaches a constant value
asymptotically, and is approximately constant at x 2. 0.15 (Fig. 2-10).
For constant x the electronic conductivity should therefore be proportional to mole
fraction CCe+3 and to a term A3 exp (-Q3/kT).
2-49
To solve for C Ce+3
at any mole fraction 5 0.2 we proceed as follows: From
C Ce+3’CCe+4
= B defined by Eq. (2-27) and
C +c Ce+3 Ce+4
=x
we obtain
C Ce+3
= xB/(l + B)
(2-29)
(2-30)
Therefore for a constant value of x (x = c) and assuming AH’ = 0 for all values
0 <x< 0.30
(2-31)
where k” is a constant relating ue to C Ce+3’
From Eq. (2-31) a plot of log u vs.
l/T at constant ‘% CO in CO2 gives Q3. At a constant temperature and for x and ui
constant, the electronic conductivity u is 0 at Ce +3 = 0 and should be proportional
Pco/Pco,) 1’2 for k:(PCC/PCC,) l/2 << 1. = kp$‘4
According to Eq. (2-25),
at constant temperature.
Conductivity as a function of PC2 for 15 mole % ceria at three constant temperatures
is shown in Fig. 2-11. At 560 and 727 “C! an increase of u with decrease of PC2 is
clearly noted. (At 977 “C the conductivity is predominately ionic. )
The conductivity curve for 727 “C is replotted in Fig. 2-18 in terms of conductivity as
a function of CD , the mole % oxygen vacancies and C Ce+3’
The rise in conductivity
occurs in the 15 to 16 mole % C, interval. The mole fraction of C Ce+3
therefore
increases from 0 to 0.02. The conductivity remains approximately constant with a
doubling of C Ce+3
to 0.04 and then decreases with further increase in concentration
2-50
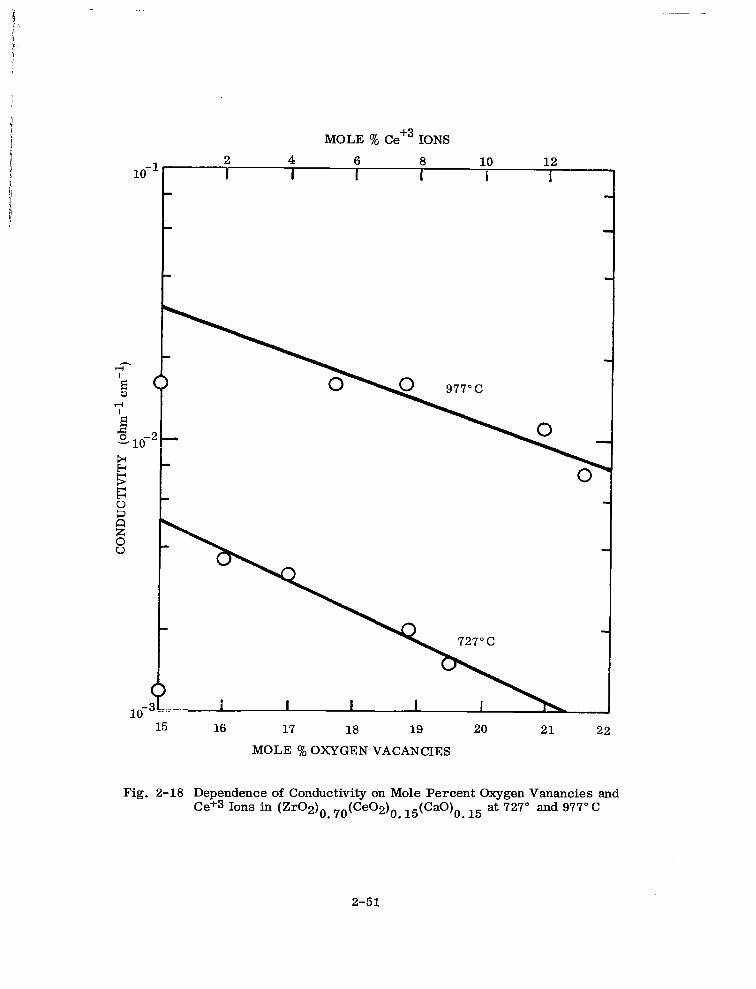
i i MOLE ‘j?~ Ce+3 IONS
4 6 8 10 12 I I I I I
15 16 17 18 19
MOLE % OXYGEN VACANCIES
20
Fig. 2-18 Dependence of Conductivity on Mole Percent Oxygen Vanancies and Ce+3 Ions in (Zr02)0 . 70(Ce02)0 . 15(CaO)o . l5 at 727” and 977°C
2-51
+3 0fCe . A sufficient number of points over a large u and PC2 interval is not avail-
able to obtain a very precise value of the slope. From the slope found in Fig. 2-11 n - l/q value of 7 was calculated for q in PC2 at 727 “c. (The theoretical value is 4. )
Figure 2-12 shows a plot of conductivity vs. mole % ceria at four different tempera-
tures for 1.6% CO in C02. The electronic conductivity increases approximately
linearly with increasing mole % ceria at low mole % ceria but appears to be leveling
off and approaching a constant value of u at higher values of ceria. The electronic
conductivity appears to be at a maximum near 1.6% CO in CO2 and a further increase
in C Ce+3
does not increase conductivity but has the opposite effect (Fig. 2-18).
As a first approximation, from Fig. 2-12 the number of Ce+3-Ce+4 conducting paths
through the crystal can be taken as varying in a linear manner in the region O-30 mole%.
Therefore in the range O-30 mole % the electronic conductivity should to be propor-
tional to x the total ceria concentration, and to Ce +3 . From this picture for a con-
stant value of x, 0 < x < 0.30, it appears reasonable that the ue should reach a
maximum and level off with increasing Ce +3
. A drop in conductivity is more difficult
to explain. The total conductivity is measured as a sum an electronic and ionic
component.
The following explanation may be proposed for a drop in the electronic component of
conductivity: when ceria in the solid solution approaches the fully reduced state
(depending on the total ceria concentration or the total number ceria paths through the
electrolyte) electronic conduction by Ce +4-Ce+3 electron hopping is replaced by a
different mechanism. In solutions with ceria I 15 mole % this leads to a large drop in
electronic conductivity from its peak value but in solutions with 30 mole % ceria a
similar large drop in the conductivity is not evident (Fig. 2-9). The change in the value
of the activation energy with composition (Fig. 2-10) may be associated with this effect.
With increasing reduction of Ce +4 to Ce+3 the concentration of oxygen vacancies is no
longer constant but increases appreciably (Fig. 2-18). For zirconia-calcia solid solu-
tion evidence is available in the literature (Refs. 17,20,21) that the ionic conductivity
goes through a maximum and then decreases with increasing oxygen vacancy concentra-
tion. Tien and Subbarao (Ref. 18) did not find a conductivity maximum but in the range
13-20 mole % oxygen vacancies the log of the conductivity was found to decrease at an
approximately linear rate. At 977 “C for 15 mole % ceria the total conductivity is
2-52
predominately ionic (Fig. 2-18) and a decrease of conductivity with increasing oxygen
vacancy concentration is evident. It may be that we are in a region where a maximum
in ionic conductivity exists, falling off sharply with increasing oxygen vacancy con- +3 centration or possibly with increasing Ce ion concentration due to an ion size effect
decreasing the oxygen ion mobility. Another possible explanation may involve an +3 ordering of the fluorite structure at large Ce concentrations in this particular tem-
perature range leading to a decrease in the ionic conductivity component. At lower
temperatures, this decrease in ionic conductivity may account only for a fraction of
the total decrease in conductivity (727 and 560 “c).
The fraction of ion and electron component contributing to the electronic conductance
may be calculated from the conductivity-temperature data and the equations presented
for a very wide range of conditions. Transport number data from EMF measurements
and oxygen efficiency data on cells containing these mixed oxides as electrolytes should
help in further interpreting the conductivity behavior of this oxide system.
2-53
Section 3
ELECTROLYSIS OF C02-H20 MIXTURES
3.1 ZIRCONIA-CALCIA TUBE CELLS
Mixtures of carbon dioxide and water vapor were electrolyzed at temperatures less than
800°C using the tube cell apparatus shown in Figs. 3-l and 3-2. A tube of composition
(Zr02)O; 85 (cao)os 15 1 mm thick with porous platinum electrodes each 1 cm2 in area
served as the electrolytic cell. The output of each reaction product, oxygen, carbon
monoxide, and hydrogen was monitored to determine the distribution of the current
between CO2 and H20 electrolysis as well as the total current efficiency (i. e., the
oxygen current efficiency). The CO2 flow rates were relatively high compared to the
current to prevent concentration polarization, and no more than 8% of the available
CO2 was reduced in any run.
3.1.1 Experimental Results
The experimental data are summarized in Table 3-l. Since the electrode area was
1 cm2 , values of the current and current density are the same. The gas flow pattern
is illustrated schematically in Fig. 3-3. The carbon dioxide flow rate, jC02; oxygen flow rate, j02; gas outflow, joUT; electrolysis current, i; and water saturater
temperature, t, were read directly. All of the other flow rates were calculated from
these data and the gas analysis data using the following relationships:
jbo2 = j,, + jco2
jouT = jco2 + jco + jH2 = jbo2 + .iH2
(3-l)
(3-2)
3-1
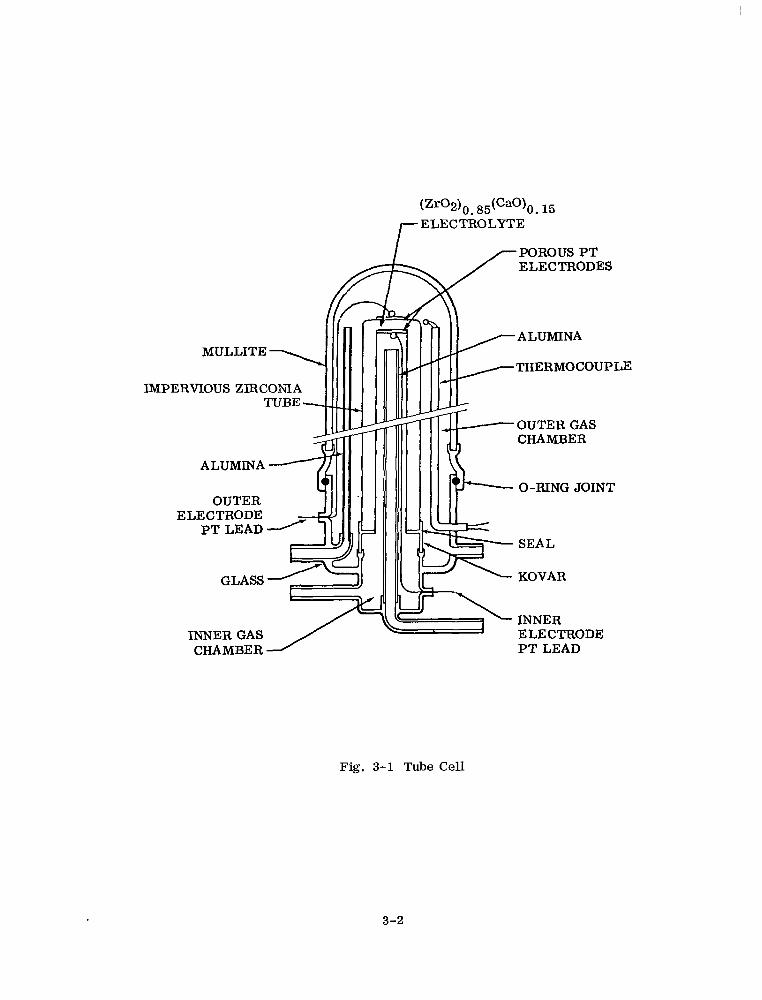
MULLITE \
IMPERVIOUS ZIRCOMA
(ZrO24). *@q), 15 ELECTROLYTE
/-POROUS PT / ELECTRODES
THERMOCOUP
ALUMINA
OUTER ELECTRODE
PT LEAD
0 -FtING JOINT
SEAL
GLASS KOVAR
INNER GAS CHAMBER /’
INNER ELECTRODE PT LEAD
LE
Fig. 3-l Tube Cell
3-2
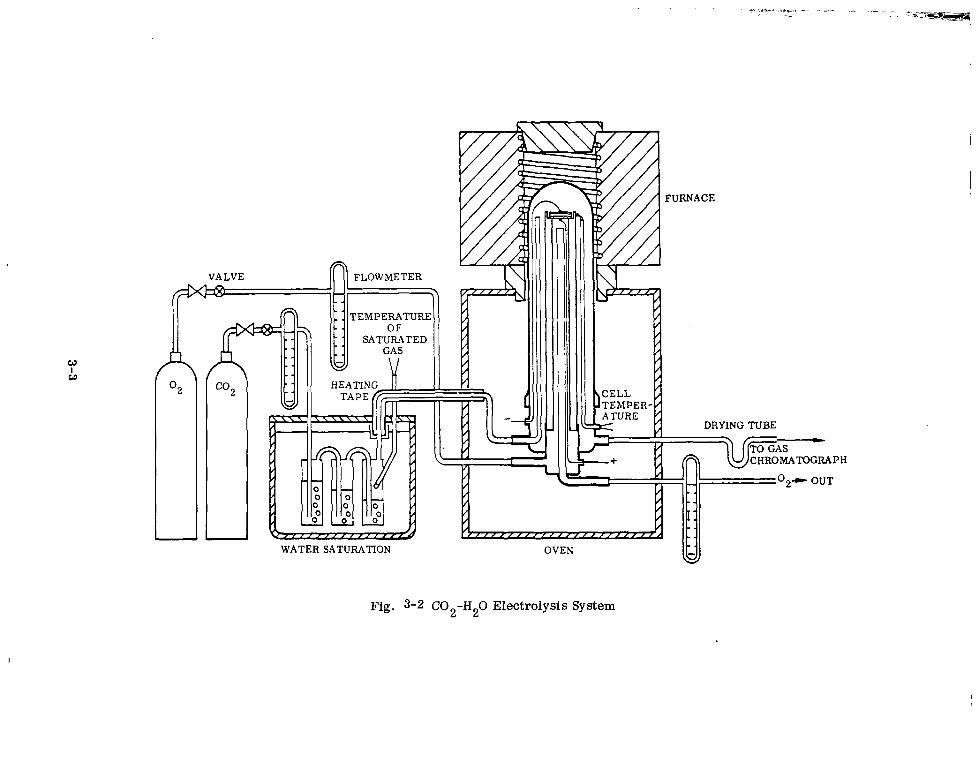
VALVE f=l FLOWMETER
FURNACE
WATER SATURATION OVEN
Fig. 3-2 C02-H20 Electrolysis System
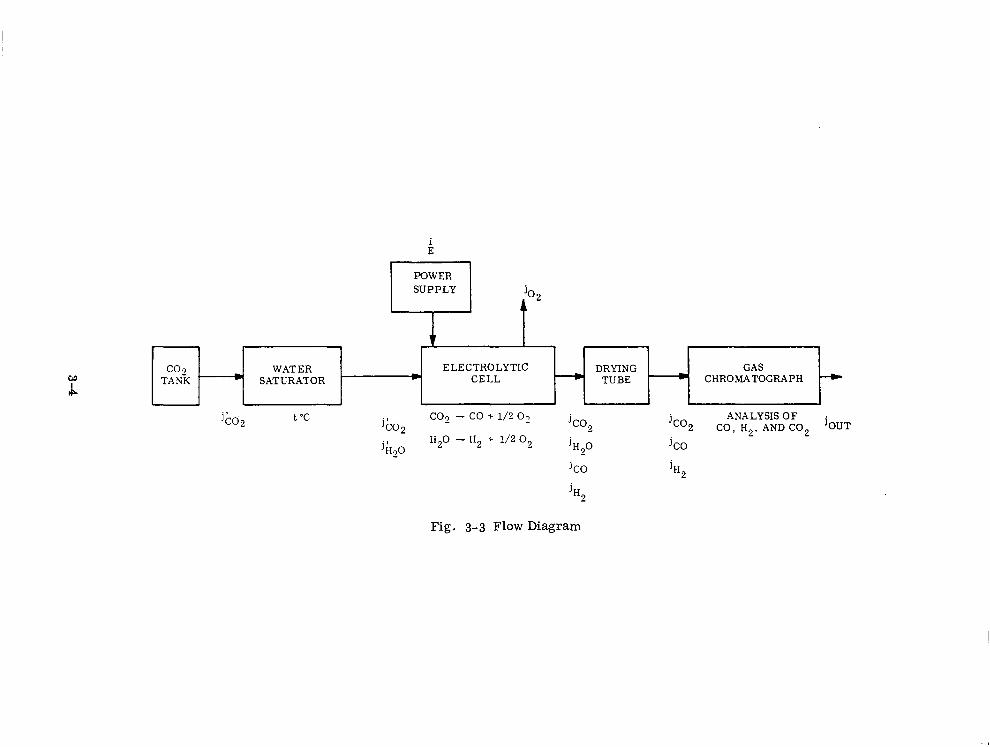
jo2 t co2 WATER ELECTROLYTIC DRYING GAS
TAEiK - SATURATOR c CELL - TUBE - CHROMATOGRAPH -
GO2 t “C co9 co, -
- co 7 l/2 02 jco2
j&O Hz0 - H2 + l/2 0,
jH20
ko2 ANALYSIS OF
CO, H2, AND CO2 jOUT
ko
lco jH2
4-3
Fig. 3-3 Flow Diagram
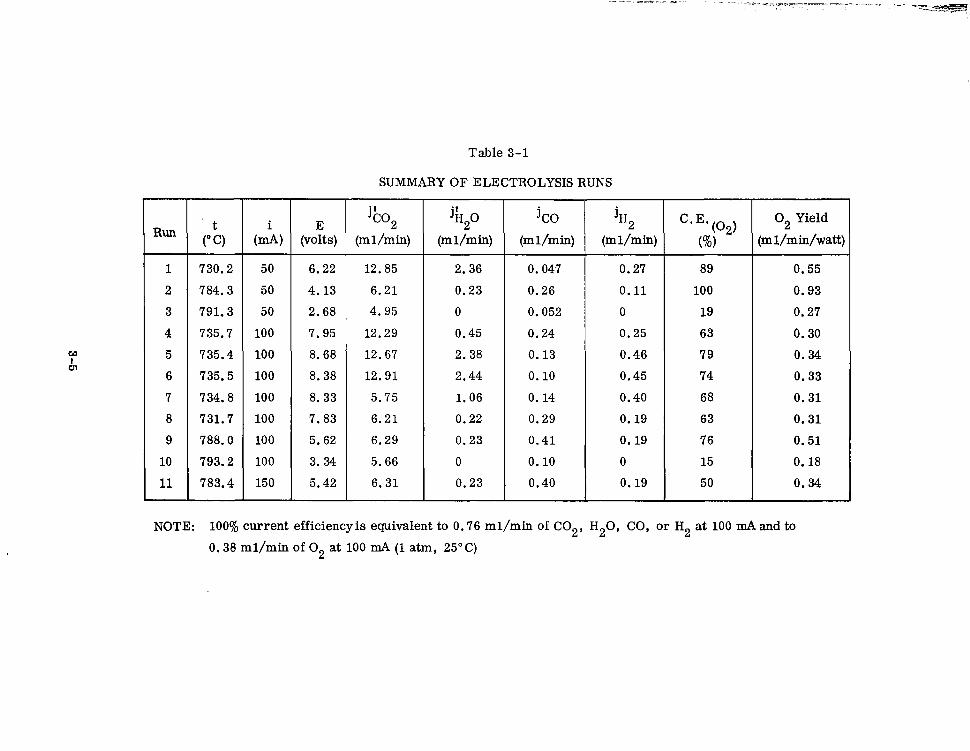
Table 3-l
SUMMARY OF ELECTROLYSIS RUNS
j&O Cl20 jco jH2 cl* ;;c,o,,
O2 Yield Run (I& (voyts) (mlh& (m l/min) (ml/min) (m l/min) 0 (m l/min/watt)
1 730.2 50 6.22 12.85 2.36 0.047 0.27 89 0.55
2 784.3 50 4.13 6.21 0.23 0.26 0.11 100 0.93
3 791.3 50 2.68 4.95 0 0.052 0 19 0.27
4 735.7 100 7.95 12.29 0.45 0.24 0.25 63 0.30
5 735.4 100 8.68 12.67 2.38 0.13 0.46 79 0.34
6 735.5 100 8.38 12.91 2.44 0.10 0.45 74 0.33
7 734.8 100 8.33 5.75 1.06 0.14 0.40 68 0.31
8 731.7 100 7.83 6.21 0.22 0.29 0.19 63 0.31
9 788.0 100 5.62 6.29 0.23 0.41 0.19 76 0.51
10 793.2 100 3.34 5.66 0 0.10 0 15 0.18
11 783.4 150 5.42 6.31 0.23 0.40 0.19 50 0.34
NOTE: 100% current efficiency is equivalent to 0.76 ml/min of C02, H20, CO, or H2 at 100 mA and to
0.38 ml/min of O2 at 100 mA (1 atm, 25°C)
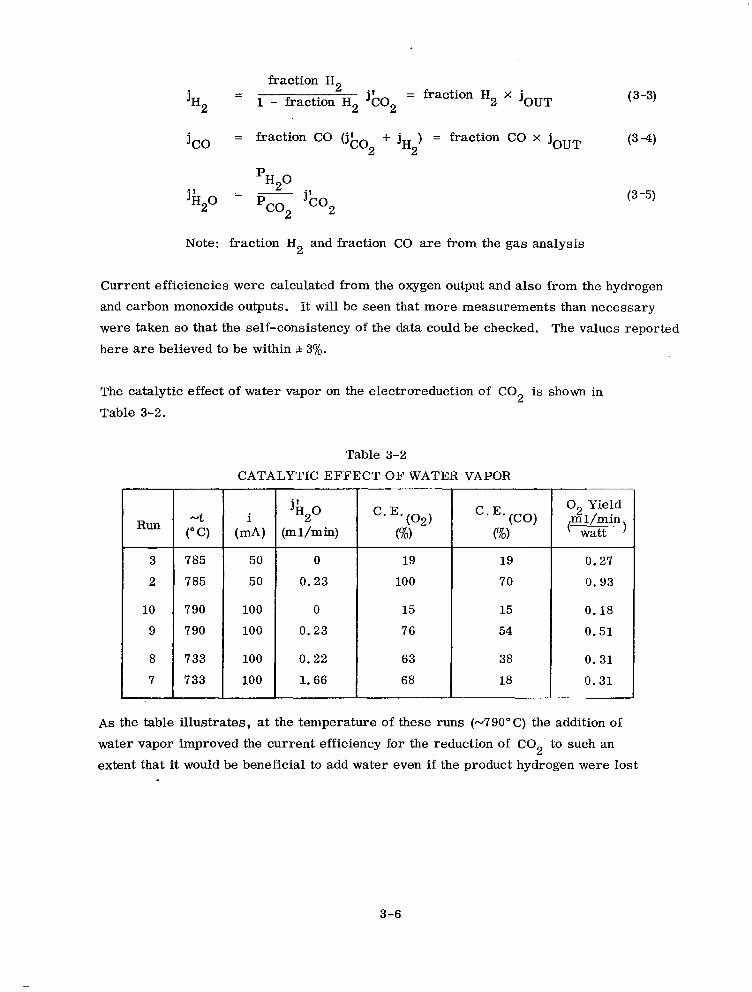
jH2
fraction H2
= 1 - fraction H2 %02 = fraction H2 X joUT (3-3)
420 = fraction CO (jb, + j, ) = fraction CO x j,,, (34) 2 2
‘H20
= pco (3 -5)
2
Note: fraction H2 and fraction CO are from the gas analysis
Current efficiencies were calculated from the oxygen output and also from the hydrogen
and carbon monoxide outputs. it will be seen that more measurements than necessary
were taken so that the self-consistency of the data could be checked. The values reported
here are believed to be within f 3%.
The catalytic effect of water vapor on the electroreduction of CO2 is shown in
Table 3-2.
Table 3-2
CATALYTIC EFFECT OF WATER VAPOR I I I jk20 O2 Yielc i
Run (2) i m l/mir
(ml/min) (- watt 9
3
2
785
785
0
0.23
19
70
0.27
0.93
10
9
0
0.23
15 0.18
54 0.51
8
7
0.22
1.66
c- ;;()C2) 0
19
100
15
76
63
68
38 0.31
18 0.31
As the table illustrates, at the temperature of these runs (-790°C) the addition of
water vapor improved the current efficiency for the reduction of CO2 to such an
extent that it would be beneficial to add water even if the product hydrogen were lost
3-6
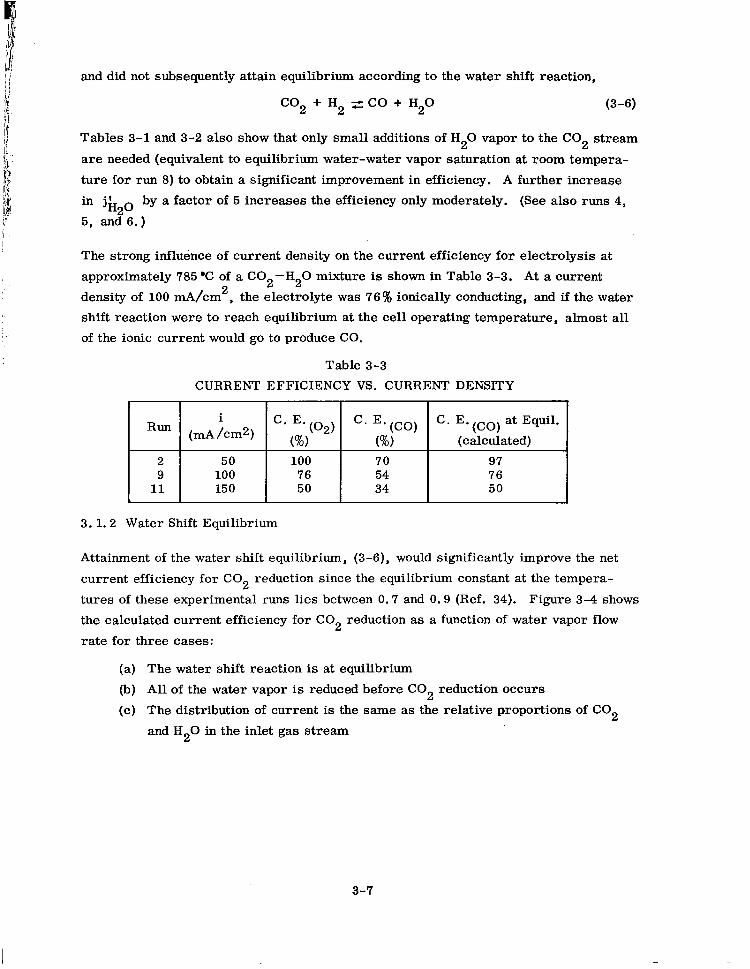
and did not subsequently attain equilibrium according to the water shift reaction,
CO2 + H2 = CO + H20 (3-6)
Tables 3-l and 3-2 also show that only small additions of H20 vapor to the CO2 stream
are needed (equivalent to equilibrium water-water vapor saturation at room tempera-
ture for run 8) to obtain a significant improvement in efficiency. A further increase
in jhzo by a factor of 5 increases the efficiency only moderately. (See also runs 4,
5, and 6.)
The strong influence of current density on the current efficiency for electrolysis at
approximately 785 l C of a C02-H20 mixture is shown in Table 3-3. At a current
density of 100 mA/cm2, the electrolyte was 76% ionically conducting, and if the water
shift reaction were to reach equilibrium at the cell operating temperature, almost all
of the ionic current would go to produce CO.
Table 3-3
CURRENT EFFICIENCY VS. CURRENT DENSITY
3. 1.2 Water Shift Equilibrium
Attainment of the water shift equilibrium, (3-6), would significantly improve the net
current efficiency for CO2 reduction since the equilibrium constant at the tempera-
tures of these experimental runs lies between 0.7 and 0.9 (Ref. 34). Figure 3-4 shows
the calculated current efficiency for CO2 reduction as a function of water vapor flow
rate for three cases:
(a) The water shift reaction is at equilibrium
(b) All of the water vapor is reduced before CO2 reduction occurs
(c) The distribution of current is the same as the relative proportions of CO2
and H20 in the inlet gas stream
3-7
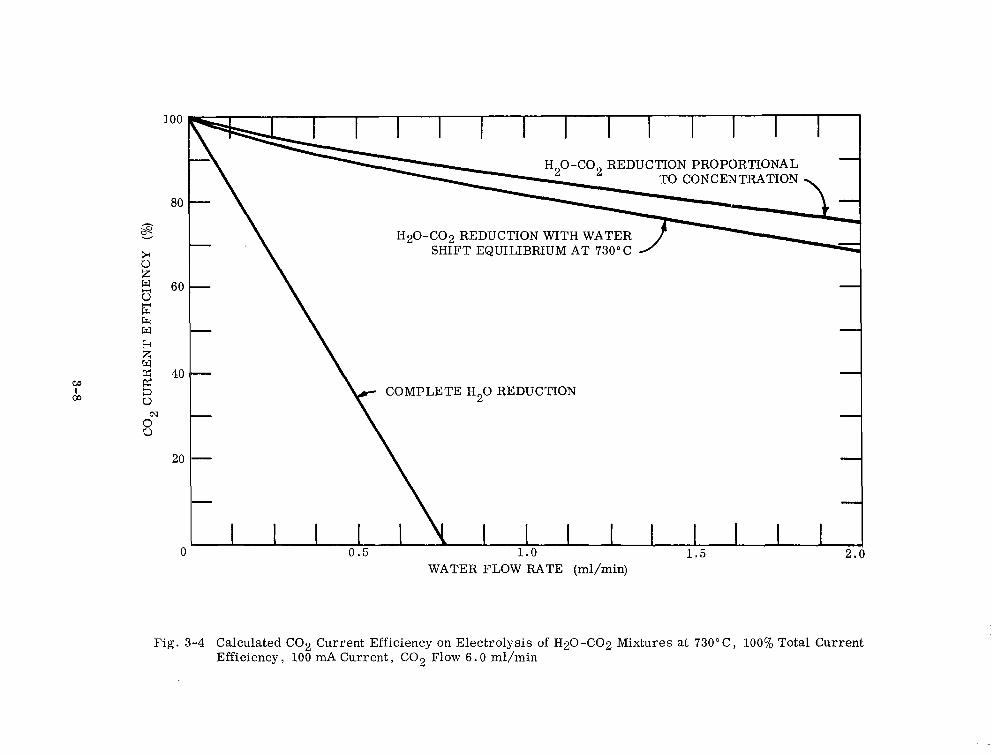
H20-CO2 REDUCTION PROPORTIONAL
COMPLETE H20 REDUCTION
1 - I I I I I I I I I 1
0 0.5 1.0 1.5 WATER FLOW RATE (ml/min)
Fig. 3-4 Calculated CO2 Current Efficiency on Electrolysis of H20-CO2 Mixtures at 730” C, 100% Total Current Efficiency, 100 mA Current, CO2 Flow 6.0 ml/min
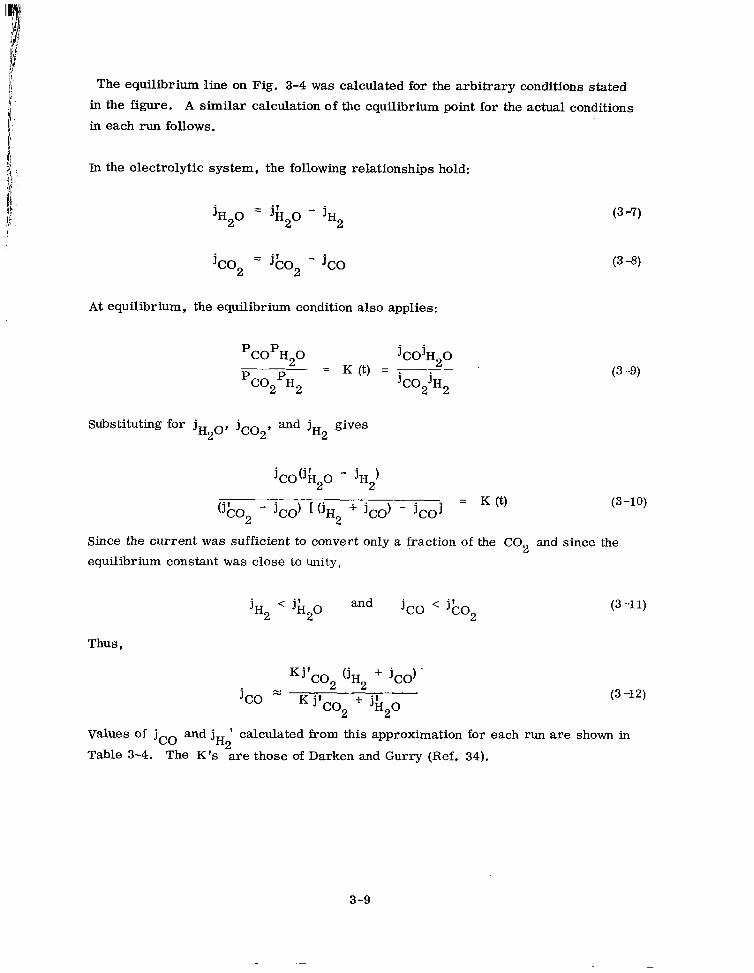
The equilibrium line on Fig. 3-4 was calculated for the arbitrary conditions stated
in the figure. A similar calculation of the equilibrium point for the actual conditions
in each run follows.
III the electrolytic system, the following relationships hold:
jHso = jhzo - jH2
jco2 = jbo2 - j,,
At equilibrium, the equilibrium condition also applies:
jCOjHoO - = K (t) = . y pC02pH2 jC02jH2
(3 -7)
(3-3)
(3 -9)
Substituting for jHzo, jco2, and jH2 gives
jco(jhzo - jH2)
(%02 - jco) [ (jH2 + j,,) - j,,] = K @) (3-10)
Since the current was sufficient to convert only a fraction of the CO2 and since the
equilibrium constant was close to unity,
jH2 < jk20 and jco < Go, (3 -11)
Thus,
j,, =
WC02 (jH2 + jco).
K Yco2 + jfIzo (3 -12)
values of j,, and jH2 calculated from this approximation for each run are shown in
Table 3-4. The K’s are those of Darken and Gurry (Ref. 34).
3-9
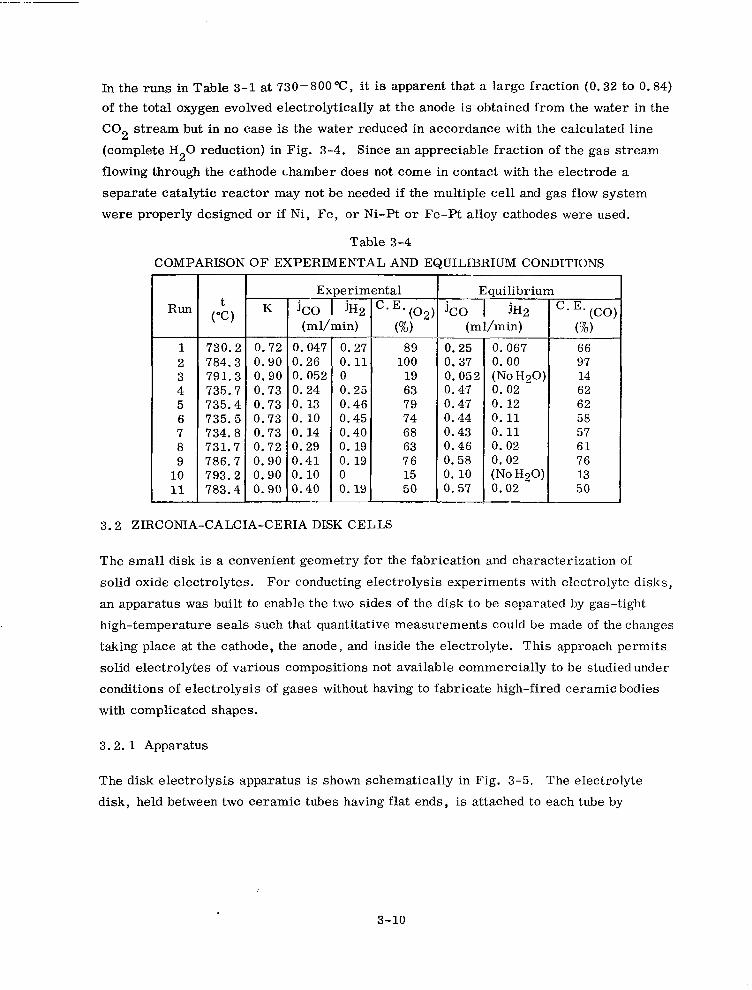
In the runs in Table 3-l at 730-800%, it is apparent that a large fraction (0.32 to 0.84)
of the total oxygen evolved electrolytically at the anode is obtained from the water in the
CO2 stream but in no case is the water reduced in accordance with the calculated line
(complete Hz0 reduction) in Fig. 3-4. Since an appreciable fraction of the gas stream
flowing through the cathode chamber does not come in contact with the electrode a
separate catalytic reactor may not be needed if the multiple cell and gas flow system
were properly designed or if Ni, Fe, or Ni-Pt or Fe-Pt alloy cathodes were used.
Table 3-4
COMPARISON OF EXPERIMENTAL AND EQUILIBRIUM CONDITIONS
Run
1 730.2 0.72 0.047 0.27 2 784.3 0.90 0.26 0.11 3 791.3 0.90 0.052 0 4 735.7 0.73 0.24 0.25 5 735.4 0.73 0.13 0.46 6 735.5 0.73 0. 10 0.45 7 734.8 0.73 0.14 0.40 8 731.7 0.72 0.29 0.19 9 786.7 0. so 0.41 0. 19
10 793.2 0. so 0. 10 0 11 783.4 0.90 0.40 0.19
K Exnerimental
5,, (
(ml/min) r
‘Ey2 0
89 100
19 63 79 74 68 63 76 15 50
T ) T -L
I
Eauilibrium
ko jH2 (ml/min) l-
0.25 0.067 0.37 0.00 0.052 (No H20 0.47 0. 02 0.47 0.12 0.44 0.11 0.43 0.11 0.46 0.02 0. 58 0. 02 0. 10 (No H20 0.57 0.02
1 I 1 -
C.E.(Co (%) 66 97 14 62 62 58 57 61 76 13 50
3.2 ZIRCOMA-CALCIA-CERIA DISK CELLS
The small disk is a convenient geometry for the fabrication and characterization of
solid oxide electrolytes. For conducting electrolysis experiments with electrolyte disks,
an apparatus was built to enable the two sides of the disk to be separated by gas-tight
high-temperature seals such that quantitative measurements could be made of the changes
taking place at the cathode, the anode, and inside the electrolyte. This approach permits
solid electrolytes of various compositions not available commercially to be studied under
conditions of electrolysis of gases without having to fabricate high-fired ceramic bodies
with complicated shapes.
3.2. 1 Apparatus
The disk electrolysis apparatus is shown schematically in Fig. 3-5. The electrolyte
disk, held between two ceramic tubes having flat ends, is attached to each tube by
3-10
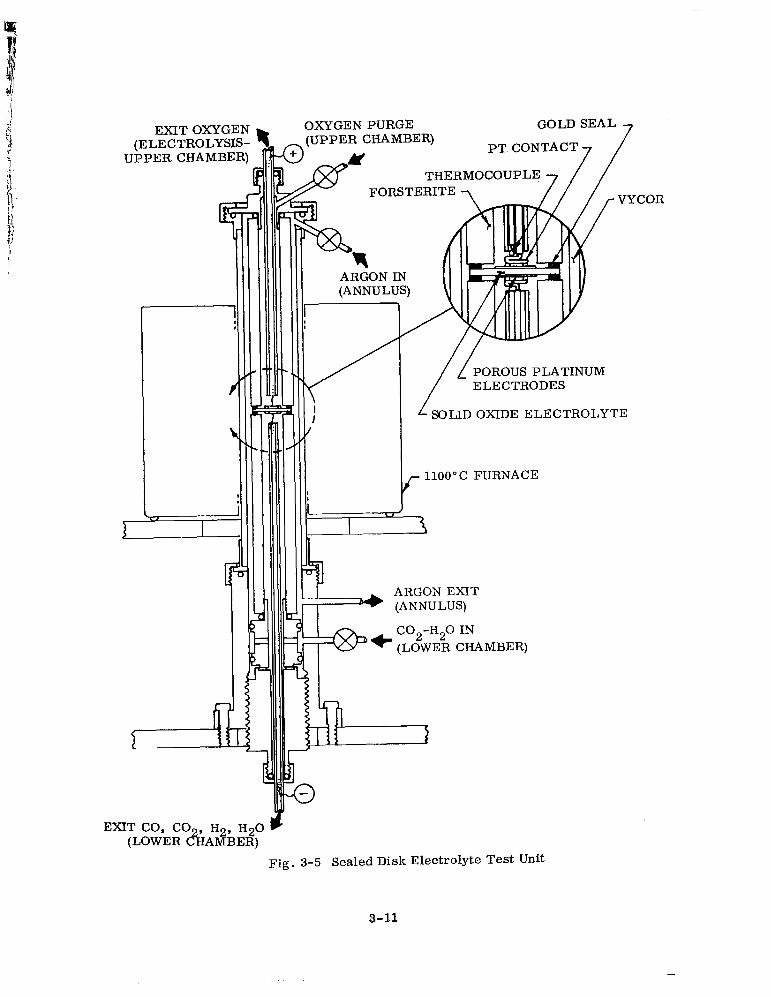
JL-L (ELECTmu - u-w
UPPER CHAMBER)
rs-m OXYGEN RnT.V.STS-
OXYGEN PURGE (UPPER CHAMBER)
PT. CONTACT
____ ___
c
ARGON IN (ANNULUS) C
I
i
POROUS PLATINUM ELECTRODES
SOLID OXIDE ELECTROLYTE
,- 1100°C FURNACE
ARGON EXIT j===+ (ANNULUS)
+ C02--HZ0 IN (LOWER CHAMBER)
EXIT CO, CO , H2, H20 (LOWER &AMBER)
Fig. 3-5 Sealed Disk Electrolyte Test Unit
3-11
a gas-tight high-temperature seal. The seals are formed by a combination of the
high temperature provided by a split furnace enclosing the assembly and mechanical
pressure applied by the screw underneath the lower tube. An outer quartz tube holds
the upper tube in alignment and also enables the atmosphere to be controlled. Once
gas-tight seals have been formed, the apparatus has three separate gas compart-
ments, the upper and lower chambers (i.e., cathode and anode sides), and the annulus.
Each compartment is provided with a gas inlet and outlet to permit different gases to
flow through independently. A thermocouple is located in the upper chamber close to
the electrolyte disk. The temperature can be varied from ambient to 1100” C.
3.2.2 High-Temperature Seals
Several sealing techniques were tried that did not give satisfactory performance.
These will be described briefly and the reasons for their failure will be discussed.
The prime criteria for useful seals are gas-tightness, freedom from interference
with the electrodes, lack of spurious electrochemical effects, and ease of forming
and demounting.
A glass seal using 0. Hommel Vitreous Enamel 38 (0. Hommel Co., Los Angeles)
gave a gas-tight seal but the glass flowed over the electrodes, thereby interfering
with electrolysis. Furthermore, at the operating temperature of the cell, the glass
was electrically conducting; such conductivity could cause short-circuiting of the cell.
A seal was attempted by melting a gold washer between the platinized electrolyte disk
and the ceramic tube. This method failed completely because the molten gold did not
wet the tube, but instead formed little balls.
The surface was rendered wettable to molten gold by applying a thin platinum paste
film to the ceramic before assembling the cell. With this arrangement, the molten
gold alloyed with the platinum and formed a gas-tight seal. However, with air/C2,
the correct electromotive force was not found, nor was 100% current efficiency
obtained on operating the cell as an oxygen-transfer cell. It seems likely that parasitic
electrolytic cells were formed at the edges of the disk resulting in electrochemical
oxygen transfer into the annulus and electrical interference with the cell electrodes.
3-12
A seal was attempted by relying on heat and pressure to alloy a gold washer to a
platinized area on the disk not connected to the platinized electrode. The seal thus
formed leaked up to the highest temperature of the run, 992°C.
The seal formed by compressing a thin gold washer between an unplatinized area of
the electrolyte disk and the flat end of the ceramic (Forsterite, American Lava Corp. ,
Chattanooga, Term. ) tube at high temperature has met our sealing criteria. Gas-
tightness was checked by applying pressure to one chamber of the apparatus and moni-
toring any flow from the other chambers as well as by measuring the open-circuit cell
potential for air/oxygen and for CO-CO,/O, with a 15 mole % calcia-zirconia electrolyte.
The electrodes consisted of platinized areas on each side of the disk not in electrical
contact with the gold washers to minimize possible spurious electrical effects involving
the seals. Seals formed in this way gave no detectable electrochemical oxygen transfer
at the edges of the electrolyte disk. All of the electrolysis results presented in this
section were obtained with disks having gold compression seals of this type.
The thermal expansion coefficients of the materials involved are Forsterite-110,
gold-140, calcia-stabilized zirconia-100 x 10s7 cm/cm-“C. The seals remained
unbroken by differential contraction upon cooling to room temperature. After remov-
ing the two Forsterite tubes with seals and disk intact, the two chambers were leak-
checked separately and found to be gas-tight and the assembly was then broken apart
by use of sufficient force. The rupture occurred primarily through the disk rather
than at the gold seal. Visual examination of the seal revealed that the gold washer
had formed a good bond with both the Forsterite and the electrolyte around its entire
periphery.
During electrolysis, mechanical pressure was maintained on the seal with the screw.
The behavior of the seal at high temperature with mechanical pressure relieved has
not yet been investigated. This sealing technique seems to be satisfactory for electro-
lytic studies with laboratory-scale electrolyte disks where conditions can be monitored
continuously, but an extrapolation to a larger unit would appear to require further work.
3-13
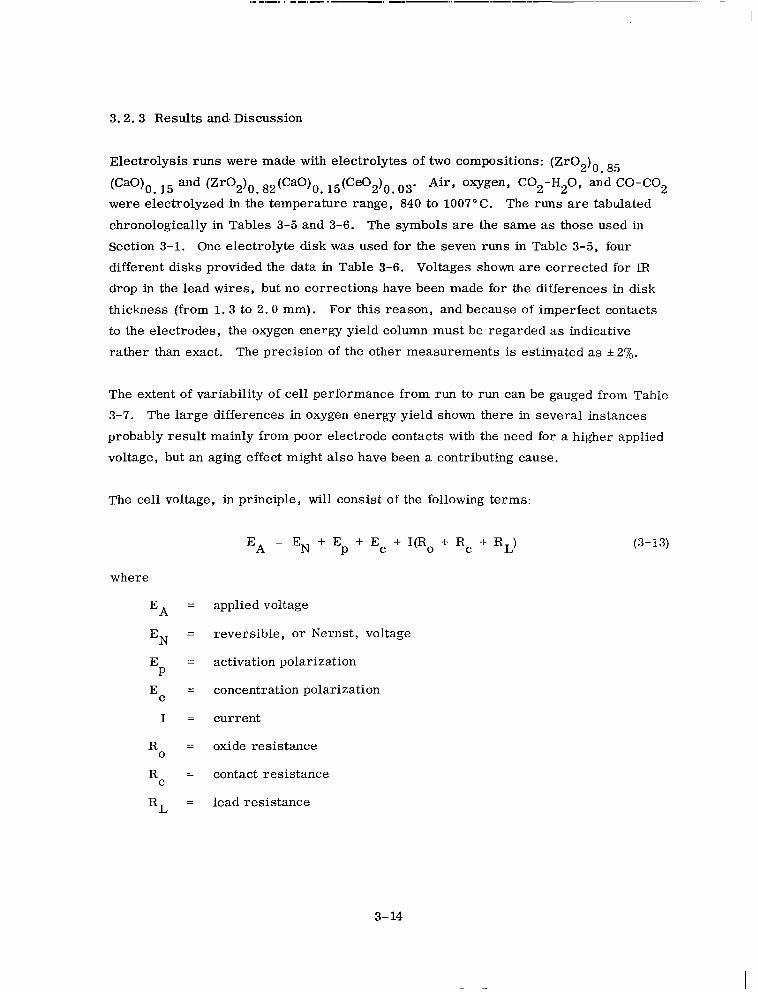
3.2.3 Results and. Discussion
Electrolysis runs were made with electrolytes of two compositions: (Zr02)0 85
(CaO)o l5 and (Zr0210 82WaO)o . 15(CeO2)6 03. . Air, oxygen, C02-H20, and CO-CO2
were electrolyzed in the temperature range, 840 to 1007°C. The runs are tabulated
chronologically in Tables 3-5 and 3-6. The symbols are the same as those used in
Section 3-l. One electrolyte disk was used for the seven runs in Table 3-5, four
different disks provided the data in Table 3-6. Voltages shown are corrected for IR
drop in the lead wires, but no corrections have been made for the differences in disk
thickness (from 1. 3 to 2.0 mm). For this reason, and because of imperfect contacts
to the electrodes, the oxygen energ yield column must be regarded as indicative
rather than exact. The precision of the other measurements is estimated as & 20/O.
The extent of variability of cell performance from run to run can be gauged from Table
3-7. The large differences in oxygen energy yield shown there in several instances
probably result mainly from poor electrode contacts with the need for a higher applied
voltage, but an aging effect might also have been a contributing cause.
The cell voltage, in principle, will consist of the following terms:
EA = EN + Ep + EC + I(Ro + R c + *L)
where
EA = applied voltage
EN = reversible, or Nernst, voltage
E = P
activation polarization
EC = concentration polarization
I ZZ current
R. = oxide resistance
Rc = contact resistance
RL = lead resistance
(3-13)
3-14
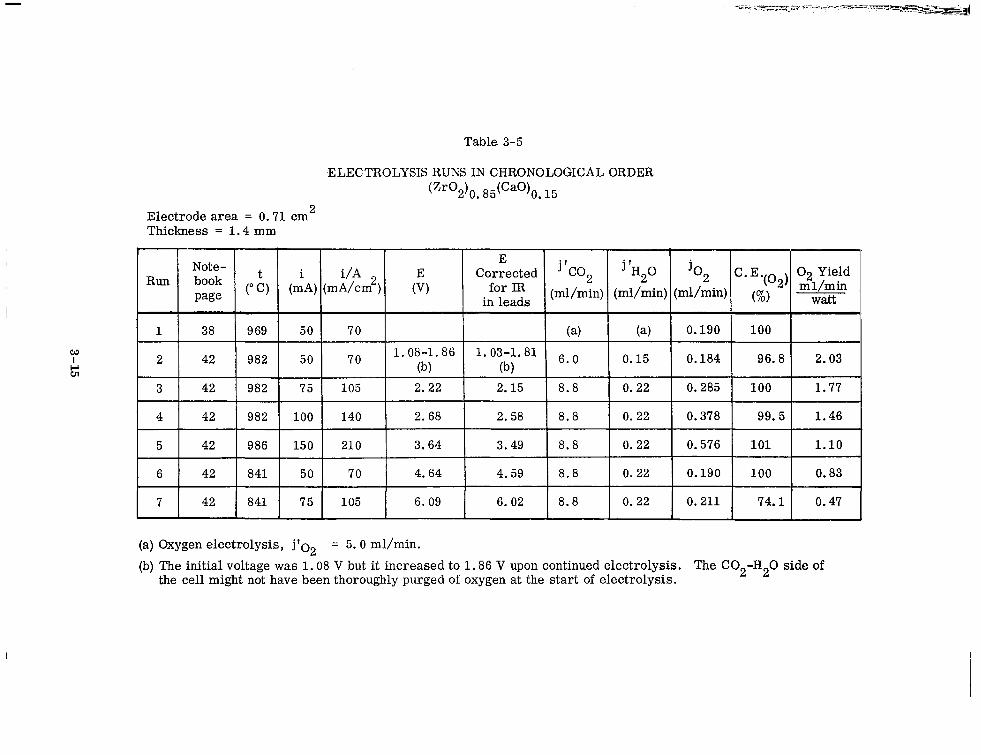
Table 3-5
-ELECTROLYSIS RUNS IN CHRONOLOGICAL ORDER
(Zr02)0.85(Ca0)0.15
Electrode area = 0.71 cm2 Thickness = 1.4 mm
~ Note- Run ~ book
page y6, (;A)
1 3 1 42 1 982 1 75
4 42 982 100
5 42 986 150
(a) Oxygen electrolysis, j102
E i/A
(mA/cm2) Corrected j ‘co2 j ‘HZ0 j02
for lR c. E.(02) cg;:
in leads (ml/min) (ml/min) (ml/min) (%I watt
\ 70 (a) (4 0.190 100
70 1.08-l. 86 1.03-1.81 @) @I
6 * o 0.15 0.184 96.8 ! 2.03
105 2.22 2.15 8.8 0.22 0.285 100 1.77
140 2.68 2.58 8.8 0.22 0.378 99.5 1.46
210 3.64 3.49 8.8 0.22 0.576 101 1.10
70 4.64 4.59 8.8 0.22 0.190 100 0.83
105 6.09 6.02 8.8 0.22 0.211 74.1 0.47
= 5.0 ml/min.
(b) The initial voltage was 1.08 V but it increased to 1.86 V upon continued electrolysis. the cell might not have been thoroughly purged of oxygen at the start of electrolysis.
The C02-H20 side of
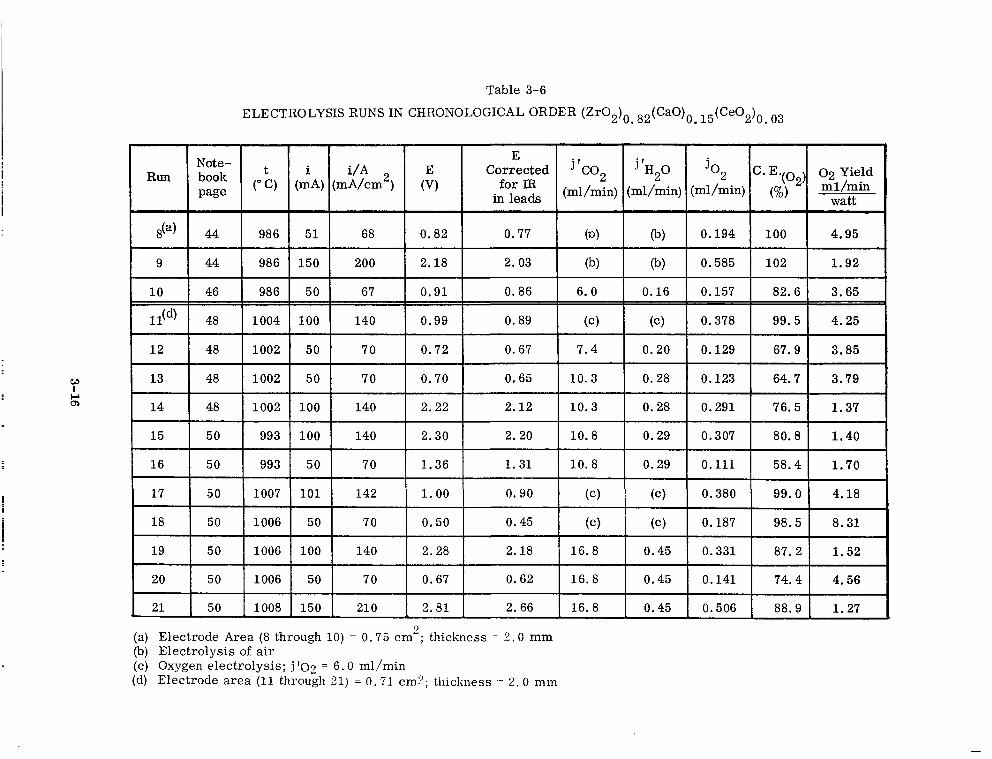
Table 3-6
ELECTROLYSIS RUNS IN CHRONOLOGICAL ORDER (Zr02)0 82(CaG)0 15(CeC2)0 o3 . .
Note- E
Run book (O”c) &A) (ma//Acm2) Corrected
for IR %02 j ‘HZ0 j02 02 Yield
page (ml/min) (ml/min) (mI/min) ml/min in leads watt
SC”) 44 986 51 68 0.82 0.77 (b) 0.194 100 4.95
12 48 1002 50 70 0.72 0.67 7.4 0.20 0.129 67.9 3.85
13 48 1002 50 70 0.70 0.65 10.3 0.28 0.123 64.7 3.79
14 48 1002 100 140 2.22 2.12 10.3 0.28 0.291 76.5 1.37
15 50 993 100 140 2.30 2.20 10.8 0.29 0.307 80.8 1.40
16 50 993 50 70 1.36 1.31 10.8 0.29 0.111 58.4 1.70
17 50 1007 101 142 1.00 0.90 (c) (c) 0.380 99.0 4.18
18 50 1006 50 70 0.50 0.45 (c) (c) 0.187 98.5 8.31
19 50 1006 100 140 2.28 2.18 16.8 0.45
20 50 1006 50 70 0.67 0.62 16.8 0.45
21 50 1008 150 210 2.81 2. 66 16.8 0.45
(a) Electrode Area (8 through 10) = 0.75 cm2; thickness = 2.0 mm (b) Electrolysis of air (c) Oxygen electrolysis; j ‘02 = 6.0 ml/min (d) Electrode area (11 through 21) = 0.71 cm?; thickness = 2. 0 mm
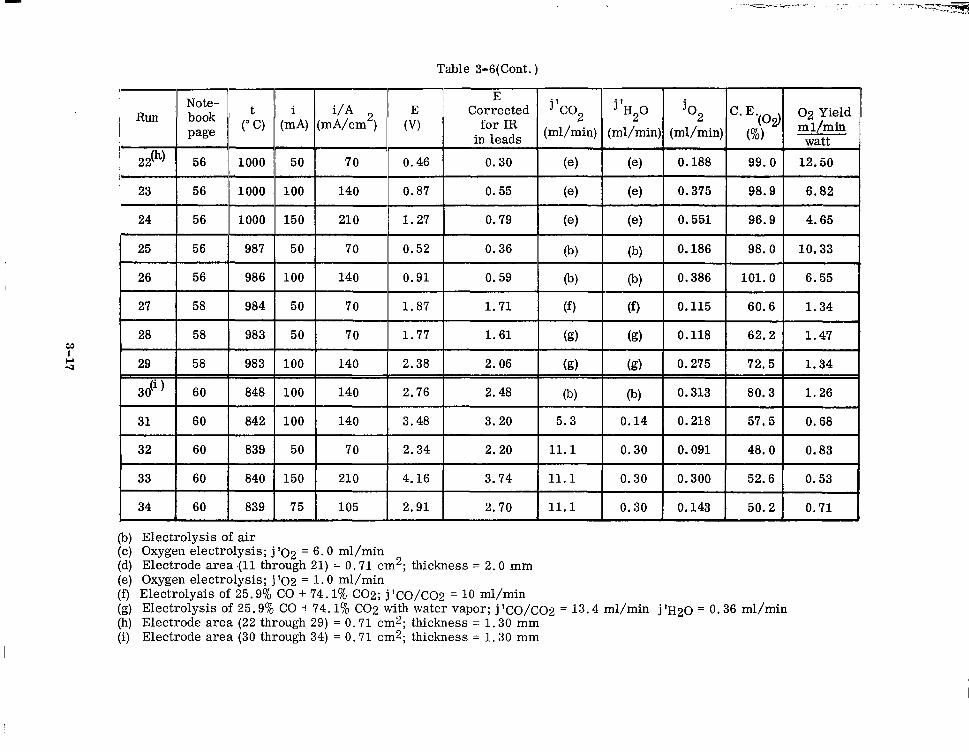
Table 3-6(Cont. ) j02 (ml/min)
0.46 // (e) -T,(e)
24 56 1000 96.9 1 4.65
25 I 56 98’7 50 j 70 0.52 1 0.36 I lb) 98.0 1 10.33 1
1 26 1 56 1 986 0.59 I/ @) 1 (b) 0.386
/ 27 ! 58 1 984 50 70 1.87 1.71 ( f ) (f )
50 70 1.77 1.61 (g) (g) 0.118 62.2 1 1.47 28 I 58 983
100 1 140 2.38 1 2.06 I (EC) I w 0.275 72.5 1 1.341
100 1 140 2.76 1 2.48 80.3 1 1.26
100 1 140 1 3.48 1 3.20 1 1 0.14 5.3 0.218
50 I 70 1 2.34 1 2.20 I 11.1 I 0.30 0.091 48.0 1 0.83 1
0.300 52.6 [ 0.53 1 150 210 4.16 3.74 11.1 0.30
75 105 2.91 2.70 11.1 0.30 0.143 50.2 1 0.71 1
(b) Electrolysis of air (c) Oxygen electrolysis; j ‘02 = 6.0 ml/min (d) Electrode area (11 through 21) = 0.71 cm2; thickness = 2.0 mm (e) Oxygen electrolysis; j ‘02 = 1.0 ml/min (f) Electrolysis of 25.9% CO + 74.1% C02; j ‘co/co2 = 10 ml/min (g) Electrolysis of 25.9% CO + 74.1% CO2 with water vapor; jlCC/CC2 = 13.4 ml/min j’R20 = 0.36 ml/min (h) Electrode area (22 through 29) = 0.71 cm2; thickness = 1,30 mm (i) Electrode area (30 through 34) = 0.71 cm2; thickness = 1.30 mm
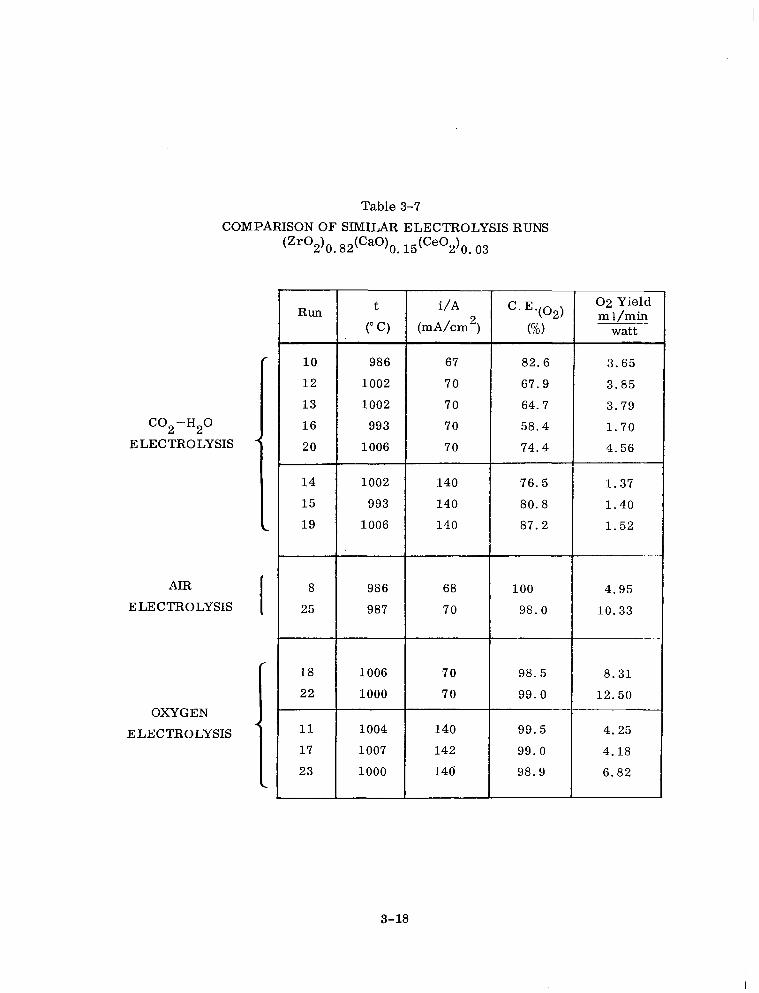
Table 3-7
COMPARISON OF SIMILAR ELECTROLYSIS RUNS
CO2 -HZ0
ELECTROLYSIS
AIR
ELECTROLYSIS
OXYGEN
ELECTROLYSIS
RLUl t (“Cl
i/A
(mA/cm2) CL!. 502)
(%)
02 Yield ml/min
watt
10 986 67 82.6 3.65
12 1002 70 67.9 3.85
13 1002 70 64.7 3.79
16 993 70 58.4 1.70
20 1006 70 74.4 4.56
14 1002 140 76.5 1.37
15 993 140 80.8 1.40
19 1006 140 87.2 1.52
8 986 68 100 4.95
25 987 70 98.0 10.33
18 1006 70 98.5 8.31
22 1000 70 99.0 12.50
11 1004 140 99.5 4.25
17 1007 142 99.0 4.18
23 1000 146 98.9 6.82
3-18
-
Plots of the cell voltage corrected for lead resistance against the current are given
in Figs. 3-6 and 3-7 for the ceria-free electrolyte andforthe 3 mole ‘% ceriaelectrolyte respectively. The plots obey Eq. (3-13) with an activation polarization of the order of
a few hundred millivolts or less, and a small contact resistance. In the runs with C02- H20, the reversible voltage will be established by the steady state concentra-
tion of CO that builds up near the cathode as a reaction product. This value will
be - 1V. Greater precision in interpreting electrolysis runs of this type can be
attained by electrolysing a feed stream of a CO-CO2 mixture at a flow rate and at
currents such that the change produced in the CO- CO2 ratio is negligible. Under these conditions, concentration polarization, Ec , will be absent and EN will
remain fixed at a known value that can be calculated from the equilibrium constant
for the reaction
co+;oz = co2 (3-14)
and the Nernst equation, throughout the electrolysis run. It is anticipated that
improvements in our experimental technique will enable the contact resistance to
be reduced to a negligible value.* It will be possible in the future to obtain E accu- P
rately from the intercept and B. from the slope of a E-I plot and thus to calculate the
applied voltage for some standard electrolyte thickness (e. g. , 1.0 mm). Using this calculated EA , more meaningful oxygen energy yield values can be obtained, permitting
better comparison of different electrolyte compositions.
A comparison of the two electrolyte compositions used in the runs performed to date is
given in Table 3-8. It is evident that the loss in current efficiency resulting from the
component of electronic conductivity in the 3 mole 70 ceria electrolyte has been com-
pensated by the lower voltage required to sustain a given current density.
*Contact resistance has not been a problem previously as our results on conductivity measurements compared with literature and previously reported bears out. The problem with sealed disks has arisen because of experimentation with a different method in applying electrode contacts. By comparison with previous results on conductivity and taking disk electrolyte geometry into account we can determine if contact resistance has been minimized.
3-19
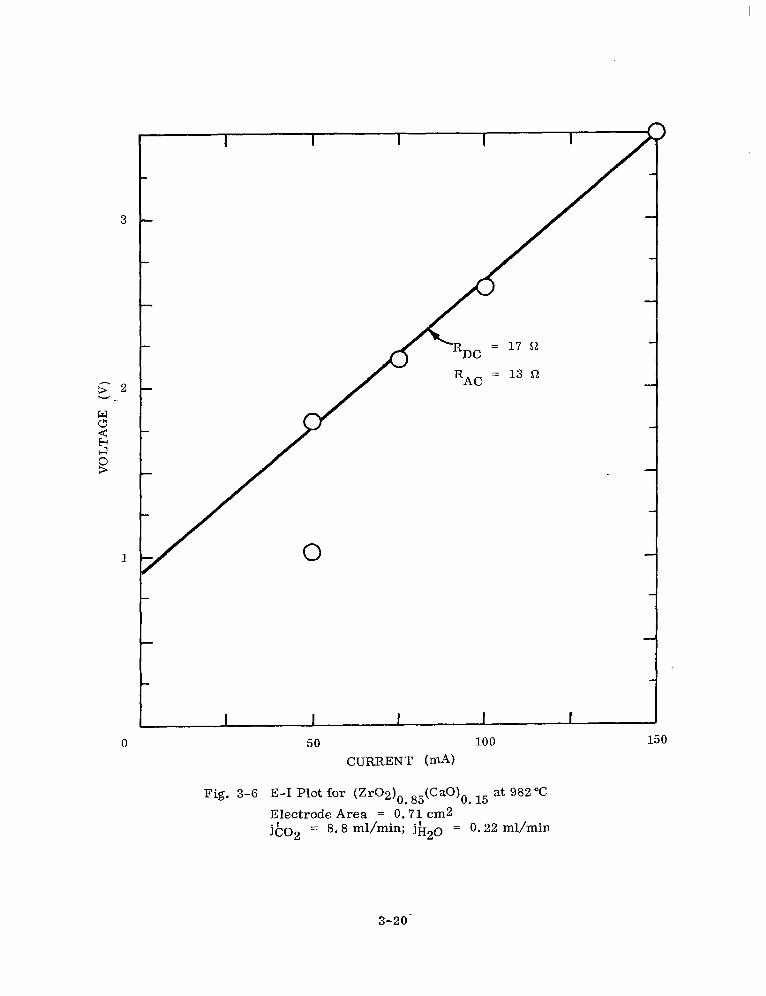
50 100
CURRENT (nN
Fig. 3-6 E-I Plot for (Zr02)0 85(CaO)o
Electrode Area = 0.‘71 cm2 . 15 at 982°C
jbo, = 8.8 ml/min; jfI,o = 0.22 ml/min
3-20'
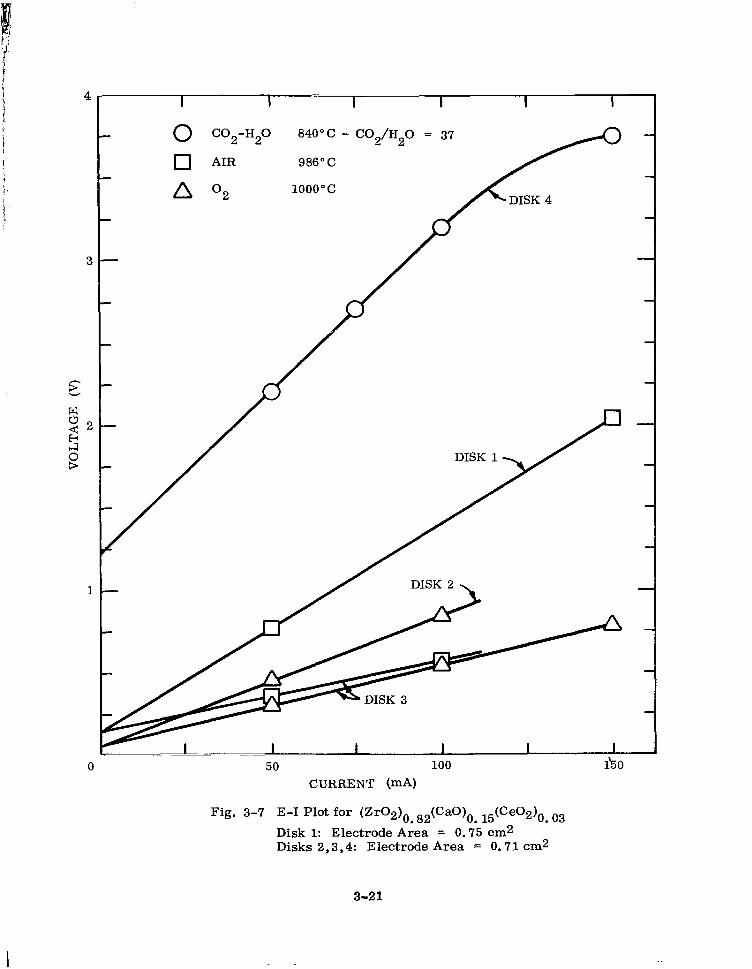
4
3
0
I I I I I I
0 C02-H20 840°C - C02/H20 = 37
cl AIR 986” c
1ooo”c A O2
50 100 250 CURRENT (mA)
Fig. 3-7 E-I Plot for (Zr02j0. 82(CaO)o. 15(Ce02)0B o3
Disk 1: Electrode Area = 0.75 cm2 Disks 2,3,4: Electrode Area = 0.71 cm2
3-21
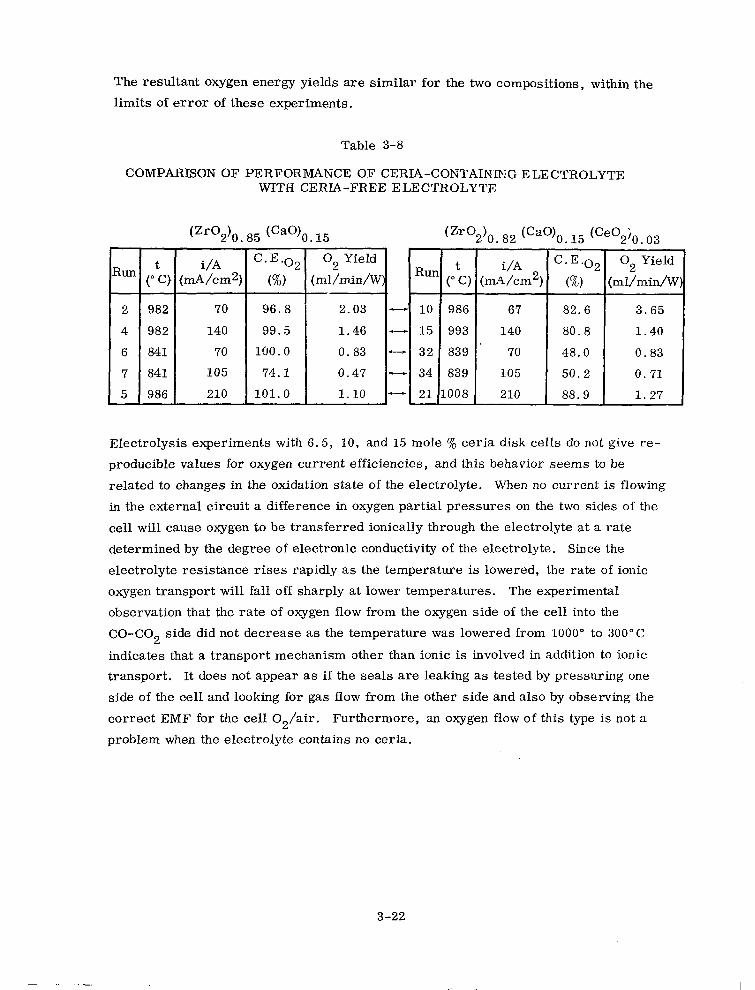
The resultant oxygen energy yields are similar for the two compositions, within the
limits of error of these experiments.
Table 3-8
COMPARISON OF PERFORMANCE OF CERIA-CONTAINRIG ELECTROLYTE WITH CERIA-FREE ELECTROLYTE
iUl-l
-
2
4
6
7
5 -
(Zr02)o 85 tCaoJo I5
982 140 99.5 1.46
841 70 100.0 0.83
841 105 74.1 0.47
986 210 101.0 1.10
10 986 67 82.6 3.65
15 993 140 80.8 1.40
32 839 70 48.0 0.83
34 839 105 50.2 0.71
21 1008 210 88.9 1.27
!m
Z.E.O,,( 0, Yield
I/min/W
Electrolysis experiments with 6.5, 10, and I5 mole % ceria disk cells do not give re-
producible values for oxygen current efficiencies, and this behavior seems to be
related to changes in the oxidation state of the electrolyte. When no current is flowing
in the external circuit a difference in oxygen partial pressures on the two sides of the
cell will cause oxygen to be transferred ionically through the electrolyte at a rate
determined by the degree of electronic conductivity of the electrolyte. Since the
electrolyte resistance rises rapidly as the temperature is lowered, the rate of ionic
oxygen transport will fall off sharply at lower temperatures. The experimental
observation that the rate of oxygen flow from the oxygen side of the cell into the
CO-CO2 side did not decrease as the temperature was lowered from 1000” to 300°C
indicates that a transport mechanism other than ionic is involved in addition to ionic
transport. It does not appear as if the seals are leaking as tested by pressuring one
side of the cell and looking for gas flow from the other side and also by observing the
correct EMF for the cell 02/air. Furthermore, an oxygen flow of this type is not a
problem when the electrolyte contains no ceria.
3-22
The effect of this flow of oxygen on the results of CO2 electrolysis experiments is to
decrease the current efficiency and also to interfere seriously with the reproducibility
of the runs since the flow rate changes. It might be that the transport mechanism
depends upon the oxidation state of the ceria in the electrolyte. As electrolysis pro-
ceeds, the CO/CO, ratio at the cathode increases and the concentration of Ce +3 ions
on that side of the electrolyte disk will be correspondingly increased. Since the disk
must be completely oxidized on the oxygen side, however, the manner in which the
oxygen completes its penetration of the disk is difficult to envision. A further
possibility is that the gold compression seals become leaky for some reason with ceria-
containing disks that have been partially reduced.
One piece of evidence that rapid oxygen transport into the electrolyte can occur at a
rate much greater than the ionic mechanism can sustain is provided by the re-oxidation
rate of disks previously reduced in CO-CO2 mixtures. An example is shown in
Fig. 2-15. As the reduced disk is heated in oxygen, complete re-oxidation occurs
within a few seconds at a temperature of 300°C or lower. This indicates that oxygen
is penetrating into the interior of the samples, which are several millimeters in
thickness, in several seconds. The current equivalent to oxygen ion transport is
given by i02 = $ ato=te-E (Ref. 35) (3 -15)
where
A = electrolyte area
B = electrolyte thickness
CJ = conductivity
to’ = transport number of the oxide ions
te- = transport number of the electrons
E = theoretical voltage
Using this relation, an approximate calculation can be made for the time required for
ionic oxygen transport in the amount equal to that lost and gamed during the reduction
and oxidation runs of the microweighing experiments. Considering oxygen transport
3-23
through a 1 cm2 cross section and an electrolyte thickness of 0.1 cm between oxygen
partial pressures of 1 atm and 10 -30 atm (i.e. , equivalent to 25.9% CO in C02) at
500°C for the 15 mole % ceria electrolyte, the parameters are:
A = lcm2
1 = O.lcm
CJ = 10-4 ohm-lcrn-1
E = 1.15 volts
to= = te- = l/2 since this value maximizes the to= te- product
The oxygen ion current is then 0.29 mA. The oxygen actually lost in the reduction ex-
periments in 25.9% CO in CO2 was 5.9 mg for a sample of 782 mg, and using this pro-
portion, the oxygen lost for a 1 cm2 x 0.1 cm disk (density = 5.73 g/cm3) would be
4.28 mg. At an ionic current of 0.29 mA, the time required to transfer 4.28 mg would
be 45.3 hr. As Fig. 2-15 shows, the actual time required in the re-oxidation runs
was of the order of seconds, not hours.
An example of the effect of the back flow is provided by two runs with a 6.5 mole %
ceria disk cell in which 1.6% CO in CO2 was electrolyzed at 859” with and without an
air flow through the anode chamber. The back flow rate at zero current was 0.08 ml/
min (equivalent to 21 mA). With an electrolysis current of 50 mA and no anode air
flow, the oxygen current efficiency was 58% as determined from the gas flow out of
the anode chamber during electrolysis. When air was flowed through the anode chamber
at a constant rate with no current and then the electrolysis current of 50 mA was
turned on, the increase in the anode gas outflow corresponded to 0.19 ml/min or 100%
oxygen current efficiency. However, if the current efficiency were based on the net
oxygen output of the cell, namely the oxygen outflow minus the gas inflow on the
anode side, then a value of 0.11 ml/min or 58% would result, in apparent agreement
with the first run. From these runs, it seems as though there were a constant oxygen
back flow (or leak) through the electrolyte disk into the CO-CO2 side of the cell. The
passage of electrolysis current caused oxygen to be evolved at the anode, part of which
was lost via the back flow. Electrolysis runs with 10 and 15 mole % ceria electrolytes and
runs with other 6.5 mole % ceria cells have proven much more difficult to interpret
since the results were inconsistent from run to run. One possible explanation is that
3-24
the back flow rate was varying, and, in fact, some measurements of this rate at
open circuit shortly after turning off the electrolysis current indicate that the rate
does not remain constant.
The origin of the back flow will have to be traced before a rational treatment of these
data can be made.
3-25
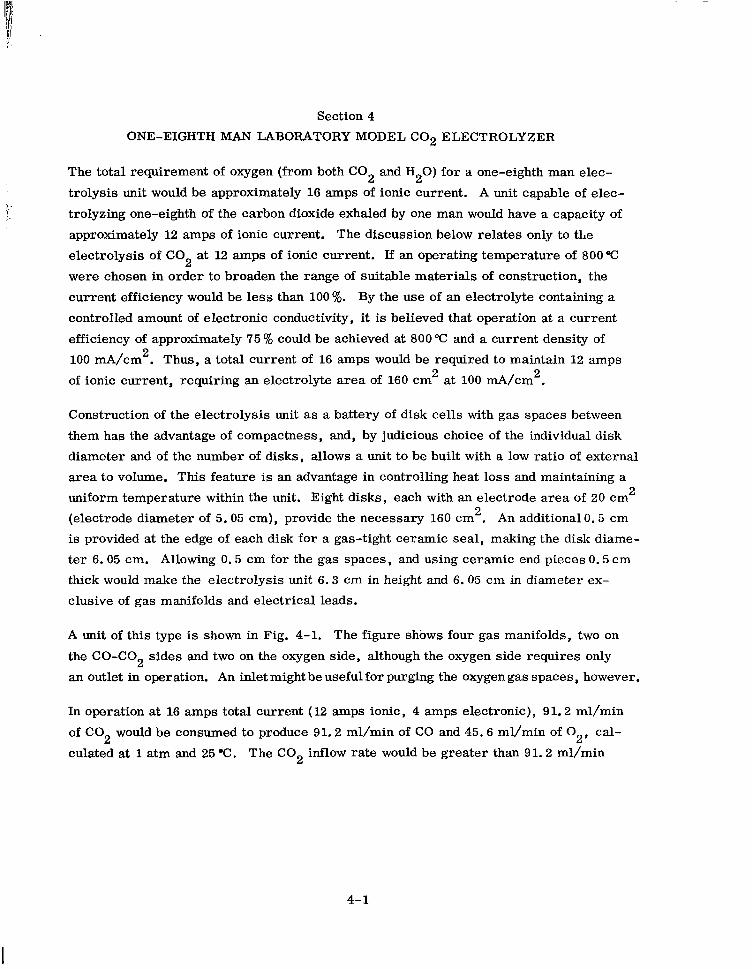
Section 4
ONE-EIGHTH MAN IABORATORY MODEL CO2 ELECTROLYZER
The total requirement of oxygen (from both CO2 and H20) for a one-eighth man elec-
trolysis unit would be approximately 16 amps of ionic current. A unit capable of elec-
trolyzing one-eighth of the carbon dioxide exhaled by one man would have a capacity of
approximately 12 amps of ionic current. The discussion below relates only to the
electrolysis of CO2 at 12 amps of ionic current. If an operating temperature of 800 aC
were chosen in order to broaden the range of suitable materials of construction, the
current efficiency would be less than 100%. By the use of an electrolyte containing a
controlled amount of electronic conductivity, it is believed that operation at a current
efficiency of approximately 75% could be achieved at 800°C and a current density of
100 mA/cm2. Thus, a total current of 16 amps would be required to maintain 12 amps
of ionic current, requiring an electrolyte area of 160 cm2 at 100 mA/cm2.
Construction of the electrolysis unit as a battery of disk cells with gas spaces between
them has the advantage of compactness, and, by judicious choice of the individual disk
diameter and of the number of disks, allows a unit to be built with a low ratio of external
area to volume. This feature is an advantage in controlling heat loss and maintaining a
uniform temperature within the unit. Eight disks, each with an electrode area of 20 cm’ n
(electrode diameter of 5.05 cm), provide the necessary 160 cm’:. An additional 0.5 cm
is provided at the edge of each disk for a gas-tight ceramic seal, making the disk diame-
ter 6.05 cm. Allowing 0.5 cm for the gas spaces, and using ceramic end pieces 0.5 cm
thick would make the electrolysis unit 6.3 cm in height and 6.05 cm in diameter ex-
clusive of gas manifolds and electrical leads.
A unit of this type is shown in Fig. 4-1. The figure shows four gas manifolds, two on
the CO-CO2 sides and two on the oxygen side, although the oxygen side requires only
an outlet in operation. An inlet might be useful for purging the oxygen gas spaces, however.
In operation at 16 amps total current (12 amps ionic, 4 amps electronic), 91.2 ml/min
of CO2 would be consumed to produce 91.2 ml/min of CO and 45.6 ml/min of 02, cal-
culated at 1 atm and 25 “C. The CO2 inflow rate would be greater than 91.2 ml/min
4-1
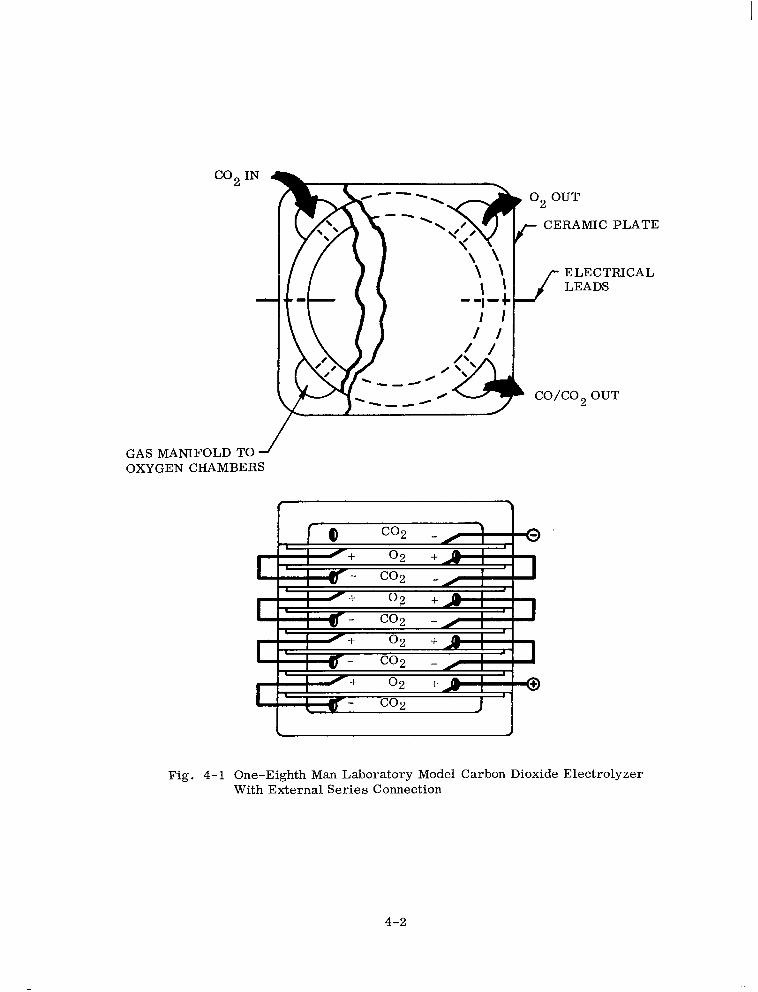
CO2 IN
GAS MANIFOLD TO d OXYGEN CHAMBERS
CERAMIC PLATE
ELECTRICAL
N-i-+ I I
/ I
1 CO/CO, OUT
f 0 v 02 +A+
Fig. 4-l One-Eighth Man Laboratory Model Carbon Dioxide Electrolyzer With External Series Connection
4-2
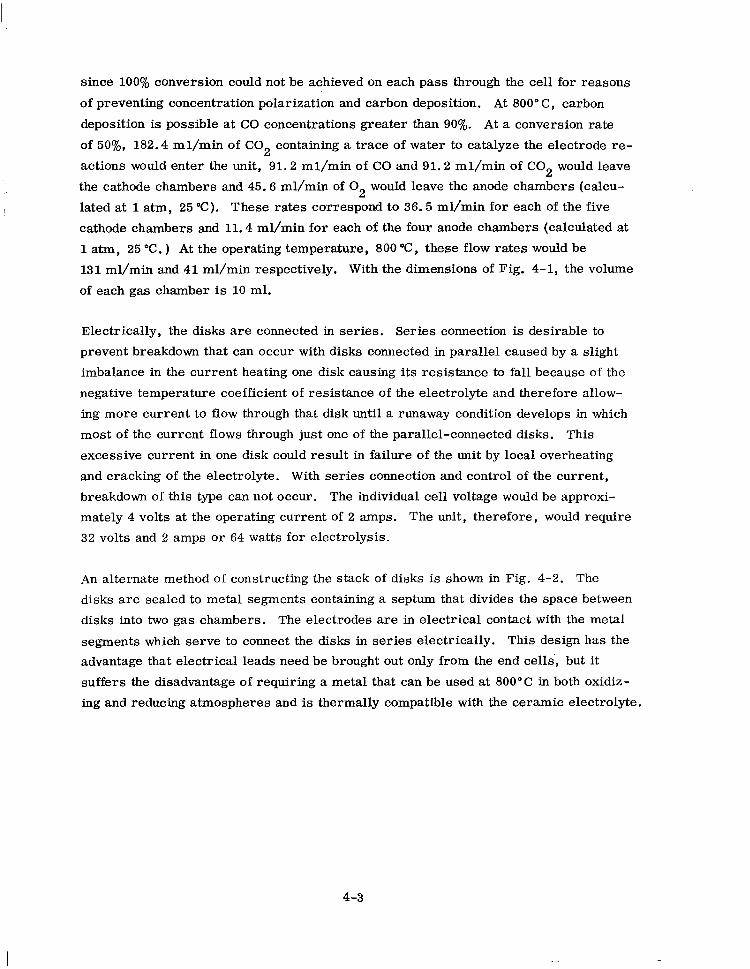
since 100% conversion could not be achieved on each pass through the cell for reasons
of preventing concentration polarization and carbon deposition. At 800” C, carbon
deposition is possible at CO concentrations greater than 90%. At a conversion rate
of 50%, 182.4 ml/mm of CO2 containing a trace of water to catalyze the electrode re-
actions would enter the unit, 91.2 ml/mi.n of CO and 91.2 ml/mm of CO2 would leave
the cathode chambers and 45.6 ml/min of O2 would leave the anode chambers (calcu-
lated at 1 atm, 25 “C). These rates correspond to 36.5 ml/min for each of the five
cathode chambers and 11.4 ml/min for each of the four anode chambers (calculated at
1 atm, 25 “C. ) At the operating temperature, 800 “C, these flow rates would be
131 ml/mm and 41 ml/min respectively. With the dimensions of Fig. 4-1, the volume
of each gas chamber is 10 ml.
Electrically, the disks are connected in series. Series connection is desirable to
prevent breakdown that can occur with disks connected in parallel caused by a slight
imbalance in the current heating one disk causing its resistance to fall because of the
negative temperature coefficient of resistance of the electrolyte and therefore allow-
ing more current to flow through that disk until a runaway condition develops in which
most of the current flows through just one of the parallel-connected disks. This
excessive current in one disk could result in failure of the unit by local overheating
and cracking of the electrolyte. With series connection and control of the current,
breakdown of this type can not occur. The individual cell voltage would be approxi-
mately 4 volts at the operating current of 2 amps. The unit, therefore, would require
32 volts and 2 amps or 64 watts for electrolysis.
An alternate method of constructing the stack of disks is shown in Fig. 4-2. The
disks are sealed to metal segments containing a septum that divides the space between
disks into two gas chambers. The electrodes are in electrical contact with the metal
segments which serve to connect the disks in series electrically. This design has the advantage that electrical leads need be brought out only from the end cells’, but it
suffers the disadvantage of requiring a metal that can be used at 800°C in both oxidiz-
ing and reducing atmospheres and is thermally compatible with the ceramic electrolyte.
4-3
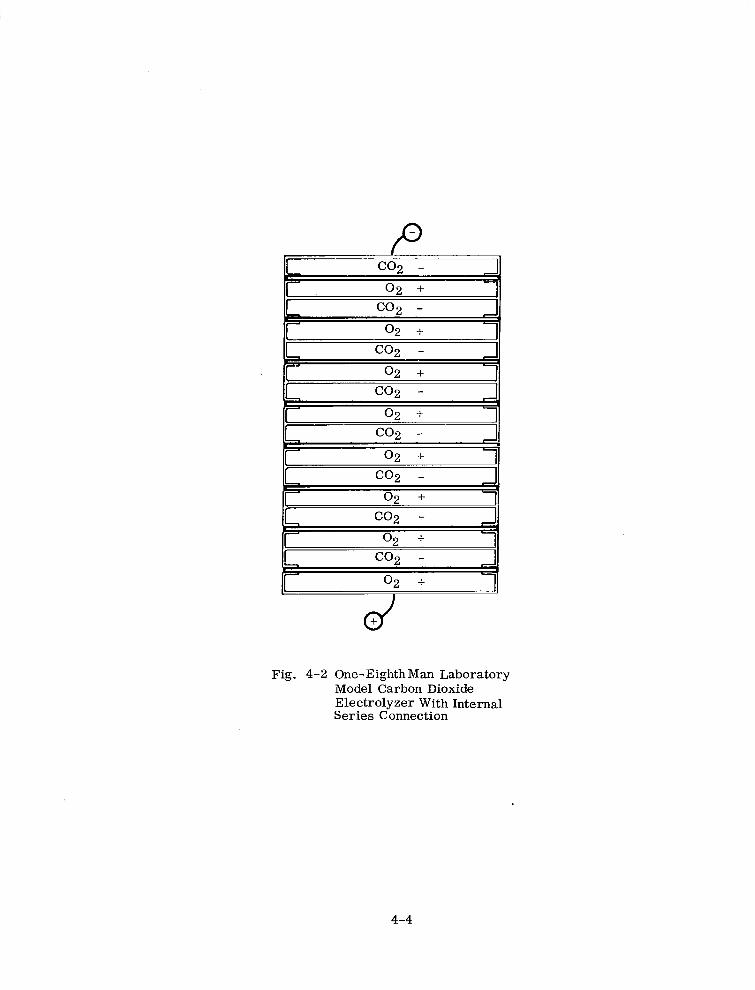
2 -
~ 02 +
2 -
02 + . I co2 -
02 + co2 -
I 02 +
co2 - I
02 +
d + Fig. 4-2 One-Eighth Man Laboratory
Model Carbon Dioxide Electrolyzer With Internal Series Connection
4-4
The actual construction of a working model similar to these designs would entail a
great deal of experimentation to determine which technique$ were most prbmising
for making high temperature seals, gas manifolding, handling of the electrical leads
and connections, and preventing thermal cracking in the electrolyte.
4-5
Section 5
REFERENCES
1. W. Nernst, Z. Elektrochem. 5, 41 (1900)
2. J. L. Weininger and P. D. Zemany, J. Chem. Phys., 3, 1469 (1954)
3. J. Weissbart and R. Ruka, Electrochemical Society Fall Meeting, Detroit,
Michigan (2 - 5 Ott 1961), Extended Abstract No. 44, Battery Division
4. W. Schottky, Wiss. Veroff. Siemens-Werkens, 1 (1935)
5. E. Baur and H. Preis, Z. Elektrochem., 43, 727 (1937)
6. G. H. J. Broers, Thesis, University of Amsterdam, The Netherlands (1958)
7. J. Weissbart and R. Ruka, J. Electrochem. Sot., 109, 723 (1962)
8. H. Binder, A. Kohling, H. Krupp, K. Richter and G. Sandstede, Electrochimica
Acta, 8, 781 (1963)
9. A. D. Neuimin, S. V. Karpachev, and S. F. Pal’guev, DokIady Akademii Nauk
SSSR, 141, 402 (1961) (English Translation)
10. J. Weissbart, LMSC, unpublished data
11. H. W. Chandler and W. Oser, Report No. MRL-TDR-62-16, Isomet Corporation,
Palisades Park, New Jersey, Mar 1962
12. H. Chandler, Report No. AMRL-TDR-64-62, Isomet Corporation, Palisades Park,
New Jersey, May 1964
13. H. H. Mobius, Z. fur Chem., 4, 81 (1964)
14. F. Hund, Z. Physik. Chem., 199, 142 (1952) --
15. P. Duwez, F. Odell, and F. H. Brown, Jr., J. Am. Ceram. Sot., 35-, 107
(1952)
16. F. Dietzel and H. Tober, Ber. deut. Keram. Ges., 30, 47, 71 (1953)
5-l
17. Z. S. Volchenkova and S. F. Palguev; Trans. Inst. Electrochem. No. 1, 97,
Consultants Bureau, New York (1961)
18. T. Y. Tien and E. C. Subbarao, J. Chem. Phys., 39, 1041 (1963)
19. J. Weissbart and L. S. Rowley, Electrochem. Sot., Extended Abstracts, No. 31,
Vol. 9, (Ott 1964)
20. F. Trombe and M. Foex, Compt. rend., 236, 1783 (1953)
21. H. A. Johansen and J. G. Cleary, J. Electrochem. Sot. , 111, 100 (1964)
22. E. K. Keler, N. A. Godma, and A. M. Kalmma, J. Inorg. Chem. USSR, 1, 2556 (1956),
Transl. J. Inorg. Chem. V, 127 (1956)
23. S. F. Palguev, S. V. Karpachev, A. D. Neuimin, and Z. S. Volchenkova, Doklady
Akad. Nauk SSSR, 134, 1138 (1960)
24. P. Duwez and F. Odell, J. Am. Ceram. Sot. , 33, 274 (1950)
25. K. Kiukkola and C. Wagner, J. Electrochem. Sot., 104, 379 (1957)
26. J. B. Nelson and D. P. Riley, Proc. Phys. Sot. (London) 57, 160 (1945)
27. A. Rabenau, Z. Anorg. Allgem. Chem., 288, 221 (1956)
28. W. R. Ruby and R. P. Loveland, J. Phys. Chem., 50, 345 (1946)
29. W. D. Kingery, J. Pappis, M. E. Doty, and D. C. Hill, J. Am. Ceram. Sot.,
42, 393 (1959)
30. W. H. Rhodes and R. E. Carter, Presented at the Am. Ceram. Sot. Meeting,
Apr 1962. Abstract in Bull. Am. Ceram. Sot., (Apr 1962)
31. J. Weissbart and R. Ruka, Rev. Sci. In&r., 32, 593 (1961)
32. G. Brauer and K. Gingerich, J. Inorg. Nucl. Chem., 2, 87 (1960)
33. G. Brauer, K. Gingerich, and U. Holtschmidt, J. Inorg. Nucl. Chem,. , 16, 77 (1960)
34. L. S. Darken and R. W. Gurry, J. Am. Chem. Sot., 3, 1401 (1945)
35. C. Wagner, Z. Physik Chem. (Leipzig), BZl, 25 (1933)
36. J. P. Coughlm, “Heats and Free Energies of’ Formation of Inorganic Oxides, I1
U.S. Bureau of Mines, Bull. 542 (1954)
5-2 NASA-Langley, 1961 CR-680
Related Documents


