205 The Prevalence of Human T-Cell Lymphotropic Virus Type 1 in the General Population is Unknown Carol Hlela 1 , Sasha Shepperd 2 , Nonhlanhla P. Khumalo 3 and Graham P. Taylor 4 1 Weatherall Institute of Molecular Medicine, Human Immunology Unit, University of Oxford, Oxford, UK; 2 Department of Public Health, University of Oxford, Oxford, UK; 3 Division of Dermatology, Red Cross Children’s Hospital, School of Child and Adolescent Health, University of Cape Town, Cape Town, South Africa; 4 Department of GU Medicine and Communicable Diseases, Faculty of Medicine, Imperial College, London, UK AIDS Rev. 2009;11:205-14 Correspondence to: Carol Hlela WIMM, Human Immunology Unit Oxford University OX3 9DS Oxford, UK E-mail: [email protected] Introduction Several human T-cell lymphotropic viruses (HTLV) have been described and are designated HTLV-1 to HTLV-4. Of these, only HTLV-1 and HTLV-2 have been associated with disease in humans 1 and with lifelong carrier state. Type HTLV-2 has 65% sequence homology to HTLV-1. Infection with HTLV-1 is diagnosed by the detection of anti-HTLV antibodies, usually by enzyme- linked immunoassay (EIA or ELISA). Various screening assays have been used and, when reactive, need to be confirmed and typed by Western Blot. Until the 1990s, most serologic assays did not discriminate between HTLV-1 and cross-reacting HTLV-2 antibodies 2 . Stringent criteria for the diagnosis of HTLV-1 infection have been proposed by various organizations, including the HTLV European Research Network (HERN) 2-4 . Up to 10% of HTLV-1 carriers develop associated diseases, with adult T-cell leukemia/lymphoma (ATLL) and HTLV-1-associated myelopathy/tropical spastic paraparesis (HAM/TSP) being the most severe. Infection Abstract Human T-cell lymphotropic virus type 1 prevalence estimates are usually based on serological screening of blood donors, pregnant women, and other selected population groups. Previously, data on the global epidemiology of human T-cell lymphotropic virus type 1 infection have been summarized unsystematically and without a focus on general populations. To assess the implications of the virus for healthcare systems it is essential to know its past and present prevalence. The widely cited estimate that 10-20 million people are infected with human T-cell lymphotropic virus type 1 worldwide was calculated from data that are now 25 years old. This estimate may therefore no longer reflect the global epidemiology. The objective of this study was to collate published data that are truly representative of the general population through a systematic review of the literature. Fifty-nine relevant studies were identified and the 17 that met the inclusion criteria were all cross-sectional designs; none reported incidence. The prevalence of human T-cell lymphotropic virus type 1 was highest in the two studies of Japanese islands (36.4%; 95% CI: 29.9-42.8) and lowest in studies from Mongolia, Malaysia and India. In Haiti the prevalence was 3.8% (95% CI: 1.78-5.86); in Africa between 6.6% (95% CI: 4.0-9.9) and 8.5% (95% CI: 6.99-10.10) in Gabon, and 1.05% (95% CI: 0.63-1.47) in Guinea. Only three studies were from West Africa and none were from the South; the only study from India was from the north of the country. We conclude that there is a paucity of general population data from countries in which human T-cell lymphotropic virus type 1 is endemic, and that new studies are required to reevaluate the global burden of infection. (AIDS Rev. 2009;11:205-14) Corresponding author: Carol Hlela, [email protected] Key words HTLV-1. HTLV-1 infection. Prevalence. General population.

Welcome message from author
This document is posted to help you gain knowledge. Please leave a comment to let me know what you think about it! Share it to your friends and learn new things together.
Transcript
Carol Hlela, et al.: The Prevalence of HTLV-1 in the General Population is Unknown
205
The Prevalence of Human T-Cell Lymphotropic Virus Type 1 in the General Population is UnknownCarol Hlela1, Sasha Shepperd2, Nonhlanhla P. Khumalo3 and Graham P. Taylor4
1Weatherall Institute of Molecular Medicine, Human Immunology Unit, University of Oxford, Oxford, UK; 2Department of Public Health, University of Oxford, Oxford, UK; 3Division of Dermatology, Red Cross Children’s Hospital, School of Child and Adolescent Health, University of Cape Town, Cape Town, South Africa; 4Department of GU Medicine and Communicable Diseases, Faculty of Medicine, Imperial College, London, UK
AIDS Rev. 2009;11:205-14
Correspondence to: Carol Hlela
WIMM, Human Immunology Unit
Oxford University
OX3 9DS Oxford, UK
E-mail: [email protected]
Introduction
Several human T-cell lymphotropic viruses (HTLV) have been described and are designated HTLV-1 to HTLV-4. Of these, only HTLV-1 and HTLV-2 have been associated with disease in humans1 and with lifelong
carrier state. Type HTLV-2 has 65% sequence homology to HTLV-1. Infection with HTLV-1 is diagnosed by the detection of anti-HTLV antibodies, usually by enzyme-linked immunoassay (EIA or ELISA). Various screening assays have been used and, when reactive, need to be confirmed and typed by Western Blot. Until the 1990s, most serologic assays did not discriminate between HTLV-1 and cross-reacting HTLV-2 antibodies2. Stringent criteria for the diagnosis of HTLV-1 infection have been proposed by various organizations, including the HTLV European Research Network (HERN)2-4.
Up to 10% of HTLV-1 carriers develop associated diseases, with adult T-cell leukemia/lymphoma (ATLL) and HTLV-1-associated myelopathy/tropical spastic paraparesis (HAM/TSP) being the most severe. Infection
Abstract
Human T-cell lymphotropic virus type 1 prevalence estimates are usually based on serological screening of blood donors, pregnant women, and other selected population groups. Previously, data on the global epidemiology of human T-cell lymphotropic virus type 1 infection have been summarized unsystematically and without a focus on general populations. To assess the implications of the virus for healthcare systems it is essential to know its past and present prevalence. The widely cited estimate that 10-20 million people are infected with human T-cell lymphotropic virus type 1 worldwide was calculated from data that are now 25 years old. This estimate may therefore no longer reflect the global epidemiology. The objective of this study was to collate published data that are truly representative of the general population through a systematic review of the literature. Fifty-nine relevant studies were identified and the 17 that met the inclusion criteria were all cross-sectional designs; none reported incidence. The prevalence of human T-cell lymphotropic virus type 1 was highest in the two studies of Japanese islands (36.4%; 95% CI: 29.9-42.8) and lowest in studies from Mongolia, Malaysia and India. In Haiti the prevalence was 3.8% (95% CI: 1.78-5.86); in Africa between 6.6% (95% CI: 4.0-9.9) and 8.5% (95% CI: 6.99-10.10) in Gabon, and 1.05% (95% CI: 0.63-1.47) in Guinea. Only three studies were from West Africa and none were from the South; the only study from India was from the north of the country. We conclude that there is a paucity of general population data from countries in which human T-cell lymphotropic virus type 1 is endemic, and that new studies are required to reevaluate the global burden of infection. (AIDS Rev. 2009;11:205-14)Corresponding author: Carol Hlela, [email protected]
Key words
HTLV-1. HTLV-1 infection. Prevalence. General population.
AIDS Reviews. 2009;11
206
with HTLV-1 causes significant morbidity (HAM/TSP: 50% become wheel chair dependant) and mortality (ATLL: median survival of 6-8 months). Other confirmed associations include uveitis, arthropathy, and HTLV-1-associated infective dermatitis5-8.
It is reported that HTLV-1 has infected 10-20 million people worldwide9, but the reality is that estimating the global prevalence of HTLV-1 on the basis of published reports is difficult because there are very few popula-tion-based studies, and selected populations where HTLV-1 infection has been found are overrepresented. The HTLV-1 infection is known to vary in prevalence or incidence across different geographic regions and popula-tion sectors. Serological screening of blood donors, preg-nant women, and other selected population groups has been common. The value of data derived from blood do-nors is often limited due to the exclusion of individuals from high-risk groups and underrepresentation of ethnic mi-norities2. Comparisons between blood donor populations with those attending antenatal clinics are not without prob-lems. In Europe it has been demonstrated that even be-tween blood donors and pregnant women, there are con-siderable differences, especially when volunteer donors are used as they are biased towards low seroprevalence of viral blood-transmissible infections2. Data from pregnant women are not representative of all ages, yet HTLV-1 is reported to increase with age and may be predominant in females10. Amongst injecting drug users, a high preva-lence of HTLV-2 has been found, but HTLV-1 is mostly rare in the same populations. Although HTLV-2 is frequently associated with HIV-1 infection, especially amongst inject-ing drug users in Europe and North America11,12, it is not usually associated with disease per se. The epidemiol-ogy of both HTLV-3 and HTLV-4 is not well understood since only rare human infection in primate hunters in Cameroon has been reported13,14. Therefore, this re-view focuses on HTLV-1. Information on prevalence from representative samples of the general population is rare.
The objective of this study was to collate data that are truly representative of the general population through a systematic review of the literature.
Methods
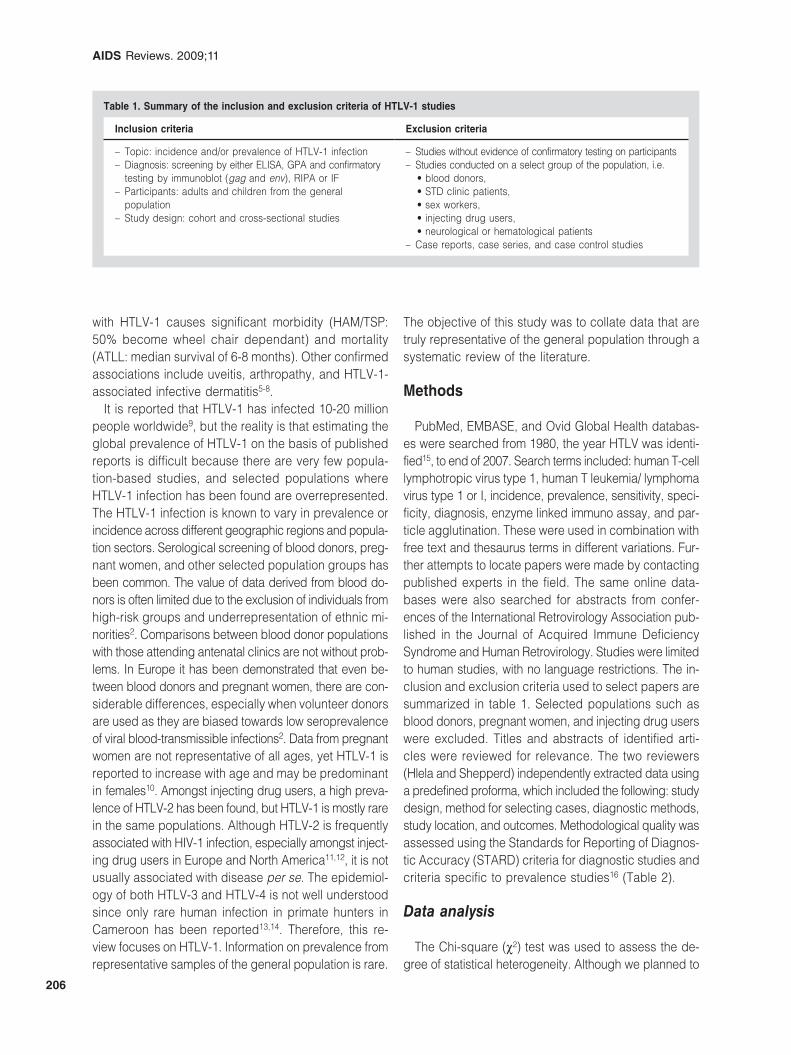
PubMed, EMBASE, and Ovid Global Health databas-es were searched from 1980, the year HTLV was identi-fied15, to end of 2007. Search terms included: human T-cell lymphotropic virus type 1, human T leukemia/ lymphoma virus type 1 or I, incidence, prevalence, sensitivity, spe ci-ficity, diagnosis, enzyme linked immuno assay, and par-ticle agglutination. These were used in combination with free text and thesaurus terms in different variations. Fur-ther attempts to locate papers were made by contacting published experts in the field. The same online data-bases were also searched for abstracts from confer-ences of the International Retrovirology Association pub-lished in the Journal of Acquired Immune Deficiency Syndrome and Human Retrovirology. Studies were limited to human studies, with no language restrictions. The in-clusion and exclusion criteria used to select papers are summarized in table 1. Selected populations such as blood donors, pregnant women, and injecting drug users were excluded. Titles and abstracts of identified arti-cles were reviewed for relevance. The two reviewers (Hlela and Shepperd) independently extracted data using a predefined proforma, which included the following: study design, method for selecting cases, diagnostic methods, study location, and outcomes. Methodological quality was assessed using the Standards for Reporting of Diagnos-tic Accuracy (STARD) criteria for diagnostic studies and criteria specific to prevalence studies16 (Table 2).
Data analysis
The Chi-square (χ²) test was used to assess the de-gree of statistical heterogeneity. Although we planned to
Table 1. Summary of the inclusion and exclusion criteria of HTLV-1 studies
Inclusion criteria Exclusion criteria
– Topic: incidence and/or prevalence of HTLV-1 infection– Diagnosis: screening by either ELISA, GPA and confirmatory
testing by immunoblot (gag and env), RIPA or IF – Participants: adults and children from the general
population– Study design: cohort and cross-sectional studies
– Studies without evidence of confirmatory testing on participants– Studies conducted on a select group of the population, i.e.
• blood donors,• STD clinic patients, • sex workers, • injecting drug users, • neurological or hematological patients
– Case reports, case series, and case control studies
Carol Hlela, et al.: The Prevalence of HTLV-1 in the General Population is Unknown
207
calculate a pooled summary estimate, this was not pursued due to the high level of statistical heterogene-ity, explained by variation in the diagnostic techniques employed by the different studies and in the study populations. Study data were entered into STATA soft-ware, version 7, to calculate individual study effect sizes and 95% CI.
Results
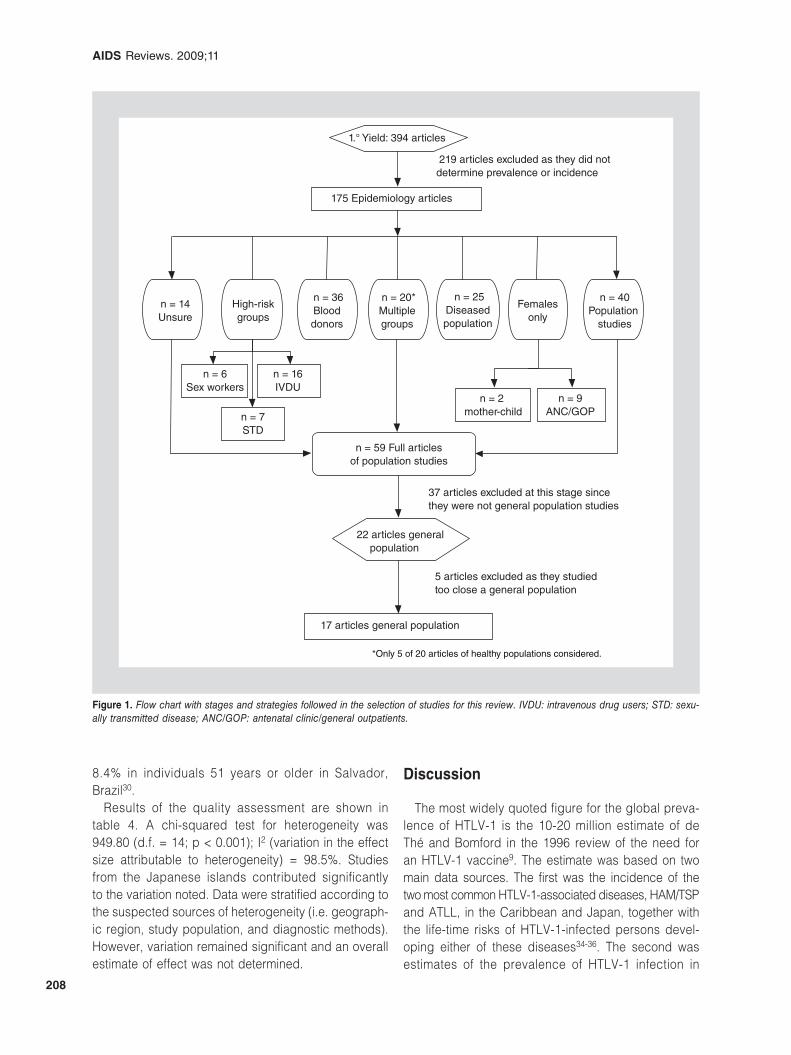
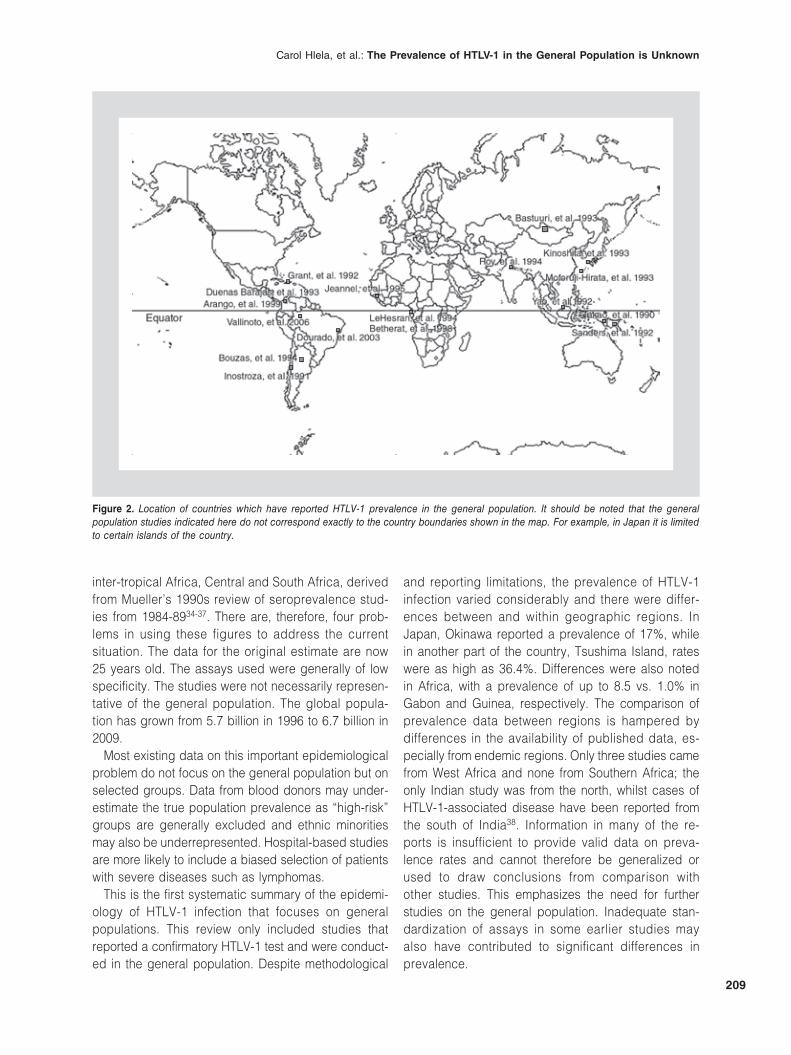
The primary search yielded 394 references, from which 59 relevant papers were identified and 17 met the inclu-sion criteria; all described prevalence of infection and all were published in English. Studies were excluded on the following grounds: lack of original data (n = 5), conducted in unrepresentative populations (n = 20), inappropriate study design (n = 4), no confirmatory testing done (n = 1) or testing performed on only some of the specimens (n = 1), prevalence not stated (n = 1) or prevalence not reported separately for HTLV-1 and HTLV-2 (n = 1). The different stages and categories of the search strategy are summarized in figure 1 and the geographic locations of the studies are depicted in figure 2.
Included studies comprised a total of 16,745 par-ticipants (age range 0-89 years) and were conducted between 1988 and 1999 and published between 1991 and 2006. All 17 studies investigated the prevalence of HTLV-1 infection in a general population using dif-ferent representative groups, with 10 recruiting indig-enous populations. One study investigated healthy in-dividuals accompanying relatives to hospital (which might have introduced bias)17, whilst two did not char-acterize their “healthy” population any further. In four
papers the general population studied was not clearly characterized. The 17 papers reviewed are listed in table 3.
The prevalence of HTLV-1 varied considerably. No cases were identified in some Asian countries18-20. The highest prevalence was reported from the Japa-nese islands of Okinawa and Tsushima, 36.4% (95% CI: 29.9-42.8)21; 17.8% (95% CI: 16.0-19.4) in 1980 and 17.1% (95% CI: 15.2-18.9) in 1989/199022. In Haiti the prevalence was 3.8% (95% CI: 1.78-5.86)17. In African studies the prevalence was between 6.6% (95% CI: 4.0-9.9)23 and 8.5% (95% CI: 6.99-10.1) in Gabon24 and 1.05% (95%: CI 0.63-1.47) in Guinea25. In Oceania a single-centre study carried out in Papua New Guinea reported a prevalence of 1.9% (95% CI: 1.42-2.42)26, whilst a multi-regional study conducted in New Guinea from both Papua New Guinea and Irian Jaya (previously referred to as Asia, being politi-cally Indonesia), Indonesia, reported an overall prev-alence of 3.76% (95% CI: 2.69-4.83)27. In Brazil an Amazonian general population had a seroprevalence of 1.15% (95% CI: 0.14-2.46)28, while in Salvador the rate was 1.7% (95% CI: 1.1-2.5)29. Prevalence rates in other studies conducted in Latin America were between 0.8% (95% CI: 0.5-4.6)30 and 2.1%31 within the Columbian Indian tribes, 0.70% (95% CI: 0.09-1.57) among the Mapuche of Chile32, and 0.45% (95% CI: 0.43-1.33) among the Indians and natives from dif-ferent regions of Argentina33. In studies with strati-fied data, HTLV-1 prevalence was higher in females and increased with age17,22,24-26. In two studies23,30 prevalence was reported to increase with age but not with gender. Duorado, et al. reported prevalence ranging from 0.3% in the 0-15 year age group up to
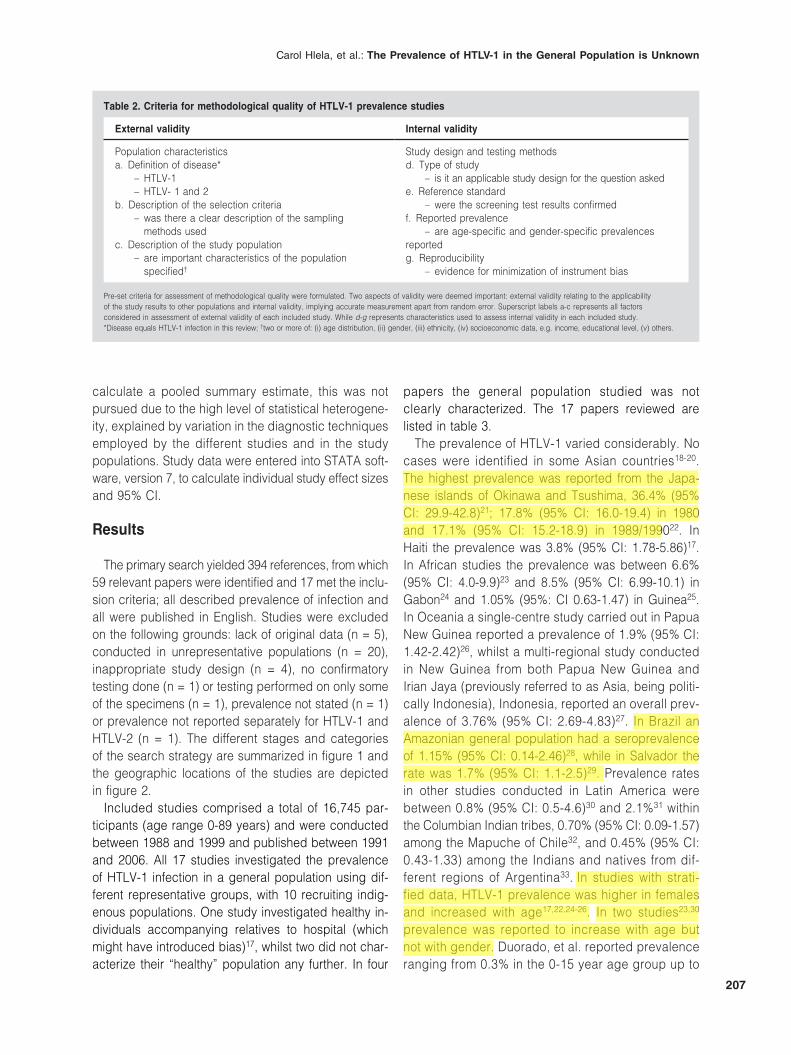
Table 2. Criteria for methodological quality of HTLV-1 prevalence studies
External validity Internal validity
Population characteristicsa. Definition of disease* – HTLV-1 – HTLV- 1 and 2b. Description of the selection criteria – was there a clear description of the sampling
methods usedc. Description of the study population – are important characteristics of the population
specified†
Study design and testing methodsd. Type of study – is it an applicable study design for the question askede. Reference standard – were the screening test results confirmed f. Reported prevalence – are age-specific and gender-specific prevalences reportedg. Reproducibility – evidence for minimization of instrument bias
Pre-set criteria for assessment of methodological quality were formulated. Two aspects of validity were deemed important: external validity relating to the applicability of the study results to other populations and internal validity, implying accurate measurement apart from random error. Superscript labels a-c represents all factors considered in assessment of external validity of each included study. While d-g represents characteristics used to assess internal validity in each included study. *Disease equals HTLV-1 infection in this review; †two or more of: (i) age distribution, (ii) gender, (iii) ethnicity, (iv) socioeconomic data, e.g. income, educational level, (v) others.
Bgalvao
Realce
Bgalvao
Realce
Bgalvao
Realce
Bgalvao
Realce
AIDS Reviews. 2009;11
208
8.4% in individuals 51 years or older in Salvador, Brazil30.
Results of the quality assessment are shown in table 4. A chi-squared test for heterogeneity was 949.80 (d.f. = 14; p < 0.001); I2 (variation in the effect size attributable to heterogeneity) = 98.5%. Studies from the Japanese islands contributed significantly to the variation noted. Data were stratified according to the suspected sources of heterogeneity (i.e. geograph-ic region, study population, and diagnostic methods). However, variation remained significant and an overall estimate of effect was not determined.
Discussion
The most widely quoted figure for the global preva-lence of HTLV-1 is the 10-20 million estimate of de Thé and Bomford in the 1996 review of the need for an HTLV-1 vaccine9. The estimate was based on two main data sources. The first was the incidence of the two most common HTLV-1-associated diseases, HAM/TSP and ATLL, in the Caribbean and Japan, together with the life-time risks of HTLV-1-infected persons devel-oping either of these diseases34-36. The second was estimates of the prevalence of HTLV-1 infection in
1.° Yield: 394 articles
175 Epidemiology articles
n = 40Population
studies
n = 25Diseased population
n = 20*Multiple groups
n = 36Blood donors
High-riskgroups
Femalesonly
n = 2 mother-child
n = 9ANC/GOP
22 articles general population
17 articles general population
5 articles excluded as they studied too close a general population
219 articles excluded as they did notdetermine prevalence or incidence
37 articles excluded at this stage since they were not general population studies
n = 14Unsure
n = 6Sex workers
n = 16IVDU
n = 7STD
n = 59 Full articlesof population studies
*Only 5 of 20 articles of healthy populations considered.
Figure 1. Flow chart with stages and strategies followed in the selection of studies for this review. IVDU: intravenous drug users; STD: sexu-ally transmitted disease; ANC/GOP: antenatal clinic/general outpatients.
Carol Hlela, et al.: The Prevalence of HTLV-1 in the General Population is Unknown
209
inter-tropical Africa, Central and South Africa, derived from Mueller’s 1990s review of seroprevalence stud-ies from 1984-8934-37. There are, therefore, four prob-lems in using these figures to address the current situation. The data for the original estimate are now 25 years old. The assays used were generally of low specificity. The studies were not necessarily represen-tative of the general population. The global popula-tion has grown from 5.7 billion in 1996 to 6.7 billion in 2009.
Most existing data on this important epidemiological problem do not focus on the general population but on selected groups. Data from blood donors may under-estimate the true population prevalence as “high-risk” groups are generally excluded and ethnic minorities may also be underrepresented. Hospital-based studies are more likely to include a biased selection of patients with severe diseases such as lymphomas.
This is the first systematic summary of the epidemi-ology of HTLV-1 infection that focuses on general populations. This review only included studies that reported a confirmatory HTLV-1 test and were conduct-ed in the general population. Despite methodological
and reporting limitations, the prevalence of HTLV-1 infection varied considerably and there were differ-ences between and within geographic regions. In Japan, Okinawa reported a prevalence of 17%, while in another part of the country, Tsushima Island, rates were as high as 36.4%. Differences were also noted in Africa, with a prevalence of up to 8.5 vs. 1.0% in Gabon and Guinea, respectively. The comparison of prevalence data between regions is hampered by differences in the availability of published data, es-pecially from endemic regions. Only three studies came from West Africa and none from Southern Africa; the only Indian study was from the north, whilst cases of HTLV-1-associated disease have been reported from the south of India38. Information in many of the re-ports is insufficient to provide valid data on preva-lence rates and cannot therefore be generalized or used to draw conclusions from comparison with other studies. This emphasizes the need for further studies on the general population. Inadequate stan-dardization of assays in some earlier studies may also have contributed to significant differences in prevalence.
Figure 2. Location of countries which have reported HTLV-1 prevalence in the general population. It should be noted that the general population studies indicated here do not correspond exactly to the country boundaries shown in the map. For example, in Japan it is limited to certain islands of the country.
AIDS Reviews. 2009;11
210
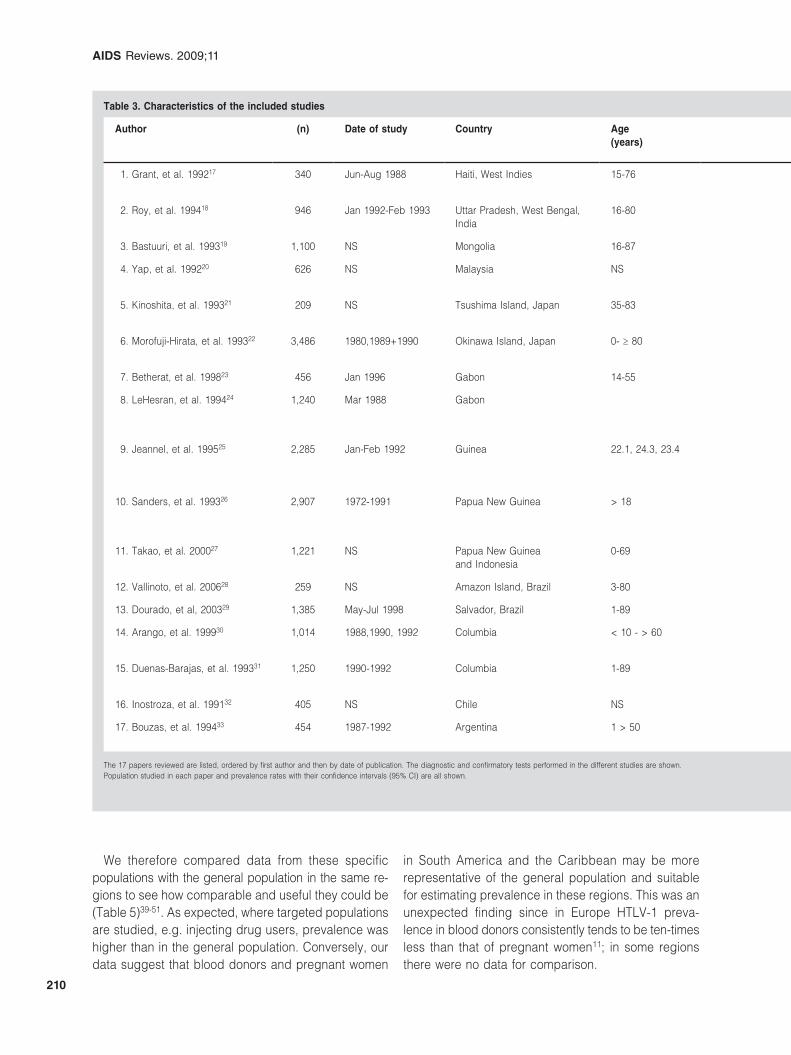
Table 3. Characteristics of the included studies
Author (n) Date of study Country Age(years)
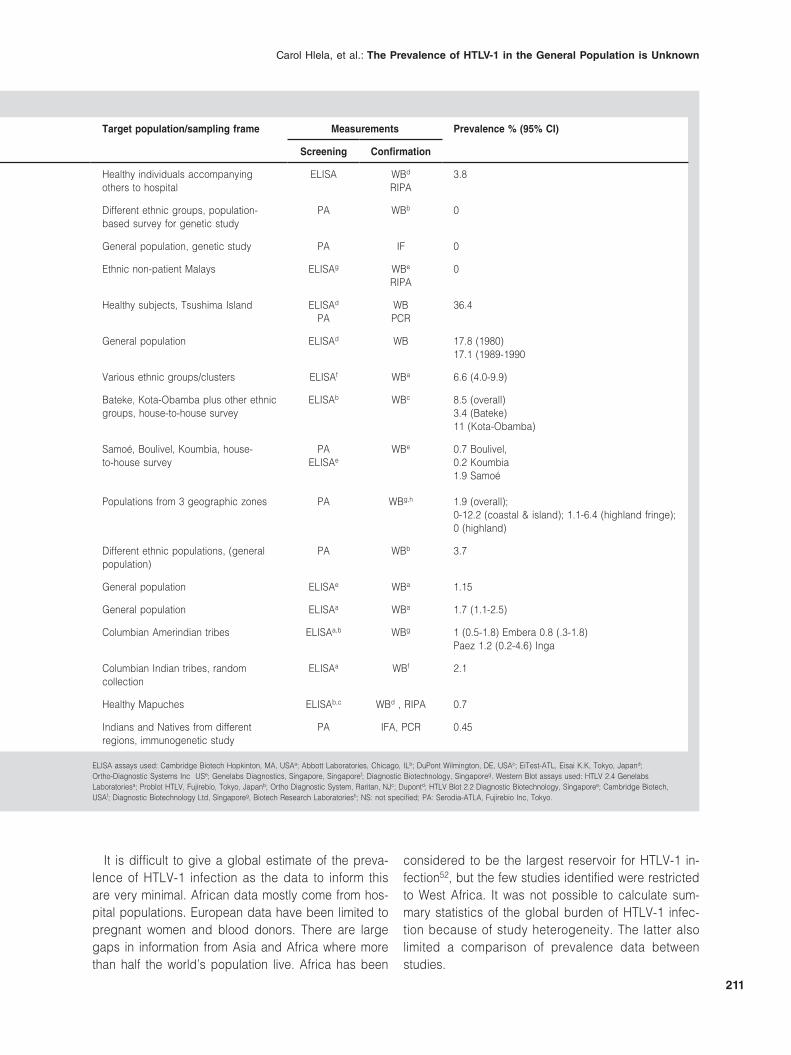
Target population/sampling frame Measurements Prevalence % (95% CI)
Screening Confirmation
1. Grant, et al. 199217 340 Jun-Aug 1988 Haiti, West Indies 15-76 Healthy individuals accompanying others to hospital
ELISA WBd
RIPA3.8
2. Roy, et al. 199418 946 Jan 1992-Feb 1993 Uttar Pradesh, West Bengal, India
16-80 Different ethnic groups, population-based survey for genetic study
PA WBb 0
3. Bastuuri, et al. 199319 1,100 NS Mongolia 16-87 General population, genetic study PA IF 0
4. Yap, et al. 199220 626 NS Malaysia NS Ethnic non-patient Malays ELISAg WBe
RIPA0
5. Kinoshita, et al. 199321 209 NS Tsushima Island, Japan 35-83 Healthy subjects, Tsushima Island ELISAd
PAWBPCR
36.4
6. Morofuji-Hirata, et al. 199322 3,486 1980,1989+1990 Okinawa Island, Japan 0- ≥ 80 General population ELISAd WB 17.8 (1980)17.1 (1989-1990
7. Betherat, et al. 199823 456 Jan 1996 Gabon 14-55 Various ethnic groups/clusters ELISAf WBa 6.6 (4.0-9.9)
8. LeHesran, et al. 199424 1,240 Mar 1988 Gabon Bateke, Kota-Obamba plus other ethnic groups, house-to-house survey
ELISAb WBc 8.5 (overall)3.4 (Bateke)11 (Kota-Obamba)
9. Jeannel, et al. 199525 2,285 Jan-Feb 1992 Guinea 22.1, 24.3, 23.4 Samoé, Boulivel, Koumbia, house- to-house survey
PAELISAe
WBe 0.7 Boulivel,0.2 Koumbia1.9 Samoé
10. Sanders, et al. 199326 2,907 1972-1991 Papua New Guinea > 18 Populations from 3 geographic zones PA WBg,h 1.9 (overall);0-12.2 (coastal & island); 1.1-6.4 (highland fringe); 0 (highland)
11. Takao, et al. 200027 1,221 NS Papua New Guinea and Indonesia
0-69 Different ethnic populations, (general population)
PA WBb 3.7
12. Vallinoto, et al. 200628 259 NS Amazon Island, Brazil 3-80 General population ELISAe WBa 1.15
13. Dourado, et al, 200329 1,385 May-Jul 1998 Salvador, Brazil 1-89 General population ELISAa WBa 1.7 (1.1-2.5)
14. Arango, et al. 199930 1,014 1988,1990, 1992 Columbia < 10 - > 60 Columbian Amerindian tribes ELISAa,b WBg 1 (0.5-1.8) Embera 0.8 (.3-1.8)Paez 1.2 (0.2-4.6) Inga
15. Duenas-Barajas, et al. 199331 1,250 1990-1992 Columbia 1-89 Columbian Indian tribes, random collection
ELISAa WBf 2.1
16. Inostroza, et al. 199132 405 NS Chile NS Healthy Mapuches ELISAb,c WBd , RIPA 0.7
17. Bouzas, et al. 199433 454 1987-1992 Argentina 1 > 50 Indians and Natives from different regions, immunogenetic study
PA IFA, PCR 0.45
The 17 papers reviewed are listed, ordered by first author and then by date of publication. The diagnostic and confirmatory tests performed in the different studies are shown. Population studied in each paper and prevalence rates with their confidence intervals (95% CI) are all shown.
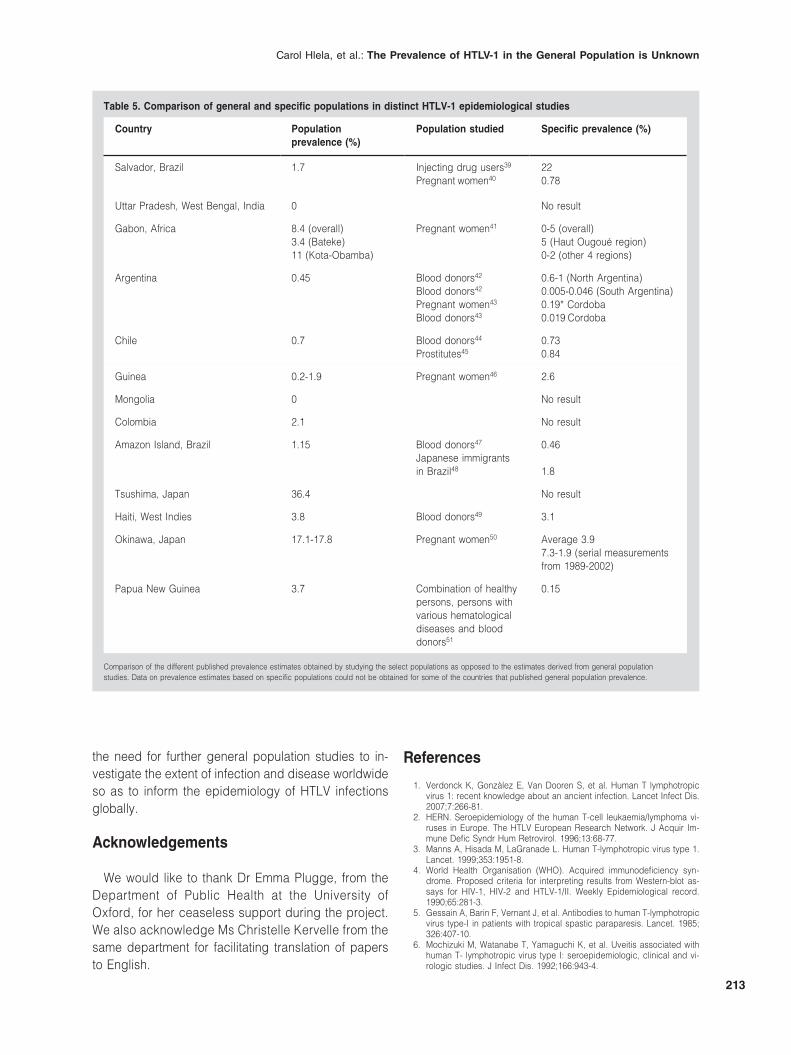
We therefore compared data from these specific populations with the general population in the same re-gions to see how comparable and useful they could be (Table 5)39-51. As expected, where targeted populations are studied, e.g. injecting drug users, prevalence was higher than in the general population. Conversely, our data suggest that blood donors and pregnant women
in South America and the Caribbean may be more representative of the general population and suitable for estimating prevalence in these regions. This was an unexpected finding since in Europe HTLV-1 preva-lence in blood donors consistently tends to be ten-times less than that of pregnant women11; in some regions there were no data for comparison.
Carol Hlela, et al.: The Prevalence of HTLV-1 in the General Population is Unknown
211
It is difficult to give a global estimate of the preva-lence of HTLV-1 infection as the data to inform this are very minimal. African data mostly come from hos-pital populations. European data have been limited to pregnant women and blood donors. There are large gaps in information from Asia and Africa where more than half the world’s population live. Africa has been
considered to be the largest reservoir for HTLV-1 in-fection52, but the few studies identified were restricted to West Africa. It was not possible to calculate sum-mary statistics of the global burden of HTLV-1 infec-tion because of study heterogeneity. The latter also limited a comparison of prevalence data between studies.
Table 3. Characteristics of the included studies
Author (n) Date of study Country Age(years)
Target population/sampling frame Measurements Prevalence % (95% CI)
Screening Confirmation
1. Grant, et al. 199217 340 Jun-Aug 1988 Haiti, West Indies 15-76 Healthy individuals accompanying others to hospital
ELISA WBd
RIPA3.8
2. Roy, et al. 199418 946 Jan 1992-Feb 1993 Uttar Pradesh, West Bengal, India
16-80 Different ethnic groups, population-based survey for genetic study
PA WBb 0
3. Bastuuri, et al. 199319 1,100 NS Mongolia 16-87 General population, genetic study PA IF 0
4. Yap, et al. 199220 626 NS Malaysia NS Ethnic non-patient Malays ELISAg WBe
RIPA0
5. Kinoshita, et al. 199321 209 NS Tsushima Island, Japan 35-83 Healthy subjects, Tsushima Island ELISAd
PAWBPCR
36.4
6. Morofuji-Hirata, et al. 199322 3,486 1980,1989+1990 Okinawa Island, Japan 0- ≥ 80 General population ELISAd WB 17.8 (1980)17.1 (1989-1990
7. Betherat, et al. 199823 456 Jan 1996 Gabon 14-55 Various ethnic groups/clusters ELISAf WBa 6.6 (4.0-9.9)
8. LeHesran, et al. 199424 1,240 Mar 1988 Gabon Bateke, Kota-Obamba plus other ethnic groups, house-to-house survey
ELISAb WBc 8.5 (overall)3.4 (Bateke)11 (Kota-Obamba)
9. Jeannel, et al. 199525 2,285 Jan-Feb 1992 Guinea 22.1, 24.3, 23.4 Samoé, Boulivel, Koumbia, house- to-house survey
PAELISAe
WBe 0.7 Boulivel,0.2 Koumbia1.9 Samoé
10. Sanders, et al. 199326 2,907 1972-1991 Papua New Guinea > 18 Populations from 3 geographic zones PA WBg,h 1.9 (overall);0-12.2 (coastal & island); 1.1-6.4 (highland fringe); 0 (highland)
11. Takao, et al. 200027 1,221 NS Papua New Guinea and Indonesia
0-69 Different ethnic populations, (general population)
PA WBb 3.7
12. Vallinoto, et al. 200628 259 NS Amazon Island, Brazil 3-80 General population ELISAe WBa 1.15
13. Dourado, et al, 200329 1,385 May-Jul 1998 Salvador, Brazil 1-89 General population ELISAa WBa 1.7 (1.1-2.5)
14. Arango, et al. 199930 1,014 1988,1990, 1992 Columbia < 10 - > 60 Columbian Amerindian tribes ELISAa,b WBg 1 (0.5-1.8) Embera 0.8 (.3-1.8)Paez 1.2 (0.2-4.6) Inga
15. Duenas-Barajas, et al. 199331 1,250 1990-1992 Columbia 1-89 Columbian Indian tribes, random collection
ELISAa WBf 2.1
16. Inostroza, et al. 199132 405 NS Chile NS Healthy Mapuches ELISAb,c WBd , RIPA 0.7
17. Bouzas, et al. 199433 454 1987-1992 Argentina 1 > 50 Indians and Natives from different regions, immunogenetic study
PA IFA, PCR 0.45
The 17 papers reviewed are listed, ordered by first author and then by date of publication. The diagnostic and confirmatory tests performed in the different studies are shown. Population studied in each paper and prevalence rates with their confidence intervals (95% CI) are all shown.
ELISA assays used: Cambridge Biotech Hopkinton, MA, USAa; Abbott Laboratories, Chicago, ILb; DuPont Wilmington, DE, USAc; EiTest-ATL, Eisai K.K, Tokyo, Japand; Ortho-Diagnostic Systems Inc USe; Genelabs Diagnostics, Singapore, Singaporef; Diagnostic Biotechnology, Singaporeg. Western Blot assays used: HTLV 2.4 Genelabs Laboratoriesa; Problot HTLV, Fujirebio, Tokyo, Japanb; Ortho Diagnostic System, Raritan, NJc; Dupontd; HTLV Blot 2.2 Diagnostic Biotechnology, Singaporee; Cambridge Biotech, USAf; Diagnostic Biotechnology Ltd, Singaporeg, Biotech Research Laboratoriesh; NS: not specified; PA: Serodia-ATLA, Fujirebio Inc, Tokyo.
AIDS Reviews. 2009;11
212
Conclusions
There are currently insufficient published data to estimate the global burden of HTLV-1 infection from data on general populations. More data are required before the results of specific populations that are gen-erally more accessible, e.g. pregnant women or blood donors, can be extrapolated to the general population. Most importantly, much of the data relates to small samples and between-study heterogeneity prevents
calculation of a summary statistic of the global burden of HTLV-1 infection. The historical estimate of 10-20 mil-lion HTLV-1-infected people worldwide should be re-viewed. General population studies are clearly needed to assess, and therefore address the implications of, HTLV-1 infection so as to inform public health policies, especially in HTLV-1 endemic countries that also have an increasing burden of HIV. The findings of this review reveal that the prevalence of HTLV-1 in general pop-ulations remains unknown. This therefore underlines
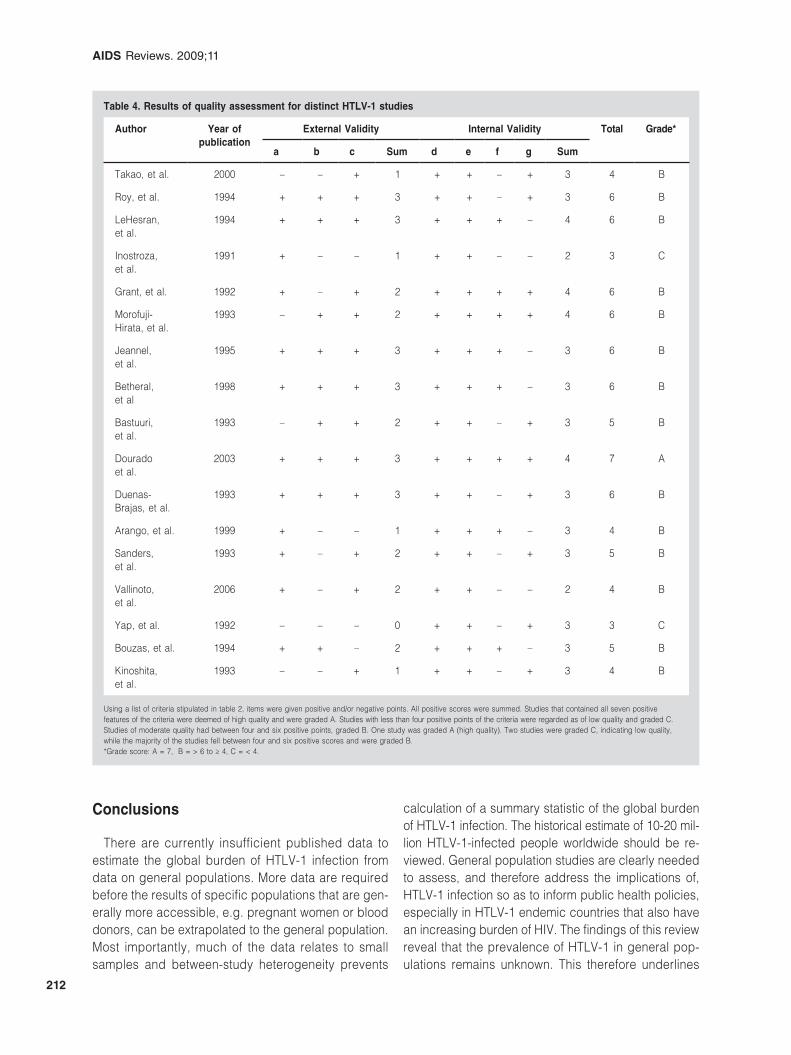
Table 4. Results of quality assessment for distinct HTLV-1 studies
Author Year of publication
External Validity Internal Validity Total Grade*
a b c Sum d e f g Sum
Takao, et al. 2000 – – + 1 + + – + 3 4 B
Roy, et al. 1994 + + + 3 + + – + 3 6 B
LeHesran, et al.
1994 + + + 3 + + + – 4 6 B
Inostroza, et al.
1991 + – – 1 + + – – 2 3 C
Grant, et al. 1992 + – + 2 + + + + 4 6 B
Morofuji-Hirata, et al.
1993 – + + 2 + + + + 4 6 B
Jeannel, et al.
1995 + + + 3 + + + – 3 6 B
Betheral, et al
1998 + + + 3 + + + – 3 6 B
Bastuuri, et al.
1993 – + + 2 + + – + 3 5 B
Dourado et al.
2003 + + + 3 + + + + 4 7 A
Duenas-Brajas, et al.
1993 + + + 3 + + – + 3 6 B
Arango, et al. 1999 + – – 1 + + + – 3 4 B
Sanders, et al.
1993 + – + 2 + + – + 3 5 B
Vallinoto, et al.
2006 + – + 2 + + – – 2 4 B
Yap, et al. 1992 – – – 0 + + – + 3 3 C
Bouzas, et al. 1994 + + – 2 + + + – 3 5 B
Kinoshita, et al.
1993 – – + 1 + + – + 3 4 B
Using a list of criteria stipulated in table 2, items were given positive and/or negative points. All positive scores were summed. Studies that contained all seven positive features of the criteria were deemed of high quality and were graded A. Studies with less than four positive points of the criteria were regarded as of low quality and graded C. Studies of moderate quality had between four and six positive points, graded B. One study was graded A (high quality). Two studies were graded C, indicating low quality, while the majority of the studies fell between four and six positive scores and were graded B. *Grade score: A = 7, B = > 6 to ≥ 4, C = < 4.
Carol Hlela, et al.: The Prevalence of HTLV-1 in the General Population is Unknown
213
the need for further general population studies to in-vestigate the extent of infection and disease worldwide so as to inform the epidemiology of HTLV infections globally.
Acknowledgements
We would like to thank Dr Emma Plugge, from the Department of Public Health at the University of Oxford, for her ceaseless support during the project. We also acknowledge Ms Christelle Kervelle from the same department for facilitating translation of papers to English.
References
1. Verdonck K, Gonzàlez E, Van Dooren S, et al. Human T lymphotropic virus 1: recent knowledge about an ancient infection. Lancet Infect Dis. 2007;7:266-81.
2. HERN. Seroepidemiology of the human T-cell leukaemia/lymphoma vi-ruses in Europe. The HTLV European Research Network. J Acquir Im-mune Defic Syndr Hum Retrovirol. 1996;13:68-77.
3. Manns A, Hisada M, LaGranade L. Human T-lymphotropic virus type 1. Lancet. 1999;353:1951-8.
4. World Health Organisation (WHO). Acquired immunodeficiency syn-drome. Proposed criteria for interpreting results from Western-blot as-says for HIV-1, HIV-2 and HTLV-1/II. Weekly Epidemiological record. 1990;65:281-3.
5. Gessain A, Barin F, Vernant J, et al. Antibodies to human T-lymphotropic virus type-I in patients with tropical spastic paraparesis. Lancet. 1985; 326:407-10.
6. Mochizuki M, Watanabe T, Yamaguchi K, et al. Uveitis associated with human T- lymphotropic virus type I: seroepidemiologic, clinical and vi-rologic studies. J Infect Dis. 1992;166:943-4.
Table 5. Comparison of general and specific populations in distinct HTLV-1 epidemiological studies
Country Population prevalence (%)
Population studied Specific prevalence (%)
Salvador, Brazil 1.7 Injecting drug users39
Pregnant women40220.78
Uttar Pradesh, West Bengal, India 0 No result
Gabon, Africa 8.4 (overall)3.4 (Bateke)11 (Kota-Obamba)
Pregnant women41 0-5 (overall)5 (Haut Ougoué region)0-2 (other 4 regions)
Argentina 0.45 Blood donors42
Blood donors42
Pregnant women43
Blood donors43
0.6-1 (North Argentina)0.005-0.046 (South Argentina)0.19* Cordoba0.019 Cordoba
Chile 0.7 Blood donors44
Prostitutes450.730.84
Guinea 0.2-1.9 Pregnant women46 2.6
Mongolia 0 No result
Colombia 2.1 No result
Amazon Island, Brazil 1.15 Blood donors47
Japanese immigrants in Brazil48
0.46
1.8
Tsushima, Japan 36.4 No result
Haiti, West Indies 3.8 Blood donors49 3.1
Okinawa, Japan 17.1-17.8 Pregnant women50 Average 3.97.3-1.9 (serial measurements from 1989-2002)
Papua New Guinea 3.7 Combination of healthy persons, persons with various hematological diseases and blood donors51
0.15
Comparison of the different published prevalence estimates obtained by studying the select populations as opposed to the estimates derived from general population studies. Data on prevalence estimates based on specific populations could not be obtained for some of the countries that published general population prevalence.
AIDS Reviews. 2009;11
214
7. Eguchi K, Origuchi T, Takashima H, et al. Seroprevalence of anti-HTLV-1 antibody in rheumatoid arthritis. Arthritis Rheum. 1996;39:463-6.
8. LeGranade L, Schwartz R, Janniger C. Childhood dermatitis in the trop-ics: with special emphasis on infective dermatitis, a marker for infection with human T-cell leukemia virus-1. Cutis. 1996;58:115-18.
9. de The G, Bomford R. An HTLV-1 vaccine: why, how, for whom? AIDS Res Hum Retroviruses. 1993;9:381-6.
10. Murphy E, Figueroa J, Blattner W. Human T-lymphotropic virus type-1 (HTLV-1) seroprevalence in Jamaica. Am J Epidemiol. 1991;133:1114-24.
11. Taylor G. Seroepidemiology of the human T-cell leukaemia/lymphoma viruses in Europe. J Acquir Immune Defic Syndr Hum Retrovirol. 1996;13: 68-77.
12. Robert-Guroff M, Weiss S, Giron J, et al. Prevalence of antibodies to HTLV-1,-II and -III in intravenous drug abusers from an AIDS endemic region. JAMA. 1986;255:3133-7.
13. Wolfe N, Heneine W, Carr J, et al. Emergence of unique primate T-lym-photropic viruses among central African bushmeat hunters. Proc Natl Acad Sci USA. 2005;102:7994-9.
14. Calattini S, Chevalier S, Duprez R, et al. Discovery of a new human T-cell lymphotropic virus (HTLV-3) in Central Africa. Retrovirology. 2005;2:30.
15. Poiesz B, Ruscetti F, Gazdar A, et al. Detection and isolation of type C retrovirus from fresh and cultured lymphocytes of patients with cutane-ous T-cell lymphoma. Proc Natl Acad Sci USA. 1980;77:7415 -9.
16. What makes a good prevalence survey? In Evidence-based Dermatol-ogy. Radelescu M, et al. (Ed.) London: BMJ Books. 2003;1-9.
17. Grant W, Bia F, Chacko T, et al. Comparison of Enzyme-Linked Immu-nosorbent and indirect antibodies in sera from rural Haiti. Diagn Micro-biol Infect Dis. 1992;15:121-4.
18. Roy M, Das M, Ishida T, et al. Absence of HTLV-1 infection in some In-dian populations. Indian J Med Res. 1994;100:160-2.
19. Batsuuri J, Dashnyam B, Maidar J, et al. Absence of human T-lympho-tropic virus type 1 in different populations in Mongolia. Scand J Infect Dis. 1993;25:398-9.
20. Yap S, Peh S, Chan L, et al. HTLV-1 antibody study in normal individu-als and unselected hospital patients in Malaysia. Southeast Asian J Trop Med Public Health. 1992;23:26-9.
21. Kinoshita T, Imamura J, Nagai H, et al. Absence of HTLV-1 infection among seronegative subjects in an endemic area of Japan. Int J Cancer. 1993;54:16-19.
22. Morofuji-Hirata M, Kariyama W, Nakashima K, et al. Prevalence of anti-body to HTLV type I in Okinawa, Japan, after an interval of 9 years. Am J Epidemiol. 1993;137:43-8.
23. Betherat E, Makuwa M, Renaut A, et al. HIV-1, HTLV-1 and HTLV-1I in a semiurban population in East Gabon. J Acquir Immune Defic Syndr Hum Retrovirol. 1998;19:430-2.
24. LeHesran J, Delaporte E, Gaudebout C, et al. Demographic factors as-sociated with HTLV-1 Infection in a Gabonese community. Int J Epide-miol. 1994;23:812-17.
25. Jeannel D, Kourouma K, Fretz C, et al. Regional differences in human retroviral infections HIV-1, HIV-2, and HTLV-1/II in Rural Guinea (West Africa). J Acquir Immune Defic Syndr Hum Retrovirol. 1995;8:315-18.
26. Sanders RC, Wai’in P, Alexander S, et al. The prevalence of antibodies to human T-lymphotropic virus type I in different population groups in Papua New Guinea. Arch Virol. 1993;130:327-34.
27. Takao S, Ishida T, Bhatia K, et al. Seroprevalence of human T-lympho-tropic virus type 1 in Papua New Guinea and Irian Jaya measured using different Western blot criteria. J Clin Virol. 2000;16:129-33.
28. Vallinoto A, Pontes G, Muto N, et al. Identification of human T-cell lympho-tropic virus infection in a semi-isolated Afro-Brazilian qulombo located in the Marajó Island (Pará, Brazil). Mem Inst Oswaldo Cruz. 2006;101:103-5.
29. Dourado I, Alcantara L, Barreto M, et al. HTLV-1 in the general popula-tion of Salvador, Brazil A city with African ethnic and sociodemographic characteristics. J Acquir Immune Defic Syndr. 2003;34:527-31.
30. Arango C, Maloney E, Rugeles M, et al. HTLV-1 and HTLV-1I coexist among the Embere and Inga Amerindians of Colombia. J Acquir Immune Defic Syndr Hum Retrovirol. 1999;20:102-3.
31. Duenas-Barajas E, Bernal J, Vaught D, et al. Human retroviruses in Amerindians of Columbia: high prevalence of human T-cell lymphotropic virus type II infection among the Tunebo Indians. Am J Trop Med Hyg. 1993;49:657-63.
32. Inostroza J, Diaz P, Saunier C. Prevalence of antibodies to HTLV-1 in South American Indians (Maphuches) from Chile. Scand J Infect Dis. 1991;23:507-8.
33. Bouzas MB, Zapiola I, Quiruelas S, et al. HTLV type I and HTLV type II infection among Indians and Natives from Argentina. AIDS Res Hum Retroviruses. 1994;10:1567-71.
34. Tajima K. The 4th nationwide study of adult T-cell//leukemia/lymphoma (ATL) in Japan: estimates of risk of ATL and its geographical and clinical fea-tures. The T- and B-cell Malignancy Study Group. Int J Cancer. 1990;45: 237-43.
35. Kaplan J, Osame M, Kubota H, et al. The risk of development of HTLV-1-associated myelopathy/tropical spastic paraparesis among persons in-fected with HTLV-1. J Acquir Immune Defic Syndr Hum Retrovirol. 1990; 3:1096-101. 35. Murphey EL, Hanchard B, Figueroa JP, et al. Modelling the risks of ATLL in persons infected with HTLV-1. Int J Cancer. 1989;43: 250-3.
36. Gessain A, Gout O. Chronic myelopathy associated with human T-lym-photropic virus type I (HTLV-1). Ann Intern Med. 1992;117:933-46.
37. Mueller N. The Epidemiology of HTLV-1 infection. Cancer Causes Con-trol. 1991;2:37-52.
38. Chandy M, Babu P, Saraswathy N, et al. HTLV-1 infection in patients with leukaemia in southern India. Lancet. 1991;338:380-1.
39. Andrade T, Dourado I, Galvào-Castro B, et al. Associations among the HTLV-1, HTLV-2 and HIV among injecting drug users in Salvador, Brazil. J Acquir Immune Defic Syndr. 1998;18:186-7.
40. Bittencourt A, Dourado I. Human T-cell lymphotropic virus type-1 infection among pregnant women in northeastern Brazil. J Acquir Immune Defic Syndr Hum Retrovirol. 2001;26:490-4.
41. Etenna S, Caron M, Besson G, et al. New insights into prevalence, ge-netic diversity and proviral load of human T-cell leukemia virus types -1 and 2 in pregnant women in Gabon in Equatorial Central Africa. J Clin Microbiol. 2008;46:3607-17.
42. Gastaldello R, Hall W, Gallego S, et al. Seroepidemiology of HTLV-1/II in Argentina: an overview. J Acquir Immune Defic Syndr Hum Retrovirol. 2004;35:301-8.
43. Trenchi A, Gastaldello R, Balangero M, et al. Retrospective study of the prevalence of human T-cell lymphotropic virus type 1/2, HIV and HBV in pregnant women in Argentina. J Med Virol. 2007;79:1974-8.
44. Vasquez P, Sanchez G, Volante C, et al. Human T-lymphotropic virus type-1: new risk for Chilean population. Blood. 1991;78:850-1.
45. Suarez M, Quero M, Ramírez A. Prevalence of HTLV-1 antibodies and possible risk factors in Chilean Prostitutes. Rev Med Chil. 1993;121: 614-7.
46. Zehender G, Ebranati E, Maddalena C, et al. Description of a “trans-Saharan” strain of human T-lymphotropic virus type 1 in West Africa. J Acquir Immune Defic Syndr Hum Retrovirol. 2008;47:269-73.
47. Mota-Miranda A, Araujo S, Dias J, et al. HTLV-1 infection in blood donors from western Brazilian Amazon region: Seroprevalence and molecular study of viral isolates. J Med Virol. 2008;80;1966-71.
48. Vallinoto A, Muto N. Serological and molecular evidence of HTLV-1 infec-tion among Japanese immigrants living in the Amazon region of Brazil. Jpn J Infect Dis. 2004;57:156-9.
49. de-Thé G, Gessan A, Gazzolo L, et al. Comparative seroepidemiolgy of HTLV-1 and HTLV-1II in the French West Indies and some African coun-tries. Cancer Res. 985;45(Suppl):4633-6s.
50. Maehama T. Human T cell leukemia virus-1 in pregnancy. Int J Gynaecol Obstet. 2004;87:247-8.
51. Tanggo Y, Gultom S, Simanjuntak T, et al. HTLV-1 in Indonesia, very low prevalence in the Jakarta: Antibodies in the healthy blood donors and various non hematological diseases. Intervirology. 2000;43:77-9.
52. Hunsmann G, Bayer H, Schneider J, et al. Antibodies to ATLV/HTLV-1 in Africa. Med Microbiol Immunol. 1984;173:167-70.
Related Documents