Hiver’s Customer Service Benchmark Report - 2021

Welcome message from author
This document is posted to help you gain knowledge. Please leave a comment to let me know what you think about it! Share it to your friends and learn new things together.
Transcript
Hiver’s CustomerService BenchmarkReport - 2021

Key Findings
Benchmark Results
Conclusion
Key Takeaways
About Hiver
4
6
29
31
32
Introduction 1
Methodology 2
Table of Contents

Companies that want to survive in starkly competitive markets, have
to fight tooth and nail for customers' business, and compromising on
the customer experience no longer remains an option.
1
But, what are companies doing differently now? How are they
delivering customer service in the digital age? How quickly do they
respond to their customers? How do they measure their support
quality? Most importantly – what are they doing to go the extra mile to
understand their customers and delight them?
In its first ever Customer Service Benchmark Report, Hiver finds out
answers to these important questions by surveying customer service
representatives on how they deliver support.
A few decades ago, customer service wasn’t considered a priority for a
lot of companies. Robotic IVR messages, long wait times and repeated
call transfers were commonplace; proactive, personalized and
empathic customer service was unheard of. Customers had little
choice but to put up with such substandard service quality.
Today, however, with the internet and smartphones having
revolutionized the way people communicate, customer expectations
have changed. The unprecedented events of the past year and a half
have especially led to a monumental shift in how customers connect
with brands, and the kind of service they demand.
Introduction

Hiver surveyed over 500 US-based customer service professionals to
understand how their teams handle and deliver support. We’ve divided their
responses under three broad categories:
Their work models, support availability and key support channels.
Customer support processes
Their SLA policies, average response and resolution times.
Performance benchmarking
Their most important indicators of support quality, key KPIs and customer feedback channels.
Support quality benchmarking
Methodology
2

The surveyed professionals were from a
mix of small, medium, large and enterprise-
level companies.
Here’s a further breakdown of those surveyed based on
the sizes of their support teams.
31%
47%
23%
12%
7%
11%
Small 0-50
0-10
Medium 51-200
11-25
Large 201-1000
26-50
Enterprise Over 1000
51-100
Over 100
35%
16%18%
3

4
of customer service teams have some
kind of remote work arrangement.
of customer service
teams offer tele support.
of teams are fully remote.
of teams offer support
via email.
of customer service teams offer
24x7 customer service.
of companies are extending support
outside of traditional business hours.
Key Findings
60%
83%
25%
77%
34%
76%

5
of the surveyed support professionals said
their First Response Time (FRT) for email
queries is less than 1 hour.
of teams said Customer
Satisfaction Score (CSAT) is their
most important KPI.
of teams analyze support tickets
to infer customer feedback.
41% 51%
of companies promise a resolution
time of below 6 hours.
50%34%
of companies deliver support
across 3 or more channels.
of customer service teams
said phone is their busiest
support channel.
60% 50%

Benchmark Results
6

Section 1
Customer support processes
7

8
Remote work is here to stay: 61% ofteams have some form of remote workarrangement
What work modeldoes your customerservice team have?
1For a lot of customer service teams, the pandemic-induced shift to
remote workplaces seems to have had a lasting impact on their work
models.
Despite the global vaccine rollout, our research shows that 61% of
teams now have some remote workers. At least 25% of these support
teams have adopted a fully remote work structure while 36% have a
hybrid work model.
There are still 38% that work out of an office.
100%remote model
Wo
rk m
od
el Hybridmodel
In officemodel
Percentage of respondents
0 10%10% 20% 30% 40%
25%
36%
38%
The pandemic changed everything, and now customer
service teams – like their counterparts in other departments
– can be just as effective remotely as they were in the office.
This presents a huge opportunity for companies to hire the
best of the best, regardless of location, and for employees to
work for companies that previously were not accessible to
them. It’s a win-win for both parties.
9
Chief Experience Officer, The Experience Maker
Dan Gingiss
10
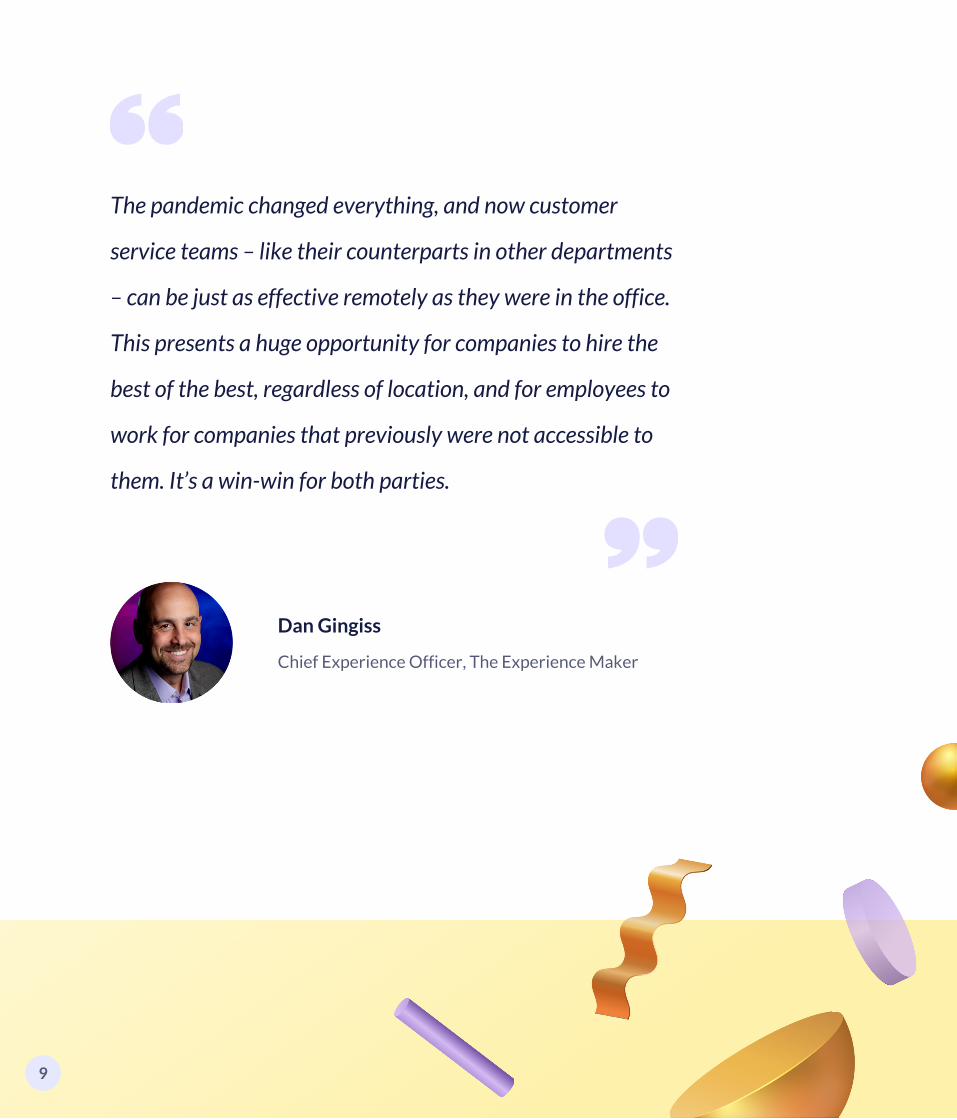
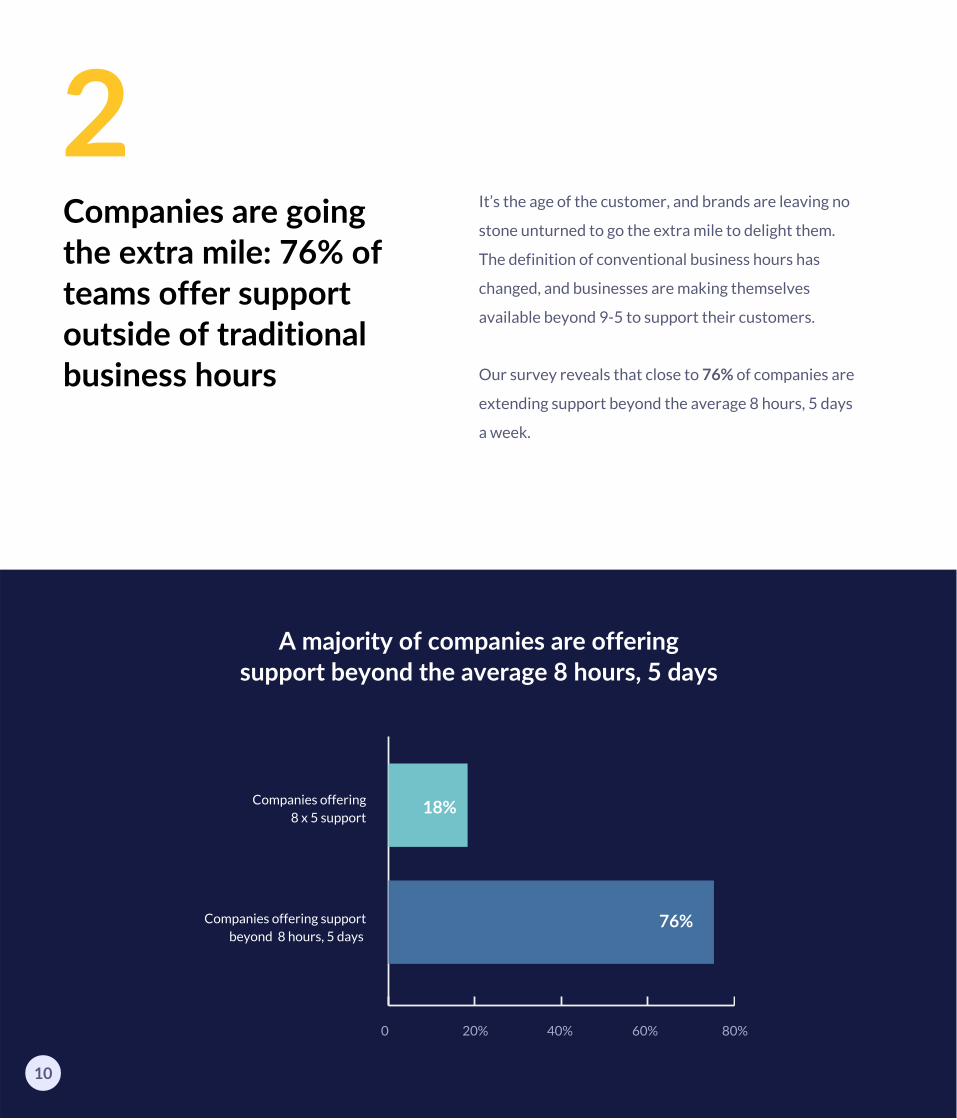
Companies are goingthe extra mile: 76% ofteams offer supportoutside of traditionalbusiness hours
A majority of companies are offeringsupport beyond the average 8 hours, 5 days
2It’s the age of the customer, and brands are leaving no
stone unturned to go the extra mile to delight them.
The definition of conventional business hours has
changed, and businesses are making themselves
available beyond 9-5 to support their customers.
Our survey reveals that close to 76% of companies are
extending support beyond the average 8 hours, 5 days
a week.
Companies offering8 x 5 support
Companies offering supportbeyond 8 hours, 5 days
0 20% 40% 60% 80%
18%
76%

What is your organization’scurrent support availability?
What’s more, the highest fraction of surveyed support professionals –
around 34% of them – are offering customers 24x7 support.
Around 14% of teams are providing 12x7 support, followed by 12%
teams offering 12x5 support. However, 18% of teams are still offering
their customers 8x5 support.
24 x 7
24 x 5
12 x 7
12 x 5
8 x 7
8 x 5
0 10% 20% 30% 40%
34%
9%
14%
12%
7%
18%
Sup
po
rt a
vaila
bili
ty
Percentage of respondents
11

Multi-channel support has become thenorm: 60% teams offer support acrossthree or more channels
A majority of teams areoffering multi-channel support
3Owing to increasing tech adoption and smartphone usage, customers
today have become more demanding than ever before. Naturally, they
expect brands to make themselves available not just whenever they
want them, but also wherever they want them to be.
Our survey shows that brands are realizing this need: Almost 60% of
respondents offer support across three or more channels.
Others
Teams that offer supportacross 3 or more channels
40%
60%
12

13
Chat
Phone
Social Media
Support forums
Self Service
0 20% 40% 60% 80% 100%
Cu
sto
mer
ser
vice
ch
ann
els
Percentage of respondents
Phone, email and chat are the three most used customer service
channels amongst the surveyed teams.
Amongst the above three channels, phone support tops the list with
83% of teams offering tele-support.
Email comes a close second with approximately 77% of teams
providing email support.
Around 42% of teams offer chat support.
42%
83%
77%
31%
16%
25%
Which all customer service channels does your team use?

Chief Experience Officer, Officium Labs
Nate Brown
Really critical data represented here. I'm amazed how
strong phone and email continue to be, acting as a reminder
that we must be careful about the assumptions we make
when it comes to customer behaviors. As much as we talk
about conversational AI, robotic process automation, and
enhanced self-service capabilities, we can't allow our guard
to slip on the traditional channels. Intelligently 'guiding
customers to the best resolution path', as stated in 'The
Effortless Experience', is still the name of the game when it
comes to channel management.
14

Traditional channels beatmodern channels: Almost50% teams said phone istheir busiest channel
4In a day and age where support teams are making huge
investments in modern and intuitive channels like AI-
powered chatbots, our survey has some rather
surprising insights.
As many as 46% of surveyed professionals responded
that phone is the busiest channel for their support team.
24% of those surveyed get the maximum number of
support requests on email.
Chat
Phone
Self-service
Social media
Support forums
0 10% 20% 30% 40% 50%
Cu
sto
mer
ser
vice
ch
ann
els
Percentage of respondents
10%
24%
46%
4%
7%
2%
Which is yourbusiest customerservice channel?
15

People want self serve until they don’t. In a world where
consumers take initiative to help themselves, humanity in
“non-human” forms is still desired. Be responsive, be real,
and really help. When customers want live help, it's critically
important for agents to be dependable and act fast . Put
your best and brightest in these roles, make it a stop on a
leadership path, and watch how your company culture
improves and grows.
Founder and President of CustomerBliss
Jeanne Bliss
16

Section 2
Support performancebenchmarking
17

Companies have fast turnaround times:34% have a First Response Time of lessthan an hour for email queries
What’s your team’saverage FirstResponse Time foremail support queries?
5For the longest time, customer service departments at companies have
gotten a bad rap for keeping customers waiting, and often, not
responding to them at all.
Our survey indicates that a substantial number of teams are
challenging this perception. For over 60% of respondents, the First
Response Time (FRT) for customer emails is less than 3 hours.
In fact, about 34% of those surveyed have a First Response Time (FRT)
of less than 60 minutes for email queries. 28% of teams have an FRT
between 1-3 hours.
24-48 hours
12-24 hours
6-12 hours
3-6 hours
1-3 hours
Less than 1hour
0 10% 20% 30% 40%
Fir
st R
esp
on
se T
ime
for
emai
l qu
erie
s
Percentage of respondents
4%
6%
10%
13%
28%
34%
18
Founder and Journey Mapper-In-Chief,
Heart of the Customer
Jim Tincher
One of the benefits of email support is that information can
be gathered efficiently, allowing teams to respond more
effectively than is possible through some other channels. As
long as these expectations are clearly set - and met -
customers are often willing to wait a few hours for their
issues to be resolved in a streamlined manner. So while
response time is critical, the quality of the response is even
more important.
19
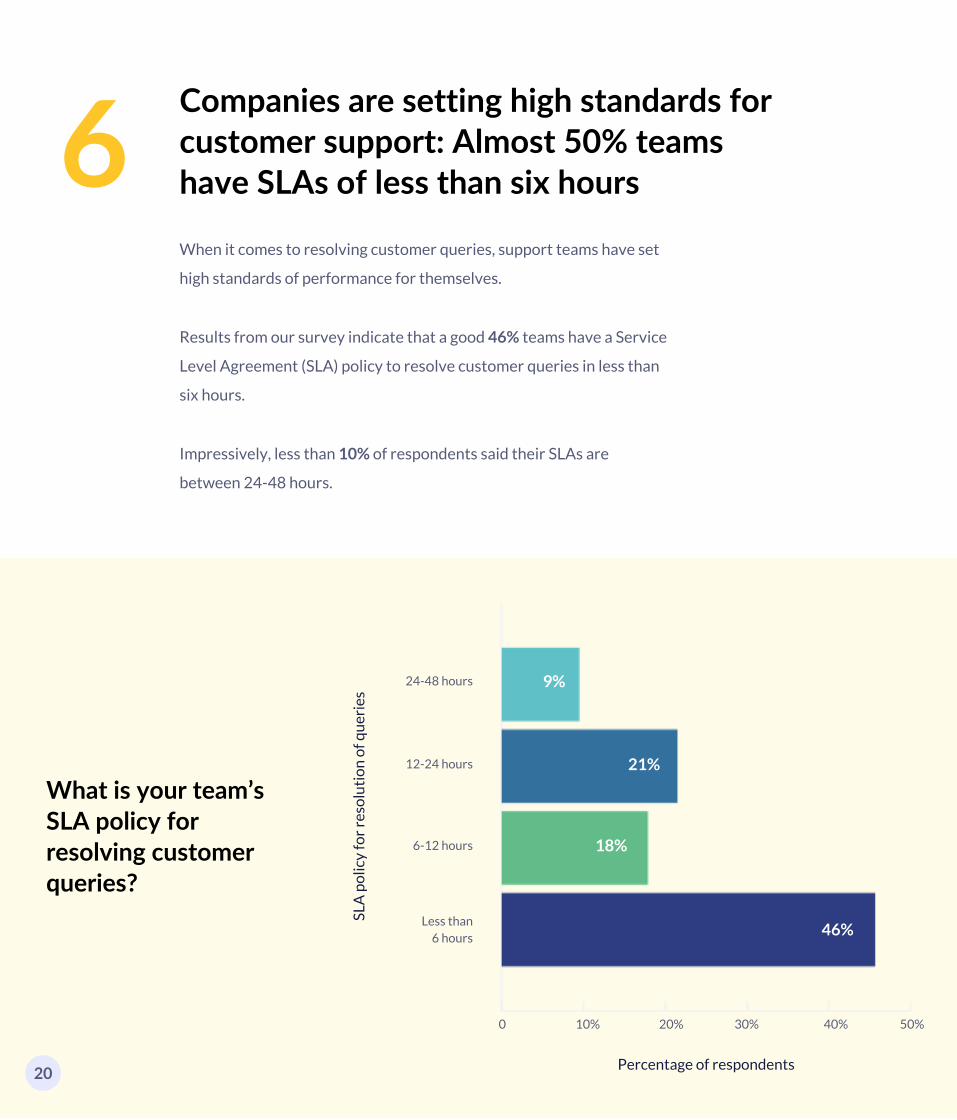
Companies are setting high standards forcustomer support: Almost 50% teamshave SLAs of less than six hours6When it comes to resolving customer queries, support teams have set
high standards of performance for themselves.
Results from our survey indicate that a good 46% teams have a Service
Level Agreement (SLA) policy to resolve customer queries in less than
six hours.
Impressively, less than 10% of respondents said their SLAs are
between 24-48 hours.
What is your team’sSLA policy forresolving customerqueries?
24-48 hours
12-24 hours
6-12 hours
Less than6 hours
0 10% 20% 30% 40% 50%
SLA
po
licy
for
reso
luti
on
of q
uer
ies
Percentage of respondents
9%
21%
18%
46%
20

Small businesses move fast: 40% of smallcompanies have an FRT of less than an hourfor email requests
7
Support teams at big companies have the most advanced help desk
software, streamlined processes and quality talent at their disposal.
However, even though small companies might not have access to
sophisticated resources that larger firms do, they’re at par, if not
better than them, in terms of speed and agility.
Our research reveals that almost 40% of customer service teams at
small companies have a First Response Time of less than 1 hour for
email queries.
About 33% of mid-sized companies have an FRT of less than 1 hour for
email requests.
In contrast, 30% of surveyed enterprise-level support teams have an
FRT of less than 1 hour for email queries.
Only 25% of large-sized companies have an FRT of less than an hour
for email queries.
21

Small companies arethe fastest with theiremail responses
Above 1000
201 - 1000
51 - 200
Less than 50
0 10% 20% 30% 40%
Org
aniz
atio
n s
ize
Percentage of respondents with an
FRT < 1 hour for email
30%
25%
33%
39%
22
Section 3
Support qualitybenchmarking
23
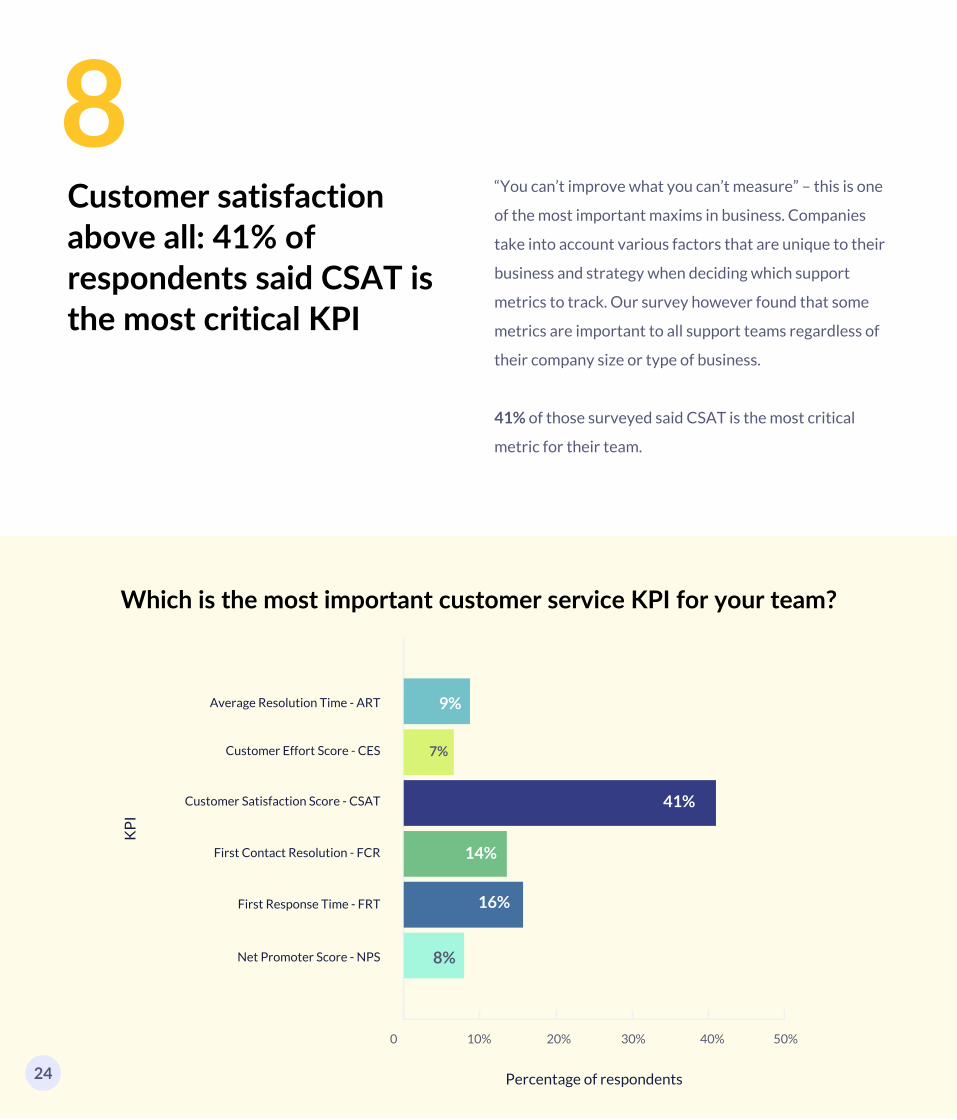
Customer satisfactionabove all: 41% ofrespondents said CSAT isthe most critical KPI
8“You can’t improve what you can’t measure” – this is one
of the most important maxims in business. Companies
take into account various factors that are unique to their
business and strategy when deciding which support
metrics to track. Our survey however found that some
metrics are important to all support teams regardless of
their company size or type of business.
41% of those surveyed said CSAT is the most critical
metric for their team.
Which is the most important customer service KPI for your team?
Average Resolution Time - ART
Customer Effort Score - CES
Customer Satisfaction Score - CSAT
First Contact Resolution - FCR
First Response Time - FRT
Net Promoter Score - NPS
0 10% 20% 30% 40% 50%
KP
I
Percentage of respondents
9%
7%
41%
14%
16%
8%
24
Founder and Chief Customer Success
Officer, Ignite Your Service
Tony Johnson
CSAT is so popular because it’s a solid benchmark metric.
You can set goals, track it, and measure results that are
easily viewed on a dashboard. That said, organizations need
to dig deeper into the why. Data is irrelevant without the
color commentary that brings it to life. Why is CSAT going
up or down? What do customers love and dislike? The
answers to these questions provide context and the ability
to quickly understand customer sentiment.
25
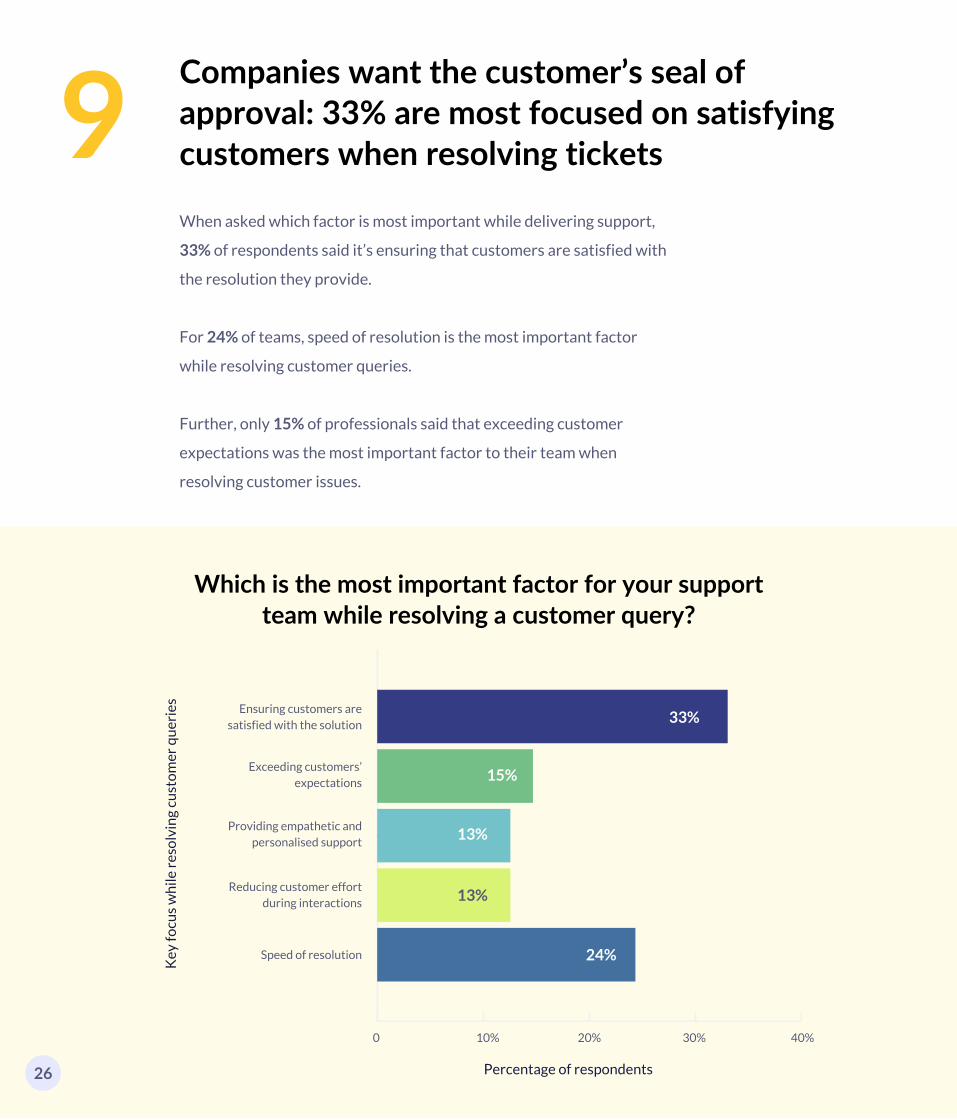
Companies want the customer’s seal ofapproval: 33% are most focused on satisfyingcustomers when resolving tickets 9When asked which factor is most important while delivering support,
33% of respondents said it’s ensuring that customers are satisfied with
the resolution they provide.
For 24% of teams, speed of resolution is the most important factor
while resolving customer queries.
Further, only 15% of professionals said that exceeding customer
expectations was the most important factor to their team when
resolving customer issues.
Which is the most important factor for your supportteam while resolving a customer query?
Ensuring customers aresatisfied with the solution
Exceeding customers’expectations
Providing empathetic andpersonalised support
Reducing customer effortduring interactions
Speed of resolution
0 10% 20% 30% 40%
Key
focu
s w
hile
res
olv
ing
cust
om
er q
uer
ies
Percentage of respondents
33%
15%
13%
13%
24%
26

Teams are trackingcustomer feedbackacross channels: 51%analyze support ticketsto infer customerfeedback
10Quality is not a unidimensional concept. Teams that truly
want to deliver exceptional support design processes that
enable them to consistently deliver high standards of
service. One of the most important factors that go into
maintaining high support standards is a robust customer
feedback loop.
According to the survey, support teams use multiple
channels to collect customer feedback.
And the most important channel is actually the simplest.
Monitoring everyday support tickets and inferring patterns
is the most common way to collect feedback. Over 50% of
customer service teams closely monitor their support
tickets to infer customer feedback.
Close to 40% of those surveyed said they regularly monitor
feedback from customer surveys, making it the second
most popular feedback collection channel.
27

Which all customer feedback channels does yourteam regularly review and track?
Monitoring escalated customer queries
Monitoring all customer queries
Feedback from customer advisory board
Feedback from customer surveys
Customer reviews on 3rd-party sites
0 10% 20% 30% 40% 50% 60%
Cu
sto
mer
feed
bac
k ch
ann
els
Percentage of respondents
25%
51%
21%
38%
15%
28
Customer service has today become one of the most important aspects
responsible for a business’ long-term success.The industry has been
undergoing a gradual transformation for years, but the pace of change
is now accelerating faster than ever. It's clear that brands need to keep
up with the necessities of these tumultuous times and customers’ ever-
growing expectations.
With that in mind, the results from this report are both reassuring and
impressive.
Companies today understand the importance of being available for
customers across multiple channels and time zones. They value what
customers think about their service quality. And even though the
majority of them rely on traditional channels to offer support, the
standards against which they measure their support performance and
quality aren’t archaic. They’re agile and data-driven.
Conclusion
What would now be interesting to see is how, in the near future, these
companies balance the use of modern technology with the human
touch – because in today’s day and age, one without the other, just
won’t cut it anymore.
29
Customer Service and Experience expert
and bestselling author of 'I’ll Be Back'
Shep Hyken
Customers have learned what it is like to experience good
customer support. They no longer compare you to your direct
competition, but to the best support they have had from any
company. The stakes are higher than ever, as evidenced by
the key findings in this report. 41% of teams said their
customer satisfaction (CSAT) score is their most important
KPI. These are the companies and brands that will set the bar
for everyone else. They are the leaders and will competitively
distance themselves from the laggards who will be struggling
to keep up and catch up. So, which group are you in?
30

Key Takeaways
Prioritize Quality Before Speed
Response and resolution time
are important, but not at the cost
of quality. Keep conversations
human, meaningful, and add
value with every interaction.
Choose the Right Tech Stack
Great customer service needs
the right team and technology.
Your help desk should aid better
collaboration, optimize
workflows and forge memorable
customer experiences.
Focus on Customer Delight
CSAT scores can offer great
insights into your support
quality. But don’t stop at
satisfying customers. Go the
extra mile – delight them.
Optimize the Right Channels
Multichannel availability is
crucial, but optimizing the wrong
channels can cost you. You don’t
have to be present everywhere
as long as you meet your
customers where they are.
Track Customer Sentiment
In addition to key KPIs, find out
the ‘why’ to 'how' your team is
performing by tracking customer
sentiment via social listening,
conversation analysis, etc.
31

Sign up for free trial Request a demo
[email protected] +1(213) 325-3297
About HiverHiver is a Gmail-based customer service solution that helps teams across the organization
collaborate on shared inboxes like services@, orders@, and support@. It’s the most frictionless,
natural way for teams to handle customer email communication as it works right inside Gmail.
Hiver helps over 1500 companies including the likes of Oxford Business Group, Harvard
University and Lonely Planet deliver memorable customer experiences.
32
Related Documents