HIV SERO-BEHAVIOURAL STUDY IN SIX UNIVERSITIES IN TANZANIA November, 2010

Welcome message from author
This document is posted to help you gain knowledge. Please leave a comment to let me know what you think about it! Share it to your friends and learn new things together.
Transcript
HIV SERO-BEHAVIOURAL STUDY IN SIX UNIVERSITIES IN TANZANIA
November, 2010
2
This document is the property of the East African Community Recommended Citation: EAC/EALP (2010): HIV Sero-Behavioural Study in Six Universities in Tanzania, Study Report, November 2010 Study Team* Dr. Abu Mvungi (Principal Investigator), Dr. Datius Rweyemamu, Professor Beatus Kundi, Dr. Sylvia Temu and Dr. Musiba Mbilima Tanzania National Technical Team Members
Dr. Subilaga Kasesela Kaganda- Tanzania Commission for AIDS Dr. Geoffrey Somi- Ministry of Health and Social Welfare Dr. Zebedayo Sekirasa- Ministry of Health and Social Welfare Prof. Eliuther Mwageni- Ministry of Education (Ardhi University) Mr. John Changalucha- National Institute for Medical Research (Mwanza) Mr. Achilles Ndyalusya- Ministry of Gender, Women and Children Ms. Dorah Neema- Ministry of East African Cooperation Mr. Renatus Kihongo- Tanzania Commission for AIDS Participating Universities
University of Dar es Salaam (UDSM), Sokoine University of Agriculture (SUA) Mzumbe University St. Augustine University of Tanzania (SAUT) Tumaini University (Iringa Campus) Muhimbili University of Health and Allied Sciences (MUHAS) EALP Programme Partners
EAC Secretariat Lake Victoria Basin Commission (LVBC) Interuniversity Council for East Africa (IUCEA) Lake Victoria Fisheries Organization African Medical and Research Foundation (AMREF Funding Partner Swedish International Development Agency (Sida)
* University of Dar-es-Salaam, University Consultancy Bureau (UCB)
3
TABLE OF CONTENTS LIST OF TABLES .................................................................................................... 5 LIST OF FIGURES.................................................................................................. 7 ACRONYMS.............................................................................................................. 8 Map of HIV prevalence in Tanzania.......................Error! Bookmark not defined. ACKNOWLEDGMENT........................................................................................10 EXECUTIVE SUMMARY....................................................................................11
CHAPTER 1 INTRODUCTION ................................................................. 21 1.1 Background...................................................................................................... 21 1.2 Study Rationale................................................................................................24 1.3 Objectives ........................................................................................................ 25 1.4 Organization of the report ...............................................................................25
CHAPTER 2 STUDY DESIGN AND METHODOLOGY......................26 2.1 Overview.......................................................................................................... 26 2.2 Study Sites ....................................................................................................... 26 2.3 Sampling Procedure and Sample Size............................................................26 2.4 Sensitization and Mobilization ....................................................................... 29 2.5 Core Indicators ................................................................................................30 2.6 Data collection ................................................................................................. 31
2.6.1 Behavioral data......................................................................................... 31 2.6.2 Blood collection and Storage ................................................................... 32
2.7 Data Management and Analysis ..................................................................... 32 2.7.1 Data Processing........................................................................................ 32 2.7.2 Data Analysis ............................................................................................ 33
2.8 Recruitment and Training of study team........................................................34 2.9 Response Rate.................................................................................................. 34
CHAPTER 3 CHARACTERISTICS OF RESPONDENTS....................36 3.1 Overview.......................................................................................................... 36 3.2 Background Characteristics of Respondents .................................................36 3.3 Year of study by background characteristics.................................................39 3.4 Sponsorship Status of Respondents................................................................40 3.5 Accommodations of respondents ................................................................... 41 3.6 Program Mode of Respondents ...................................................................... 43
CHAPTER 4 HIV AND AIDS-RELATED KNOWLEDGE AND ATTITUDES...................................................................................45
4.1 Overview.......................................................................................................... 45 4.2 HIV and AIDS related Knowledge ................................................................45
4.2.1 Rejection of Misconceptions about HIV and AIDS ............................... 52 4.2.2 Comprehensive knowledge about HIV and AIDS.................................. 52 3.2.3 Sources of HIV&AIDS Information........................................................ 60
4.3 Attitudes relating to HIV and AIDS...............................................................64 4.3.1 Attitudes relating to Use of Condoms ..................................................... 64 4.3.2 Successful Refusal to have Sex without Condoms................................. 64

4
CHAPTER 5 HIV AND AIDS-RELATED BEHAVIOUR......................68 5.1 Overview.......................................................................................................... 68 5.2 Age at First Sexual Intercourse ...................................................................... 68 5.3 Condom Use at First Sex ................................................................................71 5.4 Recent Sexual Activity....................................................................................79 5.5 Multiple Sexual Partners and Higher Risk Sex ............................................. 88 5.6 Transactional Sex ............................................................................................97 5.7 Voluntary HIV Counselling and Testing .......................................................99 5.8 Prevalence of Sexually Transmitted Infections...........................................103 5.9 Violence and Threats in Sexual Relations ...................................................106 5.10 Condom Use ................................................................................................109 5.11 Prevalence of Drug and Alcohol Consumption.........................................112 5.12. Mobility and HIV-Related Behaviour.......................................................113
5.12.1 Mobility by background Characteristics ............................................. 113 5.12.2 Mobility and HIV Related Behaviors.................................................. 115 5.12.3 Reasons for condom use during sexual intercourse while on transit and
at destination points.............................................................................. 117 5.12.4 Correspondence with sexual partners made at transit and destination
points ..................................................................................................... 117
CHAPTER 6 HIV PREVALENCE ...........................................................120 6.1 Overview........................................................................................................120 6.2 Coverage of HIV Testing..............................................................................120 6.3 Problems and challenges of HIV Testing ....................................................131 6.4 HIV Prevalence by Age and Sex..................................................................134 6.5 HIV Prevalence by Socio-economic Characteristics ..................................135 6.6 HIV Prevalence by Demographic Characteristics.......................................137 6.7 HIV Prevalence by Sexual Behaviour..........................................................139 6.8 HIV Prevalence by Other Characteristics ....................................................140
CHAPTER 7 POLICIES, REGULATIONS AND PROGRAMS AT
UNIVERSITIES .....................................................................................142 7.1Overview.........................................................................................................142 7.2HIV and AIDS Policies and Programs..........................................................142 7.3 Knowledge of Availability of HIV-Related Services within universities .144 7.4 Knowledge on female and male condoms ...................................................151 7.5 Perceived Affordability of HIV-Related Services within universities.......154 7.6 Perceived quality of HIV related services at the University.......................160
CHAPTER 8 CONCLUSION AND RECOMMENDATIONS ....................166
8.1 Conclusion .....................................................................................................166 8.2 Recommendations .........................................................................................169 8.3 Way Forward .................................................................................................170
REFERENCES......................................................................................................171 APPENDIX A Questionnaire ..............................................................................173 APPENDIX B Qualitative Tools .........................................................................190
5
LIST OF TABLES CHAPTER TWO Table 2.1 Response rate for behavioral and sero-survey per university.......................35 CHAPTER THREE Table 3.1 Distribution of Respondents by Background Characteristics.......................37 Table 3.2 Distribution of respondents by year of study by gender...............................39 Table 3.3 Respondent’s characteristics by sponsorship status by sex..........................41 Table 3.4 Respondents’ characteristics by accommodation status by sex ...................42 Table 3.5 Respondents’ characteristics by program mode by sex................................43 CHAPTER FOUR Table 4.1 Knowledge of HIV prevention methods: Male and female students...........46 Table 4.2 Percent Distribution of Awareness of means of preventing university
members from HIV and AIDS infection by gender......................................49 Table 4.3 Attitude Towards ones and University’s ability to prevent AIDS infections
by gender .........................................................................................................51 Table 4.4 Comprehensive knowledge about AIDS transmission: Male students........53 Table 4.5 Comprehensive knowledge about AIDS transmission: Female students ....55 Table 4.6 Mean Index of comprehensive knowledge by background variables..........56 Table 4.7 Mean comparison within age group:..............................................................56 Table 4.8 Mean comparison within marital status:........................................................57 Table 4.9 Mean comparison within type of accommodation........................................57 Table 4.10 Mean comparison within year of study .........................................................59 Table 4.11 Mean comparison within type of sponsorship...............................................59 Table 4.12 Mean comparison within program mode.......................................................59 Table 4.13 Mean comparison within average expenditure per semester........................60 Table 4.14 Sources of Information about HIV and AIDS: Male students .....................62 Table 4.15 Sources of Information about HIV and AIDS: Female students..................63 Table 4.16 Attitudes Relating to HIV and AIDS Male and Female students ................66 CHAPTER FIVE Table 5.1 Age at First sexual intercourse .......................................................................69 Table 5.2 Consensual sex at first sexual intercourse .....................................................70 Table 5.3 Condom use at first sexual intercourse..........................................................73 Table 5.4 Age at First Sexual Intercourse ......................................................................74 Table 5.5 Age at First Sexual Intercourse: who suggested use of condom..................76 Table 5.6 Age at First Sexual Intercourse: Suggestion of non-use of condom............78 Table 5.7 Recent sexual activity: Male and Female students .......................................80 Table 5.8 Regular Partners and the use of condom .......................................................83 Table 5.9 Recent Sexual Intercourse with regular partner: Suggestion of condom use 85 Table 5.10 Multiple sexual partners and higher-risk sexual intercourse in the past 12
months: Male students ....................................................................................89 Table 5.11 Multiple sexual partners and higher-risk sexual intercourse in the past 12
months: Female students ................................................................................90 Table 5.12 Higher risk sex: Frequency of the use of condom ........................................94 Table 5.13 Higher risk sex and use of condom................................................................95 Table 5.14 Transactional Sex and the use of condom .....................................................98 Table 5.15 Voluntary HIV Counseling and Testing: Male and Female students ........100 Table 5.16 Reasons for deciding to test for HIV ...........................................................102
6
Table 5.17 Sexual Transmitted Infections: Male and Female students........................104 Table 5.18 Awareness of Where Treatment for STDs can be obtained .......................105 Table 5.19 Violence and Threats in Sexual Relations: Males ......................................107 Table 5.20 Violence and Threats in Sexual Relations: females....................................108 Table 5.21 Use of Condoms: Male students ..................................................................110 Table 5.22 Use of Condoms: Female students...............................................................111 Table 5.23 Mobility of Respondents ..............................................................................114 Table 5.24 Condom use during sexual intercourse while on transit/destination points 116 Table: 5.25 Main reasons for using condom ...................................................................117 Table 5.26 Correspondence with the people you had sex with while on transit and at
destination......................................................................................................118 CHAPTER SIX Table 6.1 Coverage of HIV Testing and HIV Prevalence by University...................122 Table 6.2 Percent distribution of Response Rate for HIV testing: UDSM ................123 Table 6.3 Percent distribution of Response Rate for HIV testing: MZUMBE..........125 Table 6.4 Percent distribution of Response Rate for HIV testing: SUA....................126 Table 6.5 Percent distribution of Response Rate for HIV testing: MUHAS .............127 Table 6.6 Percent distribution of Response Rate for HIV testing: TUMAINI ..........128 Table 6.7 Percent distribution of Response Rate for HIV testing: SAUT .................130 CHAPTER SEVEN Table 7.1 Availability of HIV and AIDS-Related services at universities ................143 Table 7.2 Distribution of respondents by awareness of HIV related programs in
selected Universities .....................................................................................146 Table: 7.3 Distribution of female students buy availability of HI/AIDS services
according to background characteristics......................................................148 Table 7.4 Distribution of male respondents by availability of HI/AIDS services
according to background characteristics......................................................150 Table 7.5 Knowledge on where female and male condoms can be obtained by
background characteristics ...........................................................................152 Table 7.6 Knowledge on male and female condoms...................................................156 Table 7.7 Affordability of HI/AIDS services according to background characteristics 158 Table 7.8 Female students’ perception on the quality of HIV AIDS related services 161 Table 7.9 Male students’ perception on the quality of HIV AIDS related services ..163
7
LIST OF FIGURES CHAPTER FOUR Figure 4.1 Awareness of HIV and AIDS prevention methods by sex...........................47 Figure 4.2 Awareness on use of condom and limiting sex to one uninfected sexual
partner ..............................................................................................................48 Figure 4.3 Sources of HIV and AIDS information within universities .........................61 Figure 4.4 Respondents who successfully refused to have sex without using condom
by number of sexual partners in last 12 months............................................67 CHAPTER FIVE Figure: 5.1 Use of condom at first sexual intercourse by reasons for condom use........72 Figure 5.2 Sexual Intercourse within the last four weeks by age group.......................81 Figure 5.3 Reasons for not using condom with partners: male students .......................87 Figure 5.4 Reasons for not using condom with partners: Female students ...................87 Figure 5.5 Percentage of respondents with two or more sexual partners by Age group
and by gender ..................................................................................................91 Figure: 5.6 Percentage of respondents who had two or more sexual partners by
University and by gender................................................................................91 Figure 5.7 Percentage of respondents who used condom at last higher-risk intercourse
in the past 12 months by University and gender ...........................................92 Figure 5.8 Percentage of respondents who used condom at last higher-risk intercourse
in the 12 months by year of study and gender..............................................92 Figure 5.9 Prior HIV Testing by University..................................................................101 Figure 5.10 Knowledge of STDs symptoms of STI in women ......................................106 Figure 5.11 Percentage of respondents who had ever tested drugs by gender ..............112 Figure 5.12 Percentage of respondents who had ever taken alcohol in the last 4 weeks
by gender .......................................................................................................113 CHAPTER SIX Figure 6.1 HIV prevalence by universities ....................................................................134 Figure 6.2 HIV Prevalence by age group ......................................................................135 Figure 6.3 HIV Prevalence by Amount of money spent per semester.........................135 Figure 6.4 HIV Prevalence by type of sponsorship ......................................................136 Figure 6.5 HIV Prevalence by Marital Status ...............................................................137 Figure 6.6 HIV Prevalence by type of accommodation................................................138 Figure 6.7 HIV Prevalence by year of study .................................................................138 Figure 6.8 HIV Prevalence by Name of the University................................................139 Figure 6.9 HIV Prevalence by sexual relationship status .............................................140 CHAPTER SEVEN Figure 7.1 Percentage of men and women who had ever heard of female condom by
year of study ..................................................................................................153 Figure 7.2 Overall percent of men and women who have heard about Female condom 154 Figure 7.3 Knowledge on where female condoms can be obtained.............................154

8
ACRONYMS AIDS Acquired Immune Deficiency Syndrome
AMREF African Medical Research Foundation
ARV Anti-Retrovirals
CSO Civil Society Organization
DBS Dried Blood Spot
DVC Deputy Vice Chancellor
DVC-ARC Deputy Vice Chancellor-Academic, Research and Consultancy
DVC-FPA Deputy Vice Chancellor-Finance, Planning and Administration
EALP East African Lake Victoria Partnership
FGD Focus Group Discussion
HIV Human Immunodeficiency Virus
IDI In-Depth Interview
IEC Information Education Communication
IUCEA Inter-University Council for East Africa
MUHAS Muhimbili University of Health and Allied Sciences
NGO Non-Governmental Organization
NQL National Quality Assurance Laboratory
PLHA People Living with HIV and AIDS
SAUT Saint Augustine University of Tanzania
SPSS Statistical Package for Social Sciences
SUA Sokoine University of Agriculture
TACAIDS Tanzania Commission for AIDS
THIS Tanzania HIV Indicator Survey
THMIS Tanzania HIV and Malaria Indicator Survey
UDSM University of Dar es Salaam
VC Vice Chancellor
VCT Voluntary Counselling and Testing
9
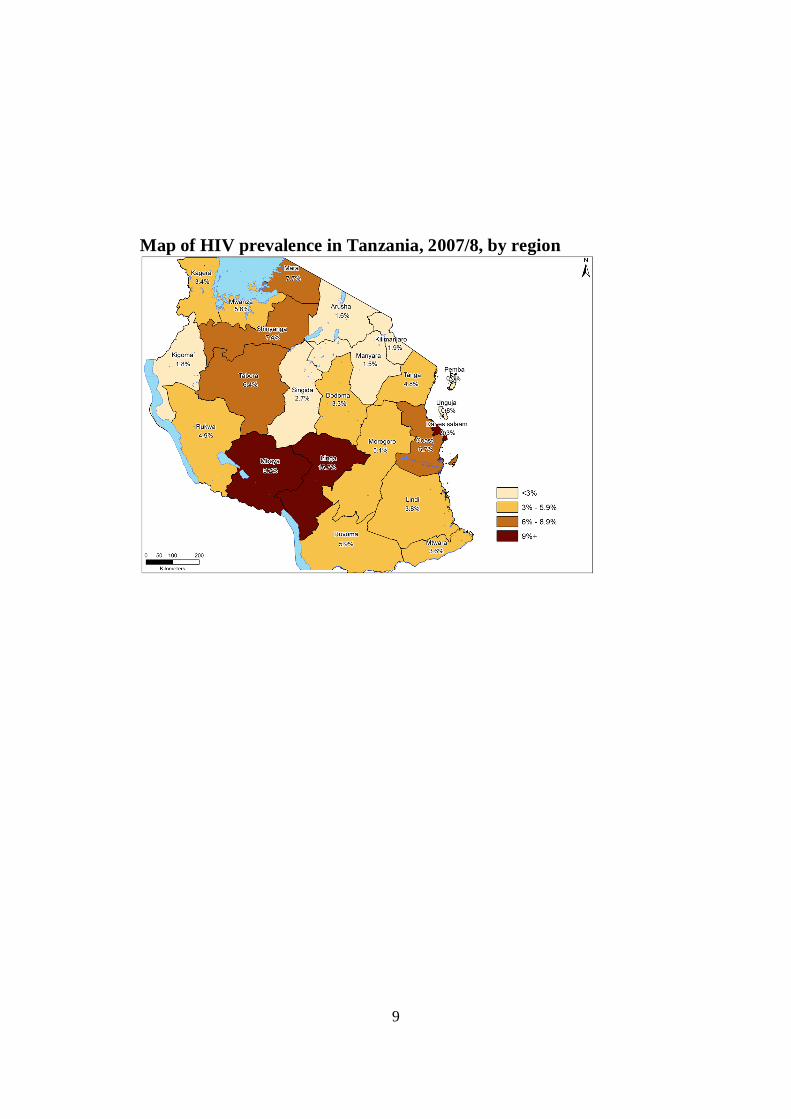
Map of HIV prevalence in Tanzania, 2007/8, by region

10
ACKNOWLEDGMENT This Baseline Study on “HIV and AIDS in Higher Education Institutions of East Africa; the Case of Tanzania Universities” was made possible through the collaboration, cooperation, and support of many individuals and organizations. We would like to acknowledge these efforts with gratitude. First of all, our thanks go to the Vice Chancellors of the universities that participated in this study. We would also appreciate efforts made by the Lake Victoria Basin Commission (LVBC), Interuniversity Council for East Africa (IUCEA), African Medical and Research Foundation (AMREF) and other partners in mobilizing resources for implementation of the study. Special thanks are extended to the Ministry of Health and Social Welfare and the Tanzania Commission for AIDS (TACAIDS), for providing staff who worked closely with the consultants. We wish to extend our thanks to the study team (Dr. Abu Mvungi, Dr. Datius Rweyemamu, Professor Beatus Kundi, Dr. Sylvia Temu and Dr. Musiba Mbilima) for diligently and tirelessly carrying out this assignment. We also thank the National Technical Team (NTT) for the technical and advisory assistance during this work. Special thanks should go to Dr. Geofrey Somi, Dr. Zebedayo Sekirasa and Dr. Subilaga Kasesela Kaganda who have tirelessly worked hand in hand with consultants right from the inception of this study to the final stage of producing the report. We feel indebted to Professor Eliuther Mwageni, who joined the NTT at a later stage for his constructive comments and review of this report. We would also like to extend our sincere gratitude to the focal persons at universities for their readiness, commitment and encouragement in undertaking this study. Specifically, we would like to extend our openhanded thanks to the following: Ms. Bwathondi, University of Dar es Salaam (UDSM), Dr. Kapilima, Sokoine University of Agricultutre (SUA), Dr. Bunini Manyilizu, Mzumbe University, Mr. Kaijanangoma, Saint Augustine University of Tanzania (SAUT), Reverend Oluochi, Tumaini University and Prof. Lekule, Muhimbili University of Health and Allied Sciences (MUHAS). Without their support, it would be difficult to enter the universities and implement the study. Appreciation is also extended to the local government leaders around universities for their heartfelt collaboration in this study. Finally, we would like to give special thanks to the health staff (nurses) for their facilitation and participation in sero-survey and field data collectors for behavioural survey. Our sincere gratitude is extended to the university student bodies and student leaders for their active involvement in the study both as student mobilizers and organizers of student groups for discussions and interviews. We also appreciate willingness of students and staff who participated in this study as our respondents. Without sincere commitment and diligence of data collectors, this study could not have come up with quality data for producing this report. Our special thanks should go to the research assistants who were recruited from the participating universities. Finally, we would like to extend our special thanks to the laboratory specialists in particular, Professor M. Matee from the Department of Microbiology and Immunology at Muhimbili University of Health and Allied Sciences (MUHAS) and Mr. Sufi from the National Quality Assurance Laboratory (NQAL), Ministry of Health and Social Welfare.

11
EXECUTIVE SUMMARY Introduction While Tanzania is taking measures to curb the HIV and AIDS pandemic- including limiting its transmission and minimizing its impact, addressing such transmission among mobile populations† such as students and staff of Higher Learning Institutions remains a challenge. Available information shows that a number of daunting challenges face Universities in Tanzania in designing and implementing effective responses to HIV and AIDS. First is the fact that little is known about the vulnerability, prevalence, impact and situation of HIV and AIDS in most of these institutions. Second is the tendency of some senior members of staff to think of HIV and AIDS as issues that only concern the junior staff and students. The third challenge is that HIV and AIDS is not given high priority in terms of resources allocation (financial, human, time and space) and this constrains on the implementation of planned, coordinated, integrated and comprehensive institutional HIV and AIDS programs. Objectives The baseline study aimed to generate data/information on the status and responses of HIV and AIDS amongst the selected Higher Education Institutions in Tanzania. Specifically, this study sought:
1. to determine HIV prevalence among students of Higher Learning Institutions
2. To identify risk factors associated with HIV infections among university population and neighboring communities
3. To assess the current and planned programs of the HIV and AIDS responses for selected institutions of Higher Learning in Tanzania
4. To assess the availability and utilization of HIV and AIDS related services for staff and students of IHL in Tanzania
Methodology A non-experimental and cross-sectional study design was adopted for this study. The study had two main components: behavioral study (in which both qualitative and quantitative data on HIV risk factors were gathered) and sero-survey (based on which HIV prevalence among university students was established). The study involved a total of six universities which are categorized by geographical distribution and type of ownership (public, private and/or faith based). The universities are the Mwanza-based Saint Augustine University of Tanzania and the Iringa-,based Tumaini University College, both of which are Faith Based; and Mzumbe University, Sokoine University of Agriculture ( both in Morogoro), the Muhimbili University of Health and Allied Sciences and the University of Dar es Salaam all of which are public owned. Participation in the study was voluntary and respondents were requested to grant informed consent for their participation.

12
Various data collection methods were applied including social survey, in-depth interviews, focus group discussions (FGD) and observation (for generating data on HIV risk factors) as well as sero-prevalence survey (for HIV prevalence data). A questionnaire was self-administered to a total sample of 2,426 students. In addition, 90 in-depth interviews and 8 focus group discussions were conducted. The study team obtained both ethical and research clearance from relevant authorities in April, 2009 and commenced training of field staff in May 2009 followed by fieldwork. Anonymity of study participants was maintained both at sampling stage as well as at data collection stage by avoiding seeking information on respondents’ names and by assigning unique random identification numbers to the dried blood spots samples. Summary of findings Characteristics of respondents University students who participated in this study came from a combination of various demographic and socio-economic characteristics. These include age, gender, accommodation, year of study, average expenditure per semester (in Tshs), program mode (full time/part time), sponsorship (private or government), year of study and marital status. These characteristics were then correlated with other issues investigated in this survey namely knowledge on HIV and AIDS, awareness o HIV related interventions, attitude and behaviour related to HIV and AIDS, HIV prevalence and testing and mobility behaviours. Overall, a sample comprised of a slightly larger proportion of the males than females (57% male students and 43% female students). Three quarters of the respondents were between age group 20-24 and 25-29 (78% male students and 73% female students). The proportion of each age group declines as the age increases, a reflection of young age structure of the university student population. For all the years of study, majority of male and female students were single. Eight in ten female students and eight in ten male students are currently single. Also, 19% and 15% of male and female students respectively are currently married, 3.4% and 4.6 of men and women respectively are cohabiting. For both male and female respondents, the percentages for divorced, separated and widowed are insignificantly low. Majority of students were in full time program. For both male and female students, 9 out of ten are in full time program. Majority of the respondents were government-sponsored. Private sponsorship is relatively low, accounting for 17.3% and 19.3% of male students and females students respectively. Three quarters of both male and female students live either on campus or at university hostel outside the main campuses. However, a substantial proportion of students (22% male students and 15% female students) are living in private apartments.
13
HIV and AIDS related knowledge and Attitudes Awareness of AIDS-related interventions within universities was assessed by both qualitative and quantitative instruments. The survey results show that about 80 percent of male and female university students are aware of HIV and AIDS-related interventions in universities. However, there were minor variations within socio-demographic characteristics. These differences were statistically significant for age group, year of study and amount of money a student spends per semester. The differences were not statistically significant for marital status, program mode and type of sponsorship. Overall, 70 percent or higher of respondents believe that using condom can reduce the chances of getting HIV. Also, over 70 percent of both males and females believe that having one faithful and uninfected sexual partner can protect one from getting HIV. However, knowledge on dual methods of HIV and AIDS prevention is generally low. It is only less than half of respondents (47 percent of men and 44 percent of women) who believe that using condom together with limiting sexual intercourse to one uninfected partner can reduce the chances of being infected with the AIDS virus. This belief is almost uniformly distributed across all socio-demographic characteristics studied. Knowledge of combining use of condom and limiting sexual intercourse to one uninfected sexual partner seem to vary among men and women and among years of study knowledge seem to increase by year of study for both men and women. Data collected by using qualitative methods show that universities vary in the way they sensitize their community members to protect themselves from HIV infection. While some public universities distribute several brands of condoms in the halls of residence, cafeteria and public toilets and others being sold in the bookshops and other shops within and around the campus, other Faith based universities prohibit promotion, sale and use of condom in the university premises. Comparatively, a slightly higher proportion of female students than male students reject misconceptions about HIV and AIDS. About half of the students (46 percent) know that an HIV-infected person does not necessarily show signs of infection. Assessment of students’ comprehensive knowledge about HIV transmission and prevention was measured by developing a knowledge composite index which had five items. Comprehensive knowledge means knowing that consistent use of condoms during sexual intercourse and having just one uninfected faithful partner can reduce the chances of getting the AIDS virus, knowing that a healthy looking person can have the AIDS virus, and rejecting the two most local misconceptions about AIDS transmission or prevention. Comprehensive knowledge about HIV and AIDS is relatively low (21.4 percent for male students and 20.3 percent for female students). The differences are significant for both men and women. The results also show that there is a significant difference in comprehensive knowledge about HIV and AIDS within

14
universities. The data show that male students aged 40-44 years and female students aged 40-44 years seem to be more knowledgeable than male and female students in other age groups. Comparatively, male students who are single and female students who are divorced seem to be more knowledgeable than the rest of the students by their marital status. Also, male students living outside the campus and female students living with guardians are more knowledgeable than other students. A statistical test for mean comparison in the year of study by their comprehensive knowledge about HIV and AIDS shows that among male students, first year students are less knowledgeable than any other year of study. Among female students, those in second year of study are less knowledgeable compared to female students of the other years of study. These differences by year of study are statistically significant for male students but not for female students. The results show that both male and female students who are privately sponsored are more knowledgeable than students who are sponsored by government. Comparatively, both male students and female students who are studying on part time basis are more knowledgeable than male students and female students on full time basis, partly implying that universities do not have effective HIV and AIDS education programs. Data from in-depth interviews and focus group discussions show that most of the universities lack IEC materials that can be used to educate its members about HIV and AIDS. Physical visits to the health facilities, university notice boards and other places such as university shops, supermarkets and cafeteria showed serious shortage of HIV and AIDS related materials. Qualitative data also show that universities do not organize HIV and AIDS-related campaigns. Instead, various organizations from outside the universities organize concerts, conferences and workshop at universities while the universities in turn offer venues for such activities. For some universities, university administration was reported to be actively engaged in participating in such events as guest speakers or presenting papers about HIV and AIDS status in their universities. Attitudes of university students towards HIV and AIDS are positive. The results indicate that about nine in ten women and men believe that females can insist on the use of condoms before having sex with a partner other than her husband. Over 80% of both the male and female believe that there are circumstances where man can insist on condom use before sex with a woman other than her wife. Of those who have had penetrative sex, about 78% of males and 57% of females were able to successfully refuse sex without condoms. HIV and AIDS-related behavior The emerging pattern of HIV and AIDS related behavior in the selected universities is that the situation is still challenging and more efforts are needed to address HIV and AIDS in universities. Generally, university students are sexually
15
very active. The data shows that more than 50% of the students have had penetrative sex and they start this activity while they were quite young. Also, consensual sex at first sexual intercourse was quite high. With respect to recent sexual activity, considering the analyzed age groups, the proportion of males whom had sex within one month ranged from 22.2% to 66.7% for males. It ranged from 33.3 to 50.0% for females. All these suggest that both males and females are active sexually. The use of condom is encouragingly high although there is need for improvement. For example, the percentage of those using condoms with regular sexual partners in the past 6 months was over 70% for age group 20 – 49. For females, it was higher than 65% for age group 20 – 49. On the use of condom with non-regular partners for cases involving multiple sexual partners in the past six months, for males, the proportion of those using condoms is about 80%; for females, the proportion is about 70%. With respect to transactional sex, 72 % of male respondents and 30% of female respondents indicated condom use during sexual intercourse every time one assisted someone in exchange for sex. Voluntary counseling and testing amongst university students is high. 59% of the male and 70% female respondents indicated they had already been tested for HIV. Unfortunately, there is significant prevalence of STIs amongst university students. For example about 6% of males and 10% of females reported to have had genital discharge during the “past 12 months”. Majority of these were treated but places for treatment ranged from university health facilities, pharmacies to traditional healers. A small proportion said they remained untreated. Violence and threats in sexual relations is an important issue warranting attention in universities. About 48% of males and 50% of females believe that some males/females use violence or threats as means of having sex. Unlike the popular belief, forced sex between university instructors and their students is very low. Only 1% of men and 3.7% of women have been forced to have sex with an instructor against ones wish. Mobility behavior among university students is relatively high. Overall, 68% of male students and 66% of female students who were interviewed had been away from their usual residence for more than a month in the past twelve months prior the survey. Among those who traveled, a slightly larger proportion of male students than female students had transit points during their travel (48% of male students and 40% of female students). Having sexual intercourse while on transit is less common among university students (8% males and 4% females). However, the proportion of students who had sexual intercourse at the destination is larger than those who had sex at transit

16
points. Also, more males than females had sex at destination. The proportion of males is twice of the female students (17% males and 8% females). Condom use while on transit or at destination is relatively high. More than three quarters of male and female students who had sex on transit had used condom (74% males and 80% females). Also majority of students who had sex at destination had used condom. However, a slightly larger proportion of males than females used condom at destination (79% males and 72% females). Among those who traveled, 21% of male students and 10% of female students had non-regular partners. Also, 5% of male students and 2% of female students had commercial sex partners. HIV prevalence A total of 2426 students (1006 female students, 1348 male students and 72 students who did not indicate their sex on the questionnaire) were eligible for HIV testing. Overall, the proportion of eligible students who provided a blood sample for HIV testing was 51.4 percent. Variations in coverage of HIV testing were noted among universities and among male students and female students. The results show that the response rate was slightly higher among female students than among male students (52.9 percent for female students and 50.4 percent for male students). Coverage of HIV testing by university ranges from 30.4 percent at Mzumbe University to 96.5 percent at Sokoine University of Agriculture (SUA). Rates are lower for male students than for female students in all universities, mainly because of the higher proportion of men who are recruited in universities. Coverage of HIV testing by age group shows a U-shaped pattern (highest among those aged 19 years or younger and 40-49). The same pattern is observed by year of study in which first year students and fourth year students had higher response rate than the rest of the students. There is no clear pattern by marital status, type of accommodation and amount of money spent per semester. Qualitative data have shown that university students like any other population group in Tanzania weigh many factors before deciding to get tested. They consult their friends, their partners and their parents or guardians. The results have shown that the reasons and circumstances that make university students agree to get tested for HIV fall into two distinct groups: those who get tested because of experiencing poor health condition and those who get tested because of other reasons. For those who get tested because of health condition, they do so in order to seek explanations for their chronic illness and hoping that if found HIV positive, they could get antiretroviral drugs to prolong their lives. Those who get tested for other reasons do so because of chronic illness of a sexual partner, concern of infidelity of a sexual partner, death of sexual partner or spouse, desire
17
for transition from condom use to non-condom use among sexual partners and belief that one is unlikely to be exposed to HIV. Overall, HIV prevalence in universities is 0.56% ranging from 0 to 2.03%. HIV prevalence is relatively higher among female students than male students and is evenly distributed among age groups except for age group 30-34 years. None of the respondents aged 45 or above years was HIV positive. The findings show that HIV prevalence is relatively higher among those who spend relatively less amount of money per semester (up to Tshs. 500,000) than those who spend larger amount of money. This is true for both male and female respondents. No major difference in prevalence of HIV was noted among students who are sponsored by government and those who are privately sponsored, though the difference is noted among male students and female students who are privately sponsored with the latter having higher prevalence. Overall, male students and female students who are living outside university campus (either renting private apartment or residing at university hostel outside university campus) have relatively higher prevalence of HIV than students who are either living with guardian/parent or living at the university campus. Still, more female students in first and second year are more likely to be HIV positive than male students in the same years of study. Analysis of HIV prevalence by sexual behavior shows that all seven respondents who were HIV positive had ever had sex. Two of them were in sexual relationship with a boyfriend/girlfriend, two had sex with a husband/wife, two had sex with other persons apart from main partners and one did not state the relationship with a partner. All respondents had had sex in the last twelve months prior the survey. Also, all respondents had had sexual intercourse with only one partner in the last twelve months prior the survey. Only three out of seven respondents had regular partner in the last twelve months. Two respondents had non-regular sexual partners. Also, two respondents (one male student and one female student) had a commercial sexual partner in the last twelve moths prior the survey. There was a negative association between being HIV positive and use of condom. Among those who were in sexual relationship, none of them had used condom with their sexual partners at last sexual intercourse indicating that the chances of infecting their partners or being infected by their partners at last sexual intercourse were high. Results also show that there is a pattern between HIV prevalence and prior HIV testing. Among students who were HIV positive, six out of seven had been tested for HIV before the survey and had received test results compared to only one student who had never been tested. This prompts the conclusion that readiness to testing could have been induced by the urge to confirm ones status? Policies, regulations and programs at universities
18
Existence of HIV policy at university is very important for guiding HIV and AIDS intervention. The finding show that only two out of six universities had HIV policies (i.e. MUHAS and UDSM) and have been operative for more than three years. One university (Mzumbe) had its policy just been approved while another university (SUA) was still in the process of formulating one. The remaining universities had not yet initiated the process. It was also found that, as per the government directive, all public universities had Technical Sub AIDS Committees charged with initiating and coordinating HIV and AIDS interventions and related activities. The two faith-based universities (Tumaini and SAUT) did not have the Committees but had key focal persons charged with HIV related activities. Voluntary Counseling and testing services were available at all the universities except at two universities (SAUT and Tumaini). At Tumaini, the equipment for HIV testing had just been procured but it was yet to be installed. However, university students perceive university VCT services as poor. They mistrust VCT counselors at their universities and rarely seek VCT services from their own universities. Lack of confidentiality and stigma were reported as some of the reasons for avoiding university VCT services. In all the universities HIV and AIDS clubs exist and there were awareness campaigns and concerts that were being conducted. However, to a large extent, these activities are externally initiated, that is, it is very rare for universities to organize their own HIV related concerts. To a large extent, these activities are initiated and supported by different organizations fro outside the universities including USAID, PSI, SPW, Engender Health, Tunajali, ROOTS AND SHOOTS, NORAD, TACAIDS, AMREF, etc. Discussions indicated that the Technical Sub Aids Committees sometimes stay dormant for longer periods when there were no funds which normally came from outside the universities. In all the Universities funding for HIV and AIDS activities was mentioned as a serious constraint when it comes to implementation of planned HIV and AIDS interventions. Looking at the budget priorities, one gets the impression that HIV and AIDS was not one of the priority activities. Some universities did not have HIV and AIDS at all in their budget lines. In fact, funding of most of university HIV and AIDS interventions to a larger extent is from sources outside the university budget. Consequently, most of HIV and AIDS intervention activities are shelved due to inadequate or irregular funding. All universities were surrounded by communities with which they interacted very much. All sorts of relationships, ranging from the communities selling labour, markets to recreation, existed between universities and neighboring communities. Sexual relationships of all types (regular, non-regular and commercial) exist between neighboring communities and universities. Both male students and

19
female students preferred to have sexual partners outside universities for various reasons. For instance, it was reported that male students prefer sexual relationships with women from the surrounding communities because they were easily accessible and the relationship is not as compelling and expensive to maintain as one with a female university students. Use of drugs and alcohol were also reported to take place between university students and neighboring communities. However information collected showed that the HIV and AIDS programs/services/interventions in the universities did not target the surrounding communities. Conclusion This study sought to establish baseline benchmarks for HIV and AIDS interventions in Tanzania universities. Being a baseline, the study has raised many questions about key intervention areas and has suggested priority areas where a few resources available can impact on the current HIV prevalence as well as the risk sexual behaviours that university students engage in. Our major conclusion is that universities like any other population groups are prone to HIV infections. Also, mobilizing university students to test for HIV without enabling them to receive their results on spot slows willingness to test. Thus, funding of university HIV-related interventions may result into reduction of the reported HIV risks. Recommendations Based on the findings of this baseline study, the study team has provided a list of recommendations for different key audiences. The key audiences include: policy makers, universities, CSOs, students and researchers. In general, the recommendations are:
Mainstreaming of HIV and AIDS education Establishing HIV and AIDS fund and avoiding the proposal writing
method to donors. Supporting current student initiatives on HIV and AIDS awareness
creation and Behaviour and social change Improving Quality of health care including VCT services at universities Involving stakeholders around the universities in HIV and AIDS
Interventions Establishing comprehensive care and support for university members who
are living with HIV Further research to explore the unwillingness of university students to test
for HIV would compliment the results of this study The details of each recommendation per key audience are provided in the recommendation section of the report. The report ends by providing a Way Forward by suggesting that:
1. Dissemination of the findings to the national stakeholders, including participating universities need to be done without delay;
20
2. Baseline data was generated to act as benchmarks for implementation of HIV and AIDS-related programs and interventions in universities. Universities need to prioritize their interventions and agree on key indicators to be monitored and timeline for implementing these findings. The Goal-Indicator matrix can serve the purpose;
3. Technical briefs for key audiences need to be prepared from the study report and;
4. Plans for publishing the report and journal articles for wider readership should be set

21
CHAPTER 1 INTRODUCTION 1.1 Background The global statistics show that the number of people worldwide living with HIV and AIDS has declined. For instance, in 2006, it was estimated that 39.5 million people worldwide were living with HIV and AIDS ((UNAIDS, 2006). Of these, 63% were in sub-Saharan Africa. People under the age of 25 years accounted for half of all new HIV infections worldwide. In 2007, about 32.2 million were estimated to be living with the HIV ((UNAIDS/WHO, 2007)‡. The 2007 data also show that Sub-Saharan African region remains the most severely affected. An estimated 22.5 million people are living with HIV in the region. This number accounts for 68% of the global population living with HIV. In the SADC region the adult HIV prevalence rate averages 11% compared to a 1% prevalence rate globally. This means that about 40% of all people living with HIV and AIDS are in the SADC region. Approximately 37% of all new infections in 2005 occurred in this region (SADC Think Tank Report 2006). Globally, AIDS remains the leading cause of death and the worst public health crisis (UNAIDS/WHO, 2007). While it is widely acknowledged that HIV and AIDS in sub-Saharan Africa is primarily spread through sexual activity (Holmes, 2003), we must acknowledge that our understanding of the meaning, values and motivations ascribed to sexual expression vary widely across cultures as well as within particular populations is far from complete. Without such information, a number of HIV interventions designed and implemented in a given community may be unsuccessful. In Tanzania, the overall HIV prevalence among women and men aged 15-49 has declined from 7% in 2003/2004 to 5.8% in 2007/2008 (THMIS, 21007/08; UNAIDS, 2008: 6). However, the HIV prevalence trends vary dramatically across sub-populations and population characteristics (such as age, education, wealth, marital status, location and mobility). For instance, HIV prevalence among the educated was initially higher than among lower education levels but this has changed. However, the underlying factors for such a change are yet to be explored. Also, the HIV prevalence is higher among the wealthy individuals than the poor (UNAIDS, 2008). However, employed persons, mobile populations and persons with higher levels of economic activity are more likely to be HIV positive (UNAIDS, 2008). Such results necessitate further investigation about HIV, mobility, level of education and levels of wealth. Furthermore, variations by geographic locations show that HIV prevalence in urban areas is much higher than in rural areas and that there is a significant regional difference across the 21 regions in Tanzania mainland (THMIS, 2007/08). For example, the recent findings show that adult HIV prevalence ranges from 1% (in Kigoma region) to 15% (in Iringa region) (THMIS, 2007/08). ‡ UNAIDS/WHO (2007: AIDS epidemic update, Geneva.
22
Despite the fact that literature on the linkage between HIV and migration at population level is limited in Tanzania, evidence from community-level studies show that mobility and short-term migration is associated with increased HIV prevalence. A few studies available show that spousal separation, frequency of travel and duration of time away from one’s usual residence are associated with engagement in risk sexual behaviors (Boerma et al. 1999, 2002). In another study, gender of a long-term mobile partner influences engagement in risk sexual behaviours, in which case, long-term mobile women than long-term mobile men were reported to engage in multiple sexual partnerships (Kishamawe et al, 2006). However, these findings vary by duration of stay at destinations (Vissers et al, 2008) and by ethnicity (Tananka et al, 2008) In general, it is evident that the HIV risk factors have been changing over time. However, these changes can hardly be established among the Higher Education Institutions due to absence of such studies in this sub-population. Thus, undertaking this study is timely and necessary. Sectoral responses to the challenges of HIV and AIDS in tertiary education began in 1997 when the then Ministry Higher Education Science and Technology (MHEST) was involved in planning and implementation of the Medium Term Planning III (1998-2002) leading to the establishment of a Technical AIDS Committee in the ministry in 2000. The first task of this committee was to prepare a Strategic Framework on HIV and AIDS for 2003-2007. The aim of the Strategic Framework was to translate the National policy and the National Multi-Sectoral Strategic Framework on HIV and AIDS through the provision of guidance in planning interventions by various stakeholders in the response to HIV and AIDS. The MHEST-TAC then directed the formation of technical AIDS Sub-committees in all of its institutions to be responsible for: coordination, planning and implementation of HIV and AIDS interventions at the institutional levels. A number of daunting challenges face Universities in Tanzania in designing and implementing effective responses to HIV and AIDS. First is the fact that little is known about the vulnerability, prevalence, impact and situation of HIV and AIDS in most of these institutions. Second is the tendency of some senior members of staff to think of HIV and AIDS as issues that only concern the junior staff and students. The third challenge is that HIV and AIDS is not given high priority in terms of resources allocation (financial, human, time and space) and this constrains on the implementation of planned, coordinated, integrated and comprehensive institutional HIV and AIDS programs. One positive development, however, is the Ministry of Science, Technology and Higher Education (MSTHE), the Tanzania Commission for AIDS (TACAIDS) and the university’s acknowledgement that HIV and AIDS is a serious matter that

23
needs to be attended to urgently as it puts the core business of the universities in danger. By 2004, most Universities (private and public) in Tanzania had established technical HIV/ AIDS sub-committees and were implementing some HIV and AIDS interventions (Mbilima et al 2004).However, HIV and AIDS policies which would have guided the interventions, including action plans and strategies, were not yet in place in the universities. In two universities draft HIV and AIDS policies were in place. Even where HIV testing services were available, members of staff and students were reluctant to use them owing to denial, shame and stigma (Mbilima et al 2004). This makes it difficult for universities to provide baseline data that can be used for monitoring and evaluation of program interventions The absence of HIV and AIDS policy on the other hand means that HIV and AIDS activities were conducted through administrative directives and/or guidelines (Mbilima et al 2004). Despite the lack of accurate data on HIV prevalence in all Universities, there is wide agreement that HV/AIDS do claim prematurely many lives of university staff members- a development which will negatively impact on the core functions of the universities i.e. teaching, research, consultancy and outreach. Based on the above background, it is quite evident that information on HIV and AIDS in higher learning institutions is limited in scope and scale. Available information does not reflect how staff and students protect their health, seek healthcare from the available services and how institutional framework limits or enhances individual initiatives towards avoiding HIV infections. The study aimed to address these and related concerns. As part of the initiatives to address the impact of HIV and AIDS, the East African Community/AMREF Lake Victoria Partnership (EALP) Programme through the Inter-University Council for East Africa is supporting a Baseline Study on HIV and AIDS in Higher Education Institutions in East Africa. The purpose of the program is to improve the effectiveness of HIV and AIDS responses in Lake Victoria Basin as way of minimizing the effects of vulnerabilities that result from internal and cross-border motilities. The program utilizes a multi-sectoral approach, focusing on various mobile§ and, therefore, vulnerable groups in the region, including migrant workers, Higher Education Institutions and Fishing Communities. The program examines mobility as a significant factor in the higher-than-average HIV infection rate in the Lake Victoria Basin. A mutli-
§ Within the context of this study, the term “short-term mobile” and “long-term mobile” are used. A short-term mobile person is the one who spends not more than two academic semester (usually one semester lasts for 3-4 months) outside the habitual residence within 12 months before the study. A long-term mobile person is the one who lives elsewhere for more than 2 academic semesters 12 months prior to this study.

24
sectoral approach is necessary to mitigate the impact of HIV and AIDS on the diverse but inter-linked population of the Basin area. This study is part of the broader study involving other East African Universities within the Lake Victoria Basin whose aim is to generate further information to enable the development of a feasible, effective and relevant national and regional HIV interventions[jointly] by the Inter-University Council for East Africa (IUCEA), AMREF, national HIV and AIDS coordinating agencies and the universities. 1.2 Study Rationale While Tanzania is taking various initiatives to curb the HIV/AIDS scourge (particularly limiting transmission) in the country, addressing transmission among the mobile population such as students and staff of Higher Learning Institutions remains a major challenge. Little, if any, is known about HIV prevalence among university communities as well as the types of HIV behavioral/sexual risk practices that this population engage in. Moreover, there’s limited information on HIV/AIDS related service availability and utilization among university communities. The available national data (The 2007-08 THMIS, the 2003-04 THIS, the 1991-92 TDHS, the 1996 TDHS, the 1999 RCHS and the 2004-05 TDHS) share one major observation: information on HIV prevalence and HIV risk factors among special sub-populations such as university communities is lacking. The only specific population groups mentioned include children and youth, girls and women, men and the disabled. Even where vulnerable population groups are mentioned as in NMSF** 2008-2012 (pages 18-23), the way vulnerability is defined seems too broad to include mobile populations of the Higher Learning Institutions. University students and staff-related HIV and AIDS information is required so that, as a matter of urgency, intervention strategies in this population are as objective as possible and are in line with national priorities and policies. Also, such information will enable the universities to respond to and address specific university community needs. Without such data, it casts doubt on whether the national HIV and AIDS intervention strategies can adequately respond to the real & specific needs of Higher learning institutions For instance, despite the remarkable achievements reported on the HIV and AIDS indicators (such as knowledge on HIV and AIDS, voluntary HIV testing and others), the 2007-08 THMIS puts in slipshod fashion the responses for higher learning institutions under the “secondary+” category. It is not clearly indicated what proportion of university population falls under this broad category. Also, while the TDHS-2007/08 reports on the remarkable decline of risk sexual behaviours among young people aged 15-19 (age at first sex, sex in the past 12 months and reduction of number of sexual partners) it well understood that ** National Multi-sectoral Strategic Framework on HIV and AIDS, 2008-2012
25
university students are largely aged above 19 years. The ever growing and mobile university population cannot be assumed to be well represented in such generalizations. With the growing number of student population in Institutions of Higher Learning, it is pertinent that these institutions have the duty to cope with the cumulative impacts of HIV and AIDS over time, and not just to deal with problems arising from new infections. In order to do so, these institutions need accurate and up-to-date data on HIV prevalence and risk factors that are related to HIV transmission. Such information will enable these institutions design and implement evidence- based interventions. 1.3 Objectives General Objective The baseline study aimed to generate data/information on the status and responses of HIV and AIDS amongst the selected Higher Education Institutions in Tanzania. Specific Objectives
1. to determine HIV prevalence among students of Higher Learning Institutions
2. To identify risk factors associated with HIV infections among university population and neighboring communities
3. To assess the current and planned programs of the HIV and AIDS responses for selected institutions of Higher Learning in Tanzania
4. To assess the availability and utilization of HIV and AIDS related services for staff and students of IHL in Tanzania
5. To develop sector specific strategies for effective policy coordination, structure and standards for management of HIV and AIDS
1.4 Organization of the report The report is organized into two major parts. Part One has two chapters: Introduction and Methodology. Chapter One provides background to the study, including a brief description on HIV and AIDS interventions by various institutions in East Africa and beyond. The chapter also includes a brief literature review, study objectives as well as core indicators studied. Chapter Two presents research design and methodology. Part Two, which is a continuation of Part One, has five chapters. Chapter Three covers description of the characteristics of respondents. Chapter Four presents results on HIV-Related Knowledge and Attitudes. Chapter Five presents findings on HIV and AIDS Related Behaviour. The findings on HIV prevalence are presented in Chapter Six. Chapter Seven presents findings on policies, regulations and programs at universities. The final chapter, Chapter Eight, presents the conclusion and recommendations of the report. Bibliography follows after the final chapter. The study tools are annexed to the report.

CHAPTER 2 STUDY DESIGN AND METHODOLOGY
2.1 Overview This is a cross sectional study which intends to establish a general picture of HIV infection prevalence and risk factors that contribute to the infection among Higher Learning Institutions in Tanzania, using both quantitative and qualitative approaches. The study team was aware that when researching HIV and AIDS among special population groups such as institutions of higher learning, blending of qualitative and quantitative approaches is the most ideal. While quantitative data help in assessing the existing breadth and effectiveness of current HIV and AIDS response programs by and for institutions of Higher Learning in Tanzania, the qualitative data complement the study with information on perceptions, opinions and attitudes towards the same themes addressed by the quantitative methods. In addition, sero-survey determines the level of HIV sero-prevalence in the sampled institutions. A non-experimental and cross-sectional study design was adopted for this study. The study had two main components: behavioral study (in which both qualitative and quantitative data on HIV risk factors were gathered) and sero-survey (based on which HIV prevalence among university students was established). Quantitative information was gathered from the student population, while qualitative information was collected from all three target populations (students, staff and neighboring communities).
2.2 Study Sites The study involved a total of six universities which are categorized by geographical distribution and type of ownership (public, private and/or faith based). The universities are the Mwanza-based Saint Augustine University of Tanzania and the Iringa-,based Tumaini University College,both of which are Faith Based; and Mzumbe University, Sokoine University of Agriculture ( both in Morogoro), the Muhimbili University of Health and Allied Sciences and the University of Dar es Salaam all of which are public owned.
2.3 Sampling Procedure and Sample Size In this sub-section, the process of obtaining the desired sample and sample size for the three populations (students, staff and neighboring communities) is presented. It must be mentioned straightaway that selection of the six universities is purely purposive based on their geographical distribution (rural or urban) and type of ownership (private, public or faith-based). The sampling strategy for quantitative and qualitative samples is presented separately. For Quantitative sample Before discussing the sampling strategy, it is important to determine the sample size. Here, we start by presenting how the student sample size was determined. Student Sample Size The appropriate sample size for a population-based survey was determined by using the Kish formula in which three factors were critical: (i) the estimated prevalence of the variable of interest – HIV prevalence in this instance, (ii) the desired level of confidence and (iii) the acceptable margin of error. For a survey design based on a simple random sample, the sample size required is calculated according to the following formula:
27
2
2
epqxtn (Panneerselvam, 20056; Tripathi, 20077)
Where, n = required sample size t = confidence level at 99% (standard value of 1.96) p = current estimated prevalence of HIV in Tanzania (7%)8 q = 1-p e = margin of error at 1% (standard value of 0.01).
Substituting the values of the formula, we obtain the value of n as 2500.8816. That is any value of n, which is greater than 2500.8816 is within the error limit at 99 percent confidence level; in this case, n was approximated at 2500. In order to account for contingencies such as non-response or recording error, the sample was further increased by 5%: Therefore our n was 2,625. Sampling Strategy for students As stated above, the 2625 students from six universities were to be interviewed. In order to have a representative sample from each university, a multistage sampling design was adopted. Based on the current population of students (25835) and the desired sample size (2625), the Probability Proportional to Size (PPS) was used to determine the number of respondents per university (see Table 1.1). The student population in each participating institution (numerator) was divided by total student population of the 6 universities (denominator) and then multiplied by the desired sample size (2,625). After determining the desired sample size for each university, cluster sampling was used to determine the number of students to be interviewed from various clusters. Clusters were the students’ years of study (1st year, 2nd year, etc). From each cluster, students were further stratified according to gender. In both cases, Probability proportional to size (PPS) was used to determine the proportional sample of each year of study by gender as shown in Table 4. Even where the researchers may not obtain in advance the actual number of students per year of study, PPS was also applicable to determine the sample size for each year of study. For qualitative sample The sampling procedure for qualitative sample was purposive in which subjects were selected because of some characteristics which are matching with the criteria of inclusion in the study (Patton, 1990). That is we selected the participants who Rudenstam and Newton (2001:92) would call “the experiential experts” meaning individuals who, through their experiences and exposure, would provide special knowledge on HIV and AIDS in higher learning institutions and the neighboring communities. In this regard, the choice of participants for In-Depth Interviews and Focus Group Discussions were guided by theoretical sampling procedure. Through this procedure, selection of participants was guided by our understanding of the theoretical field, recognition of the social circumstances surrounding HIV and AIDS 6 Panneerselvam, R. (2005), Research Methodology,Prentice Hall, New Delhi 7 Tripathi, P.C. (2007) A text Book of Research Methodology in Social Sciences, Sultan Chand and Sons, New Delhi) 8 2003/04 National STI/AIDS Control Program
28
(as shown in the initial literature review section) and an initial estimation of which populations within universities may best provide useful data on these themes (also covered in the literature review section of this document). Sampling strategy was influenced by the type of population of interest. At each of the six participating universities, purposeful sample (consisting of students, academic and administrative staff and neighboring communities) were selected for both In-Depth Interviews and Focus Group Discussions (FGDs). Below is an explanation of how each of the three populations was sampled: For students: A purposive sample of students was selected for In-Depth Interviews. These interviews were held among selected individual students who are thought to have information relevant to this study. People to be interviewed here include student leaders in the student government, student activists and student club members. For Staff: It was assumed that one’s position in the university community may have direct or indirect influence on HIV infections and interventions within a given university. For that matter, the study team conducted In-Depth Interviews with the university academic and administrative staff. The In-Depth Interview guide was developed and participants discussed and assessed the risk sexual behaviors within and around the university, the institutional responses to HIV and AIDS, service availability as well as utilization within their universities. For neighboring Communities9: It is assumed that interaction between neighboring communities and the university population may have a bearing on the nature and rate of HIV transmission. Here, the study team collected information on the nature and context of interaction between university community and the neighboring communities, utilization of social services (such as bars, restaurants, hotels and guest houses) by university staff and students as well as student accommodation available in the neighborhood and how all these influence involvement in risk sexual behaviours.. At each of the purposively selected village/community, the consultants held discussions with the local leadership, the owners of various social services (such as hotels, restaurants, guest houses, bars and student hostels) which are directly or indirectly shared by both the university community and neighbouring communities. The village government leaders introduced the study team in their localities. In addition, the leaders assisted the team in arranging meetings with potential informants (for In-Depth Interviews). It is estimated that each IDI session lasted at most for one hour. Apart from In-Depth Interviews, the study team also conducted Focus Group Discussions with neighboring communities in order to gather information about general perceptions, opinions and feelings towards risk sexual behaviours in the participants’ neighborhood. Under the consultants’ guidance, the specially trained research assistants conducted FGDs. The consultants ensured that FGDs were 9 In this study, neighboring community refers to a community within the university campus vicinity at which university members (staff and students) mostly share basic services with other members of community outside the campus
29
conducted along gender and age criteria both for the informants and the research assistants. The interviews and discussions were conducted in Kiswahili, (the national language) to facilitate communication. FGDs were recorded and later transcribed verbatim. On average each FGD session took at most two hours.
2.4 Sensitization and Mobilization Each of the participating universities was sensitized to participate in the study. The university communities were encouraged to participate, the motivation being that results would help their universities to plan and implement HIV and AIDS related interventions. The university communities were also informed that this study would not link the DBS procedure with individuals but those who wished to test for HIV infection were encouraged to do so. However, the study team was aware that carrying out HIV sero-prevalence study among special population groups such as higher learning institutions is demanding and complex. In lieu of this context, the study team had made several arrangements to ensure that the study was successfully and efficiently conducted. The arrangements were related to personnel, sensitization and mobilization of university communities and neighboring communities as well as laying down the strategies for implementing planned activities. . Personnel: In order to ensure that coordination was efficient at each participating university, the study team in collaboration with the university administration recruited a focal person who played a role of the supervisor at each participating university. The supervisor was a person employed by the university on full time basis and capable of liaising between the study team and the university community (administration, staff and students). For the purpose of taking DBS samples, the health personnel who have experience in DBS pricking were recruited for one week to participate in sensitization and conducting HIV testing. The study team in collaboration with the respective regional hospitals, through regional medical officers identified and recruited the clinical personnel within the region.
University Authorities: In order to ensure maximum cooperation of the university community, the study team worked closely with the office of the Dean of Students as well as the DVC –ARC (Deputy Vice Chancellor-Academic, Research and Consultancy) and DVC-FPA (Deputy Vice Chancellor- Planning Finance, and Administration) respectively. The three offices supported the study team in reaching decisions on the following issues:
Mapping out neighbouring communities with which the university community interact;
Based on the information provided, decide on the logistics (transport, distance and seasons) of getting to the neighbouring villages/streets;
To plan the sensitization strategy so as to ensure that the university community (students and staff) is reached and;
To decide on the appropriate timing of carrying out the study.

30
Strategies The UCB had planned three strategies, namely;
(a) Public Sensitization campaigns on the need for and usefulness of HIV testing at the Higher Education Institutions. This strategy marries very well with the currently on-going the national campaign on HIV and AIDS testing which was launched by the President of the United Republic of Tanzania.
(b) Lobbying for Top management Support in the Higher Education Institutions through demonstrated commitment to the HIV and AIDS intervention initiative.
(c) Using selected Health facilities for carrying out the actual HIV testing.
Activities performed to realize the Strategies The study team in collaboration with the participating universities carried out several activities before the DBS sample pricking at the selected institutions. These include:
Sensitization of the HEI communities through the institutional and local networks. Developing, printing and distributing HIV VCT/Antiretroviral Treatment
sensitization booklets. The booklet consists in very simplified language the advantages of HIV testing and treatment. For the benefit of the neighboring communities, both English and Swahili versions of the booklet were produced.
Using local drama groups and local celebrities for sensitization and campaigns. Using Banners with strong and motivating messages on the importance of HIV
testing. Use of press release prepared by the Vice Chancellors/Principals of the HEI
encouraging their staff and students to go for the HIV testing.
Following intensive sensitization: 1. A sample for the behavioural survey was randomly selected through multistage sampling 2. Those who were interviewed were encouraged to take part in DSB pricking for HIV test 3. Students who were in need of knowing their HIV status were encouraged by the study team to do so.
2.5 Core Indicators Risk factors associated with HIV transmission/acquisition were determined by using the following core indicators:
1. Awareness of HIV and AIDS Prevention Methods and Modes of Transmission 2. Stigma and Discrimination Associated with HIV and AIDS 3. Recent Sexual Activity 4. Number and type of sexual partnership 5. Knowledge about pregnancy 6. Transactional Sex 7. Prior HIV Testing 8. Drugs and Alcohol consumption 9. Prevalence of Medical Injections 10. STIs 11. Comprehensive knowledge about AIDS 12. Age at First Sex
31
13. Premarital Sex 14. Violence and threats in sexual relations 15. Condom Use and 16. Mobility
In addition to the above indicators, data for objectives 3 and 4 were collected based on the following thematic areas: 1. Mobility of university communities and how this may relate to their sexual behaviours. Here our interest is to explore:
The different types of mobility of university communities according to place, time, frequency and distance;
The socio-demographic characteristics of the mobile populations and; HIV risks associated with mobility including issues such as
transactional sex, class schedules, degree programs, financial issues, accommodation, peer pressure and the role of modern technology.
2. Policies and implementation status of HIV and AIDS interventions in higher education institutions: on this theme, the study intends to explore:
Process of university HIV and AIDS Policy formulation; Availability and implementation/use of university HIV and AIDS
policies; Progress on implementation of university HIV and AIDS policies; Availability and implementation status of the university HIV and
AIDS strategic plans; Existing partnerships and collaborative arrangements for the
implementation of university HIV and AIDS policy; Other issues such as budget allocation for policy implementation,
commitment of university leadership to the approved policies, monitoring and evaluation of these policies and strategic plans were also be explored.
3. Status of HIV and AIDS service provision in higher education institutions. The main issues to be explored under this thematic area include:
Type, accessibility and quality of the existing HIV and AIDS services; University community awareness about the available HIV and AIDS
services; Utilization of the available HIV and AIDS services and; Health-seeking behaviours among university and neighboring
communities.
2.6 Data collection Data collection and taking of DBS samples was done after intensive sensitization and mobilization at the university community level as described in section 5.3.
2.6.1 Behavioral data For the purpose of collecting quantitative data, a questionnaire was used to collect information on HIV infection risk behavior; service availability and utilization. Also, for qualitative data, an in-depth interview and Focus Group Discussion guides were
32
used to explore institutional management and coordination of HIV and AIDS responses in the participating universities. For both instruments (questionnaire and guides), questions were designed to address the objectives of the study. The draft guides and the questionnaire are attached to this protocol as appendix – and - The sampled university students self-administered the questionnaire in a room/facility under the supervision of trained research assistants. Informed consent was sought and when granted a consent form was signed. During questionnaire administration, privacy/confidentiality was ensured. The interview took a maximum of 40 minutes. Issues of confidentiality and informed consent were taken care of before the interviews started. On the other hand an FGD session took at most two hours each. Every questionnaire was checked for internal consistency and completeness, eliminating miscoded responses and coding of open-ended questions. Each study site was supervised by one researcher to ensure quality and safety of the data collected. At the end of data collection, each researcher ensured timely delivery of the raw data to the University of Dar es Salaam Consultancy Bureau either by hand.
2.6.2 Blood collection and Storage All students who were sampled for this study were eligible for taking the DBS samples. At the end of each interview, the respondents were encouraged to be pricked and their dried blood spots (DBS) taken for HIV testing. A respondent who consented for DBS was requested to sign an informed consent form and thereafter pick a sticker showing a unique identification number that was attached on his/her questionnaire. The respondent proceeded to the specially designed space for DBS pricking. Collection of DBS samples for HIV testing and data collection for risk sexual behaviours were carried out simultaneously. HIV testing was anonymous and unlinked, i.e., it was conducted in such a way that the results could not be linked to individual respondents. Three blood spots from a finger prick were collected on a special filter paper card. Ethical issues related to DBS pricking are elaborated in the “ethical issues” section.
2.7 Data Management and Analysis
2.7.1 Data Processing Data entry for quantitative data was performed by the use of Statistical Package for Social Sciences (SPSS version 12.0) computer program. A university computer room was hired in which seven computers used to enter data. Data entry was done at the UCB by trained data entrants under direct supervision of the study team. A series of consistency range checks was used to identify any unreasonable entries and to verify that responses adhered to filter response patterns. Validation exercise was done twice. The first validation exercise was conducted by a team comprising study team, AMREF and NTT members. Some inconsistencies in data entry were noted and corrected. A team of NTTs was invited for second validation of entries and was satisfied with quality of data entry.
33
The dried blood spot (DBS) samples were first processed at Muhimbili National HIV Reference Laboratory. The algorithm used for the testing of the DBS samples required each DBS specimen first to be eluted and tested with Vironostika HIV Uni-Form II Ag/Ab (Biomerieux). All HIV positive samples were then retested with Enzygnost Anti HIV 1/2 Plus (Dade Behring). Results from the second test were recorded as final test results. Thereafter, a 10 percent sample of negative DBS and all positive DBS were transported to the National Quality Assurance Laboratory (NQAL) for re-test. There were no variations noted between the DBS results for first and second test. Two variables were developed before merging sero- and behavioural data: testing status (whether a respondent was tested or not) and HIV test results (whether the results were positive or negative). The DBS results were merged with the behavioural data for final analysis. Processing of qualitative data was an ongoing process throughout the data collection period. Information collected from focus group discussions and in-depth interviews were initially tape-recorded, translated and transcribed verbatim and typed in the computer. Each group discussion or in-depth interview was translated and transcribed immediately after the session. The transcriptions were typed using MS Word XP Processor.
They were later subjected to content analysis, where key themes and concepts were identified in the transcripts and analyzed.
2.7.2 Data Analysis Quantitative data: Quantitative data was analyzed using SPSS version 12.0. As part of the analysis, frequency counting, cross tabulations, Chi-square tests and regression analysis were performed where necessary. In addition, univariate analysis was used to assess the association between beliefs about HIV and AIDS with gender, university ownership, and to assess the association of sexual behaviour with duration of stay at a university. Kaplan-Meier (KM) was used to asses the predictors of engagement in risk sexual behaviour and HIV testing. 99% confidence intervals (CI) were calculated while controlling for socio-demographic factors, such as age, gender, year of study, and program of study. A total of 2426 respondents (1348 male students, 1006 female students plus 72 students who did not indicate their gender) filled the questionnaire. Since the findings are presented first by gender and then by other background characteristics, the respondents whose gender was not specified (72 students) are excluded from the analysis. Also cross-tabulations exclude missing cases as SPSS automatically filters out such cases from the computations.
34
Qualitative data: The typed data were analyzed by the use of software for analysis of qualitative data called NUDDIST version 6 (or simply N6). Identification of major themes according to specific objectives and establishment of possible relationships then followed.
2.8 Recruitment and Training of study team All research assistants had a background in Social Science or Public Health at least at a bachelor degree level and had worked as research Assistant before. They had undergone an intensive training in social science research methods (especially qualitative) as well as research ethics. Other criteria for inclusion included good academic progress in postgraduate studies (for those currently studying) and good performance in undergraduate studies for those who had already completed studies). Selection was also based on interest in researching HIV and AIDS and/or sexuality and time (availability for data collection). Selected RAs then attended three-day training on the study objectives, the study design, research process and research ethics. As part of the training the RAs participated in pilot testing of the instruments before commencement of the actual fieldwork. For the sero-survey component, the study team in collaboration with the Regional Medical Office identified healthcare staff teams to be incorporated in this study. The selected individuals -along with study teams-visited selected universities, participated in HIV Testing campaign and collected DBS samples.
2.9 Response Rate
According to Boyd and colleagues, a sample is always representative of the total population if it represents at least five percent of the total population in question (Boyd et al., 1981)10. In this study, we compared the sample frame with the actual sample size for each university based on the number of students who were registered in the nominal roll for the academic year 2008/2009. Overall, the proportion taken from each university was higher than the minimum proportion suggested by Boyd and colleagues implying that the sample was representative at the university level. Table 1.1 shows response rates for the baseline study. A total of 2,426 respondents were interviewed giving a response rate of 92.4 percent ranging from 75% at UDSM to 100 percent at Mzumbe, SAUT, SUA and Tumaini. Response rate for sero-survey was 51.4%. Mzumbe had the minimum and SUA had the maximum response rate.
10 Boyd, H.K., Wesfall, P., Stasch, S.F (1981), Marketing Research: Texts and Cases, Richard D. Irwin inc. Illinois.

35
Table 2.1 Response rate for behavioral and sero-survey per university
Response rate in % Name of university sample size Behavioura survey
Sero-survey
MUHAS 179 96.0 85 Mzumbe 382 100 30 SAUT 354 100 56 SUA 252 100 96 Tumaini 308 100 44 UDSM 951 75.0 43 Total 2426 92.4 51.4
2.10 Limitations The study encountered a number of limitations: they include timing of the study, disbursement of funds and lack of on the spot release of HIV testing results. On timing, the study was conducted close to the end of semester university examinations. This meant were under pressure with final preparations for the exams, something that would have affected their participation in the study. After consulting the university authorities, time for the students to participate in the study was set aside by canceling some class sessions. Secondly, there was a long time lag between signing of the contract and release of funds. This led to the delay in commencement of fieldwork as per submitted timeline. Finally, non-release of the HIV testing results on the spot meant that students who wished to know their HIV status would see no incentive of giving blood for HIV testing. The study team encouraged students who were in need of knowing their HIV status to visit the nearby health facility that offered HIV testing services.
36
CHAPTER 3 CHARACTERISTICS OF RESPONDENTS
3.1 Overview This chapter gives a brief description of selected demographic and socio-economic of respondents to the study including age, sex, accommodation, year of study, level of income, program mode ( full time/part time), sponsorship, year of study and marital status. Examination of these characteristics helps us to gauge the accuracy of the survey data. Most significantly, these characteristics may be related to other issues investigated in this survey namely knowledge, awareness, attitude and behaviour related to HIV&AIDS prevalence, prevention and treatment.
3.2 Background Characteristics of Respondents Data in Table 3.1 show the distribution of respondents by background characteristics. Analysis by age group shows that majority of respondents were in age group 20-24 years (46.3% male students and 67.0% female students). In both cases, the proportion of each age group declines as the age increases, a reflection of young age structure of the university student population. In terms of marital status the majority of the respondents are single. The proportion of married males (13.5%) is slightly lower than that of females (15.3%). About 2.4% and 4.6% of males and females respectively are cohabiting. In both sexes the percentages for divorced, separated and widowed are low. Majority of students are government sponsored and are engaged in full time programs. In terms of accommodation most students use in-campus University hostels followed by off campus university hostels or private apartment. Majority of both male and female students are spending less than one million per semester.
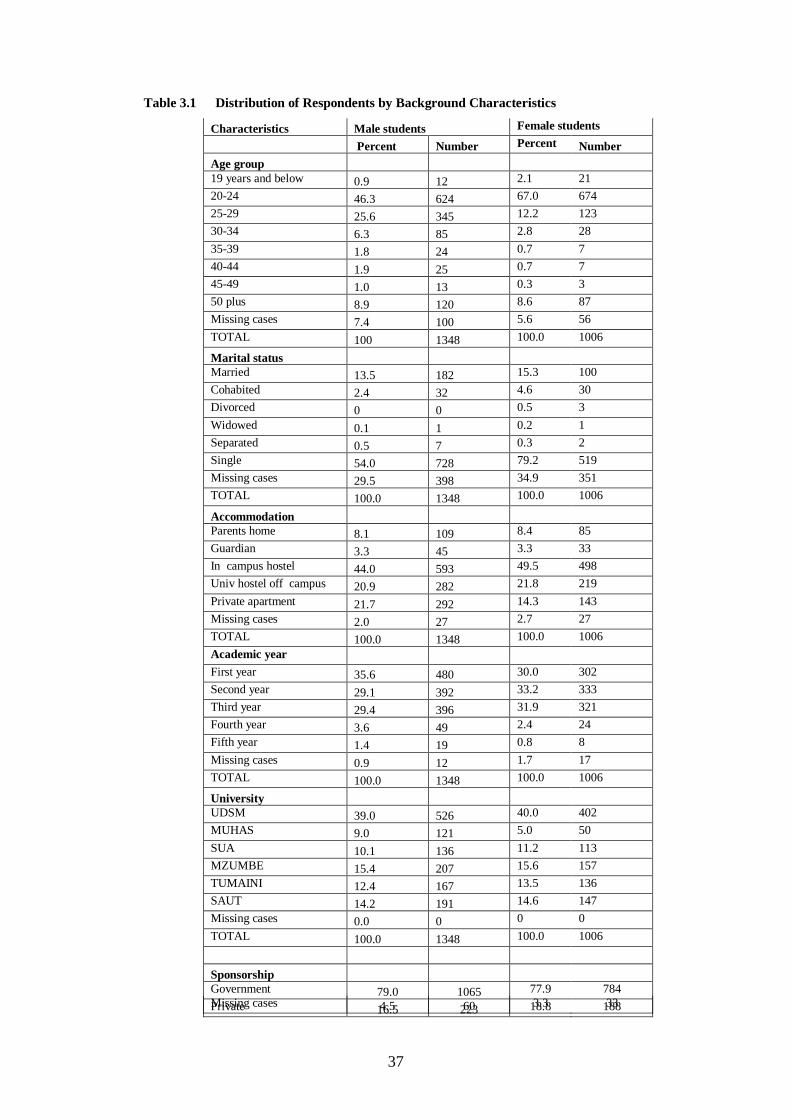
37
Table 3.1 Distribution of Respondents by Background Characteristics
Characteristics Male students Female students
Percent Number Percent Number Age group 19 years and below 0.9 12 2.1 21 20-24 46.3 624 67.0 674 25-29 25.6 345 12.2 123 30-34 6.3 85 2.8 28 35-39 1.8 24 0.7 7 40-44 1.9 25 0.7 7 45-49 1.0 13 0.3 3 50 plus 8.9 120 8.6 87 Missing cases 7.4 100 5.6 56 TOTAL 100 1348 100.0 1006
Marital status Married 13.5 182 15.3 100 Cohabited 2.4 32 4.6 30 Divorced 0 0 0.5 3 Widowed 0.1 1 0.2 1 Separated 0.5 7 0.3 2 Single 54.0 728 79.2 519 Missing cases 29.5 398 34.9 351 TOTAL 100.0 1348 100.0 1006
Accommodation Parents home 8.1 109 8.4 85 Guardian 3.3 45 3.3 33 In campus hostel 44.0 593 49.5 498 Univ hostel off campus 20.9 282 21.8 219 Private apartment 21.7 292 14.3 143 Missing cases 2.0 27 2.7 27 TOTAL 100.0 1348 100.0 1006 Academic year First year 35.6 480 30.0 302 Second year 29.1 392 33.2 333 Third year 29.4 396 31.9 321 Fourth year 3.6 49 2.4 24 Fifth year 1.4 19 0.8 8 Missing cases 0.9 12 1.7 17 TOTAL 100.0 1348 100.0 1006
University UDSM 39.0 526 40.0 402 MUHAS 9.0 121 5.0 50 SUA 10.1 136 11.2 113 MZUMBE 15.4 207 15.6 157 TUMAINI 12.4 167 13.5 136 SAUT 14.2 191 14.6 147 Missing cases 0.0 0 0 0 TOTAL 100.0 1348 100.0 1006
Sponsorship Government 79.0 1065 77.9 784 Private 16.5 223 18.8 188 Missing cases 4.5 60 3.3 33

38
.
TOTAL 100.0 1348 100.0 1006
Program mode part time 1.5 20 1.0 10 full time 96.6 1302 97.6 982 Missing cases 1.9 26 1.4 14 TOTAL 100.0 1348 100.0 1006 Average Expenditure per semester
Up to 500,000 39.4 531 44.0 443 500001-1,000,000 48.7 657 45.0 453 1,000,001-1,500,000 7.2 97 6.4 64 1,500,001-2,000,000 1.3 18 2.0 20 2,000,001-2,500,000 3.0 40 2.4 24 More than 2,500,000 0.2 3 0.1 1 Missing cases 0.1 2 0.1 1 TOTAL 100.0 1348 100.0 1006
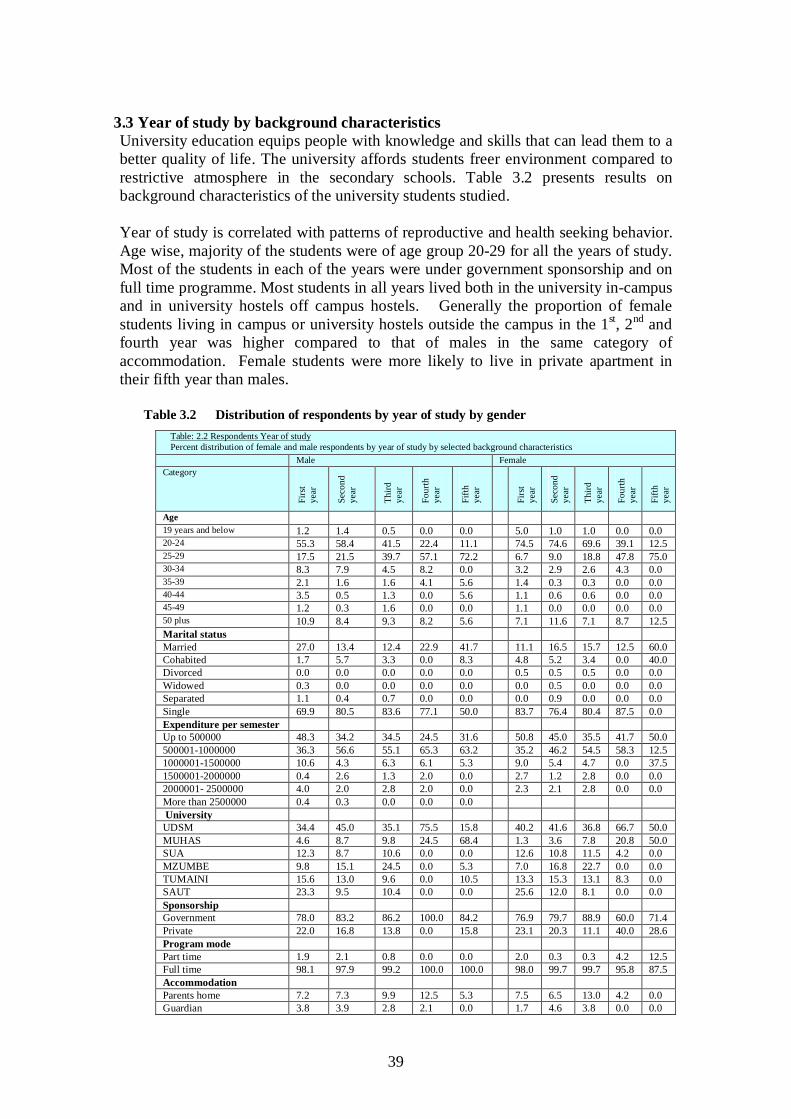
39
3.3 Year of study by background characteristics University education equips people with knowledge and skills that can lead them to a better quality of life. The university affords students freer environment compared to restrictive atmosphere in the secondary schools. Table 3.2 presents results on background characteristics of the university students studied. Year of study is correlated with patterns of reproductive and health seeking behavior. Age wise, majority of the students were of age group 20-29 for all the years of study. Most of the students in each of the years were under government sponsorship and on full time programme. Most students in all years lived both in the university in-campus and in university hostels off campus hostels. Generally the proportion of female students living in campus or university hostels outside the campus in the 1st, 2nd and fourth year was higher compared to that of males in the same category of accommodation. Female students were more likely to live in private apartment in their fifth year than males.
Table 3.2 Distribution of respondents by year of study by gender Table: 2.2 Respondents Year of study Percent distribution of female and male respondents by year of study by selected background characteristics
Male Female Category
Firs
t ye
ar
Seco
nd
year
Third
ye
ar
Four
th
year
Fifth
ye
ar
Firs
t ye
ar
Seco
nd
year
Third
ye
ar
Four
th
year
Fifth
ye
ar
Age 19 years and below 1.2 1.4 0.5 0.0 0.0 5.0 1.0 1.0 0.0 0.0 20-24 55.3 58.4 41.5 22.4 11.1 74.5 74.6 69.6 39.1 12.5 25-29 17.5 21.5 39.7 57.1 72.2 6.7 9.0 18.8 47.8 75.0 30-34 8.3 7.9 4.5 8.2 0.0 3.2 2.9 2.6 4.3 0.0 35-39 2.1 1.6 1.6 4.1 5.6 1.4 0.3 0.3 0.0 0.0 40-44 3.5 0.5 1.3 0.0 5.6 1.1 0.6 0.6 0.0 0.0 45-49 1.2 0.3 1.6 0.0 0.0 1.1 0.0 0.0 0.0 0.0 50 plus 10.9 8.4 9.3 8.2 5.6 7.1 11.6 7.1 8.7 12.5 Marital status Married 27.0 13.4 12.4 22.9 41.7 11.1 16.5 15.7 12.5 60.0 Cohabited 1.7 5.7 3.3 0.0 8.3 4.8 5.2 3.4 0.0 40.0 Divorced 0.0 0.0 0.0 0.0 0.0 0.5 0.5 0.5 0.0 0.0 Widowed 0.3 0.0 0.0 0.0 0.0 0.0 0.5 0.0 0.0 0.0 Separated 1.1 0.4 0.7 0.0 0.0 0.0 0.9 0.0 0.0 0.0 Single 69.9 80.5 83.6 77.1 50.0 83.7 76.4 80.4 87.5 0.0 Expenditure per semester Up to 500000 48.3 34.2 34.5 24.5 31.6 50.8 45.0 35.5 41.7 50.0 500001-1000000 36.3 56.6 55.1 65.3 63.2 35.2 46.2 54.5 58.3 12.5 1000001-1500000 10.6 4.3 6.3 6.1 5.3 9.0 5.4 4.7 0.0 37.5 1500001-2000000 0.4 2.6 1.3 2.0 0.0 2.7 1.2 2.8 0.0 0.0 2000001- 2500000 4.0 2.0 2.8 2.0 0.0 2.3 2.1 2.8 0.0 0.0 More than 2500000 0.4 0.3 0.0 0.0 0.0 University UDSM 34.4 45.0 35.1 75.5 15.8 40.2 41.6 36.8 66.7 50.0 MUHAS 4.6 8.7 9.8 24.5 68.4 1.3 3.6 7.8 20.8 50.0 SUA 12.3 8.7 10.6 0.0 0.0 12.6 10.8 11.5 4.2 0.0 MZUMBE 9.8 15.1 24.5 0.0 5.3 7.0 16.8 22.7 0.0 0.0 TUMAINI 15.6 13.0 9.6 0.0 10.5 13.3 15.3 13.1 8.3 0.0 SAUT 23.3 9.5 10.4 0.0 0.0 25.6 12.0 8.1 0.0 0.0 Sponsorship Government 78.0 83.2 86.2 100.0 84.2 76.9 79.7 88.9 60.0 71.4 Private 22.0 16.8 13.8 0.0 15.8 23.1 20.3 11.1 40.0 28.6 Program mode Part time 1.9 2.1 0.8 0.0 0.0 2.0 0.3 0.3 4.2 12.5 Full time 98.1 97.9 99.2 100.0 100.0 98.0 99.7 99.7 95.8 87.5 Accommodation Parents home 7.2 7.3 9.9 12.5 5.3 7.5 6.5 13.0 4.2 0.0 Guardian 3.8 3.9 2.8 2.1 0.0 1.7 4.6 3.8 0.0 0.0
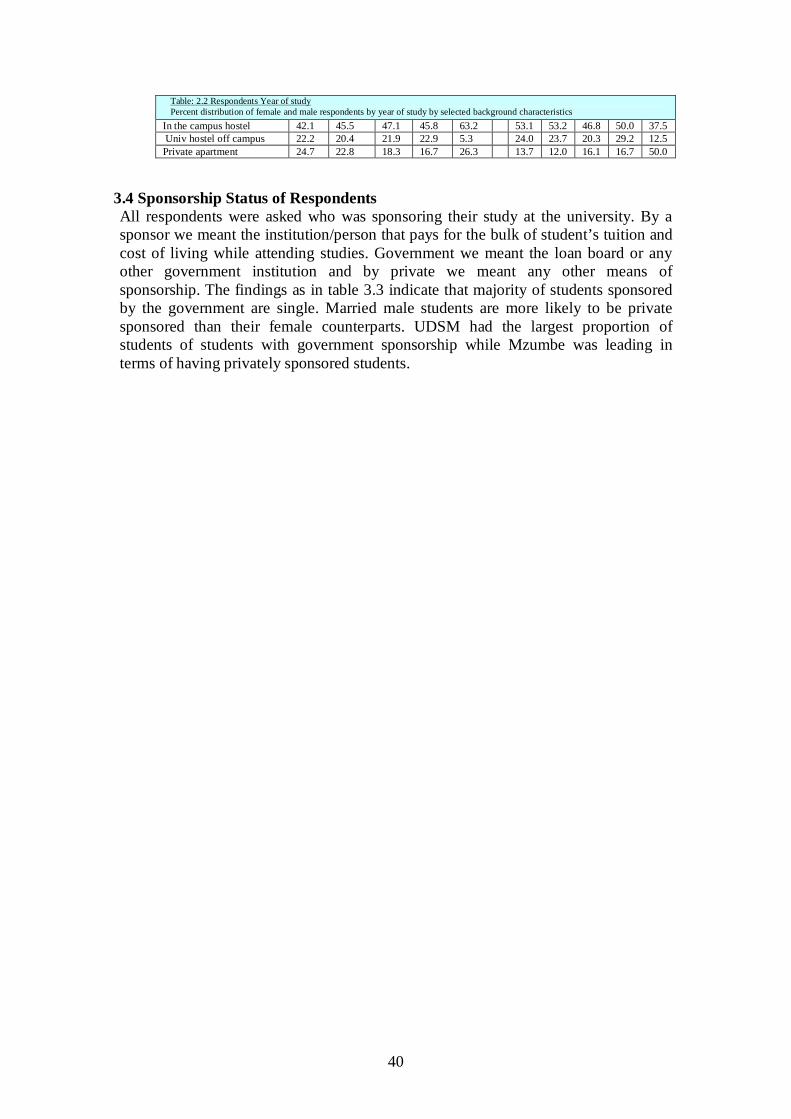
40
Table: 2.2 Respondents Year of study Percent distribution of female and male respondents by year of study by selected background characteristics
In the campus hostel 42.1 45.5 47.1 45.8 63.2 53.1 53.2 46.8 50.0 37.5 Univ hostel off campus 22.2 20.4 21.9 22.9 5.3 24.0 23.7 20.3 29.2 12.5 Private apartment 24.7 22.8 18.3 16.7 26.3 13.7 12.0 16.1 16.7 50.0
3.4 Sponsorship Status of Respondents All respondents were asked who was sponsoring their study at the university. By a sponsor we meant the institution/person that pays for the bulk of student’s tuition and cost of living while attending studies. Government we meant the loan board or any other government institution and by private we meant any other means of sponsorship. The findings as in table 3.3 indicate that majority of students sponsored by the government are single. Married male students are more likely to be private sponsored than their female counterparts. UDSM had the largest proportion of students of students with government sponsorship while Mzumbe was leading in terms of having privately sponsored students.
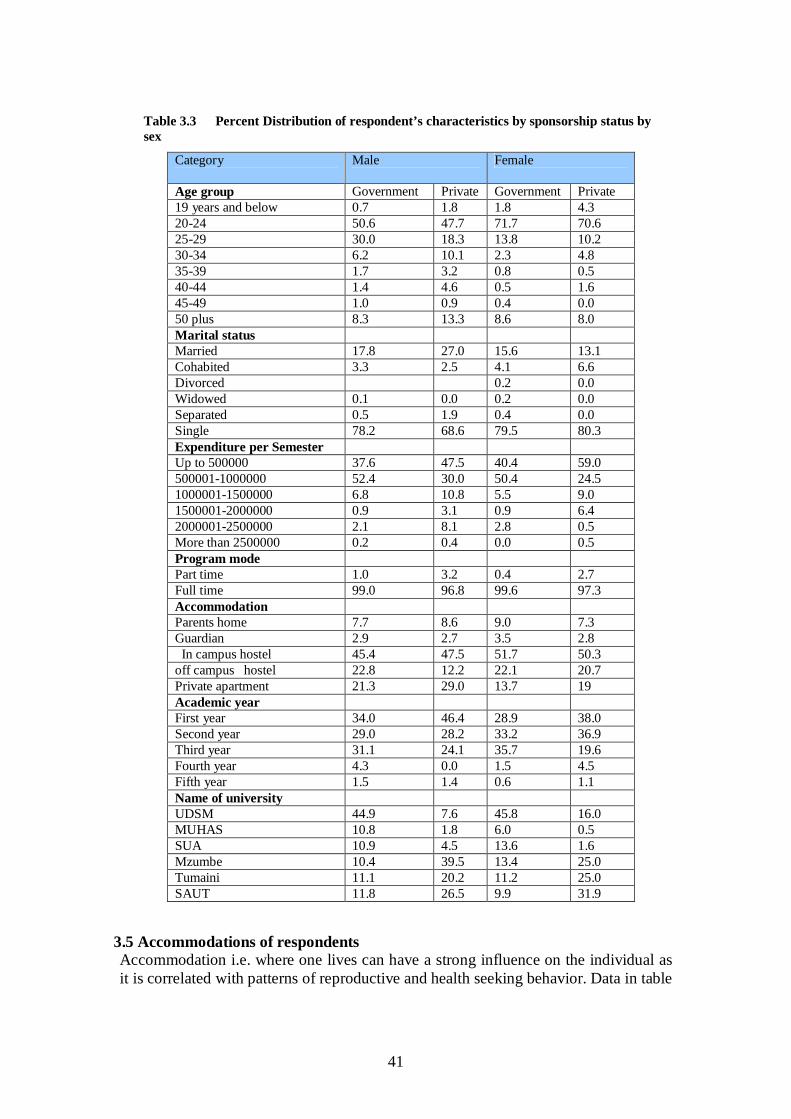
41
Table 3.3 Percent Distribution of respondent’s characteristics by sponsorship status by sex
Category
Male Female
Age group Government Private Government Private 19 years and below 0.7 1.8 1.8 4.3 20-24 50.6 47.7 71.7 70.6 25-29 30.0 18.3 13.8 10.2 30-34 6.2 10.1 2.3 4.8 35-39 1.7 3.2 0.8 0.5 40-44 1.4 4.6 0.5 1.6 45-49 1.0 0.9 0.4 0.0 50 plus 8.3 13.3 8.6 8.0 Marital status Married 17.8 27.0 15.6 13.1 Cohabited 3.3 2.5 4.1 6.6 Divorced 0.2 0.0 Widowed 0.1 0.0 0.2 0.0 Separated 0.5 1.9 0.4 0.0 Single 78.2 68.6 79.5 80.3 Expenditure per Semester Up to 500000 37.6 47.5 40.4 59.0 500001-1000000 52.4 30.0 50.4 24.5 1000001-1500000 6.8 10.8 5.5 9.0 1500001-2000000 0.9 3.1 0.9 6.4 2000001-2500000 2.1 8.1 2.8 0.5 More than 2500000 0.2 0.4 0.0 0.5 Program mode Part time 1.0 3.2 0.4 2.7 Full time 99.0 96.8 99.6 97.3 Accommodation Parents home 7.7 8.6 9.0 7.3 Guardian 2.9 2.7 3.5 2.8 In campus hostel 45.4 47.5 51.7 50.3 off campus hostel 22.8 12.2 22.1 20.7 Private apartment 21.3 29.0 13.7 19 Academic year First year 34.0 46.4 28.9 38.0 Second year 29.0 28.2 33.2 36.9 Third year 31.1 24.1 35.7 19.6 Fourth year 4.3 0.0 1.5 4.5 Fifth year 1.5 1.4 0.6 1.1 Name of university UDSM 44.9 7.6 45.8 16.0 MUHAS 10.8 1.8 6.0 0.5 SUA 10.9 4.5 13.6 1.6 Mzumbe 10.4 39.5 13.4 25.0 Tumaini 11.1 20.2 11.2 25.0 SAUT 11.8 26.5 9.9 31.9
3.5 Accommodations of respondents Accommodation i.e. where one lives can have a strong influence on the individual as it is correlated with patterns of reproductive and health seeking behavior. Data in table
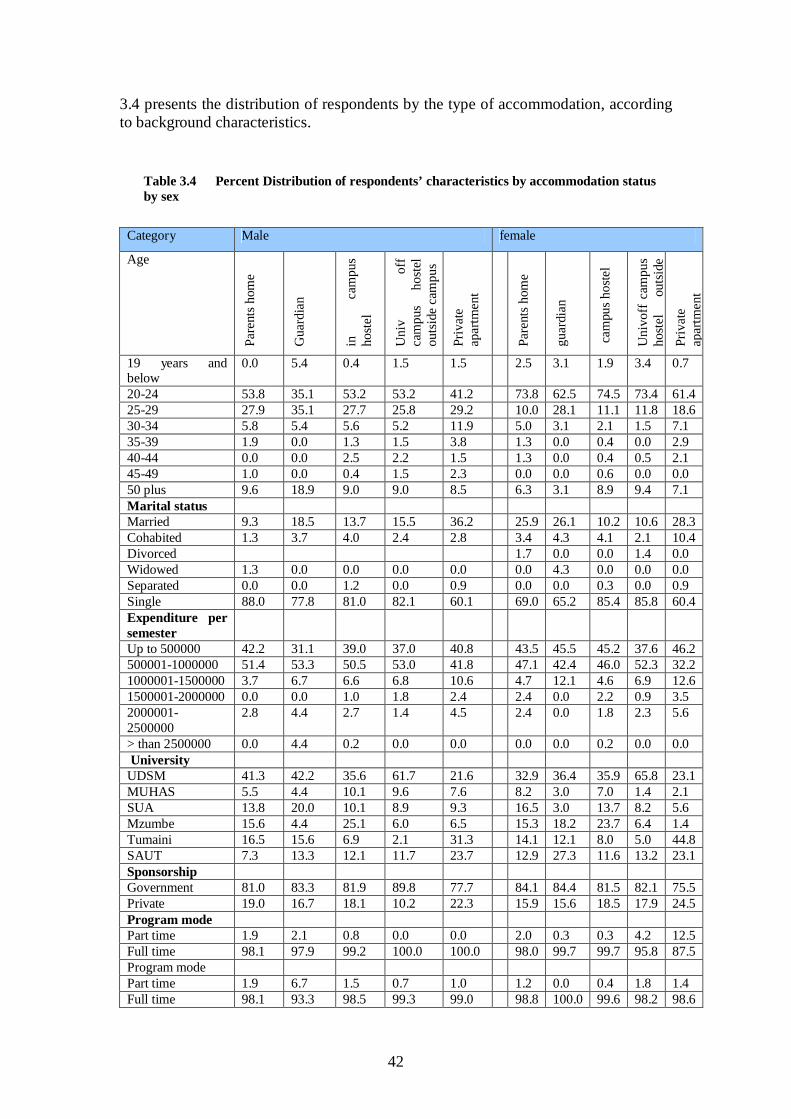
42
3.4 presents the distribution of respondents by the type of accommodation, according to background characteristics.
Table 3.4 Percent Distribution of respondents’ characteristics by accommodation status by sex
Category Male female
Age Pa
rent
s hom
e
Gua
rdia
n
in
cam
pus
host
el
Uni
v of
f ca
mpu
s ho
stel
ou
tsid
e ca
mpu
s
Priv
ate
apar
tmen
t
Pare
nts h
ome
guar
dian
cam
pus h
oste
l
Uni
voff
cam
pus
host
el
outs
ide
Priv
ate
apar
tmen
t
19 years and below
0.0 5.4 0.4 1.5 1.5 2.5 3.1 1.9 3.4 0.7
20-24 53.8 35.1 53.2 53.2 41.2 73.8 62.5 74.5 73.4 61.4 25-29 27.9 35.1 27.7 25.8 29.2 10.0 28.1 11.1 11.8 18.6 30-34 5.8 5.4 5.6 5.2 11.9 5.0 3.1 2.1 1.5 7.1 35-39 1.9 0.0 1.3 1.5 3.8 1.3 0.0 0.4 0.0 2.9 40-44 0.0 0.0 2.5 2.2 1.5 1.3 0.0 0.4 0.5 2.1 45-49 1.0 0.0 0.4 1.5 2.3 0.0 0.0 0.6 0.0 0.0 50 plus 9.6 18.9 9.0 9.0 8.5 6.3 3.1 8.9 9.4 7.1 Marital status Married 9.3 18.5 13.7 15.5 36.2 25.9 26.1 10.2 10.6 28.3 Cohabited 1.3 3.7 4.0 2.4 2.8 3.4 4.3 4.1 2.1 10.4 Divorced 1.7 0.0 0.0 1.4 0.0 Widowed 1.3 0.0 0.0 0.0 0.0 0.0 4.3 0.0 0.0 0.0 Separated 0.0 0.0 1.2 0.0 0.9 0.0 0.0 0.3 0.0 0.9 Single 88.0 77.8 81.0 82.1 60.1 69.0 65.2 85.4 85.8 60.4 Expenditure per semester
Up to 500000 42.2 31.1 39.0 37.0 40.8 43.5 45.5 45.2 37.6 46.2 500001-1000000 51.4 53.3 50.5 53.0 41.8 47.1 42.4 46.0 52.3 32.2 1000001-1500000 3.7 6.7 6.6 6.8 10.6 4.7 12.1 4.6 6.9 12.6 1500001-2000000 0.0 0.0 1.0 1.8 2.4 2.4 0.0 2.2 0.9 3.5 2000001- 2500000
2.8 4.4 2.7 1.4 4.5 2.4 0.0 1.8 2.3 5.6
> than 2500000 0.0 4.4 0.2 0.0 0.0 0.0 0.0 0.2 0.0 0.0 University UDSM 41.3 42.2 35.6 61.7 21.6 32.9 36.4 35.9 65.8 23.1 MUHAS 5.5 4.4 10.1 9.6 7.6 8.2 3.0 7.0 1.4 2.1 SUA 13.8 20.0 10.1 8.9 9.3 16.5 3.0 13.7 8.2 5.6 Mzumbe 15.6 4.4 25.1 6.0 6.5 15.3 18.2 23.7 6.4 1.4 Tumaini 16.5 15.6 6.9 2.1 31.3 14.1 12.1 8.0 5.0 44.8 SAUT 7.3 13.3 12.1 11.7 23.7 12.9 27.3 11.6 13.2 23.1 Sponsorship Government 81.0 83.3 81.9 89.8 77.7 84.1 84.4 81.5 82.1 75.5 Private 19.0 16.7 18.1 10.2 22.3 15.9 15.6 18.5 17.9 24.5 Program mode Part time 1.9 2.1 0.8 0.0 0.0 2.0 0.3 0.3 4.2 12.5 Full time 98.1 97.9 99.2 100.0 100.0 98.0 99.7 99.7 95.8 87.5 Program mode Part time 1.9 6.7 1.5 0.7 1.0 1.2 0.0 0.4 1.8 1.4 Full time 98.1 93.3 98.5 99.3 99.0 98.8 100.0 99.6 98.2 98.6
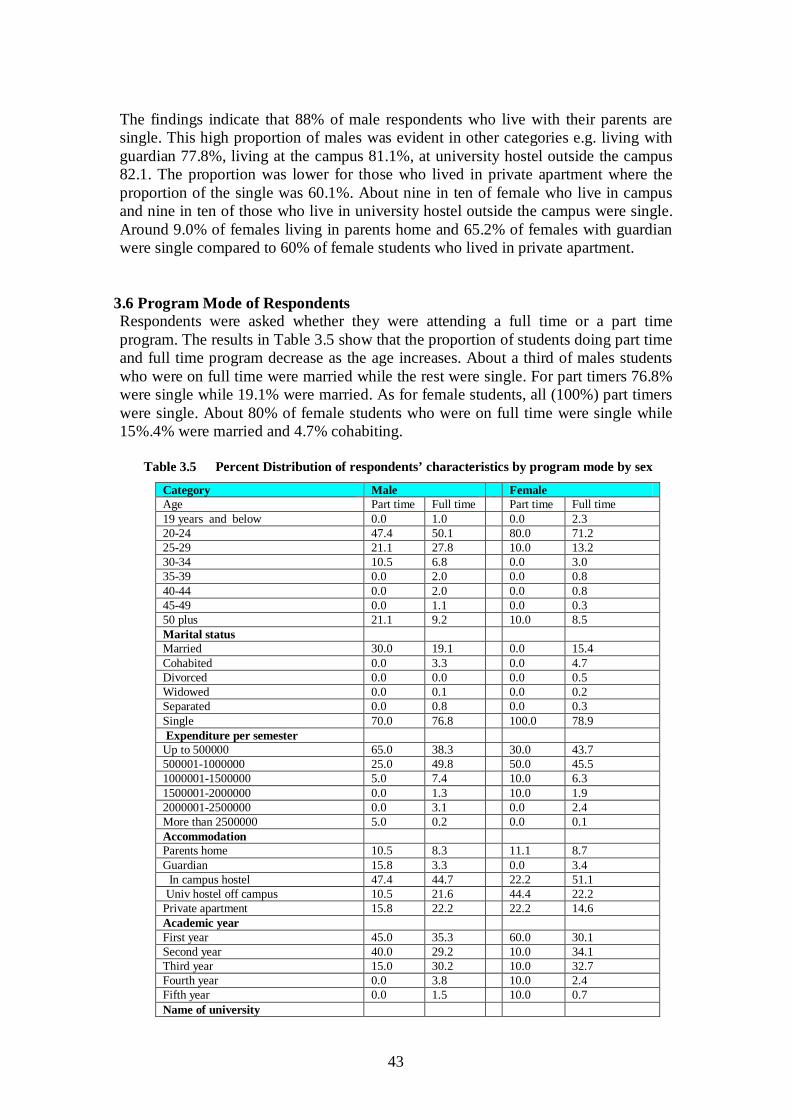
43
The findings indicate that 88% of male respondents who live with their parents are single. This high proportion of males was evident in other categories e.g. living with guardian 77.8%, living at the campus 81.1%, at university hostel outside the campus 82.1. The proportion was lower for those who lived in private apartment where the proportion of the single was 60.1%. About nine in ten of female who live in campus and nine in ten of those who live in university hostel outside the campus were single. Around 9.0% of females living in parents home and 65.2% of females with guardian were single compared to 60% of female students who lived in private apartment.
3.6 Program Mode of Respondents Respondents were asked whether they were attending a full time or a part time program. The results in Table 3.5 show that the proportion of students doing part time and full time program decrease as the age increases. About a third of males students who were on full time were married while the rest were single. For part timers 76.8% were single while 19.1% were married. As for female students, all (100%) part timers were single. About 80% of female students who were on full time were single while 15%.4% were married and 4.7% cohabiting.
Table 3.5 Percent Distribution of respondents’ characteristics by program mode by sex
Category Male Female Age Part time Full time Part time Full time 19 years and below 0.0 1.0 0.0 2.3 20-24 47.4 50.1 80.0 71.2 25-29 21.1 27.8 10.0 13.2 30-34 10.5 6.8 0.0 3.0 35-39 0.0 2.0 0.0 0.8 40-44 0.0 2.0 0.0 0.8 45-49 0.0 1.1 0.0 0.3 50 plus 21.1 9.2 10.0 8.5 Marital status Married 30.0 19.1 0.0 15.4 Cohabited 0.0 3.3 0.0 4.7 Divorced 0.0 0.0 0.0 0.5 Widowed 0.0 0.1 0.0 0.2 Separated 0.0 0.8 0.0 0.3 Single 70.0 76.8 100.0 78.9 Expenditure per semester Up to 500000 65.0 38.3 30.0 43.7 500001-1000000 25.0 49.8 50.0 45.5 1000001-1500000 5.0 7.4 10.0 6.3 1500001-2000000 0.0 1.3 10.0 1.9 2000001-2500000 0.0 3.1 0.0 2.4 More than 2500000 5.0 0.2 0.0 0.1 Accommodation Parents home 10.5 8.3 11.1 8.7 Guardian 15.8 3.3 0.0 3.4 In campus hostel 47.4 44.7 22.2 51.1 Univ hostel off campus 10.5 21.6 44.4 22.2 Private apartment 15.8 22.2 22.2 14.6 Academic year First year 45.0 35.3 60.0 30.1 Second year 40.0 29.2 10.0 34.1 Third year 15.0 30.2 10.0 32.7 Fourth year 0.0 3.8 10.0 2.4 Fifth year 0.0 1.5 10.0 0.7 Name of university

44
UDSM 40.0 38.7 30.0 40.3 MUHAS 5.0 9.2 10.0 5.0 SUA 10.0 10.2 10.0 11.3 Mzumbe 10.0 15.4 10.0 15.6 Tumaini 25.0 12.1 20.0 13.4 SAUT 10.0 14.3 20.0 14.5 Sponsorship Government 61.1 83.1 37.5 81.2 Private 38.9 16.9 62.5 18.8
There was a small difference between the proportions of males full timers (44.7%) and proportion of male part timers (47.4%) living in Campus. A tenth of male part timers lived with parents and the same proportion lived at university hostel outside the campus. For the female students, the proportion of part timers with accommodation in campus was 22.2% while the proportion of female students who were full timers with accommodation in campus was higher at 51.1%. Proportion of female part timers living with parents was 11.1% compared to 44.4% who lived at university hostel outside the campus. For full timers a small proportion 8.7 % lived with parents while 22.2% lived at university Hostel outside the campus. The proportion of male and female students on full time who were under government sponsorship was at eight out of ten in each category. For part timers the situation was different. Six out of ten male on part time program had government sponsorship while 4 out of ten part timers were under private sponsorship. On the other hand about four out ten male and six out of ten female part timers were under government and private sponsorship respectively.
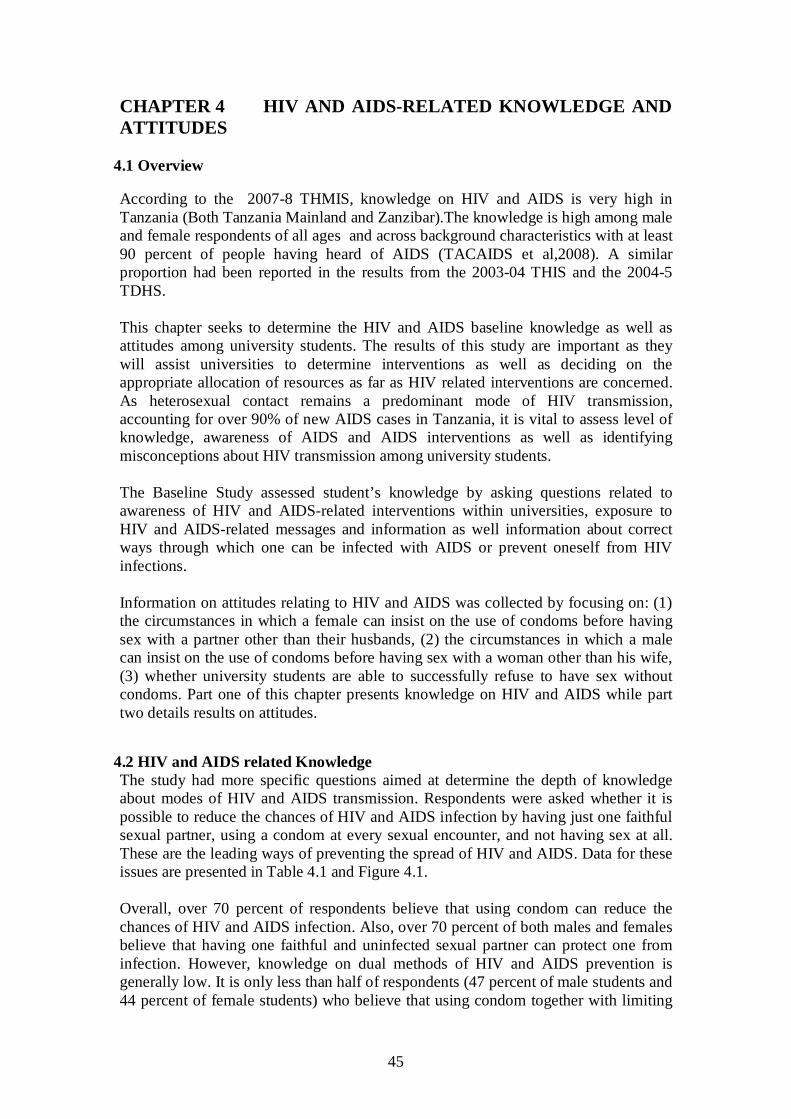
45
CHAPTER 4 HIV AND AIDS-RELATED KNOWLEDGE AND ATTITUDES
4.1 Overview According to the 2007-8 THMIS, knowledge on HIV and AIDS is very high in Tanzania (Both Tanzania Mainland and Zanzibar).The knowledge is high among male and female respondents of all ages and across background characteristics with at least 90 percent of people having heard of AIDS (TACAIDS et al,2008). A similar proportion had been reported in the results from the 2003-04 THIS and the 2004-5 TDHS. This chapter seeks to determine the HIV and AIDS baseline knowledge as well as attitudes among university students. The results of this study are important as they will assist universities to determine interventions as well as deciding on the appropriate allocation of resources as far as HIV related interventions are concerned. As heterosexual contact remains a predominant mode of HIV transmission, accounting for over 90% of new AIDS cases in Tanzania, it is vital to assess level of knowledge, awareness of AIDS and AIDS interventions as well as identifying misconceptions about HIV transmission among university students. The Baseline Study assessed student’s knowledge by asking questions related to awareness of HIV and AIDS-related interventions within universities, exposure to HIV and AIDS-related messages and information as well information about correct ways through which one can be infected with AIDS or prevent oneself from HIV infections. Information on attitudes relating to HIV and AIDS was collected by focusing on: (1) the circumstances in which a female can insist on the use of condoms before having sex with a partner other than their husbands, (2) the circumstances in which a male can insist on the use of condoms before having sex with a woman other than his wife, (3) whether university students are able to successfully refuse to have sex without condoms. Part one of this chapter presents knowledge on HIV and AIDS while part two details results on attitudes.
4.2 HIV and AIDS related Knowledge The study had more specific questions aimed at determine the depth of knowledge about modes of HIV and AIDS transmission. Respondents were asked whether it is possible to reduce the chances of HIV and AIDS infection by having just one faithful sexual partner, using a condom at every sexual encounter, and not having sex at all. These are the leading ways of preventing the spread of HIV and AIDS. Data for these issues are presented in Table 4.1 and Figure 4.1. Overall, over 70 percent of respondents believe that using condom can reduce the chances of HIV and AIDS infection. Also, over 70 percent of both males and females believe that having one faithful and uninfected sexual partner can protect one from infection. However, knowledge on dual methods of HIV and AIDS prevention is generally low. It is only less than half of respondents (47 percent of male students and 44 percent of female students) who believe that using condom together with limiting
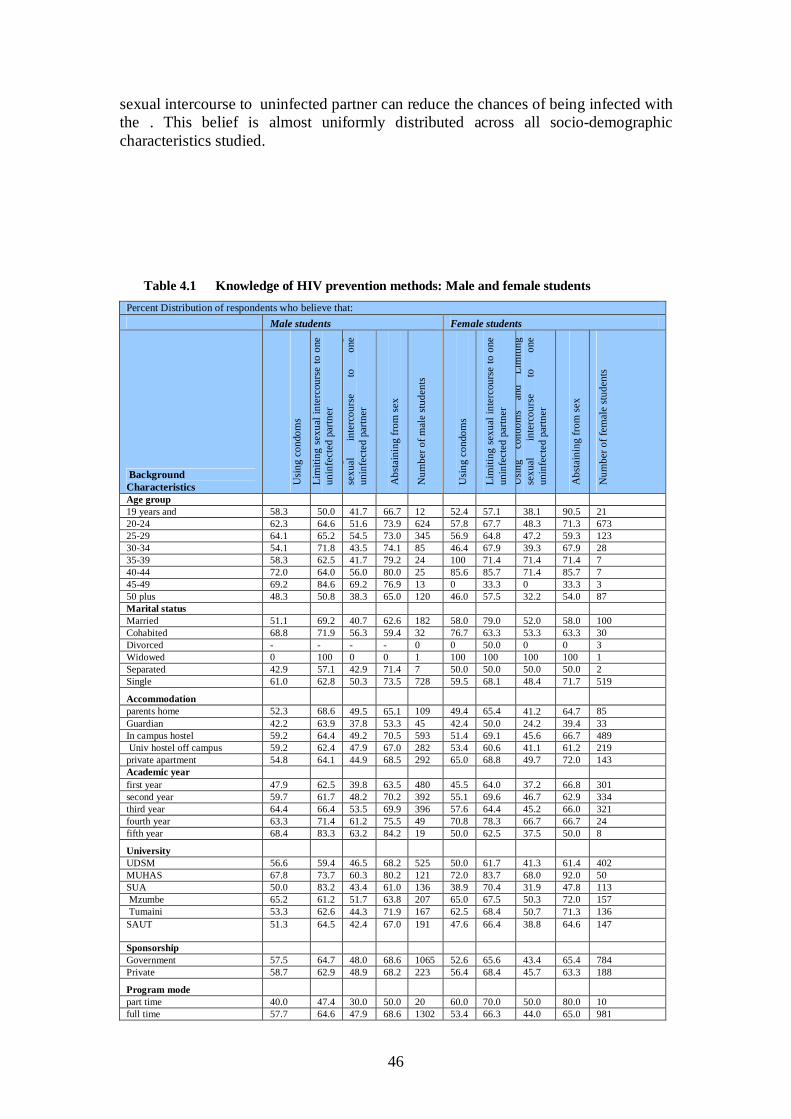
46
sexual intercourse to uninfected partner can reduce the chances of being infected with the . This belief is almost uniformly distributed across all socio-demographic characteristics studied.
Table 4.1 Knowledge of HIV prevention methods: Male and female students Percent Distribution of respondents who believe that: Male students Female students
Background Characteristics U
sing
con
dom
s
Lim
iting
sex
ual i
nter
cour
se to
one
un
infe
cted
par
tner
U
sing
co
ndom
s an
d Li
miti
ng
sexu
al
inte
rcou
rse
to
one
unin
fect
ed p
artn
er
Abs
tain
ing
from
sex
Num
ber o
f mal
e st
uden
ts
Usi
ng c
ondo
ms
Lim
iting
sex
ual i
nter
cour
se to
one
un
infe
cted
par
tner
U
sing
co
ndom
s an
d Li
miti
ng
sexu
al
inte
rcou
rse
to
one
unin
fect
ed p
artn
er
Abs
tain
ing
from
sex
Num
ber o
f fem
ale
stud
ents
Age group 19 years and 58.3 50.0 41.7 66.7 12 52.4 57.1 38.1 90.5 21 20-24 62.3 64.6 51.6 73.9 624 57.8 67.7 48.3 71.3 673 25-29 64.1 65.2 54.5 73.0 345 56.9 64.8 47.2 59.3 123 30-34 54.1 71.8 43.5 74.1 85 46.4 67.9 39.3 67.9 28 35-39 58.3 62.5 41.7 79.2 24 100 71.4 71.4 71.4 7 40-44 72.0 64.0 56.0 80.0 25 85.6 85.7 71.4 85.7 7 45-49 69.2 84.6 69.2 76.9 13 0 33.3 0 33.3 3 50 plus 48.3 50.8 38.3 65.0 120 46.0 57.5 32.2 54.0 87 Marital status Married 51.1 69.2 40.7 62.6 182 58.0 79.0 52.0 58.0 100 Cohabited 68.8 71.9 56.3 59.4 32 76.7 63.3 53.3 63.3 30 Divorced - - - - 0 0 50.0 0 0 3 Widowed 0 100 0 0 1 100 100 100 100 1 Separated 42.9 57.1 42.9 71.4 7 50.0 50.0 50.0 50.0 2 Single 61.0 62.8 50.3 73.5 728 59.5 68.1 48.4 71.7 519
Accommodation
parents home 52.3 68.6 49.5 65.1 109 49.4 65.4 41.2 64.7 85 Guardian 42.2 63.9 37.8 53.3 45 42.4 50.0 24.2 39.4 33 In campus hostel 59.2 64.4 49.2 70.5 593 51.4 69.1 45.6 66.7 489 Univ hostel off campus 59.2 62.4 47.9 67.0 282 53.4 60.6 41.1 61.2 219 private apartment 54.8 64.1 44.9 68.5 292 65.0 68.8 49.7 72.0 143 Academic year first year 47.9 62.5 39.8 63.5 480 45.5 64.0 37.2 66.8 301 second year 59.7 61.7 48.2 70.2 392 55.1 69.6 46.7 62.9 334 third year 64.4 66.4 53.5 69.9 396 57.6 64.4 45.2 66.0 321 fourth year 63.3 71.4 61.2 75.5 49 70.8 78.3 66.7 66.7 24 fifth year 68.4 83.3 63.2 84.2 19 50.0 62.5 37.5 50.0 8
University
UDSM 56.6 59.4 46.5 68.2 525 50.0 61.7 41.3 61.4 402 MUHAS 67.8 73.7 60.3 80.2 121 72.0 83.7 68.0 92.0 50 SUA 50.0 83.2 43.4 61.0 136 38.9 70.4 31.9 47.8 113 Mzumbe 65.2 61.2 51.7 63.8 207 65.0 67.5 50.3 72.0 157 Tumaini 53.3 62.6 44.3 71.9 167 62.5 68.4 50.7 71.3 136 SAUT 51.3 64.5 42.4
67.0
191 47.6 66.4 38.8
64.6
147
Sponsorship Government 57.5 64.7 48.0 68.6 1065 52.6 65.6 43.4 65.4 784 Private 58.7 62.9 48.9 68.2 223 56.4 68.4 45.7 63.3 188
Program mode
part time 40.0 47.4 30.0 50.0 20 60.0 70.0 50.0 80.0 10 full time 57.7 64.6 47.9 68.6 1302 53.4 66.3 44.0 65.0 981
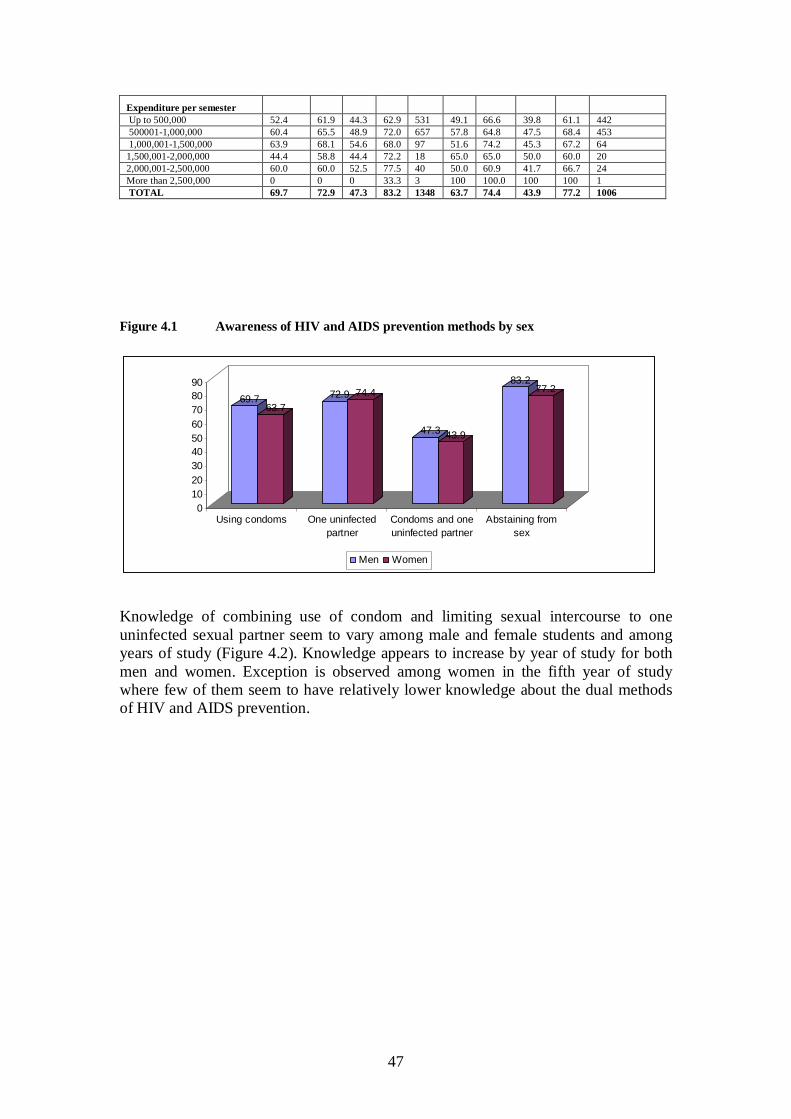
47
Expenditure per semester
Up to 500,000 52.4 61.9 44.3 62.9 531 49.1 66.6 39.8 61.1 442 500001-1,000,000 60.4 65.5 48.9 72.0 657 57.8 64.8 47.5 68.4 453 1,000,001-1,500,000 63.9 68.1 54.6 68.0 97 51.6 74.2 45.3 67.2 64 1,500,001-2,000,000 44.4 58.8 44.4 72.2 18 65.0 65.0 50.0 60.0 20 2,000,001-2,500,000 60.0 60.0 52.5 77.5 40 50.0 60.9 41.7 66.7 24 More than 2,500,000 0 0 0 33.3 3 100 100.0 100 100 1 TOTAL 69.7 72.9 47.3 83.2 1348 63.7 74.4 43.9 77.2 1006
Figure 4.1 Awareness of HIV and AIDS prevention methods by sex
69.763.7
72.9 74.4
47.3 43.9
83.277.2
0102030405060708090
Using condoms One uninfectedpartner
Condoms and oneuninfected partner
Abstaining fromsex
Men Women
Knowledge of combining use of condom and limiting sexual intercourse to one uninfected sexual partner seem to vary among male and female students and among years of study (Figure 4.2). Knowledge appears to increase by year of study for both men and women. Exception is observed among women in the fifth year of study where few of them seem to have relatively lower knowledge about the dual methods of HIV and AIDS prevention.
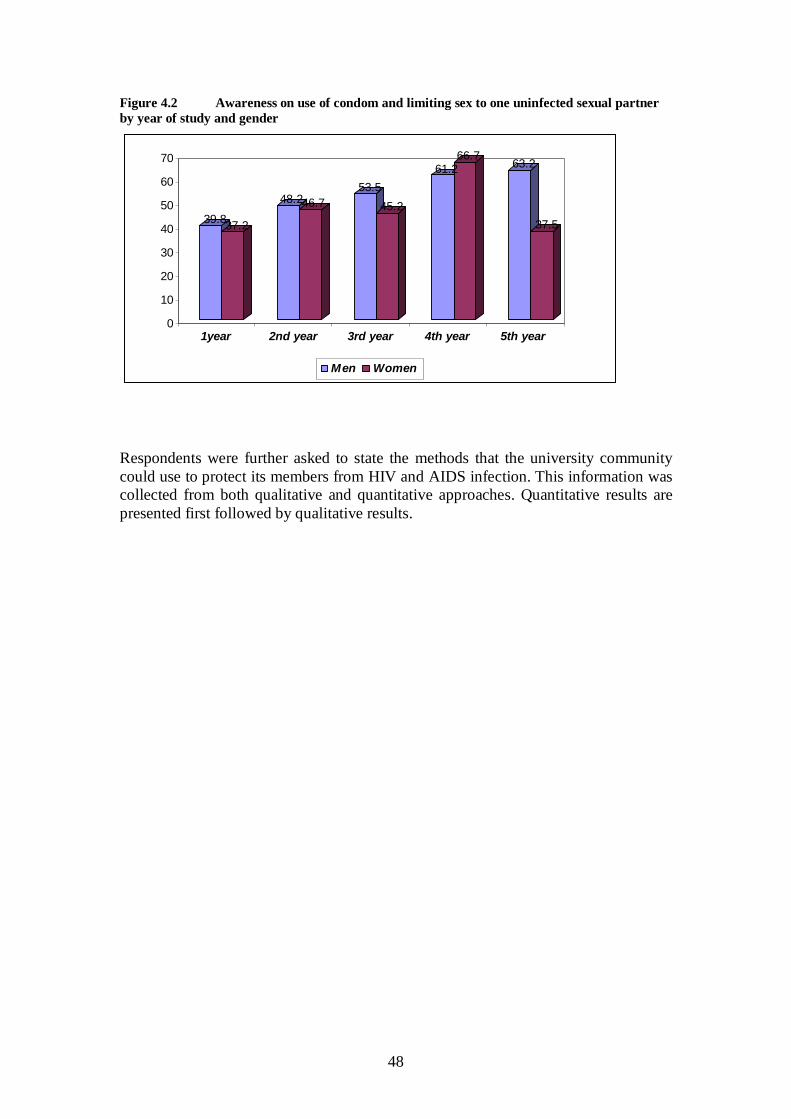
48
Figure 4.2 Awareness on use of condom and limiting sex to one uninfected sexual partner by year of study and gender
39.837.2
48.246.753.5
45.2
61.266.7
63.2
37.5
0
10
20
30
40
50
60
70
1year 2nd year 3rd year 4th year 5th year
Men Women
Respondents were further asked to state the methods that the university community could use to protect its members from HIV and AIDS infection. This information was collected from both qualitative and quantitative approaches. Quantitative results are presented first followed by qualitative results.
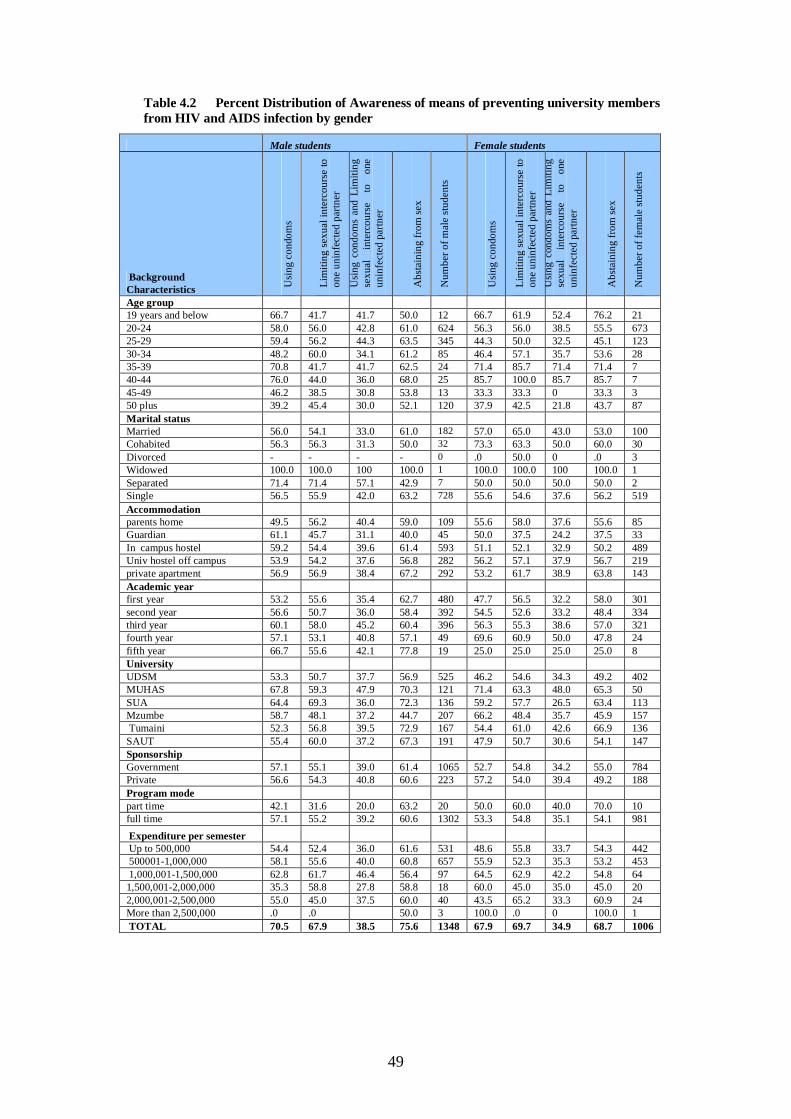
49
Table 4.2 Percent Distribution of Awareness of means of preventing university members from HIV and AIDS infection by gender
Male students Female students
Background Characteristics U
sing
con
dom
s
Lim
iting
sex
ual i
nter
cour
se to
on
e un
infe
cted
par
tner
Usi
ng c
ondo
ms
and
Lim
iting
se
xual
in
terc
ours
e to
on
e un
infe
cted
par
tner
Abs
tain
ing
from
sex
Num
ber o
f mal
e st
uden
ts
Usi
ng c
ondo
ms
Lim
iting
sex
ual i
nter
cour
se to
on
e un
infe
cted
par
tner
U
sing
con
dom
s an
d Li
miti
ng
sexu
al
inte
rcou
rse
to
one
unin
fect
ed p
artn
er
Abs
tain
ing
from
sex
Num
ber o
f fem
ale
stud
ents
Age group 19 years and below 66.7 41.7 41.7 50.0 12 66.7 61.9 52.4 76.2 21 20-24 58.0 56.0 42.8 61.0 624 56.3 56.0 38.5 55.5 673 25-29 59.4 56.2 44.3 63.5 345 44.3 50.0 32.5 45.1 123 30-34 48.2 60.0 34.1 61.2 85 46.4 57.1 35.7 53.6 28 35-39 70.8 41.7 41.7 62.5 24 71.4 85.7 71.4 71.4 7 40-44 76.0 44.0 36.0 68.0 25 85.7 100.0 85.7 85.7 7 45-49 46.2 38.5 30.8 53.8 13 33.3 33.3 0 33.3 3 50 plus 39.2 45.4 30.0 52.1 120 37.9 42.5 21.8 43.7 87 Marital status Married 56.0 54.1 33.0 61.0 182 57.0 65.0 43.0 53.0 100 Cohabited 56.3 56.3 31.3 50.0 32 73.3 63.3 50.0 60.0 30 Divorced - - - - 0 .0 50.0 0 .0 3 Widowed 100.0 100.0 100 100.0 1 100.0 100.0 100 100.0 1 Separated 71.4 71.4 57.1 42.9 7 50.0 50.0 50.0 50.0 2 Single 56.5 55.9 42.0 63.2 728 55.6 54.6 37.6 56.2 519 Accommodation parents home 49.5 56.2 40.4 59.0 109 55.6 58.0 37.6 55.6 85 Guardian 61.1 45.7 31.1 40.0 45 50.0 37.5 24.2 37.5 33 In campus hostel 59.2 54.4 39.6 61.4 593 51.1 52.1 32.9 50.2 489 Univ hostel off campus 53.9 54.2 37.6 56.8 282 56.2 57.1 37.9 56.7 219 private apartment 56.9 56.9 38.4 67.2 292 53.2 61.7 38.9 63.8 143 Academic year first year 53.2 55.6 35.4 62.7 480 47.7 56.5 32.2 58.0 301 second year 56.6 50.7 36.0 58.4 392 54.5 52.6 33.2 48.4 334 third year 60.1 58.0 45.2 60.4 396 56.3 55.3 38.6 57.0 321 fourth year 57.1 53.1 40.8 57.1 49 69.6 60.9 50.0 47.8 24 fifth year 66.7 55.6 42.1 77.8 19 25.0 25.0 25.0 25.0 8 University UDSM 53.3 50.7 37.7 56.9 525 46.2 54.6 34.3 49.2 402 MUHAS 67.8 59.3 47.9 70.3 121 71.4 63.3 48.0 65.3 50 SUA 64.4 69.3 36.0 72.3 136 59.2 57.7 26.5 63.4 113 Mzumbe 58.7 48.1 37.2 44.7 207 66.2 48.4 35.7 45.9 157 Tumaini 52.3 56.8 39.5 72.9 167 54.4 61.0 42.6 66.9 136 SAUT 55.4 60.0 37.2 67.3 191 47.9 50.7 30.6 54.1 147 Sponsorship Government 57.1 55.1 39.0 61.4 1065 52.7 54.8 34.2 55.0 784 Private 56.6 54.3 40.8 60.6 223 57.2 54.0 39.4 49.2 188 Program mode part time 42.1 31.6 20.0 63.2 20 50.0 60.0 40.0 70.0 10 full time 57.1 55.2 39.2 60.6 1302 53.3 54.8 35.1 54.1 981 Expenditure per semester Up to 500,000 54.4 52.4 36.0 61.6 531 48.6 55.8 33.7 54.3 442 500001-1,000,000 58.1 55.6 40.0 60.8 657 55.9 52.3 35.3 53.2 453 1,000,001-1,500,000 62.8 61.7 46.4 56.4 97 64.5 62.9 42.2 54.8 64 1,500,001-2,000,000 35.3 58.8 27.8 58.8 18 60.0 45.0 35.0 45.0 20 2,000,001-2,500,000 55.0 45.0 37.5 60.0 40 43.5 65.2 33.3 60.9 24 More than 2,500,000 .0 .0 50.0 3 100.0 .0 0 100.0 1 TOTAL 70.5 67.9 38.5 75.6 1348 67.9 69.7 34.9 68.7 1006

50
Trust in one’s ability to protect one from AIDS infections or the ability of the university to protect its members from AIDS infections may influence one’s attitudes towards the services offered by the university. Table 4.3 presents the findings on one’s and university’s ability to prevent its members against AIDS infections. The results show that majority of male and female students believe that they are capable of protecting themselves from HIV infections. However, fewer of them believe that the university can protect its members from AIDS infections. Analysis by selected background characteristics did not show any significant variations.
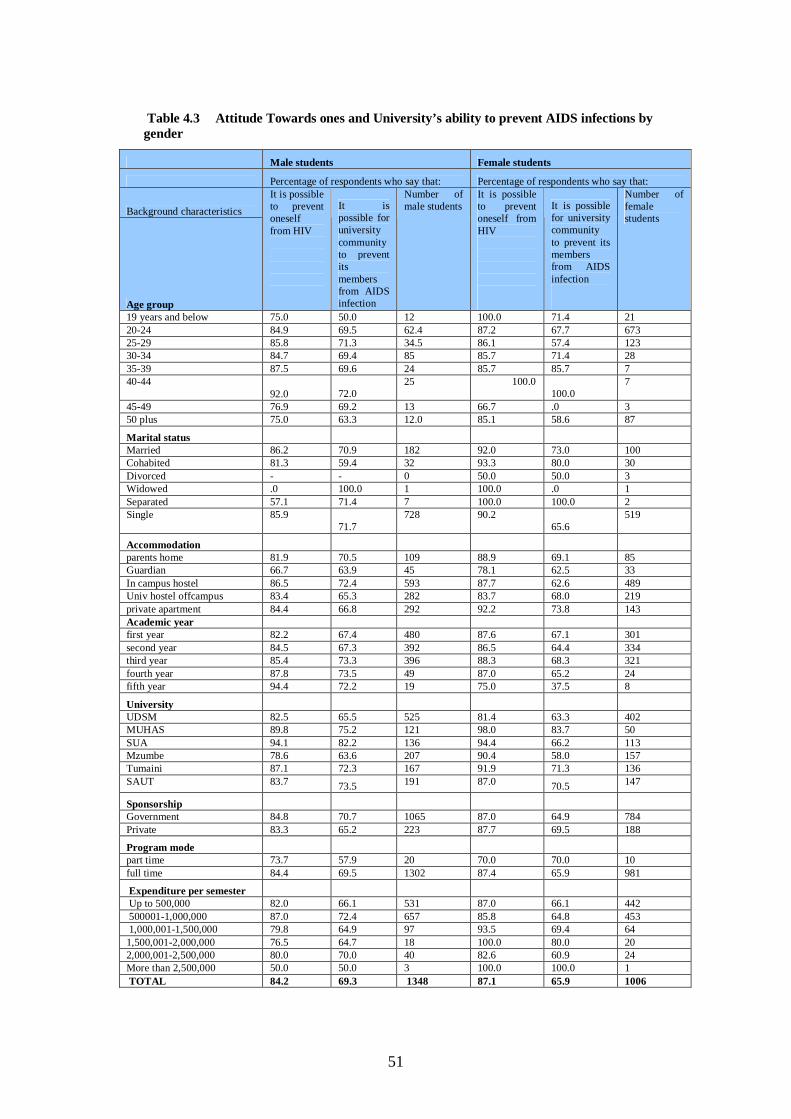
51
Table 4.3 Attitude Towards ones and University’s ability to prevent AIDS infections by gender
Male students Female students
Percentage of respondents who say that: Percentage of respondents who say that:
Background characteristics
Age group
It is possible to prevent oneself from HIV
It is possible for university community to prevent its members from AIDS infection
Number of male students
It is possible to prevent oneself from HIV
It is possible for university community to prevent its members from AIDS infection
Number of female students
19 years and below 75.0 50.0 12 100.0 71.4 21 20-24 84.9 69.5 62.4 87.2 67.7 673 25-29 85.8 71.3 34.5 86.1 57.4 123 30-34 84.7 69.4 85 85.7 71.4 28 35-39 87.5 69.6 24 85.7 85.7 7 40-44
92.0 72.0 25 100.0
100.0 7
45-49 76.9 69.2 13 66.7 .0 3 50 plus 75.0 63.3 12.0 85.1 58.6 87
Marital status
Married 86.2 70.9 182 92.0 73.0 100 Cohabited 81.3 59.4 32 93.3 80.0 30 Divorced - - 0 50.0 50.0 3 Widowed .0 100.0 1 100.0 .0 1 Separated 57.1 71.4 7 100.0 100.0 2 Single 85.9
71.7 728 90.2
65.6 519
Accommodation
parents home 81.9 70.5 109 88.9 69.1 85 Guardian 66.7 63.9 45 78.1 62.5 33 In campus hostel 86.5 72.4 593 87.7 62.6 489 Univ hostel offcampus 83.4 65.3 282 83.7 68.0 219 private apartment 84.4 66.8 292 92.2 73.8 143 Academic year first year 82.2 67.4 480 87.6 67.1 301 second year 84.5 67.3 392 86.5 64.4 334 third year 85.4 73.3 396 88.3 68.3 321 fourth year 87.8 73.5 49 87.0 65.2 24 fifth year 94.4 72.2 19 75.0 37.5 8
University
UDSM 82.5 65.5 525 81.4 63.3 402 MUHAS 89.8 75.2 121 98.0 83.7 50 SUA 94.1 82.2 136 94.4 66.2 113 Mzumbe 78.6 63.6 207 90.4 58.0 157 Tumaini 87.1 72.3 167 91.9 71.3 136 SAUT 83.7 73.5 191 87.0 70.5 147
Sponsorship
Government 84.8 70.7 1065 87.0 64.9 784 Private 83.3 65.2 223 87.7 69.5 188
Program mode
part time 73.7 57.9 20 70.0 70.0 10 full time 84.4 69.5 1302 87.4 65.9 981
Expenditure per semester
Up to 500,000 82.0 66.1 531 87.0 66.1 442 500001-1,000,000 87.0 72.4 657 85.8 64.8 453 1,000,001-1,500,000 79.8 64.9 97 93.5 69.4 64 1,500,001-2,000,000 76.5 64.7 18 100.0 80.0 20 2,000,001-2,500,000 80.0 70.0 40 82.6 60.9 24 More than 2,500,000 50.0 50.0 3 100.0 100.0 1 TOTAL 84.2 69.3 1348 87.1 65.9 1006

52
Data collected by using qualitative methods show that universities vary in the way they sensitize their community members to protect themselves against HIV and AIDS infection. An in-depth interview with one of the Deans of Students revealed that some universities object the use of condom and regard students who use condom as sexual deviants:
Here at the university, we don’t teach our students to use what you call protective gears…….our emphasis is on sexual abstinence till marriage….but not all students adhere to our teachings and these are the ones who cause trouble in our sexual socialization strategies (IDI, Dean of students)
Our field visits and discussions with university authorities also showed that public universities distribute several brands of condoms in the halls of residence, cafeteria and public toilets and others being sold in the bookshops and other shops within and around the campus,
Distribution of condoms is done by our fellow students. You find that distribution of one box of condoms in one hall of residence takes a maximum of three days. So we think this is a success on our side….we used to print T-shirts and other IEC materials to promote condoms use but now most of the students are using condoms because we keep on stocking in and stocking out….( IDI, Student HIV and AIDS club Leader)
The situation was different for Faith based universities where they prohibit promotion, sale and use of condom in the university premises:
We will join forces in your campaign against HIV and AIDS but we are not going to allow you to promote condoms here. Our students can still be good citizens without using condoms (IDI, University Administrator)
4.2.1 Rejection of Misconceptions about HIV and AIDS Apart from determining knowledge on the effective ways that can be used to avoid getting HIV and AIDS infections, this study also sought information about students’ incorrect beliefs about HIV and AIDS transmission. This information would assist in establishing the magnitude of misconceptions and how to eliminate them. Two most common local misconceptions include AIDS can be transmitted by mosquito bites and a person can become infected by sharing utensils with a person who has AIDS. Other misconceptions include the belief that one can be infected with AIDS by shaking hands with infected person and that one gets AIDS by sharing toilet with someone who is infected by AIDS. Students were asked about these misconceptions and their responses are presented in Tables 4.5.1 and 4.5.2. The results show that less than half of students interviewed knew that a healthy looking person can have the AIDS virus (46 percent). Put it in another way, few students know that an HIV-infected person does not necessarily show signs of infection. Comparatively, a slightly higher proportion of female students than male students reject the misconception that a healthy looking person cannot have AIDS (45 percent male students and 47 percent female students).
4.2.2 Comprehensive knowledge about HIV and AIDS Assessment of students’ comprehensive knowledge about HIV transmission and prevention was measured by developing a knowledge composite index which had five items. Comprehensive knowledge means knowing that consistent use of condoms
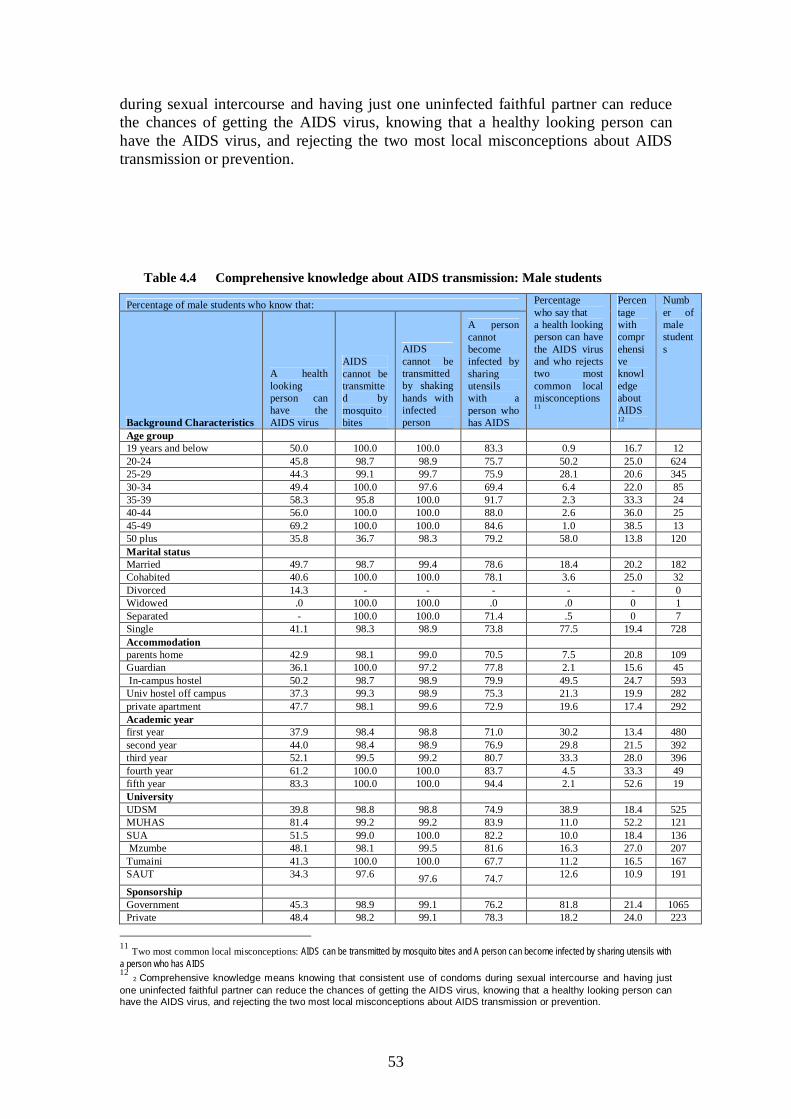
53
during sexual intercourse and having just one uninfected faithful partner can reduce the chances of getting the AIDS virus, knowing that a healthy looking person can have the AIDS virus, and rejecting the two most local misconceptions about AIDS transmission or prevention.
Table 4.4 Comprehensive knowledge about AIDS transmission: Male students
Percentage of male students who know that:
Background Characteristics
A health looking person can have the AIDS virus
AIDS cannot be transmitted by mosquito bites
AIDS cannot be transmitted by shaking hands with infected person
A person cannot become infected by sharing utensils with a person who has AIDS
Percentage who say that a health looking person can have the AIDS virus and who rejects two most common local misconceptions11
Percentage with comprehensive knowledge about AIDS12
Number of male students
Age group 19 years and below 50.0 100.0 100.0 83.3 0.9 16.7 12 20-24 45.8 98.7 98.9 75.7 50.2 25.0 624 25-29 44.3 99.1 99.7 75.9 28.1 20.6 345 30-34 49.4 100.0 97.6 69.4 6.4 22.0 85 35-39 58.3 95.8 100.0 91.7 2.3 33.3 24 40-44 56.0 100.0 100.0 88.0 2.6 36.0 25 45-49 69.2 100.0 100.0 84.6 1.0 38.5 13 50 plus 35.8 36.7 98.3 79.2 58.0 13.8 120 Marital status Married 49.7 98.7 99.4 78.6 18.4 20.2 182 Cohabited 40.6 100.0 100.0 78.1 3.6 25.0 32 Divorced 14.3 - - - - - 0 Widowed .0 100.0 100.0 .0 .0 0 1 Separated - 100.0 100.0 71.4 .5 0 7 Single 41.1 98.3 98.9 73.8 77.5 19.4 728 Accommodation parents home 42.9 98.1 99.0 70.5 7.5 20.8 109 Guardian 36.1 100.0 97.2 77.8 2.1 15.6 45 In-campus hostel 50.2 98.7 98.9 79.9 49.5 24.7 593 Univ hostel off campus 37.3 99.3 98.9 75.3 21.3 19.9 282 private apartment 47.7 98.1 99.6 72.9 19.6 17.4 292 Academic year first year 37.9 98.4 98.8 71.0 30.2 13.4 480 second year 44.0 98.4 98.9 76.9 29.8 21.5 392 third year 52.1 99.5 99.2 80.7 33.3 28.0 396 fourth year 61.2 100.0 100.0 83.7 4.5 33.3 49 fifth year 83.3 100.0 100.0 94.4 2.1 52.6 19 University UDSM 39.8 98.8 98.8 74.9 38.9 18.4 525 MUHAS 81.4 99.2 99.2 83.9 11.0 52.2 121 SUA 51.5 99.0 100.0 82.2 10.0 18.4 136 Mzumbe 48.1 98.1 99.5 81.6 16.3 27.0 207 Tumaini 41.3 100.0 100.0 67.7 11.2 16.5 167 SAUT 34.3 97.6 97.6 74.7 12.6 10.9 191
Sponsorship Government 45.3 98.9 99.1 76.2 81.8 21.4 1065 Private 48.4 98.2 99.1 78.3 18.2 24.0 223
11 Two most common local misconceptions: AIDS can be transmitted by mosquito bites and A person can become infected by sharing utensils with a person who has AIDS 12 2 Comprehensive knowledge means knowing that consistent use of condoms during sexual intercourse and having just one uninfected faithful partner can reduce the chances of getting the AIDS virus, knowing that a healthy looking person can have the AIDS virus, and rejecting the two most local misconceptions about AIDS transmission or prevention.

54
Program mode part time 31.6 100.0 100.0 73.7 1.2 10.0 20 full time 46.3 98.7 99.0 76.5 98.8 21.8 1302 Expenditure per semester Up to 500,000 39.0 98.9 99.2 77.3 36.7 16.8 531 500001-1,000,000 50.0 98.4 99.2 76.1 52.1 24.6 657 1,000,001-1,500,000 46.8 100.0 96.8 77.7 7.1 28.3 97 1,500,001-2,000,000 58.8 100.0 100.0 58.8 .9 23.5 18 2,000,001-2,500,000 42.5 97.5 100.0 77.5 3.1 15.8 40 More than 2,500,000 .0 100.0 100.0 100.0 .1 0 3 TOTAL 45.4 98.7 99.0 78.1 55.6 21.4 1348

55
Table 4.5 Comprehensive knowledge about AIDS transmission: Female students
Percentage of male students who know that:
A health looking person can have the AIDS virus
AIDS cannot be transmitted by mosquito bites
AIDS cannot be transmitted by shaking hands with infected person
A person cannot become infected by sharing utensils with a person who has AIDS
Percentage who say that a health looking person can have the AIDS virus and who rejects two most common local misconceptions13
Percentage with comprehensive knowledge about AIDS14
Number of female students
Age group 19 years and below 66.7 95.2 100.0 90.5 3.2 38.1 21 20-24 48.2 99.4 99.4 76.5 72.8 24.2 673 25-29 48.4 99.2 100.0 65.6 10.8 15.4 123 30-34 32.1 96.4 100.0 67.9 2.9 10.7 28 35-39 42.9 100.0 100.0 100.0 1.0 42.9 7 40-44 28.6 100.0 100.0 85.7 1.0 14.3 7 45-49 33.3 100.0 100.0 100.0 .3 0 3 50 plus 39.1 97.7 98.9 67.8 7.9 9.4 87 Marital status Married 43.0 97.0 100.0 71.0 15.5 15.8 100 Cohabited 50.0 96.7 93.3 60.0 3.9 17.9 30 Divorced .0 100.0 100.0 50.0 - - 3 Widowed 100.0 100.0 100.0 100.0 .2 100 1 Separated .0 100.0 100.0 50.0 .2 0 2 Single 45.9 99.4 99.4 72.8 80.1 20.6 519 Accommodation parents home 55.6 97.5 98.8 72.8 8.8 20.5 85 Guardian 34.4 96.9 100.0 84.4 3.6 10.0 33 In campus hostel 47.0 99.1 99.4 75.7 51.4 20.9 489 niv hostel off campus 43.8 99.5 99.5 74.9 20.8 19.9 219 private apartment 48.9 99.3 100.0 70.2 15.5 21.4 143 Academic year first year 36.7 98.6 98.6 76.0 30.8 14.7 301 second year 51.0 99.0 100.0 75.6 33.7 22.0 334 third year 51.5 99.4 99.7 71.8 32.7 21.8 321 fourth year 52.2 100.0 100.0 69.6 2.2 30.4 24 fifth year 50.0 100.0 100.0 62.5 .5 14.3 8 University UDSM 37.8 99.2 99.2 75.3 38.0 14.0 402 MUHAS 91.8 100.0 100.0 83.7 6.7 60.0 50 SUA 66.2 100.0 100.0 73.2 8.1 24.5 113 Mzumbe 58.6 99.4 100.0 78.3 18.7 29.5 157 Tumaini 41.9 98.5 100.0 66.2 13.4 17.8 136 SAUT 39.7 97.9 98.6 74.7 15.1 14.6 147 Sponsorship Government 46.0 98.9 99.3 74.5 78.8 20.5 784 Private 50.8 99.5 100.0 77.5 21.2 20.0 188 Program mode part time 50.0 100.0 100.0 80.0 .9 20.0 10 full time 47.1 99.0 99.5 74.4 99.1 20.3 981 Expenditure per semester Up to 500,000 44.0 99.0 99.3 75.2 43.2 17.5 442 500001-1,000,000 50.5 99.3 99.8 75.6 45.5 24.2 453 1,000,001-1,500,000 48.4 96.8 98.4 66.1 6.2 18.3 64 1,500,001-2,000,000 50.0 100.0 100.0 65.0 2.2 5.0 20 2,000,001-2,500,000 26.1 100.0 100.0 78.3 2.7 16.7 24 More than 2,500,000 100.0 100.0 100.0 100.0 .2 100.0 1 TOTAL 47.0 99.1 99.5 76.0 44.4 20.3 1006
13 Two most common local misconceptions: AIDS can be transmitted by mosquito bites and A person can 83.7become infected by sharing utensils with a person who has AIDS 14 2 Comprehensive knowledge means knowing that consistent use of condoms during sexual intercourse and having just one uninfected faithful partner can reduce the chances of getting the AIDS virus, knowing that a healthy looking person can have the AIDS virus, and rejecting the two most local misconceptions about AIDS transmission or prevention.

56
Apart from measuring comprehensive knowledge about HIV and AIDS, a statistical test was performed to understand whether comprehensive knowledge about HIV and AIDS varied within background characteristics of the respondents. The results are shown below. Data in Table 4.6 show the mean comparison of comprehensive knowledge about HIV and AIDS within universities. The results show that there is a significant difference in comprehensive knowledge about HIV and AIDS within universities. The differences are significant for both male and female students. The results also show that male students at UDSM and female students at MUHAS are more knowledgeable than the rest.
Table 4.6 Mean Index of comprehensive knowledge by background variables
Male students Female students
Name of the university Mean N
Std. Deviation
Std. Error of Mean Mean N
Std. Deviation
Std. Error of Mean
UDSM 3.3505 525 1.13541 .04955 3.2090 402 1.09459 .05459 MUHAS 4.0826 121 1.14446 .10404 4.3600 50 .89807 .12701 SUA 3.0956 136 1.46504 .12563 2.7434 113 1.61897 .15230 Mzumbe 3.5604 207 1.15118 .08001 3.7325 157 1.09417 .08732 Tumaini 3.2635 167 1.16786 .09037 3.4044 136 1.09124 .09357 SAUT 3.1099 191 1.23265 .08919 3.2381 147 1.08118 .08917 Total 3.3779 1347 1.22039 .03325 3.3264 1006 1.20464 .03800
p=0.000 p=0.000
The data on Table 4.7 show that male students aged 40-44 years and female students aged 40-44 years seem to be more knowledgeable than male and female students in other age groups. However, this difference by age group is not statistically significant.
Table 4.7 Mean comparison within age group:
Male students Female students
Age group Mean N Std. Deviation
Std. Error of Mean Mean N
Std. Deviation
Std. Error of Mean
19 years or under 3.5833 12 1.08362 .31282 3.9524 21 .97346 .21243
20-24 3.5609 624 1.10281 .04415 3.5305 673 1.11111 .04283 25-29 3.5652 345 1.03258 .05559 3.2846 123 1.05985 .09556 30-34 3.4706 85 1.08659 .11786 3.1071 28 1.10014 .20791 35-39 3.8333 24 1.04950 .21423 4.1429 7 .89974 .34007 40-44 3.9600 25 .97809 .19562 3.8571 7 .69007 .26082 45-49 4.0000 13 1.08012 .29957 2.6667 3 1.15470 .66667 50 plus 3.2500 120 1.07101 .09777 3.0460 87 1.03326 .11078 Total 3.5441 1248 1.08040 .03058 3.4552 949 1.10491 .03587
p=0.317 p=0.198
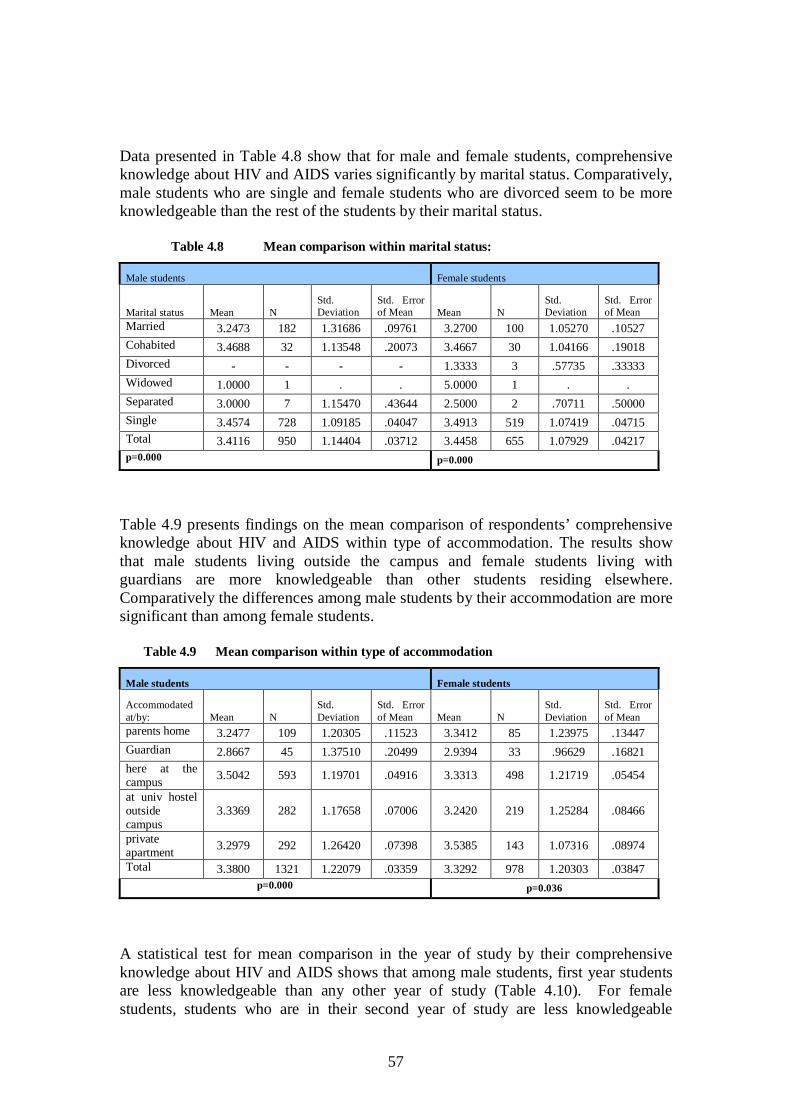
57
Data presented in Table 4.8 show that for male and female students, comprehensive knowledge about HIV and AIDS varies significantly by marital status. Comparatively, male students who are single and female students who are divorced seem to be more knowledgeable than the rest of the students by their marital status.
Table 4.8 Mean comparison within marital status:
Male students Female students
Marital status Mean N Std. Deviation
Std. Error of Mean Mean N
Std. Deviation
Std. Error of Mean
Married 3.2473 182 1.31686 .09761 3.2700 100 1.05270 .10527 Cohabited 3.4688 32 1.13548 .20073 3.4667 30 1.04166 .19018 Divorced - - - - 1.3333 3 .57735 .33333 Widowed 1.0000 1 . . 5.0000 1 . . Separated 3.0000 7 1.15470 .43644 2.5000 2 .70711 .50000 Single 3.4574 728 1.09185 .04047 3.4913 519 1.07419 .04715 Total 3.4116 950 1.14404 .03712 3.4458 655 1.07929 .04217 p=0.000 p=0.000
Table 4.9 presents findings on the mean comparison of respondents’ comprehensive knowledge about HIV and AIDS within type of accommodation. The results show that male students living outside the campus and female students living with guardians are more knowledgeable than other students residing elsewhere. Comparatively the differences among male students by their accommodation are more significant than among female students.
Table 4.9 Mean comparison within type of accommodation
Male students Female students
Accommodated at/by: Mean N
Std. Deviation
Std. Error of Mean Mean N
Std. Deviation
Std. Error of Mean
parents home 3.2477 109 1.20305 .11523 3.3412 85 1.23975 .13447 Guardian 2.8667 45 1.37510 .20499 2.9394 33 .96629 .16821 here at the campus 3.5042 593 1.19701 .04916 3.3313 498 1.21719 .05454
at univ hostel outside campus
3.3369 282 1.17658 .07006 3.2420 219 1.25284 .08466
private apartment 3.2979 292 1.26420 .07398 3.5385 143 1.07316 .08974
Total 3.3800 1321 1.22079 .03359 3.3292 978 1.20303 .03847 p=0.000 p=0.036
A statistical test for mean comparison in the year of study by their comprehensive knowledge about HIV and AIDS shows that among male students, first year students are less knowledgeable than any other year of study (Table 4.10). For female students, students who are in their second year of study are less knowledgeable

58
compared to female students of the remaining years of study. These differences by year of study however are statistically significant for male students but not for female students.
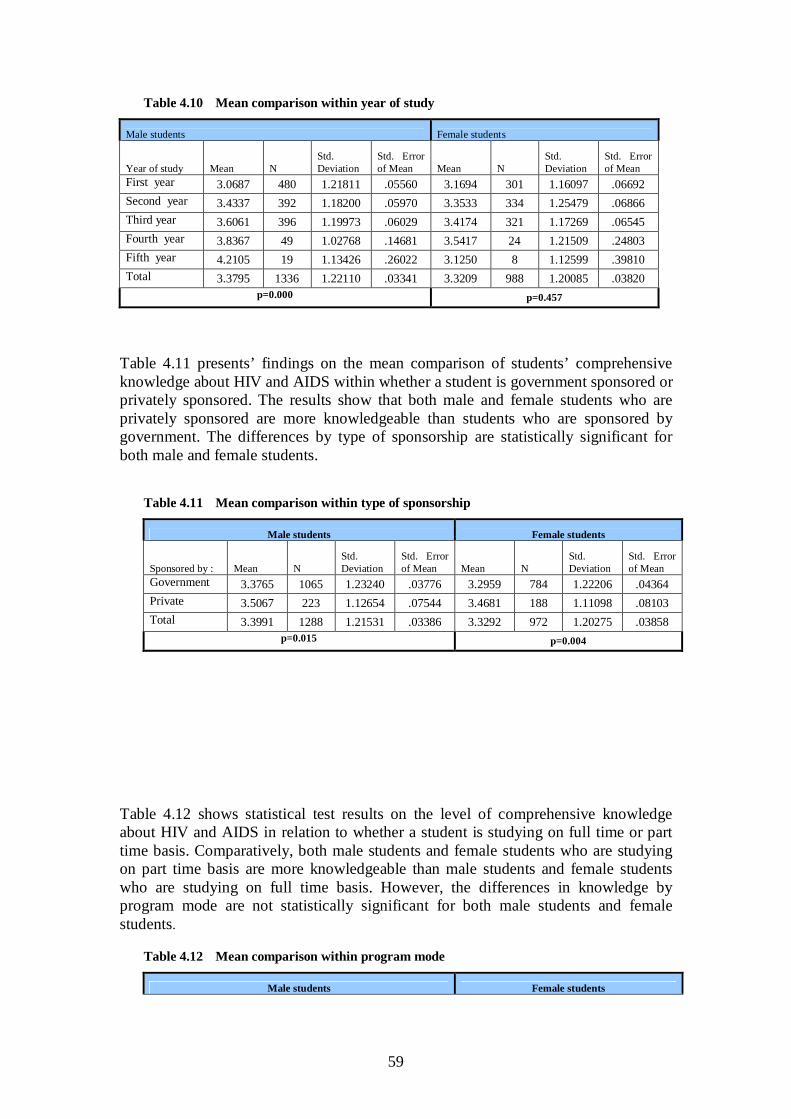
59
Table 4.10 Mean comparison within year of study
Male students Female students
Year of study Mean N Std. Deviation
Std. Error of Mean Mean N
Std. Deviation
Std. Error of Mean
First year 3.0687 480 1.21811 .05560 3.1694 301 1.16097 .06692 Second year 3.4337 392 1.18200 .05970 3.3533 334 1.25479 .06866 Third year 3.6061 396 1.19973 .06029 3.4174 321 1.17269 .06545 Fourth year 3.8367 49 1.02768 .14681 3.5417 24 1.21509 .24803 Fifth year 4.2105 19 1.13426 .26022 3.1250 8 1.12599 .39810 Total 3.3795 1336 1.22110 .03341 3.3209 988 1.20085 .03820
p=0.000 p=0.457
Table 4.11 presents’ findings on the mean comparison of students’ comprehensive knowledge about HIV and AIDS within whether a student is government sponsored or privately sponsored. The results show that both male and female students who are privately sponsored are more knowledgeable than students who are sponsored by government. The differences by type of sponsorship are statistically significant for both male and female students.
Table 4.11 Mean comparison within type of sponsorship
Table 4.12 shows statistical test results on the level of comprehensive knowledge about HIV and AIDS in relation to whether a student is studying on full time or part time basis. Comparatively, both male students and female students who are studying on part time basis are more knowledgeable than male students and female students who are studying on full time basis. However, the differences in knowledge by program mode are not statistically significant for both male students and female students.
Table 4.12 Mean comparison within program mode
Male students Female students
Male students Female students
Sponsored by : Mean N Std. Deviation
Std. Error of Mean Mean N
Std. Deviation
Std. Error of Mean
Government 3.3765 1065 1.23240 .03776 3.2959 784 1.22206 .04364 Private 3.5067 223 1.12654 .07544 3.4681 188 1.11098 .08103 Total 3.3991 1288 1.21531 .03386 3.3292 972 1.20275 .03858
p=0.015 p=0.004
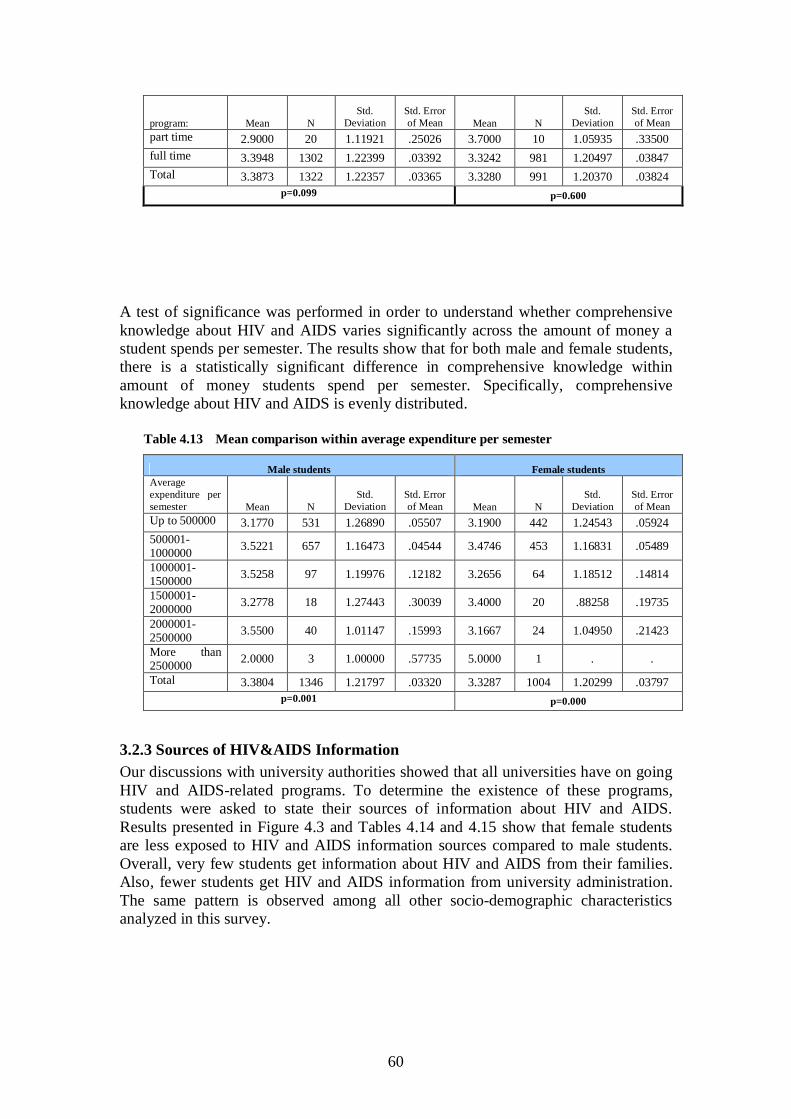
60
program: Mean N Std.
Deviation Std. Error of Mean Mean N
Std. Deviation
Std. Error of Mean
part time 2.9000 20 1.11921 .25026 3.7000 10 1.05935 .33500 full time 3.3948 1302 1.22399 .03392 3.3242 981 1.20497 .03847 Total 3.3873 1322 1.22357 .03365 3.3280 991 1.20370 .03824
p=0.099 p=0.600
A test of significance was performed in order to understand whether comprehensive knowledge about HIV and AIDS varies significantly across the amount of money a student spends per semester. The results show that for both male and female students, there is a statistically significant difference in comprehensive knowledge within amount of money students spend per semester. Specifically, comprehensive knowledge about HIV and AIDS is evenly distributed.
Table 4.13 Mean comparison within average expenditure per semester
Male students Female students Average expenditure per semester Mean N
Std. Deviation
Std. Error of Mean Mean N
Std. Deviation
Std. Error of Mean
Up to 500000 3.1770 531 1.26890 .05507 3.1900 442 1.24543 .05924 500001-1000000 3.5221 657 1.16473 .04544 3.4746 453 1.16831 .05489
1000001-1500000 3.5258 97 1.19976 .12182 3.2656 64 1.18512 .14814
1500001-2000000 3.2778 18 1.27443 .30039 3.4000 20 .88258 .19735
2000001-2500000 3.5500 40 1.01147 .15993 3.1667 24 1.04950 .21423
More than 2500000 2.0000 3 1.00000 .57735 5.0000 1 . .
Total 3.3804 1346 1.21797 .03320 3.3287 1004 1.20299 .03797 p=0.001 p=0.000
3.2.3 Sources of HIV&AIDS Information Our discussions with university authorities showed that all universities have on going HIV and AIDS-related programs. To determine the existence of these programs, students were asked to state their sources of information about HIV and AIDS. Results presented in Figure 4.3 and Tables 4.14 and 4.15 show that female students are less exposed to HIV and AIDS information sources compared to male students. Overall, very few students get information about HIV and AIDS from their families. Also, fewer students get HIV and AIDS information from university administration. The same pattern is observed among all other socio-demographic characteristics analyzed in this survey.
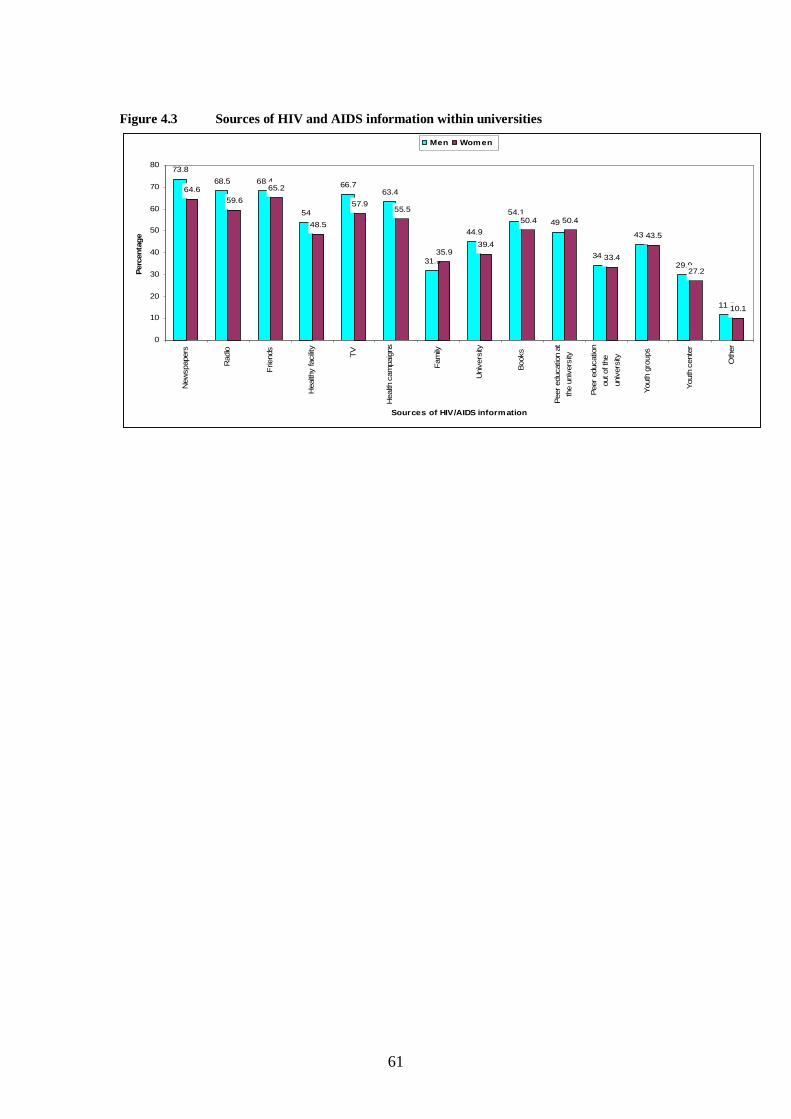
61
Figure 4.3 Sources of HIV and AIDS information within universities
73.868.5 68.4
54
66.763.4
31.9
44.9
54.149.5
34.4
43.7
29.9
11.5
64.659.6
65.2
48.5
57.955.5
35.939.4
50.4 50.4
33.4
43.5
27.2
10.1
0
10
20
30
40
50
60
70
80
New
spap
ers
Rad
io
Frie
nds
Hea
lthy
faci
lity
TV
Hea
lth c
ampa
igns
Fam
ily
Uni
vers
ity
Book
s
Peer
edu
catio
n at
the
univ
ersi
ty
Peer
edu
catio
nou
t of t
heun
iver
sity
Yout
h gr
oups
Yout
h ce
nter
Oth
er
Sources of HIV/AIDS information
Perc
enta
geMen Women

62
Table 4.14 Sources of Information about HIV and AIDS: Male students
Percent distribution of male students who reported source of message as being:
Background Characteristics N
ewsp
aper
s
Radi
o
Frie
nds
Hea
lth fa
cilit
y
TV
Hea
lth
cam
paig
n
fam
ily
univ
ersit
y
book
s
Peer
ed
ucat
ion
at th
e un
iver
sity
Peer
ed
ucat
ion
outsi
de
the
univ
ersit
y
You
th g
roup
s
You
th c
ente
rs
Oth
er s
ourc
es
Num
ber
Age group 19 years and below
75.0
50.0 50.0 58.3
50.0
50.0
41.7
33.3 58.3
50.0 33.3
25.0 25.0
8.3 12
20-24 63.7 58.8 60.5 47.1 55.6 52.7 29.7 38.3 46.9 42.1 28.9 36.8 27.0 9.6 624 25-29 66.7 64.1 60.3 51.6 63.8 60.6 27.8 43.5 49.0 47.0 32.2 41.7 28.4 9.0 345 30-34 60.0 55.3 57.6 48.2 58.8 52.9 25.9 41.2 42.4 47.1 35.3 41.2 20.0 10.6 85 35-39 62.5 54.2 50.0 29.2 58.3 54.2 20.8 33.3 41.7 50.0 20.8 20.8 12.5 16.7 24 40-44 76.0 80.0 72.0 48.0 72.0 64.0 24.0 48.0 56.0 40.0 36.0 28.0 20.0 12.0 25 45-49
30.8
30.8 23.1 23.1
30.8 69.2
0.0 7.7 23.1
15.4
7.7 38.5 .0
38.5
13 50 plus
61.7
53.3 55.8 35.0
51.7 48.3
21.7 30.8 44.2
33.3
25.0 35.0 23.3
10.0
120
Marital status Married 59.7 55.3 56.6 42.1 57.2 52.8 23.9 33.3 39.0 45.3 29.6 31.4 16.4 13.2 182 Cohabited 68.8 59.4 65.6 56.3 46.9 53.1 25.0 28.1 53.1 43.8 31.3 62.5 34.4 12.5 32 Divorced - - - - - - - - - - - - - - 0 Widowed 100.0 100 100
.0
100 .0 .0 .0
.0
.0 .0 .0
.0
.0 1
Separated 42.9 57.1 71.4 42.9 57.1 42.9 28.6 28.6 14.3 28.6 .0 28.6 .0 14.3 7 Single 64.3 60.7 59.2 46.9 58.2 55.4 27.4 40.1 49.5 42.0 28.8 38.3 28.8 9.8 728 Accommodation parents home 68.6 58.1 58.1 41.9 60.0 51.4 22.9 42.9 44.8 46.7 27.6 33.3 22.9 7.6 109 guardian 61.1 58.3 52.8 52.8 44.4 52.8 27.8 33.3 41.7 41.7 27.8 38.9 16.7 5.6 45 In campus hostel 63.8 59.0 59.4 48.4 58.5 56.3 28.1 40.6 47.3 42.8 30.6 43.3 31.3 9.5 593 a Univ hostel offcampus
60.9 59.8 57.2
46.9
55.7 55.4 26.2 66.2
44.6
36.5 25.5 31.7
20.7
11.1 282
private apartment 66.0 60.7 62.6 44.3 59.9 53.4 29.8 40.1 49.6 48.9 33.6 34.0 21.8 10.3 292 Academic year first year 63.0 59.0 56.2 49.2 58.1 51.3 27.9 37.9 44.7 43.1 31.6 37.7 26.7 10.3 480 second year 62.7 57.9 59.5 44.8 55.2 53.1 29.0 36.5 49.9 41.3 30.6 37.5 26.8 10.7 392 third year 65.6 58.7 61.4 43.4 56.9 59.8 25.1 41.3 43.9 44.4 26.7 38.6 24.3 7.4 396 fourth year 55.1 61.2 57.1 53.1 69.4 49.0 32.7 36.7 49.0 32.7 22.4 26.5 18.4 18.4 49 fifth year 94.4 94.4 83.3 77.8 94.4 83.3 44.4 61.1 88.9 77.8 66.7 66.7 44.4 11.1 19 University UDSM 59.6 58.2 54.3 43.5 55.1 47.8 23.1 29.4 43.3 33.9 24.5 30.2 22.4 10.6 525 MUHAS 78.0 71.2 75.4 66.1 73.7 74.6 47.5 56.8 60.2 53.4 46.6 51.7 43.2 5.1 121 SUA 66.3 57.4 61.4 40.6 60.4 65.3 19.8 47.5 47.5 58.4 33.7 53.5 26.7 10.9 136 Mzumbe 59.2 48.1 53.9 43.2 48.5 55.3 19.4 34.5 38.8 38.8 25.2 38.3 23.8 6.8 207 Tumaini 71.6 58.7 60.6 42.6 60.0 54.2 32.3 51.6 56.1 65.8 35.5 42.6 26.5 14.2 167 SAUT 64.5 39.9 66.9 54.8 62.7 56.6 38.0 43.4 49.4 37.3 31.9 36.7 25.9 10.8 191
Sponsorship government 64.7 60.1 60.0 47.7 59.0 55.8 27.3 39.0 46.7 43.2 31.1 38.3 27.0 9.9 1065 Private 62.0 54.3 57.5 42.1 54.3 52.0 28.5 38.5 47.1 42.1 26.7 38.9 22.2 10.9 223
Program mode part time 47.4 36.8 36.8 31.6 36.8 36.8 26.3 31.6 21.1 42.1 15.8 31.6 15.8 .0 20 full time 64.2 59.6 59.8 47.0 58.3 55.2 27.6 38.9 47.2 43.0 30.0 37.8 26.0 10.0 1302 Expenditure per semester
Up to 500,000 58.3 53.2 52.1 40.5 53.6 48.3 22.5 35.8 44.5 39.2 26.1 37.1 24.6 8.9 531 500001-1,000,000 68.7 63.9 64.1 50.9 60.8 60.0 31.6 40.8 49.4 46.4 33.7 38.0 27.1 10.1 657
1,000,001-1,500,000 62.8 62.8
64.9
47.9
59.6 53.2 26.6
41.5
44.7
44.7 25.5
41.5
25.5
13.8 97
1,500,001-2,000,000 58.8 52.9 58.8 52.9 64.7 64.7 29.4 35.3 41.2 17.6 11.8 35.3 35.3 .0 18 2,000,001-2,500,000 60.0 55.0 55.0 47.5 52.5 55.0 27.5 40.0 42.5 37.5 30.0 37.5 20.0 15.0 40 More than 2,500,000 50.0 .0 .0 50.0 50.0 .0 .0 .0 50.0 50.0 .0 .0 .0 .0 3
TOTAL 73.8
68.5
68.4
54.0
66.7 63.4
31.9
44.9
54.1
49.5 34.4
43.7
29.9
11.5 1348

63
Table 4.15 Sources of Information about HIV and AIDS: Female students Percent distribution of male students who reported source of message as being:
Background Characteristics N
ewsp
aper
s
Radi
o
Frie
nds
Hea
lth fa
cilit
y
TV
Hea
lth c
ampa
ign
fam
ily
univ
ersit
y
book
s
Peer
edu
catio
n at
the
un
iver
sity
Peer
ed
ucat
ion
outsi
de th
e un
iver
sity
You
th g
roup
s
You
th c
ente
rs
Oth
er s
ourc
es
Num
ber
Age group
19 years and below 57.1 57.1 76.2 61.9 52.4 42.9 33.3 19.0 47.6 23.8 19.0 47.6 28.6 9.5 2120-24 54.9 51.8 58.2 40.5 51.2 49.0 31.3 35.9 44.2 44.9 30.8 39.1 24.4 7.4 67325-29 56.6 51.6 45.9 41.0 41.0 42.6 27.0 26.2 38.5 41.8 23.0 36.9 23.0 13.1 12330-34 71.4 82.1 64.3 64.3 71.4 57.1 42.9 42.9 57.1 57.1 39.3 32.1 25.0 21.4 2835-39 57.1 42.9 42.9 28.6 42.9 71.4 28.6 28.6 42.9 42.9 14.3 14.3 14.3 14.3 40-44 71.4 57.1 71.4 42.9 71.4 71.4 14.3 42.9 57.1 57.1 .0 42.9 14.3 14.3 45-49 .0 .0 66.7 33.3 33.3 .0 .0 .0 .0 .0 .0 33.3 .0 .0 50 plus 56.3 37.9 47.1 42.5 46.0 44.8 32.2 31.0 40.2 35.6 26.4 28.7 18.4 8.0 87
Marital status
Married 59.0 54.0 52.0 52.0 50.0 45.0 28.0 29.0 44.0 48.0 28.0 34.0 26.0 17.0 100Cohabited 63.3 56.7 73.3 33.3 60.0 53.3 36.7 40.0 50.0 53.3 33.3 43.3 26.7 10.0 30Divorced .0 50.0 .0 50.0 .0 50.0 .0 .0 .0 .0 .0 100.0 .0 .0 Widowed 100.0 100.0 100.0 .0 100.0 100.0 100.0 100.0 100.0 100.0 100.0 100.0 100.0 .0 Separated 50.0 50.0 100.0 .0 100.0 50.0 50.0 .0 50.0 50.0 50.0 .0 .0 .0 Single 56.2 52.5 56.0
41.1
50.2 47.9 29.5 34.4
44.6
42.5 29.0 37.5
24.9
9.1 519
Accommodation
parents home 63.0 60.5 66.7 48.1 60.5 55.6 34.6 39.5 54.3 46.9 33.3 37.0 25.9 13.6 85Guardian 50.0 37.5 46.9 31.3 31.3 21.9 21.9 18.8 34.4 18.8 9.4 21.9 21.9 9.4 33In campus hostel 53.4 49.8 55.7 42.3 50.2 49.8 30.9 35.3 42.1 44.9 28.7 40.4 25.1 10.2 489Univ hosteloff campus 56.2 50.2 51.2 41.9 49.3 41.9 31.5 30.5 40.9 37.9 31.5 34.0 22.7 5.4 219private apartment 58.9 55.3 60.3 36.9 46.8 51.1 27.0 32.6 45.4 49.6 27.0 36.2 19.1 5.7 143Academic year first year 56.5 53.0 53.4 41.3 50.5 43.1 30.4 33.9 38.9 39.6 25.1 37.8 23.0 8.8 301second year 52.2 47.1 53.5 39.1 47.1 50.0 30.8 31.4 44.9 41.7 31.4 37.2 24.7 6.1 334third year 60.2 54.4 62.5 45.3 53.1 50.8 31.4 37.5 46.0 52.4 31.4 38.2 22.7 11.7 321fourth year 60.9 56.5 60.9 47.8 52.2 52.2 43.5 34.8 56.5 26.1 26.1 47.8 39.1 8.7 24fifth year 25.0 25.0 25.0 25.0 25.0 25.0 25.0 12.5 37.5 25.0 12.5 25.0 12.5 12.5
University
UDSM 50.8 47.2 52.0 38.5 48.5 37.8 28.1 24.2 37.8 34.4 26.3 33.2 19.9 7.1 402MUHAS 55.1 59.2 73.5 67.3 63.3 67.3 49.0 65.3 67.3 65.3 51.0 42.9 36.7 8.2 50SUA 57.7 59.2 54.9 38.0 50.7 47.9 31.0 31.0 42.3 63.4 25.4 46.5 21.1 11.3 113Mzumbe 58.0 44.6 59.2 43.9 51.0 66.9 31.8 38.2 42.7 43.9 29.9 43.9 28.7 12.7 157Tumini 61.0 44.1 58.1 38.2 43.4 52.2 26.5 40.4 50.7 61.0 30.9 39.0 27.2 9.6 136SAUT 61.0 69.9 56.8 44.5 54.1 43.8 35.6 39.7 45.2 33.6 26.7 34.9 20.5 6.8 147
Sponsorship
Government 56.5 52.1 55.0 42.0 50.9 47.9 30.6 33.7 43.4 46.2 29.6 38.1 24.3 9.1 784Private 54.0 48.7 62.6 41.7 46.5 48.7 32.1 35.8 44.4 35.3 26.7 36.4 22.5 8.6 188
Program mode
part time 40.0 40.0 60.0 50.0 40.0 30.0 40.0 40.0 40.0 40.0 30.0 30.0 30.0 10.0 10full time 56.1 51.7 56.1 41.7 50.1 48.2 31.0 33.8 44.0 43.8 29.0 37.8 23.7 8.8 981 Expenditure per semester
Up to 500,000 56.0 51.1 54.3 42.5 48.9 46.2 32.7 36.4 44.0 42.5 29.2 37.3 24.6 7.4 442 500001-1,000,000 54.8 50.0 57.1 40.9 49.3 50.9 29.7 32.2 42.9 45.4 29.7 38.6 27.1 9.1 453 1,000,001-1,500,000 61.3 58.1 54.8 50.0 59.7 38.7 30.6 29.0 46.8 37.1 24.2 32.3 25.5 12.9 641,500,001-2,000,000 55.0 55.0 80.0 25.0 55.0 50.0 25.0 35.0 35.0 35.0 25.0 45.0 35.3 5.0 202,000,001-2,500,000 52.2 56.5 52.2 34.8 47.8 39.1 26.1 30.4 39.1 43.5 17.4 30.4 20.0 17.4 24More than 2,500,000 100.0 100.0 100.0 100.0 100.0 100.0 100.0 100.0 100.0 100.0 100.0 .0 .0 .0 TOTAL 64.7 59.6 65.2 48.5 58.0 55.6 35.9 39.3 50.4 50.4 33.5 43.6 27.2 10.1 1006
64
Apart from the above, students also mentioned other sources of information about HIV and AIDS which included religious congregations, internet and entertainment (music and drama shows). Data from in-depth interviews and focus group discussions also show that most of the universities lack IEC materials that can be used to educate its members about HIV and AIDS. Physical visits to the health facilities, university notice boards and other places such as university shops, supermarkets and cafeteria showed serious shortage of HIV and AIDS related materials. Although 63 percent male students and 56 percent female students reported that they get information on HIV and AIDS from health campaigns conducted at the universities, qualitative studies show that universities do not organize HIV and AIDS-related campaigns. Instead, various organizations from outside the universities organize concerts, conferences and workshop at universities while the universities in turn offer venues for such activities. For some universities, university administration was reported to be actively engaged in participating in such events as guest speakers or presenting papers about HIV and AIDS status in their universities.
4.3 Attitudes relating to HIV and AIDS
4.3.1 Attitudes relating to Use of Condoms Respondents were asked if there are circumstances in which a female can insist on the use of condoms before having sex with a partner other than her husband. The results are presented in Tables 4.16. The results generally indicate about nine in ten female and male students believe that females can insist on the use of condoms before having sex with a partner other than their husband. Amongst the responding universities, MUHAS students show highest confidence (94% for males and 91.5% for females). Analysis by age groups shows that there is a small difference between male and female students in believing that more female students than male students can insist on the use of condoms before having sex with a partner other than her husband. Data in Table 4.16 shows that males also plays their roles in reducing sexual transmitted diseases as there are circumstances where a man can insist on condom use before sex with a woman other than his wife. In general, over 80% of both the male and female believe that there are circumstances where man can insist in condom use before sex with a woman other than his wife.
4.3.2 Successful Refusal to have Sex without Condoms Data on successful refusal to sex without condoms also presented in Table 4.16 and Figure 4.4. About 39% of the respondents were able to successfully refuse sex without condoms. The percent of those indicating to have refused range from 14% for SAUT female students to 53.7% for MUHAS females.
65
Successful refusal to sex without condoms is of particular importance as HIV in Tanzania is mainly transmitted through heterosexual contact. Furthermore data presented in Table 4.16 indicates the profiles of the university students who reported successful refusal to sex without condoms. The data indicate generally more than 50% of the students have successful refusal to sex without condoms. For males, this behavioral pattern varies significantly with age group, marital status and name of university. Thus analyzing data on successful refusal to sex without condoms is a way to understand individual’s capability of not exposed to the risk of infection with the HIV virus. Detailed findings on successful refusal to sex without condoms for both males and females are presented in Table 4.16. .
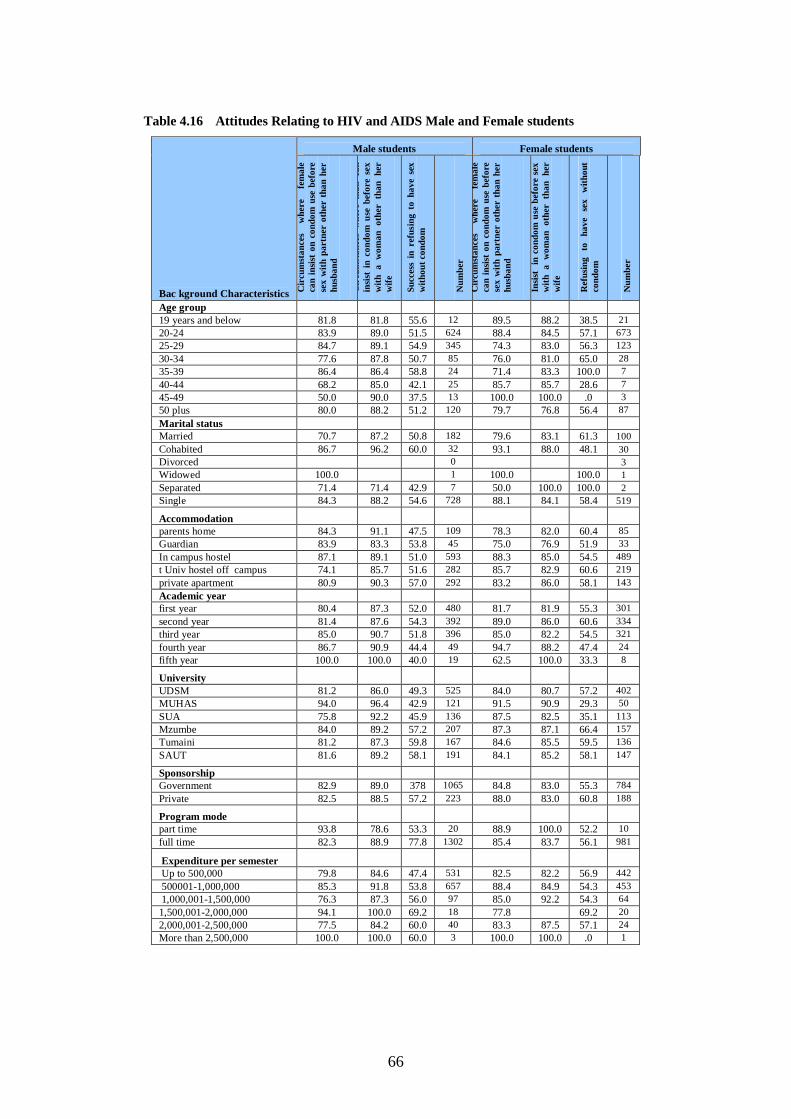
66
Table 4.16 Attitudes Relating to HIV and AIDS Male and Female students
Male students Female students
Bac kground Characteristics Cir
cum
stan
ces
whe
re
fem
ale
can
insis
t on
con
dom
use
bef
ore
sex
with
par
tner
oth
er t
han
her
husb
and
Cir
cum
stan
ces
whe
re m
an c
an
insis
t in
con
dom
use
bef
ore
sex
with
a w
oman
oth
er t
han
her
wife
Succ
ess
in r
efus
ing
to h
ave
sex
with
out c
ondo
m
Num
ber
Cir
cum
stan
ces
whe
re
fem
ale
can
insis
t on
con
dom
use
bef
ore
sex
with
par
tner
oth
er t
han
her
husb
and
Insis
t in
con
dom
use
bef
ore
sex
with
a w
oman
oth
er t
han
her
wife
Ref
usin
g to
ha
ve
sex
with
out
cond
om
Num
ber
Age group 19 years and below 81.8 81.8 55.6 12 89.5 88.2 38.5 21 20-24 83.9 89.0 51.5 624 88.4 84.5 57.1 673 25-29 84.7 89.1 54.9 345 74.3 83.0 56.3 123 30-34 77.6 87.8 50.7 85 76.0 81.0 65.0 28 35-39 86.4 86.4 58.8 24 71.4 83.3 100.0 7 40-44 68.2 85.0 42.1 25 85.7 85.7 28.6 7 45-49 50.0 90.0 37.5 13 100.0 100.0 .0 3 50 plus 80.0 88.2 51.2 120 79.7 76.8 56.4 87 Marital status Married 70.7 87.2 50.8 182 79.6 83.1 61.3 100 Cohabited 86.7 96.2 60.0 32 93.1 88.0 48.1 30 Divorced 0 3 Widowed 100.0 1 100.0 100.0 1 Separated 71.4 71.4 42.9 7 50.0 100.0 100.0 2 Single 84.3 88.2 54.6 728 88.1 84.1 58.4 519
Accommodation
parents home 84.3 91.1 47.5 109 78.3 82.0 60.4 85 Guardian 83.9 83.3 53.8 45 75.0 76.9 51.9 33 In campus hostel 87.1 89.1 51.0 593 88.3 85.0 54.5 489 t Univ hostel off campus 74.1 85.7 51.6 282 85.7 82.9 60.6 219 private apartment 80.9 90.3 57.0 292 83.2 86.0 58.1 143 Academic year first year 80.4 87.3 52.0 480 81.7 81.9 55.3 301 second year 81.4 87.6 54.3 392 89.0 86.0 60.6 334 third year 85.0 90.7 51.8 396 85.0 82.2 54.5 321 fourth year 86.7 90.9 44.4 49 94.7 88.2 47.4 24 fifth year 100.0 100.0 40.0 19 62.5 100.0 33.3 8
University
UDSM 81.2 86.0 49.3 525 84.0 80.7 57.2 402 MUHAS 94.0 96.4 42.9 121 91.5 90.9 29.3 50 SUA 75.8 92.2 45.9 136 87.5 82.5 35.1 113 Mzumbe 84.0 89.2 57.2 207 87.3 87.1 66.4 157 Tumaini 81.2 87.3 59.8 167 84.6 85.5 59.5 136 SAUT 81.6 89.2 58.1 191 84.1 85.2 58.1 147
Sponsorship Government 82.9 89.0 378 1065 84.8 83.0 55.3 784 Private 82.5 88.5 57.2 223 88.0 83.0 60.8 188
Program mode
part time 93.8 78.6 53.3 20 88.9 100.0 52.2 10 full time 82.3 88.9 77.8 1302 85.4 83.7 56.1 981
Expenditure per semester
Up to 500,000 79.8 84.6 47.4 531 82.5 82.2 56.9 442 500001-1,000,000 85.3 91.8 53.8 657 88.4 84.9 54.3 453 1,000,001-1,500,000 76.3 87.3 56.0 97 85.0 92.2 54.3 64 1,500,001-2,000,000 94.1 100.0 69.2 18 77.8 69.2 20 2,000,001-2,500,000 77.5 84.2 60.0 40 83.3 87.5 57.1 24 More than 2,500,000 100.0 100.0 60.0 3 100.0 100.0 .0 1

67
Also, analysis of successful refusal to have sex without condom by number of sexual partners in the last 12 months show that more male students than female students who had one partner in the last 12 months had successfully refused to have sex without using condom. Among respondents with two or more partners in the last 12 months, more male students than female students who had two or more partners in the last 12 months successfully refused to have sex without using condom. Implicitly, ability to negotiate for safer sex is higher among female students with two or more partners than male students with same number of sexual partners.
Figure 4.4 Respondents who successfully refused to have sex without using condom by number of sexual partners in last 12 months
42
64
38
69
01020304050607080
one partner two or more partners Number of partners
Perc
enta
ge
Men Women

68
CHAPTER 5 HIV AND AIDS-RELATED BEHAVIOUR
5.1 Overview This chapter investigated HIV and AIDS related behavior in the selected universities. It reports findings on:
Age at first sexual intercourse Recent sexual activity Multiple sexual partners and higher-risk sex Transactional sex Voluntary HIV counseling and testing, Prevalence of sexually transmitted infections, Violence and threats in sexual relations and Prevalence of drug and alcohol consumption Mobility and sex-related behaviour
The above issues have been analyzed by the selected socio-demographic variables of age, marital status, accommodation, and academic year, name of the university, sponsorship and program mode.
5.2 Age at First Sexual Intercourse Age at first sexual intercourse is of particular importance because HIV in Tanzania is mainly transmitted through heterosexual contact. Thus analyzing data on age at first sex help understand when individuals are first exposed to the risk of infection with the HIV virus. Table 4.1 indicates the profiles of the university students who reported to have had penetrative sex. The data indicate that generally over three quarters (82% males vs. 66.7% females) have had penetrative sex. The median age at first sex for male students is 19 years (minimum 6 years and maximum 32 years) and for female students is 20 years (minimum 8 years and maximum 29 years) The results show that increasingly people start sexual activity at a younger age. For example, among males aged 20-49 nine percent had sex before they were 15, while 18% had sex before 18 and 23% had sex by age 20. Males initiate sexual intercourse somewhat earlier than females. The age at first sexual intercourse varies significantly with universities for both male and females, age groups for both males and females, accommodation for males, marital status for females and income for both males and females. It is not significantly related to academic year for both males and females, program mode for both males and females, accommodation for females, sponsorship for both males and females and marital status for males.

69
Table 5.1 Age at First sexual intercourse
Consensual sex at first sexual intercourse was investigated and the results are presented in Table 5.2. Generally, consensual sex was high for both males and females with 80.5% and 85% respectively.
Chi-square results indicate that consensual sex significantly varies with universities, academic year, accommodation, marital status and income for males. It is not significantly related to universities, academic year for females, program mode for both males and females, accommodation for females, sponsorship for both males and females marital status for females and income for females.
Percent Distribution of respondents by their age at first sexual intercouse
Background Characteristics Age 15
Age 16-18
Age 19-20
Age 21-22
Age 23-24
Age 25 and above
Percentage who never had intercourse
Number
Male students Age group 19 years or under 10.0 .0 0 .0 0 0 16.9 12 20-24 10.4 19.8 18.6 12.6 3.6 0 21.8 600 25-29 7.4 21.1 18.5 5.2 6.3 41.5 19.1 327 30-34 6.5 15.6 13.0 3.9 1.3 59.7 6.1 82 35-39 9.5 19.0 9.5 .0 9.5 52.4 8.7 23 40-44 9.1 13.6 9.1 13.6 .0 54.5 8.3 24 45-49 10.0 20.0 50.0 .0 .0 20.0 0 10 50 plus 5.8 11.6 5.8 9.3 4.7 62.8 0 104 TOTAL 2.5 14.1 13.4 6.7 2.8 3.6 17.6 1182 Female students Age group 19 years or under 9.1 36.4 0 .0 .0 0 38.9 18 20-24 4.5 16.4 33.0 23.1 5.0 0 35.5 626 25-29 2.3 15.1 19.8 10.5 18.6 33.7 25.9 116 30-34 11.1 .0 5.6 16.7 27.8 38.9 33.3 27 35-39 .0 .0 .0 .0 .0 100.0 0 7 40-44 .0 .0 .0 16.7 16.7 66.7 14.3 7 45-49 .0 50.0 .0 .0 .0 50.0 0 2 50 plus 1.9 7.7 17.3 19.2 3.8 50.0 0 76 TOTAL 1.2 8.9 17.9 12.5 5.0 2.7 33.3 879
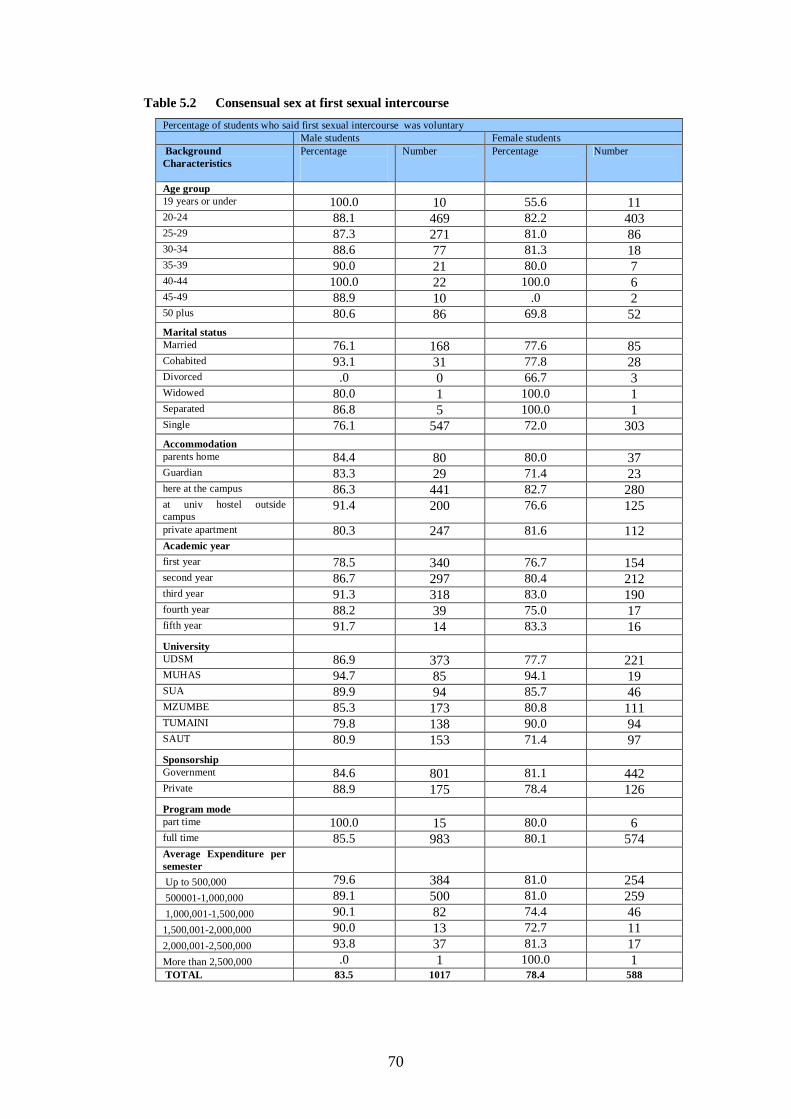
70
Table 5.2 Consensual sex at first sexual intercourse Percentage of students who said first sexual intercourse was voluntary Male students Female students Background Characteristics
Percentage
Number Percentage
Number
Age group 19 years or under 100.0 10 55.6 11 20-24 88.1 469 82.2 403 25-29 87.3 271 81.0 86 30-34 88.6 77 81.3 18 35-39 90.0 21 80.0 7 40-44 100.0 22 100.0 6 45-49 88.9 10 .0 2 50 plus 80.6 86 69.8 52 Marital status Married 76.1 168 77.6 85 Cohabited 93.1 31 77.8 28 Divorced .0 0 66.7 3 Widowed 80.0 1 100.0 1 Separated 86.8 5 100.0 1 Single 76.1 547 72.0 303 Accommodation parents home 84.4 80 80.0 37 Guardian 83.3 29 71.4 23 here at the campus 86.3 441 82.7 280 at univ hostel outside campus
91.4 200 76.6 125
private apartment 80.3 247 81.6 112 Academic year first year 78.5 340 76.7 154 second year 86.7 297 80.4 212 third year 91.3 318 83.0 190 fourth year 88.2 39 75.0 17 fifth year 91.7 14 83.3 16 University UDSM 86.9 373 77.7 221 MUHAS 94.7 85 94.1 19 SUA 89.9 94 85.7 46 MZUMBE 85.3 173 80.8 111 TUMAINI 79.8 138 90.0 94 SAUT 80.9 153 71.4 97 Sponsorship Government 84.6 801 81.1 442 Private 88.9 175 78.4 126 Program mode part time 100.0 15 80.0 6 full time 85.5 983 80.1 574 Average Expenditure per semester
Up to 500,000 79.6 384 81.0 254 500001-1,000,000 89.1 500 81.0 259 1,000,001-1,500,000 90.1 82 74.4 46 1,500,001-2,000,000 90.0 13 72.7 11 2,000,001-2,500,000 93.8 37 81.3 17 More than 2,500,000 .0 1 100.0 1 TOTAL 83.5 1017 78.4 588

71
5.3 Condom Use at First Sex Previous studies have shown that first sexual intercourse is always unsafe (Kopoka, 2008; Tungaraza et al, 2009). In this study we investigated the extent to which university students used condom at their first sexual intercourse. Table 5.3 shows the results for condom use at first sexual intercourse. The results show that the percentage of those who reportedly used condom at first intercourse is a cause for concern because it is on the low side. For example, for single people, it is 46.3% for males and 58.4 for females. The proportion of females reporting to have used condom at first sexual intercourse is higher than that for males. For the 20-24 age category, for example, more than half of females (56.6 %) compared to 48.6 for males used condom at first sex. Chi-square analysis indicates that the use of condom the first time of sexual intercourse varies significantly with universities for males, age group for males, accommodation for females, and sponsorship for males and income for males. It is not significantly related to universities for females, academic year for females, program mode for both males and females, accommodation for both males and females, sponsorship for females, marital status for both males and females and income for females. Figure 5.1 and Table 5.4 show the main reasons given for using condom at the first sexual intercourse. Overall, majority of both males and females used condom mainly for prevention of HIV (74.1%) or pregnancy (69.5%). Less than half of respondents used condom for prevention of STIs (46%) or because they did not trust their partners (26%). Comparatively, more males than females used condom at first sex in order to prevent HIV infections (72% males vs. 70% females). Conversely, more females than males used condom at first sex in order to prevent pregnancy (64% males vs. 72% females).

72
Figure: 5.1 Use of condom at first sexual intercourse by reasons for condom use
63.772.4
42.5
24.7
3.7
72 69.6
43.5
21.6
1.50
1020304050607080
To preventpregnancy
For prevention ofHIV
For prevention ofSTIs
Don’t trust eachothetr
Other reasons
Reasons
Per
cent
age
Men Women
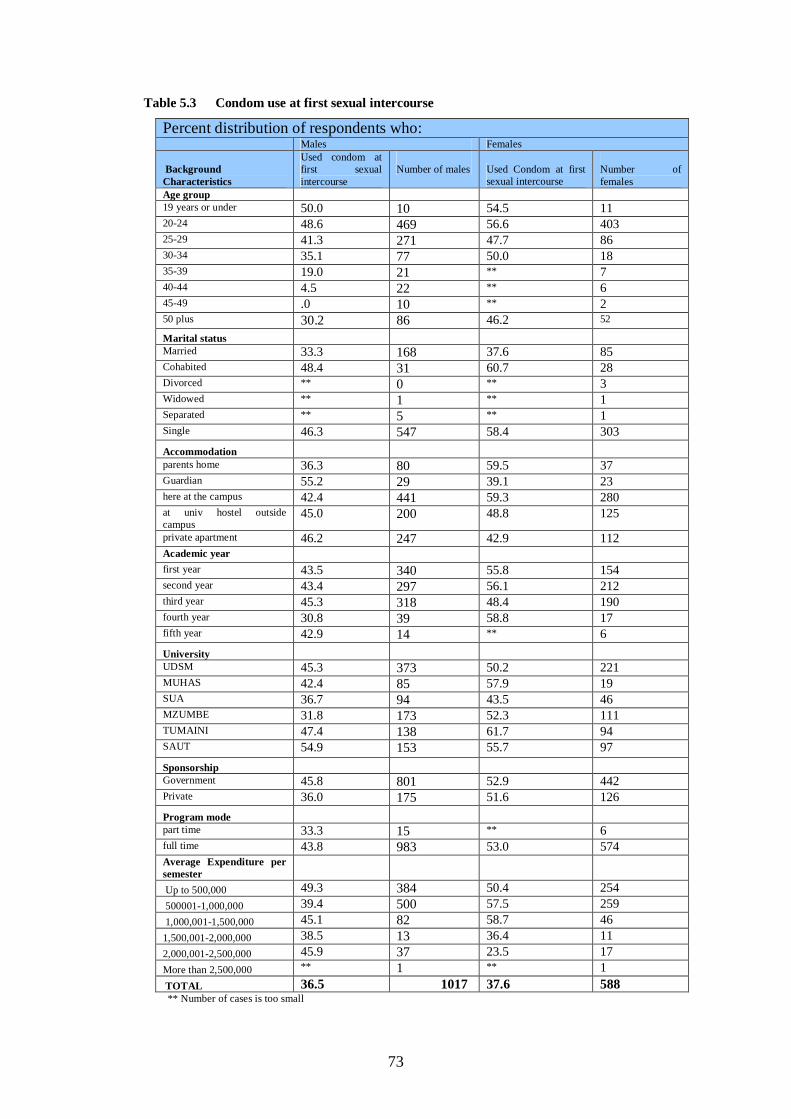
73
Table 5.3 Condom use at first sexual intercourse
Percent distribution of respondents who: Males Females
Background Characteristics
Used condom at first sexual intercourse
Number of males Used Condom at first
sexual intercourse
Number of females
Age group 19 years or under 50.0 10 54.5 11 20-24 48.6 469 56.6 403 25-29 41.3 271 47.7 86 30-34 35.1 77 50.0 18 35-39 19.0 21 ** 7 40-44 4.5 22 ** 6 45-49 .0 10 ** 2 50 plus 30.2 86 46.2 52
Marital status Married 33.3 168 37.6 85 Cohabited 48.4 31 60.7 28 Divorced ** 0 ** 3 Widowed ** 1 ** 1 Separated ** 5 ** 1 Single 46.3 547 58.4 303 Accommodation
parents home 36.3 80 59.5 37 Guardian 55.2 29 39.1 23 here at the campus 42.4 441 59.3 280 at univ hostel outside campus
45.0 200 48.8 125
private apartment 46.2 247 42.9 112 Academic year first year 43.5 340 55.8 154 second year 43.4 297 56.1 212 third year 45.3 318 48.4 190 fourth year 30.8 39 58.8 17 fifth year 42.9 14 ** 6 University
UDSM 45.3 373 50.2 221 MUHAS 42.4 85 57.9 19 SUA 36.7 94 43.5 46 MZUMBE 31.8 173 52.3 111 TUMAINI 47.4 138 61.7 94 SAUT 54.9 153 55.7 97 Sponsorship Government 45.8 801 52.9 442 Private 36.0 175 51.6 126 Program mode
part time 33.3 15 ** 6 full time 43.8 983 53.0 574 Average Expenditure per semester
Up to 500,000 49.3 384 50.4 254 500001-1,000,000 39.4 500 57.5 259 1,000,001-1,500,000 45.1 82 58.7 46 1,500,001-2,000,000 38.5 13 36.4 11 2,000,001-2,500,000 45.9 37 23.5 17 More than 2,500,000 ** 1 ** 1 TOTAL 36.5 1017 37.6 588 ** Number of cases is too small
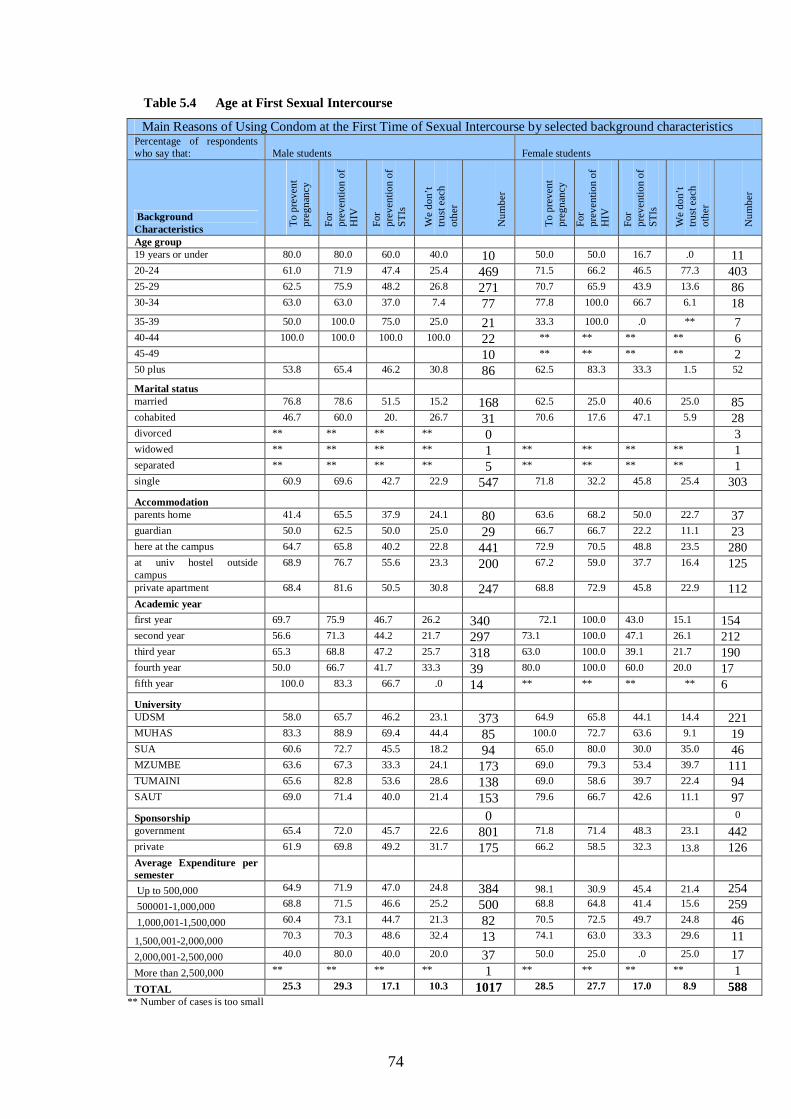
74
Table 5.4 Age at First Sexual Intercourse
Main Reasons of Using Condom at the First Time of Sexual Intercourse by selected background characteristics Percentage of respondents who say that: Male students Female students
Background Characteristics To
pre
vent
pr
egna
ncy
For
prev
entio
n of
H
IV
For
prev
entio
n of
ST
Is
We
don’
t tru
st e
ach
othe
r
Num
ber
To p
reve
nt
preg
nanc
y
For
prev
entio
n of
H
IV
For
prev
entio
n of
ST
Is
We
don’
t tru
st e
ach
othe
r
Num
ber
Age group 19 years or under 80.0 80.0 60.0 40.0 10 50.0 50.0 16.7 .0 11 20-24 61.0 71.9 47.4 25.4 469 71.5 66.2 46.5 77.3 403 25-29 62.5 75.9 48.2 26.8 271 70.7 65.9 43.9 13.6 86 30-34 63.0 63.0 37.0 7.4 77 77.8 100.0 66.7 6.1 18 35-39 50.0 100.0 75.0 25.0 21 33.3 100.0 .0 ** 7 40-44 100.0 100.0 100.0 100.0 22 ** ** ** ** 6 45-49 10 ** ** ** ** 2 50 plus 53.8 65.4 46.2 30.8 86 62.5 83.3 33.3 1.5 52
Marital status married 76.8 78.6 51.5 15.2 168 62.5 25.0 40.6 25.0 85 cohabited 46.7 60.0 20. 26.7 31 70.6 17.6 47.1 5.9 28 divorced ** ** ** ** 0 3 widowed ** ** ** ** 1 ** ** ** ** 1 separated ** ** ** ** 5 ** ** ** ** 1 single 60.9 69.6 42.7 22.9 547 71.8 32.2 45.8 25.4 303 Accommodation
parents home 41.4 65.5 37.9 24.1 80 63.6 68.2 50.0 22.7 37 guardian 50.0 62.5 50.0 25.0 29 66.7 66.7 22.2 11.1 23 here at the campus 64.7 65.8 40.2 22.8 441 72.9 70.5 48.8 23.5 280 at univ hostel outside campus
68.9 76.7 55.6 23.3 200 67.2 59.0 37.7 16.4 125
private apartment 68.4 81.6 50.5 30.8 247 68.8 72.9 45.8 22.9 112 Academic year first year 69.7 75.9 46.7 26.2 340 72.1 100.0 43.0 15.1 154 second year 56.6 71.3 44.2 21.7 297 73.1 100.0 47.1 26.1 212 third year 65.3 68.8 47.2 25.7 318 63.0 100.0 39.1 21.7 190 fourth year 50.0 66.7 41.7 33.3 39 80.0 100.0 60.0 20.0 17 fifth year 100.0 83.3 66.7 .0 14 ** ** ** ** 6 University
UDSM 58.0 65.7 46.2 23.1 373 64.9 65.8 44.1 14.4 221 MUHAS 83.3 88.9 69.4 44.4 85 100.0 72.7 63.6 9.1 19 SUA 60.6 72.7 45.5 18.2 94 65.0 80.0 30.0 35.0 46 MZUMBE 63.6 67.3 33.3 24.1 173 69.0 79.3 53.4 39.7 111 TUMAINI 65.6 82.8 53.6 28.6 138 69.0 58.6 39.7 22.4 94 SAUT 69.0 71.4 40.0 21.4 153 79.6 66.7 42.6 11.1 97 Sponsorship 0 0 government 65.4 72.0 45.7 22.6 801 71.8 71.4 48.3 23.1 442 private 61.9 69.8 49.2 31.7 175 66.2 58.5 32.3 13.8 126 Average Expenditure per semester
Up to 500,000 64.9 71.9 47.0 24.8 384 98.1 30.9 45.4 21.4 254 500001-1,000,000 68.8 71.5 46.6 25.2 500 68.8 64.8 41.4 15.6 259 1,000,001-1,500,000 60.4 73.1 44.7 21.3 82 70.5 72.5 49.7 24.8 46 1,500,001-2,000,000 70.3 70.3 48.6 32.4 13 74.1 63.0 33.3 29.6 11 2,000,001-2,500,000 40.0 80.0 40.0 20.0 37 50.0 25.0 .0 25.0 17 More than 2,500,000 ** ** ** ** 1 ** ** ** ** 1 TOTAL 25.3 29.3 17.1 10.3 1017 28.5 27.7 17.0 8.9 588
** Number of cases is too small
75
The study was also interested in knowing who suggested the use of condom between the two partners. Table 5.5 shows use of condom at first sexual intercourse by who suggested the use of condom. The results show significant variation in responses among males and females. The results also show that majority (55%) of male students than female students reported that it was them who suggested the use of condom.

76
Table 5.5 Age at First Sexual Intercourse: who suggested use of condom
Percentage of respondents who say that use of condom at first sexual intercourse was suggested by: Males Females
Background Characteristics M
ysel
f
My
partn
er
Join
t de
cisi
on
Num
ber
of M
ales
Mys
elf
My
partn
er
Join
t de
cisi
on
Num
ber
of
Fem
ales
Age group 19 years or under ** ** ** 10 33.3 .0 66.7 11 20-24 57.2 6.8 36.0 469 31.0 8.4 2.3 403 25-29 50.5 4.6 43.1 271 34.1 7.3 59.7 86 30-34 50.0 16.7 33.3 77 55.6 11.1 58.5 18 35-39 100.0 .0 .0 21 ** ** ** 7 40-44 100.0 .0 .0 22 ** ** ** 6 45-49 ** ** ** 10 ** ** ** 2 50 plus 76.0 .0 24.0 86 58.3 12.5 29.2 52
Marital status married 70.0 10.0 20.0 168 28.1 12.5 59.4 85 cohabited 28.6 7.1 64.3 31 29.4 .0 70.6 28 divorced - - - 0 ** ** ** 3 widowed ** ** ** 1 ** ** ** 1 separated 100.0 .0 .0 5 100.0 .0 .0 1 single 57.3 5.2 37.1 547 36.9 8.5 54.0 303 Accommodation parents home 40.7 7.4 51.9 80 27.3 4.5 68.2 37 guardian 56.3 .0 43.8 29 88.9 11.1 .0 23 here at the campus 58.2 5.1 36.7 441 21.7 9.6 67.5 280 at univ hostel outside campus 59.1 6.8 31.8 200 50.8 8.5 40.7 125 private apartment 54.4 6.7 38.9 247 43.8 8.3 47.9 112 Academic year first year 58.5 3.4 37.3 340 39.5 8.1 52.3 154 second year 54.3 11.8 33.1 297 31.4 11.0 56.8 212 third year 56.1 2.9 41.0 318 34.1 6.6 58.2 190 fourth year 63.6 9.1 27.3 39 30.0 10.0 60.0 17 fifth year 50.0 .0 50.0 14 ** ** ** 6 University UDSM 57.9 7.3 33.5 373 35.5 10.0 54.5 221 MUHAS 51.4 2.9 45.7 85 27.3 .0 72.7 19 SUA 61.3 6.5 32.3 94 40.0 10.0 50.0 46 MZUMBE 60.8 2.0 37.3 173 20.7 6.9 69.0 111 TUMAINI 64.3 7.1 28.6 138 39.7 12.1 48.3 94 SAUT 41.2 5.9 52.9 153 39.6 5.7 54.7 97 Sponsorship government 55.6 6.0 37.8 801 33.0 7.3 59.2 442 private 54.2 6.8 39.0 175 37.5 14.1 46.9 126 Program mode part time 20.0 20.0 60.0 15 ** ** ** 6 full time 56.5 5.9 37.2 983 34.4 8.3 56.6 574 Average Expenditure per semester
Up to 500,000 53.5 5.0 40.9 384 32.0 10.2 57.0 254 500001-1,000,000 59.2 6.8 33.5 500 34.0 7.5 57.8 259 1,000,001-1,500,000 48.6 5.7 45.7 82 44.4 11.1 44.4 46 1,500,001-2,000,000 75.0 .0 25.0 13 50.0 .0 50.0 11 2,000,001-2,500,000 58.8 5.9 35.3 37 25.0 .0 75.0 17 More than 2,500,000 ** ** ** 1 ** ** ** 1 TOTAL 54.8 8 37.7 1017 35.5 9.2 54.3 588
** Number of cases is too small
77
Further to the foregoing the non-use of condom was also interrogated to establish the one who suggested not using condom at first sexual intercourse. The findings are presented in Table 5.6 The results in Table 5.6 show that for three in every ten males and two in every ten females, condom use was not discussed at first sexual intercourse. Also the proportion of males who reported that they are the ones who suggested not using condom is twice that of females who claimed being the ones who suggested not using condom. In addition more male partners than female partners are likely to object the use of condom at first sexual intercourse.

78
Table 5.6 Age at First Sexual Intercourse: Suggestion of non-use of condom
Percentage of respondents who say that non-use of condom at first sexual intercourse was suggested by: Male students Female students
Background Characteristics M
ysel
f
My
partn
er
Join
t de
cisi
on
Not
di
scus
sed
Num
ber
Mys
elf
My
partn
er
Join
t de
cisi
on
Not
di
scus
sed
Num
ber
Age group 19 years or under .0 33.3 .0 66.7 10 .0 .0 100.0 .0 11 20-24 30.9 4.5 17.4 44.4 469 14.0 17.8 22.5 45.0 403 25-29 23.9 3.5 15.9 54.9 271 3.1 6.3 31.3 59.4 86 30-34 28.1 3.1 15.6 53.1 77 16.7 16.7 50.0 16.7 18 35-39 44.4 .0 22.2 22.2 21 .0 .0 50.0 .0 7 40-44 27.3 9.1 18.2 36.4 22 50.0 .0 .0 50.0 6 45-49 .0 .0 .0 100.0 10 .0 .0 .0 100.0 2 50 plus 15.6 6.3 18.8 46.9 86 25.0 .0 12.5 37.5 52
Marital status Married 20.7 5.2 24.1 46.6 168 18.9 8.1 29.7 37.8 85 Cohabited 40.0 .0 26.7 33.3 31 11.1 .0 33.3 55.6 28 Divorced 0 .0 50.0 .0 50.0 3 Widowed 1 1 Separated .0 .0 33.3 33.3 5 .0 .0 100.0 .0 1 Single 32.5 4.9 12.8 45.8 547 11.9 22.6 20.2 44.0 303 Accommodation parents home 40.0 .0 25.7 31.4 80 22.2 22.2 .0 44.4 37 Guardian 20.0 20.0 20.0 40.0 29 11.1 11.1 11.1 66.7 23 here at the campus 22.9 3.6 19.3 51.8 441 10.8 18.1 25.3 44.6 280 at univ hostel outside campus 33.3 6.7 9.3 42.7 200 15.9 15.9 15.9 50.0 125 private apartment 25.8 3.2 15.1 53.8 247 12.2 9.8 39.0 39.0 112 Academic year first year 28.0 5.1 20.3 42.4 340 10.8 24.3 24.3 37.8 154 second year 32.8 7.4 15.6 41.0 297 14.3 14.3 30.0 40.0 212 third year 22.1 1.6 13.9 60.7 318 14.3 14.3 17.1 52.9 190 fourth year 17.6 .0 23.5 52.9 39 14.3 14.3 14.3 57.1 17 fifth year 33.3 .0 .0 33.3 14 .0 .0 33.3 66.7 6 University
UDSM 31.9 6.4 15.6 43.3 373 12.7 15.2 24.1 46.8 221 MUHAS 25.7 .0 8.6 62.9 85 14.3 14.3 14.3 57.1 19 SUA 16.2 .0 18.9 62.2 94 20.0 10.0 20.0 45.0 46 MZUMBE 25.9 1.2 21.0 46.9 173 8.1 21.6 24.3 43.2 111 TUMAINI 29.5 6.8 20.5 38.6 138 13.0 17.4 34.8 34.8 94 SAUT 22.7 9.1 13.6 52.3 153 16.0 12.0 24.0 48.0 97 Sponsorship Government 28.0 3.3 17.1 48.4 801 13.7 15.1 48.6 48.6 442 Private 20.3 6.8 16.9 50.8 175 11.9 16.7 31.0 31.0 126 Program mode part time 37.5 12.5 25.0 25.0 15 .0 .0 100.0 .0 6 full time 27.0 4.1 16.8 48.6 983 13.3 16.0 24.5 44.7 574 Average Expenditure per semester
Up to 500,000 32.8 6.6 21.3 35.2 384 12.5 15.9 26.1 43.2 254 500001-1,000,000 23.5 3.8 16.0 53.5 500 13.9 13.9 25.3 46.8 259 1,000,001-1,500,000 33.3 3.7 14.8 48.1 82 10.0 20.0 20.0 40.0 46 1,500,001-2,000,000 40.0 .0 .0 60.0 13 .0 16.7 16.7 66.7 11 2,000,001-2,500,000 20.0 .0 .0 73.3 37 28.6 28.6 .0 42.9 17 More than 2,500,000 1 .0 .0 100.0 .0 1 TOTAL 28.6 6.1 17.3 42.9 1017 13 15.9 25.6 41.9 588
79
5.4 Recent Sexual Activity The respondents were asked when they last had sex. The results in Table 5.7 and Figure 5.2 show that large proportion of both males and females were sexually active within four weeks prior the survey. Considering the age groups, sexual activities within the last four weeks vary by age groups of university students. In younger age groups (19 years or younger to 24 years) more female than male students had sex within the last four weeks (Figure 5.2) in middle and old age groups, more male students than female students had sex within the last four weeks prior the survey.
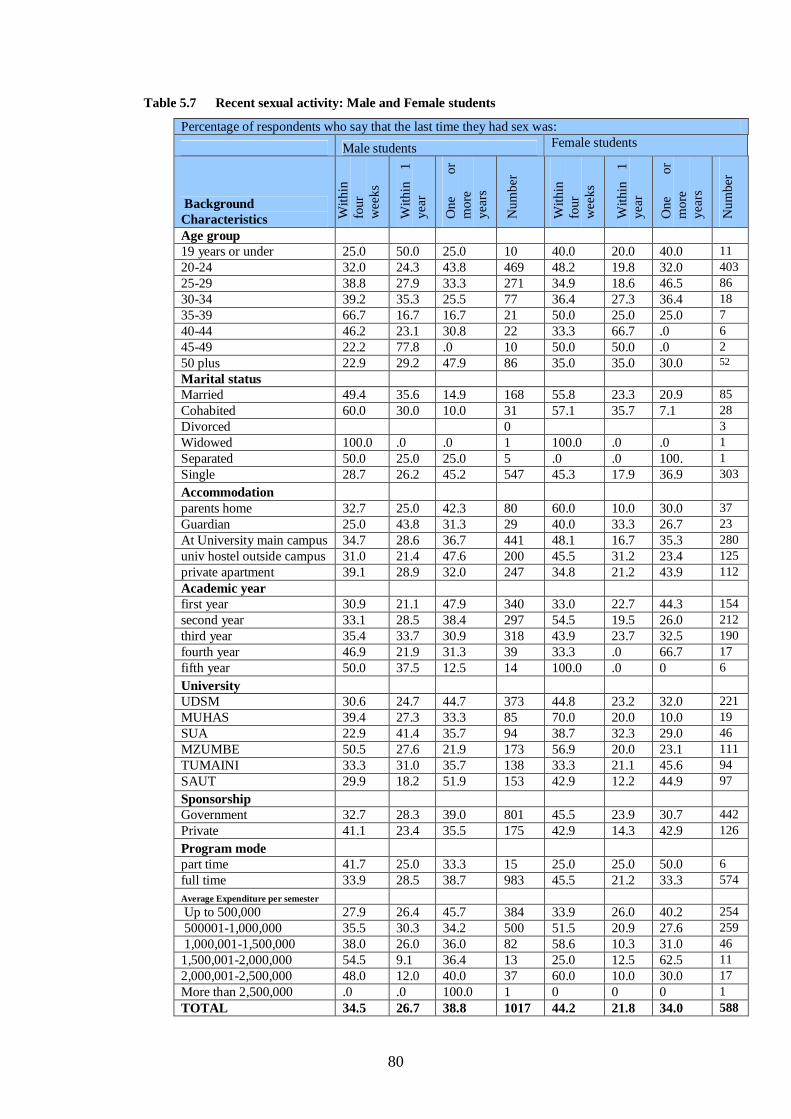
80
Table 5.7 Recent sexual activity: Male and Female students
Percentage of respondents who say that the last time they had sex was: Male students Female students
Background Characteristics W
ithin
fo
ur
wee
ks
With
in
1 ye
ar
One
or
m
ore
year
s
Num
ber
With
in
four
w
eeks
With
in
1 ye
ar
One
or
m
ore
year
s
Num
ber
Age group 19 years or under 25.0 50.0 25.0 10 40.0 20.0 40.0 11 20-24 32.0 24.3 43.8 469 48.2 19.8 32.0 403 25-29 38.8 27.9 33.3 271 34.9 18.6 46.5 86 30-34 39.2 35.3 25.5 77 36.4 27.3 36.4 18 35-39 66.7 16.7 16.7 21 50.0 25.0 25.0 7 40-44 46.2 23.1 30.8 22 33.3 66.7 .0 6 45-49 22.2 77.8 .0 10 50.0 50.0 .0 2 50 plus 22.9 29.2 47.9 86 35.0 35.0 30.0 52
Marital status
Married 49.4 35.6 14.9 168 55.8 23.3 20.9 85 Cohabited 60.0 30.0 10.0 31 57.1 35.7 7.1 28 Divorced 0 3 Widowed 100.0 .0 .0 1 100.0 .0 .0 1 Separated 50.0 25.0 25.0 5 .0 .0 100. 1 Single 28.7 26.2 45.2 547 45.3 17.9 36.9 303 Accommodation
parents home 32.7 25.0 42.3 80 60.0 10.0 30.0 37 Guardian 25.0 43.8 31.3 29 40.0 33.3 26.7 23 At University main campus 34.7 28.6 36.7 441 48.1 16.7 35.3 280 univ hostel outside campus 31.0 21.4 47.6 200 45.5 31.2 23.4 125 private apartment 39.1 28.9 32.0 247 34.8 21.2 43.9 112 Academic year
first year 30.9 21.1 47.9 340 33.0 22.7 44.3 154 second year 33.1 28.5 38.4 297 54.5 19.5 26.0 212 third year 35.4 33.7 30.9 318 43.9 23.7 32.5 190 fourth year 46.9 21.9 31.3 39 33.3 .0 66.7 17 fifth year 50.0 37.5 12.5 14 100.0 .0 0 6 University
UDSM 30.6 24.7 44.7 373 44.8 23.2 32.0 221 MUHAS 39.4 27.3 33.3 85 70.0 20.0 10.0 19 SUA 22.9 41.4 35.7 94 38.7 32.3 29.0 46 MZUMBE 50.5 27.6 21.9 173 56.9 20.0 23.1 111 TUMAINI 33.3 31.0 35.7 138 33.3 21.1 45.6 94 SAUT 29.9 18.2 51.9 153 42.9 12.2 44.9 97 Sponsorship
Government 32.7 28.3 39.0 801 45.5 23.9 30.7 442 Private 41.1 23.4 35.5 175 42.9 14.3 42.9 126 Program mode
part time 41.7 25.0 33.3 15 25.0 25.0 50.0 6 full time 33.9 28.5 38.7 983 45.5 21.2 33.3 574 Average Expenditure per semester Up to 500,000 27.9 26.4 45.7 384 33.9 26.0 40.2 254 500001-1,000,000 35.5 30.3 34.2 500 51.5 20.9 27.6 259 1,000,001-1,500,000 38.0 26.0 36.0 82 58.6 10.3 31.0 46 1,500,001-2,000,000 54.5 9.1 36.4 13 25.0 12.5 62.5 11 2,000,001-2,500,000 48.0 12.0 40.0 37 60.0 10.0 30.0 17 More than 2,500,000 .0 .0 100.0 1 0 0 0 1 TOTAL 34.5 26.7 38.8 1017 44.2 21.8 34.0 588
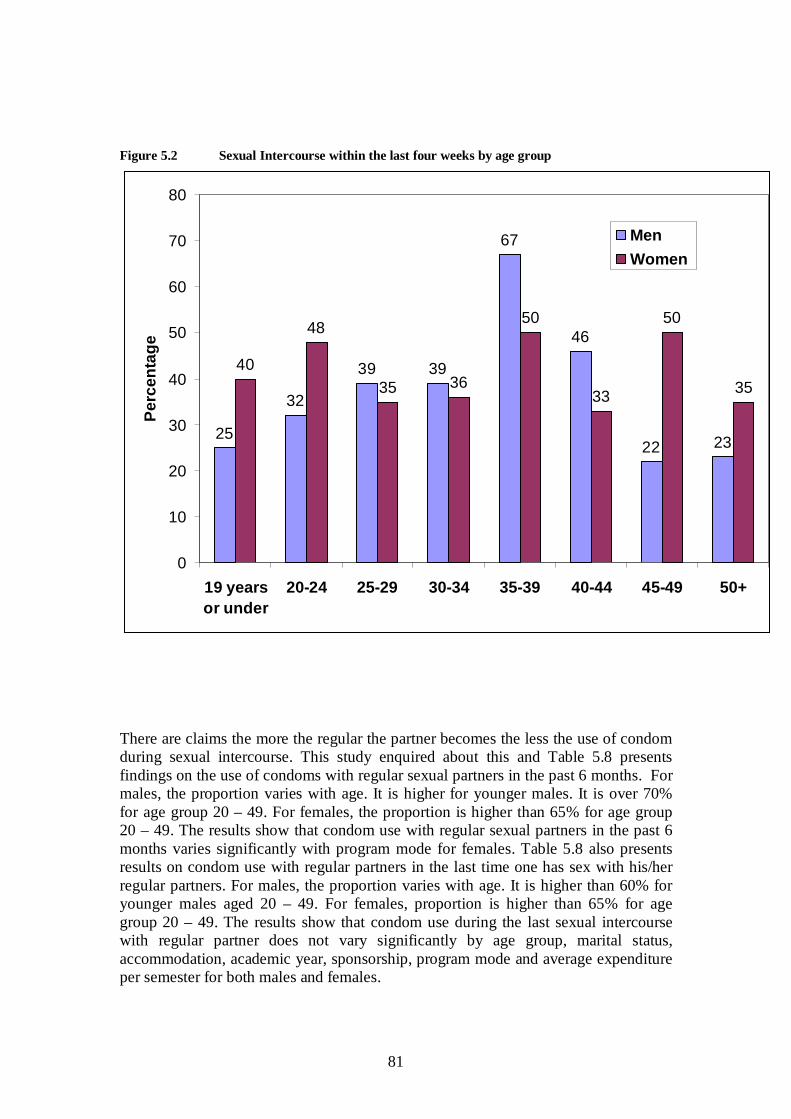
81
Figure 5.2 Sexual Intercourse within the last four weeks by age group
25
32
39 39
67
46
22 23
40
48
35 36
50
33
50
35
0
10
20
30
40
50
60
70
80
19 yearsor under
20-24 25-29 30-34 35-39 40-44 45-49 50+
Perc
enta
ge
MenWomen
There are claims the more the regular the partner becomes the less the use of condom during sexual intercourse. This study enquired about this and Table 5.8 presents findings on the use of condoms with regular sexual partners in the past 6 months. For males, the proportion varies with age. It is higher for younger males. It is over 70% for age group 20 – 49. For females, the proportion is higher than 65% for age group 20 – 49. The results show that condom use with regular sexual partners in the past 6 months varies significantly with program mode for females. Table 5.8 also presents results on condom use with regular partners in the last time one has sex with his/her regular partners. For males, the proportion varies with age. It is higher than 60% for younger males aged 20 – 49. For females, proportion is higher than 65% for age group 20 – 49. The results show that condom use during the last sexual intercourse with regular partner does not vary significantly by age group, marital status, accommodation, academic year, sponsorship, program mode and average expenditure per semester for both males and females.

82
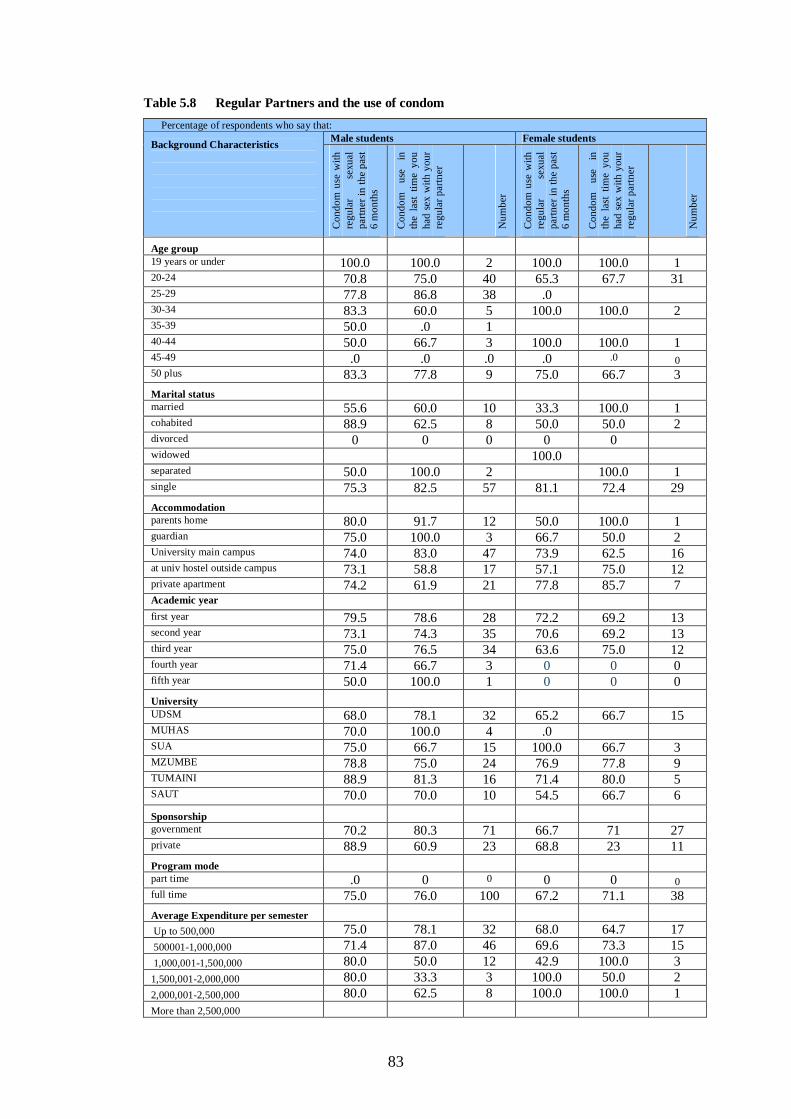
83
Table 5.8 Regular Partners and the use of condom Percentage of respondents who say that:
Male students Female students Background Characteristics C
ondo
m u
se w
ith
regu
lar
sexu
al
partn
er in
the
past
6 m
onth
s
Con
dom
us
e in
th
e la
st t
ime
you
had
sex
with
you
r re
gula
r par
tner
Num
ber
Con
dom
use
with
re
gula
r se
xual
pa
rtner
in th
e pa
st 6
mon
ths
Con
dom
us
e in
th
e la
st t
ime
you
had
sex
with
you
r re
gula
r par
tner
Num
ber
Age group 19 years or under 100.0 100.0 2 100.0 100.0 1 20-24 70.8 75.0 40 65.3 67.7 31 25-29 77.8 86.8 38 .0 30-34 83.3 60.0 5 100.0 100.0 2 35-39 50.0 .0 1 40-44 50.0 66.7 3 100.0 100.0 1 45-49 .0 .0 .0 .0 .0 0 50 plus 83.3 77.8 9 75.0 66.7 3 Marital status married 55.6 60.0 10 33.3 100.0 1 cohabited 88.9 62.5 8 50.0 50.0 2 divorced 0 0 0 0 0 widowed 100.0 separated 50.0 100.0 2 100.0 1 single 75.3 82.5 57 81.1 72.4 29 Accommodation parents home 80.0 91.7 12 50.0 100.0 1 guardian 75.0 100.0 3 66.7 50.0 2 University main campus 74.0 83.0 47 73.9 62.5 16 at univ hostel outside campus 73.1 58.8 17 57.1 75.0 12 private apartment 74.2 61.9 21 77.8 85.7 7 Academic year first year 79.5 78.6 28 72.2 69.2 13 second year 73.1 74.3 35 70.6 69.2 13 third year 75.0 76.5 34 63.6 75.0 12 fourth year 71.4 66.7 3 0 0 0 fifth year 50.0 100.0 1 0 0 0 University UDSM 68.0 78.1 32 65.2 66.7 15 MUHAS 70.0 100.0 4 .0 SUA 75.0 66.7 15 100.0 66.7 3 MZUMBE 78.8 75.0 24 76.9 77.8 9 TUMAINI 88.9 81.3 16 71.4 80.0 5 SAUT 70.0 70.0 10 54.5 66.7 6 Sponsorship government 70.2 80.3 71 66.7 71 27 private 88.9 60.9 23 68.8 23 11 Program mode part time .0 0 0 0 0 0 full time 75.0 76.0 100 67.2 71.1 38
Average Expenditure per semester Up to 500,000 75.0 78.1 32 68.0 64.7 17 500001-1,000,000 71.4 87.0 46 69.6 73.3 15 1,000,001-1,500,000 80.0 50.0 12 42.9 100.0 3 1,500,001-2,000,000 80.0 33.3 3 100.0 50.0 2 2,000,001-2,500,000 80.0 62.5 8 100.0 100.0 1 More than 2,500,000
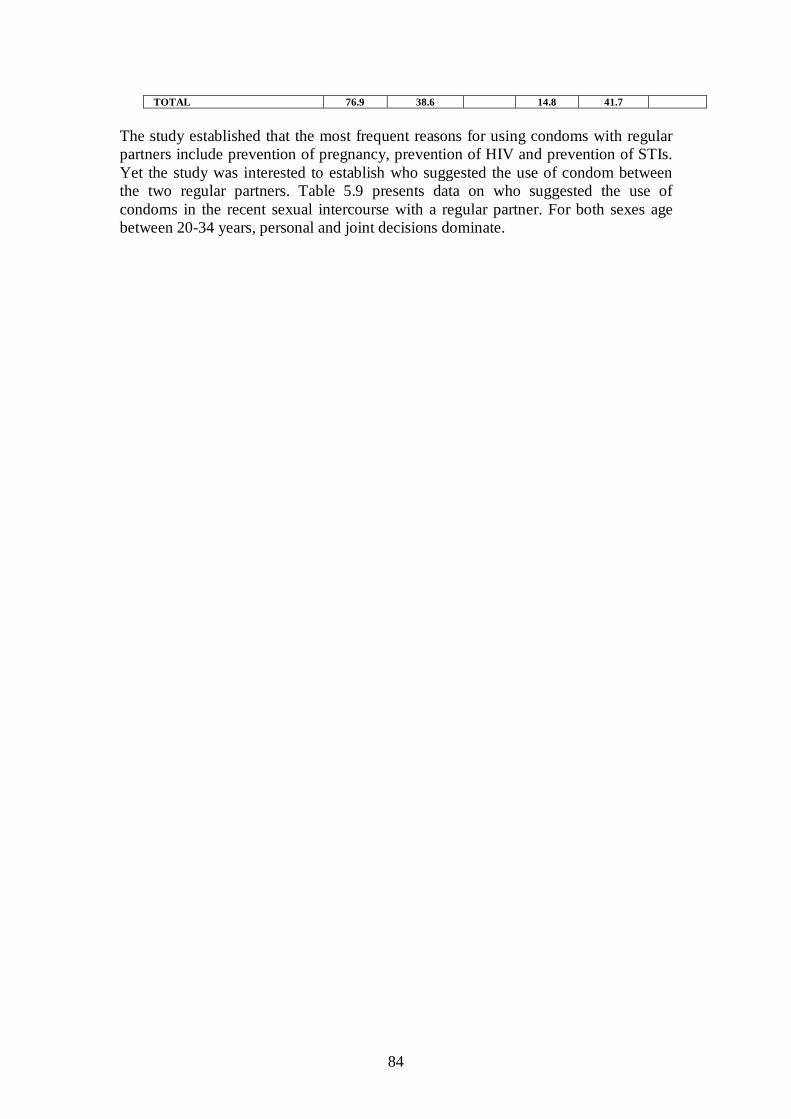
84
TOTAL 76.9 38.6 14.8 41.7 The study established that the most frequent reasons for using condoms with regular partners include prevention of pregnancy, prevention of HIV and prevention of STIs. Yet the study was interested to establish who suggested the use of condom between the two regular partners. Table 5.9 presents data on who suggested the use of condoms in the recent sexual intercourse with a regular partner. For both sexes age between 20-34 years, personal and joint decisions dominate.

85
Table 5.9 Recent Sexual Intercourse with regular partner: Suggestion of condom use
Percentage of respondents who say that: use of condom was suggested by: Males Females
Background Characteristics Mys
elf
My
partn
er
Join
t de
cisi
on
Num
ber
of m
ales
Mys
elf
My
partn
er
Join
t de
cisi
on
Num
ber
of
fem
ales
Age group 19 years or under 100.0 .0 .0 2 .0 .0 100.0 1 20-24 36.4 6.8 56.8 44 37.9 10.3 5.3 29 25-29 30.8 10.3 59.0 39 50.0 .0 51.7 2 30-34 40.0 20.0 40.0 5 .0 .0 50.0 1 35-39 40-44 66.7 33.3 .0 3 50.0 .0 100.0 1 45-49 50 plus 66.7 .0 33.3 9 .0 .0 50.0 2 Marital status married 55.6 33.3 11.1 9 .0 .0 100.0 1 cohabited 28.6 14.3 57.1 7 100.0 .0 .0 1 divorced widowed 100.0 .0 .0 1 separated 50.0 .0 50.0 2 Single 42.9 7.9 49.2 63 35.7 10.7 53.6 28 Accommodation parents home 36.4 9.1 54.5 11 .0 .0 100.0 1 guardian 33.3 .0 66.7 3 100.0 .0 .0 2 here at the campus 45.1 5.9 49.0 51 31.3 6.3 62.5 16 at univ hostel outside campus 33.3 11.1 55.6 18 33.3 22.2 44.4 9 private apartment 38.1 14.3 47.6 21 42.9 .0 57.1 7 Academic year first year 57.1 3.6 39.3 28 45.5 18.2 36.4 11 second year 45.7 8.6 45.7 35 33.3 8.3 58.3 12 third year 25.0 11.1 63.9 36 33.3 .0 66.7 12 fourth year 25.0 25.0 50.0 4 fifth year .0 .0 100.0 2 University UDSM 46.9 12.5 40.6 32 58.3 8.3 33.3 12 MUHAS 14.3 .0 85.7 7 SUA 40.0 13.3 46.7 15 66.7 .0 33.3 3 MZUMBE 45.5 .0 54.5 22 10.0 10.0 80.0 10 TUMAINI 50.0 18.8 31.3 16 25.0 .0 75.0 4 SAUT 15.4 .0 84.6 13 33.3 16.7 50.0 6 Sponsorship government 36.8 10.5 52.6 76 41.7 8.3 50.0 24 Private 52.4 4.8 42.9 21 27.3 9.1 63.6 11 Program mode part time full time 40.4 8.7 51.0 104 37.1 8.6 54.3 35 Average Expenditure per semester
Up to 500,000 34.5 34.5 34.5 29 35.7 35.7 35.7 14 500001-1,000,000 13.8 13.8 13.8 54 14.3 14.3 14.3 15 1,000,001-1,500,000 51.7 51.7 51.7 12 50.0 50.0 50.0 3 1,500,001-2,000,000 35.2 35.2 35.2 3 46.7 46.7 46.7 2 2,000,001-2,500,000 5.6 5.6 5.6 7 6.7 6.7 6.7 1 More than 2,500,000 0 0 0 0 0 0 TOTAL 43.2 10.8 44.1 31.6 6.8 60.8

86
For those who did not use condom, we explored reasons for not using condom. The results show that majority of those who did not use condom did not discuss anything about condom. Reasons for not using condom varied by type of sexual partners; that is, whether a partner was spouse, a regular partner or other partners. As shown in Figure 5.3 and Figure 5.4 male students are more likely than female students to object the use of condom with their spouses and/or regular partners. The figures also show that a larger proportion of female students and male students do not use condom with their spouse because they trust them. Figure 5.3 and 5.4 also show that larger proportion of female students compared to male students did not think it was necessary to use condom with their regular partners.
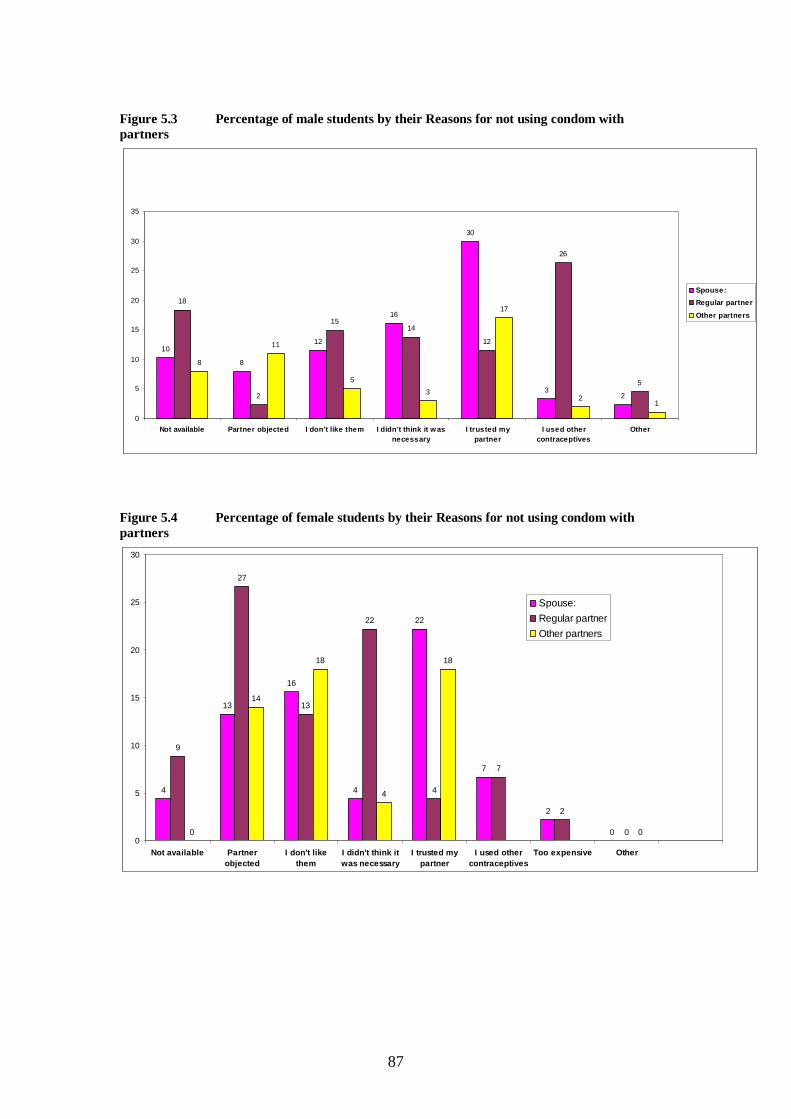
87
Figure 5.3 Percentage of male students by their Reasons for not using condom with partners
10
8
12
16
30
32
18
2
1514
12
26
5
8
11
53
17
21
0
5
10
15
20
25
30
35
Not available Partner objected I don't like them I didn't think it wasnecessary
I trusted mypartner
I used othercontraceptives
Other
Spouse: Regular partner
Other partners
Figure 5.4 Percentage of female students by their Reasons for not using condom with partners
4
13
16
4
22
7
2
0
9
27
13
22
4
7
2
00
14
18
4
18
00
5
10
15
20
25
30
Not available Partnerobjected
I don't likethem
I didn't think itwas necessary
I trusted mypartner
I used othercontraceptives
Too expensive Other
Spouse: Regular partnerOther partners

88
5.5 Multiple Sexual Partners and Higher Risk Sex The baseline study investigated the issue of multiple sexual partners and higher risk sex. Respondents who had sex in the past 12 months preceding the survey were asked about the number of sexual partners they had within that time. They were also asked of the sexual partners they had in the past 12 months, how many were regular partners, how many were non-regular partners/casual partners and how many were commercial partners15.In addition Respondents were asked about the number of lifetime sexual partners. The data show that females were far less likely than males to report having had two or more sexual partners in the “past 12months.” The results also show that a larger proportion of males than females had two or more sexual partners (34.7% male students vs. 19.3% female students). Also, 32.6% males vs. 20.3% females had higher-risk intercourse in the past 12 month. The mean number of sexual partners in the past 12 months preceding the survey was 6.4 for males and 4.2 for females. Also, very few university students reported that they did not have sexual partners at all. Findings show that the relationship between age group of respondent and multiple sexual partnerships takes a wave-like shape. Proportion of respondents with two or more sexual partners is higher among respondents age less than 20 years and steadily decreases up to age group 30-34 before it rises again. Analysis of data by age group shows that contrary to the general belief about sexual behaviors of university female students, more university male students than female students have two or more sexual partners (see Figures 5.6, 5.7 and 5.8). The same trend was observed among all universities and among other background characteristics. On the use of condom, more male university students than female university students reported to have used condom the last time they had higher-risk sexual intercourse (44.0% for males and 35.5% for females).
15 In this study, commercial partners were defined as partners with whom one had sexual intercourse with in exchange for money.
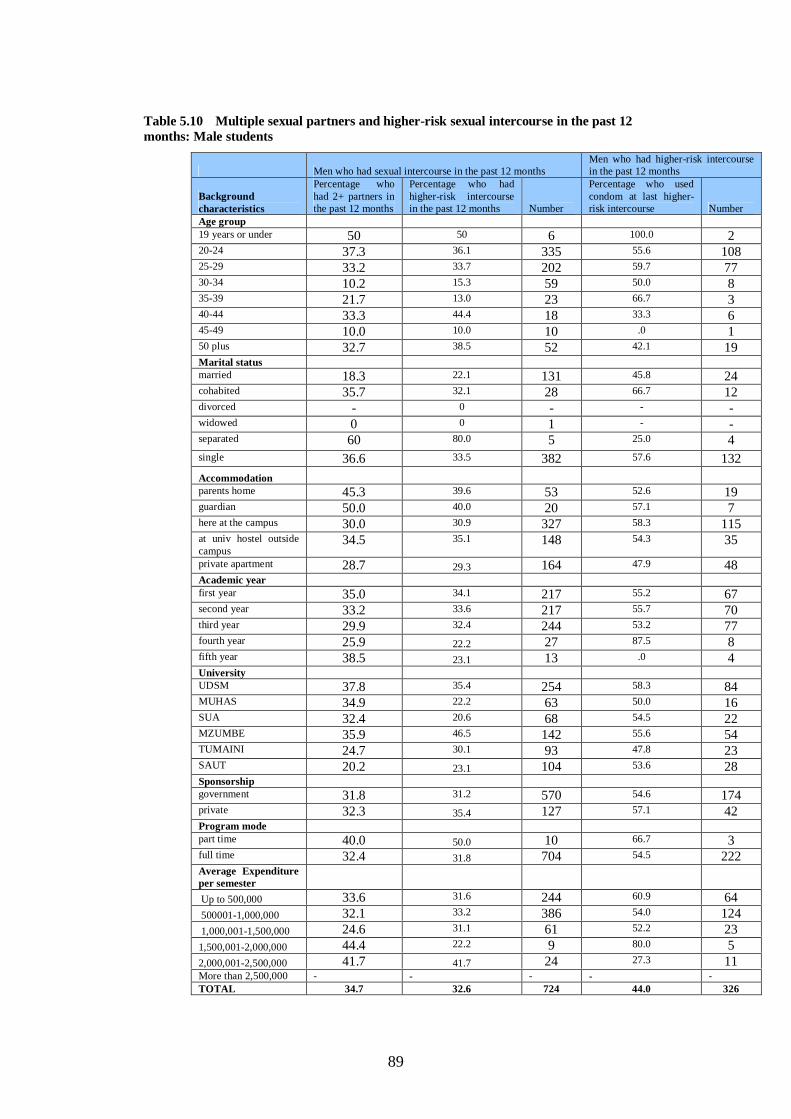
89
Table 5.10 Multiple sexual partners and higher-risk sexual intercourse in the past 12 months: Male students
Men who had sexual intercourse in the past 12 months Men who had higher-risk intercourse in the past 12 months
Background characteristics
Percentage who had 2+ partners in the past 12 months
Percentage who had higher-risk intercourse in the past 12 months Number
Percentage who used condom at last higher-risk intercourse Number
Age group 19 years or under 50 50 6 100.0 2 20-24 37.3 36.1 335 55.6 108 25-29 33.2 33.7 202 59.7 77 30-34 10.2 15.3 59 50.0 8 35-39 21.7 13.0 23 66.7 3 40-44 33.3 44.4 18 33.3 6 45-49 10.0 10.0 10 .0 1 50 plus 32.7 38.5 52 42.1 19 Marital status married 18.3 22.1 131 45.8 24 cohabited 35.7 32.1 28 66.7 12 divorced - 0 - - - widowed 0 0 1 - - separated 60 80.0 5 25.0 4 single 36.6 33.5 382 57.6 132 Accommodation parents home 45.3 39.6 53 52.6 19 guardian 50.0 40.0 20 57.1 7 here at the campus 30.0 30.9 327 58.3 115 at univ hostel outside campus
34.5 35.1 148 54.3 35
private apartment 28.7 29.3 164 47.9 48 Academic year first year 35.0 34.1 217 55.2 67 second year 33.2 33.6 217 55.7 70 third year 29.9 32.4 244 53.2 77 fourth year 25.9 22.2 27 87.5 8 fifth year 38.5 23.1 13 .0 4 University UDSM 37.8 35.4 254 58.3 84 MUHAS 34.9 22.2 63 50.0 16 SUA 32.4 20.6 68 54.5 22 MZUMBE 35.9 46.5 142 55.6 54 TUMAINI 24.7 30.1 93 47.8 23 SAUT 20.2 23.1 104 53.6 28 Sponsorship government 31.8 31.2 570 54.6 174 private 32.3 35.4 127 57.1 42 Program mode part time 40.0 50.0 10 66.7 3 full time 32.4 31.8 704 54.5 222 Average Expenditure per semester
Up to 500,000 33.6 31.6 244 60.9 64 500001-1,000,000 32.1 33.2 386 54.0 124 1,000,001-1,500,000 24.6 31.1 61 52.2 23 1,500,001-2,000,000 44.4 22.2 9 80.0 5 2,000,001-2,500,000 41.7 41.7 24 27.3 11 More than 2,500,000 - - - - - TOTAL 34.7 32.6 724 44.0 326
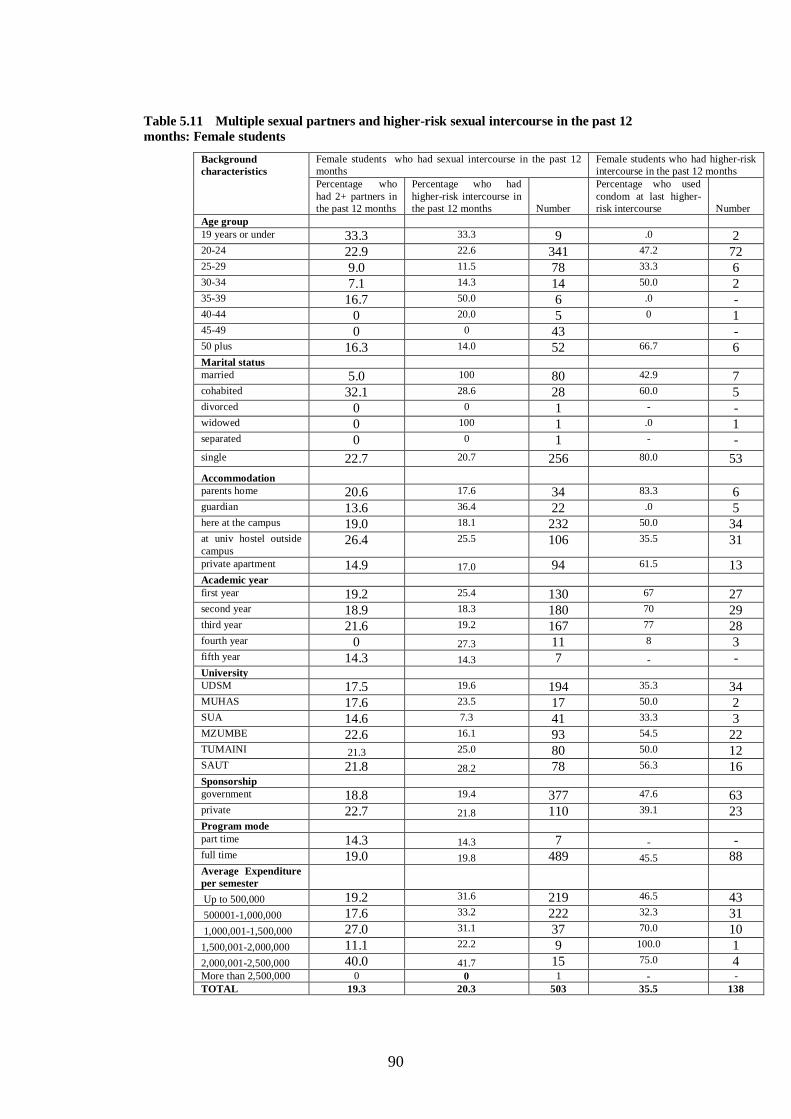
90
Table 5.11 Multiple sexual partners and higher-risk sexual intercourse in the past 12 months: Female students
Female students who had sexual intercourse in the past 12 months
Female students who had higher-risk intercourse in the past 12 months
Background characteristics
Percentage who had 2+ partners in the past 12 months
Percentage who had higher-risk intercourse in the past 12 months Number
Percentage who used condom at last higher-risk intercourse Number
Age group 19 years or under 33.3 33.3 9 .0 2 20-24 22.9 22.6 341 47.2 72 25-29 9.0 11.5 78 33.3 6 30-34 7.1 14.3 14 50.0 2 35-39 16.7 50.0 6 .0 - 40-44 0 20.0 5 0 1 45-49 0 0 43 - 50 plus 16.3 14.0 52 66.7 6 Marital status married 5.0 100 80 42.9 7 cohabited 32.1 28.6 28 60.0 5 divorced 0 0 1 - - widowed 0 100 1 .0 1 separated 0 0 1 - - single 22.7 20.7 256 80.0 53 Accommodation parents home 20.6 17.6 34 83.3 6 guardian 13.6 36.4 22 .0 5 here at the campus 19.0 18.1 232 50.0 34 at univ hostel outside campus
26.4 25.5 106 35.5 31
private apartment 14.9 17.0 94 61.5 13 Academic year first year 19.2 25.4 130 67 27 second year 18.9 18.3 180 70 29 third year 21.6 19.2 167 77 28 fourth year 0 27.3 11 8 3 fifth year 14.3 14.3 7 - - University UDSM 17.5 19.6 194 35.3 34 MUHAS 17.6 23.5 17 50.0 2 SUA 14.6 7.3 41 33.3 3 MZUMBE 22.6 16.1 93 54.5 22 TUMAINI 21.3 25.0 80 50.0 12 SAUT 21.8 28.2 78 56.3 16 Sponsorship government 18.8 19.4 377 47.6 63 private 22.7 21.8 110 39.1 23 Program mode part time 14.3 14.3 7 - - full time 19.0 19.8 489 45.5 88 Average Expenditure per semester
Up to 500,000 19.2 31.6 219 46.5 43 500001-1,000,000 17.6 33.2 222 32.3 31 1,000,001-1,500,000 27.0 31.1 37 70.0 10 1,500,001-2,000,000 11.1 22.2 9 100.0 1 2,000,001-2,500,000 40.0 41.7 15 75.0 4 More than 2,500,000 0 0 1 - - TOTAL 19.3 20.3 503 35.5 138

91
Figure 5.5 Percentage of respondents with two or more sexual partners by Age group and by gender B
50
3733
10
22
33
10
3333
23
97
17
0 0
16
0
10
20
30
40
50
60
19 yearsor under
20-24 25-29 30-34 35-39 40-44 45-49 50+
Per
cent
age
MenWomen
Figure: 5.6 Percentage of respondents who had two or more sexual partners by University and by gender
3835
32
36
25
20
16 1715
2321 22
0
5
10
15
20
25
30
35
40
UDSM MUHAS SUA MZUMBE TUMAINI SAUT
Perc
enta
ge
MenWomen
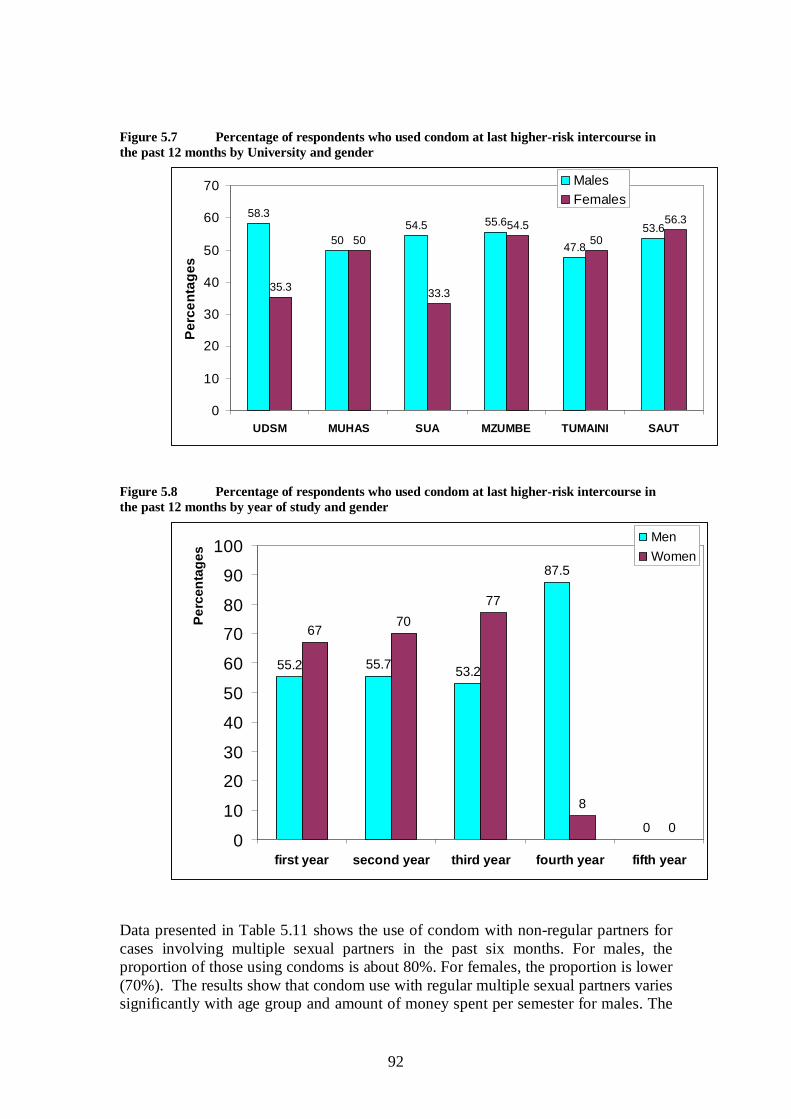
92
Figure 5.7 Percentage of respondents who used condom at last higher-risk intercourse in the past 12 months by University and gender
58.3
5054.5 55.6
47.8
53.6
35.3
50
33.3
54.550
56.3
0
10
20
30
40
50
60
70
UDSM MUHAS SUA MZUMBE TUMAINI SAUT
Perc
enta
ges
Males Females
Figure 5.8 Percentage of respondents who used condom at last higher-risk intercourse in the past 12 months by year of study and gender
55.2 55.7 53.2
87.5
0
6770
77
8
00
10
20
30
40
50
60
70
80
90
100
first year second year third year fourth year fifth year
Perc
enta
ges
MenWomen
Data presented in Table 5.11 shows the use of condom with non-regular partners for cases involving multiple sexual partners in the past six months. For males, the proportion of those using condoms is about 80%. For females, the proportion is lower (70%). The results show that condom use with regular multiple sexual partners varies significantly with age group and amount of money spent per semester for males. The
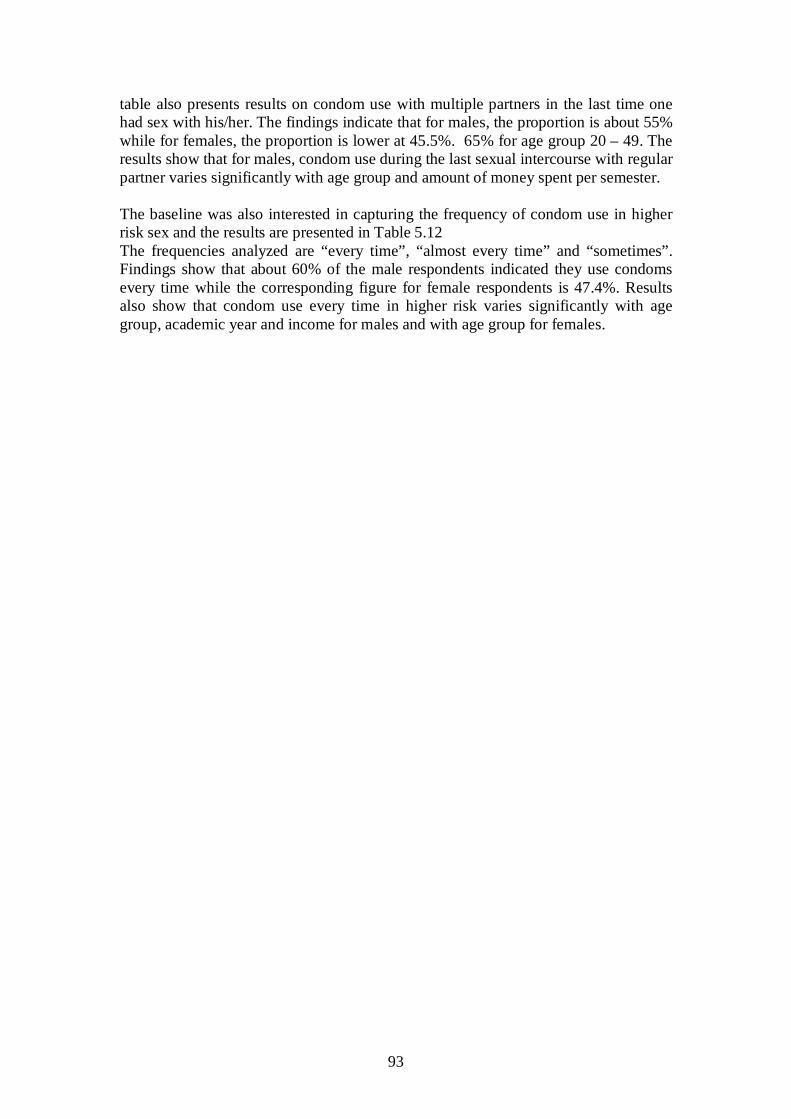
93
table also presents results on condom use with multiple partners in the last time one had sex with his/her. The findings indicate that for males, the proportion is about 55% while for females, the proportion is lower at 45.5%. 65% for age group 20 – 49. The results show that for males, condom use during the last sexual intercourse with regular partner varies significantly with age group and amount of money spent per semester. The baseline was also interested in capturing the frequency of condom use in higher risk sex and the results are presented in Table 5.12 The frequencies analyzed are “every time”, “almost every time” and “sometimes”. Findings show that about 60% of the male respondents indicated they use condoms every time while the corresponding figure for female respondents is 47.4%. Results also show that condom use every time in higher risk varies significantly with age group, academic year and income for males and with age group for females.

94
Table 5.12 Higher risk sex: Frequency of the use of condom
Male students Female students
Background Characteristics
Every time
Almost every time
sometimes
Don’t know
No response
Number
Every time
Almost every time
sometimes
Don’t know
No response
Number
Age group
19 years or under 50.0 .0 50.0 .0 .0 2 2 20-24 51.9 18.5 51.9 9.9 .0 108 52.1 18.8 16.
7 10.4
2.1 72
25-29 70.4 9.3 70.4 3.7 3.7 77 .0 25.0 25.0
25.0
25.0 6
30-34 80.0 .0 80.0 .0 .0 8 100.0
.0 .0 .0 .0 2
35-39 100.0
.0 100.0 .0 .0 3 -
40-44 66.7 .0 66.7 .0 .0 6 1 45-49 1 - 50 plus 60.0 .0 60.0 10.0 .0 19 20.0 40.0 20.
0 20.0
.0 6
Marital status Married 64.3 7.1 28.6 .0 .0 24 40.0 20.0 20.
0 20.0
.0 7
Cohabited 75.0 12.5 12.5 .0 .0 12 33.3 33.3 33.3
.0 .0 5
Divorced - - Widowed - 1 Separated 100.
0 .0 .0 .0 .0 4 -
Single 60.0 14.0 16.0 8.0 2.0 132 44.4 19.4 16.7
13.9
5.6 53
Accommodation Parents home 58.3 25.0 .0 8.3 8.3 19 66.7 16.7 16.
7 .0 .0 6
Guardian 75.0 .0 25.0 .0 .0 7 .0 33.3 .0 66.7
.0 5
Here at the campus
56.6 15.7 21.7 6.0 .0 115 44.0 16.0 20.0
12.0
8 34
At univ. hostel outside campus
73.9 8.7 8.7 8.7 .0 35 40.0 20.0 26.7
13.3
.0 31
Private apartment 57.1 11.4 20.0 8.6 2.9 48 66.7 33.3 .0 .0 .0 13 Academic year First year 54.2 12.5 25.0 8.3 .0 67 40.0 13.3 26.
7 20.0
.0 27
Second year 61.8 14.5 20.0 3.6 .0 70 35.0 25.0 20.0
15.0
5.0 29
Third year 63.8 12.8 10.6 8.5 4.3 77 63.2 26.3 5.3 5.3 .0 28 Fourth year 62.5 25.0 .0 12.5 .0 8 .0 .0 50.
0 .0 50.0 3
Fifth year 4 - University UDSM 58.1 16.1 16.1 9.7 .0 84 35.0 15.0 30.
0 15.0
5.0 34
MUHAS 40.0 60.0 .0 .0 .0 16 50.0 50.0 .0 .0 .0 2 SUA 92.3 .0 7.7 .0 .0 22 .0 50.0 .0 50.
0 .0 3
MZUMBE 60.5 10.5 21.1 7.9 .0 54 64.3 14.3 14.3
7.1 14 22
TUMAINI 47.1 5.9 35.3 5.9 5.9 23 50.0 12.5 12.5
12.5
12.5 12
SAUT 68.4 5.3 15.8 5.3 5.3 28 50.0 33.3 8.3 8.3 .0 16 Sponsorship Government 59.5 14.9 16.5 7.4 1.7 174 43.9 24.4 17.
1 12.2
2.4 63
Private 61.3 9.7 25.8 3.2 .0 42 46.7 13.3 20. 13.3
6.7 23

95
Program mode Part time .0 50.0 50.0 .0 .0 3 - Full time 60.6 13.5 17.4 7.1 1.3 222 47.4 21.1 15.
8 12.3
3.5 88 Average Expenditure per semester
Up to 500,000 68.1 10.6 12.8 8.5 .0 64 39.3 25.0 14.
3 14.3
7.1 43
500001-1,000,000 58.1 17.4 16.3 7.0 1.2 124 46.7 13.3 20.
0 20.0
. 31
1,000,001-1,500,000
37.5 12.5 37.5 6.3 6.3 23 40.0 30.0 30.0
.0 .0 10
1,500,001-2,000,000
80.0 .0 20.0 .0 .0 5 100.0
.0 .0 .0 .0 1
2,000,001-2,500,000
80.0 .0 20.0 .0 .0 11 100.0
.0 .0 .0 .0 4
More than 2,500,000
0 0 0 0 0 - 0
0 0 0 0 -
TOTAL 54.3 13.9 14.5 11.1 6.1
326 39.1 19.9 14.
7 20.5
5.8 138
Table 5.13 presents data on who suggested the use of condoms with non regular/casual, non-commercial sexual partners as being the personal and joint decisions. Findings in table 5.13 indicate that a higher proportion of males claim to be the ones who made decision over condom use. This was different from female students where apart from making decision on their own, there are instances where a bigger proportion pointed out that the use of condom was a joint decision.
Table 5.13 Higher risk sex and use of condom
Percentage of respondents who say that use of condom was suggested by
Male students Female students
Background Characteristics Myself My partners
Joint Decision
Number Myself
My partner
Joint decision
Number
Age group
19 years or under 100.0 .0 .0 2 2 20-24 58.3 6.7 31.7 108 38.2 2.9 58.8 72 25-29 73.9 4.3 21.7 77 50.0 .0 50.0 6
30-34 75.0 .0 25.0 8 .0 .0 100.0 2 35-39 100.0 .0 .0 3 - 40-44 100.0 .0 .0 6 1 45-49 62.5 .0 37.5 1 - 50 plus 100.0 .0 .0 19 75.0 .0 25.0 6
Marital status married 81.8 9.1 9.1 24 66.7 .0 33.3 7 cohabited 62.5 .0 37.5 12 33.3 33.3 33.3 5 divorced - - widowed - 1 separated .0 .0 100.0 4 - single 72.4 2.6 22.4 132 45.8 .0 54.2 53
Accommodation
parents home 80.0 .0 20.0 19 20.0 .0 80.0 6 guardian 50.0 .0 50.0 7 29.4% .0 70.6 5 here at the campus 67.2 7.5 23.9 115 54.5 .0 45.5 34 at univ hostel outside campus 68.4 .0 31.6 35 62.5 12.5 25.0 31 private apartment 69.6 4.3 21.7 48 20.0 .0 80.0 13 Academic year first year 64.9 5.4 24.3 67 40.0 10.0 50.0 27 second year 79.5 .0 20.5 70 50.0 .0 50.0 29 third year 61.0 9.8 29.3 77 31.3 .0 68.8 28 fourth year 57.1 .0 42.9 8 .0 .0 100.0 3 fifth year 4 -
University

96
UDSM 65.3 4.1 26.5 84 50.0 .0 50.0 34 MUHAS 37.5 25.0 37.5 16 .0 .0 100.0 2 SUA 91.7 0 8.3 22 100.0 .0 .0 3 MZUMBE 73.3 3.3 23.3 54 33.3 .0 66.7 22 TUMAINI 81.8 .0 18.2 23 50.0 .0 50.0 12 SAUT 46.7 6.7 46.7 28 33.3 11.1 55.6 16
Sponsorship government 65.3 5.3 27.4 174 43.3 3.3 53.3 63 private 79.2 4.2 16.7 42 44.4 .0 55.6 23
Program mode part time .0 100.0 .0 3 66.7 4.9 26.8 - full time 67.8 3.3 27.3 222 40.0 2.5 57.5 88
Average Expenditure per semester Up to 500,000 56.4 2.6 41.0 64 50.0 .0 50.0 43 500001-1,000,000 71.6 6.0 19.4 124 30.0 .0 70.0 31 1,000,001-1,500,000 66.7 .0 33.3 23 28.6 14.3 57.1 10 1,500,001-2,000,000 100.0 .0 .0 5 .0 .0 100.0 1 2,000,001-2,500,000 66.7 33.3 .0 11 66.7 .0 33.3 4 More than 2,500,000 0 0 0 - 0 0 0 - TOTAL 16.4 2.6 8.3 326 5.2 0.9 6.5 138
The baseline study also sought to know from those who did not use condom at the last higher- risk sexual encounter the reasons for not using condom. Findings show a significant difference between male and female students. For male students, reasons mentioned included trusted partner (41%), don’t like them (38%) and non availability (26%). For female students, lower percentages were recorded i.e. trusted partner (29%) don’t like (21%) them non availability 14%. Important to note is the finding that a relatively higher proportion of female students (22%) compared to male students (15%) gave the reason that a partner objected pointing to the men’s power in making decisions on sexual behavior. Findings from qualitative data corroborate the above findings. Information collected from the group discussions and in depth interviews both showed that multiple partnerships were a common practice among university students. Students had multiple partners both within the university with their fellow students and to a certain extent with members of staff. Beyond this students also had relationship with people from outside the universities. Reasons advanced for having multiple sexual partners included economic, academic and recreational hence recreational, economic and academic boyfriends. A quotation from Mzumbe FGD is illustrative of multiple partnering in universities:
…..a lady may have boyfriend whom she calls academic boyfriend. Here she know she is a bit settled academically.…another (sexual partner) is for financial matters, we call him economic boyfriend meaning that this partner has money ….so he will take care of all matters pertaining to cash....but the third one (partner) is what we call recreational boyfriend….. . all matters of having fun out there in town… and this one is only for spending money for lavish life, the rest are not capable of taking her out for spending money…….. (FGD/student leaders)
To note is also the fact that the academic boyfriend (those who are good in academics) have more than one girl friend whom they help with academics for sexual favours and money. Likewise the economic boyfriend has more than one student girl friend whom he helps economically. This is besides other partners outside the Universities.
97
5.6 Transactional Sex Transactional sex is normally expected to be associated with non-marital, non-cohabiting partners. It includes sex with commercial sex workers (prostitutes). Doing sex with prostitutes is certainly risky because they have many partners and are thus more likely to have sexually transmitted infections. In this study issues related to transactional sex were investigated. Table 5.14 presents results on condom use in the last time assistance was made in exchange for sexual intercourse. 66.7 % of male respondents and 17.4% of female respondents indicated condom use in the last time assistance was made in exchange for sexual intercourse. Table 4.15 also presents results on condom use during sexual intercourse every time one assisted someone in exchange for sex. 72 % of male respondents and 30% of female respondents indicated condom use during sexual intercourse every time one assisted someone in exchange for sex.

98
Table 5.14 Transactional Sex and the use of condom Percentage of respondents used condom at last transactional sex
Males Females
Background Characteristics Con
dom
use
at
last
trans
actio
nal s
ex
Con
dom
us
e at
ev
ery
trans
actio
nal
sex
Num
ber o
f mal
es
Con
dom
use
at
last
trans
actio
nal s
ex
Con
dom
us
e at
ev
ery
trans
actio
nal
sex
Num
ber o
f fem
ales
Age group
19 years or under 0 0 0 0 0 0 20-24 64.5 74. 29 14.3 16.7 14 25-29 78.9 73.7 21 16.7 20.0 1 30-34 33.3 66.7 1 0 0 0 35-39 0 0 0 .0 100.0 1 40-44 100.0 100.0 1 0 0 0 45-49 0 0 0 0 0 0 50 plus .0 33.3 1 50.0 100.0 2 Marital status married 71.4 85.7 5 33.3 3 0 cohabited 100.0 100.0 2 0 0 0 divorced 0 0 0 0 0 0 widowed 0 0 0 0 0 0 separated 0 0 0 0 0 0 single 55.3 63.6 37 17.6 26.7 13
Accommodation
parents home 62.5 57.1 6 0 0 0 guardian 0 0 3 .0 .0 0 here at the campus 27 65.4 22 25.0 45.5 6 at univ hostel outside campus 66.7 78. 13 14.3 16.7 7 private apartment 63.6 100.0 11 .0 .0 4 Academic year first year 65.4 79.2 18 .0 40.0 6 second year 58.3 72.7 14 33.3 28.6 7 third year 77.8 72.2 20 14.3 33.3 2 fourth year 100.0 .0 1 .0 .0 0 fifth year .0 .0 2 0 0 1 University UDSM 72.2 78.9 22 18.2 20.0 11 MUHAS 66.7 66.7 4 0 0 0 SUA 85.7 100.0 6 .0 .0 1 MZUMBE 68.8 66.7 10 33.3 100.0 1 TUMAINI 66.7 50.0 4 20.0 25.0 2 SAUT 45.5 55.6 9 .0 50.0 2
Sponsorship
government 68.2 71.4 43 15.8 37.5 11 private 70.0 72.7 7 33.3 .0 6 Program mode
part time 66.7 100.0 54 17.4 30.0 1 full time 0 71.7 1 0 0 16 Average Expenditure per semester
Up to 500,000 61.9 72.7 17 33.3 37.5 8 500001-1,000,000 71.4 76.0 32 .0 22.2 6 1,000,001-1,500,000 60.0 50.0 3 50.0 50.0 2 1,500,001-2,000,000 0 0 3 0 0 1 2,000,001-2,500,000 75.0 75.0 0 .0 .0 0 More than 2,500,000 0 0 0 0 0 0 TOTAL 39.4 51.0 18.6 31.6
99
5.7 Voluntary HIV Counselling and Testing In order to explore how awareness of HIV status can influence sexual behaviours, respondents were asked whether they had ever been tested for HIV. Those who had tested were asked when they were most recently tested and whether they had received the results of their last tests. Those who had never tested were asked whether they knew a place where they could go to be tested. Table 5.15 presents the results for males and females and their HIV testing behaviors by selected background characteristics. It is shown that more females than males have ever been tested for HIV (59% males and 70% females. This percentage is relatively higher compared to the national average where only 27% of males and 37% of females have ever been tested (THIS, 2007-2008:82). However, putting it in another way, 41% of male students and 30% of female students have never got tested and therefore they do not know their HIV status. With these results, it is evident that university students need to be mobilized so that they may know their HIV status and start acting responsibly about their sexual behaviours.

100
Table 5.15 Voluntary HIV Counseling and Testing: Male and Female students Male students Female students
Background Characteristics Ev
er t
este
d fo
r H
IV
Col
lect
ing
the
re
sults
of
the
test
s
Kno
w w
here
HIV
tes
t se
rvic
es a
re p
rovi
ded
HIV
tes
ting
faci
lity
in
the
univ
ersi
ty/n
eigh
borh
ood Pr
efer
ence
for
te
stin
g
HIV
Num
ber
Ever
tes
ted
for
HIV
Col
lect
ing
the
re
sults
of
the
test
s
Kno
w w
here
HIV
tes
t se
rvic
es a
re p
rovi
ded
HIV
tes
ting
faci
lity
in
the
univ
ersi
ty/n
eigh
borh
ood Pr
efer
ence
for
te
stin
g
HIV
Num
ber
Age group 19 years or under
22.2 100.0 87.5 37.5 57.1 10 57.1 100.0 95.0 50.0 56.3 11
20-24 51.4 96.9 96.0 71.6 69.2 469 67.0 98.5 97.6 75.9 80.1 403 25-29 63.3 97.9 97.7 73.9 79.2 271 78.3 100.0 99.0 75.5 82.7 86 30-34 80.5 96. 93.6 77.9 83.8 77 71.4 100.0 100.0 64.0 84.0 18 35-39 65.2 100.0 95.7 54.2 81.8 21 85.7 80.0 100.0 50.0 85.7 7 40-44 72.0 100.0 100.0 84.0 90.9 22 100.0 100.0 100.0 71.4 85.7 6 45-49 54.5 33.3 90.9 90.9 70.0 10 66.2 100.0 100.0 50.0 100.0 2 50 plus 65.7 96.9 87.5 64.2 64.1 86 88.0 100.0 97.3 63.0 74.3 52 Marital status married 76.2 94.7 96.6 74.5 81.0 168 95.8 98.9 98.9 69.9 84.6 85 cohabited 71.4 100.0 96.4 69.0 81.5 31 79.3 100.0 00.0 75.0 75.0 28 divorced 0 100.0 100.0 100.0 50.0 50.0 3 widowed .0 100.0 .0 100.0 1 100.0 100.0 100.0 100.0 100.0 1 separated 71.4 100.0 85.7 42.9 71.4 5 100.0 100.0 97.6 100.0 50.0 1 single 54.4 96.8 94.9 70.5 71.4 547 66.0 98.4 98.9 72.9 79.9 303
Accommodation
parents home 55.1 89 95.3 69.2 66.7 80 55.1 98.0 100.0 72.2 77.8 37 guardian 40.0 23 96.2 60.0 76.0 29 40.0 100.0 92.6 64.3 85.2 23 University main campus
60.0 2 96.8 75.4 74.8 441 60.0 99.3 98.8 76.5 81.1 280
at univ hostel outside campus
51.0 1 93.9 69.2 76.2 200 51.0 98.3 95.8 77.5 74.9 125
private apartment
64.6 2 96.1 68.7 70.5 247 64.6 98.1 97.7 65.1 81.3 112
Academic year first year 55.4 100.0 94.5 68.2 72.7 340 68.6 97.6 96.8 68.8 352 154 second year 56.8 100.0 95.9 71.5 70.8 297 69.5 96.8 97.4 74.9 315 212 third year 62.0 97.0 96.8 73.6 75.1 318 67.5 96.2 98.9 77. 334 190 fourth year 62.2 90.9 100.0 81.4 73.8 39 73.7 96.3 100.0 70.0 42 17 fifth year 70.6 99.3 100.0 94.1 87.5 14 100.0 100.0 100.0 83.3 16 16
University
UDSM 49.8 96.4 94.4 69.6 76.7 373 66.2 98.2 98.2 437 81.2 221 MUHAS 52.3 98.2 99.1 92.6 81.2 85 45.8 100.0 95.7 108 77.8 19 SUA 65.6 93.7 98.9 84.5 79.8 94 63.2 100.0 100.0 97 92.4 46 MZUMBE 69.9 96.7 93.7 76.0 64.5 173 81.4 99.2 99.3 179 78.5 111 TUMAINI 65.7 97.8 100.0 64.0 62.1 138 69.6 98.9 98.4 136 73.3 94 SAUT 65.3 97.9 97.9 57.2 74.5 153 73.3 99.0 94.5 145 77.8 97
Sponsorship Government 55.5 96.7 95.9 73.1 73.7 801 67.4 99.1 98.0 77.3 80.4 442 Private 71.4 96.3 95.9 67.9 70.9 175 74.0 98.4 97.5 60.5 78.6 126
Program mode
part time 58.8 100.0 100.0 75.0 71.4 15 62.5 80.0 100.0 75.0 87.5 6 full time 58.8 96.8 95.8 71.8 98.7 983 69.4 99.0 97.9 74.0 79.6 574 Average Expenditure per semester
Up to 500,000 59.1 97.1 95.0 70.1 73.7 384 69.5 98.0 398 70.3 77.2 254 500001-1,000,000
56.2 96.0 97.0 73.2 72.0 500 68.5 99.6 567 79.5 82.9 259
1,000,001-1,500,000
61.9 100.0 93.6 70.9 79.7 82 69.5 97.6 78 63.8 69.1 46
1,500,001-2,000,000
78.6 100.0 100.0 76.9 69.2 13 68.4 100.0 11 37.5 88.9 11
2,000,001-2,500,000
73.0 96.2 91.9 70.3 77.8 37 71.4 100.0 37 71.4 90.0 17
More than 2,500,000
100.0 100.0 100.0 100.0 100.0 1 .0 100.0 2 100.0 .0 1

101
TOTAL 58.6 88.8 95.9 71.9 73.3 1386 69.0 93.2 97.8 73.5 79.8 1006 Further analysis on testing showed that Mzumbe University had the highest percentage for both male and female as shown in figure 5.9. Compared to other Universities MUHAS had the lowest percentage for tested female students (46%) while UDSM had the lowest percentage for tested male students (50%)
Figure 5.9 Prior HIV Testing by University
50 52
6670
66 6566
46
63
81
7073
0
10
20
30
40
50
60
70
80
90
UDSM MUHAS SUA MZUMBE TUMAINI SAUT
Perc
enta
ge
MenWomen
Information on testing alone is not enough for it is also important to know why people opted for testing. In that vein the respondents were asked for the main reasons for HIV testing and results are presented in Table 5.16 According to the respondents (Table 5.16)), the main reasons for deciding to test for HIV are to know one’s status (92.5% for male students and (94.6%) % for female students).
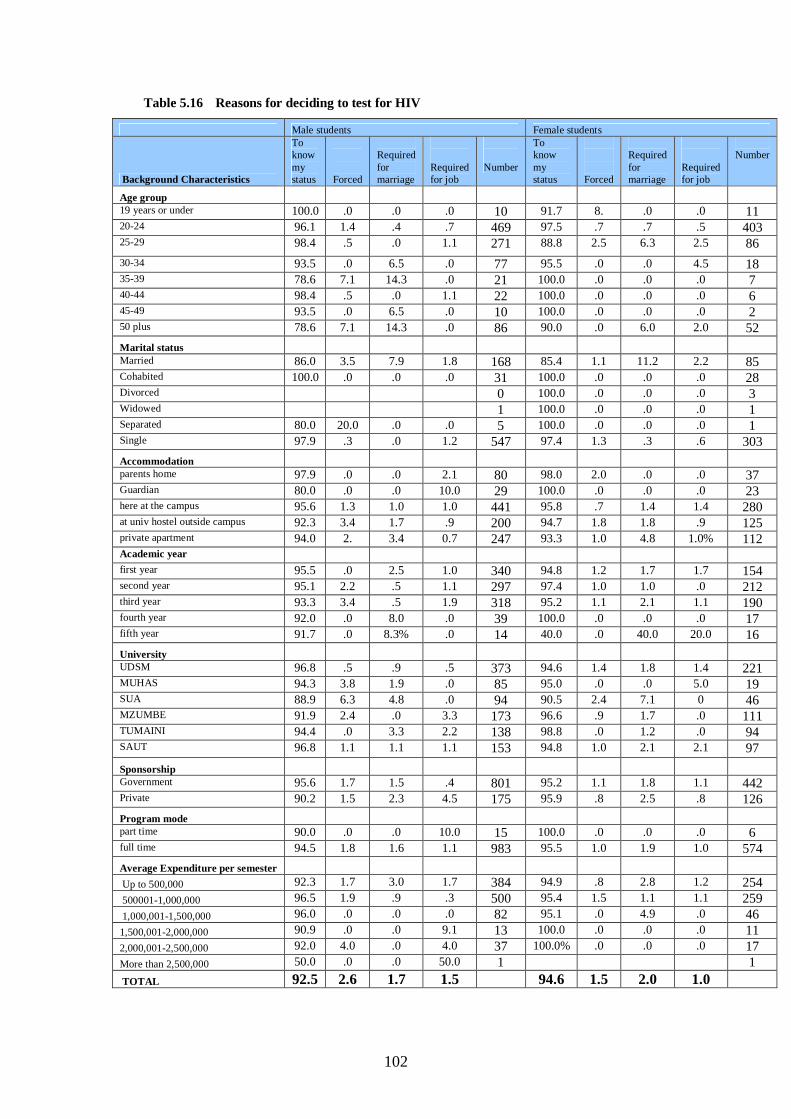
102
Table 5.16 Reasons for deciding to test for HIV
Male students Female students
Background Characteristics
To know my status
Forced
Required for marriage
Required for job
Number
To know my status
Forced
Required for marriage
Required for job
Number
Age group
19 years or under 100.0 .0 .0 .0 10 91.7 8. .0 .0 11 20-24 96.1 1.4 .4 .7 469 97.5 .7 .7 .5 403 25-29 98.4 .5 .0 1.1 271 88.8 2.5 6.3 2.5 86 30-34 93.5 .0 6.5 .0 77 95.5 .0 .0 4.5 18 35-39 78.6 7.1 14.3 .0 21 100.0 .0 .0 .0 7 40-44 98.4 .5 .0 1.1 22 100.0 .0 .0 .0 6 45-49 93.5 .0 6.5 .0 10 100.0 .0 .0 .0 2 50 plus 78.6 7.1 14.3 .0 86 90.0 .0 6.0 2.0 52 Marital status Married 86.0 3.5 7.9 1.8 168 85.4 1.1 11.2 2.2 85 Cohabited 100.0 .0 .0 .0 31 100.0 .0 .0 .0 28 Divorced 0 100.0 .0 .0 .0 3 Widowed 1 100.0 .0 .0 .0 1 Separated 80.0 20.0 .0 .0 5 100.0 .0 .0 .0 1 Single 97.9 .3 .0 1.2 547 97.4 1.3 .3 .6 303 Accommodation parents home 97.9 .0 .0 2.1 80 98.0 2.0 .0 .0 37 Guardian 80.0 .0 .0 10.0 29 100.0 .0 .0 .0 23 here at the campus 95.6 1.3 1.0 1.0 441 95.8 .7 1.4 1.4 280 at univ hostel outside campus 92.3 3.4 1.7 .9 200 94.7 1.8 1.8 .9 125 private apartment 94.0 2. 3.4 0.7 247 93.3 1.0 4.8 1.0% 112 Academic year first year 95.5 .0 2.5 1.0 340 94.8 1.2 1.7 1.7 154 second year 95.1 2.2 .5 1.1 297 97.4 1.0 1.0 .0 212 third year 93.3 3.4 .5 1.9 318 95.2 1.1 2.1 1.1 190 fourth year 92.0 .0 8.0 .0 39 100.0 .0 .0 .0 17 fifth year 91.7 .0 8.3% .0 14 40.0 .0 40.0 20.0 16 University UDSM 96.8 .5 .9 .5 373 94.6 1.4 1.8 1.4 221 MUHAS 94.3 3.8 1.9 .0 85 95.0 .0 .0 5.0 19 SUA 88.9 6.3 4.8 .0 94 90.5 2.4 7.1 0 46 MZUMBE 91.9 2.4 .0 3.3 173 96.6 .9 1.7 .0 111 TUMAINI 94.4 .0 3.3 2.2 138 98.8 .0 1.2 .0 94 SAUT 96.8 1.1 1.1 1.1 153 94.8 1.0 2.1 2.1 97 Sponsorship Government 95.6 1.7 1.5 .4 801 95.2 1.1 1.8 1.1 442 Private 90.2 1.5 2.3 4.5 175 95.9 .8 2.5 .8 126 Program mode part time 90.0 .0 .0 10.0 15 100.0 .0 .0 .0 6 full time 94.5 1.8 1.6 1.1 983 95.5 1.0 1.9 1.0 574 Average Expenditure per semester Up to 500,000 92.3 1.7 3.0 1.7 384 94.9 .8 2.8 1.2 254 500001-1,000,000 96.5 1.9 .9 .3 500 95.4 1.5 1.1 1.1 259 1,000,001-1,500,000 96.0 .0 .0 .0 82 95.1 .0 4.9 .0 46 1,500,001-2,000,000 90.9 .0 .0 9.1 13 100.0 .0 .0 .0 11 2,000,001-2,500,000 92.0 4.0 .0 4.0 37 100.0% .0 .0 .0 17 More than 2,500,000 50.0 .0 .0 50.0 1 1 TOTAL 92.5 2.6 1.7 1.5 94.6 1.5 2.0 1.0
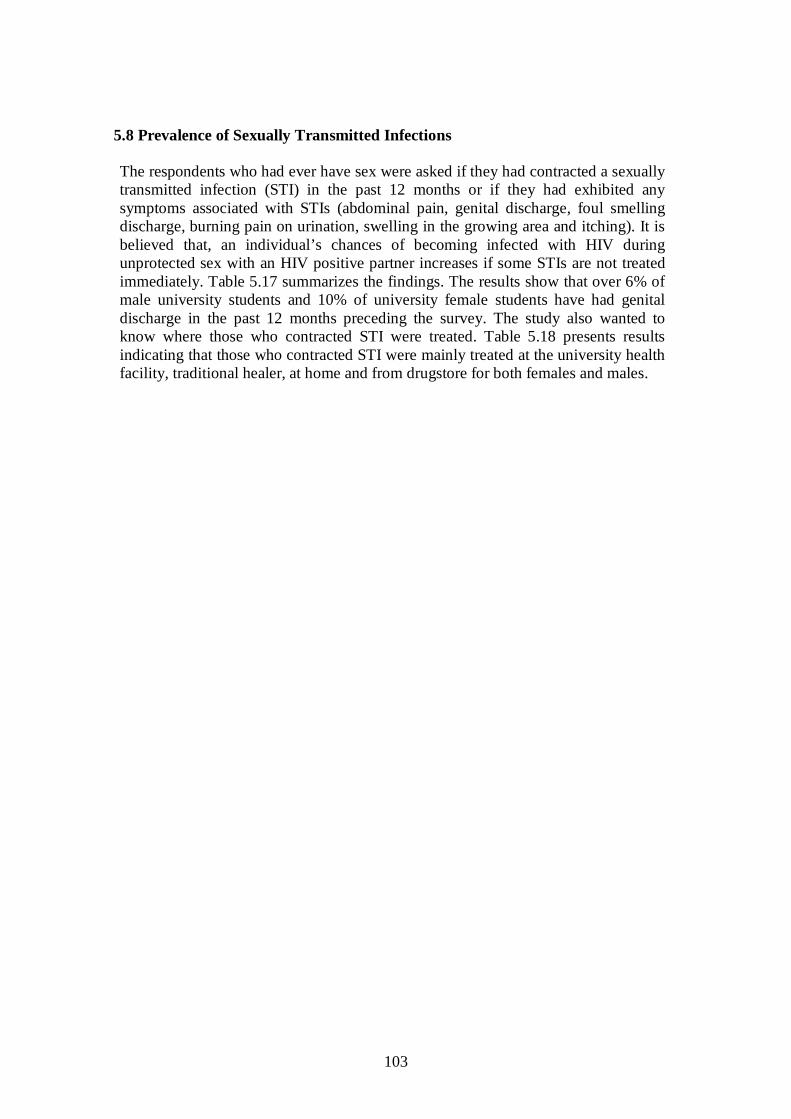
103
5.8 Prevalence of Sexually Transmitted Infections The respondents who had ever have sex were asked if they had contracted a sexually transmitted infection (STI) in the past 12 months or if they had exhibited any symptoms associated with STIs (abdominal pain, genital discharge, foul smelling discharge, burning pain on urination, swelling in the growing area and itching). It is believed that, an individual’s chances of becoming infected with HIV during unprotected sex with an HIV positive partner increases if some STIs are not treated immediately. Table 5.17 summarizes the findings. The results show that over 6% of male university students and 10% of university female students have had genital discharge in the past 12 months preceding the survey. The study also wanted to know where those who contracted STI were treated. Table 5.18 presents results indicating that those who contracted STI were mainly treated at the university health facility, traditional healer, at home and from drugstore for both females and males.

104
Table 5.17 Sexual Transmitted Infections: Male and Female students
Male students Female students
Background Characteristics G
enita
l di
scha
rge
durin
g th
e pa
st 1
2 m
onth
s
Gen
ital u
lcer
du
ring
the
past
12
mon
ths
Got
trea
ted
Num
ber
Gen
ital
disc
harg
e du
ring
the
past
12
mon
ths
Gen
ital u
lcer
du
ring
the
past
12
mon
ths
Got
trea
ted
Num
ber
Age group 19 years or under 9.1 100.0 .0 10 17.6 100.0 100.0 254 20-24 3.5 100.0 100.0 469 16.8 100.0 90.9 259 25-29 5.1 100.0 80.0 271 12.7 100.0 100.0 46 30-34 5.0 100.0 100.0 77 8.0 100.0 100.0 11 35-39 .0 .0 .0 21 .0 0 0 17 40-44 .0 .0 .0 22 .0 0 0 1 45-49 .0 .0 .0 10 .0 0 0 254 50 plus 5.6 100.0 66.7 86 7.8 100.0 .0 259 Marital status 46 Married 2.6 100.0 100.0 168 11.0 100.0 100.0 11 Cohabited 16.7 100.0 100.0 31 29.6 100.0 100.0 17 Divorced .0 .0 .o 0 .0 0 0 1 Widowed .0 .0 .0 1 .0 0 254 Separated 14.3 100.0 100.0 5 .0 0 0 259 Single 4.3 100.0 85.7 547 15.3 100.0 81.3 46 Accommodation 11 parents home 2.8 .0 .0 80 12.7 100.0 100. 17 Guardian .0 100.0 100.0 29 30.8 100.0 100.0 1 here at the campus 4.5 100.0 83.3 441 16.1 100.0 92.3 254 at univ hostel outside campus
4.8 100.0 100.0 200 9.8 100.0 83.3 259
private apartment 3.9 100.0 83.3 247 15.9 100.0 85.7 46 Academic year 11 first year 4.1 100.0 100.0 340 9.4 100.0 75.0 17 second year 4.9 100.0 1.4 297 18.2 100.0 88.9 1 third year 3.5 100.0 100.0 318 14.7 100.0 100.0 254 fourth year 7.9 100.0 100.0 39 27.8 0 0 259 fifth year .0 .0 .0 14 12.5 0 0 46 University 11 UDSM 3.6 100.0 100.0 373 12.7 100.0 75.0 17 MUHAS 6.3 100.0 80.0 85 31.3 100.0 100.0 1 SUA 5.9 .0 .0 94 4.8 254 MZUMBE 4.1 100.0 66.7 173 23.7 100.0 100.0 259 TUMAINI 2.0 100.0 100.0 138 13.2 100.0 100.0 46 SAUT 4.8 100.0 00. 153 10.9 100.0 100.0 11 Sponsorship 17 Government 4.5 100.0 84.6 801 15.0 100.0 85. 1 Private 1.9 100.0 100. 175 14.3 100.0 100.0 254 Program mode 259 part time .0 100.0 .0 15 .0 0 0 46 full time 4.1 100.0 87.5 983 15.1 100.0 89.7 11 Average Expenditure per semester
17
Up to 500,000 3.2 100.0 100.0 384 10.1 100.0 83.3 1 500001-1,000,000 4.9 100.0 84.6 500 18.1 100.0 90.9 254 1,000,001-1,500,000 5.0 100.0 100.0 82 17.5 100.0 100.0 259 1,500,001-2,000,000 .0 100.0 100.0 13 13.3 0 0 46 2,000,001-2,500,000 3.2 .0 .0 37 29.4 0 0 11 More than 2,500,000 .0 .0 .0 1 .0 0 0 17
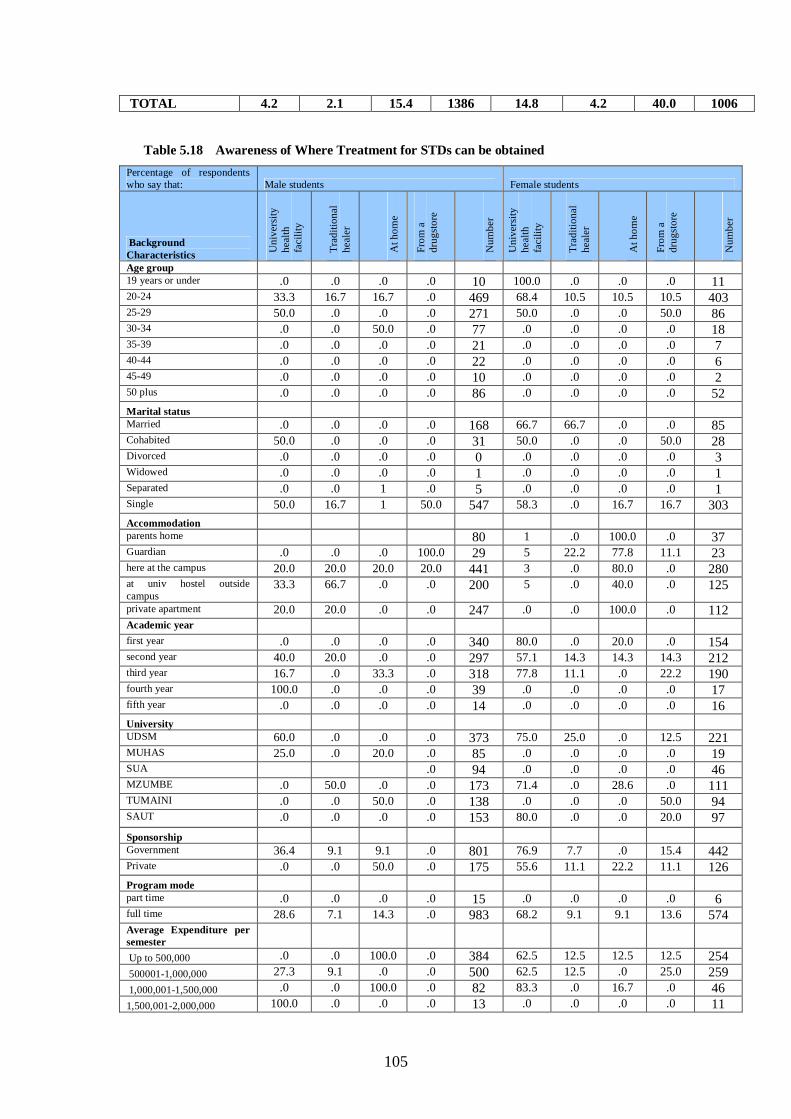
105
TOTAL 4.2 2.1 15.4 1386 14.8 4.2 40.0 1006
Table 5.18 Awareness of Where Treatment for STDs can be obtained Percentage of respondents who say that: Male students Female students
Background Characteristics U
nive
rsity
he
alth
fa
cilit
y
Trad
ition
al
heal
er
At h
ome
From
a
drug
stor
e
Num
ber
Uni
vers
ity
heal
th
faci
lity
Trad
ition
al
heal
er
At h
ome
From
a
drug
stor
e
Num
ber
Age group 19 years or under .0 .0 .0 .0 10 100.0 .0 .0 .0 11 20-24 33.3 16.7 16.7 .0 469 68.4 10.5 10.5 10.5 403 25-29 50.0 .0 .0 .0 271 50.0 .0 .0 50.0 86 30-34 .0 .0 50.0 .0 77 .0 .0 .0 .0 18 35-39 .0 .0 .0 .0 21 .0 .0 .0 .0 7 40-44 .0 .0 .0 .0 22 .0 .0 .0 .0 6 45-49 .0 .0 .0 .0 10 .0 .0 .0 .0 2 50 plus .0 .0 .0 .0 86 .0 .0 .0 .0 52 Marital status Married .0 .0 .0 .0 168 66.7 66.7 .0 .0 85 Cohabited 50.0 .0 .0 .0 31 50.0 .0 .0 50.0 28 Divorced .0 .0 .0 .0 0 .0 .0 .0 .0 3 Widowed .0 .0 .0 .0 1 .0 .0 .0 .0 1 Separated .0 .0 1 .0 5 .0 .0 .0 .0 1 Single 50.0 16.7 1 50.0 547 58.3 .0 16.7 16.7 303 Accommodation parents home 80 1 .0 100.0 .0 37 Guardian .0 .0 .0 100.0 29 5 22.2 77.8 11.1 23 here at the campus 20.0 20.0 20.0 20.0 441 3 .0 80.0 .0 280 at univ hostel outside campus
33.3 66.7 .0 .0 200 5 .0 40.0 .0 125
private apartment 20.0 20.0 .0 .0 247 .0 .0 100.0 .0 112 Academic year first year .0 .0 .0 .0 340 80.0 .0 20.0 .0 154 second year 40.0 20.0 .0 .0 297 57.1 14.3 14.3 14.3 212 third year 16.7 .0 33.3 .0 318 77.8 11.1 .0 22.2 190 fourth year 100.0 .0 .0 .0 39 .0 .0 .0 .0 17 fifth year .0 .0 .0 .0 14 .0 .0 .0 .0 16 University UDSM 60.0 .0 .0 .0 373 75.0 25.0 .0 12.5 221 MUHAS 25.0 .0 20.0 .0 85 .0 .0 .0 .0 19 SUA .0 94 .0 .0 .0 .0 46 MZUMBE .0 50.0 .0 .0 173 71.4 .0 28.6 .0 111 TUMAINI .0 .0 50.0 .0 138 .0 .0 .0 50.0 94 SAUT .0 .0 .0 .0 153 80.0 .0 .0 20.0 97 Sponsorship Government 36.4 9.1 9.1 .0 801 76.9 7.7 .0 15.4 442 Private .0 .0 50.0 .0 175 55.6 11.1 22.2 11.1 126 Program mode part time .0 .0 .0 .0 15 .0 .0 .0 .0 6 full time 28.6 7.1 14.3 .0 983 68.2 9.1 9.1 13.6 574 Average Expenditure per semester
Up to 500,000 .0 .0 100.0 .0 384 62.5 12.5 12.5 12.5 254 500001-1,000,000 27.3 9.1 .0 .0 500 62.5 12.5 .0 25.0 259 1,000,001-1,500,000 .0 .0 100.0 .0 82 83.3 .0 16.7 .0 46 1,500,001-2,000,000 100.0 .0 .0 .0 13 .0 .0 .0 .0 11
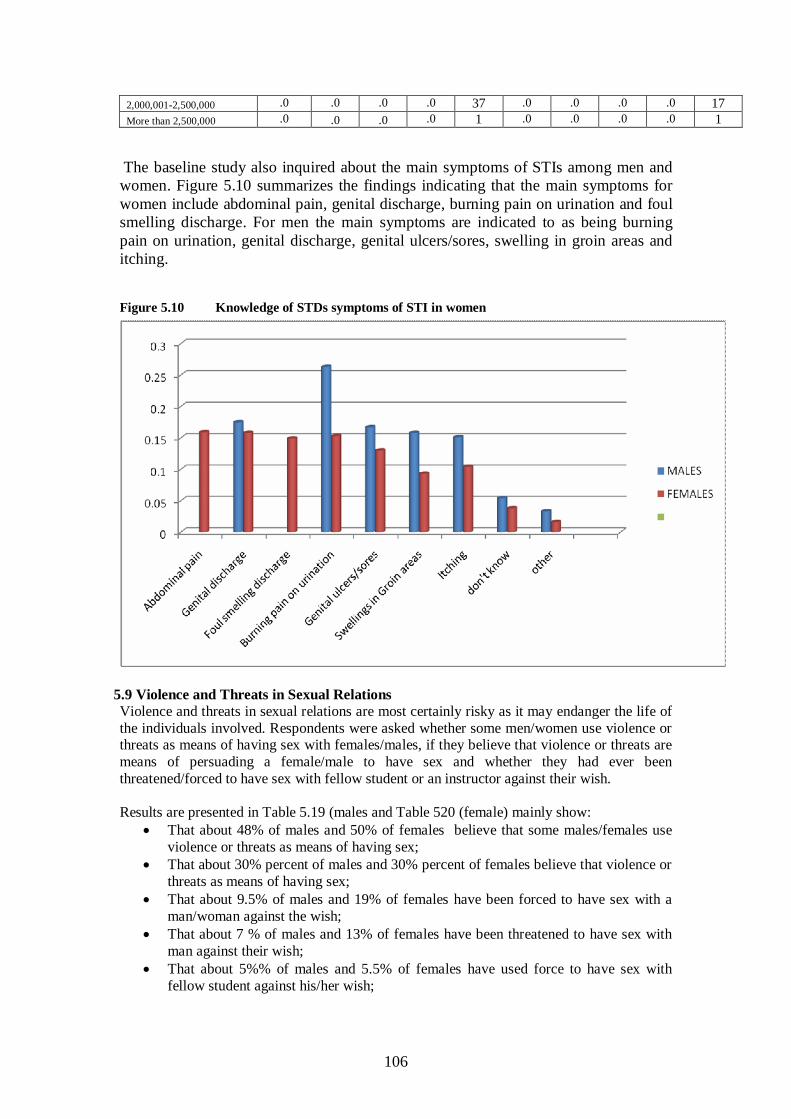
106
2,000,001-2,500,000 .0 .0 .0 .0 37 .0 .0 .0 .0 17 More than 2,500,000 .0 .0 .0 .0 1 .0 .0 .0 .0 1
The baseline study also inquired about the main symptoms of STIs among men and women. Figure 5.10 summarizes the findings indicating that the main symptoms for women include abdominal pain, genital discharge, burning pain on urination and foul smelling discharge. For men the main symptoms are indicated to as being burning pain on urination, genital discharge, genital ulcers/sores, swelling in groin areas and itching.
Figure 5.10 Knowledge of STDs symptoms of STI in women
5.9 Violence and Threats in Sexual Relations Violence and threats in sexual relations are most certainly risky as it may endanger the life of the individuals involved. Respondents were asked whether some men/women use violence or threats as means of having sex with females/males, if they believe that violence or threats are means of persuading a female/male to have sex and whether they had ever been threatened/forced to have sex with fellow student or an instructor against their wish. Results are presented in Table 5.19 (males and Table 520 (female) mainly show:
That about 48% of males and 50% of females believe that some males/females use violence or threats as means of having sex;
That about 30% percent of males and 30% percent of females believe that violence or threats as means of having sex;
That about 9.5% of males and 19% of females have been forced to have sex with a man/woman against the wish;
That about 7 % of males and 13% of females have been threatened to have sex with man against their wish;
That about 5%% of males and 5.5% of females have used force to have sex with fellow student against his/her wish;

107
That about 1% of males and 3.7% of females have been forced to have sex with an instructor against ones wish
That about 1% of males and 4.2% of females have been threatened to have sex with an instructor against ones wish
The belief that some males/females use violence or threats as means of having sex varies significantly with name of university in the case of females.
Table 5.19 Violence and Threats in Sexual Relations: Males
Background Characteristics Use
of
vi
olen
ce
or
thre
ats
as
mea
ns
of
havi
ng se
x
Bel
ieve
tha
t vi
olen
ce o
r th
reat
s as
m
eans
of
ha
ving
sex
Forc
ed to
hav
e se
x w
ith
a m
an/w
oman
ag
ains
t th
e w
ish
Th
reat
s to
hav
e se
x w
ith
man
aga
inst
you
r wis
h U
se o
f for
ce to
hav
e se
x w
ith
fello
w
stud
ent
agai
nst y
our w
ish
sex
with
yo
ur
fello
w
stud
ent
agai
nst
your
w
ish
Use
of f
orce
to h
ave
sex
with
an
in
stru
ctor
ag
ains
t you
r wis
h U
se o
f th
reat
s to
hav
e se
x w
ith
an
inst
ruct
or
agai
nst y
our w
ish
Num
ber o
f mal
es
Age group 19 years or under 30.0 33.3 20.0 20.0 10.0 10.0 11.1 11.1 10 20-24 51.5 29.5 10.0 6.3 5.6 3.6 1.5 1.1 469 25-29 49.7 32.2 10.1 8.4 5.3 3.7 .7 1.0 271 30-34 43.4 28.2 9.1 6.6 6.4 6.5 1.4 2.6 77 35-39 47.8 30.4 .0 4.3 8.7 4.5 .0 .0 21 40-44 30.4 30.4 .0 4.2 .0 .0 .0 .0 22 45-49 9.1 18.2 .0 .0 .0 .0 .0 .0 10 50 plus 46.5 19.2 5.0 4.0 4.0 3.0 .0 1.0 86 Marital status Married 43.8 30.1 6.1 6.1 5.4 4.8 2.1 3.5 168 Cohabited 62.1 30.0 20.0 17.2 20.0 13.8 .0 .0 31 Divorced 0 Widowed 100.0 100.0 .0 .0 .0 .0 .0 .0 1 Separated 33.3 16.7 .0 16.7 16.7 16.7 .0 .0 5 Single 49.4 28.9 10.3 7.2 5.6 3.5 1.0 1.0 547
Accommodation
parents home 50.6 33.7 10.5 3.5 3.4 3.4 .0 80 Guardian 53.3 31.0 6.7 3.3 3.2 3.2 3.2 29 here at the campus 47.5 32.4 8.0 6.8 3.2 3.2 1.4 441 at univ hostel outside campus 49.0 23.6 10.8 8.4 4.7 4.7 .8 200 private apartment 50.2 26.5 10.9 7.3 4.7 4.7 1.8 247 Academic year first year 45.2 27.3 8.3 7.0 5.1 4.0 .8 .8 340 second year 50.3 29.6 10.1 6.0 5.8 4.3 1.8 1.8 297 third year 51.2 30.5 10.5 7.8 5.6 3.6 .9 .9 318 fourth year 47.7 30.4 6.8 6.8 6.7 2.3 2.2 2.3 39 fifth year 55.6 37.5 .0 .0 .0 .0 .0 5.9 14
University
UDSM 10.4 26.7 10.4 8.4 6.3 3.8 .9 .7 373 MUHAS 3.5 28.1 3.5 1.8 1.7 1.7 .0 .9 85 SUA 8.2 30.9 8.2 6.2 6.1 5.2 2.1 2.1 94 MZUMBE 11.9 28.2 11.9 7.9 5.6 3.9 1.7 2.8 173 TUMAINI 9.8 35.9 9.8 6.4 5.0 3.6 .0 .0 138 SAUT 7.4 30.9 7.4 6.1 6.0 5.4 2.7 2.0 153
Sponsorship Government 48.7 28.5 8.7 6.3 4.8 3.6 81.8 .9 801 Private 49.0 33.3 11.5 7.9 6.8 3.7 1.0 1.6 175
Program mode
part time 56.3 11.8 6.7 5.9 12.5 6.3 .0 .0 15 full time 48.7 29.4 9.3 6.7 5.4 3.8 1.1 1.2 983
Average Expenditure per semester
Up to 500,000 45.5 31.4 9.3 7.7 7.7 5.7 4.3 1.5 384
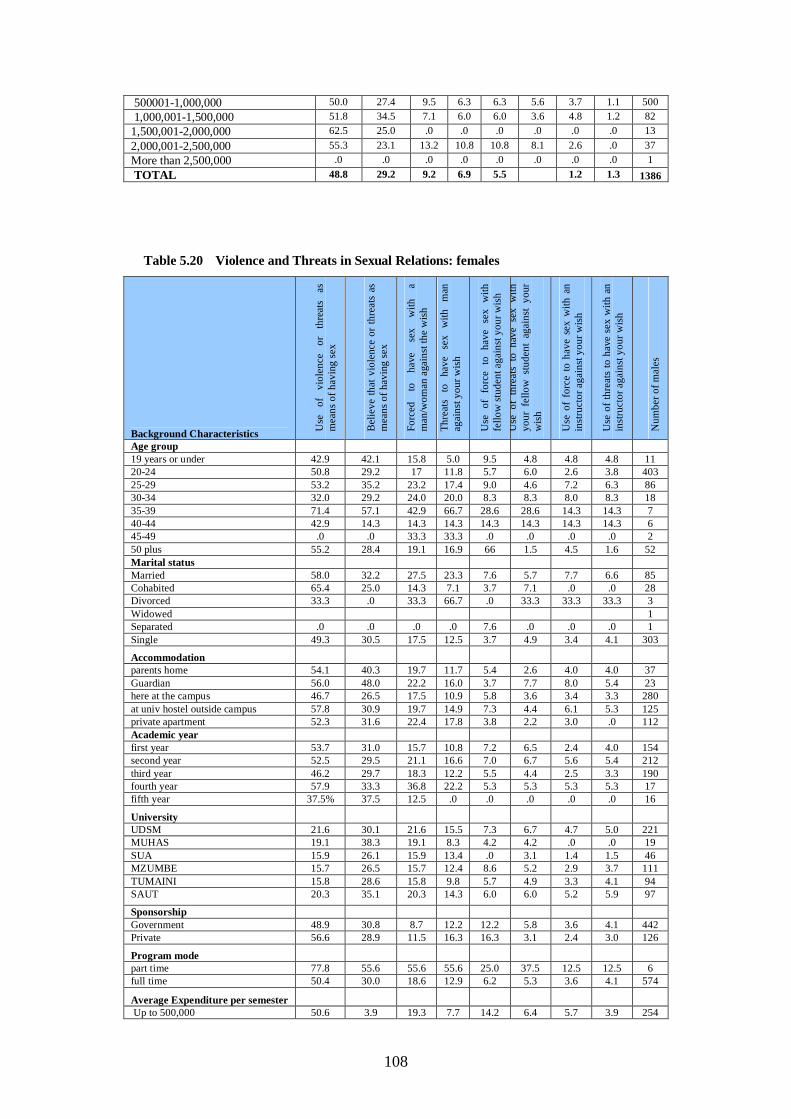
108
500001-1,000,000 50.0 27.4 9.5 6.3 6.3 5.6 3.7 1.1 500 1,000,001-1,500,000 51.8 34.5 7.1 6.0 6.0 3.6 4.8 1.2 82 1,500,001-2,000,000 62.5 25.0 .0 .0 .0 .0 .0 .0 13 2,000,001-2,500,000 55.3 23.1 13.2 10.8 10.8 8.1 2.6 .0 37 More than 2,500,000 .0 .0 .0 .0 .0 .0 .0 .0 1 TOTAL 48.8 29.2 9.2 6.9 5.5 1.2 1.3 1386
Table 5.20 Violence and Threats in Sexual Relations: females
Background Characteristics Use
of
vi
olen
ce
or
thre
ats
as
mea
ns o
f hav
ing
sex
Bel
ieve
that
vio
lenc
e or
thre
ats
as
mea
ns o
f hav
ing
sex
Forc
ed
to
have
se
x w
ith
a m
an/w
oman
aga
inst
the
wis
h
Thre
ats
to
have
se
x w
ith
man
ag
ains
t you
r wis
h
Use
of
forc
e to
hav
e se
x w
ith
fello
w st
uden
t aga
inst
you
r wis
h U
se o
f th
reat
s to
hav
e se
x w
ith
your
fel
low
stu
dent
aga
inst
you
r w
ish
Use
of
forc
e to
hav
e se
x w
ith a
n in
stru
ctor
aga
inst
you
r wis
h
Use
of t
hrea
ts to
hav
e se
x w
ith a
n in
stru
ctor
aga
inst
you
r wis
h
Num
ber o
f mal
es
Age group 19 years or under 42.9 42.1 15.8 5.0 9.5 4.8 4.8 4.8 11 20-24 50.8 29.2 17 11.8 5.7 6.0 2.6 3.8 403 25-29 53.2 35.2 23.2 17.4 9.0 4.6 7.2 6.3 86 30-34 32.0 29.2 24.0 20.0 8.3 8.3 8.0 8.3 18 35-39 71.4 57.1 42.9 66.7 28.6 28.6 14.3 14.3 7 40-44 42.9 14.3 14.3 14.3 14.3 14.3 14.3 14.3 6 45-49 .0 .0 33.3 33.3 .0 .0 .0 .0 2 50 plus 55.2 28.4 19.1 16.9 66 1.5 4.5 1.6 52 Marital status Married 58.0 32.2 27.5 23.3 7.6 5.7 7.7 6.6 85 Cohabited 65.4 25.0 14.3 7.1 3.7 7.1 .0 .0 28 Divorced 33.3 .0 33.3 66.7 .0 33.3 33.3 33.3 3 Widowed 1 Separated .0 .0 .0 .0 7.6 .0 .0 .0 1 Single 49.3 30.5 17.5 12.5 3.7 4.9 3.4 4.1 303
Accommodation
parents home 54.1 40.3 19.7 11.7 5.4 2.6 4.0 4.0 37 Guardian 56.0 48.0 22.2 16.0 3.7 7.7 8.0 5.4 23 here at the campus 46.7 26.5 17.5 10.9 5.8 3.6 3.4 3.3 280 at univ hostel outside campus 57.8 30.9 19.7 14.9 7.3 4.4 6.1 5.3 125 private apartment 52.3 31.6 22.4 17.8 3.8 2.2 3.0 .0 112 Academic year first year 53.7 31.0 15.7 10.8 7.2 6.5 2.4 4.0 154 second year 52.5 29.5 21.1 16.6 7.0 6.7 5.6 5.4 212 third year 46.2 29.7 18.3 12.2 5.5 4.4 2.5 3.3 190 fourth year 57.9 33.3 36.8 22.2 5.3 5.3 5.3 5.3 17 fifth year 37.5% 37.5 12.5 .0 .0 .0 .0 .0 16
University
UDSM 21.6 30.1 21.6 15.5 7.3 6.7 4.7 5.0 221 MUHAS 19.1 38.3 19.1 8.3 4.2 4.2 .0 .0 19 SUA 15.9 26.1 15.9 13.4 .0 3.1 1.4 1.5 46 MZUMBE 15.7 26.5 15.7 12.4 8.6 5.2 2.9 3.7 111 TUMAINI 15.8 28.6 15.8 9.8 5.7 4.9 3.3 4.1 94 SAUT 20.3 35.1 20.3 14.3 6.0 6.0 5.2 5.9 97
Sponsorship Government 48.9 30.8 8.7 12.2 12.2 5.8 3.6 4.1 442 Private 56.6 28.9 11.5 16.3 16.3 3.1 2.4 3.0 126
Program mode
part time 77.8 55.6 55.6 55.6 25.0 37.5 12.5 12.5 6 full time 50.4 30.0 18.6 12.9 6.2 5.3 3.6 4.1 574
Average Expenditure per semester
Up to 500,000 50.6 3.9 19.3 7.7 14.2 6.4 5.7 3.9 254
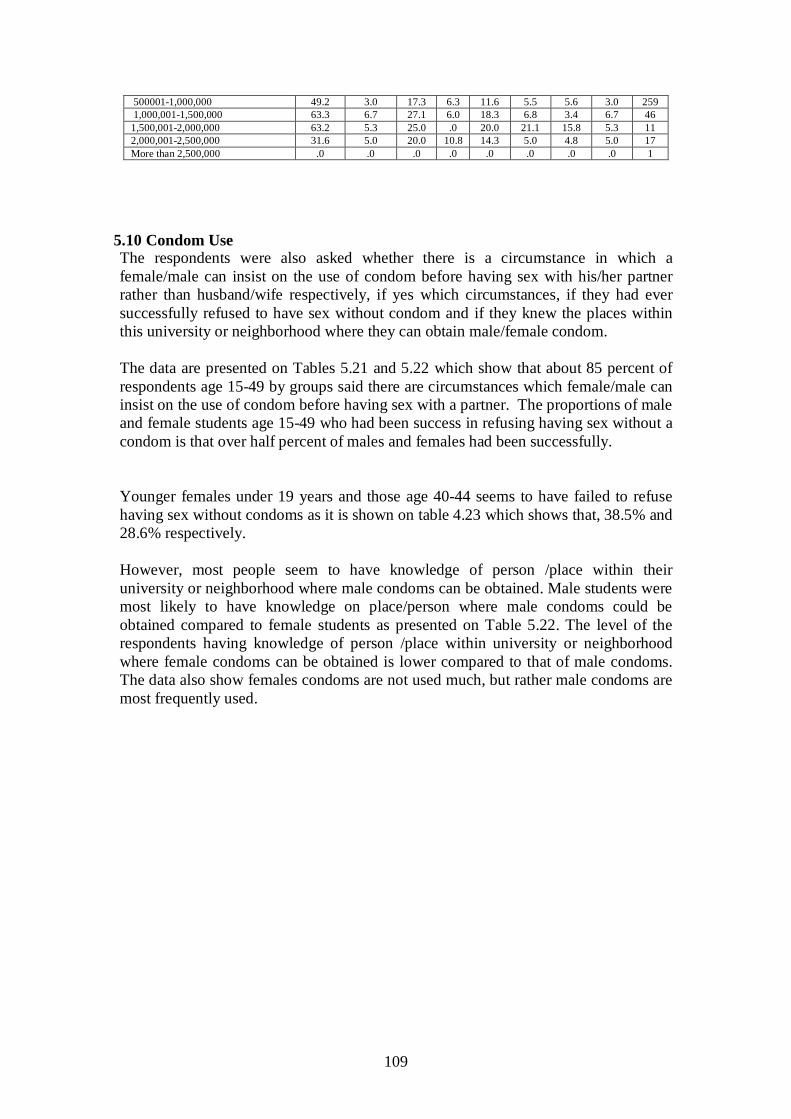
109
500001-1,000,000 49.2 3.0 17.3 6.3 11.6 5.5 5.6 3.0 259 1,000,001-1,500,000 63.3 6.7 27.1 6.0 18.3 6.8 3.4 6.7 46 1,500,001-2,000,000 63.2 5.3 25.0 .0 20.0 21.1 15.8 5.3 11 2,000,001-2,500,000 31.6 5.0 20.0 10.8 14.3 5.0 4.8 5.0 17 More than 2,500,000 .0 .0 .0 .0 .0 .0 .0 .0 1
5.10 Condom Use The respondents were also asked whether there is a circumstance in which a female/male can insist on the use of condom before having sex with his/her partner rather than husband/wife respectively, if yes which circumstances, if they had ever successfully refused to have sex without condom and if they knew the places within this university or neighborhood where they can obtain male/female condom. The data are presented on Tables 5.21 and 5.22 which show that about 85 percent of respondents age 15-49 by groups said there are circumstances which female/male can insist on the use of condom before having sex with a partner. The proportions of male and female students age 15-49 who had been success in refusing having sex without a condom is that over half percent of males and females had been successfully. Younger females under 19 years and those age 40-44 seems to have failed to refuse having sex without condoms as it is shown on table 4.23 which shows that, 38.5% and 28.6% respectively. However, most people seem to have knowledge of person /place within their university or neighborhood where male condoms can be obtained. Male students were most likely to have knowledge on place/person where male condoms could be obtained compared to female students as presented on Table 5.22. The level of the respondents having knowledge of person /place within university or neighborhood where female condoms can be obtained is lower compared to that of male condoms. The data also show females condoms are not used much, but rather male condoms are most frequently used.
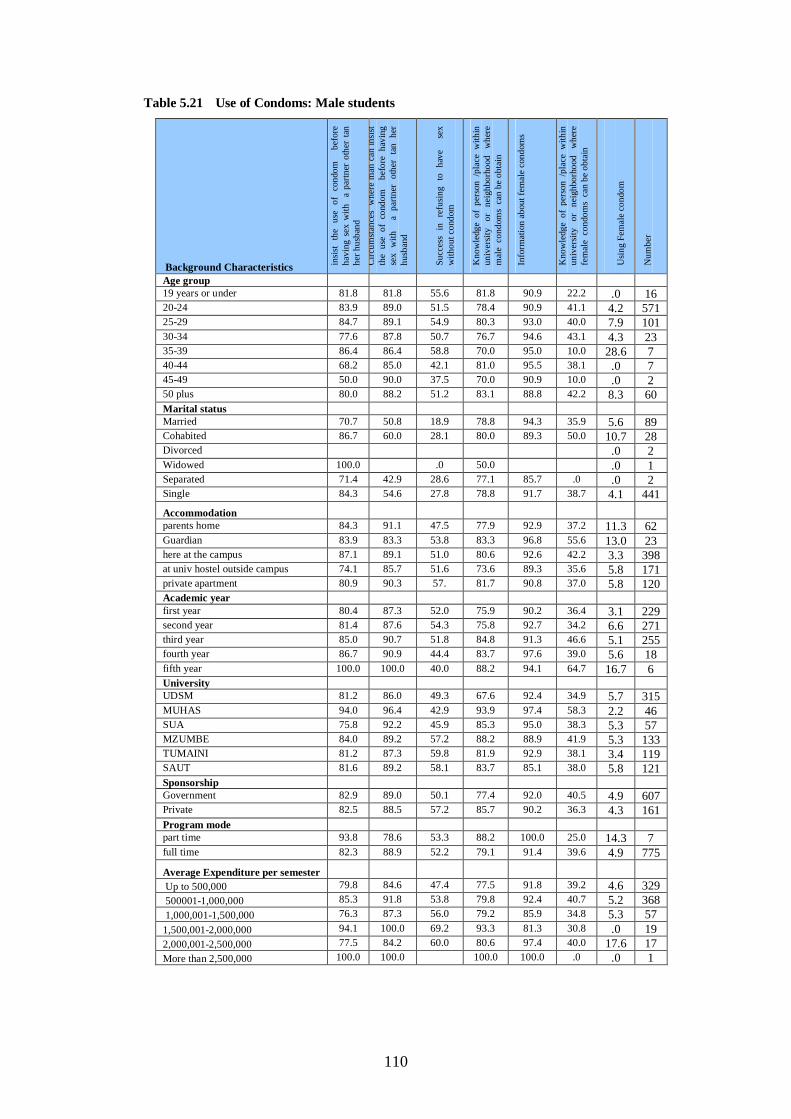
110
Table 5.21 Use of Condoms: Male students
Background Characteristics Circ
umsta
nces
w
here
fem
ale
can
insis
t th
e us
e of
con
dom
be
fore
ha
ving
sex
with
a
partn
er o
ther
tan
her h
usba
nd
Circ
umsta
nces
whe
re m
an c
an in
sist
the
use
of c
ondo
m
befo
re h
avin
g se
x w
ith
a pa
rtner
oth
er t
an h
er
husb
and
Succ
ess
in r
efus
ing
to h
ave
sex
w
ithou
t con
dom
Kno
wle
dge
of p
erso
n /p
lace
with
in
univ
ersit
y or
ne
ighb
orho
od
whe
re
mal
e c
ondo
ms
can
be o
btai
n
Info
rmat
ion
abou
t fem
ale
cond
oms
Kno
wle
dge
of p
erso
n /p
lace
with
in
univ
ersit
y or
ne
ighb
orho
od
whe
re
fem
ale
con
dom
s ca
n be
obt
ain
Usin
g Fe
mal
e co
ndom
Num
ber
Age group 19 years or under 81.8 81.8 55.6 81.8 90.9 22.2 .0 16 20-24 83.9 89.0 51.5 78.4 90.9 41.1 4.2 571 25-29 84.7 89.1 54.9 80.3 93.0 40.0 7.9 101 30-34 77.6 87.8 50.7 76.7 94.6 43.1 4.3 23 35-39 86.4 86.4 58.8 70.0 95.0 10.0 28.6 7 40-44 68.2 85.0 42.1 81.0 95.5 38.1 .0 7 45-49 50.0 90.0 37.5 70.0 90.9 10.0 .0 2 50 plus 80.0 88.2 51.2 83.1 88.8 42.2 8.3 60 Marital status Married 70.7 50.8 18.9 78.8 94.3 35.9 5.6 89 Cohabited 86.7 60.0 28.1 80.0 89.3 50.0 10.7 28 Divorced .0 2 Widowed 100.0 .0 50.0 .0 1 Separated 71.4 42.9 28.6 77.1 85.7 .0 .0 2 Single 84.3 54.6 27.8 78.8 91.7 38.7 4.1 441 Accommodation
parents home 84.3 91.1 47.5 77.9 92.9 37.2 11.3 62 Guardian 83.9 83.3 53.8 83.3 96.8 55.6 13.0 23 here at the campus 87.1 89.1 51.0 80.6 92.6 42.2 3.3 398 at univ hostel outside campus 74.1 85.7 51.6 73.6 89.3 35.6 5.8 171 private apartment 80.9 90.3 57. 81.7 90.8 37.0 5.8 120 Academic year first year 80.4 87.3 52.0 75.9 90.2 36.4 3.1 229 second year 81.4 87.6 54.3 75.8 92.7 34.2 6.6 271 third year 85.0 90.7 51.8 84.8 91.3 46.6 5.1 255 fourth year 86.7 90.9 44.4 83.7 97.6 39.0 5.6 18 fifth year 100.0 100.0 40.0 88.2 94.1 64.7 16.7 6 University UDSM 81.2 86.0 49.3 67.6 92.4 34.9 5.7 315 MUHAS 94.0 96.4 42.9 93.9 97.4 58.3 2.2 46 SUA 75.8 92.2 45.9 85.3 95.0 38.3 5.3 57 MZUMBE 84.0 89.2 57.2 88.2 88.9 41.9 5.3 133 TUMAINI 81.2 87.3 59.8 81.9 92.9 38.1 3.4 119 SAUT 81.6 89.2 58.1 83.7 85.1 38.0 5.8 121 Sponsorship Government 82.9 89.0 50.1 77.4 92.0 40.5 4.9 607 Private 82.5 88.5 57.2 85.7 90.2 36.3 4.3 161 Program mode part time 93.8 78.6 53.3 88.2 100.0 25.0 14.3 7 full time 82.3 88.9 52.2 79.1 91.4 39.6 4.9 775 Average Expenditure per semester
Up to 500,000 79.8 84.6 47.4 77.5 91.8 39.2 4.6 329 500001-1,000,000 85.3 91.8 53.8 79.8 92.4 40.7 5.2 368 1,000,001-1,500,000 76.3 87.3 56.0 79.2 85.9 34.8 5.3 57 1,500,001-2,000,000 94.1 100.0 69.2 93.3 81.3 30.8 .0 19 2,000,001-2,500,000 77.5 84.2 60.0 80.6 97.4 40.0 17.6 17 More than 2,500,000 100.0 100.0 100.0 100.0 .0 .0 1
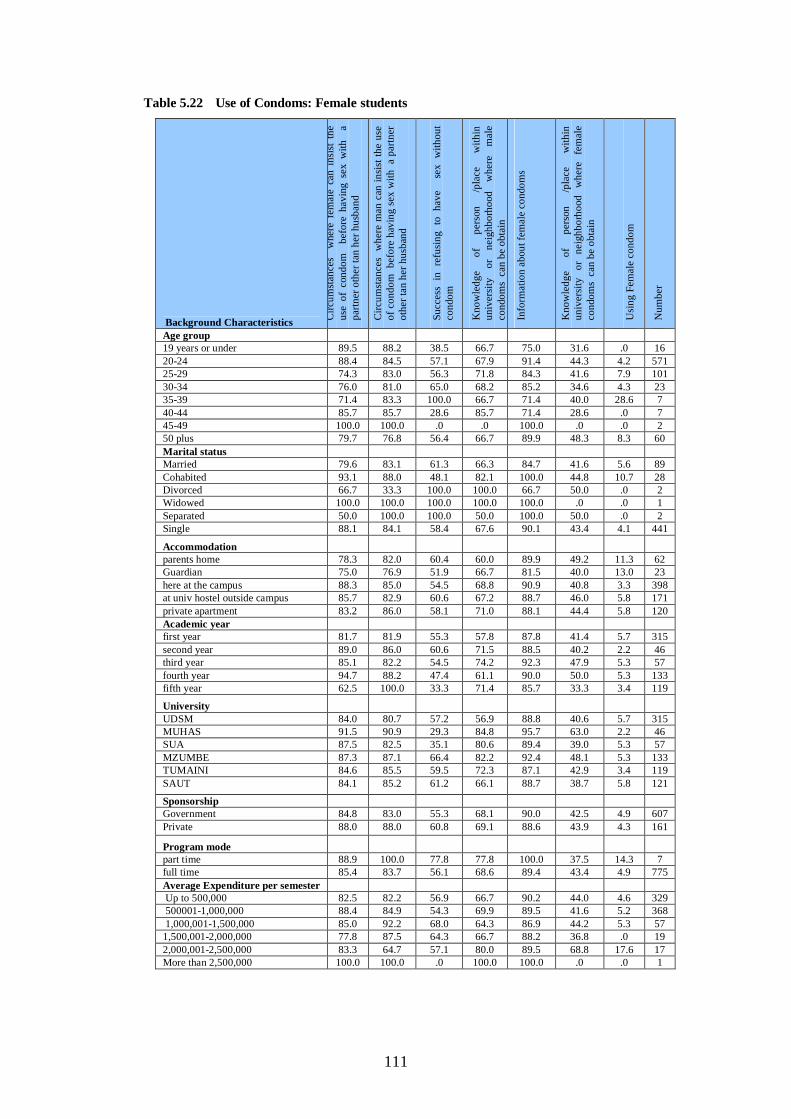
111
Table 5.22 Use of Condoms: Female students
Background Characteristics Circ
umst
ance
s w
here
fem
ale
can
insi
st t
he
use
of c
ondo
m
befo
re h
avin
g se
x w
ith
a pa
rtner
oth
er ta
n he
r hus
band
Circ
umst
ance
s w
here
man
can
insi
st th
e us
e of
con
dom
bef
ore
havi
ng s
ex w
ith a
par
tner
ot
her t
an h
er h
usba
nd
Succ
ess
in r
efus
ing
to h
ave
sex
with
out
cond
om
Kno
wle
dge
of
pers
on
/pla
ce
with
in
univ
ersi
ty
or
neig
hbor
hood
w
here
m
ale
co
ndom
s ca
n be
obt
ain
Info
rmat
ion
abou
t fem
ale
cond
oms
Kno
wle
dge
of
pers
on
/pla
ce
with
in
univ
ersi
ty
or
neig
hbor
hood
w
here
fe
mal
e
cond
oms
can
be o
btai
n
Usi
ng F
emal
e co
ndom
Num
ber
Age group 19 years or under 89.5 88.2 38.5 66.7 75.0 31.6 .0 16 20-24 88.4 84.5 57.1 67.9 91.4 44.3 4.2 571 25-29 74.3 83.0 56.3 71.8 84.3 41.6 7.9 101 30-34 76.0 81.0 65.0 68.2 85.2 34.6 4.3 23 35-39 71.4 83.3 100.0 66.7 71.4 40.0 28.6 7 40-44 85.7 85.7 28.6 85.7 71.4 28.6 .0 7 45-49 100.0 100.0 .0 .0 100.0 .0 .0 2 50 plus 79.7 76.8 56.4 66.7 89.9 48.3 8.3 60 Marital status Married 79.6 83.1 61.3 66.3 84.7 41.6 5.6 89 Cohabited 93.1 88.0 48.1 82.1 100.0 44.8 10.7 28 Divorced 66.7 33.3 100.0 100.0 66.7 50.0 .0 2 Widowed 100.0 100.0 100.0 100.0 100.0 .0 .0 1 Separated 50.0 100.0 100.0 50.0 100.0 50.0 .0 2 Single 88.1 84.1 58.4 67.6 90.1 43.4 4.1 441
Accommodation
parents home 78.3 82.0 60.4 60.0 89.9 49.2 11.3 62 Guardian 75.0 76.9 51.9 66.7 81.5 40.0 13.0 23 here at the campus 88.3 85.0 54.5 68.8 90.9 40.8 3.3 398 at univ hostel outside campus 85.7 82.9 60.6 67.2 88.7 46.0 5.8 171 private apartment 83.2 86.0 58.1 71.0 88.1 44.4 5.8 120 Academic year first year 81.7 81.9 55.3 57.8 87.8 41.4 5.7 315 second year 89.0 86.0 60.6 71.5 88.5 40.2 2.2 46 third year 85.1 82.2 54.5 74.2 92.3 47.9 5.3 57 fourth year 94.7 88.2 47.4 61.1 90.0 50.0 5.3 133 fifth year 62.5 100.0 33.3 71.4 85.7 33.3 3.4 119
University
UDSM 84.0 80.7 57.2 56.9 88.8 40.6 5.7 315 MUHAS 91.5 90.9 29.3 84.8 95.7 63.0 2.2 46 SUA 87.5 82.5 35.1 80.6 89.4 39.0 5.3 57 MZUMBE 87.3 87.1 66.4 82.2 92.4 48.1 5.3 133 TUMAINI 84.6 85.5 59.5 72.3 87.1 42.9 3.4 119 SAUT 84.1 85.2 61.2 66.1 88.7 38.7 5.8 121
Sponsorship Government 84.8 83.0 55.3 68.1 90.0 42.5 4.9 607 Private 88.0 88.0 60.8 69.1 88.6 43.9 4.3 161
Program mode
part time 88.9 100.0 77.8 77.8 100.0 37.5 14.3 7 full time 85.4 83.7 56.1 68.6 89.4 43.4 4.9 775 Average Expenditure per semester Up to 500,000 82.5 82.2 56.9 66.7 90.2 44.0 4.6 329 500001-1,000,000 88.4 84.9 54.3 69.9 89.5 41.6 5.2 368 1,000,001-1,500,000 85.0 92.2 68.0 64.3 86.9 44.2 5.3 57 1,500,001-2,000,000 77.8 87.5 64.3 66.7 88.2 36.8 .0 19 2,000,001-2,500,000 83.3 64.7 57.1 80.0 89.5 68.8 17.6 17 More than 2,500,000 100.0 100.0 .0 100.0 100.0 .0 .0 1

112
5.11 Prevalence of Drug and Alcohol Consumption Use of drugs and alcohol, research has shown, reduces self-consciousness and increases engagement in risky behavior. In this study respondents were asked if they had ever tested drugs and alcohol. Those who reported to have tested alcohol were further asked about the frequency of taking alcohol in the last four weeks preceding the survey. The results show that relatively a small proportion of university students have ever tested drugs. Comparatively, both male and female students had ever tested bhang than any other drug. Responses were too small to perform statistical computations by demographic variables. However, the number of users of drugs increases with increase in year of study. Alcohol consumption seems relatively common among male and female students. Almost a quarter of male students and slightly less than a quarter of female students had taken alcohol at least once a week within the last four weeks before the survey. Majority of these had engaged themselves in high risk sex within the last 12 moths preceding the survey.
Figure 5.11 Percentage of respondents who had ever tested drugs by gender
3.60.6 0.2 0.3 0.7
48.6
1.51 0.1 0.1 0.1 0.3
36.5
0.80
10
20
30
40
50
60
Bhang Cocaine Heroin Glue DrugInjection
Alcohol Other
Males Females

113
Figure 5.12 Percentage of respondents who had ever taken alcohol in the last 4 weeks by gender
2.4
13 11.4
41.8
2.3
29.1
0.4
7.5 8.7
46.9
2.4
34.1
0
5
1015
20
25
30
3540
45
50
everday once in a week less than once aweek
never dont know no response
MalesFemales
5.12. Mobility and HIV-Related Behaviour University staff and students are part of a highly mobile population of East Africa. In this regard University institutions may play an important role in the increased rate of HIV infection in the Lake Victoria Basin region. This is because Higher Education Institutions bring together people from around the nation and region by creating a migratory pull factor. Staff and students interact within the campuses as well as with the surrounding community before potentially returning to their initial place of residence or moving to a new destination, thus could be affected by and impacting a wide area.
5.12.1 Mobility by background Characteristics Universities take staff and students from all over the country. In addition, by the very nature of the university studies and learning, mobility cannot be avoided. Students and staff not only go back to where they came from but they also travel to do research and practical/field training. Mobility is correlated with patterns of reproductive and health seeking behavior. Students were asked if they had been away from their university in the past 12 months. Table 5.23 present’s distribution of male and female student’s age 19 or under-50 plus by mobility according to background characteristics. Findings show that 80.9% of male students who were mobile were single and 11.8% were married. The corresponding figure for the female students was 87% and 5.6% respectively. For male students who were not mobile 75% were single. The corresponding figure for female students was 74.1. In addition five out of ten male and female students who were mobile stayed in campus compared to non mobile where 54.8% and 41.7% of males and females respectively stayed in campus There was no big difference in terms of proportions of male and female students who were mobile across the first, second and third years of study. Of the male students who were mobile 28.7%, 30.8% and 35.3% were in the first, second and third year respectively. The corresponding proportions for female students were 30.2%, 31.7% and 36.5% respectively.
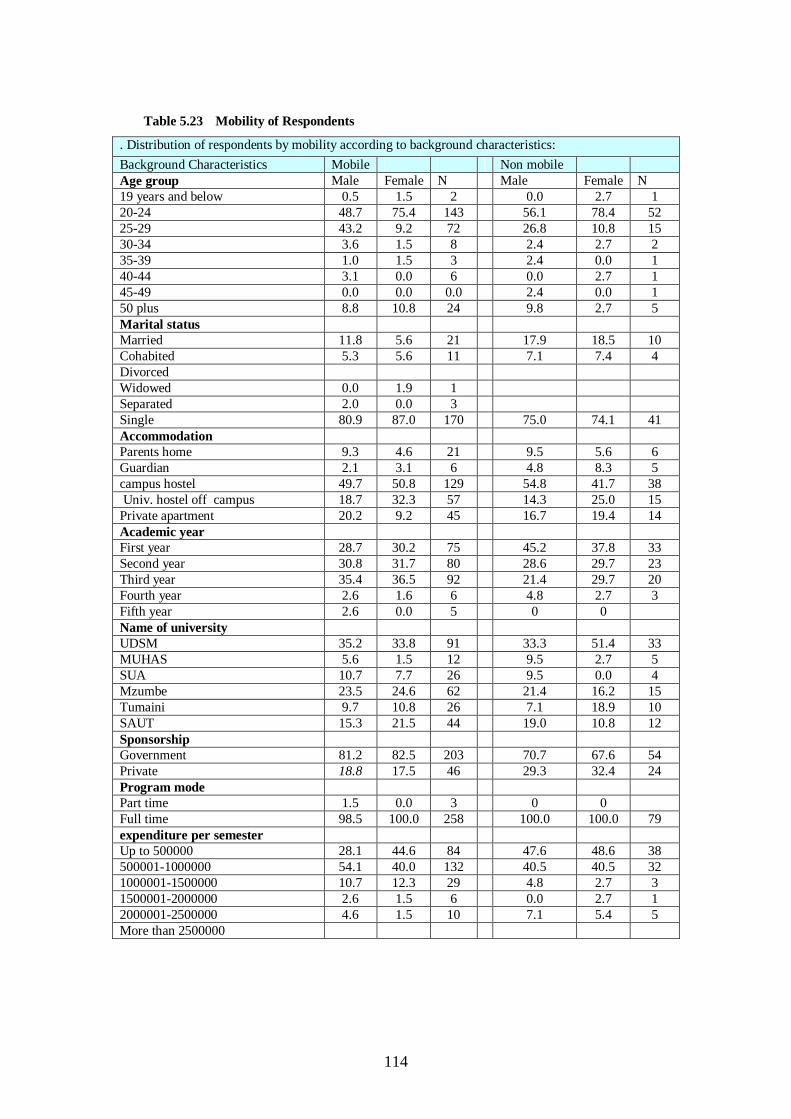
114
Table 5.23 Mobility of Respondents
. Distribution of respondents by mobility according to background characteristics: Background Characteristics Mobile Non mobile Age group Male Female N Male Female N 19 years and below 0.5 1.5 2 0.0 2.7 1 20-24 48.7 75.4 143 56.1 78.4 52 25-29 43.2 9.2 72 26.8 10.8 15 30-34 3.6 1.5 8 2.4 2.7 2 35-39 1.0 1.5 3 2.4 0.0 1 40-44 3.1 0.0 6 0.0 2.7 1 45-49 0.0 0.0 0.0 2.4 0.0 1 50 plus 8.8 10.8 24 9.8 2.7 5 Marital status Married 11.8 5.6 21 17.9 18.5 10 Cohabited 5.3 5.6 11 7.1 7.4 4 Divorced Widowed 0.0 1.9 1 Separated 2.0 0.0 3 Single 80.9 87.0 170 75.0 74.1 41 Accommodation Parents home 9.3 4.6 21 9.5 5.6 6 Guardian 2.1 3.1 6 4.8 8.3 5 campus hostel 49.7 50.8 129 54.8 41.7 38 Univ. hostel off campus 18.7 32.3 57 14.3 25.0 15 Private apartment 20.2 9.2 45 16.7 19.4 14 Academic year First year 28.7 30.2 75 45.2 37.8 33 Second year 30.8 31.7 80 28.6 29.7 23 Third year 35.4 36.5 92 21.4 29.7 20 Fourth year 2.6 1.6 6 4.8 2.7 3 Fifth year 2.6 0.0 5 0 0 Name of university UDSM 35.2 33.8 91 33.3 51.4 33 MUHAS 5.6 1.5 12 9.5 2.7 5 SUA 10.7 7.7 26 9.5 0.0 4 Mzumbe 23.5 24.6 62 21.4 16.2 15 Tumaini 9.7 10.8 26 7.1 18.9 10 SAUT 15.3 21.5 44 19.0 10.8 12 Sponsorship Government 81.2 82.5 203 70.7 67.6 54 Private 18.8 17.5 46 29.3 32.4 24 Program mode Part time 1.5 0.0 3 0 0 Full time 98.5 100.0 258 100.0 100.0 79 expenditure per semester Up to 500000 28.1 44.6 84 47.6 48.6 38 500001-1000000 54.1 40.0 132 40.5 40.5 32 1000001-1500000 10.7 12.3 29 4.8 2.7 3 1500001-2000000 2.6 1.5 6 0.0 2.7 1 2000001-2500000 4.6 1.5 10 7.1 5.4 5 More than 2500000
115
5.12.2 Mobility and HIV Related Behaviors While on transit or destination, both male and female students found to interact with people and developed relationships that put them on risk of contracting HIV. The study found that students engaged in penetrative sexual relationship during their passage and at the place of destination. The following tables 7.24, 5.25 and 5.26 present data on condom use, reason for condom use and whether correspondence with those with whom sexual relationship developed continued
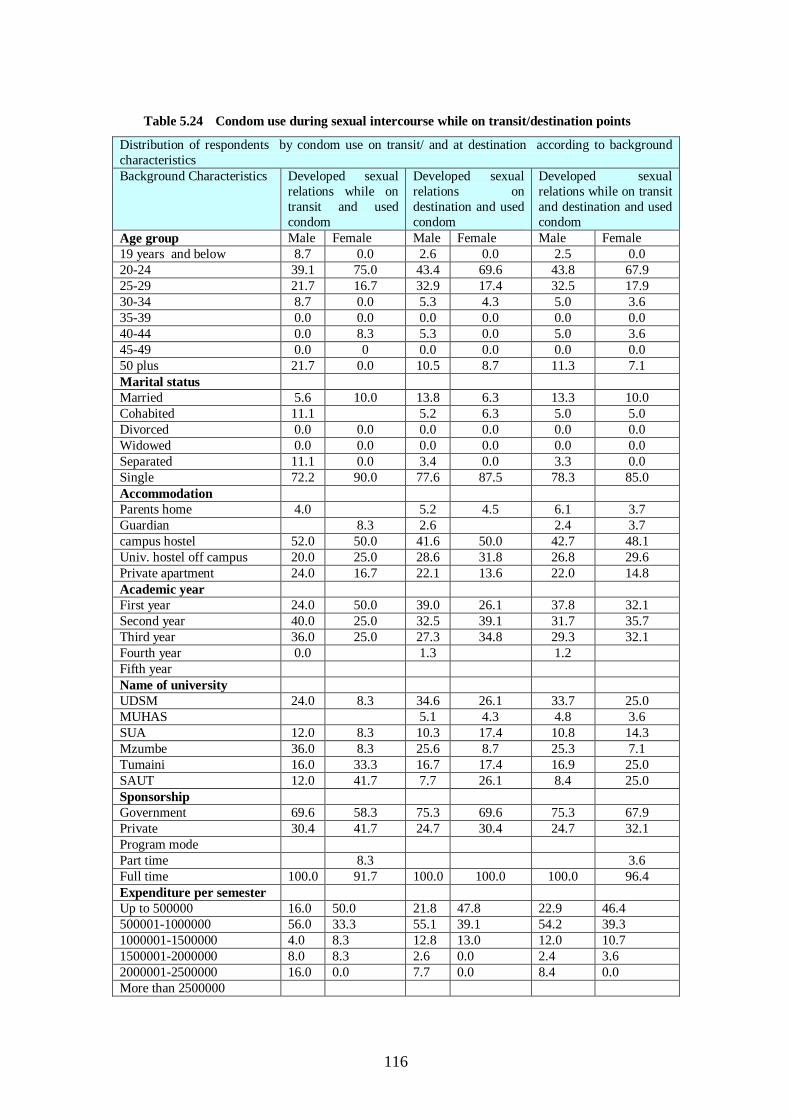
116
Table 5.24 Condom use during sexual intercourse while on transit/destination points
Distribution of respondents by condom use on transit/ and at destination according to background characteristics Background Characteristics Developed sexual
relations while on transit and used condom
Developed sexual relations on destination and used condom
Developed sexual relations while on transit and destination and used condom
Age group Male Female Male Female Male Female 19 years and below 8.7 0.0 2.6 0.0 2.5 0.0 20-24 39.1 75.0 43.4 69.6 43.8 67.9 25-29 21.7 16.7 32.9 17.4 32.5 17.9 30-34 8.7 0.0 5.3 4.3 5.0 3.6 35-39 0.0 0.0 0.0 0.0 0.0 0.0 40-44 0.0 8.3 5.3 0.0 5.0 3.6 45-49 0.0 0 0.0 0.0 0.0 0.0 50 plus 21.7 0.0 10.5 8.7 11.3 7.1 Marital status Married 5.6 10.0 13.8 6.3 13.3 10.0 Cohabited 11.1 5.2 6.3 5.0 5.0 Divorced 0.0 0.0 0.0 0.0 0.0 0.0 Widowed 0.0 0.0 0.0 0.0 0.0 0.0 Separated 11.1 0.0 3.4 0.0 3.3 0.0 Single 72.2 90.0 77.6 87.5 78.3 85.0 Accommodation Parents home 4.0 5.2 4.5 6.1 3.7 Guardian 8.3 2.6 2.4 3.7 campus hostel 52.0 50.0 41.6 50.0 42.7 48.1 Univ. hostel off campus 20.0 25.0 28.6 31.8 26.8 29.6 Private apartment 24.0 16.7 22.1 13.6 22.0 14.8 Academic year First year 24.0 50.0 39.0 26.1 37.8 32.1 Second year 40.0 25.0 32.5 39.1 31.7 35.7 Third year 36.0 25.0 27.3 34.8 29.3 32.1 Fourth year 0.0 1.3 1.2 Fifth year Name of university UDSM 24.0 8.3 34.6 26.1 33.7 25.0 MUHAS 5.1 4.3 4.8 3.6 SUA 12.0 8.3 10.3 17.4 10.8 14.3 Mzumbe 36.0 8.3 25.6 8.7 25.3 7.1 Tumaini 16.0 33.3 16.7 17.4 16.9 25.0 SAUT 12.0 41.7 7.7 26.1 8.4 25.0 Sponsorship Government 69.6 58.3 75.3 69.6 75.3 67.9 Private 30.4 41.7 24.7 30.4 24.7 32.1 Program mode Part time 8.3 3.6 Full time 100.0 91.7 100.0 100.0 100.0 96.4 Expenditure per semester Up to 500000 16.0 50.0 21.8 47.8 22.9 46.4 500001-1000000 56.0 33.3 55.1 39.1 54.2 39.3 1000001-1500000 4.0 8.3 12.8 13.0 12.0 10.7 1500001-2000000 8.0 8.3 2.6 0.0 2.4 3.6 2000001-2500000 16.0 0.0 7.7 0.0 8.4 0.0 More than 2500000
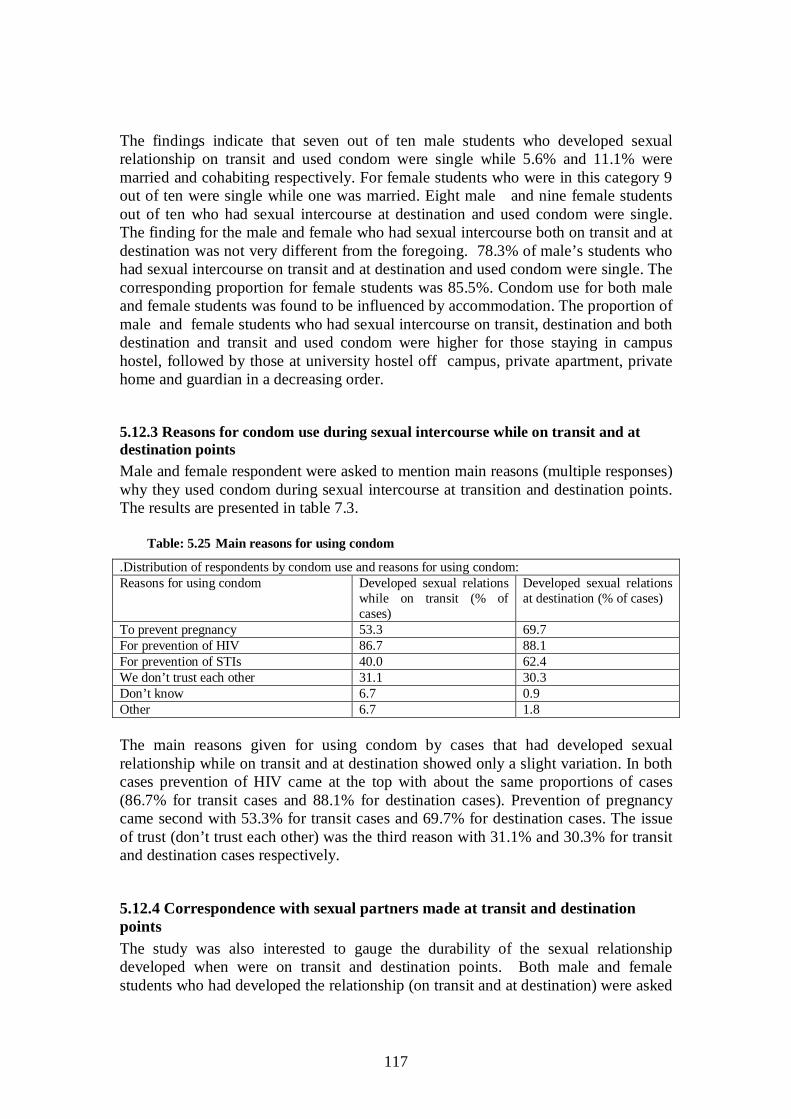
117
The findings indicate that seven out of ten male students who developed sexual relationship on transit and used condom were single while 5.6% and 11.1% were married and cohabiting respectively. For female students who were in this category 9 out of ten were single while one was married. Eight male and nine female students out of ten who had sexual intercourse at destination and used condom were single. The finding for the male and female who had sexual intercourse both on transit and at destination was not very different from the foregoing. 78.3% of male’s students who had sexual intercourse on transit and at destination and used condom were single. The corresponding proportion for female students was 85.5%. Condom use for both male and female students was found to be influenced by accommodation. The proportion of male and female students who had sexual intercourse on transit, destination and both destination and transit and used condom were higher for those staying in campus hostel, followed by those at university hostel off campus, private apartment, private home and guardian in a decreasing order.
5.12.3 Reasons for condom use during sexual intercourse while on transit and at destination points Male and female respondent were asked to mention main reasons (multiple responses) why they used condom during sexual intercourse at transition and destination points. The results are presented in table 7.3.
Table: 5.25 Main reasons for using condom
.Distribution of respondents by condom use and reasons for using condom: Reasons for using condom Developed sexual relations
while on transit (% of cases)
Developed sexual relations at destination (% of cases)
To prevent pregnancy 53.3 69.7 For prevention of HIV 86.7 88.1 For prevention of STIs 40.0 62.4 We don’t trust each other 31.1 30.3 Don’t know 6.7 0.9 Other 6.7 1.8 The main reasons given for using condom by cases that had developed sexual relationship while on transit and at destination showed only a slight variation. In both cases prevention of HIV came at the top with about the same proportions of cases (86.7% for transit cases and 88.1% for destination cases). Prevention of pregnancy came second with 53.3% for transit cases and 69.7% for destination cases. The issue of trust (don’t trust each other) was the third reason with 31.1% and 30.3% for transit and destination cases respectively.
5.12.4 Correspondence with sexual partners made at transit and destination points The study was also interested to gauge the durability of the sexual relationship developed when were on transit and destination points. Both male and female students who had developed the relationship (on transit and at destination) were asked
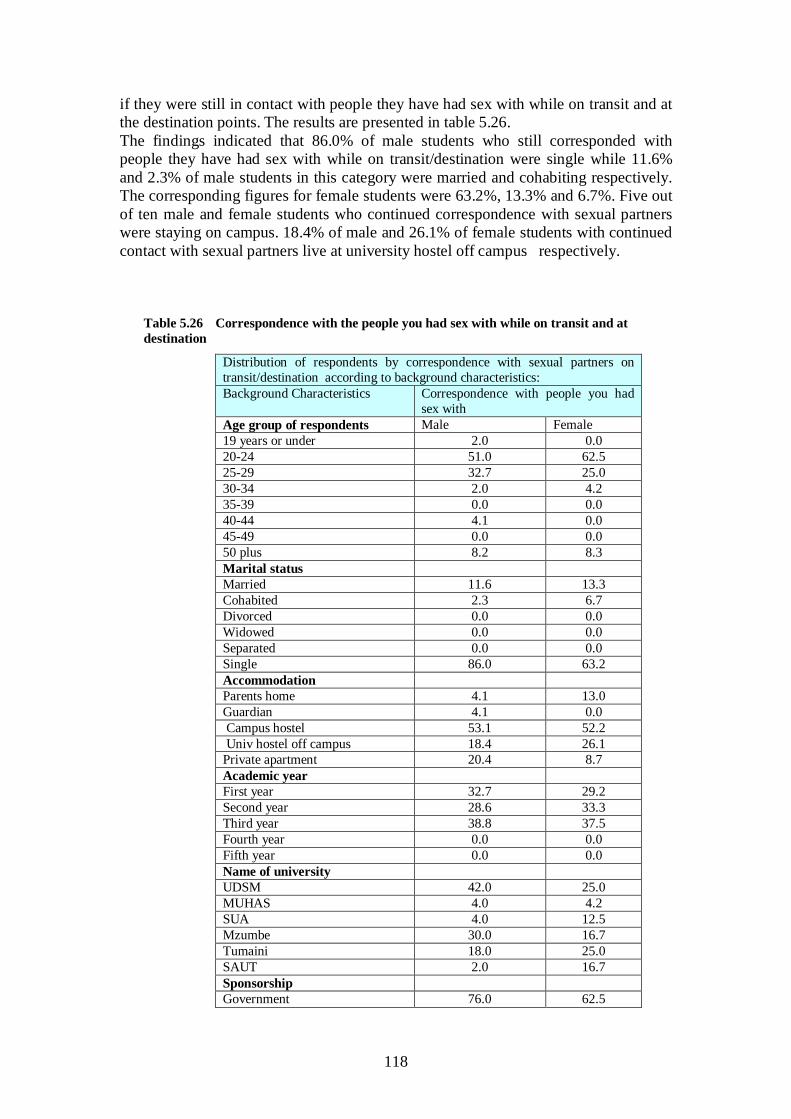
118
if they were still in contact with people they have had sex with while on transit and at the destination points. The results are presented in table 5.26. The findings indicated that 86.0% of male students who still corresponded with people they have had sex with while on transit/destination were single while 11.6% and 2.3% of male students in this category were married and cohabiting respectively. The corresponding figures for female students were 63.2%, 13.3% and 6.7%. Five out of ten male and female students who continued correspondence with sexual partners were staying on campus. 18.4% of male and 26.1% of female students with continued contact with sexual partners live at university hostel off campus respectively.
Table 5.26 Correspondence with the people you had sex with while on transit and at destination
Distribution of respondents by correspondence with sexual partners on transit/destination according to background characteristics: Background Characteristics Correspondence with people you had
sex with Age group of respondents Male Female 19 years or under 2.0 0.0 20-24 51.0 62.5 25-29 32.7 25.0 30-34 2.0 4.2 35-39 0.0 0.0 40-44 4.1 0.0 45-49 0.0 0.0 50 plus 8.2 8.3 Marital status Married 11.6 13.3 Cohabited 2.3 6.7 Divorced 0.0 0.0 Widowed 0.0 0.0 Separated 0.0 0.0 Single 86.0 63.2 Accommodation Parents home 4.1 13.0 Guardian 4.1 0.0 Campus hostel 53.1 52.2 Univ hostel off campus 18.4 26.1 Private apartment 20.4 8.7 Academic year First year 32.7 29.2 Second year 28.6 33.3 Third year 38.8 37.5 Fourth year 0.0 0.0 Fifth year 0.0 0.0 Name of university UDSM 42.0 25.0 MUHAS 4.0 4.2 SUA 4.0 12.5 Mzumbe 30.0 16.7 Tumaini 18.0 25.0 SAUT 2.0 16.7 Sponsorship Government 76.0 62.5
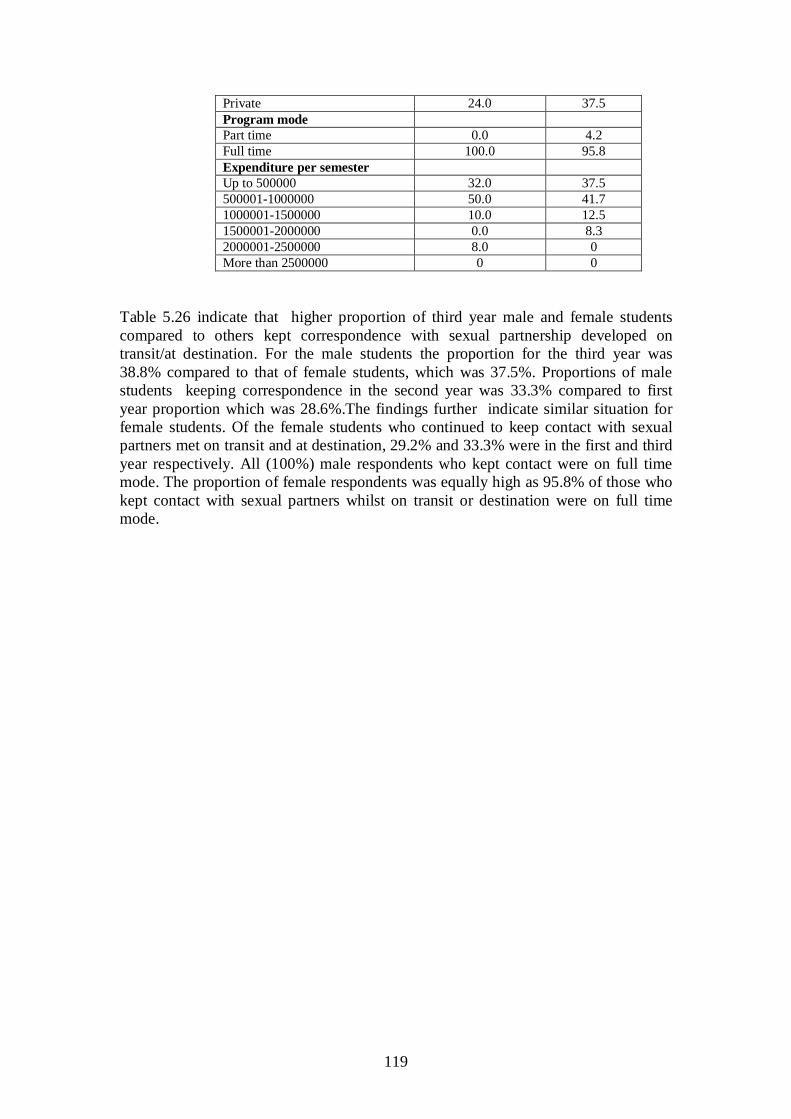
119
Private 24.0 37.5 Program mode Part time 0.0 4.2 Full time 100.0 95.8 Expenditure per semester Up to 500000 32.0 37.5 500001-1000000 50.0 41.7 1000001-1500000 10.0 12.5 1500001-2000000 0.0 8.3 2000001-2500000 8.0 0 More than 2500000 0 0
Table 5.26 indicate that higher proportion of third year male and female students compared to others kept correspondence with sexual partnership developed on transit/at destination. For the male students the proportion for the third year was 38.8% compared to that of female students, which was 37.5%. Proportions of male students keeping correspondence in the second year was 33.3% compared to first year proportion which was 28.6%.The findings further indicate similar situation for female students. Of the female students who continued to keep contact with sexual partners met on transit and at destination, 29.2% and 33.3% were in the first and third year respectively. All (100%) male respondents who kept contact were on full time mode. The proportion of female respondents was equally high as 95.8% of those who kept contact with sexual partners whilst on transit or destination were on full time mode.
120
CHAPTER 6 HIV PREVALENCE 6.1 Overview Prior to the 2003-04 Tanzania HIV and AIDS Indicator Survey (THIS), national HIV prevalence was estimated using prevalence from blood donors and sentinel surveillance among pregnant women attending selected antenatal care (ANC) services. Another source of information that was sometimes used in estimating HIV prevalence rates in the general population was data collected from blood donations. Another source of information on HIV prevalence is the results of the National Voluntary HIV Testing Campaign which took place in all parts of the country between July 2007 and April 2008. During this period, over 4 million Tanzanians were tested for HIV and results were made available to those tested. Finally, in 2004-2005 and 2007-2008, Tanzania conducted national survey by name “Tanzania HIV and Malaria Indicator Survey- THMIS based on which a clearer understanding of the magnitude and pattern of HIV infection in both Mainland Tanzania and Zanzibar were established. While the rates of HIV infection from the above-mentioned sources are important and are being used in various settings, they cannot be used as a reliable estimate of the HIV prevalence rate for the Tanzania university population due to variations in geographical coverage, differences in capturing representativeness of the sample as well exclusion of institutions (including universities) and some socio-economic and demographic variables in the previous studies. .
6.2 Coverage of HIV Testing The results in this sub-section show comparison of coverage of HIV testing by socio-demographic characteristics. Also, in order to test whether there were a significant difference between those who were interviewed and tested for HIV and those who were interviewed but did not provide blood for HIV testing, mean comparison within socio-demographic variables about HIV testing behaviour and a chi-square test were performed. All students who were sampled for behavioural survey and who filled the questionnaire were eligible for the HIV testing component. Tables 5.1, 5.2 and 5.3 present the coverage rates for HIV testing for eligible respondents by background characteristics of respondents. Both tables are based on respondents who were eligible to be tested. They show the proportion of students who were interviewed and consented to HIV testing and the proportion that was interviewed and refused to provide blood after filling the questionnaire. No technical errors (such as mismatch of questionnaires and blood samples, or technical problems in taking blood) were reported during collection or processing of blood. A total of 2426 students (1006 female students, 1348 male students and 72 students who did not indicate their sex on the questionnaire) were eligible for HIV testing (Table 6.1). Overall, the proportion of eligible students who provided a blood sample for HIV testing was 51.4 percent. Variations in coverage of HIV testing were noted among male students and female students and among universities (Tables 6.2 and 6.7). The results show that coverage of HIV testing by university ranges from 30.4 percent at Mzumbe University to 96.5 percent at SUA. Tables 6.1 to 6.6 show coverage of HIV testing by university by background characteristics. The data show

121
that response rates among female students and male students are higher among younger and older ages and lower at middle ages showing a U-shaped pattern (highest among those aged 19 years or younger and 40-49). The same pattern is observed by year of study in which first year students and fourth year students had higher response rate than the rest of the students. There is no clear pattern by marital status, type of accommodation and amount of money spent per semester. In almost every category of background characteristics, female respondents were more likely to be tested than male respondents.

122
Table 6.1 Coverage of HIV Testing and HIV Prevalence by University
University Sample size Response rate for blood
draw HIV
prevalence UDSM 950 42.6 0.25
MUHAS 197 84.4 0.0
SUA 252 96.5 0.41
MZUMBE 382 30.4 0
TUMAINI 308 43.5 0.74 SAUT 354 55.9 2.03 Total 2426 51.4 0.56
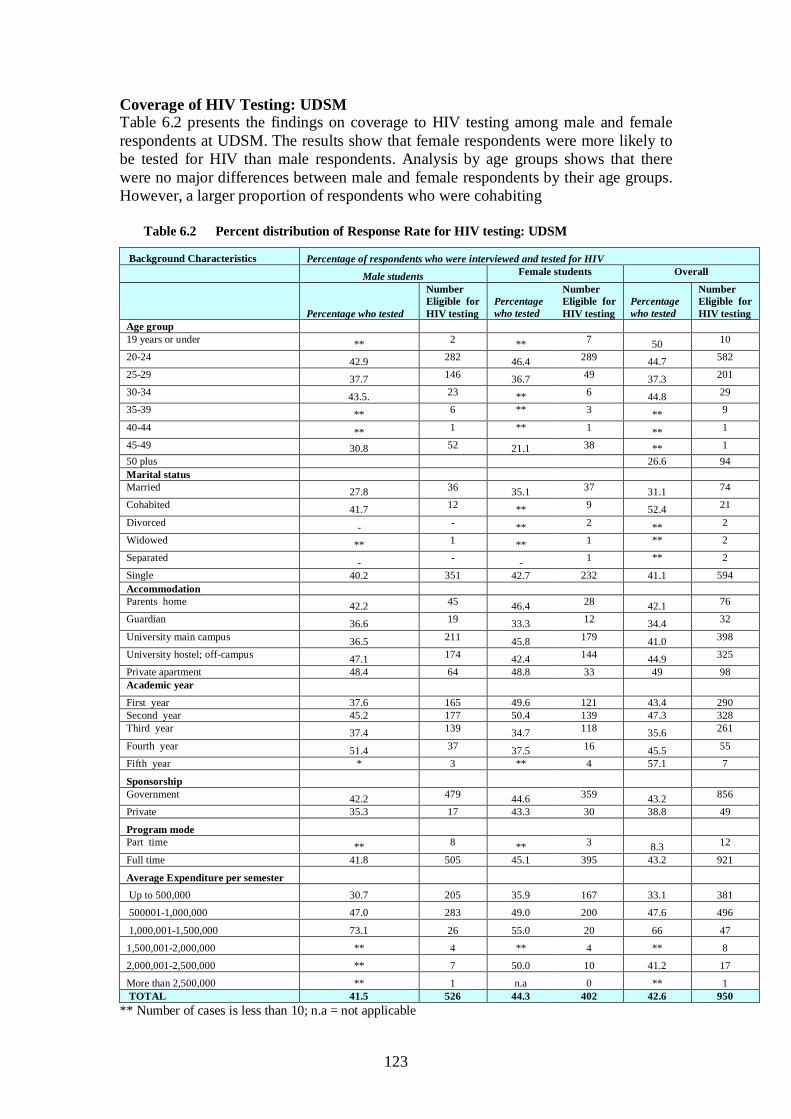
123
Coverage of HIV Testing: UDSM Table 6.2 presents the findings on coverage to HIV testing among male and female respondents at UDSM. The results show that female respondents were more likely to be tested for HIV than male respondents. Analysis by age groups shows that there were no major differences between male and female respondents by their age groups. However, a larger proportion of respondents who were cohabiting
Table 6.2 Percent distribution of Response Rate for HIV testing: UDSM
** Number of cases is less than 10; n.a = not applicable
Background Characteristics Percentage of respondents who were interviewed and tested for HIV Male students Female students Overall
Percentage who tested
Number Eligible for HIV testing
Percentage who tested
Number Eligible for HIV testing
Percentage who tested
Number Eligible for HIV testing
Age group 19 years or under ** 2 ** 7 50 10
20-24 42.9 282 46.4 289 44.7 582
25-29 37.7 146 36.7 49 37.3 201
30-34 43.5. 23 ** 6 44.8 29
35-39 ** 6 ** 3 ** 9
40-44 ** 1 ** 1 ** 1
45-49 30.8 52 21.1 38 ** 1 50 plus 26.6 94 Marital status Married 27.8 36 35.1 37 31.1 74
Cohabited 41.7 12 ** 9 52.4 21
Divorced - - ** 2 ** 2
Widowed ** 1 ** 1 ** 2
Separated - - - 1 ** 2
Single 40.2 351 42.7 232 41.1 594 Accommodation Parents home 42.2 45 46.4 28 42.1 76
Guardian 36.6 19 33.3 12 34.4 32
University main campus 36.5 211 45.8 179 41.0 398
University hostel; off-campus 47.1 174 42.4 144 44.9 325
Private apartment 48.4 64 48.8 33 49 98 Academic year
First year 37.6 165 49.6 121 43.4 290 Second year 45.2 177 50.4 139 47.3 328 Third year 37.4 139 34.7 118 35.6 261
Fourth year 51.4 37 37.5 16 45.5 55
Fifth year * 3 ** 4 57.1 7
Sponsorship
Government 42.2 479 44.6 359 43.2 856
Private 35.3 17 43.3 30 38.8 49
Program mode
Part time ** 8 ** 3 8.3 12
Full time 41.8 505 45.1 395 43.2 921
Average Expenditure per semester
Up to 500,000 30.7 205 35.9 167 33.1 381
500001-1,000,000 47.0 283 49.0 200 47.6 496
1,000,001-1,500,000 73.1 26 55.0 20 66 47
1,500,001-2,000,000 ** 4 ** 4 ** 8
2,000,001-2,500,000 ** 7 50.0 10 41.2 17
More than 2,500,000 ** 1 n.a 0 ** 1 TOTAL 41.5 526 44.3 402 42.6 950

124
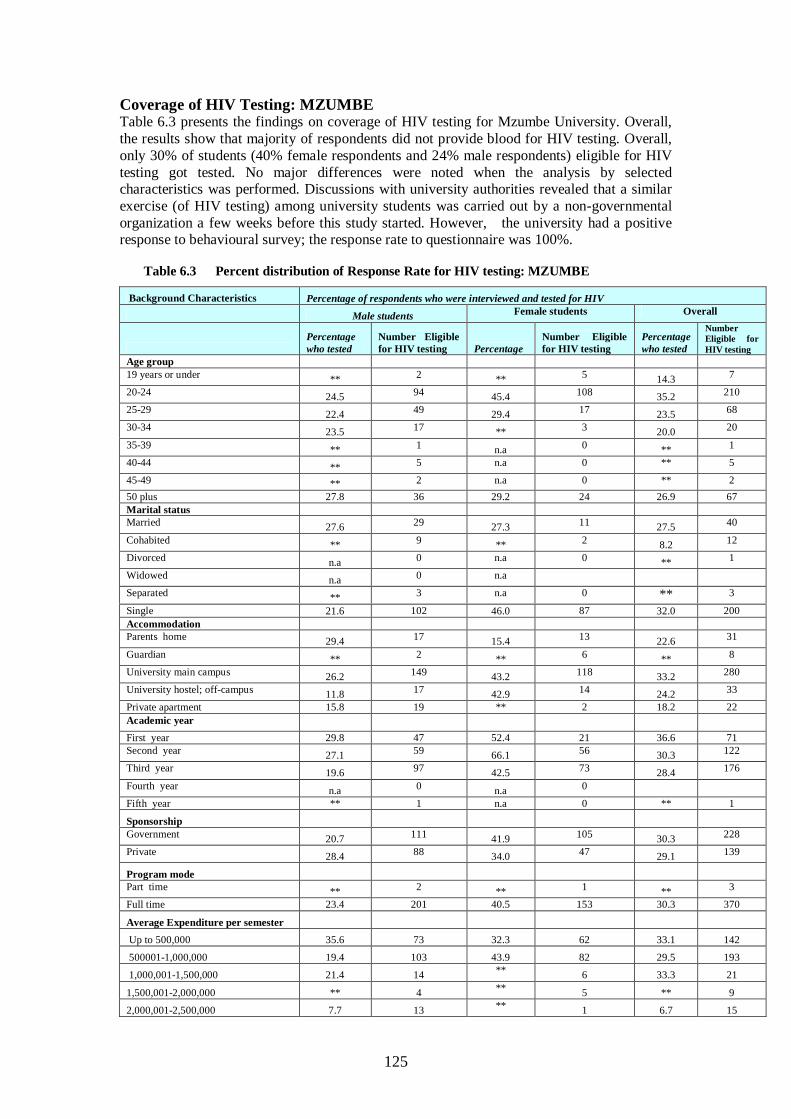
125
Coverage of HIV Testing: MZUMBE Table 6.3 presents the findings on coverage of HIV testing for Mzumbe University. Overall, the results show that majority of respondents did not provide blood for HIV testing. Overall, only 30% of students (40% female respondents and 24% male respondents) eligible for HIV testing got tested. No major differences were noted when the analysis by selected characteristics was performed. Discussions with university authorities revealed that a similar exercise (of HIV testing) among university students was carried out by a non-governmental organization a few weeks before this study started. However, the university had a positive response to behavioural survey; the response rate to questionnaire was 100%.
Table 6.3 Percent distribution of Response Rate for HIV testing: MZUMBE
Background Characteristics Percentage of respondents who were interviewed and tested for HIV Male students Female students Overall
Percentage who tested
Number Eligible for HIV testing Percentage
Number Eligible for HIV testing
Percentage who tested
Number Eligible for HIV testing
Age group 19 years or under ** 2 ** 5 14.3 7
20-24 24.5 94 45.4 108 35.2 210
25-29 22.4 49 29.4 17 23.5 68
30-34 23.5 17 ** 3 20.0 20
35-39 ** 1 n.a 0 ** 1
40-44 ** 5 n.a 0 ** 5
45-49 ** 2 n.a 0 ** 2 50 plus 27.8 36 29.2 24 26.9 67 Marital status Married 27.6 29 27.3 11 27.5 40
Cohabited ** 9 ** 2 8.2 12
Divorced n.a 0 n.a 0 ** 1
Widowed n.a 0 n.a
Separated ** 3 n.a 0 ** 3
Single 21.6 102 46.0 87 32.0 200 Accommodation Parents home 29.4 17 15.4 13 22.6 31
Guardian ** 2 ** 6 ** 8
University main campus 26.2 149 43.2 118 33.2 280
University hostel; off-campus 11.8 17 42.9 14 24.2 33
Private apartment 15.8 19 ** 2 18.2 22 Academic year
First year 29.8 47 52.4 21 36.6 71 Second year 27.1 59 66.1 56 30.3 122
Third year 19.6 97 42.5 73 28.4 176
Fourth year n.a 0 n.a 0
Fifth year ** 1 n.a 0 ** 1
Sponsorship
Government 20.7 111 41.9 105 30.3 228
Private 28.4 88 34.0 47 29.1 139
Program mode
Part time ** 2 ** 1 ** 3
Full time 23.4 201 40.5 153 30.3 370
Average Expenditure per semester
Up to 500,000 35.6 73 32.3 62 33.1 142
500001-1,000,000 19.4 103 43.9 82 29.5 193
1,000,001-1,500,000 21.4 14 ** 6 33.3 21
1,500,001-2,000,000 ** 4 ** 5 ** 9
2,000,001-2,500,000 7.7 13 ** 1 6.7 15

126
** Number of cases is less than 10; n.a = not applicable Coverage of HIV Testing: SUA As shown in Table 6.4, coverage of HIV Testing at SUA was generally high. The overall results show that 97% of students eligible for HIV testing were tested. Differences between male respondents and female respondents were very minimal, with a slightly higher percentage of female respondents than male respondents getting tested for HIV (96% male respondents vs. 97% female respondents noted. Analysis by specific characteristics show that marital status influenced students’ HIV testing behaviour. Overall, majority of the students who tested for HIV were single compared to those who were married. Willingness to test for HIV increased as the year of study increased. The responses were 94%, 975 and 99% for first, second and third year of study respectively.
Table 6.4 Percent distribution of Response Rate for HIV testing: SUA
More than 2,500,000 n.a 0 ** 1 ** 1 TOTAL 24.2 207 39.5 157 30.4 382
Background Characteristics Percentage of respondents who were interviewed and tested for HIV Male students Female students Overall
Percentage who tested
Number Eligible for HIV testing
Percentage who tested
Number Eligible for HIV testing
Percentage who tested
Number Eligible for HIV testing
Age group 19 years or under
n.a 0
n.a 0
n.a 0
20-24 96.7
30 97.7
44 97.3
74
25-29 100
28 100
11 100
39
30-34 100
12 **
5 100
17
35-39 **
4 ** 1 **
5
40-44 ** 7 ** 3 91.7
12
45-49 ** 8 ** 2 90 10
50 plus ** 1 ** 1 ** 2 Marital status Married
87.1 31
87.5 16
87.8 49
Cohabited **
1 **
2 **
3
Divorced n.a 0 n.a 0 n.a 0 Widowed
n.a 0
n.a 0
n.a 0
Separated n.a
0 n.a
0 n.a
0
Single 100 36 97.4 38 98.6 74 Accommodation Parents home
100 15
100 14
100 29
Guardian **
9 **
1 100
10
University main campus 93.3
60 98.5
68 96.2
131
University hostel; off-campus 100
25 83.3
18 93
43
Private apartment 96.3 27 ** 8 97.1 35 Academic year
First year 93.2 59 94.7 38 93.8 97 Second year
100 34
94.4 36
97.2 71
Third year 97.6
42 100
37 98.8
81
Fourth year n.a
0 **
1 **
1
Fifth year n.a 0 n.a 0 n.a 0
Sponsorship
Government 96.6
116 97.2
107 96.9
225
Private 90
10 **
3 84.6
13
Program mode
Part time **
2 **
1 **
3
Full time 96.2 133 96.4 111 96.4 247
Average Expenditure per semester
Up to 500,000 97.9 47 98.0 49 97.9 97
500001-1,000,000 98.7 76 94.7 57 97.0 135
1,000,001-1,500,000 ** 9 ** 4 92.3 13
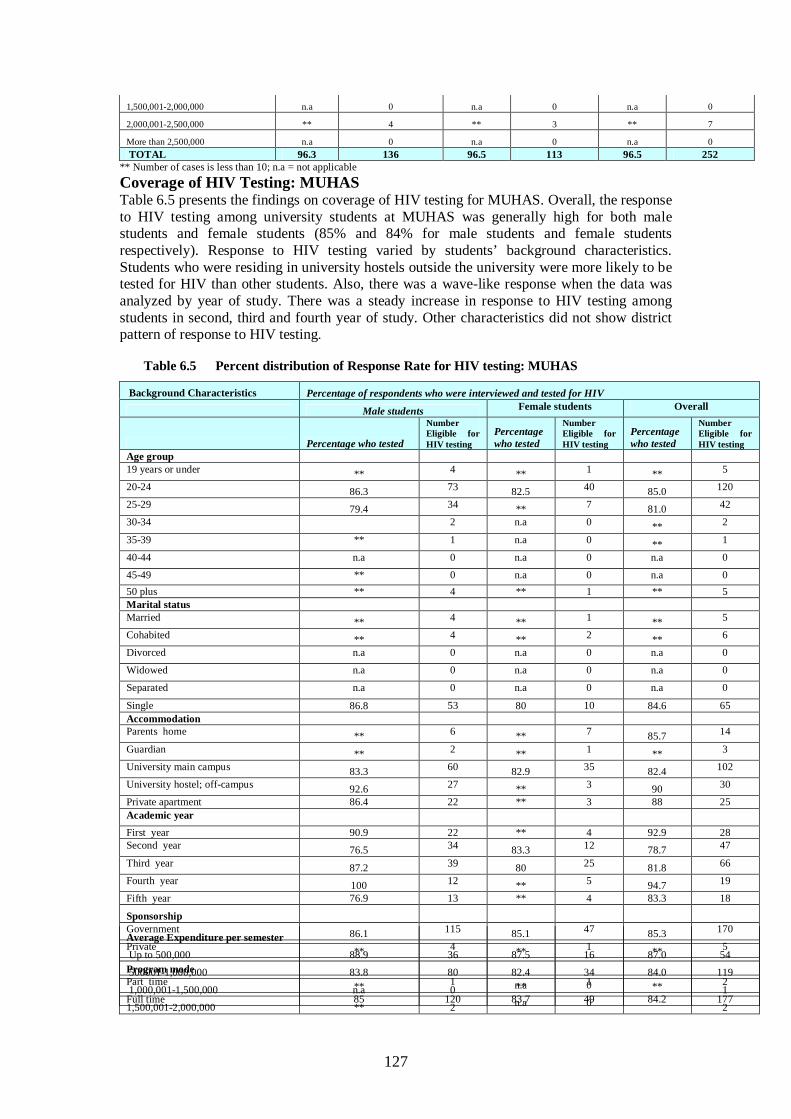
127
** Number of cases is less than 10; n.a = not applicable Coverage of HIV Testing: MUHAS Table 6.5 presents the findings on coverage of HIV testing for MUHAS. Overall, the response to HIV testing among university students at MUHAS was generally high for both male students and female students (85% and 84% for male students and female students respectively). Response to HIV testing varied by students’ background characteristics. Students who were residing in university hostels outside the university were more likely to be tested for HIV than other students. Also, there was a wave-like response when the data was analyzed by year of study. There was a steady increase in response to HIV testing among students in second, third and fourth year of study. Other characteristics did not show district pattern of response to HIV testing.
Table 6.5 Percent distribution of Response Rate for HIV testing: MUHAS
1,500,001-2,000,000 n.a 0 n.a 0 n.a 0
2,000,001-2,500,000 ** 4 ** 3 ** 7
More than 2,500,000 n.a 0 n.a 0 n.a 0 TOTAL 96.3 136 96.5 113 96.5 252
Background Characteristics Percentage of respondents who were interviewed and tested for HIV
Male students Female students Overall
Percentage who tested
Number Eligible for HIV testing
Percentage who tested
Number Eligible for HIV testing
Percentage who tested
Number Eligible for HIV testing
Age group 19 years or under ** 4 ** 1 ** 5
20-24 86.3 73 82.5 40 85.0 120
25-29 79.4 34 ** 7 81.0 42
30-34 2 n.a 0 ** 2
35-39 ** 1 n.a 0 ** 1
40-44 n.a 0 n.a 0 n.a 0
45-49 ** 0 n.a 0 n.a 0 50 plus ** 4 ** 1 ** 5 Marital status Married ** 4 ** 1 ** 5
Cohabited ** 4 ** 2 ** 6
Divorced n.a 0 n.a 0 n.a 0
Widowed n.a 0 n.a 0 n.a 0
Separated n.a 0 n.a 0 n.a 0
Single 86.8 53 80 10 84.6 65 Accommodation Parents home ** 6 ** 7 85.7 14
Guardian ** 2 ** 1 ** 3
University main campus 83.3 60 82.9 35 82.4 102
University hostel; off-campus 92.6 27 ** 3 90 30
Private apartment 86.4 22 ** 3 88 25 Academic year
First year 90.9 22 ** 4 92.9 28 Second year 76.5 34 83.3 12 78.7 47
Third year 87.2 39 80 25 81.8 66
Fourth year 100 12 ** 5 94.7 19
Fifth year 76.9 13 ** 4 83.3 18
Sponsorship
Government 86.1 115 85.1 47 85.3 170
Private ** 4 ** 1 ** 5
Program mode
Part time ** 1 ** 1 ** 2
Full time 85 120 83.7 49 84.2 177
Average Expenditure per semester
Up to 500,000 88.9 36 87.5 16 87.0 54
500001-1,000,000 83.8 80 82.4 34 84.0 119
1,000,001-1,500,000 n.a 0 n.a 0 1
1,500,001-2,000,000 ** 2 n.a 0 2

128
** Number of cases is less than 10; n.a = not applicable Coverage of HIV Testing: Tumaini Table 6.6 presents findings on coverage of HIV testing for university students at Tumaini University. Overall, less than half of respondents eligible for HIV testing (44%) were tested for HIV. Comparatively, female respondents were more likely to be tested for HIV than male respondents. There was an inverse relationship between year of study and HIV testing behaviour. The percentage of respondents who got tested for HIV decreased as the year of study increased. Also, the similar pattern was observed among respondents by amount of money they spent per semester.
Table 6.6 Percent distribution of Response Rate for HIV testing: TUMAINI
2,000,001-2,500,000 ** 1 n.a 0 1
More than 2,500,000 n.a 0 n.a 0 TOTAL 85.1 121 84.0 50 84.4 197
Background Characteristics Percentage of respondents who were interviewed and tested for HIV Male students Female students Overall
Percentage who tested
Number Eligible for HIV testing
Percentage who tested
Number Eligible for HIV testing
Percentage who tested
Number Eligible for HIV testing
Age group 19 years or under ** 2 ** 1 ** 3
20-24 31.1 71 44.7 94 39.3 168
25-29 38.5 39 55.0 20 45.0 60
30-34 44.0 18 ** 5 43.5 23
35-39 ** 5 ** 1 ** 7
40-44 ** 7 ** 3 60.0 10
45-49 ** 2 n.a 0 ** 2 50 plus 50.0 12 50.0 12 50.0 24 Marital status Married 50 40 47.1 17 48.3 58
Cohabited ** 3 ** 8 36.4 11
Divorced ** 1 ** 1 ** 2
Widowed n.a 0 n.a 0 n.a 0
Separated n.a 0 n.a 0 n.a 0
Single 32.9 82 50 76 41.6 161 Accommodation Parents home 55.6 18 16.7 12 43.8 32
Guardian ** 7 ** 4 36.4 11
University main campus 46.3 41 45 40 45.7 81
University hostel; off-campus ** 6 63.6 11 58.8 17
Private apartment 33 91 50 64 39.5 157 Academic year
First year 52 75 72.5 40 59 117 Second year 25.5 51 41.2 51 34 103
Third year 34.2 38 31 42 32.9 82
Fourth year ** 2 ** 2
Fifth year ** 2 ** 2
Sponsorship
Government 39.8 118 44.3 88 42.1 209
Private 40 45 53.2 47 46.8 94
Program mode
Part time ** 5 ** 2 ** 7
Full time 38.9 162 47.3 131 42.5 292
Average Expenditure per semester
Up to 500,000 49.4 79 42.9 70 46.4 151
500001-1,000,000 31.0 58 61.4 44 44.2 104

129
** Number of cases is less than 10; n.a = not applicable
1,000,001-1,500,000 18.8 16 27.3 11 25.0 28
1,500,001-2,000,000 ** 4 ** 5 ** 9
2,000,001-2,500,000 ** 8 ** 6 35.7 14
More than 2,500,000 ** 2 n.a 0 ** 2 TOTAL 39.5 167 47.8 136 43.5 308

130
Coverage of HIV Testing: SAUT The results for response to HIV testing among university students at SAUT are presented in Table 6.7. Overall, 56% of students who were eligible for HIV testing were tested. More male respondents than female respondents were tested for HIV. Analysis by age group shows that response to HIV testing increased by age group but decreased as the amount of money spent per semester increased. Second year students were less likely to be tested for HIV than any other year of study. Also, students who were residing in private apartments were more likely to be tested for HIV than any other category of accommodation.
Table 6.7 Percent distribution of Response Rate for HIV testing: SAUT
Background Characteristics Percentage of respondents who were interviewed and tested for HIV Male students Female students Overall
Percentage who tested
Number Eligible for HIV testing
Percentage who tested
Number Eligible for HIV testing
Percentage who tested
Number Eligible for HIV testing
Age group 19 years or under ** 2 ** 7 70.0 10
20-24 47.3 74 49.5 99 49.2 179
25-29 53.1 49 42.1 19 50.7 69
30-34 69.2 13 ** 9 70.8 24
35-39 ** 7 ** 2 ** 9
40-44 ** 5 ** 1 ** 6
45-49 ** 1 n.a 0 ** 1 50 plus 53.3 15 54.5 11 51.7 29 Marital status Married 66.7 42 38.9 18 59.4 64
Cohabited ** 3 ** 7 50 10
Divorced ** 3 ** 1 ** 1
Widowed ** 3
Separated
Single 59.6 104 48.7 76 55.4 186 Accommodation Parents home ** 8 54.5 11 47.6 21
Guardian ** 6 ** 9 60 15
University main campus 54.2 72 51.7 58 54.4 133
University hostel; off-campus 45.5 33 45.5 33 43.9 66
Private apartment 68.1 69 68.1 69 64.8 105 Academic year
First year 58 112 52.6 78 56.1 198 Second year 48.6 37 47.5 40 48.8 80
Third year 68.3 41 65.4 26 67.6 68
Fourth year n.a 0 n.a 0 n.a 0
Fifth year n.a 0 n.a 0 n.a 0
Sponsorship
Government 58.7 126 57.7 78 59.4 212 Private 59.3 59 45.9 61 52.5 122
Program mode
Part time ** 2 ** 2 ** 4
Full time 57.5 186 51.7 143 57.5 186
Average Expenditure per semester
Up to 500,000 73.6 91 58.2 79 65.7 178
500001-1,000,000 45.6 57 47.2 36 47.9 96
1,000,001-1,500,000 43.8 32 43.5 23 43.9 57
1,500,001-2,000,000 ** 4 ** 6 20.0 10
2,000,001-2,500,000 ** 7 ** 4 54.5 11 More than 2,500,000 n.a 0 n.a 0
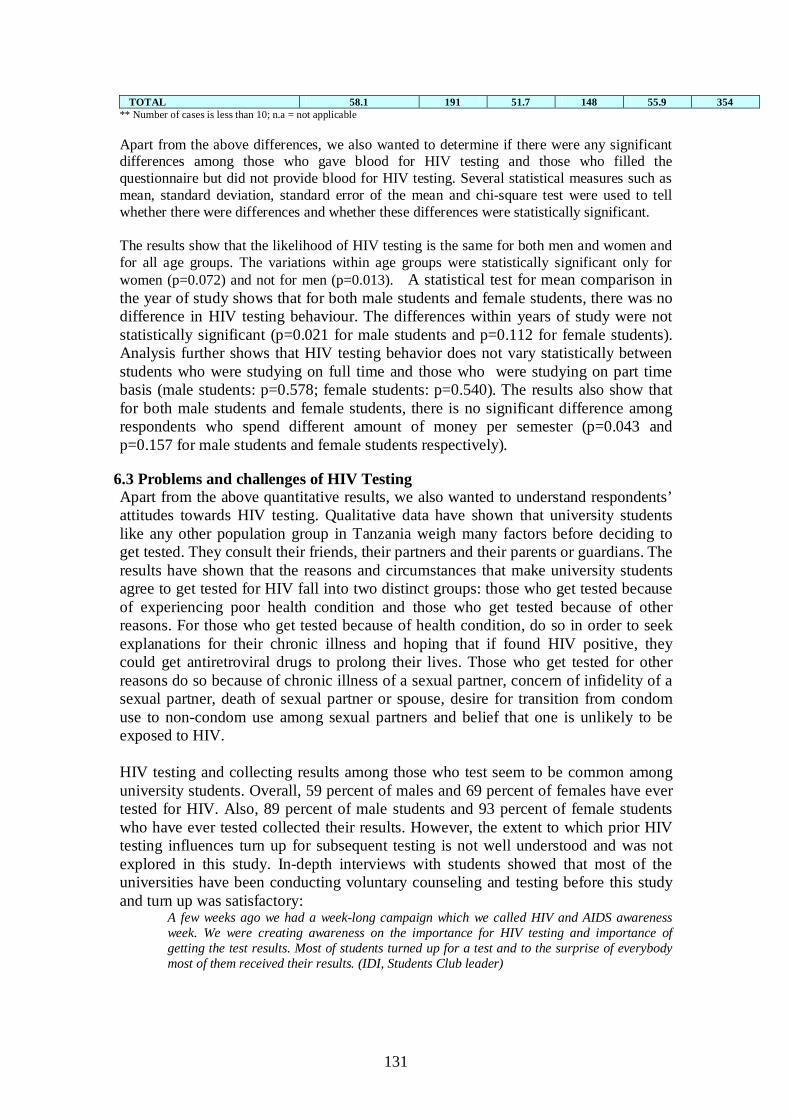
131
** Number of cases is less than 10; n.a = not applicable Apart from the above differences, we also wanted to determine if there were any significant differences among those who gave blood for HIV testing and those who filled the questionnaire but did not provide blood for HIV testing. Several statistical measures such as mean, standard deviation, standard error of the mean and chi-square test were used to tell whether there were differences and whether these differences were statistically significant. The results show that the likelihood of HIV testing is the same for both men and women and for all age groups. The variations within age groups were statistically significant only for women (p=0.072) and not for men (p=0.013). A statistical test for mean comparison in the year of study shows that for both male students and female students, there was no difference in HIV testing behaviour. The differences within years of study were not statistically significant (p=0.021 for male students and p=0.112 for female students). Analysis further shows that HIV testing behavior does not vary statistically between students who were studying on full time and those who were studying on part time basis (male students: p=0.578; female students: p=0.540). The results also show that for both male students and female students, there is no significant difference among respondents who spend different amount of money per semester (p=0.043 and p=0.157 for male students and female students respectively).
6.3 Problems and challenges of HIV Testing Apart from the above quantitative results, we also wanted to understand respondents’ attitudes towards HIV testing. Qualitative data have shown that university students like any other population group in Tanzania weigh many factors before deciding to get tested. They consult their friends, their partners and their parents or guardians. The results have shown that the reasons and circumstances that make university students agree to get tested for HIV fall into two distinct groups: those who get tested because of experiencing poor health condition and those who get tested because of other reasons. For those who get tested because of health condition, do so in order to seek explanations for their chronic illness and hoping that if found HIV positive, they could get antiretroviral drugs to prolong their lives. Those who get tested for other reasons do so because of chronic illness of a sexual partner, concern of infidelity of a sexual partner, death of sexual partner or spouse, desire for transition from condom use to non-condom use among sexual partners and belief that one is unlikely to be exposed to HIV. HIV testing and collecting results among those who test seem to be common among university students. Overall, 59 percent of males and 69 percent of females have ever tested for HIV. Also, 89 percent of male students and 93 percent of female students who have ever tested collected their results. However, the extent to which prior HIV testing influences turn up for subsequent testing is not well understood and was not explored in this study. In-depth interviews with students showed that most of the universities have been conducting voluntary counseling and testing before this study and turn up was satisfactory:
A few weeks ago we had a week-long campaign which we called HIV and AIDS awareness week. We were creating awareness on the importance for HIV testing and importance of getting the test results. Most of students turned up for a test and to the surprise of everybody most of them received their results. (IDI, Students Club leader)
TOTAL 58.1 191 51.7 148 55.9 354
132
Some of the challenges that university students reported as factors that influenced their decisions to go for HIV testing include: the desire to get the results on spot, perceived poor quality of HIV and AIDS services including counseling, ARV and nutrition services at universities, poor confidentiality about HIV testing and lack of ARVs for those who would be found HIV positive. Also, in some universities, it was mentioned that because the VCT services are isolated from other health care services, people tend to avoid seeking HIV testing from such facilities. This is because they fear of being labeled as HIV positive even before one gets tested. In this situation, HIV testing services are stigmatized and are functioning as barriers to getting tested for those who would like to test without knowledge of other people around them. The results also show that desire for getting testing results on spot contributed towards decision making on getting tested or not. Since the results were not provided on spot, they did not see the value of getting tested and ended up discouraging each other to giving their blood for HIV testing:
When we pass around the dormitories, students ask us questions which we fail to answer. Some people say: I don’t want to test at our university health centre, will my participation in the study help me know my status on spot? Others are asking: I want me and my (sexual) partner to participate in HIV testing so that we can share the results but you have selected me and left her out of your study, so what will be the value of my participation (in HIV testing)? FGD, student leaders
However, in another focus group discussion with male and female students, it was learnt that most of students who are not married but have sexual partners do not like to get tested. In their own accounts, getting tested while in sexual partnership may lead to involuntary disclosure of sero-status by a partner especially when one is found HIV positive. Other outcomes include social isolation within university campus and stigmatization. In most of the universities that participated in this study, HIV testing facilities and services are available. However, the quality of these services varies from one university to the other. For instance, in one of the universities, we were informed by the university administration that the university has put in place arrangement with one of the organizations that offer HIV testing and social and medical support to PLHAs to provide care and support for its university students:
We don’t compel our students to get tested here at our university health centre. They are free to get tested anywhere and if they think that they need referral, they consult our medical in-charge and get permit to seek support at …….. Hospital (name withheld). The hospital sends us a bill every month and we have evidence that our students are receiving quality care including HIV care and support. (IDI, University administrator)
Although HIV testing is increasingly available in most of the universities some students are still reluctant to be tested for the fear of discrimination and uncertainty about the type of post-test HIV and AIDS services within universities. Results from focus group discussions and in-depth interviews show that the above reasons may contribute to poor turn up for HIV testing among university students:
The decision to go for HIV testing is not that simple….. first of all you are not sure of the outcomes, what if they tell you that you are HIV positive, will the university take care of you? The university does not have comprehensive HIV and AIDS care and treatment plan not even

133
for its instructors, so who do you think you are here, just a mere student (FGD participant, Female students)
Suppose you are HIV positive, how are you going to live here at the campus, even if you decide to live off-campus, will that be permanent solution? You need good nutrition, good care and support. I don’t think the university can provide such services….)IDI, Student leader)
Students also mentioned fear of rejection by their partners and fear of stigma while more others mentioned poor HIV and AIDS care and support services at the universities as reasons for avoiding getting tested. In one of the recommendations, the participants said that mandatory HIV testing among university students would help in changing their attitudes towards involvement in high risk sex:
Once you announce that HIV testing is voluntary, everybody takes it easy. It is better to make it one of the university entry qualifications or condition for determining loan means testing by the loan board. People (students) would avoid engaging in risk sexual encounter because they would say: if I am found HIV positive I won’t be admitted at the university…… (FGD, male students).
It is evident from the above findings that the decision to get tested is a social process that starts by an individual having an intention to be tested, followed by discussing the intention or anxiety with other people, decision to visiting HIV testing services, undergoing counseling, getting tested and waiting for results. Where this chain is broken for reasons such as getting tested but not receiving results on spot or counseling services not being appropriate or having anxiety about HIV and AIDS services after learning that one is HIV positive, then turnout for people getting tested may be hampered. The above findings about challenges and problems of HIV testing are similar to findings that have been reported by other qualitative studies which show that people avoid getting tested for fear of inappropriate HIV screening and counseling, fear of learning that one is HIV positive, fear of partner’s or community reaction or belief that one is unlikely to be exposed to HIV (Rweyemamu, 2008; Lugalla et al, 2008; Gage and Ali,2005).
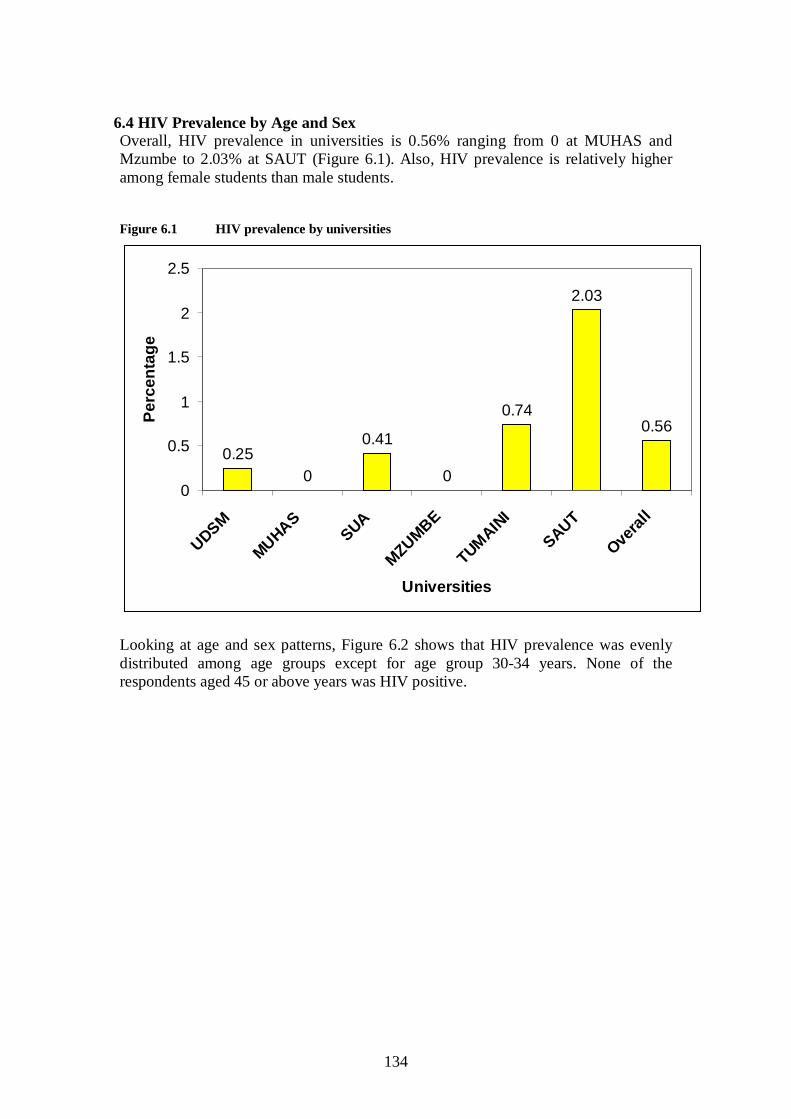
134
6.4 HIV Prevalence by Age and Sex Overall, HIV prevalence in universities is 0.56% ranging from 0 at MUHAS and Mzumbe to 2.03% at SAUT (Figure 6.1). Also, HIV prevalence is relatively higher among female students than male students.
Figure 6.1 HIV prevalence by universities
0.250
0.41
0
0.74
2.03
0.56
0
0.5
1
1.5
2
2.5
UDSM
MUHASSUA
MZUMBE
TUMAINI
SAUT
Overal
l
Universities
Perc
enta
ge
Looking at age and sex patterns, Figure 6.2 shows that HIV prevalence was evenly distributed among age groups except for age group 30-34 years. None of the respondents aged 45 or above years was HIV positive.

135
Figure 6.2 HIV Prevalence by age group
1 1 11
2
1
0
0.5
1
1.5
2
2.5
19 oryounger
20-24 25-29 30-34 40-44 45-49 50+
Num
ber o
f res
pond
ents
Men Women
6.5 HIV Prevalence by Socio-economic Characteristics Data presented in Figure 6.3 show that HIV prevalence is relatively higher among those who spend relatively less amount of money per semester (up to Tshs. 500,000) than those who spend larger amount of money. This is true for both male and female students. No major difference in prevalence of HIV was noted among students who are sponsored by government and those who are privately sponsored, though the difference is noted among male students and female students who are privately sponsored (Figure 6.3).
Figure 6.3 HIV Prevalence by Amount of money spent per semester
2
1
2
1 1
0
0.5
1
1.5
2
2.5
Up to 500000 500001-1000000 1000001-1500000
Num
ber o
f res
pond
ents
Men Women
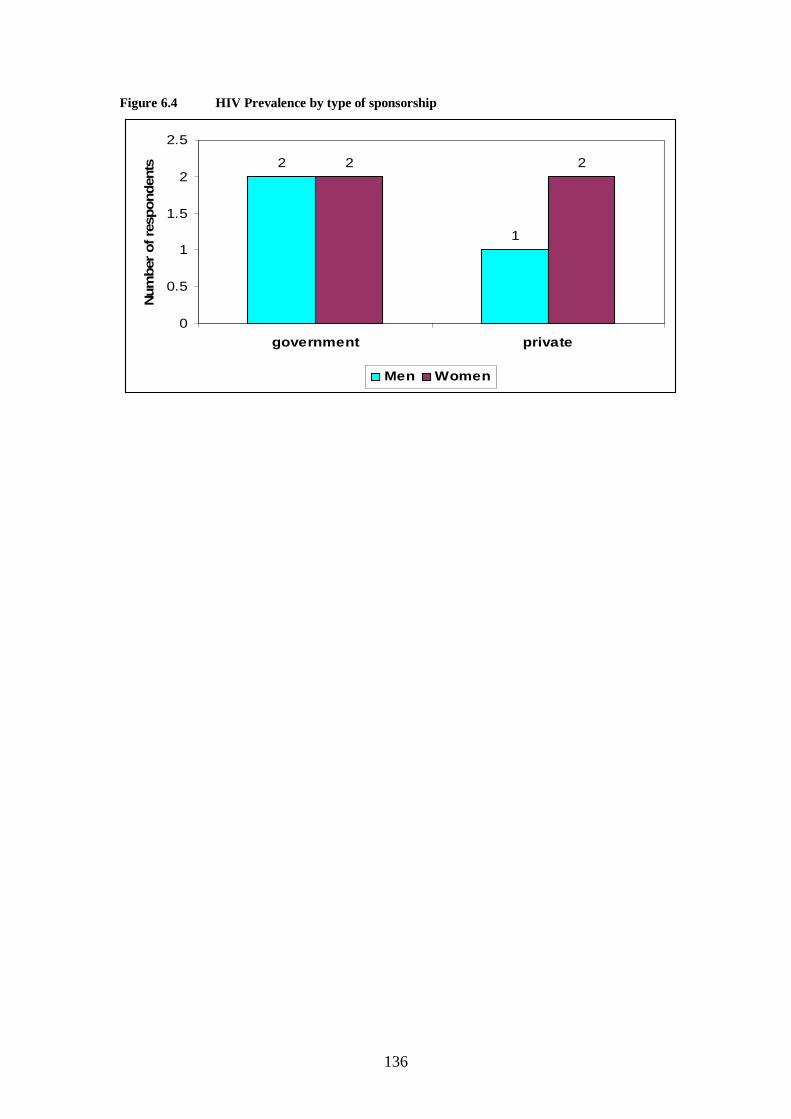
136
Figure 6.4 HIV Prevalence by type of sponsorship
2
1
2 2
0
0.5
1
1.5
2
2.5
government private
Num
ber o
f res
pond
ents
Men Women
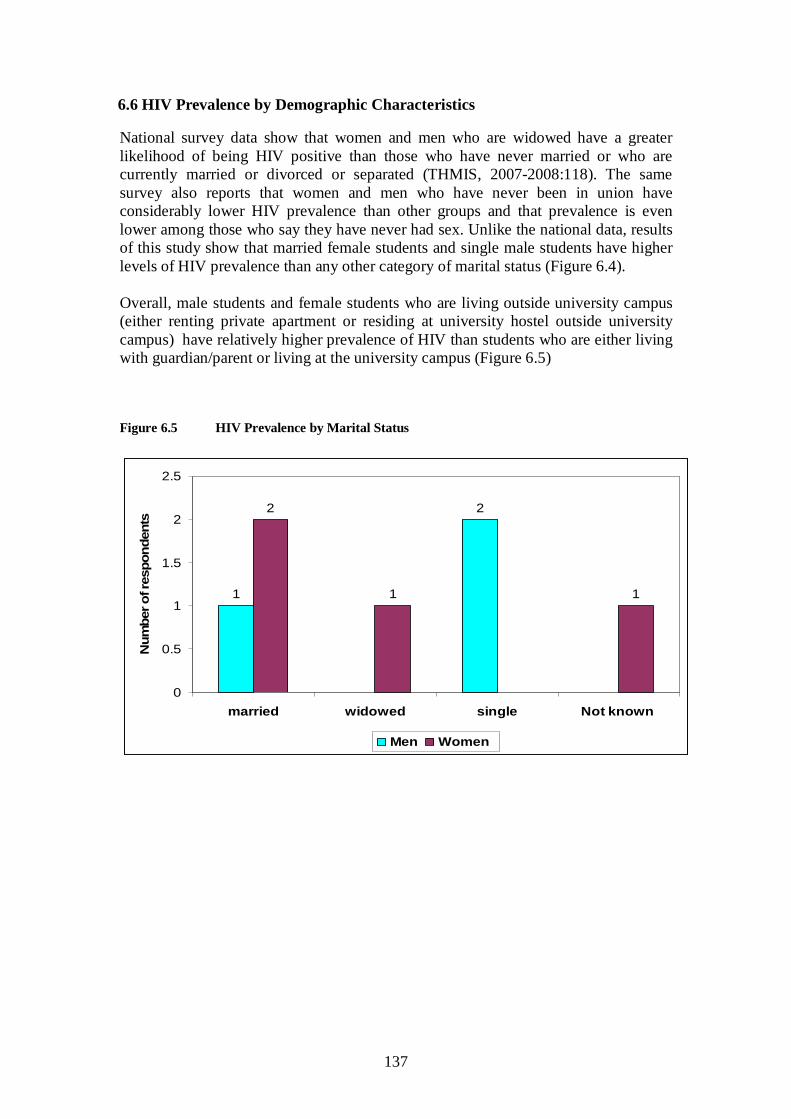
137
6.6 HIV Prevalence by Demographic Characteristics National survey data show that women and men who are widowed have a greater likelihood of being HIV positive than those who have never married or who are currently married or divorced or separated (THMIS, 2007-2008:118). The same survey also reports that women and men who have never been in union have considerably lower HIV prevalence than other groups and that prevalence is even lower among those who say they have never had sex. Unlike the national data, results of this study show that married female students and single male students have higher levels of HIV prevalence than any other category of marital status (Figure 6.4). Overall, male students and female students who are living outside university campus (either renting private apartment or residing at university hostel outside university campus) have relatively higher prevalence of HIV than students who are either living with guardian/parent or living at the university campus (Figure 6.5)
Figure 6.5 HIV Prevalence by Marital Status
1
22
1 1
0
0.5
1
1.5
2
2.5
married widowed single Not known
Num
ber o
f res
pond
ents
Men Women
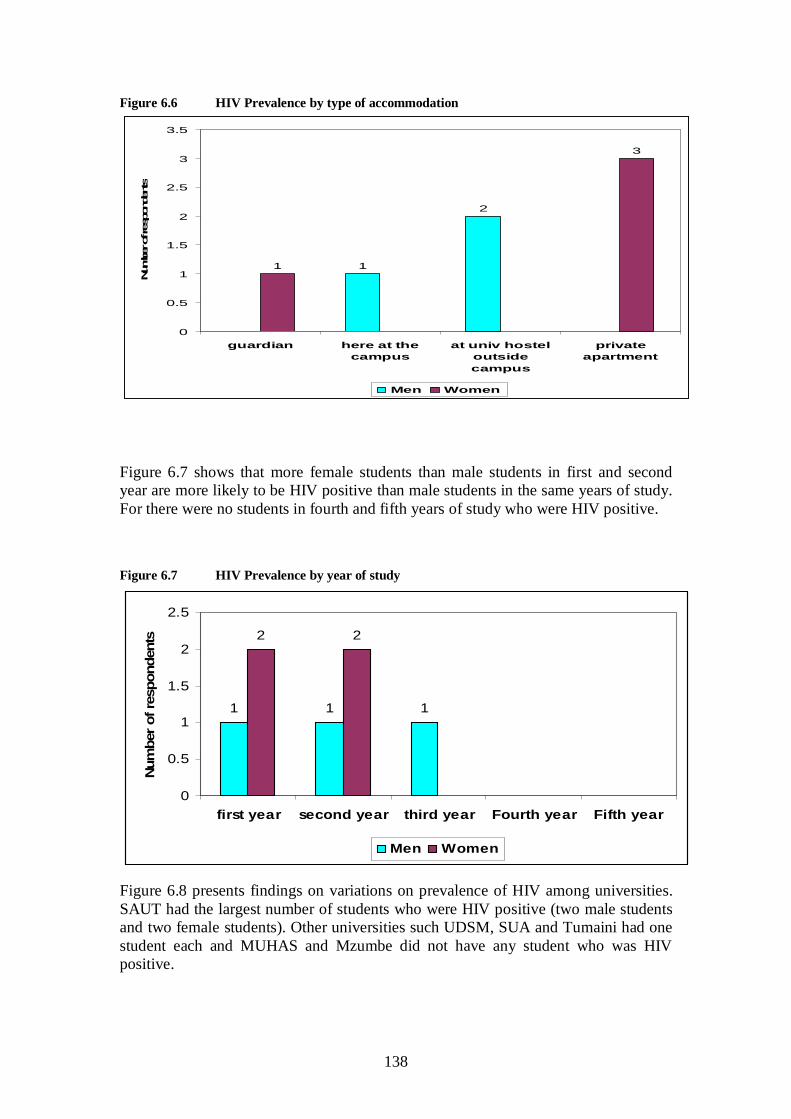
138
Figure 6.6 HIV Prevalence by type of accommodation
1
2
1
3
0
0.5
1
1.5
2
2.5
3
3.5
guardian here at thecampus
at univ hosteloutsidecampus
privateapartment
Num
ber o
f res
pond
ents
Men Women
Figure 6.7 shows that more female students than male students in first and second year are more likely to be HIV positive than male students in the same years of study. For there were no students in fourth and fifth years of study who were HIV positive.
Figure 6.7 HIV Prevalence by year of study
1 1 1
2 2
0
0.5
1
1.5
2
2.5
first year second year third year Fourth year Fifth year
Num
ber o
f res
pond
ents
Men Women
Figure 6.8 presents findings on variations on prevalence of HIV among universities. SAUT had the largest number of students who were HIV positive (two male students and two female students). Other universities such UDSM, SUA and Tumaini had one student each and MUHAS and Mzumbe did not have any student who was HIV positive.
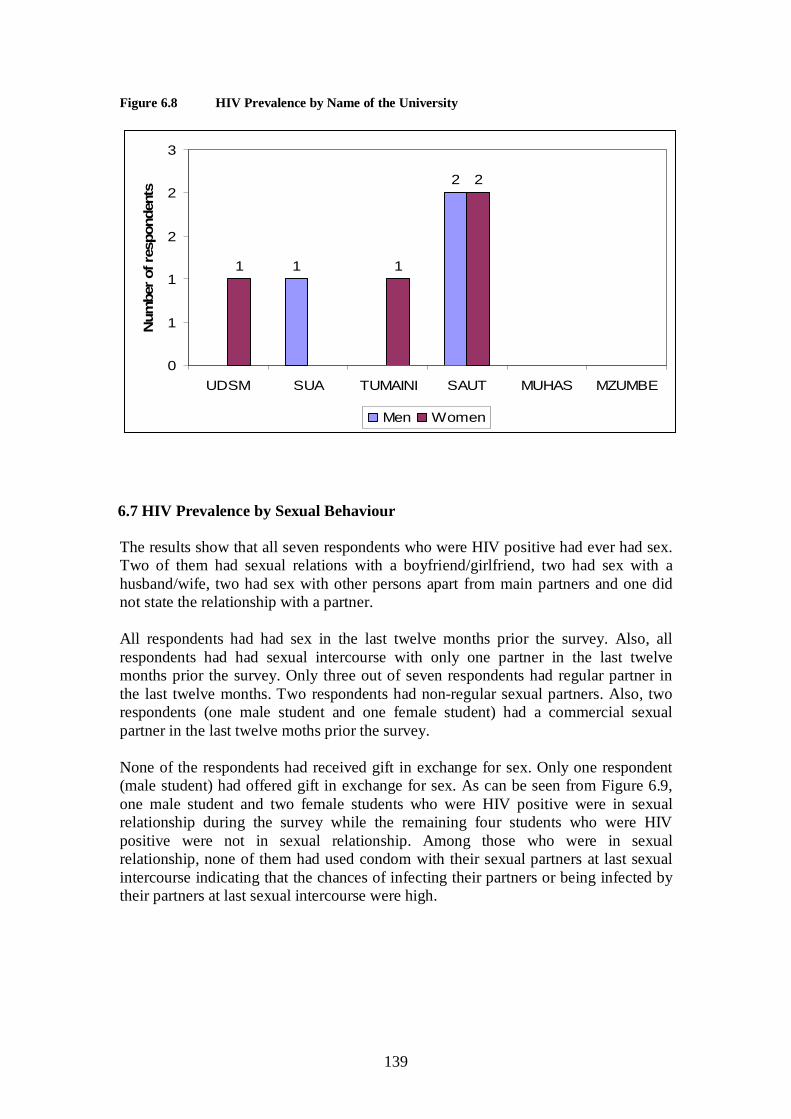
139
Figure 6.8 HIV Prevalence by Name of the University
1
2
1 1
2
0
1
1
2
2
3
UDSM SUA TUMAINI SAUT MUHAS MZUMBE
Num
ber o
f res
pond
ents
Men Women
6.7 HIV Prevalence by Sexual Behaviour The results show that all seven respondents who were HIV positive had ever had sex. Two of them had sexual relations with a boyfriend/girlfriend, two had sex with a husband/wife, two had sex with other persons apart from main partners and one did not state the relationship with a partner. All respondents had had sex in the last twelve months prior the survey. Also, all respondents had had sexual intercourse with only one partner in the last twelve months prior the survey. Only three out of seven respondents had regular partner in the last twelve months. Two respondents had non-regular sexual partners. Also, two respondents (one male student and one female student) had a commercial sexual partner in the last twelve moths prior the survey. None of the respondents had received gift in exchange for sex. Only one respondent (male student) had offered gift in exchange for sex. As can be seen from Figure 6.9, one male student and two female students who were HIV positive were in sexual relationship during the survey while the remaining four students who were HIV positive were not in sexual relationship. Among those who were in sexual relationship, none of them had used condom with their sexual partners at last sexual intercourse indicating that the chances of infecting their partners or being infected by their partners at last sexual intercourse were high.
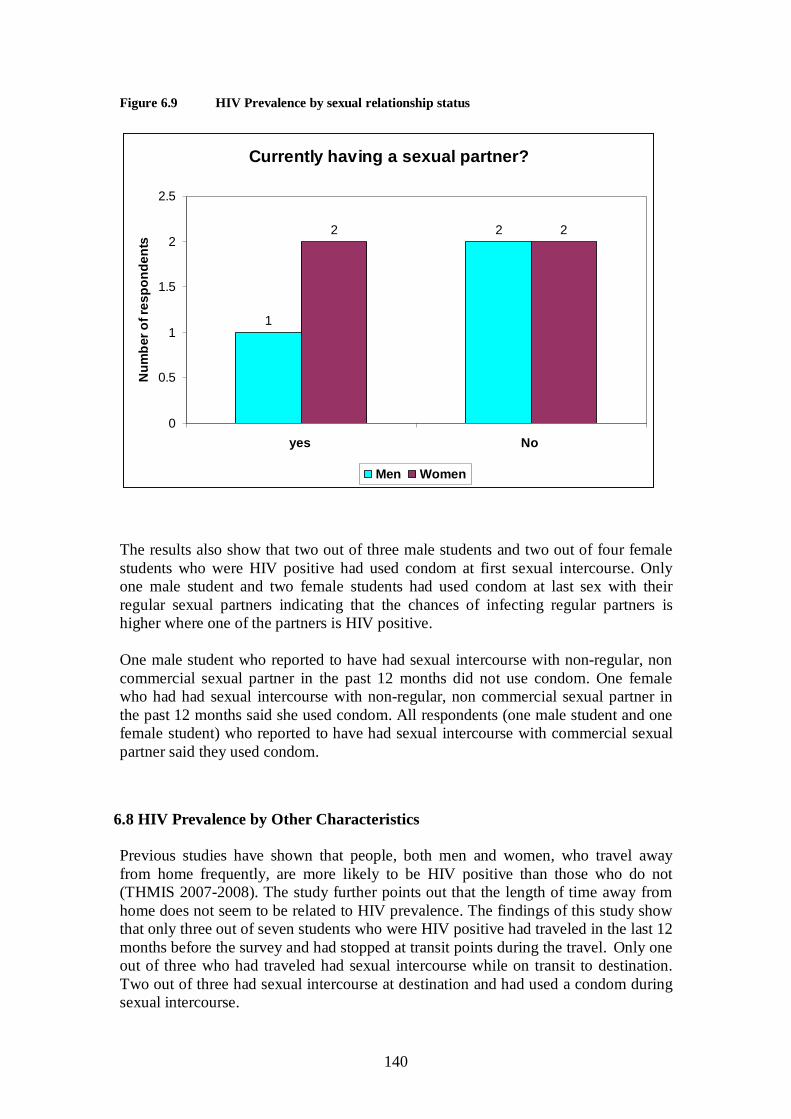
140
Figure 6.9 HIV Prevalence by sexual relationship status
Currently having a sexual partner?
1
22 2
0
0.5
1
1.5
2
2.5
yes No
Num
ber o
f res
pond
ents
Men Women
The results also show that two out of three male students and two out of four female students who were HIV positive had used condom at first sexual intercourse. Only one male student and two female students had used condom at last sex with their regular sexual partners indicating that the chances of infecting regular partners is higher where one of the partners is HIV positive. One male student who reported to have had sexual intercourse with non-regular, non commercial sexual partner in the past 12 months did not use condom. One female who had had sexual intercourse with non-regular, non commercial sexual partner in the past 12 months said she used condom. All respondents (one male student and one female student) who reported to have had sexual intercourse with commercial sexual partner said they used condom.
6.8 HIV Prevalence by Other Characteristics Previous studies have shown that people, both men and women, who travel away from home frequently, are more likely to be HIV positive than those who do not (THMIS 2007-2008). The study further points out that the length of time away from home does not seem to be related to HIV prevalence. The findings of this study show that only three out of seven students who were HIV positive had traveled in the last 12 months before the survey and had stopped at transit points during the travel. Only one out of three who had traveled had sexual intercourse while on transit to destination. Two out of three had sexual intercourse at destination and had used a condom during sexual intercourse.
141
Results also show that there is a pattern between HIV prevalence and prior HIV testing. Among students who were HIV positive, six out of seven had been tested for HIV before the survey compared to only one student who had never been tested. Also, the same six students who had been tested previously and collected their HIV test results.

142
CHAPTER 7 POLICIES, REGULATIONS AND PROGRAMS AT UNIVERSITIES 7.1 Overview Universities are now cognizant of the adverse impact HIV and AIDS can have to its core activities. For them to mitigate this impact there is a need to institute an integrated and comprehensive HIV and AIDS programme including referral purposes. It was thus important to establish a baseline in terms of the interventions that different universities are undertaking with regard to combating HIV and AIDS. This chapter looks at the policies and implementation structure of the HIV and AIDS programs in the Universities visited. 7.2 HIV and AIDS Policies and Programs
As a response HIV and AIDS, in 1985 the Government established the National HIV/ AIDS Control Programme (NACP) under the Ministry of Health. NACP formulated a short-term plan and three 5-year medium term plans, the last of which expired in 2002. Initially, HIV and AIDS was perceived purely as a health problem and the campaign to deal with it was left to the health sector alone. This was a major weakness in the approach to combating the epidemic. Subsequently, in 2001 the Government established the Tanzania Commission for AIDS (TACAIDS) as a statutory organ entrusted with the overall task of coordinating the multi-sectoral approach in fighting HIV and AIDS. The Government, through TACAIDS and other stakeholders, promulgated the National Policy on HIV and AIDS in November 2001. The overall goal of the National Policy “is to provide for a framework for leadership and coordination of the national multi-sectoral response to the HIV and AIDS epidemic. This includes formulation, by all sectors, of appropriate interventions that will be effective in preventing transmission of HIV and other sexually transmitted infections, protecting and supporting vulnerable groups, mitigating the social and economic impact of HIV and AIDS. It also provides for the framework for strengthening the capacity of institutions, communities and individuals in all sectors to arrest the spread of the epidemic”. In 2003, TACAIDS developed the National Multi-Sectoral Strategic Framework on HIV and AIDS 2003-2007. The mission of the Strategic Framework is to guide and safeguard the intensification and expansion of HIV and AIDS prevention, care and support, impact mitigation programmes and interventions within a framework of a well coordinated national multi-sectoral response programme led by the National Government, anchored at the Local Government Councils, rooted in communities and actively supported by partnerships with all concerned stakeholders. As part of sectoral response to the challenges of the HIV and AIDS epidemic in 1997 the Ministry of Science, Technology and Higher Education (MSTHE) was involved in the planning and implementation of the Medium Term Plan III (1998-2002). This was followed, in May 2000, with the establishment of the Technical AIDS Committee (TAC) within the Ministry. In its endeavors to tackle the epidemic at sectoral level, the MSTHE -TAC prepared a Strategic Framework on HIV and for 2003-2007. The Strategic Framework seeks to translate the National Policy and the National Multi-Sectoral Strategic Framework on HIV and AIDS by providing strategic guidance to the planning of programmes, projects and interventions by various stakeholders in the fight against HIV/ AIDS. While grappling with the epidemic at sectoral level, the MSTHE-TAC, through its Chairperson, directed all institutions under the Ministry to
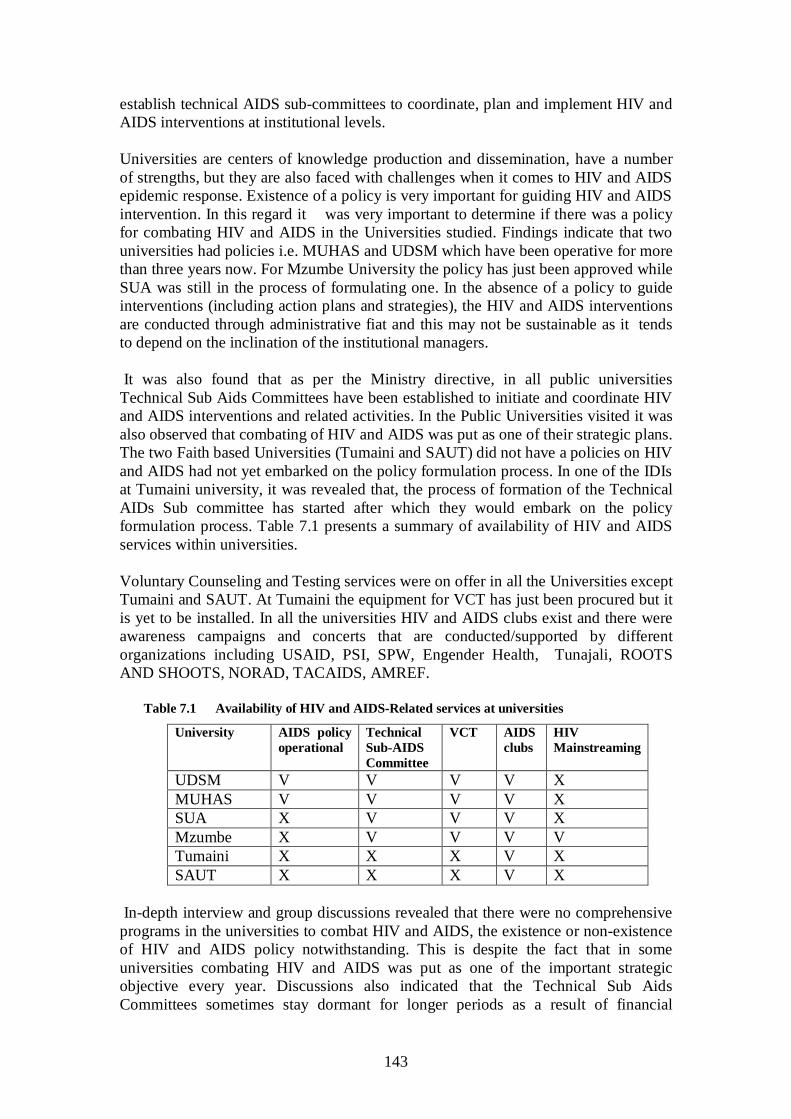
143
establish technical AIDS sub-committees to coordinate, plan and implement HIV and AIDS interventions at institutional levels. Universities are centers of knowledge production and dissemination, have a number of strengths, but they are also faced with challenges when it comes to HIV and AIDS epidemic response. Existence of a policy is very important for guiding HIV and AIDS intervention. In this regard it was very important to determine if there was a policy for combating HIV and AIDS in the Universities studied. Findings indicate that two universities had policies i.e. MUHAS and UDSM which have been operative for more than three years now. For Mzumbe University the policy has just been approved while SUA was still in the process of formulating one. In the absence of a policy to guide interventions (including action plans and strategies), the HIV and AIDS interventions are conducted through administrative fiat and this may not be sustainable as it tends to depend on the inclination of the institutional managers. It was also found that as per the Ministry directive, in all public universities Technical Sub Aids Committees have been established to initiate and coordinate HIV and AIDS interventions and related activities. In the Public Universities visited it was also observed that combating of HIV and AIDS was put as one of their strategic plans. The two Faith based Universities (Tumaini and SAUT) did not have a policies on HIV and AIDS had not yet embarked on the policy formulation process. In one of the IDIs at Tumaini university, it was revealed that, the process of formation of the Technical AIDs Sub committee has started after which they would embark on the policy formulation process. Table 7.1 presents a summary of availability of HIV and AIDS services within universities. Voluntary Counseling and Testing services were on offer in all the Universities except Tumaini and SAUT. At Tumaini the equipment for VCT has just been procured but it is yet to be installed. In all the universities HIV and AIDS clubs exist and there were awareness campaigns and concerts that are conducted/supported by different organizations including USAID, PSI, SPW, Engender Health, Tunajali, ROOTS AND SHOOTS, NORAD, TACAIDS, AMREF.
Table 7.1 Availability of HIV and AIDS-Related services at universities
University AIDS policy operational
Technical Sub-AIDS Committee
VCT AIDS clubs
HIV Mainstreaming
UDSM V V V V X MUHAS V V V V X SUA X V V V X Mzumbe X V V V V Tumaini X X X V X SAUT X X X V X
In-depth interview and group discussions revealed that there were no comprehensive programs in the universities to combat HIV and AIDS, the existence or non-existence of HIV and AIDS policy notwithstanding. This is despite the fact that in some universities combating HIV and AIDS was put as one of the important strategic objective every year. Discussions also indicated that the Technical Sub Aids Committees sometimes stay dormant for longer periods as a result of financial
144
constraints facing universities. It was reported that to a larger extent implementation of HIV and AIDS interventions were to a larger extent dependent on funding from outside the universities. In all the Universities funding was mentioned as a serious constraint when it comes to implementation of designed HIV and AIDS interventions. HIV and AIDS were not placed as one of the priority activities of the Universities. In this regard, and given the fact that like elsewhere budget for universities are being trimmed, HIV and AIDS intervention activities are some of the activities which are shelved as a result of inadequate funding. In most university HIV and AIDS interventions to a larger extent depend on funding from sources outside the university budget. This is made explicit in one of the IDI at Mzumbe University where while rejoicing over the approval of the HIV and AIDS policy by the University council, its implementation was to depend on soliciting funds from donors outside the University. The following quotation from in depth interviews is illustrative.
Now in implementing this policy we are at initial processes including requesting funds from external stakeholders so that they can help in different activities including requesting funds for reprinting (of the policy) and dissemination to stakeholders so that they aware of its existence with various activities that need to be funded. But there are also some prevention activities that we have asked our external stakeholders to help our internal stakeholders to prevent themselves from HIV and AIDS and also to help them with treatment.
The findings also found that the interventions designed by universities did not include the surrounding communities. This was despite that fact that all the universities were surrounded by communities with which they interacted intensely All sorts of relationships with these communities ranging from provision of labour, markets to intimate sexual relationship were reported to be rampant. It was learnt in some in-depth interviews example that male students preferred sexual relationships with women from the surrounding communities. Reasons given included that non- students were easily accessible and the relationship was not as complicated and expensive to maintain as one with a female University student. However information collected showed that the HIV and AIDS programs/services/interventions in the universities did not target the surrounding communities. This is a serious limitation given the reportedly rampant sexual relationships between students and surrounding communities. In this regard, universities need a comprehensive program which not only include the surrounding communities but should also be linked up with the ward, district and regional programs because after all there are a number of university staff and students who seek HIV and AIDS related services outside the university.
7.3 Knowledge of Availability of HIV-Related Services within universities Knowing that there are services provided within universities increases the likelihood of utilizing such services. In this regard respondents were asked whether they knew

145
about availability of HIV and AIDS services in their universities. Results are presented in Tables 7.1, 7.2 and 7.3 for female and male respondents respectively. The survey results on awareness of any HIV and AIDS-related initiative at the university show that about 80 percent of university students are aware of HIV and AIDS-related interventions in universities. Also, the results show that awareness on university programs increase with duration of stay at the university (See Table 7.2).

146
Table 7.2 Distribution of respondents by awareness of HIV related programs in selected Universities
Male students Female students Background Characteristics
Heard of any HIV initiative
Number of men
Heard of any HIV initiative
Number of female students
Age group 19 years or below 63.6 12 73.7 21 20-24 82.3 624 80.2 673 25-29 82.2 345 75.7 123 30-34 83.3 85 76.0 28 35-39 87.5 24 57.1 7 40-44 95.8 25 100.0 7 45-49 100.0 13 100.0 3 50 plus 85.1 120 80 87
Marital status Married 85.1 182 81.9 100 Cohabited 86.7 32 72.4 30 Divorced 0.0 0 100.0 3 Widowed 1 100.0 1 Separated 71.4 7 100 2 Single 82.4 728 78.4 519
Accommodation parents home 80.5 109 80.0 85 Guardian 73.3 45 71.4 33 In campus hostel 86.1 593 83.0 498 un off campus 78.2 283 71.8 219 private apartment 82.2 292 78.4 143 Academic year first year 81.5 480 78.5 301 second year 81.9 392 75.5 334 third year 84.6 396 86.0 321 fourth year 80.0 49 66.7 24 fifth year 94.4 19 57.1 8
University UDSM 77.1 525 71.2 402 MUHAS 85.3 121 91.7 50 SUA 95.0 136 94.4 113 Mzumbe 85.0 207 93.1 157 TUMAINI 88.2 167 84.7 136 SAUT 81.9 191 67.4 147
Sponsorship Government 83.5 1065 80.7 784 Private 78.7 223 73.8 188
Program mode part time 87.5 20 62.5 10 full time 82.8 1302 79.5 981
Expenditure per semester Up to 500,000 83.7 531 78.9 442 500001-1,000,000 82.7 657 80.1 453 1,000,001-1,500,000 79.3 97 78.9 64 1,500,001-2,000,000 94.1 18 76.5 20 2,000,001-2,500,000 78.9 40 75.0 24 More than 2,500,000 100.0 3 100.0 1 TOTAL 82.9 1348 79.4 1006
Furthermore, knowledge on specific HIV and AIDS interventions was sought. Table 7.3 presents the findings. Results indicated that knowledge on availability of HIV and AIDS services among female respondents decreased with the increase in age an indication that older students did not pay attention to programs outside the academics. Of the females who knew about the availability of Counselling services, 82.2% were
147
single while 15% were married. Female students who mentioned knowing availability of condom distribution, FP services and conferences/campaigns were all single i.e. 100%. Meanwhile 58.3% of female students who knew about HIV and AIDS education were single while 33.3% were married and 8.3% were cohabiting. A higher percentage of female students who knew about different HIV/ADS services lived in Campus. About 5 out of ten of those who knew about the availability of counseling and existence of AIDS club live in campus while8 out of ten of those who knew of the ARV and condom provision were in campus. In addition 65.2% and 67.7 of women who knew of HIV education and gender clubs respectively lived in campus while those who knew of the availability of FP services we all (100%) living in campus. Findings further indicated that comparatively higher percentages of female respondents with knowledge of the services (e.g. Counseling (40.8%), Aids clubs (50%), ARV provision (66.7%), HIV education (72.2) and Gender clubs (50%) were in their third year of study.
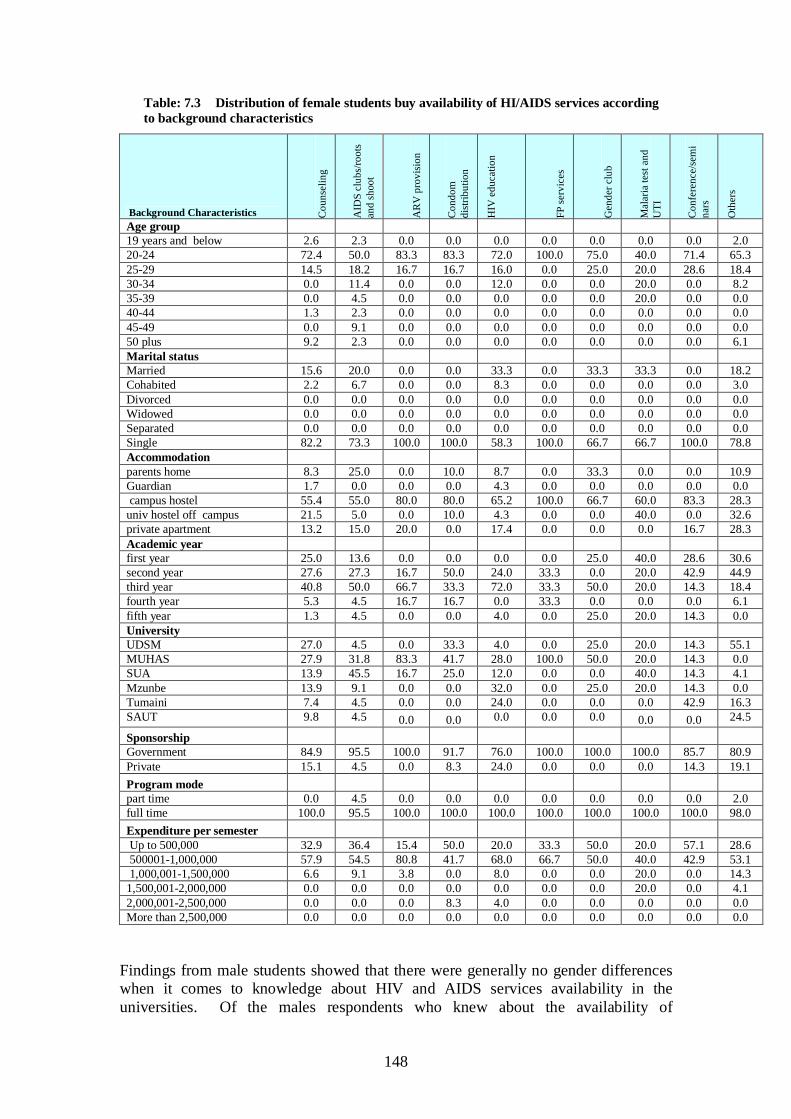
148
Table: 7.3 Distribution of female students buy availability of HI/AIDS services according to background characteristics
Background Characteristics Cou
nsel
ing
AID
S cl
ubs/
root
s an
d sh
oot
AR
V p
rovi
sion
Con
dom
di
strib
utio
n
HIV
edu
catio
n
FP se
rvic
es
Gen
der c
lub
Mal
aria
test
and
U
TI
Con
fere
nce/
sem
ina
rs
Oth
ers
Age group 19 years and below 2.6 2.3 0.0 0.0 0.0 0.0 0.0 0.0 0.0 2.0 20-24 72.4 50.0 83.3 83.3 72.0 100.0 75.0 40.0 71.4 65.3 25-29 14.5 18.2 16.7 16.7 16.0 0.0 25.0 20.0 28.6 18.4 30-34 0.0 11.4 0.0 0.0 12.0 0.0 0.0 20.0 0.0 8.2 35-39 0.0 4.5 0.0 0.0 0.0 0.0 0.0 20.0 0.0 0.0 40-44 1.3 2.3 0.0 0.0 0.0 0.0 0.0 0.0 0.0 0.0 45-49 0.0 9.1 0.0 0.0 0.0 0.0 0.0 0.0 0.0 0.0 50 plus 9.2 2.3 0.0 0.0 0.0 0.0 0.0 0.0 0.0 6.1 Marital status Married 15.6 20.0 0.0 0.0 33.3 0.0 33.3 33.3 0.0 18.2 Cohabited 2.2 6.7 0.0 0.0 8.3 0.0 0.0 0.0 0.0 3.0 Divorced 0.0 0.0 0.0 0.0 0.0 0.0 0.0 0.0 0.0 0.0 Widowed 0.0 0.0 0.0 0.0 0.0 0.0 0.0 0.0 0.0 0.0 Separated 0.0 0.0 0.0 0.0 0.0 0.0 0.0 0.0 0.0 0.0 Single 82.2 73.3 100.0 100.0 58.3 100.0 66.7 66.7 100.0 78.8 Accommodation parents home 8.3 25.0 0.0 10.0 8.7 0.0 33.3 0.0 0.0 10.9 Guardian 1.7 0.0 0.0 0.0 4.3 0.0 0.0 0.0 0.0 0.0 campus hostel 55.4 55.0 80.0 80.0 65.2 100.0 66.7 60.0 83.3 28.3 univ hostel off campus 21.5 5.0 0.0 10.0 4.3 0.0 0.0 40.0 0.0 32.6 private apartment 13.2 15.0 20.0 0.0 17.4 0.0 0.0 0.0 16.7 28.3 Academic year first year 25.0 13.6 0.0 0.0 0.0 0.0 25.0 40.0 28.6 30.6 second year 27.6 27.3 16.7 50.0 24.0 33.3 0.0 20.0 42.9 44.9 third year 40.8 50.0 66.7 33.3 72.0 33.3 50.0 20.0 14.3 18.4 fourth year 5.3 4.5 16.7 16.7 0.0 33.3 0.0 0.0 0.0 6.1 fifth year 1.3 4.5 0.0 0.0 4.0 0.0 25.0 20.0 14.3 0.0 University UDSM 27.0 4.5 0.0 33.3 4.0 0.0 25.0 20.0 14.3 55.1 MUHAS 27.9 31.8 83.3 41.7 28.0 100.0 50.0 20.0 14.3 0.0 SUA 13.9 45.5 16.7 25.0 12.0 0.0 0.0 40.0 14.3 4.1 Mzunbe 13.9 9.1 0.0 0.0 32.0 0.0 25.0 20.0 14.3 0.0 Tumaini 7.4 4.5 0.0 0.0 24.0 0.0 0.0 0.0 42.9 16.3 SAUT 9.8 4.5 0.0 0.0 0.0 0.0 0.0 0.0 0.0 24.5
Sponsorship Government 84.9 95.5 100.0 91.7 76.0 100.0 100.0 100.0 85.7 80.9 Private 15.1 4.5 0.0 8.3 24.0 0.0 0.0 0.0 14.3 19.1 Program mode part time 0.0 4.5 0.0 0.0 0.0 0.0 0.0 0.0 0.0 2.0 full time 100.0 95.5 100.0 100.0 100.0 100.0 100.0 100.0 100.0 98.0 Expenditure per semester Up to 500,000 32.9 36.4 15.4 50.0 20.0 33.3 50.0 20.0 57.1 28.6 500001-1,000,000 57.9 54.5 80.8 41.7 68.0 66.7 50.0 40.0 42.9 53.1 1,000,001-1,500,000 6.6 9.1 3.8 0.0 8.0 0.0 0.0 20.0 0.0 14.3 1,500,001-2,000,000 0.0 0.0 0.0 0.0 0.0 0.0 0.0 20.0 0.0 4.1 2,000,001-2,500,000 0.0 0.0 0.0 8.3 4.0 0.0 0.0 0.0 0.0 0.0 More than 2,500,000 0.0 0.0 0.0 0.0 0.0 0.0 0.0 0.0 0.0 0.0
Findings from male students showed that there were generally no gender differences when it comes to knowledge about HIV and AIDS services availability in the universities. Of the males respondents who knew about the availability of
149
Counselling 77.4% were single while 17.0%% were married. Eight respondents out of ten who mentioned knowing availability of condom distribution were single and three out of four who knew the about ARV provision were single. An equal percent (67.7%) of those who knew of the FP services and Gender Clubs were single and the remaining proportion of each i.e. 33.3% were cohabiting. Generally a higher percentage of those who knew about different HIV/ADS services lived in Campus. About 5 and 4 out of ten of those who knew about the availability of counseling and existence of AIDS club respectively lived in campus. In addition 61.9% and 46.4% of those who know the availability of ARV provision and condom distribution respectively lived in Campus. The proportion of female respondents who knew of the Malaria/UTI services and conferences and seminars was higher at 54.5 and 76.9 respectively. Findings further indicated that comparatively, slightly higher percentages of those with knowledge of the services (e.g. Counseling (37.2.8%), Aids clubs (40.9%), condom distribution 33.3% and HIV education (42.9) were in their third year of study Knowledge of availability of service was correlated to program mode (Table 7.4). While nine out of ten male respondents who knew of availability of counseling services were full time mode, a 100% of those who knew about other services (e.g. AIDS Clubs, ARV provision, condom distribution, HIV education, PF services, Gender clubs an Malaria test/UTI) were on full time mode.

150
Table 7.4 Distribution of male respondents by availability of HI/AIDS services according to background characteristics
Background Characteristics C
ouns
elin
g
AID
S cl
ubs/r
oots
and
shoo
t
AR
V
prov
isio
n
Con
dom
di
strib
utio
n
HIV
ed
ucat
ion
FP se
rvic
es
Gen
der c
lub
Mal
aria
test
and
UTI
Con
fere
nce/
sem
inar
s
Oth
ers
Age group 19 years and below 0.8 2.3 0.0 0.0 0.0 0.0 0.0 0.0 0.0 0.0 20-24 46.7 50.0 61.5 61.9 50.0 66.7 60.0 45.5 50.0 48.6 25-29 32.8 18.2 32.1 33.3 28.6 33.3 40.0 27.3 41.7 20.8 30-34 9.8 11.4 7.7 0.0 7.1 0.0 0.0 9.1 8.3 9.7 35-39 0.0 4.5 0.0 0.0 0.0 0.0 0.0 0.0 0.0 2.8 40-44 0.8 2.3 0.0 4.8 14.3 0.0 0.0 0.0 0.0 4.2 45-49 0.0 9.1 0.0 0.0 0.0 0.0 0.0 0.0 0.0 5.6 50 plus 9.0 2.3 7.7 0.0 0.0 0.0 0.0 18.2 0.0 8.3 Marital status Married 17.9 28.1 11.8 8.3 31.6 0.0 0.0 11.1 11.1 39.3 Cohabited 4.8 9.4 11.8 8.3 10.5 33.3 33.3 11.1 33.3 1.8 Divorced Widowed 0.0 0.0 0.0 0.0 0.0 0.0 0.0 0.0 0.0 0.0 Separated 0.0 0.0 0.0 0.0 0.0 0.0 0.0 0.0 0.0 1.8 Single 77.4 62.5 76.5 83.3 57.9 66.7 66.7 77.8 55.6 57.1 Accommodation parents home 8.3 6.8 23.1 28.6 25.0 33.3 20.0 18.2 7.7 12.5 Guardian 1.7 4.5 7.7 0.0 3.6 0.0 0.0 9.1 0.0 2.8 campus hostel 55.4 43.2 46.2 61.9 46.4 50.0 40.0 54.5 76.9 36.1 univ hostel off campus 21.5 27.3 19.2 9.5 10.7 16.7 40.0 9.1 15.4 29.2 private apartment 13.2 18.2 3.8 0.0 14.3 0.0 0.0 9.1 0.0 19.4 Academic year first year 28.1 22.7 19.2 23.8 32.1 50.0 40.0 50.0 15.4 44.4 second year 22.3 25.0 30.8 23.8 17.9 16.7 40.0 30.0 38.5 26.4 third year 37.2 40.9 30.8 33.3 42.9 16.7 0.0 0.0 38.5 23.6 fourth year 7.4 4.5 7.7 4.8 0.0 0.0 0.0 10.0 0.0 4.2 fifth year 5.0 6.8 11.5 14.3 7.1 16.7 20.0 10.0 7.7 1.4 University UDSM 27.0 2.3 11.5 28.6 3.6 16.7 20.0 45.5 0.0 37.5 MUHAS 27.9 43.2 30.8 28.6 17.9 50.0 60.0 36.4 23.1 6.9 SUA 13.9 27.3 30.8 23.8 32.1 0.0 0.0 0.0 7.7 20.8 Mzumbe 13.9 11.4 23.1 19.0 39.3 33.3 20.0 18.2 69.2 5.6 Tumaini 7.4 4.5 0.0 0.0 7.1 0.0 0.0 0.0 0.0 15.3 SAUT 9.8 11.4 3.8 0.0 0.0 0.0 0.0 0.0 0.0 13.9 Sponsorship Government 84.3 86.0 84.0 85.7 78.6 66.7 80.0 80.0 69.2 83.1 Private 15.7 14.0 16.0 14.3 21.4 33.3 20.0 20.0 30.8 16.9 Program mode part time 0.8 0.0 0.0 0.0 0.0 0.0 0.0 0.0 0.0 1.4 full time 99.2 100.0 100.0 100.0 1000 100.0 100.0 100.0 100.0 98.6 Expenditure per semester
Up to 500,000 33.6 25.0 15.4 28.6 7.1 50.0 20.0 54.5 23.1 30.6 500001-1,000,000 52.5 65.9 80.8 66.7 67.9 50.0 80.0 36.4 69.2 51.4 1,000,001-1,500,000 9.8 9.1 3.8 4.6 10.7 0.0 0.0 9.1 0.0 12.5 1,500,001-2,000,000 0.8 0.0 0.0 0.0 0.0 0.0 0.0 0.0 7.7 1.4 2,000,001-2,500,000 3.3 0.0 0.0 0.0 14.3 0.0 0.0 0.0 0.0 4.2 More than 2,500,000 0.0 0.0 0.0 0.0 0.0 0.0 0.0 0.0 0.0 0.0
151
7.4 Knowledge on female and male condoms One of the HIV related services mentioned to be provided in the universities is condom distribution of both male and female condoms. The study wanted to know if men and women had knowledge about the female condoms and also if they knew exactly where both men and female condoms can be obtained. In this regard respondents were asked if they knew where both the male and female condoms were obtainable and also if they ever heard about the female condom. The findings are presented in Table 7.5 The findings indicate that knowledge about where male condoms can be obtained was higher among cohabiting males (80%) compared to 78.8% and 77.1% of male respondents who are married and single respectively. For female respondents all widowed (100%) and divorced (100%) had knowledge on where the male condom can be obtained compared to proportion of those who are single, cohabiting and married where 67.6%82.1% and 63.3 respectively had knowledge of where male condoms can be obtained.

152
Table 7.5 Knowledge on where female and male condoms can be obtained by background characteristics
Background Characteristics Know where to obtain male condoms
Information on a female condom
Know where to obtain female condoms
Age group Male Female Male Female Male Female 19 and below 81.8 66.7 90.9 75.0 22.2 31.6 20-24 78.4 67.8 90.9 91.5 41.1 44.2 25-29 80.3 71.8 93.0 84.3 40.0 41.6 30-34 76.7 68.2 94.6 85.2 43.1 34.6 35-39 70.0 66.7 95.0 71.4 10.0 40.0 40-44 81.0 85.7 95.5 71.4 38.1 28.6 45-49 70.0 0.0 90.9 100.0 10.0 0.0 50 plus 83.1 66.7 88.8 89.9 42.2 48.3 Marital status Married 78.8 66.3 94.3 84.7 35.9 41.6 Cohabited 80.0 82.1 89.3 100.0 50.0 44.8 Divorced 0.0 100.0 0.0 66.7 0.0 50.0 Widowed 0.0 100.0 0.0 100.0 0.0 0.0 Separated 50.0 50.0 85.7 100.0 0.0 50.0 Single 77.1 67.6 91.7 90.1 38.7 43.4 Accommodation parents home 77.9 60.0 92.9 89.9 37.2 49.2 Guardian 83.3 66.7 96.8 81.5 55.6 40.0 campus hostel 80.6 68.8 92.6 90.9 42.2 40.8 univ hostel off campus 73.6 67.2 89.3 88.7 35.6 46.0 private apartment 81.7 70.4 90.8 88.2 37.0 44.0 Academic year first year 75.9 57.5 90.2 87.9 36.4 41.2 second year 75.8 71.5 92.7 88.5 34.2 40.2 third year 84.8 74.2 91.3 92.3 46.6 47.9 fourth year 83.7 61.1 97.6 90.0 39.0 50.0 fifth year 88.2 71.4 94.1 85.7 64.7 33.3 University UDSM 67.6 56.9 92.4 88.8 34.9 40.6 MUHAS 93.9 84.8 97.4 95.7 58.3 63.0 SUA 85.3 80.6 95.0 89.4 38.3 39.0 Mzumbe 88.2 82.2 88.9 92.4 41.9 48.1 Tumaini 81.9 72.3 92.9 87.1 38.1 42.9 SAUT 83.7 65.5 85.1 88.8 38.0 38.3 Sponsorship : Government 77.4 68.1 92.0 90.0 40.5 42.5 Private 85.7 68.7 90.2 88.7 36.3 43.6 Program mode part time 88.2 77.8 100.0 100.0 25.0 37.5 full time 79.1 68.5 91.4 89.5 39.6 43.3 Expenditure per semester Up to 500,000 77.5 66.5 91.8 90.2 39.2 43.8 500001-1,000,000 79.8 69.9 92.4 89.5 40.7 41.6 1,000,001-1,500,000 79.2 64.3 85.9 86.9 34.8 44.2 1,500,001-2,000,000 93.3 33.3 81.3 88.2 30.8 36.8 2,000,001-2,500,000 80.6 80.0 97.4 89.5 40.0 68.8 More than 2,500,000 100.0 100.0 100.0 100.0 0.0 0.0

153
TOTAL 79.2 68.2 91.7 89.6 39.6 43.1 A high percentage of both male and female respondents indicated to have heard about the female condom. Across the academic years there was slight difference among the years and between male and female. A notable observation is that, except for the third year where the percentage of female respondents who have heard of female condom is higher (92.3%) than that of the female respondents (91.3%) in third year, in all other years the proportion of male who have heard about the female condom was higher than the proportion of females who have heard about the female condom. Figure 8.1 is illustrative of the findings. The overall picture of having heard about female condom is shown in figure 8.2 where men have a slight edge over women.
Figure 7.1 Percentage of men and women who had ever heard of female condom by year of study
90.287.8
92.7
88.5
91.392.3
97.6
90
94.1
85.7
7880828486889092949698
Firstyear
Secondyear
ThirdYear
FourthYear
FifthYear
Ever heard of female condom
Male Female

154
Figure 7.2 Overall percent of men and women who have heard about Female condom
91.7
89.6
88
90
92
Male Female
Ever heard of female condom
The higher proportion of men and women who had heard about the female condom was not reflected in the knowledge on where the female condoms can be obtained. The proportions here were generally below half of those on having heard of the female condom along all background characteristics. A single exception worth mentioning is higher proportions of both men (58.3%) and women (63.0%) who knew where female condoms can be obtained at Muhimbili University of Health and Allied Sciences (MUHAS). Figure 7.3 is illustrative on the overall knowledge status of male and female on where female condoms could be obtained. The figure indicates that a bigger portion (43.1%) of women knew where to obtain condoms compared to the corresponding proportion for men which was 39.6%.
Figure 7.3 Knowledge on where female condoms can be obtained
39.6
43.1
3738394041424344
Male Female
Know where to obtain Female condom
7.5 Perceived Affordability of HIV-Related Services within universities Perception on affordability of HIV-related services influences the decision to seek their use. Respondents in this study were asked about their perception on affordability and results are presented in table 7.6 (females) and 7.5 (males) below.

155
Findings indicate that three out of four who perceived the HIV related services as best were single while 18.3% of these were married. But you also have 76.2% of those who perceive the services as bad being single while 19% of these are not married.

156
Table 7.6 Knowledge on male and female condoms
Distribution of respondents by knowledge on where female and male condoms can be obtained
Background Characteristics Bes
t
Goo
d
Ave
rage
Satis
fact
ory
Bad
Don
’t kn
ow
num
ber
Age group 19 years and below 0 1.9 3.6 2.8 0 0 11 20-24 75.9 67.9 70.7 72.0 75.0 100.0 370 25-29 9.6 18.2 14.4 9.7 10.7 0 71 30-34 1.2 3.1 3.0 4.2 0 0 14 35-39 1.2 0 6 1.4 0 0 3 40-44 1.2 1.3 0 0 0 0 3 45-49 0 0 0 1.4 0 0 1 50 plus 10.8 7.5 7.8 8.3 14.3 0 44
Marital status Married 18.3 15.0 16.7 14.3 19.0 0 60 Cohabited 5.0 2.5 5.8 2.0 4.8 14.3 4.2 Divorced 1.7 0 0 0 0 0 1 Widowed 0 0 0.8 0 0 0 1 Separated 0 0.8 0 0 0 0 1 Single 75.0 81.7 76.7 83.7 76.2 85.7 298
Accommodation parents home 10.8 7.1 10.5 8.5 0 50.0 47 Guardian 7.2 1.9 4.9 1.4 7.1 0 20 campus hostel 44.6 55.8 50.0 49.3 35.7 50.0 254 univ hostel offcampus 18.1 21.2 21.6 26.8 35.7 0 112 private apartment 19.3 14.1 13.0 14.1 21.4 0 75 Academic year first year 37.8 20.3 28.7 34.2 33.3 25.0 147 second year 26.8 41.1 34.1 30.1 33.3 12.5 176 third year 32.9 34.8 35.9 34.2 22.2 62.5 178 fourth year 2.4 3.2 1.2 0 7.4 0 11 fifth year 0 0.6 0 1.4 3.7 0 3
University UDSM 42.2 32.1 41.3 53.4 75.0 37.5 218 MUHAS 7.2 10.0 5.4 2.7 0 0 33 SUA 3.6 8.8 5.4 11.0 0 62.5 39 Mzumbe 12.0 18.9 22.2 16.4 10.7 0 72 Tumaini 22.9 14.5 13.2 8.2 7.1 0 72 SAUT 12.0 15.7 12.6 8.2 7.1 0 64
Sponsorship Government 82.1 85.3 81.8 82.9 88.9 100 422 Private 17.9 14.7 18.2 17.1 11.1 0 82
Program mode part time 0 0.6 0.6 1.4 0 0 3 full time 100 99.4 99.4 98.6 100 100 510
Expenditure per semester Up to 500,000 39.8 34.6 41.3 47.9 60.7 25.0 211 500001-1,000,000 44.6 55.3 50.9 39.7 21.4 75.0 251 1,000,001-1,500,000 9.6 6.3 4.2 8.2 14.3 0 35 1,500,001-2,000,000 1.2 1.9 1.8 1.4 0 0 8 2,000,001-2,500,000 4.8 1.9 1.8 2.7 3.6 0 13 More than 2,500,000
157
Table 7.7 shows that 75.7% of male who perceive the services as best were single while 20% were married. Likewise 75% of the males respondents who perceived the services as bad were single while 25% were married. This observation does not differ very much from that of women in the same category. There was very little difference among the first second and third year male respondents in terms of proportions that assessed the affordability of services as best, good, average and satisfactory.

158
Table 7.7 Affordability of HI/AIDS services according to background characteristics
Background Characteristics B
est
Goo
d
Ave
rage
Satis
fact
ory B
ad
Don
’t kn
ow
Tota
l
Age group 19 years and below 0 5 8 1 0 0 4 20-24 52.9 49.5 46.5 49.7 58.0 80.0 352 25-29 27.5 26.0 29.6 28.6 24.0 0 196 30-34 78 10.1 8.2 5.7 4.0 0 57 35-39 2.0 3.4 2.1 1.9 6.0 0 19 40-44 3.9 3.4 0.8 2.9 2.0 0 17 45-49 0 2.4 0.4 0 0 20.0 7 50 plus 5.9 4.8 11.5 13.3 6.0 0 61 Marital status Married 20.0 25.8 18.4 11.0 21.6 25.0 108 Cohabited 4.3 3.1 2.1 6.1 5.4 0 19 Divorced Widowed Separated 0 1.3 05 1.2 0 0 4 Single 75.7 69.8 78.9 81.7 73.0 75.0 411 Accommodation parents home 11.0 8.9 10.0 6.7 10.0 20. 66 Guardian 4.0 2.0 1.7 2.9 8.0 0 19 campus hostel 44.0 47.3 50.8 47.1 38.0 60.0 333 univ hostel off campus 19.0 20.2 17.5 26.0 24.0 0 141 private apartment 15.4 30.8 33.6 12.6 7.0 7 143 Academic year first year 36.3 33.2 29.6 32.1 42.0 0 231 second year 28.4 28.8 28.3 34.0 32.0 40.0 210 third year 27.5 34.1 35.8 27.4 22.0 60.0 227 fourth year 6.9 2.0 4.2 4.7 0 0 26 fifth year 1.0 2.0 2.1 1.9 4.0 0 15 University UDSM 34.0 28.8 42.8 47.2 58.0 20.0 279 MUHAS 17.5 8.7 7.8 5.7 4.0 20.0 64 SUA 7.8 12.5 9.9 9.4 6.0 0 71 Mzumbe 11.7 17.8 21.0 17.0 12.0 20.0 125 Tumaini 15.5 12.5 10.7 8.5 10.0 20.0 83 SAUT 13.6 19.7 7.8 12.3 10.0 20.0 93 Sponsorship Government 84.7 77.9 81.7 85.1 76.6 80.0 560 Private 15.3 22.1 18.3 14.9 23.4 20.0 130 Program mode part time 1.0 1.5 1.2 1.9 6.0 0 12 full time 99.0 98.5 98.8 98.1 94.0 100 694 Expenditure per semester
Up to 500,000 35.9 37.5 43.6 28.3 38.0 40.0 272 500001-1,000,000 49.5 50.5 46.9 53.8 48.0 60.0 354 1,000,001-1,500,000 7.8 7.2 5.8 9.4 6.0 0 50 1,500,001-2,000,000 1.0 1.9 0 1.9 2.0 0 8 2,000,001-2,500,000 5.8 2.4 3.7 6.6 4.0 0 29 More than 2,500,000 0 50.0 0 0 50.0 0 2

159
The qualitative data collected indicated that affordability was not a problem because mostly these services were said to be available freely. However affordability was said to be compromised at times by convenience. In the group discussions and in-depth interviews it was gathered that shortage of staff who offer the HIV and AIDS services in the university was a serious problem that make accessibility to the services difficult and in the end the student and staff shy away from the services. In two public Universities it was claimed that there were no specific doctors for HIV and AIDS and since the health facilities were always congested the doctors did not have enough time to give attention to HIV and AIDS service seekers. Related to the above is the issue of trust. Informants showed lack of trust on the staff and this was given as a reason why some students do not seek HIV and AIDS services in the University Health facility. Data indicated that utilization of VCT by members of staff and students of the same university was very low. According to the in depth interviews and group discussions people feared that their HIV status will be made public as they doubted the professionalism of the service givers. In two instances examples were given where any health staff is transferred overnight to the HIV and AIDS section without any kind of retraining. To build confidence on the would be users it is important that there are well qualified service givers and there is enough space for the HIV and AIDS services that also offered the required privacy. Students IDIs and group discussions in all the universities pointed out that attending some of the HIV and AIDS activities was made difficult by tight schedules. For example it was pointed out that the timetable for the students was too tight to have time to attend/access some of the activities. So much so that even when classes are cancelled to enable students attend such activities, students prefer to use such time for resting or finishing off their assignment rather than attending HIV and AIDS campaign meetings etc. In one Public University students complained that accessibility to male condoms was impaired by the fact that they were not put in a convenient place (halls of residence, wash rooms etc) where students could freely collect. Instead they were put at the University Dispensary and were hardly collected by students. Timing of the interventions was another issue that was mentioned to affect affordability. Intervention activities examples are sometimes conducted well into the term and few students attend because already they will have a lot of assignments and tests to do or preparing for examination. The HIV and AIDS interventions were supplementary activities as far as the students are concerned as reflected in the following quote from in depth interview
Students came here with their major objective being to study…..so to have interest in attending campaign (HIV and AIDS) is to sacrifice the major objective that brought him/her here to listen to you…..when one is under pressure of studies they concentrate on the study…….other things are always there
Indeed although all Universities are currently mindful of the danger that HIV and AIDS pose to their core activities, HIV and AIDS issues remain outside the core university business. The above thinking from students results from this fact. The
160
baseline wanted to know if there were any efforts by the universities to move HIV and AIDS into centre stage as part and parcel of the core University activities by making it part of the knowledge imparting exercise Results show that SUA has formally decided to integrate HIV and AIDS issues into its curriculum and Mzumbe is I the process of mainstreaming HIV and AIDS into its teaching. The idea is to raise the status of knowledge on HIV and AIDS equal and ensure that the university produces graduates who are well conversant with HIV and AIDS. This is a step in the right direction. Although it is too early to assess its efficacy, it needs to be emulated by other institutions of higher learning. The current approach where topics on HIV and AIDS are inserted in the courses or HIV and AIDS examples are used teaching should be abandoned. This will give HIV and AIDS the centrality it deserves given the fact that it is threatening the very core functions of the universities. Apart from building up the knowledge base on HIV and AIDS at these institutions, this will also increase participation of staff and students in HIV and AIDS related activities.
7.6 Perceived quality of HIV related services at the University How one perceives the services determines the use of the said service. In this regard our study wanted to know how the people who are supposed to use HIV related services at the university perceive the services with regard to quality. Respondents were asked how they perceived the quality of the different HIV related services offered by the university. The results are presented in Tables 7.6 and 7.7 present results for women and men respectively. Findings in table 7.8 show that 8 out ten female respondents who see the HIV related services as of best and good quality are single. But again 8 out of ten female respondents who perceive the quality of HIV related services as bad are also single. Two out of ten female respondents who perceive the HIV AIDS related services as average and satisfactory are married. Higher proportions in all perception categories lived in campus. For example 5 out of ten female respondents who perceive the quality of services as best, good, average and satisfactory were living in campus hostel. Likewise you also have a high percentage of theose who perceive the services as bad 43.2% living in campus hostel, 32.4% of those who perceive the quality as bad lived in university hostel off campus. Five respondents out of those who perceive the services as best were in the first year compared to the rest of the years.

161
Table 7.8 Female students’ perception on the quality of HIV AIDS related services
Background Characteristics Bes
t
Goo
d
Ave
rage
Satis
fact
ory
Bad
Don
’t kn
ow
Tota
l
Age group 19 years and below 1.0 1.8 3.2 1.2 2.7 1.7 13 20-24 71.0 67.9 68.8 67.1 81.1 79.2 473 25-29 11.0 13.7 14.3 16.5 8.1 10.0 85 30-34 3.0 3.0 3.9 3.5 0.0 3.3 21 35-39 0.0 1.2 0.6 2.4 0.0 0.8 6 40-44 1.0 1.2 0.6 1.2 0.0 0.0 5 45-49 0.0 0.0 0.0 1.2 0.0 0.0 1 50 plus 13.0 11.3 8.4 7.1 8.1 5.0 60
Marital status Married 13.0 11.7 23.8 21.0 11.1 6.5 70 Cohabited 6.5 2.5 4.0 1.6 7.4 2.2 17 Divorced 1.3 0.0 0.0 1.6 0.0 0.0 2 Widowed 0.0 0.8 0.0 0.0 0.0 0.0 1 Separated 0.0 0.8 1.0 0.0 0.0 0.0 2 Single 79.2 84.2 71.3 75.8 81.5 91.3 387
Accommodation parents home 10.1 7.9 7.4 10.8 5.4 9.2 56 Guardian 3.0 3.7 4.7 1.2 8.1 3.3 24 campus hostel 49.5 49.4 51.7 48.2 43.2 60.8 336 univ hostel off campus 20.2 23.8 21.5 22.9 32.4 18.3 144 private apartment 17.2 15.2 14.8 16.9 10.8 8.3 92 Academic year first year 49.0 30.1 25.3 32.9 22.2 30.8 210 second year 22.4 33.1 35.7 30.6 33.3 35.0 212 third year 26.5 33.1 37.0 34.1 33.3 34.2 220 fourth year 2.0 3.0 1.9 2.4 8.3 0.0 15 fifth year 0.0 0.6 0.0 0.0 2.8 0.0 2
University UDSM 41.0 34.5 44.8 43.0 70.3 40.0 279 MUHAS 4.0 8.3 5.2 4.7 0.0 5.8 37 SUA 6.0 11.3 3.9 7.0 0.0 10.0 49 Mzumbe 11.0 14.3 21.4 19.8 8.1 25.0 118 Tumaini 25.0 13.7 13.6 8.1 13.5 8.3 91 SAUT 13.0 17.9 11.0 17.4 8.1 10.8 91
Sponsorship Government 77.3 82.2 84.1 78.3 91.9 86.4 537 Private 22.7 17.8 15.9 21.7 8.1 13.6 112
Program mode part time 1.0 1.8 0.7 0.0 0.0 0.0 5 full time 99.0 98.2 99.3 100.0 100.0 100.0 653
Expenditure per semester Up to 500,000 49.0 38.7 43.5 46.5 54.1 29.2 276 500001-1,000,000 42.0 47.6 45.5 37.2 35.1 62.5 312 1,000,001-1,500,000 4.0 8.3 7.1 11.6 2.7 4.2 45 1,500,001-2,000,000 1.0 3.0 1.3 1.2 0.0 3.3 13 2,000,001-2,500,000 4.0 2.4 2.6 3.5 8.1 0.8 19
It was also noted that 99.0%, 98.2% and 99.3 % of those who perceive the services as best, good and average respectively are on full time mode. However 100% of those who perceive the services as satisfactory and bad are also in full time mode. There were slight differences when female respondents were compared to male respondent. Proportion of male respondents who perceived the quality as best and

162
were single was 71.6% while proportion of those who saw the services as good and were single. The corresponding figures for women were are higher at 79.2% and 84.2% respectively. However the proportion of male respondents who perceived the services as average and were single stood at 81.4% higher than the proportion of women for the same category which was 71.3%. The proportion of male respondents who saw the services as satisfactory was 79.2% higher than that of women which was 75.8%. 39.6% of those who saw the services as best were in the first year while 29.2% and 24.5% were in second and third year respectively.
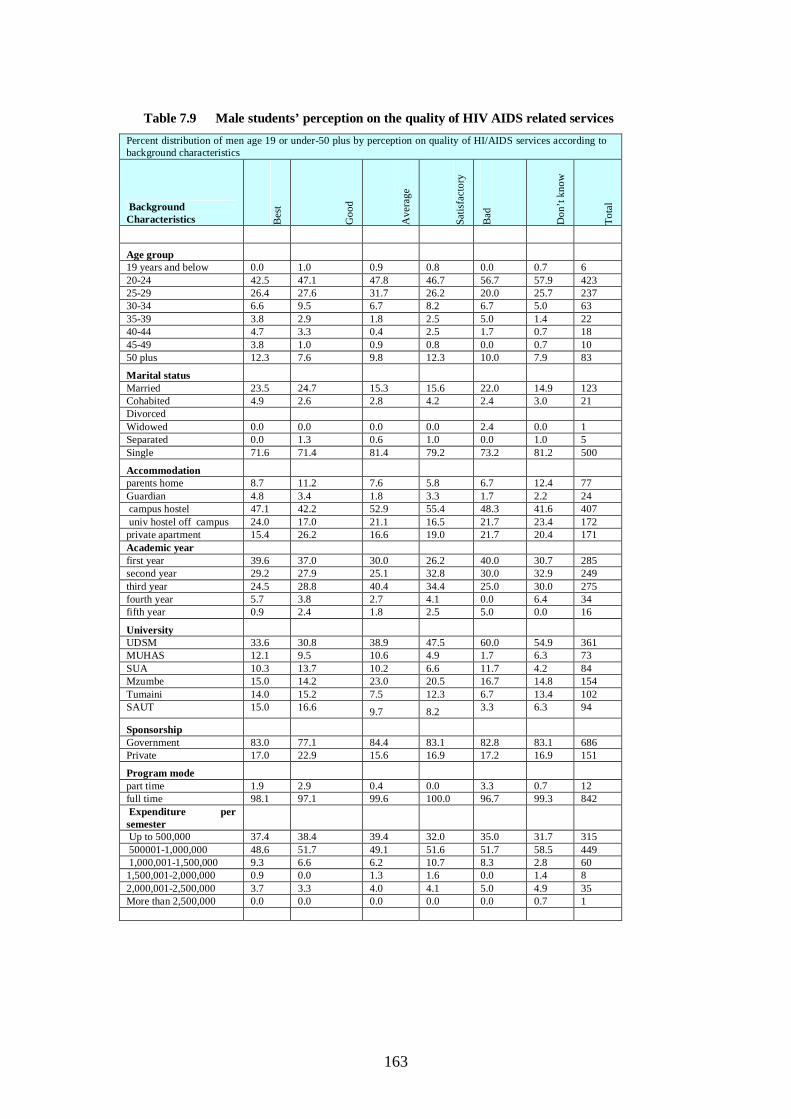
163
Table 7.9 Male students’ perception on the quality of HIV AIDS related services
Percent distribution of men age 19 or under-50 plus by perception on quality of HI/AIDS services according to background characteristics
Background Characteristics B
est
Goo
d
Ave
rage
Satis
fact
ory
Bad
Don
’t kn
ow
Tota
l
Age group 19 years and below 0.0 1.0 0.9 0.8 0.0 0.7 6 20-24 42.5 47.1 47.8 46.7 56.7 57.9 423 25-29 26.4 27.6 31.7 26.2 20.0 25.7 237 30-34 6.6 9.5 6.7 8.2 6.7 5.0 63 35-39 3.8 2.9 1.8 2.5 5.0 1.4 22 40-44 4.7 3.3 0.4 2.5 1.7 0.7 18 45-49 3.8 1.0 0.9 0.8 0.0 0.7 10 50 plus 12.3 7.6 9.8 12.3 10.0 7.9 83
Marital status Married 23.5 24.7 15.3 15.6 22.0 14.9 123 Cohabited 4.9 2.6 2.8 4.2 2.4 3.0 21 Divorced Widowed 0.0 0.0 0.0 0.0 2.4 0.0 1 Separated 0.0 1.3 0.6 1.0 0.0 1.0 5 Single 71.6 71.4 81.4 79.2 73.2 81.2 500
Accommodation parents home 8.7 11.2 7.6 5.8 6.7 12.4 77 Guardian 4.8 3.4 1.8 3.3 1.7 2.2 24 campus hostel 47.1 42.2 52.9 55.4 48.3 41.6 407 univ hostel off campus 24.0 17.0 21.1 16.5 21.7 23.4 172 private apartment 15.4 26.2 16.6 19.0 21.7 20.4 171 Academic year first year 39.6 37.0 30.0 26.2 40.0 30.7 285 second year 29.2 27.9 25.1 32.8 30.0 32.9 249 third year 24.5 28.8 40.4 34.4 25.0 30.0 275 fourth year 5.7 3.8 2.7 4.1 0.0 6.4 34 fifth year 0.9 2.4 1.8 2.5 5.0 0.0 16
University UDSM 33.6 30.8 38.9 47.5 60.0 54.9 361 MUHAS 12.1 9.5 10.6 4.9 1.7 6.3 73 SUA 10.3 13.7 10.2 6.6 11.7 4.2 84 Mzumbe 15.0 14.2 23.0 20.5 16.7 14.8 154 Tumaini 14.0 15.2 7.5 12.3 6.7 13.4 102 SAUT 15.0 16.6 9.7 8.2 3.3 6.3 94
Sponsorship Government 83.0 77.1 84.4 83.1 82.8 83.1 686 Private 17.0 22.9 15.6 16.9 17.2 16.9 151
Program mode part time 1.9 2.9 0.4 0.0 3.3 0.7 12 full time 98.1 97.1 99.6 100.0 96.7 99.3 842 Expenditure per semester
Up to 500,000 37.4 38.4 39.4 32.0 35.0 31.7 315 500001-1,000,000 48.6 51.7 49.1 51.6 51.7 58.5 449 1,000,001-1,500,000 9.3 6.6 6.2 10.7 8.3 2.8 60 1,500,001-2,000,000 0.9 0.0 1.3 1.6 0.0 1.4 8 2,000,001-2,500,000 3.7 3.3 4.0 4.1 5.0 4.9 35 More than 2,500,000 0.0 0.0 0.0 0.0 0.0 0.7 1

164
Apart from the above quantitative results, this study also explored qualitatively how people living with HIV and AIDS (PLHAs) in universities relate with other students and staff. The study also explored the capabilities of universities to take care of the PLHAs. In one of the focus group discussions, the participants described the dilemma they face between maintaining confidentiality and protecting rights of uninfected persons when they witness their fellow students deliberately having sexual intercourse with other people:
A friend of mine, we are in the same class (year of study) is HIV positive but he hides his status. I know for sure that he is HIV positive because I saw his documents in his room. Of course I can’t tell my fellows about his status but he keeps on changing partners and he brings in many women just for one night sexual intercourse….. I feel bad about his behaviours but still I find it unfair for him to infect innocent women…I know if I disclose his HIV status to other people I may be sued but you see? I am preserving his HIV status at the expense of many other lives”. FGD, Male students.
When the facilitator asked whether the university could do anything to rescue the situation, it was evident that students do not perceive the university to have such capability: Facilitator: Can the university do anything about this situation?
Participant 2: Our university administration treats everything from the legal perspective. They will ask: is he raping people? The answer is no. is it voluntary sexual intercourse? The answer is Yes, then they won’t even bother. …. Participant 4: Had we had strong counselors we could have reported such matters to the counselors but the quality of HIV counseling services here is pathetic…..” FGD, Male students.
Findings from the qualitative data also indicate that the quality of the services offered by the universities was marred by lack of funds to ensure sustainability of the interventions/services at the universities. Invariably the group discussions and in depth interviews indicated that there was no independent budget line for HIV related services at the universities. According to the in-depth discussions, there were some funds within the University budget that was being used for HIV and AIDS activities although for all Universities but this was inadequate. The universities HIV related services/interventions relied mostly on funds from outside the University e.g. the Government through TACAIDS and other organizations like SHOOTS and ROOTS, TACAIDS, NORAD, AMREF, ANGAZA, SPW international etc. At times funds from these organizations are released through competitive proposal writing. This means that it is the expertise in proposal writing rather than the need for enhancing HIV and AIDS interventions that is at stake. For universities to implement policies to effectively combat HIV and AIDS, the issue of funding needs to be resolved especially now where the Universities themselves are strapped for funding There is a need for Universities to have a budget line for HIV and AIDS activities so that there is a sustainable fund to support interventions to reduce HIV and AIDS transmission and infection at our universities. It was noted in some universities that the quality of HIV and AIDS services was compromised by the taken for granted assumption that anyone can talk on HIV and AIDS issues. The data collected commended continuous campaigns and concerts organized and conducted within the Universities but showed concern on the quality because some of the talks were repetitive and hence boring. There is a need for creativity and innovativeness on the parts of those who are concerned with campaigns
165
and concerts- (new topics and new approaches are needed). In the words one informant
Sometimes you feel pity why you decided to go there and listen because you have heard enough about these same things and you feel shy to leave the place. And sometimes the facilitator seem to be doing guesswork or maybe plagiarizing. She does not capture the audience attention because she does speak about down to earth examples (Student leader)
This was explained by the absence of a comprehensive action plan to guide interventions/activities a function of inadequate funding which gives the universities no choice but to accept unplanned interventional activities. Qualitative findings also indicate that the quality HIV related services especially VCT and others which are offered at University health centers, are prejudiced by the quality of other health services being offered by the center. Information from group discussions and in depth interviews for example pointed out that perception of poor services offered by the University of Dar es Salaam and Mzumbe University health centers have caused the students to have negative attitude on the Health facilities. In this regard students cannot fathom better HIV related services being offered by the same facility. HIV related services at the universities are also negatively impacted by the fact that they are seen as matters for the students. Even where there were HIV and AIDS policies like the University of DSM and SUA staff involvement was minimal in these services. This should be taken as a serious weakness on the universities programs because to the students it shows lack of seriousness of purpose. In fact if anything the participation of the staff (lecturers, professors and administrators) would have been a big incentive to the participation of the students and in the success of the programs.

166
CHAPTER 8 CONCLUSION AND RECOMMENDATIONS 8.1 Conclusion This study sought to establish baseline benchmarks for HIV and AIDS interventions in Tanzania universities. Being a baseline, the study has raised many questions about key intervention areas and has suggested priority areas where a few resources available can impact on the current HIV prevalence as well as the risk sexual behaviours that university students engage in. our major conclusion is that universities like any other population groups are prone to HIV infections. Thus, funding of university HIV-related interventions may result into reduction of the reported HIV risks. Objective one of this study aimed to determine HIV prevalence among university students. The results have shown that coverage of HIV testing was around 51.6% in which more females than males were likely to give their blood for HIV test. It is important to note that the reported response rate is the outcome of several factors: first, those who provided blood for HIV testing were not given their results on spot because the design of the study stated that HIV testing was anonymous and unlinked. Secondly, voluntary HIV testing in most of the universities had been done some time back before this study; the time ranged between a few weeks to some months. Unlike in this study, VCT did not involve filling questionnaires as a precondition for HIV testing. Some students felt that our study was too demanding and was taking too much time before one got tested. Thirdly, mobilization campaigns were locally organized by each university in collaboration with researchers. Although the intention was to ensure ownership of the whole exercise, universities differ in their capacities to organize and conduct mobilization campaigns. Still, our assumption was that for those who would like to get results on spot, we would facilitate them to get the same service from their VCT centres within universities. However, the mere presence of VCT facilities in universities does not necessarily imply that students will use them. This may imply that HIV testing within universities is still stigmatized. Also, lack of confidentiality at university VCT centres does not encourage students to be tested for HIV. Students’ desire for compensation or tangible incentives of their blood (in their own language, rewards, money, awards, gifts, compensation, motivation, etc) implies that the importance of HIV testing is not well understood by students. Objective two of this study sought to identify risk factors associated with HIV infections among university population and neighbouring communities. The results show that in general, knowledge on HIV and AIDS is very impressive (over 98%). However, comprehensive knowledge for both male and female students is less than 40%. Still, knowledge on STI symptoms is very low among university students. Also, very few students who have symptoms of STIs seek treatment. The low level of comprehensive knowledge on HIV and AIDS among the students implies that behavioural interventions among universities are on acute demand. Our understanding of STI treatment-seeking behaviour should influence our strategies for promoting STI treatment among university students. Also, use of condom is high among university students, even in universities where condom promotion is prohibited. However, women in all cases are less likely than men to use condom at first sex, use condom with non-regular partner and use condom at transactional sex. Also, it has been reported that more male students with one regular partner successfully refused to have sex without condom than female students with same number of regular partners. However, the proportion changes with increase of number of regular partners. More
167
female students with two or more regular partners are more likely to refuse to have sex without condom than male students with same number of regular partners. In all these situations, women use condom mainly to prevent pregnancy than HIV. The implication is that dual methods for prevention of pregnancy and HIV should be promoted among female students otherwise they will protect themselves against pregnancy and still get infected by HIV. Universities interact with surrounding communities in a number of ways. As such there are strong relationships that have developed between the universities and surrounding communities including economic, social, market and sexual relationships. Also, students engage in risky behaviour (multiple partners) for a number of reasons including fun, economic, academic and social. Furthermore, students and staff are mobile and the develop relationship which subject them to high risk both on transit and at destinations. Therefore, mobility among university populations is a risk factor and requires intervention. Objective three of this study sought to assess universities’ current and planned programs of HIV and AIDS responses. in relation to this, the final objective (Objective four) also sought to assess availability and utilization of HIV and AIDS related services at universities. The findings show that quality of HIV and AIDS related services in universities is pathetic. There are functional systems, guidelines and policies at the moment. Very few universities have clear referral systems for students and university staff who require further investigation for HIV related illnesses. Financial support to HIV and AIDS related programs is intermittent and sometimes unpredictable. Students’ accessibility to services may sometimes be constrained by the timing of the activities and/or tight timetable Formulating comprehensive policy on combating HIV and AIDS does not necessarily mean that there will be effective intervention. It was observed that the most serious challenge facing the universities with implementing HIV and AIDS interventions is funding. There is no independent budget line for HIV and AIDS related services. Universities invariably rely on funding from outside and this cannot sustain a comprehensive HIV and AIDS program. Also, the universities do not have a comprehensive strategic HIV and AIDS interventions that include all the stakeholders around the university at the same time linked and coordinated with the ward, district and regional programs of which the universities are parts. University students and staff not only interact with other people in the district/region but they also seek HIV and AIDS related services at these levels. High level of awareness has been observed on availability of HIV and AIDS related services but utilization is limited by students’ and staffs’ bad experience of other services offered in the universities health centres. Also, few universities have streamlined HIV and AIDS into teaching while others are still putting it on the side or bringing it in as topics or examples during teaching other causes. Still, HIV and AIDS interventions/services are supplementary to the core activities of the university so they are second priority to the students. Members of staff hardly participate in HIV and AIDS awareness activities. Thus, the four studied objectives of this study have been achieved. The remaining part is on how these evidences can be transformed into action. The next sub-section recommends how the policy makers, students, CSOs, researchers and universities are
168
potential in bridging the evidence presented in this study with HIV and AIDS interventions in universities.
169
8.2 Recommendations Based on the results of this study, a study team submits several recommendations specific to key audiences, in this case, policy makers, students, CSOs, researchers and universities, as follows: For Policy makers:
For comprehensive strategic and sustainable interventions, there is a need for policy makers to introduce a budget line for HIV and AIDS activities in universities and avoid the proposal writing method to donors.
For Civil Society Organizations (CSOs)
Encouraging CSOs to continue working with universities on HIV and AIDS interventions may reduce AIDS infections among university populations
CSOs working on HIV and AIDS and mobile populations should ensure that HIV and AIDS kits include messages on university populations
For Universities Mainstreaming of HIV and AIDS education: Based on the current low
comprehensive knowledge about HIV and AIDS, prevalence of misconceptions about the epidemic, involvement in HIV and AIDS-related behaviors and weak involvement of university management in HIV and AIDS activities, it is important that HIV and AIDS education be mainstreamed and integrated into university curricula. Mainstreaming of HIV and AIDS education will enable university students to acquire knowledge about the epidemic, avoid HIV and AIDS related behaviors and finally become experts in HIV and AIDS. Training of university instructors and designing the HIV and AIDS courses can be done in collaboration with external expertise as necessary steps before mainstreaming;
Supporting current student initiatives on HIV and AIDS awareness creation and Behaviour and social change: given that university students are conducting several activities that aim to mobilize other students on behaviour change, these initiatives need to be supported and promoted. Initiatives such HIV and AIDS awareness creation week, inter-university HIV and AIDS concerts and university HIV and AIDS clubs need support. By supporting such initiatives, other HIV and AIDS related problems (such as low turn up for HIV testing and getting test results and engagement in HIV and AIDS risk behaviours) can be easily addressed.
Improving Quality of VCT services at universities: There is need to improve quality of VCT services as well as having trained counselors within universities. In addition, universities need to increase accessibility to VCT, promote privacy and maintain confidentiality of counseling. VCT services need to be integrated in other healthcare and treatment services and not having stand-alone buildings or rooms so as to avoid labeling of VCT facilities as buildings or rooms for people living with HIV and AIDS.
Involving stakeholders around the universities in HIV and AIDS Interventions: University HIV and AIDS programs should include all the stakeholders around the university at the same time linked and coordinated with the ward, district and regional programs of which the universities are parts. This is because University students and staff not only interact with other people in the district/region but they also seek HIV and AIDS related services at these levels. Within universities, members of staff should form an integral part of interventions.
Establishing comprehensive care and support for university members who are living with HIV: As reported in this study, most universities do not have clear policies on how to care for the PLHAs. Other universities are yet to offer ARVs
170
and none of the universities has nutrition plan for the PLHAs. A referral system need to be developed so that university members who get their HIV test in facilities that do not offer care and treatment services can access such services. One way to do so is to create links with community-based support services that are available at the local level or in the university neighborhood so that continuous support for PLHAs is available.
Students:
Encouraging students to form more groups, clubs and associations that aim to promote change in reduction of risk behaviour and increase in positive social norms may reduce chances of AIDS infections among students.
Researchers Conducting further research to explore the unwillingness of university
students to test for HIV would compliment the results of this study; Baseline study should be complemented by follow up and endline studies so as
to establish trends in change of behaviour, utilization and quality of services at universities.
8.3 Way Forward As the study report is being finalized, several activities need to be done in order link the findings to interventions:
1. Dissemination of the findings to the national stakeholders, including participating universities need to be done without delay;
2. Baseline data was generated to act as benchmarks for implementation of HIV and AIDS-related programs and interventions in universities. Universities need to prioritize their interventions and agree on key indicators to be monitored and timeline for implementing these findings. The Goal-Indicator matrix can serve the purpose;
3. Technical briefs for key audiences need to be prepared from the study report and;
4. Plans for publishing the report and journal articles for wider readership should be set.

171
REFERENCES
Altman, Dennis 2001: Global Sex, University of Chicago Press, Chicago. Boerma, JT, Urssa, M, Nnko, S, Ng’weshemi, J, Isingo, R, Zaba, B and Mwaluko, G (2002):
Socioeconomic contexts of AIDS Epidemic in a rural area in Tanzania with focus on people’s mobility and marriage. In Sexually Transmitted Infections Vol.78 Suppl.1 (pgs 97-105
Boerma, TJ, Urassa, M, Senkoro, K, Klokke, A and Ng’weshemi, JZ (1999): Spread of HIV infection in a rural area of Tanzania. AIDS Vol.13 (10) pgs. 1233-40.
Fuglesang, M. 1994. Veils and Videos. Female youth culture on the Kenyan coast. Almquist and Wiksell.
Fuglesang, M: 1997. Lessons for Life: Past and Present Modes of Sexuality Education in Tanzanian Society. Social Science and Medicine 44(8): 1245-1254.
Furstenberg, F. F., Jr. (1993). Howfamilies manage risk and opportunity in dangerous neighborhoods. In W. J.Wilson (Ed.), Sociology and the public agenda (pp. 231-258). Newbury Park, CA: Sage. Furstenberg, F. F.,&Hughes, M. E. (1995). Social capital and successful development among at-risk youth. Journal of Marriage and the Family, 57, 580-592.
Holland, Janet, Caroline Ramazanoglu, Sue Scott, Sue Sharpe, and Rachel Thomson. 1991. “Between Embarrassment and Trust: Young Women and the Diversity of Condom Use.” In P. Aggleton, G. Hart, and P. Davies (eds.), AIDS: Responses, Interventions and Care (pp. 127–48). Bristol, PA: The Falmer Press.
Kapiga, D: 1988: Adolescent Fertility in Tanzania - A Case Study of Dar es Salaam Region (Unpublished). Kapiga, S. H., and J. L. P. Lugalla. 2002. “Sexual Behavior Patterns and Condom Use in Tanzania: Results From the 1996 Demographic and Health Survey.” AIDSCare 14(4):443–53.
Katapa, Rosalia, 1994: Arranged Marriages. In Tumbo-Masabo, Zubeida and Liljestrom, Rita (Eds): Chelewa Chelewa: The Dilemma of teenage Girls, the Scandinavian Institute of African Studies pg 76- 95.
Killewo J, 1994. Epidemiology towards the control of HIV infection in Tanzania with special reference to Kagera region. PhD thesis, Dept of Epidemiology and Public Health, Umeå University.
Kishamawe, c, Vissers, DC, Urasa, M, Isingo, R, Mwaluko, G, Borsboom, GJ, Voeten, HA, Zaba, B, Habbema, JD and de Vlas, SJ (2006): Mobility and HIV in Tanzanian couples: both mobile persons and their partners show increased risk. AIDS Vol.20(4) pgs: 601-8.
Klepp KI, Ndeki SS, Leshabari MT, et al. AIDS education in Tanzania: Promoting risk reduction among primary school children. Am J Public Health 1997; 87(12):1931-36.
Klepp, K.I.; Biswalo, PM; Talle, A, 1995: Young people at risk – Fighting AIDS in northern Tanzania. Oslo, Universitets förlaget.
Leshabari, M.Y., Mpangile, S.G., Kaaya, S.F. and Kihwele, D.J., 1994: From teenage unwanted pregnancy to induced abortion: who facilitates the links? International Journal of Adolescence and Youth 4, pp. 195-210 Abstract- PsycINFO
Leshabari, M: 1988: Factors Influencing School-Adolescent Fertility Behaviour in Dar es Salaam, Tanzania (Unpublished).
Leshebari M, and Kaaya, S, 1997: Bridging the information gap. In P. Setel et al Eds: Sexual Networking, Knowledge and Risk - Health Transition Review supp 3 vol.7.
Liljestrom, R, Masanja P, Mkai C and Tumbo-Masabo, Z, 1994: the Pubescent Girl- Past and Present. In Tumbo-Masabo, Z and Liljestrom, R (Eds): Chelewa Chelewa: The Dilemma of teenage Girls, the Scandinavian Institute of African Studies, pg 35- 53.
Matasha, E, Ntembelea, T., Said, W., Todd, J., and Mayaud, P., 1996: Baseline questionnaire survey of sexual and reproductive health among primary and secondary school pupils in Mwanza region,
Mbilima, M. (2005): HIV and AIDS Voluntary Testing, Counselling, Care and Treatment. University of Dar-es-Salaam Technical AIDS Sub-Committee, No.2, University of Dar-es-Salaam.
172
Mbilima, M. and Mvungi, A. (2004): Study of African Universities’ Response to the Threat of HIV/ AIDS in 12 Global HIV/AIDS Initiative Countries, Country Report, Tanzania: Submitted to the Association of African Universities, Accra, Ghana.
Mbilima, M., Lyamuya, E., Tungaraza, F., et al (2006): University of Dar-es-Salaam HIV and AIDS Policy, University of Dar-es-Salaam.
Megan Klein, Megan and Coombes, Yolande, 2005: Trust and Condom Use: The Role of Sexual Caution and Sexual Assurances for Tanzanian Youth (a baseline survey), PSI Research Division. Working Paper No. 64. April.
Muhondwa, E. (1999). Adolescent sexuality and a HIV/AIDS in Mtwara rural and Makete districts.: A study commissioned by UNICEF- Tanzania Office. Dar es Salaam, Tanzania.
Parker., R. and G. Herdt, and M. Carballo (1991) Sexual Culture, HIV Transmission and AIDS research. The Journal of Sex Research. 28(1): 77-98.
Raudenbush, S.W. (1997). Statistical analysis and optimal design for cluster randomized trials. Psychological Methods, 2(2), 173-185.
Silberschmidt, Margrethe and Rasch Vibeke: 2001: Adolescent girls, illegal abortions and ‘’sugar-daddies’’ in Dar es Salaam: vulnerable victims and active social agents. In Social Science & Medicine, vol. 52, Issue 12 June 1815-1826.
Silberschmidt, Margrethe. 2001. ‘Disempowerment of Men in Rural and Urban East Africa: Implications for Male Identity and Sexual Behavior’. World Development 29:657-71.
Tanaka Y, Kunii O, Hatano T, Wakai S (2008): Knowledge, Attitude and Practice (KAP) of HIV Prevention and HIV Infection risk among Congolese Refugees in Tanzania. In Health Place. Sept; 14(3):434-52. Epub.2007 Sep 21.
Tanzania (Unpublished).
Tanzania Bureau of Statistics (Planning Commission) and Macro International Inc. 1993. Tanzania Demographic and Health Survey 1991/1992. Macro International Inc. Calverton, Maryland, USA and Planning Commission, Tanzania
Tanzania Bureau of Statistics (Planning Commission) and Macro International Inc. 1995. Knowledge, Attitudes and Practices Survey 1994. Macro International Inc. Calverton, Maryland, USA and Planning Commission, Tanzania
Tanzania Bureau of Statistics (Planning Commission), Dar es Salaam, Tanzania and Macro International Inc. 1997. Tanzania Demographic and Health Survey 1996. Bureau of Statistics (Planning Commission), Dares Salaam, Tanzania and Macro International Inc.Calverton, Maryland USA
Tanzania Commission for AIDS, National Bureau of Statistics and ORC Macro. 2005. Tanzania HIV/AIDS Indicator Survey 2003-04. Tanzania Commission for AIDS: Dar es Salaam, Tanzania. National Bureau of Statistics: Dar es Salaam, Tanzania. ORC Macro: Calverton, Maryland, USA
Tanzania Commission for AIDS, National Bureau of Statistics and ORC Macro. 2005. Tanzania HIV/AIDS Indicator Survey 2007-08. Tanzania Commission for AIDS: Dar es Salaam, Tanzania. National Bureau of Statistics: Dar es Salaam, Tanzania. ORC Macro: Calverton, Maryland, USA (draft)
UNAIDS/WHO (2007): AIDS epidemic update, Geneva. UNDP, 1999: “Asking young people about sexual and reproductive behaviours: Introduction to
Illustrative Core Instruments”. UNDP/UNFPA/WHO/World Bank Special Programme of Research, Development and Research Training in Human Reproduction
UNESCO and UNFPA, 1998: Handbook for Education on Adolescent Reproductive and Sexual Health.
UNICEF, 2003: The State of the World’s Children. Young, Jake (1994) Anthropological Research on Patterns of Sexual Behavior in Sub-Saharan Africa: Implications for HIV/AIDS Interventions. Journal of the Steward Anthropological Society. 22(1):1-12.
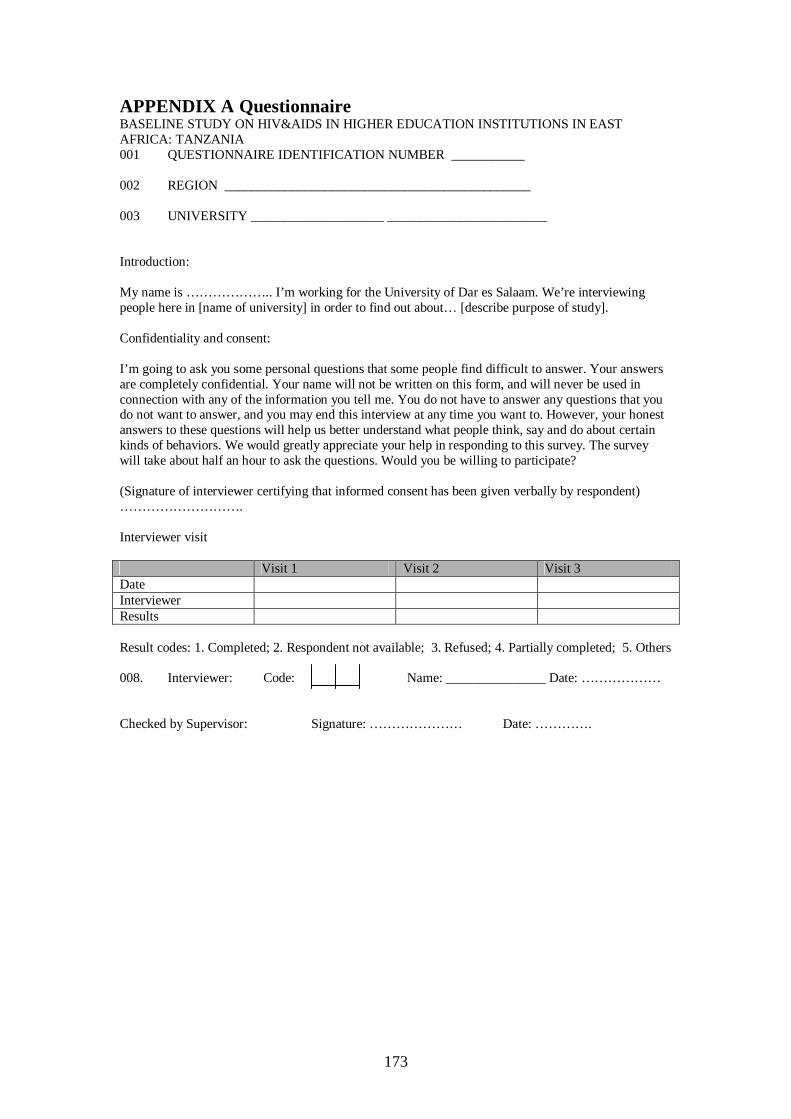
173
APPENDIX A Questionnaire BASELINE STUDY ON HIV&AIDS IN HIGHER EDUCATION INSTITUTIONS IN EAST AFRICA: TANZANIA 001 QUESTIONNAIRE IDENTIFICATION NUMBER ___________ 002 REGION ______________________________________________ 003 UNIVERSITY ____________________ ________________________ Introduction: My name is ……………….. I’m working for the University of Dar es Salaam. We’re interviewing people here in [name of university] in order to find out about… [describe purpose of study]. Confidentiality and consent: I’m going to ask you some personal questions that some people find difficult to answer. Your answers are completely confidential. Your name will not be written on this form, and will never be used in connection with any of the information you tell me. You do not have to answer any questions that you do not want to answer, and you may end this interview at any time you want to. However, your honest answers to these questions will help us better understand what people think, say and do about certain kinds of behaviors. We would greatly appreciate your help in responding to this survey. The survey will take about half an hour to ask the questions. Would you be willing to participate? (Signature of interviewer certifying that informed consent has been given verbally by respondent) ………………………. Interviewer visit Visit 1 Visit 2 Visit 3 Date Interviewer Results Result codes: 1. Completed; 2. Respondent not available; 3. Refused; 4. Partially completed; 5. Others 008. Interviewer: Code: Name: _______________ Date: ……………… Checked by Supervisor: Signature: ………………… Date: ………….

174
SECTION 1: BACKGROUND CHARACTERISTICS No. Question and filters Coding categories Skip to Q101 Record of sex of the respondent Male 1
Female 2
Q102 In what month and year were you born? Month Don’t know month 88 No response 99 Year Don’t know year 88 No response 99
Q103 How old were you last year? (Compare and correct Q102 if needed)
Age in completed years Don’t know 88 No response 99 Estimate best answer (102 and 103)
Q104 Which course/program are you taking at this university?
……………………………………………………………………………
Q105 In which year of study are you? First year 1 Second year 2 Third year ………….3 Fourth year……………………4 Fifth year………………………5 Not mentioned/ no response 99
Q109
Q106 Are you a part-time or full time student? Part-time…………………..1 Full time…………………..2 Other ………………………3
Q107 During your study period, where do you usually reside
At home with my parents At home with my guardian(s) Here at the main campus At the university hostel located outside the main campus I have a hired room/apartment
Q108 Who sponsors your studies? Government through loan board …..1 Private………………………….2
Q109 How much money do you receive (if sponsored) or spend (if self-sponsored) per semester
Tshs ………………….
Q110 Apart from being a student, what is your occupation? (CIRCLE THE MAIN OCCUPATION)
Business 1 Trading 3 Public employee 4 Private employee 5 Unemployed 7 Other -------------------- 8 No response 99
Q111 What Religion are you? Christian 1 Moslem 2 Others---------------------------------- Don’t know 88 No response 99
Q112 How often do you go to church/mosque?
Daily 1 Weekly 2 Monthly 3 Less than once per month 4 Don’t know 88 No response 99
Q113 Have you ever had penetrative sex? Yes ……………………1 No……………………….2 Not sure…………………3 Don’t know……………..4
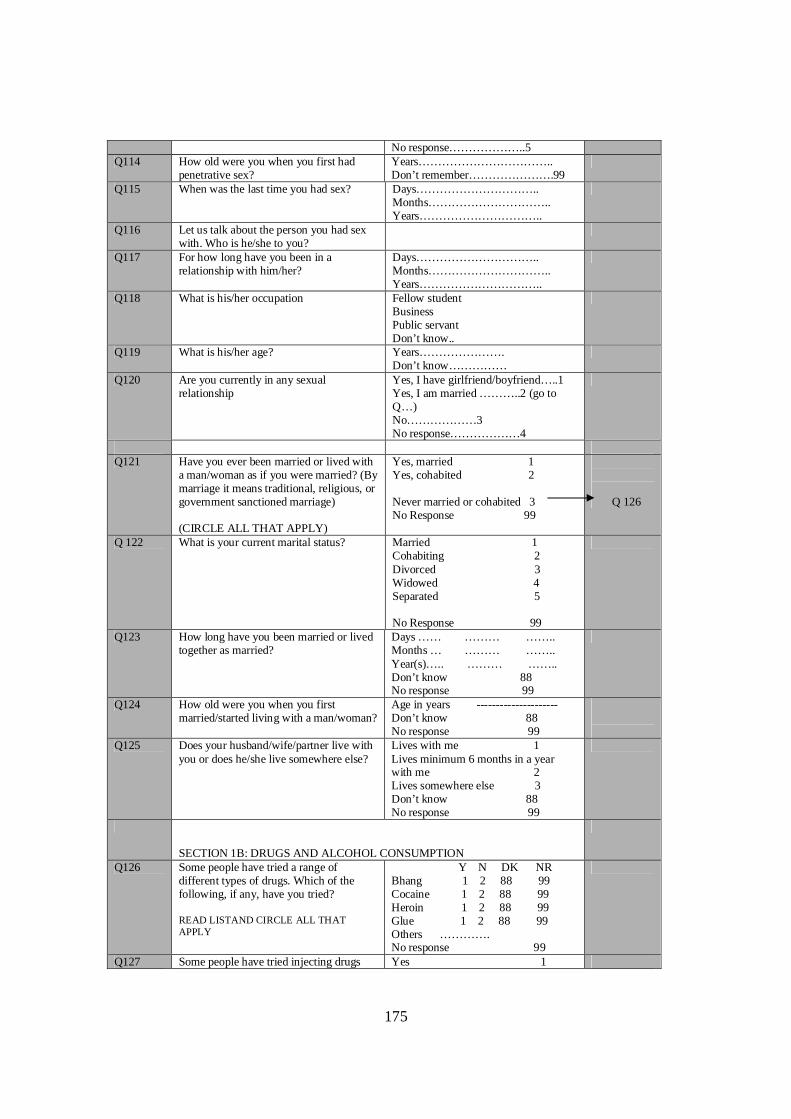
175
No response………………..5 Q114 How old were you when you first had
penetrative sex? Years…………………………….. Don’t remember………………….99
Q115 When was the last time you had sex? Days………………………….. Months………………………….. Years…………………………..
Q116 Let us talk about the person you had sex with. Who is he/she to you?
Q117 For how long have you been in a relationship with him/her?
Days………………………….. Months………………………….. Years…………………………..
Q118 What is his/her occupation Fellow student Business Public servant Don’t know..
Q119 What is his/her age? Years…………………. Don’t know……………
Q120 Are you currently in any sexual relationship
Yes, I have girlfriend/boyfriend…..1 Yes, I am married ………..2 (go to Q…) No………………3 No response………………4
Q121 Have you ever been married or lived with
a man/woman as if you were married? (By marriage it means traditional, religious, or government sanctioned marriage) (CIRCLE ALL THAT APPLY)
Yes, married 1 Yes, cohabited 2 Never married or cohabited 3 No Response 99
Q 126
Q 122 What is your current marital status? Married 1 Cohabiting 2 Divorced 3 Widowed 4 Separated 5 No Response 99
Q123 How long have you been married or lived together as married?
Days …… ……… …….. Months … ……… …….. Year(s)….. ……… …….. Don’t know 88 No response 99
Q124 How old were you when you first married/started living with a man/woman?
Age in years --------------------- Don’t know 88 No response 99
Q125 Does your husband/wife/partner live with you or does he/she live somewhere else?
Lives with me 1 Lives minimum 6 months in a year with me 2 Lives somewhere else 3 Don’t know 88 No response 99
SECTION 1B: DRUGS AND ALCOHOL CONSUMPTION
Q126 Some people have tried a range of different types of drugs. Which of the following, if any, have you tried? READ LISTAND CIRCLE ALL THAT APPLY
Y N DK NR Bhang 1 2 88 99 Cocaine 1 2 88 99 Heroin 1 2 88 99 Glue 1 2 88 99 Others …………. No response 99
Q127 Some people have tried injecting drugs Yes 1
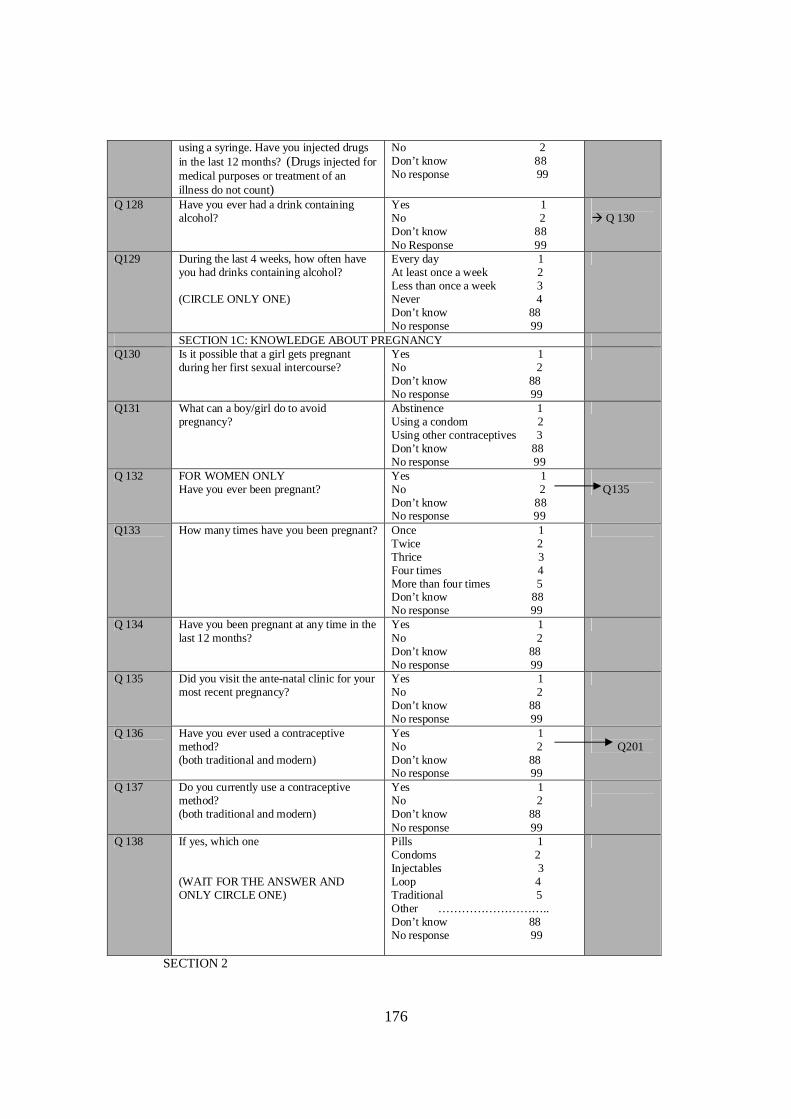
176
using a syringe. Have you injected drugs in the last 12 months? (Drugs injected for medical purposes or treatment of an illness do not count)
No 2 Don’t know 88 No response 99
Q 128 Have you ever had a drink containing alcohol?
Yes 1 No 2 Don’t know 88 No Response 99
Q 130
Q129 During the last 4 weeks, how often have you had drinks containing alcohol? (CIRCLE ONLY ONE)
Every day 1 At least once a week 2 Less than once a week 3 Never 4 Don’t know 88 No response 99
SECTION 1C: KNOWLEDGE ABOUT PREGNANCY Q130 Is it possible that a girl gets pregnant
during her first sexual intercourse? Yes 1 No 2 Don’t know 88 No response 99
Q131 What can a boy/girl do to avoid pregnancy?
Abstinence 1 Using a condom 2 Using other contraceptives 3 Don’t know 88 No response 99
Q 132 FOR WOMEN ONLY Have you ever been pregnant?
Yes 1 No 2 Don’t know 88 No response 99
Q135
Q133 How many times have you been pregnant? Once 1 Twice 2 Thrice 3 Four times 4 More than four times 5 Don’t know 88 No response 99
Q 134 Have you been pregnant at any time in the last 12 months?
Yes 1 No 2 Don’t know 88 No response 99
Q 135 Did you visit the ante-natal clinic for your most recent pregnancy?
Yes 1 No 2 Don’t know 88 No response 99
Q 136 Have you ever used a contraceptive method? (both traditional and modern)
Yes 1 No 2 Don’t know 88 No response 99
Q201
Q 137 Do you currently use a contraceptive method? (both traditional and modern)
Yes 1 No 2 Don’t know 88 No response 99
Q 138 If yes, which one (WAIT FOR THE ANSWER AND ONLY CIRCLE ONE)
Pills 1 Condoms 2 Injectables 3 Loop 4 Traditional 5 Other ……………………….. Don’t know 88 No response 99
SECTION 2

177
SEXUAL HISTORY: NUMBERS AND TYPES OF PARTNERS Now I am going to ask you some personal questions about your sexual life. Remember we are asking these questions to learn more about how people like yourself feel, in order to help you make your life safer. We know that some people have had sexual intercourse and some have sexual intercourse with more than one person. Others don’t. Please, answer the following questions honestly. Remember, your name is not written on this questionnaire. No. Question and filters Coding categories Skip to Q201 Have you ever had sexual intercourse?
[By sexual intercourse, we are only taking about vaginal or anal sex]
Yes 1 No 2 Don’t know 88 No response 99
Q301
Q202 At what age did you FIRST have sexual intercourse?
Age in years Don’t know 88 No response 99
Q203 Was it voluntary? Yes 1 No 2 Don’t know 88 No response 99
Q204 Was a condom used during this first time you had sexual intercourse?
Yes 1 No 2 Don’t know 88 No response 99
Q207
Q205 What were the main reasons that you used a condom the FIRST time you had sexual intercourse? Don’t read the list CIRCLE ALL THAT APPLY
To prevent pregnancy For prevention of HIV For prevention of STIs We don’t trust each other Other----------------------------- Don’t know 88 No response 99
Q206 Who suggested the use of condoms? CIRCLE ONLY ONE
Myself 1 My partner 2 Joint decision 3 Don’t know 88 No response 99
Q207 Why was a condom not used the first time you had sex? Don’t read the list CIRCLE ALL THAT APPLY
Not available Too expensive Partner objected Don’t like them Didn’t think it was necessary Not aware of condom Other ………. Don’t know 88 No response 99
Q208 Who suggested not to use condoms? CIRCLE ONLY ONE
Myself 1 My partner 2 Joint decision 3 Not discussed 4 Don’t know 88 No response 99
Q209 Have you had sexual intercourse in the last 12 months?
Yes 1 No 2 Don’t know 88 No response 99
Q301
Q210 How many sexual partners have you had Number of sexual partners

178
in the last 12 months? Don’t know 88 No response 99
Q211 Of the sexual partners you had in the past 12 months, how many were your regular partners? (Read the following definition: A “REGULAR” PARTNER is a spouse, live-in partner or somebody whom you have sex with regularly)
Number of REGULAR partners -------------- Don’t know 88 No response 99
Q212 Of the sexual partners you had in the past 12 months, how many were non-regular/casual partners? (Read the following definition: “NON-REGULAR”/CASUAL PARTNER is a sexual partner you don’t have sex with regularly and you don’t pay)
Number of NON-REGULAR/CASUAL partners ------------------------------------------- Don’t know 88 No response 99
Q213 Of the sexual partners you had in the past 12 months, how many were COMMERCIAL PARTNERS? (Partners with whom you had sexual intercourse in exchange for money)
Number of COMMERCIAL partners -------- Don’t know 88 No response 99
Q214 What was the age (ages) of the partners you have had sexual intercourse with, in the past 12 months? FILL IN ALL THAT APPLY (Key: RP= Regular Partner; NRP= Non-regular partner/ Casual partner; CP= Commercial partner)
RP NRP CP Partner 1: ………. …….. …… Partner 2: ………. …….. ……. Partner 3: ………. …….. ……. Partner 4: ……….. …….. ……. Don’t know 88 No response 99
Q215 Have you ever in the last 12 months received gifts, money or favors in exchange for sex?
Yes 1 No 2 Don’t know 88 No response 99
Q216 Have you ever given someone gifts, money or favors to have sex with in the last 12 months?
Yes 1 No 2 Don’t know 88 No response 99
Q217 Do young females in this area normally have partners who are older then themselves?
Yes 1 No 2 Don’t know 88 No response 99
Q218 Do young males in this area normally have partners who are older then themselves?
Yes 1 No 2 Don’t know 88 No response 99
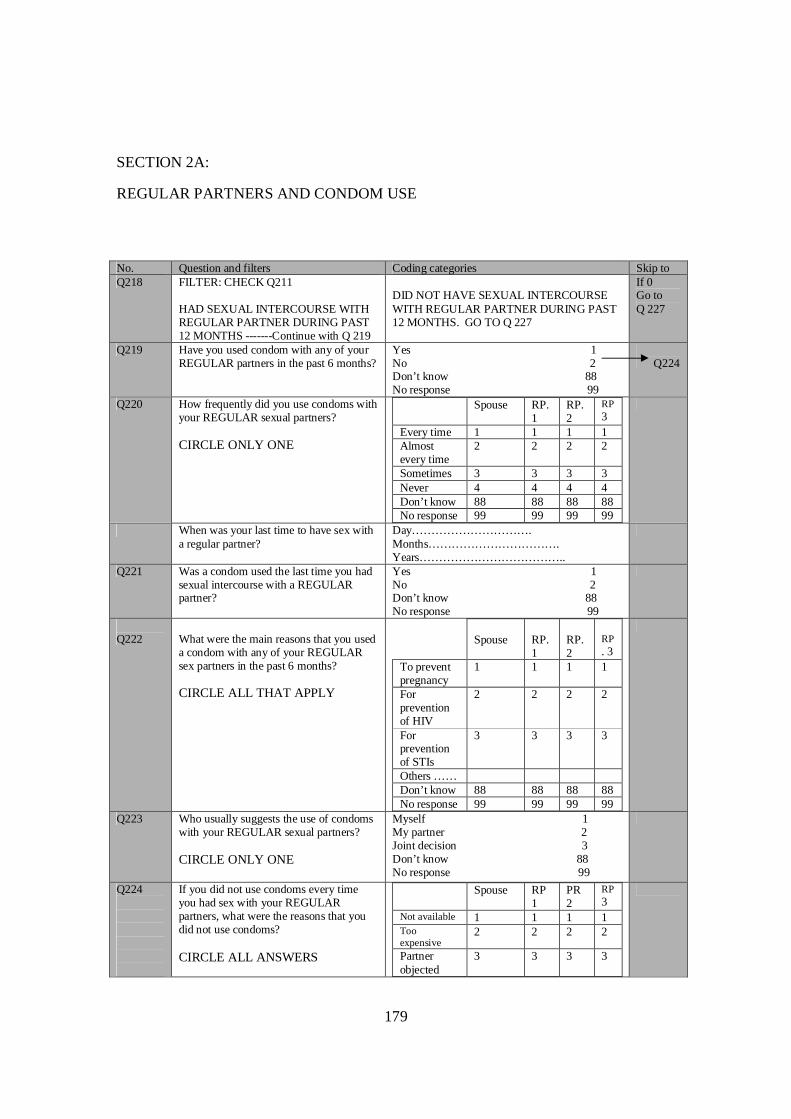
179
SECTION 2A: REGULAR PARTNERS AND CONDOM USE No. Question and filters Coding categories Skip to Q218 FILTER: CHECK Q211
HAD SEXUAL INTERCOURSE WITH REGULAR PARTNER DURING PAST 12 MONTHS -------Continue with Q 219
DID NOT HAVE SEXUAL INTERCOURSE WITH REGULAR PARTNER DURING PAST 12 MONTHS. GO TO Q 227
If 0 Go to Q 227
Q219 Have you used condom with any of your REGULAR partners in the past 6 months?
Yes 1 No 2 Don’t know 88 No response 99
Q224
Q220 How frequently did you use condoms with your REGULAR sexual partners? CIRCLE ONLY ONE
Spouse RP. 1
RP. 2
RP 3
Every time 1 1 1 1 Almost every time
2 2 2 2
Sometimes 3 3 3 3 Never 4 4 4 4 Don’t know 88 88 88 88 No response 99 99 99 99
When was your last time to have sex with a regular partner?
Day…………………………. Months……………………………. Years………………………………..
Q221 Was a condom used the last time you had sexual intercourse with a REGULAR partner?
Yes 1 No 2 Don’t know 88 No response 99
Q222
What were the main reasons that you used a condom with any of your REGULAR sex partners in the past 6 months? CIRCLE ALL THAT APPLY
Spouse
RP. 1
RP. 2
RP. 3
To prevent pregnancy
1 1 1 1
For prevention of HIV
2 2 2 2
For prevention of STIs
3 3 3 3
Others …… Don’t know 88 88 88 88 No response 99 99 99 99
Q223 Who usually suggests the use of condoms with your REGULAR sexual partners? CIRCLE ONLY ONE
Myself 1 My partner 2 Joint decision 3 Don’t know 88 No response 99
Q224
If you did not use condoms every time you had sex with your REGULAR partners, what were the reasons that you did not use condoms? CIRCLE ALL ANSWERS
Spouse RP 1
PR 2
RP 3
Not available 1 1 1 1 Too expensive
2 2 2 2
Partner objected
3 3 3 3
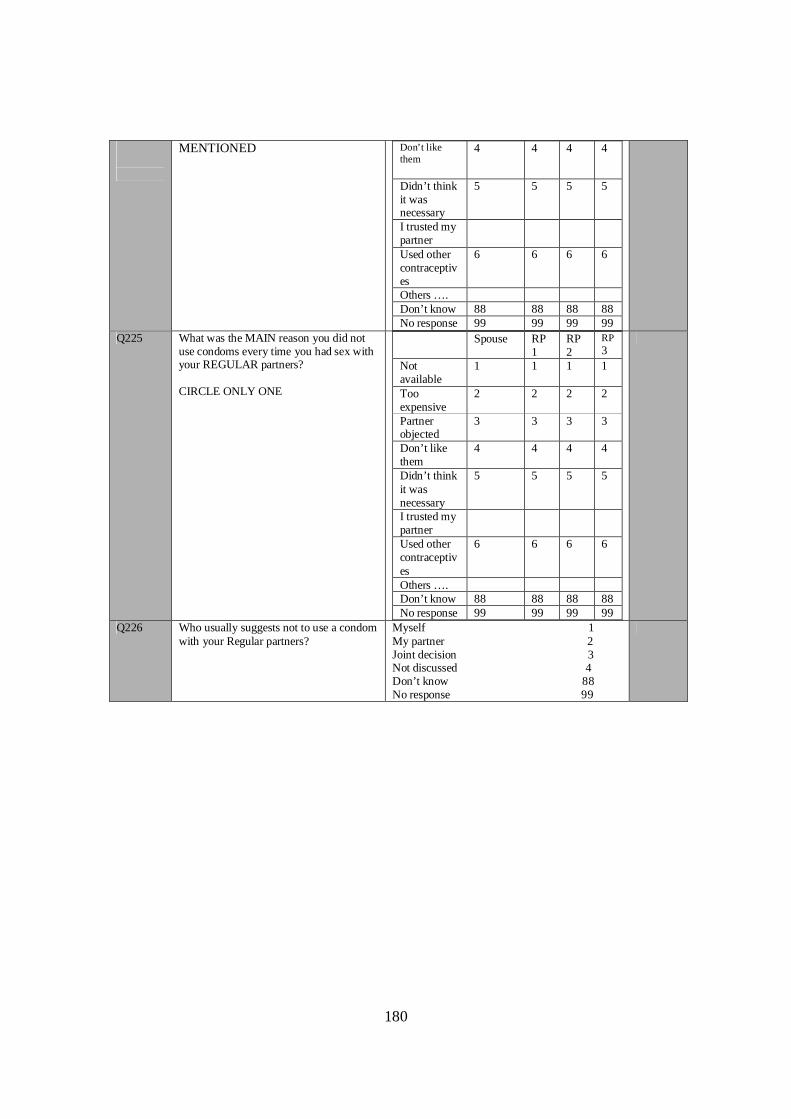
180
MENTIONED
Don’t like them
4 4 4 4
Didn’t think it was necessary
5 5 5 5
I trusted my partner
Used other contraceptives
6 6 6 6
Others …. Don’t know 88 88 88 88 No response 99 99 99 99
Q225 What was the MAIN reason you did not use condoms every time you had sex with your REGULAR partners? CIRCLE ONLY ONE
Spouse RP 1
RP 2
RP 3
Not available
1 1 1 1
Too expensive
2 2 2 2
Partner objected
3 3 3 3
Don’t like them
4 4 4 4
Didn’t think it was necessary
5 5 5 5
I trusted my partner
Used other contraceptives
6 6 6 6
Others …. Don’t know 88 88 88 88 No response 99 99 99 99
Q226 Who usually suggests not to use a condom with your Regular partners?
Myself 1 My partner 2 Joint decision 3 Not discussed 4 Don’t know 88 No response 99
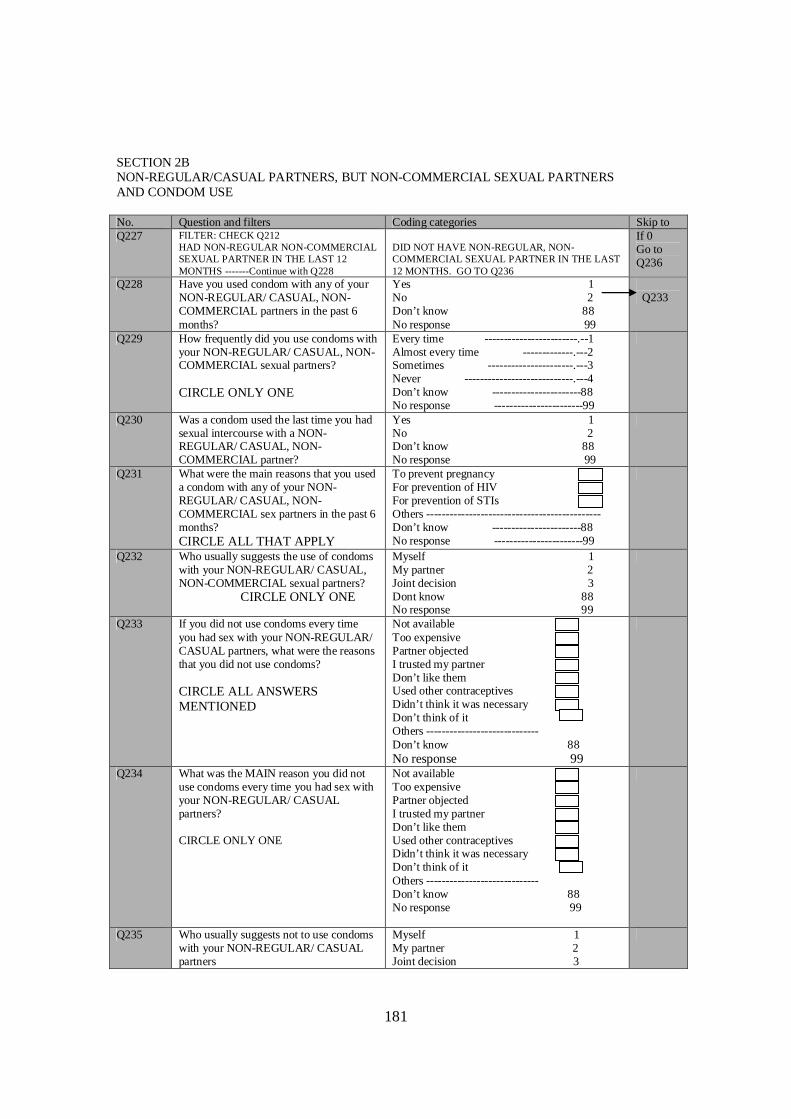
181
SECTION 2B NON-REGULAR/CASUAL PARTNERS, BUT NON-COMMERCIAL SEXUAL PARTNERS AND CONDOM USE No. Question and filters Coding categories Skip to Q227 FILTER: CHECK Q212
HAD NON-REGULAR NON-COMMERCIAL SEXUAL PARTNER IN THE LAST 12 MONTHS -------Continue with Q228
DID NOT HAVE NON-REGULAR, NON-COMMERCIAL SEXUAL PARTNER IN THE LAST 12 MONTHS. GO TO Q236
If 0 Go to Q236
Q228 Have you used condom with any of your NON-REGULAR/ CASUAL, NON-COMMERCIAL partners in the past 6 months?
Yes 1 No 2 Don’t know 88 No response 99
Q233
Q229 How frequently did you use condoms with your NON-REGULAR/ CASUAL, NON-COMMERCIAL sexual partners? CIRCLE ONLY ONE
Every time ------------------------.--1 Almost every time -------------.---2 Sometimes ----------------------.---3 Never ----------------------------.---4 Don’t know -----------------------88 No response -----------------------99
Q230 Was a condom used the last time you had sexual intercourse with a NON-REGULAR/ CASUAL, NON-COMMERCIAL partner?
Yes 1 No 2 Don’t know 88 No response 99
Q231 What were the main reasons that you used a condom with any of your NON-REGULAR/ CASUAL, NON-COMMERCIAL sex partners in the past 6 months? CIRCLE ALL THAT APPLY
To prevent pregnancy For prevention of HIV For prevention of STIs Others --------------------------------------------- Don’t know -----------------------88 No response -----------------------99
Q232 Who usually suggests the use of condoms with your NON-REGULAR/ CASUAL, NON-COMMERCIAL sexual partners? CIRCLE ONLY ONE
Myself 1 My partner 2 Joint decision 3 Dont know 88 No response 99
Q233 If you did not use condoms every time you had sex with your NON-REGULAR/ CASUAL partners, what were the reasons that you did not use condoms? CIRCLE ALL ANSWERS MENTIONED
Not available Too expensive Partner objected I trusted my partner Don’t like them Used other contraceptives Didn’t think it was necessary Don’t think of it Others ----------------------------- Don’t know 88 No response 99
Q234 What was the MAIN reason you did not use condoms every time you had sex with your NON-REGULAR/ CASUAL partners? CIRCLE ONLY ONE
Not available Too expensive Partner objected I trusted my partner Don’t like them Used other contraceptives Didn’t think it was necessary Don’t think of it Others ----------------------------- Don’t know 88 No response 99
Q235 Who usually suggests not to use condoms with your NON-REGULAR/ CASUAL partners
Myself 1 My partner 2 Joint decision 3
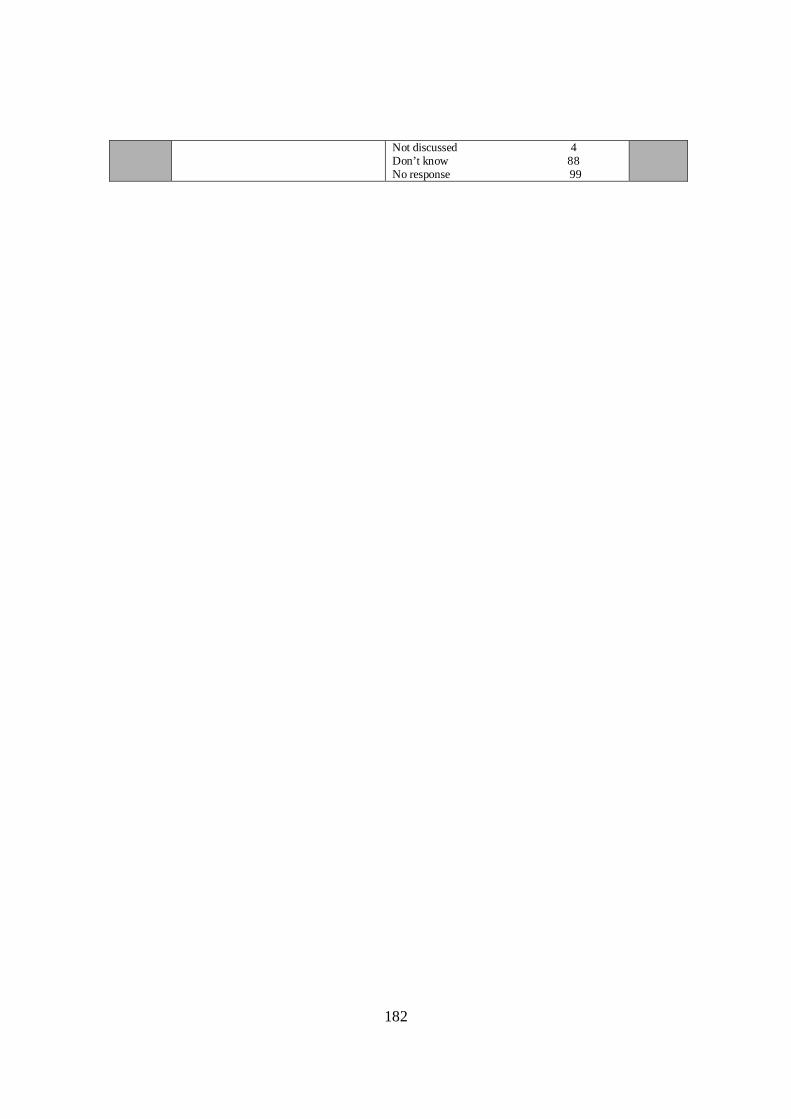
182
Not discussed 4 Don’t know 88 No response 99
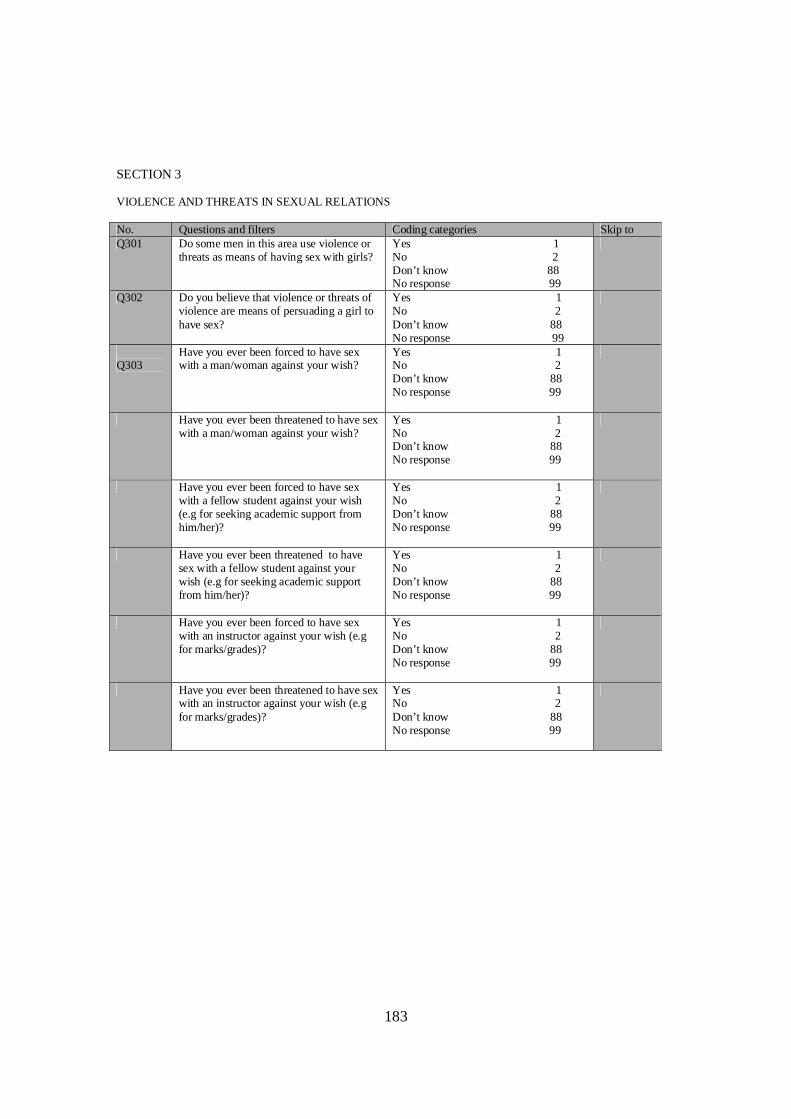
183
SECTION 3 VIOLENCE AND THREATS IN SEXUAL RELATIONS No. Questions and filters Coding categories Skip to Q301 Do some men in this area use violence or
threats as means of having sex with girls? Yes 1 No 2 Don’t know 88 No response 99
Q302 Do you believe that violence or threats of violence are means of persuading a girl to have sex?
Yes 1 No 2 Don’t know 88 No response 99
Q303
Have you ever been forced to have sex with a man/woman against your wish?
Yes 1 No 2 Don’t know 88 No response 99
Have you ever been threatened to have sex with a man/woman against your wish?
Yes 1 No 2 Don’t know 88 No response 99
Have you ever been forced to have sex with a fellow student against your wish (e.g for seeking academic support from him/her)?
Yes 1 No 2 Don’t know 88 No response 99
Have you ever been threatened to have sex with a fellow student against your wish (e.g for seeking academic support from him/her)?
Yes 1 No 2 Don’t know 88 No response 99
Have you ever been forced to have sex with an instructor against your wish (e.g for marks/grades)?
Yes 1 No 2 Don’t know 88 No response 99
Have you ever been threatened to have sex with an instructor against your wish (e.g for marks/grades)?
Yes 1 No 2 Don’t know 88 No response 99

184
SECTION 4 CONDOM USE No. Questions and filters Coding categories Skip to Q401 Are there circumstances in which a female
can insist on the use of condoms before having sex with a partner other than her husband?
Yes 1 No 2 Don’t know 88 No response 99
Q405
Q402 If Yes, which circumstances? Pregnancy prevention STIs/HIV prevention Other ……………………………
Q403 Are there circumstances in which a male can insist on the use of condoms before having sex with a woman other than his wife?
Yes 1 No 2 Don’t know 88 No response 99
Q405
Q404 If Yes, which circumstances? Pregnancy prevention STIs/HIV prevention Other ……………………………
Q405
Have you ever successfully refused to have sex without a condom?
Yes 1 No 2 I have never been in that situation 3 Don’t know 88 No response 99
Q406 What happened then? Had sex with condom 1 Had sex without condom 2 Did not have sex 3 Others ……………………….
Q407 Do you know of any place or person within this university or neighborhood from which you can obtain male condoms?
Yes 1 No 2 No response 99
Q409
Q408 Which places or persons within this university or neighborhood do you know you can obtain a male condom?
Shop Pharmacy Market Clinic Hospital Family Planning Center Bar/Guest house/Hotel Peer educator Friend Other ……………………….. Don’t know 88 No response 99
Q409 Have you ever heard of a female condom? Yes 1 No 2 Don’t know 88 No response 99
Q 501
Q410 Do you know of any place or person within this university or neighborhood from which you can obtain female condoms?
Yes 1 No 2 No response 99
Q 412
Q411 Which places or persons do you know within this university or neighborhood you can obtain a female condom?
Shop Pharmacy Market Clinic Hospital Family Planning Center Bar/Guest house/Hotel Peer educator

185
Friend Other ……………………….. Don’t know 88 No response 99
Q412 Have you ever had sex and used a female condom?
Yes 1 No 2 Don’t know 88 No response 99
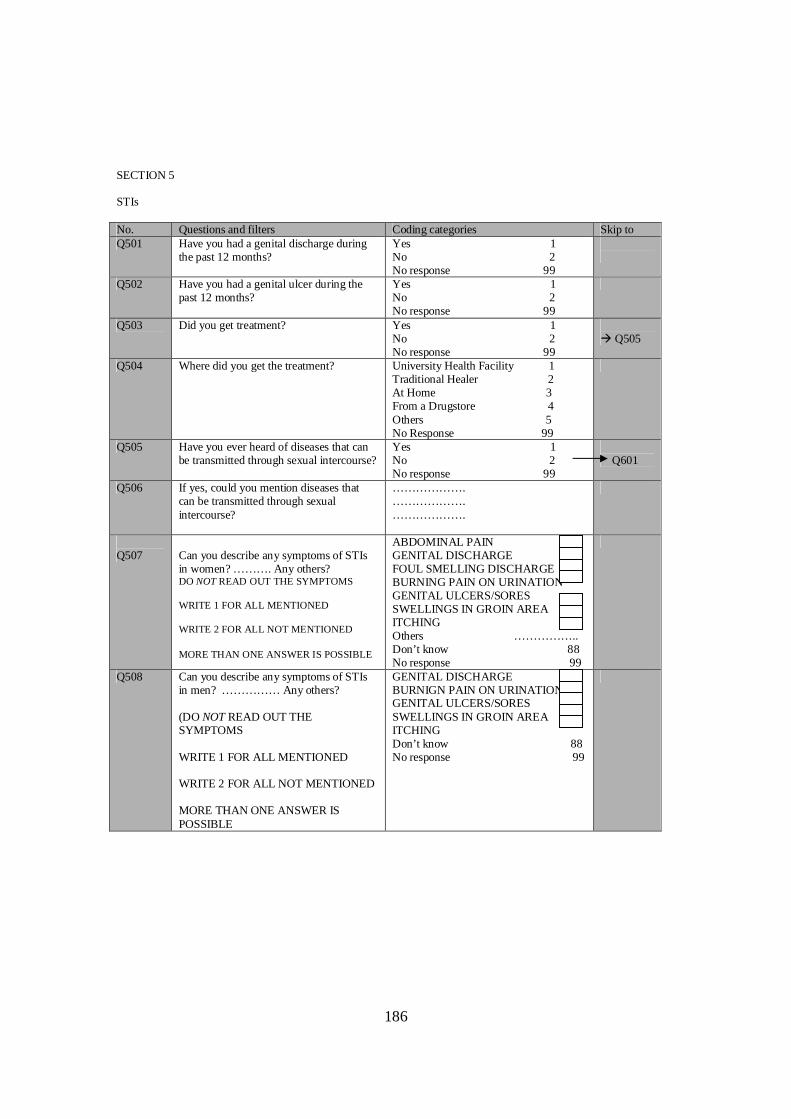
186
SECTION 5 STIs No. Questions and filters Coding categories Skip to Q501 Have you had a genital discharge during
the past 12 months? Yes 1 No 2 No response 99
Q502 Have you had a genital ulcer during the past 12 months?
Yes 1 No 2 No response 99
Q503 Did you get treatment? Yes 1 No 2 No response 99
Q505
Q504 Where did you get the treatment? University Health Facility 1 Traditional Healer 2 At Home 3 From a Drugstore 4 Others 5 No Response 99
Q505 Have you ever heard of diseases that can be transmitted through sexual intercourse?
Yes 1 No 2 No response 99
Q601
Q506 If yes, could you mention diseases that can be transmitted through sexual intercourse?
………………. ………………. ……………….
Q507
Can you describe any symptoms of STIs in women? ………. Any others? DO NOT READ OUT THE SYMPTOMS WRITE 1 FOR ALL MENTIONED WRITE 2 FOR ALL NOT MENTIONED MORE THAN ONE ANSWER IS POSSIBLE
ABDOMINAL PAIN GENITAL DISCHARGE FOUL SMELLING DISCHARGE BURNING PAIN ON URINATION GENITAL ULCERS/SORES SWELLINGS IN GROIN AREA ITCHING Others …………….. Don’t know 88 No response 99
Q508 Can you describe any symptoms of STIs in men? …………… Any others? (DO NOT READ OUT THE SYMPTOMS WRITE 1 FOR ALL MENTIONED WRITE 2 FOR ALL NOT MENTIONED MORE THAN ONE ANSWER IS POSSIBLE
GENITAL DISCHARGE BURNIGN PAIN ON URINATION GENITAL ULCERS/SORES SWELLINGS IN GROIN AREA ITCHING Don’t know 88 No response 99

187
SECTION 6: KNOWLEDGE AND PREVENTION OF HIV/AIDS No. Questions and filters Coding categories Skip to Q601 Have you ever heard of any initiatives
here at the university that are related to controlling HIV and AIDS?
Yes 1 No 2 Don’t know 88 No response 99
Q701
Q602 When did you hear about HIV and AIDS here at the university? TICK ALL THAT APPLY
Newspapers Radio Friends Health facility TV Health campaigns family university Books Peer education at the university Peer education out at the university ol Youth groups Youth Center Other ………. Don’t know 88 No response 99
Q603 Look around this university or neighbourhood: through which ways is HIV transmitted? TICK ALL THAT APPLY
Shaking hands with infected person Mosquito bites Sharing utensils with infected person Sharing toilets Sex without a condom Blood transfusion Having sex with more than one partner Others ………………………. Don’t know 88 No response 99
Q604 Look around this university or nroghbourhood: How can you tell that someone is infected with the HIV/AIDS? TICK ALL THAT APPLY
Physical appearance Illness condition Medical test You cannot tell Other ………… Don’t know 88 No response 99
Q605 Can you be infected by a healthy looking person?
Yes 1 No 2 Don’t know 88 No response 99
Q606 Do you think it is possible to prevent yourself from getting HIV/AIDS?
Yes 1 No 2 Don’t know 88 No response 99
Q607 Do you think it is possible for the university community to prevent its members (students, staff) from getting HIV/AIDS?
Yes 1 No 2 Don’t know 88 No response 99
Q608 What ways can be used to protect you from getting HIV/AIDS? TICK ALL THAT APPLY
Condom use Abstaining from sex Single faithful partner Other ….. Don’t know 88 No response 99

188
Q609 What ways can be used by the university community to protect members (students, staff) from getting HIV/AIDS? TICK ALL THAT APPLY
Condom use Abstaining from sex Single faithful partner Other ….. Don’t know 88 No response 99
Q610 Have you ever tested for HIV? Yes 1
No 2 Don’t know 88 No response 99
Q 612
Q611 If yes, why did you decide to test for HIV?
To know my status 1 Forced 2 Required for Marriage 3 Required for Job 4 Don’t know 88 No response 99
Q612 Did you go to collect the results of the test?
Yes 1 No 2 Don’t know 88 No response 99
Q613 Do you know where HIV test services are provided?
Yes 1 No 2 Don’t know 88 No response 99
Q614 Is there a HIV testing facility in this university/neighborhood?
Yes 1 No 2 Don’t know 88 No response 99
Q615 Would you like to test for HIV? Yes 1 No 2 Don’t know 88 No response 99
Q616 Apart from HIV testing, what other HIV and AIDS related services are available at this university?
Q617 What is your perception about the quality of these services?
Best Good Average Satisfactory Bad
Q618 What is your perception about the affordability of these services?
Best Good Average Satisfactory bad
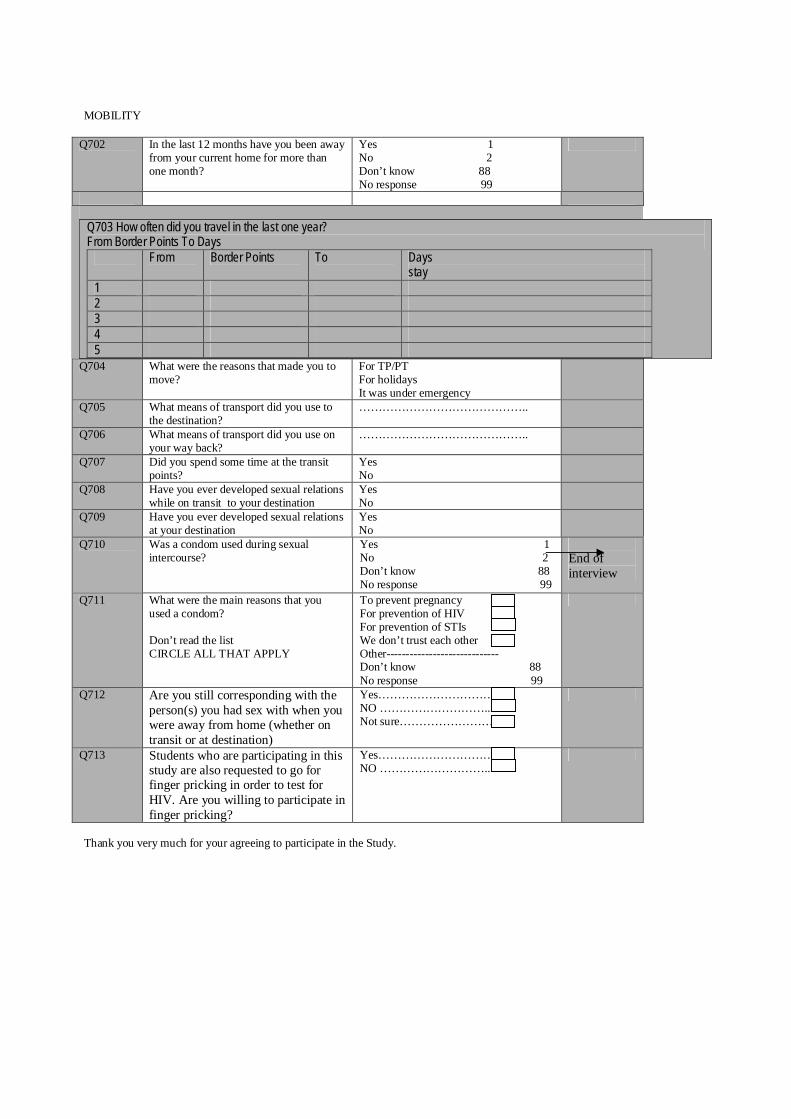
MOBILITY
Q702 In the last 12 months have you been away from your current home for more than one month?
Yes 1 No 2 Don’t know 88 No response 99
Q703 How often did you travel in the last one year? From Border Points To Days
From Border Points To Days stay
1 2 3 4 5
Q704 What were the reasons that made you to move?
For TP/PT For holidays It was under emergency
Q705 What means of transport did you use to the destination?
……………………………………..
Q706 What means of transport did you use on your way back?
……………………………………..
Q707 Did you spend some time at the transit points?
Yes No
Q708 Have you ever developed sexual relations while on transit to your destination
Yes No
Q709 Have you ever developed sexual relations at your destination
Yes No
Q710 Was a condom used during sexual intercourse?
Yes 1 No 2 Don’t know 88 No response 99
End of interview
Q711 What were the main reasons that you used a condom? Don’t read the list CIRCLE ALL THAT APPLY
To prevent pregnancy For prevention of HIV For prevention of STIs We don’t trust each other Other----------------------------- Don’t know 88 No response 99
Q712 Are you still corresponding with the person(s) you had sex with when you were away from home (whether on transit or at destination)
Yes………………………… NO ……………………….. Not sure…………………….
Q713 Students who are participating in this study are also requested to go for finger pricking in order to test for HIV. Are you willing to participate in finger pricking?
Yes………………………… NO ………………………..
Thank you very much for your agreeing to participate in the Study.

190
APPENDIX B Qualitative Tools KEY INFORMANT AND FOCUS GROUP QUESTION GUIDE
1. Diffusion of Information on HIV (a) What kind of information on HIV issues do you receive from the University? (b) Do you feel that you receive adequate information on HIV issues from the University? Give reasons for your
answer. (c) What kind of information do you think you should get on HIV issues from the University? (d) What are your main current sources of information on HIV issues? (e) Indicate the frequency of each source of information that you have mentioned (above)? (f) Indicate how useful is each source of information (g) What challenges are you facing in getting information on HIV issues in your University? How can these be
addressed? 2. Experience of available HIV services (a) Which HIV services should your University students /staff/ host community be provided with? Give reasons (b) Which HIV services are currently available at your University? (c) How do you assess the accessibility of each of the HIV service measured above under (b)? Give reasons for your
assessment (d) What is your assessment of the quality of each mentioned service? Give reasons for your assessment. (e) How do you assess the affordability of each mentioned service? Give reasons for your assessment. 3. Students network for HIV prevention
Source: Students and Staff
(a) What is the Registered name of your Association/Student- led Project (b) Members of the Associations/Project in number composition sex (c) What are the specific activities of association/project in relation to HIV and AIDS prevention (d) what have you done in the last year in HIV/AIDS prevention (e) How successful have you been (f) What have been the source of your funding (g) How is your network /project facilitated by the University? (h) How do you assess the contribution of your network/project towards influencing positive behavior change at the
University? Give reasons for your assessment. (i) What are the weaknesses and challenges facing your networks /project on HIV issues? What needs to be done to
address them? (j) Which opportunities are there for greater promotion of student networks /projects for HIV prevation at the
University? 4. Availability of policy framework for HIV control Source : Administration (a) Are you aware on the national Policy on HIV and AIDS? (b) What does it stipulate with regard to public, private institution on HIV and AIDS? (c) Is there an explicity University policy on HIV /AIDS? Can we get a copy? (d) Which other University policies have direct bearing on the management of HIV/AIDS issues in the University? (e) What are the priority thrusts in the University HIV/ AIDS policy with regard to HIV control and prevention? (f) How is your University-wide HIV/AIDS policy
o with regard to staff o with regard to students o with regard to curricular/programmes o with regard to research o with regard to consultancy
(g) How are the University policies on HIV/AIDS related to the national HIV/AIDS policies? (h) Explain how the University is implementing its HIV/AIDS policy. Also how does the University implement the
National HIV/AIDS policy?
191
(i) What challenges is the University facing in implementing its HIV/AIDS policy? The National HIV/AIDS Policy? (j) If you do not have a University HIV/AIDS policy, what is the University direction and position 5. Involvement of Administrators Source: Administrators, Religious leaders Lecturers and student leaders
1. What do you normally do with regard to behavioral change in pursuance of HIV and AIDS control
and prevention 2. What is your role in as far as the prevention and control of HIV at the University is concerned
- community for Religious leaders - fellow students (student leaders)
3. Please describe the KEY activities caries out in the last one year with regard to HIV /AIDS control - University: - leaders
- Community: - Religious leaders Students community: - students leaders
6. HIV and MIS Source: Coordinators of HIV (a) Is there a monitoring and evaluation system for HIV /AIDS activities at the University? Reasons for your answers? (b) If there is an M&E system:
Which indicators are used? How is the data collection done? Is there a computerized database being maintained for HIV/AIDS activities? Which reports are generated by the M&E system or database? How are reports disseminated and used for decision making and other purposes? How are the M&E activities funded?
7. HIV /AIDS Mainstreaming into curriculating Source: Directors of Undergraduate and Postgraduate Programmes (a) Is HIV /AIDS mainstreaming into curricula a University policy? (b) How is HIV /AIDS mainstreaming into curricula currently undertaken? (c) To what extent would you say that the curricula at the University has mainstreamed HIV/AIDS? Give reasons for
your answer (d) What are challenges faced in mainstreaming into the curricula? And what are the opportunities? 8. HIV prevention and support activities and services Source: Administrators, Head of Hostels (a) Does the University have a comprehensive Strategic Action Plan or programme for HIV/AIDS? If yes, how is it
being implemented? Please provide a copy of the plan or programme) (b) Please list down the HIV and AIDS preventive services available at your University HIV
Unit/Centre/Hostel/Hotel/Guest (condom, leaflets, posters, warnings in public places messages etc) (c) What are the specific services offered by your institution?
How do you promote these? Probe for availability, accessibility and affordability of these services (d) How do you assess the effectiveness of the HIV prevention activities being implemented? Reasons for your
assessment?
Source: Coordinators of HIV
(e) How do you work with the MoH activities related to HIV (f) Are you a member of national/local organs/institutions dealing with HIV and AIDS?
192
(g) Which HIV/AIDS services are needed by students, staff and host community of the University? Which of these are actually available?
(h) How do you assess the availability of HIV /AIDS services for students, staff and host community at the University? (i) How do you assess the following services in terms of availability, quality and affordability?
1. VCT 2. HCT 3. ARV 4. PMTCT 5. PEP 6. Condom distribution
Source: Student leaders, Peer Educations (a) To what extend do you offer support of students victims of HIV and AIDS? (b) What specific services do you provide to fellow students? Source: Students (a) How do rate the effectiveness of (a)Prevention services (b)Care services (and) (c)Support activities at the University (b) On the overall are you satisfied with the services on HIV prevention, care and support at the University? (c) What do you think needs to be done to maintain or improve the level of services offered so far 9. Financing of HIV RELATED SERVICES. Source: DVC PFA, Bursar and Coordinator for HIV (a) What is the University policy for financing HIV related services ? What are its strengths and weaknesses? (b) What are the University sources for financing HIV/AIDS activities? How is each source mobilized? What are the
opportunities and challenges of each sources? (c) What is the amount of budget allocated for HIV services over the past three years 2007 2006 2005 HIV Budget Total Budget Local Donors 10.
Related Documents