N ever has there been a more critical time to ensure a healthy future for our children. In the past 20 years, obesity in U.S. children has doubled, putting a growing number of kids at risk for a lifetime of health problems. If we do nothing, the repercus- sions will be staggering. The statistics inside, from the Texas Department of Health’s in-depth study “The Burden of Overweight and Obesity in Texas, 2000-2040,” tell the story. A Battle We Can’t Afford toLose Decisive action is needed to control this epidemic of overweight and obesity. The Burden of Overweight and Obesity in Texas: The Costs in Dollars and Lives

Welcome message from author
This document is posted to help you gain knowledge. Please leave a comment to let me know what you think about it! Share it to your friends and learn new things together.
Transcript

In accordance with Federal law and U.S. Department of Agriculture policy, this institution is prohibited from discriminating on the basis of race, color, national origin, sex, age, or disability. To file a com-
plaint of discrimination, write USDA, Director, Office of Civil Rights, Room 326-W, Whitten Building, 1400 Independence Avenue, SW, Washington, D.C. 20250-9410 or call (202) 720-5964 (voice and
TDD). USDA is an equal opportunity provider and employer. TDA M(N) 599 07/04
Texas Department of Agriculture, Food and Nutrition DivisionP.O. Box 12847, Austin, Texas 78711
(888) TEX-KIDS • [email protected]
Texas Department of Agriculture • Susan Combs, Commissioner
For more information contact:
Texas Department of Health, Office of Executive Support, 1100 W. 49th St., Austin, Texas 78957
(512) 458-7111 • [email protected]
Never has there been a more
critical time to ensure a
healthy future for our children.
In the past 20 years, obesity in U.S. children
has doubled, putting a growing number
of kids at risk for a lifetime of health
problems. If we do nothing, the repercus-
sions will be staggering. The statistics
inside, from the Texas Department of
Health’s in-depth study “The Burden
of Overweight and Obesity in
Texas, 2000-2040,” tell the story.
ABattle WeCan’t
Afford toLose
Decisive actionis needed to control this epidemic ofoverweight and obesity.
The Burden of Overweightand Obesity in Texas:
The Costs in Dollars and Lives
For the first time in American history,
this generation of children may have a
shorter lifespan than their parents.
Cost Study Information: For more information about the study “The Burden of Overweight and Obesity in Texas, 2000-2040,” contact the Office of Executive
Support, Texas Department of Health at (512) 458-7111 ext 6517 or 6566 or via e-mail at [email protected] or [email protected].
EVERY ACTION MAKES A DIFFERENCE. Even small steps can lead to big changes. Get started by calling the Texas Department
of Agriculture at (888) TEX-KIDS to request a family action packet. You can also visit www.squaremeals.org for tips on every-
thing from easy ways to change your family’s eating habits to fun ideas for adding more physical activity into your family’s day.
The alarm has been sounded. We must take steps to prevent the spread of
overweight and obesity in Texas.” Doctor Eduardo J. Sanchez, Texas Commissioner of Health
“
Document5 7/14/04 5:00 PM Page 1
Early intervention is critical. That’s why
Texas is taking a lead role in redefining
the school nutrition environment, which
can provide as much as 60 percent of a
child’s daily meals. With groundbreaking
and nationally recognized school nutrition
policies and an unprecedented focus on
promoting healthy, nutritious food,
the Texas Department of Agriculture’s
Square Meals program works with school
administrators, foodservice professionals,
teachers, parents and schoolchildren to
help turn the tide.
For details, go to www.squaremeals.org
or call (888) TEX-KIDS for information
on getting involved.
To keep Texas strong, we musttake action to reverse our healthcrisis and eliminate the staggeringstatistics for our future. Together,we must begin to develop a newstrategy to set a healthier course.The cost is already too high. Texascan’t afford to look the other way.”
“
Our Future
The Costof Overweightand Obesity
Growing at an
Incredible Rate
$39Billion
by2040
If population
figures continue
to climb at the
current rate.
$10.5Billionin 2001
Our Current Health Crisis
In the period of just 10 years —from 1991 to
2001 — the percentage of overweight and
obese adult Texans rose by almost one-third,
from 46 percent of the population to more
than 60 percent. Even more troubling, obesity
rates alone nearly doubled, from 13 percent of
the population to almost 25 percent — a full
quarter of all adult Texans. Increased risks for
heart disease, stroke, diabetes, arthritis and
cancer are just some of the problems over-
weight and obese adult Texans face. More than
300,000 deaths each year are attributed to
overweight and obesity in the United States.
$10.5 Billion and Counting
In total, overweight- and obesity-associated costs
for Texas adults were estimated at $10.5 billion
during 2001. This included $4.2 billion in direct
health care costs and $6.3 billion in indirect
costs. Indirect costs included the value of lost
productivity such as wages and household work
due to illness, disability and premature death.
A Growing Trend
At our current pace, it is estimated
that by the year 2040 the number of over-
weight Texas adults will increase by 94 percent
and the number of obese adults will increase
by 174 percent. By these estimates, nearly
75 percent of Texas adults will be overweight
or obese in 2040 — about 20 million people.
Tomorrow’s Cost in Dollars
Combining the 2001 direct and indirect costs with
the projected rise in overweight and obesity num-
bers over the next four decades, it is estimated
that overweight and obesity could cost Texans
$26 billion by the year 2040. If population fig-
ures continue to climb at the rate seen during
1990-2000, that estimate could rise as high as
$39 billion in direct and indirect costs.
Tomorrow’s Cost in Lives
Life expectancy is estimated at 3 to 20 years
shorter for overweight and obese Texans. But
it’s not just adults we need to worry about:
obese children have a 50 percent chance of
becoming obese adults. Obese adolescents face
an even graver statistic, with a 70 percent to 80
percent chance of remaining obese as adults.
To stop this cycle, we can look at the numbers
and act now to improve the health of all Texans.
According to recent statistics, about 35 percent
of Texas school-age children are currently over-
weight or obese. For the first time in American
history, this generation of children may have a
shorter lifespan than their parents.
199146% 2001
60% 2040
75%
Susan Combs, Texas Agriculture Commissioner
Document5 7/14/04 5:00 PM Page 2

In accordance with Federal law and U.S. Department of Agriculture policy, this institution is prohibited from discriminating on the basis of race, color, national origin, sex, age, or disability. To file a com-
plaint of discrimination, write USDA, Director, Office of Civil Rights, Room 326-W, Whitten Building, 1400 Independence Avenue, SW, Washington, D.C. 20250-9410 or call (202) 720-5964 (voice and
TDD). USDA is an equal opportunity provider and employer. TDA M(N) 599 07/04
Texas Department of Agriculture, Food and Nutrition DivisionP.O. Box 12847, Austin, Texas 78711
(888) TEX-KIDS • [email protected]
Texas Department of Agriculture • Susan Combs, Commissioner
For more information contact:
Texas Department of Health, Office of Executive Support, 1100 W. 49th St., Austin, Texas 78957
(512) 458-7111 • [email protected]
Never has there been a more
critical time to ensure a
healthy future for our children.
In the past 20 years, obesity in U.S. children
has doubled, putting a growing number
of kids at risk for a lifetime of health
problems. If we do nothing, the repercus-
sions will be staggering. The statistics
inside, from the Texas Department of
Health’s in-depth study “The Burden
of Overweight and Obesity in
Texas, 2000-2040,” tell the story.
ABattle WeCan’t
Afford toLose
Decisive actionis needed to control this epidemic ofoverweight and obesity.
The Burden of Overweightand Obesity in Texas:
The Costs in Dollars and Lives
For the first time in American history,
this generation of children may have a
shorter lifespan than their parents.
Cost Study Information: For more information about the study “The Burden of Overweight and Obesity in Texas, 2000-2040,” contact the Office of Executive
Support, Texas Department of Health at (512) 458-7111 ext 6517 or 6566 or via e-mail at [email protected] or [email protected].
EVERY ACTION MAKES A DIFFERENCE. Even small steps can lead to big changes. Get started by calling the Texas Department
of Agriculture at (888) TEX-KIDS to request a family action packet. You can also visit www.squaremeals.org for tips on every-
thing from easy ways to change your family’s eating habits to fun ideas for adding more physical activity into your family’s day.
The alarm has been sounded. We must take steps to prevent the spread of
overweight and obesity in Texas.” Doctor Eduardo J. Sanchez, Texas Commissioner of Health
“
Document5 7/14/04 5:00 PM Page 1
5
Introduction | The Burden of Overweight & Obesity in Texas: A study by the Texas Department of Health
INTRODUCTION
Between 1991 and 2001, the prevalence of obesityamong Texas adults rose from 13% to almost 25%.1
This increase is a cause for great concern because of the health risks associated with overweight and obesity. Overweight and obesity are associated withincreased risks for several diseases including coronaryheart disease, ischemic stroke, congestive heart failure, hypertension, hypercholesterolemia, type 2diabetes mellitus, osteoarthritis, gallbladder disease,asthma, sleep apnea and cancers of the cervix, colon,endometrium, gallbladder, kidney, ovary, and post-menopausal breast.2-5 In addition, life expectancydecreases with increasing degrees of obesity withestimates ranging from 3 to 20 years of life lost,depending on age, gender, race and smoking status.6-8
More than 300,000 deaths each year in the UnitedStates might be attributable to overweight and obesity.7
The economic consequences of the rising prevalenceof overweight and obesity include increased costs forhealth care, and lost wages and productivity due tomorbidity and premature mortality associated withexcess body weight. There are several published estimates of the direct healthcare costs of overweightand obesity for the United States, but few studies provide estimates of the indirect costs associated withoverweight and obesity.9-12 Although state-specificestimates can be derived from these national studies,variations in the population structure and the preva-lence of overweight and obesity might reduce the reliability of state-specific estimates based on nationaldata. A recent study estimated that direct healthcarecosts for obesity alone in Texas totaled $5.3 billion in2003 dollars, based on national medical expendituredata.13
This report provides:
1 Estimates of the direct and indirect costs to soci-ety of overweight and obesity among adults for
the state of Texas during 2001, based primarilyon state-specific data;
2 the projected number of normal weight, over-weight, and obese adults in Texas for the years2000 through 2040; and
3 the projected annual costs of overweight and obe-sity among Texas adults through the year 2040based on the 2001 cost estimates and the popula-tion projections.
DATA SOURCES
This report is based on several data sources:
TEXAS BEHAVIORAL RISK FACTOR SURVEILLANCE SYSTEM (BRFSS)The Texas BRFSS is an ongoing telephone survey ofstate residents’ health conditions and behaviors coor-dinated by the Centers for Disease Control andPrevention.14 The survey began in Texas during 1987.During 2001, there were 5,916 respondents, and theoverall response rate was 40%. Data from the 2001Texas BRFSS were used to estimate the prevalence ofoverweight and obesity based on respondents’ self-reported height and weight. Combined data from the1999-2002 Texas BRFS were used to establish age,sex, and race/ethnicity-specific overweight and obesi-ty baseline prevalence for the population projections.
TEXAS HOSPITAL INPATIENT DISCHARGE DATAThe Texas Health Care Information Council collectsdata on discharges from more than 400 Texas hospi-tals; a public-use data file without patient identities isavailable.15 Each patient-level record includes demo-graphic and geographic data, diagnoses, procedures,sources of payment, and total charges. Hospital dis-charge data for the year 2001 were used in this study
THE BURDEN OF OVERWEIGHT AND OBESITY IN TEXAS, 2000-2040

6
Introduction | The Burden of Overweight & Obesity in Texas: A study by the Texas Department of Health
to determine the number of overweight- and obesity-related hospital discharges.
TEXAS PERSONAL HEALTHCARE EXPENDITURESThe Centers for Medicare and Medicaid Services(CMS) release state-level estimates for personalhealthcare expenditures.16 The most recent state-spe-cific data available were for the year 1998. The 1998data for Texas were used in this study and adjusted forchanges in price with the national consumer priceindex for medical care to estimate healthcare expen-ditures during 2001.17
NATIONAL HEALTH INTERVIEW SURVEY (NHIS)The National Center for Health Statistics administersthe NHIS each year to a probability sample of approx-imately 43,000 civilian, non-institutionalized house-holds in the United States.18 The survey collects dataon topics including demographics, socioeconomic sta-tus, health status, and use of healthcare services. Thisstudy used data from the 2001 NHIS to estimate theaverage number of lost work days among employedpersons and bed disability days among unemployedpersons.
MEDICAL EXPENDITURE PANEL SURVEY(MEPS) The Agency for Healthcare Research and Quality con-ducts the MEPS to collect data about health careexpenses and utilization.19 Ongoing since 1996, theMEPS comprises four survey components: house-hold, nursing home, medical provider and insurance.This study used data from the 1998 MEPS householdcomponent to estimate the fraction of total healthcarecosts expended for adults aged 18 and older. Thehousehold component is a panel survey that collectsdata from a nationally representative subset of house-holds that participated in the NHIS during the previ-ous year. The MEPSnet software program is availableon-line and allows access to data from the householdand insurance component surveys.20
CURRENT POPULATION SURVEY (CPS)The U.S. Bureau of Census conducts the CPS for theBureau of Labor Statistics. The CPS collects dataabout the U.S. civilian, noninstitutionalized laborforce each month from a probability sample of 60,000households; periodic supplements that collect addi-tional data are also conducted.21 This study used ageand gender-specific mean income data from the 2001annual demographic supplement to the CPS to esti-mate the dollar value of lost workdays and of bed-dis-ability days.
TEXAS MORTALITY DATAThe Bureau of Vital Statistics at the Texas Departmentof Health collects and reports mortality data for thestate. This study used the 2001 Annual Vital StatisticsReport to obtain the number of deaths among adultsby sex and by age group, as well as age-specific lifeexpectancies for Texas residents.22

7
Part 1: Costs of Obesity | The Burden of Overweight & Obesity in Texas: A study by the Texas Department of Health
METHODS
This study used a cost-of-illness approach to calculateprevalence-based estimates of the direct and indirecteconomic costs of overweight and obesity.23 Directcosts considered in this study included costs of per-sonal healthcare expenditures for hospital care,healthcare providers, medications, home health care,nursing home care, and other personal health care.24
No attempt was made to estimate direct costs for non-medical expenses such as transportation to and fromhealthcare facilities, personal care provided by familymembers or costs for weight loss programs and aids.For indirect costs, this study used human-capitalmethods developed by Rice and others to estimate thevalue of lost wages and household work due to over-weight and obesity-attributable morbidity and prema-ture mortality.23 No attempt was made to estimateindirect costs for reduced quality of life attributable tooverweight and obesity.25
Prevalence of overweight and obesity
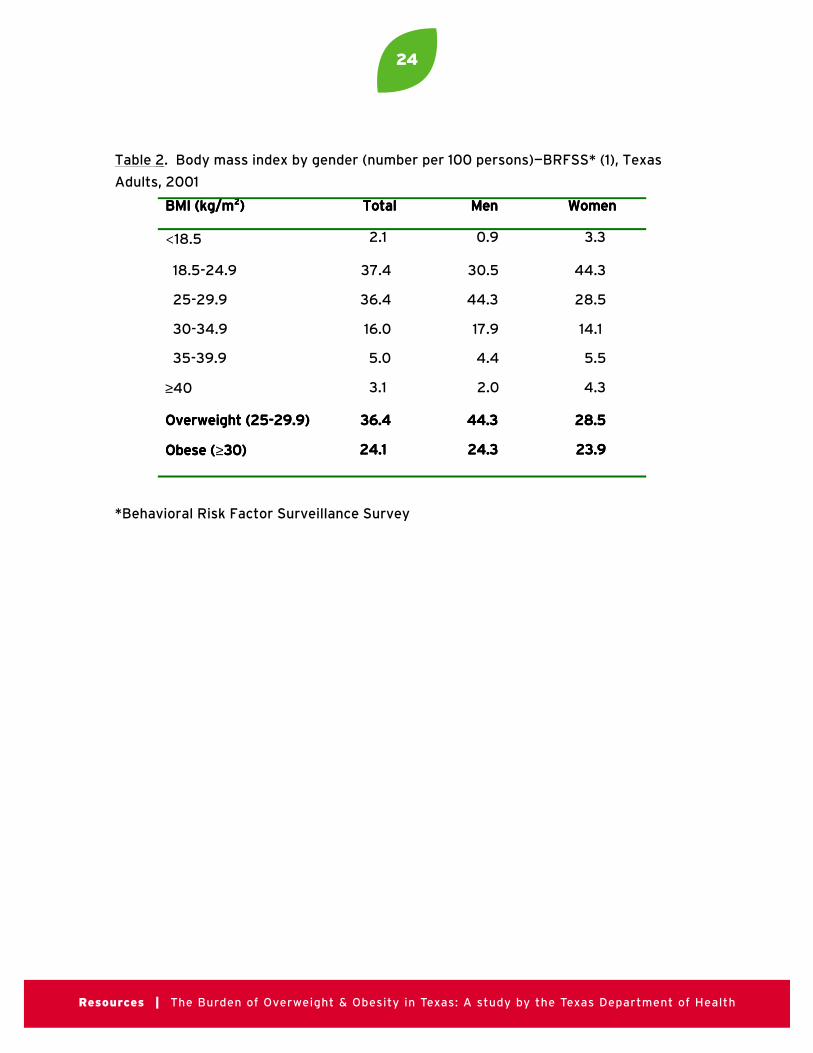
This study estimated the prevalence of overweightand obesity based on data from the 2001 TexasBRFSS.1 Body mass index (BMI, weight in kilogramsdivided by height in meters squared) was calculatedfrom respondents’ self-reported height and weight.Based on guidelines from the National Institutes ofHealth, individuals were classified as overweight ifthey had a BMI between 25.0 and 29.9 kg/m2, andobese if they had a BMI of 30 kg/m2 or greater.3
Population Attributable Fractions
Population attributable fractions were calculated formorbidity from diseases and lost productivity daysrelated to overweight and obesity and all-cause mor-tality associated with increasing body-mass index(BMI). The population attributable fraction equation
used in the study is p*((RR-1)/RR), where p is theprevalence of the risk factor in the population and RRis the risk ratio for the probability of disease in per-sons with and without the risk factor. This version ofthe attributable fraction equation produces reliableestimates when adjusted relative risks are used toaccount for confounding.26 For each factor consideredin the study, an attributable fraction was calculatedfor each BMI category used to define risks, and thecategory-specific estimates were added together toproduce overall attributable fractions for overweightand for obesity.
Direct Healthcare Costs
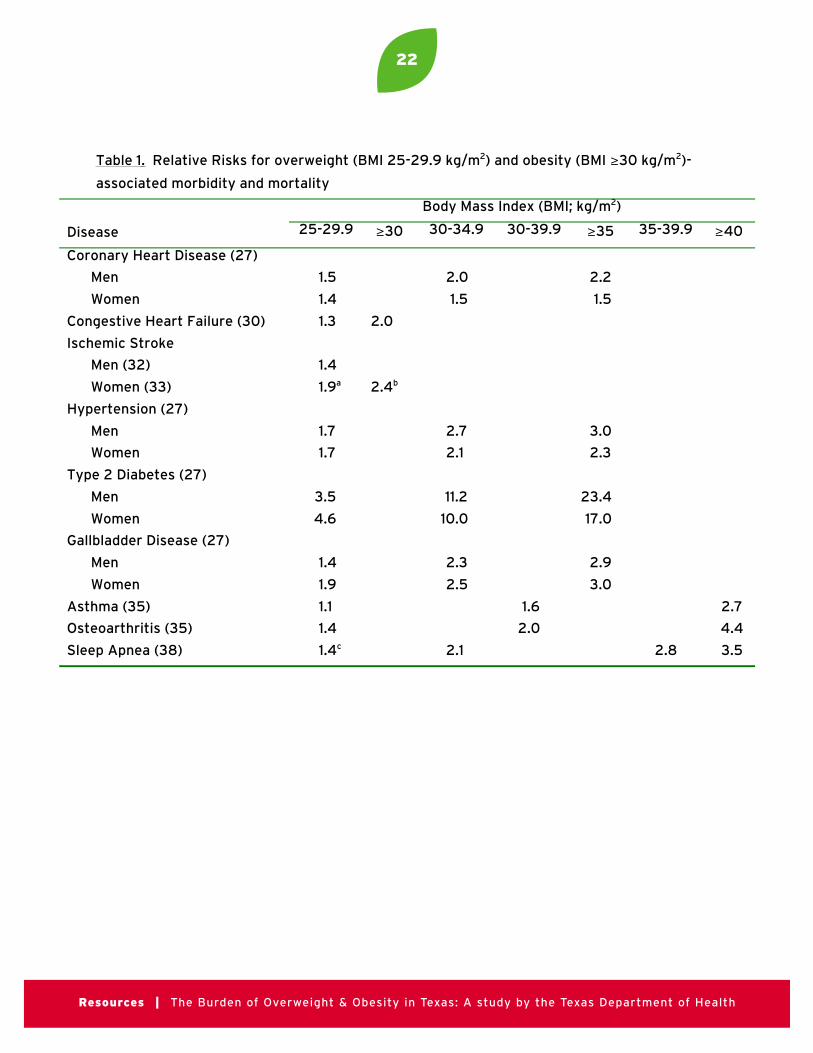
Direct healthcare costs were based on estimates ofdisease risks associated with excess body weightobtained from published epidemiologic studies of theU.S. population or of large, U.S.-based cohorts. Basedon consistent, statistically significant associationsreported in these studies, overweight and obesity-attributable fractions were calculated for the followingconditions: coronary heart disease, congestive heartfailure, ischemic stroke, hypertension, type 2 diabetesmellitus, gallbladder disease (other than cancer),asthma, osteoarthritis, sleep apnea, colon cancer, kid-ney cancer, gallbladder cancer, cervical cancer,endometrial cancer, ovarian cancer, and post-menopausal breast cancer.4, 5, 27-46 The relative risksused in this report are shown in Table 1.
Hospital inpatient discharge data for 2001 wereobtained from the Texas Health Care InformationCouncil public-use data file.15 The number of hospitaldischarges among adults aged 18 and older was deter-mined for each principal International Classificationof Disease, Clinical Modification (ICD9-CM) diagno-sis code for an obesity-associated condition.47 see Appendix
The number of hospital discharges for each primarydiagnosis was multiplied by the calculated overweight
PART ONE: COSTS OF OVERWEIGHT AND OBESITY IN TEXAS, 2001
8
Part 1: Costs of Obesity | The Burden of Overweight & Obesity in Texas: A study by the Texas Department of Health
and obesity-attributable fractions for that condition.Next, the number of adult hospital discharges attrib-utable to overweight and obesity were added togetherand these totals were divided by the number of rou-tine hospital discharges among adults aged 18 andolder (excluding discharges related to pregnancy andexternal causes of injury) to produce estimates of theproportion of healthcare costs attributable to over-weight and obesity.
In addition, the median cost per discharge for eachoverweight- and obesity-associated diagnosis was cal-culated, and the attributable fraction for each condi-tion was applied to determine the attributable costs.The total of the overweight- and obesity-associatedattributable costs was divided by the costs for all adulthospital discharges (except pregnancy-related diag-noses) to produce a second set of estimates of the pro-portion of healthcare costs attributable to overweightand obesity.
Personal healthcare expenditures for Texas wereobtained from estimates compiled by the CMS.16 Thisstudy considered the following categories of health-care expenditures to be related to overweight and obesity: hospital care, healthcare provider services(outpatient care), prescription drugs and other non-durable medical products, home health care, nursinghome care, and other personal health care expendi-tures. This study excluded expenditures for dentalcare and durable medical equipment/vision productsfrom the estimates.
To estimate the fraction of total healthcare costsexpended for adults aged 18 and older, data from the1998 MEPS household component were accessedthrough the MEPSnet software program.20 For eachhealthcare expenditure category, the healthcare costsfor persons aged 18 and older were divided by thecosts for persons of all ages. These fractions wereapplied to the personal healthcare expenditures inTexas during 2001 to estimate personal healthcareexpenditures among adults for each of the five expen-
diture categories. Finally, the expenditures in eachcategory were multiplied by the overweight and obesi-ty-attributable healthcare fractions.
Indirect Costs for Lost Productivity Due to Morbidity
Estimates of indirect costs for lost productivity (e.g.,wages and the value of household work) due to mor-bidity were based on methods described by Rice et al.23
Data from the 2001 NHIS were used to determine theaverage number of lost workdays per year among cur-rently employed men and women, and the number ofbed-disability days among men and women who werenot currently employed, controlling for age and smok-ing status.18 The ratio of lost days for overweight,obese and extremely obese (BMI ≥ 35 kg/m2) personscompared with persons of normal weight were calcu-lated. Population attributable fractions for eachweight category were calculated for men and womenbased on these ratios and the prevalence of over-weight and obesity among Texas adults during 2001.
To estimate the dollar value of lost workdays and ofbed-disability days, this study used age and gender-specific mean income data from the 2001 annualdemographic supplement to the CPS, 2001 labor par-ticipation rates for Texas as reported by the U.S.Bureau of Labor statistics, and published values forhousehold work.17, 21, 24 The total number of lost work-days was estimated by multiplying the average num-ber of lost workdays among men and women by thenumber of adults in Texas and the labor force partici-pation rate. For the total number of bed-disabilitydays, the average number of bed-disability daysamong men and women was multiplied by the num-ber of adults in Texas and one minus the labor forceparticipation rate. For employed men and women, theage-specific value of a lost workday was calculated byadding the average annual pay divided by 250 (e.g.,the typical number of days spent at work during oneyear) plus the value of mean annual household workdivided by 365. For unemployed men and women, thevalue of a lost day of productivity equaled the age-
9
Part 1: Costs of Obesity | The Burden of Overweight & Obesity in Texas: A study by the Texas Department of Health
specific value of mean annual household work dividedby 365. The total value of lost workdays and bed-disability days was calculated by multiplying the totalnumber of lost days by the value of an average day ofincome and/or household work. The age- and gender-specific values were added together to determine thetotal value of lost workdays and of bed-disability days,and these totals were multiplied by the overweight-and obesity-attributable fractions to estimate the costof lost productivity attributable to overweight- andobesity-related morbidity.
Indirect Costs for Lost Productivity Due to Mortality
For mortality, this study used age -and sex-adjustedrelative risks for all-cause mortality among nonsmok-ers in increasing categories of BMI based on meas-ured height and weight.48 The data from the AlamedaCounty Health Study and the NHANES I EpidemiologicFollow-Up Study (EFS) were selected for use becausethese two cohort studies included both men andwomen, and also included a substantial proportion ofnon-white persons. Mortality data were obtainedfrom the Bureau of Vital Statistics at the TexasDepartment of Health.22 The number of adult deathswas multiplied by the overweight and obesity-attrib-utable fractions of mortality to determine how manydeaths were attributable to overweight and obesity.
This study used mean income data from the 2001annual demographic supplement to the CPS, andpublished estimates of the value of household work tocalculate estimates of the present value of future earn-ings for each of the following age groups: 18-24, 25-34, 35-44, 45-54, 55-64, 65-74, and 75 years andolder.23, 24, 49 Since the median income in Texas during2001 was 96.8% of the U.S. median income, meanincome values from the CPS were multiplied by0.968.50 To account for persons who were not in thework force, mean income values were multiplied bythe labor force participation rate for each age group.49
The adjusted annual mean income and the value ofhousehold work were added for each age group, andthese figures were multiplied by the probability of
survival to the middle of each age group.22 For the 75years and older age group, this study used the proba-bility of survival to age 80. The present value of futureearnings and household work was calculated for each age group based on the expected years of liferemaining.22 Finally, in each age group, the number ofdeaths was multiplied by the attributable fractions ofmortality and this product was multiplied by the pres-ent value of future earnings and household work.Estimates were prepared for discount rates from 0%to 6% to examine the impact of the discount rate onthe projected value of lost productivity.24, 51 The totalvalue of lost productivity due to overweight and obesity-attributable mortality was the sum of the agegroup-specific estimates.
Sensitivity Analysis
This study examined the impact of changing several ofthe assumptions on which these estimates were basedto determine which factors had the greatest effect onthe direct and indirect costs of overweight and obesi-ty. For direct costs, the prevalence of overweight andobesity among adults was varied by substituting BMIdata based on measured height and weight from the1999-2000 National Health and Nutrition ExaminationSurvey (NHANES).52 For indirect morbidity costs, theprevalence of overweight and obesity among adultswas varied by substituting BMI data based on meas-ured height and weight reported by the 1999-2000NHANES.52 This study also used the upper and lowerbounds of the estimated number of lost workdays andbed-disability days from the NHIS to examine the pre-cision of these estimates. For indirect mortality costs,estimates using age-and gender-adjusted relative risksfor all-cause mortality from the Alameda CountyHealth Study and the NHANES III EFS were com-pared with estimates using age- and gender- specificrelative risks relative risks for all-cause mortalityamong adults aged 30 years and older from theAmerican Cancer Society’s Cancer Prevention StudyII.48, 53 This study also examined the influence of thediscount rate for the present value of future earningson the indirect mortality cost estimates. Based on fed-eral guidelines for choosing discount rates, and the
10
Part 1: Costs of Obesity | The Burden of Overweight & Obesity in Texas: A study by the Texas Department of Health
long-term impact of premature mortality on lostfuture earnings, a 4% discount rate was selected as themost likely estimate of the value of lost earnings.51
Finally, the total costs of overweight and obesity werecalculated based on the highest, lowest and most likely(best) values for each of the direct and indirect costs.
RESULTS
During 2001, there were approximately 15,311,363adults aged 18 and older living in Texas, of whichabout 36% were overweight and 24% were obese(Table 2). A higher proportion of men were over-weight compared with women, but the prevalence ofobesity was the same among men and women. Morethan twice as many women had a BMI ≥ 40 kg/m2compared with men.
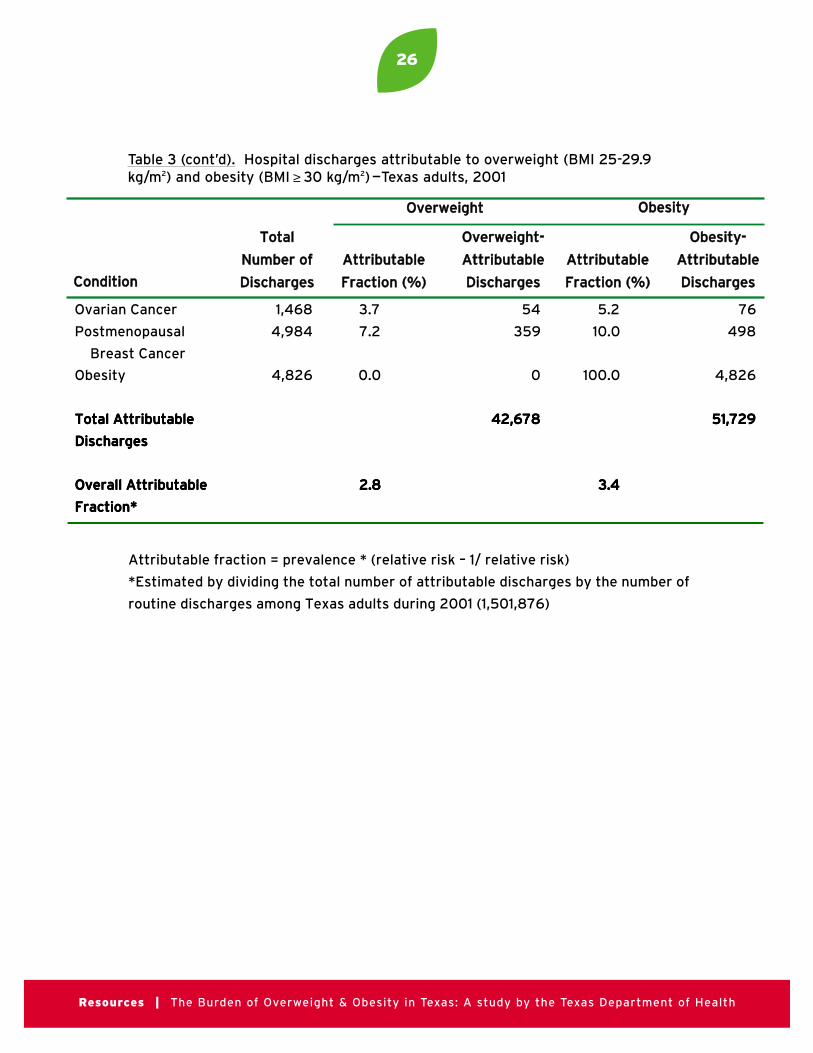
More than 94,000 hospital discharges in Texas during2001 were attributable to overweight and obesity(Table 3). Approximately 2.8% of all routine hospitaldischarges were attributable to overweight, and 3.4%were attributable to obesity. Estimates of the propor-tion of healthcare costs attributable to overweight andobesity based on costs per discharge instead of thenumber of discharges yielded similar results: 2.9% ofhospital discharge costs were attributable to over-weight, and 3.4% were attributable to obesity. One-third of the overweight and obesity-attributable dis-charges were for hospitalizations related to coronaryheart disease, 15% were for congestive heart failure,13% for ischemic stroke and 12% for type 2 diabetes.Among men, the highest overweight and obesity-attributable fractions were for type 2 diabetes (54%)and hypertension (34%). Among women, the highestoverweight and obesity-attributable fractions were fortype 2 diabetes (44%) and gallbladder disease (28%).
Healthcare expenditures among adults aged 18 andolder totaled $67.1 billion in Texas during 2001 andaccounted for almost 92% of all healthcare expendi-tures in the state for that year (Table 4). Based onoverweight and obesity prevalence data from the 2001
Texas BRFS, overweight and obesity-attributablecosts totaled $4.2 billion. Based on data from the1999-2000 NHANES, total costs for overweight andobesity in Texas during 2001 were $4.4 billion. Thisincrease was due to a higher prevalence of obesityreported from NHANES (30.5%) compared with theTexas BRFSS (24.1%), which increased the obesity-attributable fraction from 3.4% to 4.0%, although alower prevalence of overweight (34% compared with36.5%) reduced the overweight-attributable fractionfrom 2.8% to 2.5%.
During 2001, overweight-and obesity-associated mor-bidity accounted for 2.1% and 9.7% of total morbidity-related lost productivity among Texas adults (Table 5).Combined overweight- and obesity-associated indi-rect morbidity cost estimates ranged from $1.04 bil-lion to $1.29 billion, depending on the standard errorsfor the estimated number of workdays and bed-disability days, and the prevalence of overweight andobesity based on self-reported versus measuredheight and weight data.
Obesity-attributable fractions of mortality based ondata from the NHANES I EFS (11%) and the AlamedaCounty Health Study (11.9%) were similar. However,no deaths could be attributed to overweight based onNHANES I EFS while 0.7% of deaths were attributa-ble to overweight based on the Alameda CountyHealth Study. Based on NHANES I EFS data, 16,281deaths were attributable to obesity among adults inTexas during 2001; based on Alameda County data,1,036 deaths were attributable to overweight and17,613 were attributable to obesity (Table 6).
Indirect costs for lost productivity due to overweightand obesity-attributable mortality were calculated fordiscount rates from 0% to 6% (Table 7). Based on pub-lished recommendations and U.S. Treasury interestrates during 2001, a 4% real discount rate yielded thebest estimates of present value of future earnings.49, 55
Lost productivity due to obesity-attributable mor-tality cost $4.5 billion in Texas during 2001 based on

11
Part 1: Costs of Obesity | The Burden of Overweight & Obesity in Texas: A study by the Texas Department of Health
NHANES I EFS data. Lost productivity due to over-weight and obesity-attributable mortality cost $5.2billion in Texas during 2001 based on AlamedaCounty Health Study data.
Since the association between excess weight and mortality decreases as age increases, this study compared mortality cost estimates based on age andgender-specific relative risks reported from the ACSCPS II with the age-adjusted estimates based on theAlameda County and NHANES III EFS data. Obesityattributable fractions of mortality decreased from13.7% among men aged 30-64 years to 2.9% amongmen aged 75 years and older; and from 12.1% to 3.4%among women. Overweight attributable fractions ofmortality decreased from 9% among men aged 30-64years to 3.1% among men aged 75 years and older; andfrom 7.1% to 2.4% among women. Based on these frac-tions and on gender-specific present value of futureearnings estimates discounted by 4%, 16,810 deathswere attributable to overweight and obesity amongTexas adults aged 30 years and older during 2001,with associated lost productivity costs of $7.2 billion.
Total costs attributable to overweight and obesityamong adults in Texas during 2001 ranged from $9.1billion, based on the lowest cost estimates from allcategories, to $14.0 billion based on the highest costestimates (Table 8). The most reliable estimate foroverweight and obesity-attributable costs is $10.5 bil-lion, which includes $4.2 billion in direct costs forhealth care, $5.2 billion in indirect costs for lost pro-ductivity due to mortality and $1.1 billion in indirectcosts for lost productivity due to morbidity.

12
Part 2: Projected Numbers | The Burden of Overweight & Obesity in Texas: A study by the Texas Department of Health
METHODS
Texas State Data Center population projections
The estimated number of normal weight, overweightand obese adults in Texas was based on populationprojections provided by the Texas State Data Center(TSDC) in the Institute for Demographic andSocioeconomic Research at the University of Texas atSan Antonio. Population projections for each yearfrom 2000 through 2040 are available for individualyears of age (from 0-1 to 85+) for both sexes and forfour racial/ethnic groups in each of the 254 Texascounties and for the state as a whole. A completedescription of the TSDC projections and of the meth-ods used to produce them is provided on the TSDCWeb site.54
The use of four mutually exclusive racial/ethnicgroups in the 2000-based TSDC projections requiredmaking certain assumptions about racial/ethnic iden-tification because of a change in the race/ethnicityidentification procedure in the 2000 Census and theneed to make 1990 to 2000 comparisons to projectfuture rates of change. The racial/ethnic groupsincluded in the TSDC projections are Anglos (non-Hispanic persons who identified themselves as beingmembers of only the White race and those who indi-cated White race in combination with any other singlerace, except Black or African American), Blacks orAfrican Americans (non-Hispanic persons who areof the Black race or who indicate Black race in combi-nation with any other single race/ethnicity groupidentification), Hispanics (persons who are ofHispanic origin who are of any race), and an Othercategory composed of persons in all other race groupswho are not of Hispanic origin or who claim three ormore racial identities. A rationale for the racial/ethnicgroups used in the projections is available on theTSDC Web site under the discussion of comparabilityof 1990 and 2000 racial/ethnic groups.54
The TSDC projections were made using the cohort-component population projection method. Becausepopulation change is a function of the components ofbirths, deaths and net migration (which includes bothmigration from and to other areas in the United Statesand immigration from and to other nations) thismethod involves the projection of future populationsmaking certain assumptions about future rates ofbirths (fertility), deaths (mortality or survivability)and migration (both net domestic and internationalmigration) with the number of births added to, thenumber of deaths subtracted from, and the net num-ber of migrants added to (if it is net inmigration) orsubtracted from (if it is net outmigration) a startingpopulation value (in this case the 2000 CensusCount). These component changes are computed andapplied for each population cohort. Each cohort con-sists of the persons from a given age, sex, andracial/ethnic group (e.g. Anglo males 18 years of age).Thus the total number of cohorts used consists of 85age groups for two sexes for four racial/ethnic groups,a total of 680 cohorts for each county and for the stateas a whole. The TSDC uses birth rates and survivalrates (the proportion of persons who survive from oneage to another; that is, do not die) based on 1999-2000 rates for individual age, sex and racial/ethniccohorts in each county and the entire state. The sumof projections for each cohort for all counties is con-trolled to the state level projection for the same cohort.
The TSDC projections use 2000 Census populationcounts together with assumptions about future birth,survival and net migration rates to project future populations. Future trends in birth and survival rateswere projected based on historical patterns, and alter-native assumptions regarding net migration wereused to determine three alternative population projection scenarios.54 These scenarios use the samefertility and survival assumptions but three differentsets of migration rates. One scenario assumes no netmigration (that in and outmigration are either equal
PART TWO: PROJECTED NUMBER OF NORMAL WEIGHT, OVERWEIGHT
AND OBESE PERSONS IN TEXAS, 2000-2040

13
Part 2: Projected Numbers | The Burden of Overweight & Obesity in Texas: A study by the Texas Department of Health
or there is no migration), referred to as the 0.0 migra-tion scenario. A second scenario assumes rates of age,sex, and race/ethnicity net migration equal to one-half those of 1990 to 2000 and similar to the averageof the rates from 1980 through 2000, referred to asthe 0.5 migration scenario. A third assumes a contin-uation of the 1990-2000 rates of age, sex, andrace/ethnicity net migration and is referred to as the1.0 migration scenario. For most purposes, the TSDCrecommends the relatively conservative 0.5 scenariobecause the growth rate during 1990-2000 wasunusually high and the 2000 Census showed a sub-stantially higher population in the U.S. and in Texasthan anticipated.54
Prevalence of normal weight, overweight and obesity among Texas adults
Estimates of the prevalence of normal weight, over-weight and obesity among Texas adults by age group,race/ethnicity and sex were derived from data collect-ed during 1999-2002 by the Texas BRFSS.1
Respondents’ self-reported height and weight wereused to calculate their body mass index (BMI, weightin kilograms divided by height in meters squared).Based on guidelines from the National Institutes ofHealth, individuals were classified as of normalweight if their BMI was less than 25.0, overweight iftheir BMI was 25.0-29.9 kg/m2, and obese if theirBMI was 30 kg/m2 or greater. These prevalence esti-mates were applied to the TSDC population projec-tions to estimate future numbers of normal weight,overweight and obese persons by age, sex, andrace/ethnicity (Table 1).
Projected changes in prevalence of normal weight,overweight and obesity among Texas adults
In the United States, the prevalence of overweight andobesity has increased dramatically during the past 20years.55 The increase in the prevalence of obesity hasbeen so rapid during recent years that the rate ofincrease is not likely to be sustainable over time. Forthis reason, future changes in the prevalence of normal
weight, overweight and obese adults were assumed todecrease incrementally over time. Changes in theprevalence of normal weight, overweight and obesitywere based on data from the 1990-2002 nationalBRFSS, which uses self-reported height and weight tocalculate body-mass index (BMI) for individualrespondents.1 The rates of change in prevalence wereassumed to slow over time with rates of changeassumed to decrease linearly to one-fourth the 1990-2002 decade equivalent from 2000 to 2010, and todecrease by an additional one-half of the previousdecade’s prevalence in each of the next three decades.The projected numbers of adults by weight statusthrough the year 2040 were also completed with theassumption that the prevalence of normal weight,overweight and obesity would not change from the1999-2002 baseline values (e.g., baseline prevalence).
RESULTS
Based on population projections from the Texas StateData Center, the number of adults in Texas is expectedto increase from 15 million in 2000 to between 20million and 40 million in 2040 (Table 9). In the 0.5population migration scenario, which is considered tobe the most reliable scenario, the proportion of Angloadults in Texas is expected to decrease from 57% in2000 to 34% in 2040. In this same scenario, the pro-portion of Hispanic adults in Texas is expected toincrease from 28% in 2000 to 50% in 2040, while theproportion of Black adults is expected to remainalmost unchanged.
The population projections for the number of normalweight, overweight and obese Texas adults throughthe year 2040 were based on combined data from theTexas BRFSS for the years 1999-2002 (Table 10).Among both sexes in the Anglo, Hispanic and Otherrace/ethnicity groups, the prevalence of overweightand of obesity increased by age group among adultsaged 18 through 64 years, and decreased among adultsaged 65 years and older. Among Black men, the preva-lence of obesity increased with age across all age groups.Adults in the Black and Hispanic race/ethnicity

14
Part 2: Projected Numbers | The Burden of Overweight & Obesity in Texas: A study by the Texas Department of Health
groups had the highest prevalence of obesity across allage groups.
Age, gender and race/ethnicity-specific prevalenceestimates for the years 2000, 2010, 2020, 2030 and2040 based on the 0.5 population migration scenarioare included in this report (Table 11A-E). Based on theseprojections, the prevalence of obesity among Texasadults will increase from 24.0% among men and23.1% among women in 2000 to 34.6% among menand 35.7% among women in 2040. These changesreflect not only the increasing number of obese adultsbut also increases in the proportion of Hispanicadults, among whom the prevalence of obesity is sub-stantially higher compared with Anglo adults.
Among Texas adults, the number of obese persons isprojected to increase from 3.5 million in 2000 to be-tween 6.8 and 14.2 million in 2040 (Table 12). Giventhat the 0.5 population migration scenario yields themost likely projections, the number of obese adults inTexas is expected to reach 9.6 million by the year2040, almost three times the number of obese adultsin the state during 2000. Even if the prevalence ofoverweight and obesity do not change from the 1999-2002 baseline, the number of obese adults is expectedto double to 7.1 million by 2040. The greatest increas-es in the number of obese adults are expected to occuramong Hispanic persons, with an almost five-foldincrease in the number of obese Hispanic males andfemales in 2040 compared with 2000 (Tables 13A-E).
15
Part 3: Projected Costs | The Burden of Overweight & Obesity in Texas: A study by the Texas Department of Health
METHODS
The projected costs of overweight and obesity amongTexas adults for the years 2010, 2020, 2030 and 2040were based on the 2001 cost estimates described pre-viously in this report. The combined direct and indi-rect costs were determined for a single overweight anda single obese adult. These values were multiplied bythe projected number of overweight and obese adultsin each of the years 2010, 2020, 2030 and 2040 toyield cost estimates in 2001 dollars.
RESULTS
Based on the 2001 cost estimates for overweight andobesity, total annual direct and indirect costs were$471 for one overweight adult in Texas and $2,249 forone obese adult. Based on these figures and the pro-jected number of overweight and obese adults inTexas through the year 2040, the annual costs of over-weight and obesity are expected to rise from $10.5 bil-lion during 2001 to between $18.8 billion and $39.0billion in 2001 constant dollars by 2040 (Table 14).Based on the 0.5 population migration scenario, theannual costs of overweight and obesity will total $26.3billion in 2001 constant dollars by 2040. This projec-tion includes direct and indirect costs of $4.7 billionfor overweight adults and $21.6 billion for obeseadults. Even if the prevalence of overweight and obe-sity remains close to the 1999-2002 baseline, theannual cost of overweight and obesity is projected toalmost double to $20.5 billion in 2001 constant dol-lars by the year 2040 compared with 2001.
DISCUSSION
The economic costs of overweight and obesity inTexas during 2001 were an estimated $10.5 billion.Overweight- and obesity-associated healthcare costsaccounted for 6.3% of total healthcare expenditures
among Texas adults during 2001. If current trends inthe increasing prevalence of overweight and obesityamong both children and adults persist, annual costsassociated with excess weight might reach $39 billionby the year 2040. Even if the prevalence of overweightand obesity among Texas adults remains close to the1999-2002 estimates presented in this study, the costsof overweight and obesity will continue to rise as theTexas population increases.
Although there are several estimates of costs associat-ed with overweight and obesity based on nationaldata, few state-specific estimates have been report-ed.9-13 State-specific data can be difficult to obtain, andsome of the information used to estimate state-levelcosts may have to be inferred from national data, aswas done in this study to determine the percentage ofhealthcare expenditures attributable to adults. In astate-specific study published by Finkelstein et al, theestimated direct healthcare costs of obesity for Texasadults were $5.3 billion during 2003.13 This figurerepresents 6.1% of total adult healthcare expendituresin Texas. The estimates from the Finkelstein et alstudy included all medical expenditures reported by participants in the Medical Expenditure PanelSurvey, even those that might not be attributable toobesity, such as dental care and glasses. State-specificestimates of the costs of healthcare attributable tooverweight were not presented.
The overweight- and obesity-attributable healthcarecost estimates presented in this report are based onattributable fractions derived from hospital dischargedata. This method may underestimate costs for condi-tions such as osteoarthritis and hypertension, whichmight not require hospitalization for treatment butmight incur high costs for visits to healthcare practi-tioners and medications. In addition, this study usedratios from the national Medical Expenditure PanelSurvey to estimate the proportion of healthcare
PART THREE: PROJECTED COST OF OVERWEIGHT AND OBESITY IN TEXAS, 2000-2040

16
Part 3: Projected Costs | The Burden of Overweight & Obesity in Texas: A study by the Texas Department of Health
expenditures incurred by adults in Texas based ondata collected by the Centers for Medicare andMedicaid Services. If and when state-level data onhealthcare expenditures among adults and childrenbecome available, this information should be used inplace of the estimates presented in this report.
If the prevalence of obesity continues to increase inTexas, the number of adults who become disabledand/or die prematurely from obesity-related conditionscould increase. This report did not examine the poten-tial impact of an increase in the number of obesity-attributable deaths beyond the proportion expectedfrom the 2001 base-year estimates. A greater numberof premature deaths might mitigate some of the projected rise in healthcare costs. However, mosthealthcare expenditures tend to occur at the extremesof life, and so any potential savings in long-termambulatory care might be offset by an increase in end-of-life-related healthcare expenditures. In addition,rising numbers of persons with obesity-associateddisabilities would increase the indirect costs associat-ed with lost productivity. It is difficult to determinehow much these two factors might affect the cost estimates given in this report.
Although the number of overweight and obese adultsin Texas and the United States is expected to continueto increase, few projections exist that quantify theextent or rate of change. A recent study based onnational BRFSS data used a linear time trend to proj-ect the prevalence of overweight and obesity amongadult men and women in the United States.56 Thestudy estimated that among men, the prevalence ofoverweight would reach 39% by 2020 and the preva-lence of obesity would reach 46%. Among women theprevalence of overweight was estimated to reach 42%by 2020 and the prevalence of obesity was estimatedto reach 38%. These estimates are higher than theprojections presented in this report, chiefly since theestimates in the published study are based on a lineartime trend while the projections in this report arebased on a logarithmic time trend. In the currentanalysis, the rates of prevelance change were assumed
to slow over time since the rapid increase in the preva-lence of overweight and obesity in Texas and theUnited States observed during the 1990s was consid-ered to be unsustainable. If the prevalence of over-weight and obesity continued to increase on a lineartrend in Texas and reached the levels reported in thepublished study, the associated annual costs of over-weight and obesity in Texas could reach $23.5 billionby the year 2020, an estimate that is $4.9 billion high-er than the estimate of $18.6 billion in this report.
LIMITATIONS
The findings in this report are subject to several limi-tations. First, this study relied on secondary data fromseveral sources to create these estimates. The reliabilityof these estimates depends on the availability andquality of data on weight-related morbidity and mortality. For example, this study did not include thecosts of depression, obstetric complications and infer-tility, and low back pain in these estimates becausevalid estimates of the risks for these conditions werenot located in published, peer-reviewed literature. Asmore information about weight-related health effectsbecomes available, these estimates should be adjustedto reflect the most current evidence.
A second limitation is that the prevalence estimatesfor overweight and obesity in Texas were based onself-reported height and weight data, which typicallyunderestimate BMI.57 According to the BRFSS, theprevalence of obesity among Texas adults is higherthan that of the United States as a whole.1 However,when compared with national prevalence estimatesbased on measured height and weight collected by theNational Health and Nutrition Examination Survey,the self-reported obesity prevalence estimates forTexas were lower than measured estimates for theentire U.S.52 If the actual prevalence of obesity inTexas is higher than this study reports, then the costsassociated with obesity in Texas might be much higherthan those presented herein.

17
Part 3: Projected Costs | The Burden of Overweight & Obesity in Texas: A study by the Texas Department of Health
The risk ratios upon which the attributable fractionsfor healthcare are based come from several differentstudies.4, 5, 27-46 All of the study participants were volun-teers, and the majority of the participants in thesestudies were white. In addition, all of the reported riskratios were adjusted for at least two potential confounders, which might impact attributable fraction estimates. To compensate for this limitation,this study used an attributable fraction formula that isvalid when used with adjusted risk ratios.26 In addi-tion, risk estimates from studies with a nationally rep-resentative sample were used whenever possible, andrisk estimates for weight-related conditions had to beconsistent in at least two studies prior to inclusion inthe calculations. Thus, this study attempted to use themost valid risk estimates that were available at thetime of the analysis.
Indirect costs for morbidity were estimated based ondata from the National Health Interview Survey.These total estimates are higher than those reportedin other studies because costs for unemployed per-sons and for overweight persons were included. Wolfand Colditz also used data from the National HealthInterview Survey to estimate the cost of lost produc-tivity among U.S. adults aged 17-64 with a BMI ≥ 30 kg/m2 in 1995 at $3.93 billion.11 Adjustingthis estimate for inflation and for the increased preva-lence of obesity, this figure would be $8.95 billion in2001, of which $0.67 billion might be attributed toTexas based on population. Tucker and Friedmanstudied the association between obesity and absen-teeism among 10,825 employed adults and estimatedthat the cost difference between 1,000 obese and1,000 lean employees was $128,600.58 Based on thisestimate, the cost of obesity-related absenteeismamong Texas adults in 2001 would be $0.64 billion.This study estimated that the cost of lost workdaysamong obese adults, which included all adults aged 18and older and also included the value of householdwork, was $0.87 billion, which is consistent with thepreviously published estimates.
The association between BMI and mortality decreaseswith age.8, 59 Age-adjusted relative risks for BMI-associated mortality were used because the studies onwhich these risks were based used measured heightand weight to calculate BMI and included the highestproportions of non-white participants.48 This studyestimated a single population attributable fraction foroverweight and for obesity and used these fractions toestimate deaths and the value of lost wages across allage groups. To determine if these methods produceda reliable estimate for indirect mortality costs, thesecosts were also calculated using age- and gender-spe-cific relative risks for BMI-associated mortalityreported from the ACS CPS II.53 More than 90% ofCPS II participants were white, all were aged 30 andolder, and more than 70% were female. In addition,self-reported height and weight were used to calculateBMI in the ACS CPS II. Estimates based on the ACSCPS II produced a figure for the number of deathsattributable to overweight and obesity that was simi-lar to the estimates based on the Alameda CountyHealth Study and the NHANES III EFS, but a muchgreater value for lost wages. This value was greaterbecause of higher attributable fractions amongyounger persons and among overweight persons inthe CPS II study. Since several studies report an asso-ciation between overweight and reduced lifeexpectancy, the best mortality estimates were basedon the Alameda County Health Study data.6-8, 48
CONCLUSION
If the prevalence of overweight and obesity continuesto increase, the costs for healthcare and productivitylosses associated with excess body weight in Texascould reach $39 billion by 2040, almost four times thecosts during 2001. In addition, increases in the num-ber of overweight and obese Texas adults will result inmore cases of overweight- and obesity-associated dis-eases and deaths. Policies and programs designed todecrease the prevalence of overweight and obesitythrough both prevention and treatment are needed toaddress this growing public health problem in Texas.

18
References | The Burden of Overweight & Obesity in Texas: A study by the Texas Department of Health
REFERENCES
1Centers for Disease Control and Prevention (CDC).Behavioral Risk Factor Surveillance System SurveyData. Atlanta, Georgia: U.S. Department of Healthand Human Services, Centers for Disease Control andPrevention, 1991-2001. Available at www.cdc.gov/brfss.
2National Task Force on the prevention and treat-ment of obesity. Overweight, obesity and health risk.Archives of Internal Medicine, 2000. 160:898-904.
3National Institutes of Health. Clinical guidelines onthe identification, evaluation, and treatment of over-weight and obesity in adults. Bethesda, Maryland:Department of Health and Human Services, NationalInstitutes of Health, National Heart, Lung, and BloodInstitute, 1998.
4Calle EE, Rodriguez C, Walker-Thurmond K, ThunMJ. Overweight, obesity, and mortality from cancer ina prospectively studied cohort of U.S. Adults. NewEngland Journal of Medicine. 2003; 348:1625-38.
5Wolk A, Gridley G, Svensson M, Nyrem O, McLaughlinJ, Fraumeni J, Adami HO. A prospective study of obe-sity and cancer risk (Sweden). Cancer Causes andControl. 2001; 12:13-21.
6Thompson D, Edelsberg J, Colditz GA, Bird AP, Oster G.Lifetime health and economic consequences of obesi-ty. Archives of Internal Medicine. 1999; 159:2177-83.
7Fontaine KR, Redden DT, Wang C, Westfall AO,Allison DB. Years of life lost due to obesity. Journal ofthe American Medical Association. 2003; 289:187-93.
8Peeters A; Barendregt JJ, Willekens F, MackenbachJP, Al Mamun A, Bonneux L. Obesity in adulthoodand its consequences for life expectancy: a life-tableanalysis. Annals of Internal Medicine. 2003; 138:24-33.
9Finkelstein EA, Fiebelkorn IC, Wang G. Nationalmedical spending attributable to overweight and obesity: how much, and who’s paying? Health Affairs.2003; W3-219-W3-226.
10Thompson D, Wolf AM. The medical-care cost bur-den of obesity. Obesity Review. 2001; 2:189-97.
11Wolf AM, Colditz GA. Current estimates of the eco-nomic cost of obesity in the United States. ObesityResearch. 1998; 6:97-106.
12Allison DB, Zannolli R, Narayan KMV. The directhealth care costs of obesity in the United States.American Journal of Public Health. 1999; 89:1194-9.
13Finkelstein EA, Fiebelkorn IC, Wang G. State-levelestimates of annual medical expenditures attributableto obesity. Obesity Research. 2004: 12:18-24.
14Centers for Disease Control and Prevention (CDC).About the BRFSS. Atlanta, Georgia: U.S. Departmentof Health and Human Services, Centers for DiseaseControl and Prevention, 2003. Available athttp://www.cdc.gov/brfss/about.htm.
15Texas Health Care Information Council. Texas hos-pital inpatient discharge public use data file, 2001.Available at http://www.thcic.state.tx.us.
16Martin AB, Whittle LS, Levit KR. Trends in statehealth care expenditures and funding 1980-1998.Health Care Finance Rev. 2001; 22:111-40.
17United States Census Bureau. Statistical abstractof the United States: 2002. Available athttp://www.census.gov/statab/www.
18National Center for Health Statistics. NationalHealth Interview Survey: description. Hyattsville,Maryland: U.S. Department of Health and HumanServices, Centers for Disease Control and Prevention,2003. Available at http://www.cdc.gov/nchs/about/major/nhis/hisdesc.htm.
19Agency for Healthcare Research and Quality.Medical Expenditure Panel Survey. Department ofHealth and Human Services, Agency for HealthcareResearch and Quality, 2003. Available athttp://www.meps.ahrq.gov.
19
References | The Burden of Overweight & Obesity in Texas: A study by the Texas Department of Health
20Agency for Healthcare Research and Quality.MEPSnet Analytical Tools. Rockville, Maryland. U.S.Department of Health and Human Services, 2001.Available at http://www.meps.ahrq.gov/mepsnet/MEPSnetIntro.htm.
21United States Census Bureau. Current PopulationSurvey overview. Available at http://www.bls.cen-sus.gov/cps/overmain.htm.
22Bureau of Vital Statistics. Texas Vital Statistics:2001 Annual Report. Texas Department of Health,Bureau of Vital Statistics, 2002. Available athttp://www.tdh.state.tx.us/bvs/stats01/annrpt.htm.
23Rice DP, Hodgson TA, Kopstein AN. The economiccosts of illness: a replication and update. Health CareFinance Review. 1985; 7:61-80.
24Haddix AC, Teutsch SM, Corso PS, editors.Prevention effectiveness: a guide to decision analysisand economic evaluation. New York: OxfordUniversity Press; 2003.
25Han TS, Tijhuis MA, Lean ME, Seidell JC. Qualityof life in relation to overweight and body fat distribu-tion. American Journal of Public Health. 1998;88:1814-20.
26Rockhill B, Newman B, Weinberg C. Use and mis-use of population attributable fractions. AmericanJournal of Public Health. 1998; 88:15-19.
27Field AE, Coakley EH, Must A, Spadano JL, LairdN, Dietz WH, Rimm E, Colditz GA. Impact of over-weight on the risk of developing common chronic dis-eases during a 10-year period. Archives of InternalMedicine. 2001; 161:1581-6.
28Wilson PWF, D’Agostino RB, Sullivan L, Parise H,Kannel WB. Overweight and obesity as determinantsof cardiovascular risk. Archives of Internal Medicine.2002; 162:1867-72.
29Manson JE, Colditz GA, Stampfer MJ, Willett WC,Rosner B, Monson RR, Speizer FE, Hennekens CH. Aprospective study of obesity and risk of coronary heartdisease in women. New England Journal of Medicine.1990; 322:882-9.
30Kenchaiah S, Evans JC, Levy D, Wilson PWFBenjamin E, Larson MG, Kannel WB, Vasan RS.Obesity and the risk of heart failure. New EnglandJournal of Medicine. 2002; 347:305-13.
31He J, Ogden LG, Bazzano LA, Vupputuri S, LoriaC, Whelton PK. Risk factors for congestive heart fail-ure in US men and women. Archives of InternalMedicine. 2001; 161:996-1002.
32Kurth T, Gaziano M, Berger K, Kase CS, RexrodeKM, Cook NR, Buring JE, Manson JE. Body massindex and the risk of stroke in men. Archives ofInternal Medicine. 2002; 162:2557-62.
33Rexrode KM, Hennekens CH, Willett WC, ColditzGA, Stampfer MJ, Rich-Edwards JW, Speizer FE,Manson JE. A prospective study of body mass index,weight change, and risk of stroke in women. Journalof the American Medical Association. 1997; 277:1539-45.
34Nakeeb A, Comuzzie AG, Martin L, SonnenbergGE, Swartz-Basile D, Kissebah AH, Pitt HA.Gallstones: genetics versus environment. Annals ofSurgery. 2002; 235:842-9.
35Mokdad AH, Ford ES, Bowman BA, Dietz WH,Vinicor F, Bales VS Marks JS. Prevalence of obesity,diabetes, and obesity-related health factors, 2001.Journal of the American Medical Association. 2003;289:76-9.
36Felson DT. Weight and osteoarthritis. AmericanJournal of Clinical Nutrition. 1996; 63:430S-2S.
37Sturmer T, Gunther K-P, Brenner H. Obesity, over-weight and patterns of osteoarthritis: the Ulmosteoarthritis study. Journal of Clinical Epidemiology.2000; 53:307-13.
20
References | The Burden of Overweight & Obesity in Texas: A study by the Texas Department of Health
38Tishler PV, Larkin EK, Schluchter MD, Redline S.Incidence of sleep-disordered breathing in an urbanadult population. Journal of the American MedicalAssociation. 2003; 289:2230-7.
39Bixler EO, Vgontzas AN, Lin H-M, Ten Have T,Rein J, Vela-Bueno A, Kales A. Prevalence of sleep-disordered breathing in women: effects of gender.American Journal of Respiratory and Critical CareMedicine. 2001; 163:608-13.
40Peppard PE, Young T, Palta M, Dempsey J,Skatrud J. Longitudinal study of moderate weightchange and sleep-disordered breathing. Journal of theAmerican Medical Association. 2000; 284:3015-21.
41Young T, Palta M, Dempsey J, Skatrud J, Weber S,Badr S. The occurrence of sleep-disordered breathingamong middle-aged adults. New England Journal ofMedicine. 1993; 328:1230-5.
42Young T, Shahar E, Nieto FJ, Redline S, NewmanA, Gottlieb DJ et al. Predictors of sleep-disorderedbreathing in community-dwelling adults. Archives ofInternal Medicine. 2002; 162:893-900.
43Chow W-H, Gridely G, Fraumeni JF, Jarvholm B.Obesity, hypertension, and the risk of kidney cancer inmen. New England Journal of Medicine. 2000;343:1305-11.
44van den Brandt PA, Spiegelman D, Yaun S-S, AdamiH-O, Beeson L, Folsom AR, Fraser G, Goldbohm RA,Graham S, Kushi L, Marshall JR, Miller AB, Rohan T,Smith-Warner SA, Speizer FE, Willett WC, Wolk A,Hunter DJ. Pooled analysis of prospective cohortstudies on height, weight, and breast cancer risk.American Journal of Epidemiology. 2000; 152:514-27.
45Sonnenschein E, Toniolo P, Terry MB, Bruning PF,Kato I, Koenig KL, Shore RE. Body fat distributionand obesity in pre-and postmenopausal breast cancer.International Journal of Epidemiology. 1999;28:1026-31.
46Must A, Spadano J, Coakley EH, Field AE, ColditzG, Dietz WH. The disease burden associated withoverweight and obesity. Journal of the AmericanMedical Association.1999; 282:1523-9.
47National Center for Health Statistics. TheInternational Classification of Diseases, 9th Revision,Clinical Modification” (ICD-9-CM), sixth edition.Hyattsville, Maryland: U.S. Department of Health andHuman Services, Centers for Disease Control andPrevention, 2000. Available at http://www.cdc.gov/nchs/about/otheract/icd9/abticd9.htm.
48Allison DB, Fontaine KR, Manson JE, Stevens J,VanItalie TB. Annual deaths attributable to obesity inthe United States. Journal of the American MedicalAssociation. 1999; 282:1530-8.
49Bureau of Labor Statistics. Labor Force Statisticsfrom the Current Population Survey. U.S. Departmentof Labor, Bureau of Labor Statistics, 2003. Availableat http://www.bls.gov/cps.
50Bureau of Labor Statistics. Geographic profile ofemployment and unemployment, 2001. U.S.Department of Labor, Bureau of Labor Statistics,2003; USDL bulletin no. 2556. Available athttp://www.bls.gov/lau/table12.full01.pdf.
51Office of Management and Budget. Guidelines anddiscount rates for benefit-cost analysis of federal pro-grams. Executive Office of the President of the UnitedStates, Office of Management and Budget.Washington, D.C.: Office of Management and Budget;2002, Jan. Circular No. A-94. Available athttp://www.whitehouse.gov/omb/circulars/index.htm.
52Flegal KM, Carroll MD, Ogden CL, Johnson CL.Prevalence and trends in obesity among US adults,1999-2000. Journal of the American MedicalAssociation. 2002; 288:1723-7.
53Calle EE, Thun MJ, Petrelli JM, Rodriguez C,Heath CW. Body-mass index and mortality in aprospective cohort of U.S. adults. New EnglandJournal of Medicine. 1999; 341:1097-1105.

21
References | The Burden of Overweight & Obesity in Texas: A study by the Texas Department of Health
54Texas State Data Center. Available at:http://txsdc.utsa.edu/download/pdf/2001_Projection_Methodology.pdf
55National Center for Chronic Disease Preventionand Health Promotion. Division of Nutrition andPhysical Activity. U.S. obesity trends, 1985-2002.Department of Health and Human Services, Centersfor Disease Control and Prevention, 2004. Availableathttp://www.cdc.gov/nccdphp/dnpa/obesity/trend/maps.
56Sturm R, Ringel JS, Andreyeva T. Increasing obe-sity rates and disability trends. Health Affairs. 2004;23:199-205.
57Nieto-Garcia FJ, Bush TL, Keyl PM. Body massdefinitions of obesity: sensitivity and specificity usingself-reported height and weight. Epidemiology. 1990;1:146-52.
58Tucker LA, Friedman GM. Obesity and absenteeism:an epidemiologic study of 10,825 employed adults.American Journal of Health Promotion. 1998; 12:202-7.
59Bender R, Jockel K-H, Trautner C, Spraul M,Berger M. Effect of age on excess mortality in obesity.Journal of the American Medical Association. 1999;281:1498-1504.
22
Resources | The Burden of Overweight & Obesity in Texas: A study by the Texas Department of Health
Table 1. Relative Risks for overweight (BMI 25-29.9 kg/m2) and obesity (BMI ≥30 kg/m2)-
associated morbidity and mortality
Body Mass Index (BMI; kg/m2)
Disease 25-29.9 ≥30 30-34.9 30-39.9 ≥35 35-39.9 ≥40
Coronary Heart Disease (27)
Men
Women
1.5
1.4
2.0
1.5
2.2
1.5
Congestive Heart Failure (30) 1.3 2.0
Ischemic Stroke
Men (32)
Women (33)
1.4
1.9a 2.4b
Hypertension (27)
Men
Women
1.7
1.7
2.7
2.1
3.0
2.3
Type 2 Diabetes (27)
Men
Women
3.5
4.6
11.2
10.0
23.4
17.0
Gallbladder Disease (27)
Men
Women
1.4
1.9
2.3
2.5
2.9
3.0
Asthma (35) 1.1 1.6 2.7
Osteoarthritis (35) 1.4 2.0 4.4
Sleep Apnea (38) 1.4c 2.1 2.8 3.5
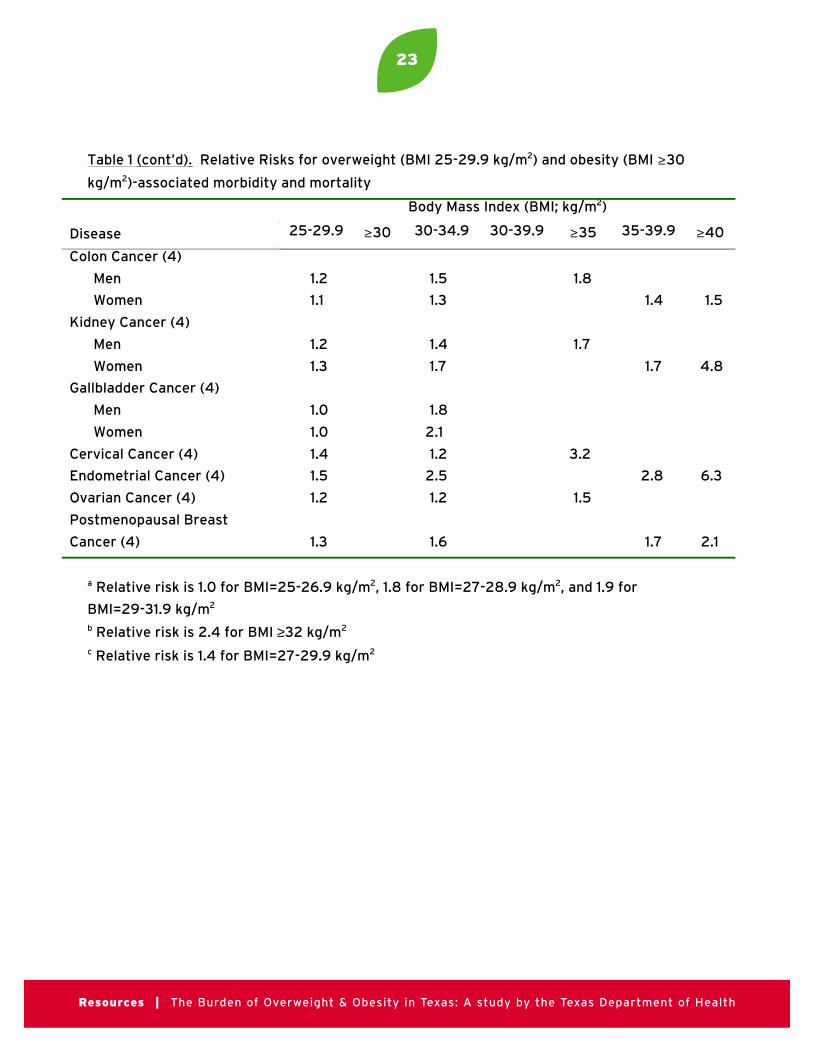
23
Resources | The Burden of Overweight & Obesity in Texas: A study by the Texas Department of Health
Table 1 ( cont’d). Relative Risks for overweight (BMI 25-29.9 kg/m2) and obesity (BMI ≥30
kg/m2)-associated morbidity and mortality
Body Mass Index (BMI; kg/m2)
Disease 25-29.9 ≥30 30-34.9 30-39.9 ≥35 35-39.9 ≥40
Colon Cancer (4)
Men
Women
1.2
1.1
1.5
1.3
1.8
1.4 1.5
Kidney Cancer (4)
Men
Women
1.2
1.3
1.4
1.7
1.7
1.7 4.8
Gallbladder Cancer (4)
Men
Women
1.0
1.0
1.8
2.1
Cervical Cancer (4) 1.4 1.2 3.2
Endometrial Cancer (4) 1.5 2.5 2.8 6.3
Ovarian Cancer (4) 1.2 1.2 1.5
Postmenopausal Breast
Cancer (4) 1.3 1.6 1.7 2.1
a Relative risk is 1.0 for BMI=25-26.9 kg/m2, 1.8 for BMI=27-28.9 kg/m2, and 1.9 for
BMI=29-31.9 kg/m2
b Relative risk is 2.4 for BMI ≥32 kg/m2
c Relative risk is 1.4 for BMI=27-29.9 kg/m2
24
Resources | The Burden of Overweight & Obesity in Texas: A study by the Texas Department of Health
Table 2 . Body mass index by gender (number per 100 persons)—BRFSS* (1), Texas
Adults, 2001
BBBBMMMMIIII ((((kkkkgggg////mmmm2222)))) TTTToooottttaaaallll MMMMeeeennnn WWWWoooommmmeeeennnn
<18.5 2.1 0.9 3.3
18.5-24.9 37.4 30.5 44.3
25-29.9 36.4 44.3 28.5
30-34.9 16.0 17.9 14.1
35-39.9 5.0 4.4 5.5
≥40 3.1 2.0 4.3
OOOOvvvveeeerrrrwwwweeeeiiiigggghhhhtttt ((((22225555----22229999....9999)))) 33336666....4444 44444444....3333 22228888....5555
OOOObbbbeeeesssseeee ((((≥33330000)))) 22224444....1111 22224444....3333 22223333....9999
*Behavioral Risk Factor Surveillance Survey

25
Resources | The Burden of Overweight & Obesity in Texas: A study by the Texas Department of Health
Table 3. Hospital discharges attributable to overweight (BMI 25-29.9 kg/m2) and
obesity (BMI ≥30 kg/m2)— Texas adults, 2001
OOOOvvvveeeerrrrwwwweeeeiiiigggghhhhtttt OOOObbbbeeeessssiiiittttyyyy
CCCCoooonnnnddddiiiittttiiiioooonnnn
TTTToooottttaaaallll
NNNNuuuummmmbbbbeeeerrrr ooooffff
DDDDiiiisssscccchhhhaaaarrrrggggeeeessss
AAAAttttttttrrrriiiibbbbuuuuttttaaaabbbblllleeee
FFFFrrrraaaaccccttttiiiioooonnnn ((((%%%%))))
OOOOvvvveeeerrrrwwwweeeeiiiigggghhhhtttt----
AAAAttttttttrrrriiiibbbbuuuuttttaaaabbbblllleeee
DDDDiiiisssscccchhhhaaaarrrrggggeeeessss
AAAAttttttttrrrriiiibbbbuuuuttttaaaabbbblllleeee
FFFFrrrraaaaccccttttiiiioooonnnn ((((%%%%))))
OOOObbbbeeeessssiiiittttyyyy----
AAAAttttttttrrrriiiibbbbuuuuttttaaaabbbblllleeee
DDDDiiiisssscccchhhhaaaarrrrggggeeeessss
Coronary Heart
Disease
Men
Women
80,791
56,022
14.8
8.1
11,957
4,538
12.4
8.0
10,018
4,482
Congestive Heart
Failure
64,420 9.2 5,927 12.3 7,924
Ischemic Stroke
Men
Women
19,734
24,294
11.5
4.2
2,269
1,020
11.3
15.0
2,230
3,644
Hypertension
Men
Women
4,400
8,523
18.2
11.7
801
997
15.5
12.9
682
1,099
Type 2 Diabetes
Men
Women
11,073
12,100
31.6
22.3
3,499
2,698
22.3
22.0
2,469
2,662
Gallbladder Disease
Men
Women
9,251
22,280
12.7
13.5
1,175
3,008
14.4
14.9
1,332
3,320
Asthma 13,070 4.5 588 10.0 1,307
Osteoarthritis 29,501 10.0 2,950 13.1 3,865
Sleep Apnea 457 5.5 25 13.9 64
Colon Cancer
Men
Women
3,058
3,324
7.4
2.6
226
86
8.6
6.3
263
209
Kidney Cancer
Men
Women
1,613
1,068
6.8
7.1
110
76
7.4
11.2
119
120
Gallbladder Cancer
Men
Women
214
280
0.0
0.0
0
0
10.5
12.7
22
36
Cervical Cancer 1,577 7.8 123 9.4 148
Endometrial Cancer 2,008 9.5 191 15.6 313
26
Resources | The Burden of Overweight & Obesity in Texas: A study by the Texas Department of Health
Ovarian Cancer 1,468 3.7 54 5.2 76
Postmenopausal
Breast Cancer
4,984 7.2 359 10.0 498
Obesity 4,826 0.0 0 100.0 4,826
TTTToooottttaaaallll AAAAttttttttrrrriiiibbbbuuuuttttaaaabbbblllleeee
DDDDiiiisssscccchhhhaaaarrrrggggeeeessss
44442222,,,,666677778888 55551111,,,,777722229999
OOOOvvvveeeerrrraaaallllllll AAAAttttttttrrrriiiibbbbuuuuttttaaaabbbblllleeee
FFFFrrrraaaaccccttttiiiioooonnnn****
2222....8888 3333....4444
Attributable fraction = prevalence * (relative risk – 1/ relative risk)
*Estimated by dividing the total number of attributable discharges by the number of
routine discharges among Texas adults during 2001 (1,501,876)
Table 3 (cont’d). Hospital discharges attributable to overweight (BMI 25-29.9kg/m2) and obesity (BMI ≥ 30 kg/m2)—Texas adults, 2001
CCoonnddiittiioonn
TToottaall
NNuummbbeerr ooff
DDiisscchhaarrggeess
AAttttrriibbuuttaabbllee
FFrraaccttiioonn ((%%))
OOvveerrwweeiigghhtt--
AAttttrriibbuuttaabbllee
DDiisscchhaarrggeess
AAttttrriibbuuttaabbllee
FFrraaccttiioonn ((%%))
OObbeessiittyy--
AAttttrriibbuuttaabbllee
DDiisscchhaarrggeess
OOvveerrwweeiigghhtt OObbeessiittyy

27
Resources | The Burden of Overweight & Obesity in Texas: A study by the Texas Department of Health
Tab
le 4
. P
ers
on
al H
eal
thca
re E
xpe
nd
itu
res
($ B
illio
ns)
—T
exa
s, 2
00
1*
HHHHeeee
aaaa llll tttt
hhhhcccc aaaa
rrrr eeee EEEE
xxxx ppppeeee
nnnndddd
iiii ttttuuuu
rrrr eeee
AAAAllll llll
EEEExxxx p
pppeeee n
nnndddd
iiii ttttuuuu
rrrr eeeessss
%%%% AAAA
mmmmoooo
nnnngggg
AAAAdddd
uuuullll tttt
ssss
AAAAllll llll
AAAAdddd
uuuullll tttt
EEEExxxx p
pppeeee n
nnndddd
iiii ttttuuuu
rrrr eeeessss
OOOOvvvv e
eee rrrr wwww
eeee iiii gggg
hhhhtttt ----
AAAAtttt tttt
rrrr iiiibbbb
uuuutttt aaaa
bbbbllll eeee
EEEExxxx p
pppeeee n
nnndddd
iiii ttttuuuu
rrrr eeeessss
OOOObbbb
eeee ssss iiii
tttt yyyy----
AAAAtttt tttt
rrrr iiiibbbb
uuuutttt aaaa
bbbbllll eeee
EEEExxxx p
pppeeee n
nnndddd
iiii ttttuuuu
rrrr eeeessss
TTTToooo
tttt aaaallll####
HHHHoooo
ssss ppppiiii tttt
aaaa llll CCCC
aaaa rrrr eeee
33330000
.... 55554444
99993333
%%%%2222
8888.... 3333
88880000
.... 88881111
0000.... 9999
88881111 ....
77779999
PPPPhhhh
yyyyssss iiii
cccc iiiiaaaa n
nnnssss
aaaa nnnndddd
OOOOtttt hhhh
eeeerrrr
HHHHeeee
aaaa llll tttt
hhhhcccc aaaa
rrrr eeeePPPP
rrrr ooooffff eeee
ssss ssssiiii oooo
nnnnaaaa l
lll ssss ((((
OOOOuuuu
tttt ppppaaaa t
ttt iiiieeee
nnnntttt
cccc aaaarrrr eeee
))))2222
2222.... 2222
77778888
8888%%%%
1111 9999.... 5555
22220000
.... 55555555
0000.... 6666
77771111 ....
22222222
HHHHoooo
mmmmeeee
HHHHeeee a
aaa llll tttt
hhhh CCCC
aaaa rrrr eeee
3333.... 1111
88889999
2222%%%%
2222.... 9999
11110000
.... 00008888
0000.... 1111
00000000
.... 11118888
MMMMeeee
ddddiiii cccc
aaaa tttt iiii
oooonnnn
ssss aaaa n
nnndddd
DDDDuuuu
rrrr aaaabbbb
llll eeeeMMMM
eeee ddddiiii cccc
aaaa llll GGGG
oooooooo
ddddssss
1111 0000.... 0000
99999999
4444%%%%
9999.... 5555
22220000
.... 22227777
0000.... 3333
33330000
.... 66660000
NNNNuuuu
rrrr ssssiiii nnnn
gggg HHHH
oooommmm
eeee CCCC
aaaa rrrr eeee
4444.... 9999
00009999
2222%%%%
4444.... 4444
88880000
.... 11113333
0000.... 1111
55550000
.... 22228888
OOOOtttt hhhh
eeee rrrr
CCCCoooo
ssss ttttssss
2222.... 3333
55559999
6666%%%%
2222.... 2222
66660000
.... 00006666
0000.... 0000
88880000
.... 11114444
TTTToooo
tttt aaaallll H
HHHeeee
aaaa llll tttt
hhhhcccc aaaa
rrrr eeee EEEE
xxxx ppppeeee
nnnndddd
iiii ttttuuuu
rrrr eeeessss
77773333
.... 33332222
66667777
.... 00007777
1111 ....9999
00002222
.... 33331111
4444.... 2222
1111
*Nu
mb
ers
may
no
t ad
d e
xact
ly d
ue
to
ro
un
din
g
#T
ota
l fo
r o
verw
eig
ht
and
ob
esi
ty c
om
bin
ed

28
Resources | The Burden of Overweight & Obesity in Texas: A study by the Texas Department of Health
Table 5. Overweight (BMI 25-29.9 kg/m2) and Obesity- (BMI ≥30 kg/m2) attributable
costs of morbidity-associated lost productivity (wages and household work)—Texas
adults, 2001
OOOOvvvveeeerrrrwwwweeeeiiiigggghhhhtttt OOOObbbbeeeesssseeee TTTToooottttaaaallll
Workdays Lost 896,459 4,140,786 5,037,245
Cost of Lost Workdays $0.16 billion $0.77 billion $0.93 billion
Bed-Disability Days 1,006,028 4,646,889 5,652,916
Cost of Bed-Disability Days $0.02 billion $0.10 billion $0.12 billion
TTTToooottttaaaallll CCCCoooosssstttt ooooffff LLLLoooosssstttt PPPPrrrroooodddduuuuccccttttiiiivvvviiiittttyyyy (((($$$$)))) $$$$0000....11118888 bbbbiiiilllllllliiiioooonnnn $$$$0000....88887777 bbbbiiiilllllllliiiioooonnnn $$$$1111....00005555 bbbbiiiilllllllliiiioooonnnn

29
Resources | The Burden of Overweight & Obesity in Texas: A study by the Texas Department of Health
Tab
le 6
. D
eat
hs
and
ind
ire
ct c
ost
s o
f lo
st e
arn
ing
s at
trib
uta
ble
to
ob
esi
ty-a
ttri
bu
tab
le p
rem
atu
re m
ort
alit
y—
Te
xas,
20
01
NNNNHHHH
AAAANNNN
EEEESSSS
IIII EEEE
FFFFSSSS
*AAAA
llll aaaammmm
eeee ddddaaaa
CCCCoooo
uuuunnnn
tttt yyyy SSSS
tttt uuuudddd
yyyy†
AAAAgggg
eeee ((((
yyyyeeee a
aaa rrrr ssss
))))
PPPPrrrr eeee
ssss eeeennnn
tttt VVVV
aaaa llll uuuu
eeee
ooooffff
FFFFuuuu
tttt uuuurrrr eeee
EEEEaaaa r
rrr nnnniiii nnnn
ggggssss
(((( $$$$))))‡
NNNNuuuu
mmmmbbbb
eeee rrrr
ooooffff
DDDDeeee
aaaatttt hhhh
ssss§
NNNNuuuu
mmmmbbbb
eeee rrrr
ooooffff
OOOObbbb
eeee ssss iiii
tttt yyyy----
AAAAtttt tttt
rrrr iiiibbbb
uuuutttt aaaa
bbbbllll eeee
DDDDeeee a
aaa tttt hhhh
ssss
TTTToooo
tttt aaaallll V
VVVaaaa l
lll uuuueeee
ooooffff
LLLLoooo
ssss tttt EEEE
aaaa rrrr nnnn
iiii nnnngggg
ssss
(((( $$$$ mmmm
iiii llll llll iiii oooonnnn
ssss ))))_
NNNNuuuu
mmmmbbbb
eeee rrrr
ooooffff
OOOOvvvv e
eee rrrr wwww
eeee iiii gggg
hhhhtttt ----
AAAAtttt tttt
rrrr iiiibbbb
uuuutttt aaaa
bbbbllll eeee
DDDDeeee a
aaa tttt hhhh
ssss
NNNNuuuu
mmmmbbbb
eeee rrrr
ooooffff
OOOObbbb
eeee ssss iiii
tttt yyyy----
AAAAtttt tttt
rrrr iiiibbbb
uuuutttt aaaa
bbbbllll eeee
DDDDeeee a
aaa tttt hhhh
ssss
TTTToooo
tttt aaaallll V
VVVaaaa l
lll uuuueeee
ooooffff
LLLLoooo
ssss tttt EEEE
aaaa rrrr nnnn
iiii nnnngggg
ssss
(((( $$$$ mmmm
iiii llll llll iiii oooonnnn
ssss )))) _
20
-24
36
7,5
90
1,5
1916
76
1.4
1118
17
0.4
25
-29
73
5,9
66
1,5
1916
712
3.0
1118
114
0.9
30
-34
82
4,2
36
1,7
75
195
160
.912
211
184
.3
35
-39
917
,70
12
,66
72
93
26
9.2
193
173
08
.4
40
-44
92
5,3
89
4,0
42
44
54
11.5
28
48
14
71.
3
45
-49
86
6,0
93
5,3
145
85
50
6.3
37
63
25
79
.9
50
-54
80
4,9
28
6,7
00
73
75
93
.24
77
97
67
9.5
55
-59
59
5,1
05
7,7
55
85
35
07
.75
49
23
58
1.5
60
-64
46
0,3
66
9,2
43
1,0
174
68
.16
511
00
53
6.2
65
-69
212
,115
11,9
22
1,3
112
78
.28
314
193
18.6
70
-74
165
,53
415
,94
31,
75
42
90
.311
218
97
33
2.5
75
an
d o
lde
r9
4,6
49
7,9
611
8,7
57
82
8.9
55
79
47
49
49
.4
TTTToooo
tttt aaaallll
1111 44448888
,,,, 00001111 0000
1111 6666,,,, 2222
88881111
4444,,,, 4444
99998888
.... 66661111 ,,,,
00003333
66661111 7777
66661111 3333
5555,,,, 1111
55552222
.... 9999
Att
rib
uta
ble
fra
ctio
n =
pre
vale
nce
* (
rela
tive
ris
k –
1/ r
ela
tive
ris
k)
**** Ove
rwe
igh
t-at
trib
uta
ble
fra
ctio
n =
0%
; ob
esi
ty-a
ttri
bu
tab
le f
ract
ion
= 1
1%†O
verw
eig
ht-
attr
ibu
tab
le f
ract
ion
= 0
.7%
; ob
esi
ty-a
ttri
bu
tab
le f
ract
ion
= 1
1.9
%‡A
ssu
me
s a
4%
dis
cou
nt
rate
; ear
nin
gs
incl
ud
es
wag
es
and
ho
use
ho
ld w
ork
§B
ure
au o
f V
ital
Sta
tist
ics,
Te
xas
De
par
tme
nt
of
He
alth
(5
2)
_ Nu
mb
ers
may
no
t ad
d e
xact
ly d
ue
to
ro
un
din
g

30
Resources | The Burden of Overweight & Obesity in Texas: A study by the Texas Department of Health
Table 7 . Sensitivity analysis for costs of overweight and obesity among adults—Texas, 2001
Overweight Obesity
Variations in Estimates AF Cost AF Cost Total Cost
DDDDiiiirrrreeeecccctttt HHHHeeeeaaaalllltttthhhhccccaaaarrrreeee CCCCoooossssttttssss
2001 TX BRFS 2.8% 1.9 3.4% 2.3 4.2
1999-2000 NHANES 2.5% 1.7 4.0% 2.7 4.4
IIIInnnnddddiiiirrrreeeecccctttt CCCCoooossssttttssss
MMMMoooorrrrbbbbiiiiddddiiiittttyyyy
NHIS and TX BRFS Prevalence 2.1% 0.2 9.7% 0.9 1.1
NHIS and NHANES Prevalence 2.1% 0.2 12.4% 1.1 1.3
NHIS Lower Confidence Limits 2.0% 0.2 9.7% 0.9 1.0
MMMMoooorrrrttttaaaalllliiiittttyyyy ---- AAAAllllllll----CCCCaaaauuuusssseeee
NHANES I EFS 0.0% 11.0%
PVFE Discount: 0% 0 7.2 7.2
1% 0 6.3 6.3
2% 0 5.6 5.6
3% 0 5.0 5.0
4% 0 4.5 4.5
5% 0 4.1 4.1
6% 0 3.8 3.8
Alameda County Study 0.7% 11.9%
PVFE Discount: 0% 0.5 7.8 8.3
1% 0.4 6.8 7.2
2% 0.4 6.0 6.4
3% 0.3 5.4 5.7
4% 0.3 4.9 5.2
5% 0.3 4.4 4.7
6% 0.2 4.1 4.3

31
Resources | The Burden of Overweight & Obesity in Texas: A study by the Texas Department of Health
Table 8 . Highest, lowest and best cost estimates for overweight and obesity among
adults—Texas, 2001
Overweight Obesity
Total Cost Estimates AF Cost AF Cost Total Cost
HHHHiiiigggghhhheeeesssstttt
Healthcare 2.5% 1.7 4.0% 2.7 4.4
Mortality 0.7% 0.5 11.9% 7.8 8.3
Morbidity 2.1% 0.2 12.4% 1.1 1.3
Total 2.4 11.6 14.0
LLLLoooowwwweeeesssstttt
Healthcare 2.8% 1.9 3.4% 2.3 4.2
Mortality 0.0% 0 11.0% 3.8 3.8
Morbidity 2.0% 0.2 9.7% 0.9 1.1
Total 2.1 7.0 9.1
BBBBeeeesssstttt
Healthcare 2.8% 1.9 3.4% 2.3 4.2
Mortality 0.7% 0.3 11.9% 4.9 5.2
Morbidity 2.1% 0.2 9.7% 0.9 1.1
TTTToooottttaaaallll 2222....4444 8888....1111 11110000....5555
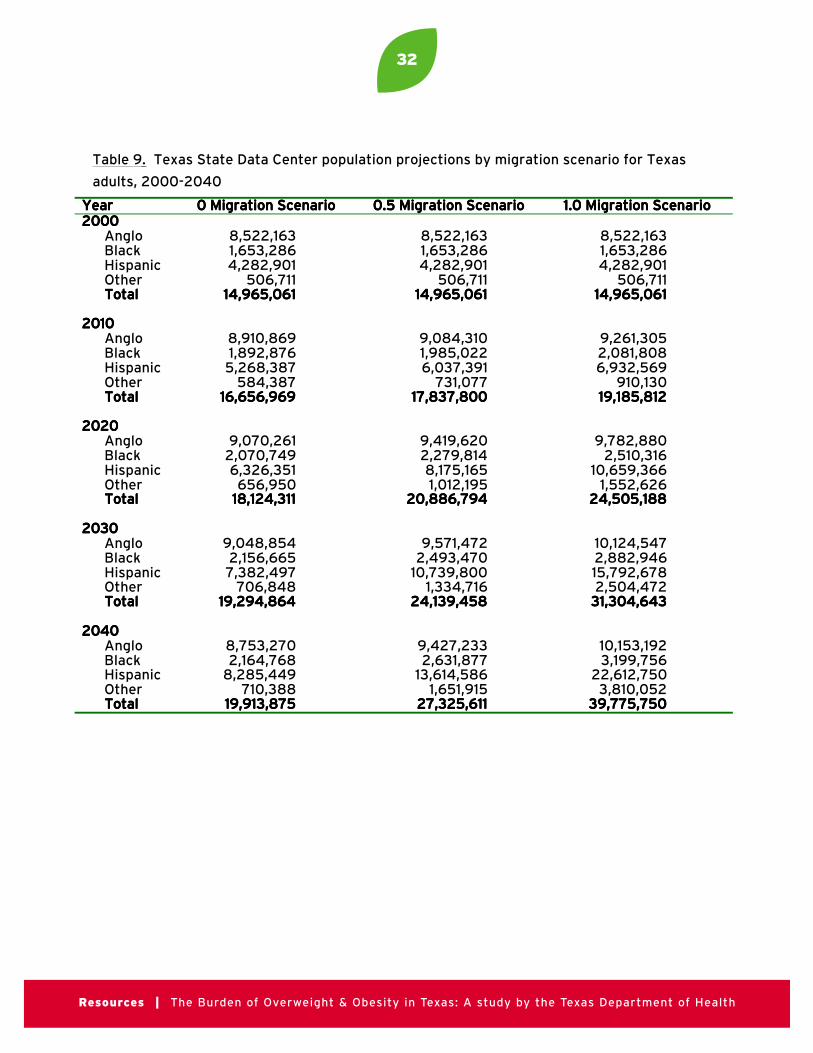
32
Resources | The Burden of Overweight & Obesity in Texas: A study by the Texas Department of Health
Table 9. Texas State Data Center population projections by migration scenario for Texas
adults, 2000-2040
YYYYeeeeaaaarrrr 0000 MMMMiiiiggggrrrraaaattttiiiioooonnnn SSSScccceeeennnnaaaarrrriiiioooo 0000....5555 MMMMiiiiggggrrrraaaattttiiiioooonnnn SSSScccceeeennnnaaaarrrriiiioooo 1111....0000 MMMMiiiiggggrrrraaaattttiiiioooonnnn SSSScccceeeennnnaaaarrrriiiioooo2222000000000000
AngloBlackHispanicOtherTTTToooottttaaaallll
8,522,1631,653,2864,282,901
506,71111114444,,,,999966665555,,,,000066661111
8,522,1631,653,2864,282,901
506,71111114444,,,,999966665555,,,,000066661111
8,522,1631,653,2864,282,901
506,71111114444,,,,999966665555,,,,000066661111
2222000011110000AngloBlackHispanicOtherTTTToooottttaaaallll
8,910,8691,892,8765,268,387
584,38711116666,,,,666655556666,,,,999966669999
9,084,3101,985,0226,037,391
731,07711117777,,,,888833337777,,,,888800000000
9,261,3052,081,8086,932,569
910,13011119999,,,,111188885555,,,,888811112222
2222000022220000AngloBlackHispanicOtherTTTToooottttaaaallll
9,070,2612,070,7496,326,351656,950
11118888,,,,111122224444,,,,333311111111
9,419,6202,279,8148,175,1651,012,195
22220000,,,,888888886666,,,,777799994444
9,782,8802,510,316
10,659,3661,552,626
22224444,,,,555500005555,,,,111188888888
2222000033330000AngloBlackHispanicOtherTTTToooottttaaaallll
9,048,8542,156,6657,382,497
706,84811119999,,,,222299994444,,,,888866664444
9,571,4722,493,470
10,739,8001,334,716
22224444,,,,111133339999,,,,444455558888
10,124,5472,882,94615,792,6782,504,472
33331111,,,,333300004444,,,,666644443333
2222000044440000AngloBlackHispanicOtherTTTToooottttaaaallll
8,753,2702,164,768
8,285,449710,388
11119999,,,,999911113333,,,,888877775555
9,427,2332,631,877
13,614,5861,651,915
22227777,,,,333322225555,,,,666611111111
10,153,1923,199,756
22,612,7503,810,052
33339999,,,,777777775555,,,,777755550000

33
Resources | The Burden of Overweight & Obesity in Texas: A study by the Texas Department of Health
Table 10: Prevalence (number per 100 persons) of normal weight, overweight and obeseadults by age, sex and race/ethnicity for Texas, 1999-2002
MMMMeeeennnn WWWWoooommmmeeeennnn
RRRRaaaacccceeee////EEEEtttthhhhnnnniiiicccciiiittttyyyy
aaaannnndddd AAAAggggeeee GGGGrrrroooouuuupppp
NNNNoooorrrrmmmmaaaallll
WWWWeeeeiiiigggghhhhtttt OOOOvvvveeeerrrrwwwweeeeiiiigggghhhhtttt OOOObbbbeeeesssseeee
NNNNoooorrrrmmmmaaaallll
WWWWeeeeiiiigggghhhhtttt OOOOvvvveeeerrrrwwwweeeeiiiigggghhhhtttt OOOObbbbeeeesssseeee
AAAAnnnngggglllloooo
18-24
25-44
45-64
65+
All ages
51.8
31.7
24.5
35.5
31.7
35.1
46.7
49.1
46.8
46.5
13.1
21.7
26.4
17.7
21.8
75.1
58.0
45.6
49.9
53.1
16.7
24.8
30.2
32.4
27.9
8.2
17.2
24.2
17.7
18.9
BBBBllllaaaacccckkkk
18-24
25-44
45-64
65+
All ages
41.7
21.9
22.7
34.2
25.8
33.8
44.0
44.4
23.9
41.9
24.5
34.1
32.9
41.9
32.3
49.1
35.5
19.6
33.1
32.7
26.9
30.7
39.0
36.0
33.2
24.0
33.8
41.4
30.9
34.2
HHHHiiiissssppppaaaannnniiiicccc
18-24
25-44
45-64
65+
All ages
50.1
24.0
17.4
26.8
26.3
34.0
46.1
48.6
45.5
45.4
15.9
29.9
34.0
27.7
28.3
58.9
35.4
28.9
29.8
37.3
25.5
33.7
31.8
39.6
32.0
15.5
30.9
39.3
30.6
30.7
OOOOtttthhhheeeerrrr
18-24
25-44
45-64
65+
All ages
59.0
49.2
38.5
62.6
48.9
37.8
37.2
41.8
29.7
38.1
3.2
13.6
19.8
7.7
13.0
81.4
68.2
44.4
50.4
62.5
16.2
21.4
32.4
26.5
23.7
2.3
10.4
23.1
23.0
13.9
OOOOvvvveeeerrrraaaallllllll 33330000....7777 44445555....5555 22223333....8888 44447777....8888 22229999....2222 22223333....0000

34
Resources | The Burden of Overweight & Obesity in Texas: A study by the Texas Department of Health
Table 11A: Prevalence (number per 100 persons) of normal weight, overweight and obeseadults by age, sex and race/ethnicity for Texas, 0.5 migration scenario, 2000
MMMMeeeennnn WWWWoooommmmeeeennnn
RRRRaaaacccceeee////EEEEtttthhhhnnnniiiicccciiiittttyyyy
aaaannnndddd AAAAggggeeee GGGGrrrroooouuuupppp
NNNNoooorrrrmmmmaaaallll
WWWWeeeeiiiigggghhhhtttt OOOOvvvveeeerrrrwwwweeeeiiiigggghhhhtttt OOOObbbbeeeesssseeee
NNNNoooorrrrmmmmaaaallll
WWWWeeeeiiiigggghhhhtttt OOOOvvvveeeerrrrwwwweeeeiiiigggghhhhtttt OOOObbbbeeeesssseeee
AAAAnnnngggglllloooo
18-24
25-44
45-64
65+
All ages
52.7
31.8
24.6
34.7
32.4
34.2
46.6
49.1
47.3
46.0
13.2
21.7
26.4
18.0
21.6
76.2
58.0
45.7
49.3
54.4
16.6
24.8
30.1
33.2
27.3
7.1
17.2
24.2
17.5
18.3
BBBBllllaaaacccckkkk
18-24
25-44
45-64
65+
All ages
47.1
21.9
22.7
35.9
27.7
38.2
44.0
44.4
25.0
41.4
14.7
34.1
32.9
39.1
30.9
48.1
35.5
19.7
35.1
33.3
29.9
30.7
38.8
33.3
33.0
22.1
33.8
41.4
31.5
33.7
HHHHiiiissssppppaaaannnniiiicccc
18-24
25-44
45-64
65+
All ages
46.6
24.0
17.4
25.8
27.7
38.6
46.1
48.6
46.1
45.0
14.8
29.9
33.9
28.1
27.3
60.1
35.5
28.9
33.3
38.6
24.8
33.6
31.8
35.4
31.7
15.1
30.9
39.3
31.3
29.8
OOOOtttthhhheeeerrrr
18-24
25-44
45-64
65+
All ages
61.5
48.6
38.3
55.6
48.3
36.5
37.9
41.8
36.1
38.6
1.9
13.5
19.9
8.3
13.0
84.5
68.0
44.6
48.4
62.4
12.1
21.5
32.2
29.0
23.7
3.4
10.5
23.2
22.6
13.9
OOOOvvvveeeerrrraaaallllllll 33331111....0000 44445555....0000 22224444....0000 44447777....9999 22229999....0000 22223333....1111

35
Resources | The Burden of Overweight & Obesity in Texas: A study by the Texas Department of Health
Table 11B: Prevalence (number per 100 persons) of normal weight, overweight and obeseadults by age, sex and race/ethnicity for Texas, 0.5 migration scenario, 2010
MMMMeeeennnn WWWWoooommmmeeeennnn
RRRRaaaacccceeee////EEEEtttthhhhnnnniiiicccciiiittttyyyy
aaaannnndddd AAAAggggeeee GGGGrrrroooouuuupppp
NNNNoooorrrrmmmmaaaallll
WWWWeeeeiiiigggghhhhtttt OOOOvvvveeeerrrrwwwweeeeiiiigggghhhhtttt OOOObbbbeeeesssseeee
NNNNoooorrrrmmmmaaaallll
WWWWeeeeiiiigggghhhhtttt OOOOvvvveeeerrrrwwwweeeeiiiigggghhhhtttt OOOObbbbeeeesssseeee
AAAAnnnngggglllloooo
18-24
25-44
45-64
65+
All ages
48.2
26.9
20.4
31.3
27.8
35.4
47.5
49.1
48.4
46.8
16.5
25.7
30.5
20.4
25.5
73.9
54.2
41.9
46.2
50.2
17.2
25.3
30.2
33.9
28.0
8.9
20.5
27.9
19.8
21.8
BBBBllllaaaacccckkkk
18-24
25-44
45-64
65+
All ages
42.0
14.0
17.6
30.2
21.5
39.6
44.7
44.8
25.6
42.2
18.4
41.4
37.5
44.2
36.3
41.4
28.3
13.0
30.2
25.5
30.9
31.6
39.2
34.1
34.3
27.7
40.1
47.8
35.7
40.2
HHHHiiiissssppppaaaannnniiiicccc
18-24
25-44
45-64
65+
All ages
41.5
16.7
12.3
21.0
20.2
39.9
47.4
48.8
47.1
46.4
18.6
35.9
38.9
31.9
33.4
55.5
28.3
22.5
28.4
31.4
25.6
34.6
31.9
36.1
32.5
18.9
37.1
45.6
35.5
36.1
OOOOtttthhhheeeerrrr
18-24
25-44
45-64
65+
All ages
59.8
44.1
36.2
53.6
44.3
37.8
40.0
41.3
36.9
39.8
2.4
16.0
22.5
9.4
15.8
83.2
64.1
40.7
44.7
55.7
12.5
23.1
32.6
29.7
26.0
4.3
12.8
26.7
25.6
18.3
OOOOvvvveeeerrrraaaallllllll 22225555....1111 44445555....9999 22229999....0000 44441111....1111 33330000....1111 22228888....5555
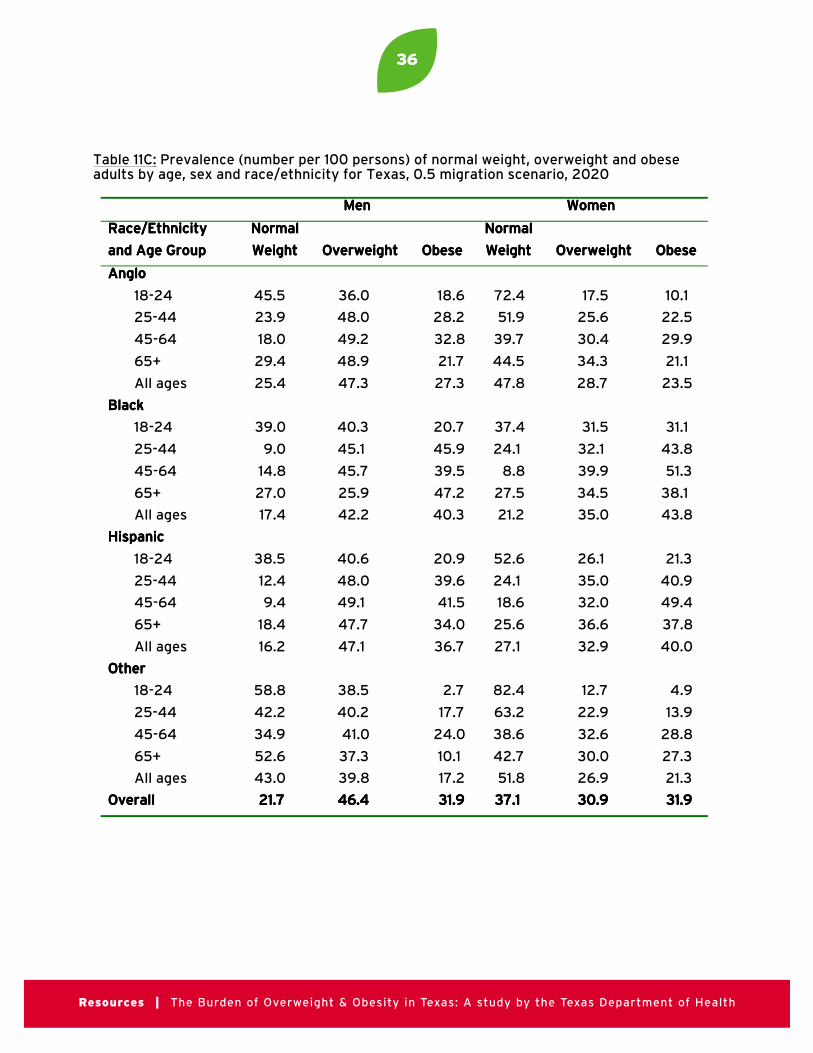
36
Resources | The Burden of Overweight & Obesity in Texas: A study by the Texas Department of Health
Table 11C: Prevalence (number per 100 persons) of normal weight, overweight and obeseadults by age, sex and race/ethnicity for Texas, 0.5 migration scenario, 2020
MMMMeeeennnn WWWWoooommmmeeeennnn
RRRRaaaacccceeee////EEEEtttthhhhnnnniiiicccciiiittttyyyy
aaaannnndddd AAAAggggeeee GGGGrrrroooouuuupppp
NNNNoooorrrrmmmmaaaallll
WWWWeeeeiiiigggghhhhtttt OOOOvvvveeeerrrrwwwweeeeiiiigggghhhhtttt OOOObbbbeeeesssseeee
NNNNoooorrrrmmmmaaaallll
WWWWeeeeiiiigggghhhhtttt OOOOvvvveeeerrrrwwwweeeeiiiigggghhhhtttt OOOObbbbeeeesssseeee
AAAAnnnngggglllloooo
18-24
25-44
45-64
65+
All ages
45.5
23.9
18.0
29.4
25.4
36.0
48.0
49.2
48.9
47.3
18.6
28.2
32.8
21.7
27.3
72.4
51.9
39.7
44.5
47.8
17.5
25.6
30.4
34.3
28.7
10.1
22.5
29.9
21.1
23.5
BBBBllllaaaacccckkkk
18-24
25-44
45-64
65+
All ages
39.0
9.0
14.8
27.0
17.4
40.3
45.1
45.7
25.9
42.2
20.7
45.9
39.5
47.2
40.3
37.4
24.1
8.8
27.5
21.2
31.5
32.1
39.9
34.5
35.0
31.1
43.8
51.3
38.1
43.8
HHHHiiiissssppppaaaannnniiiicccc
18-24
25-44
45-64
65+
All ages
38.5
12.4
9.4
18.4
16.2
40.6
48.0
49.1
47.7
47.1
20.9
39.6
41.5
34.0
36.7
52.6
24.1
18.6
25.6
27.1
26.1
35.0
32.0
36.6
32.9
21.3
40.9
49.4
37.8
40.0
OOOOtttthhhheeeerrrr
18-24
25-44
45-64
65+
All ages
58.8
42.2
34.9
52.6
43.0
38.5
40.2
41.0
37.3
39.8
2.7
17.7
24.0
10.1
17.2
82.4
63.2
38.6
42.7
51.8
12.7
22.9
32.6
30.0
26.9
4.9
13.9
28.8
27.3
21.3
OOOOvvvveeeerrrraaaallllllll 22221111....7777 44446666....4444 33331111....9999 33337777....1111 33330000....9999 33331111....9999

37
Resources | The Burden of Overweight & Obesity in Texas: A study by the Texas Department of Health
Table 11D: Prevalence (number per 100 persons) of normal weight, overweight and obeseadults by age, sex and race/ethnicity for Texas, 0.5 migration scenario, 2030
MMMMeeeennnn WWWWoooommmmeeeennnn
RRRRaaaacccceeee////EEEEtttthhhhnnnniiiicccciiiittttyyyy
aaaannnndddd AAAAggggeeee GGGGrrrroooouuuupppp
NNNNoooorrrrmmmmaaaallll
WWWWeeeeiiiigggghhhhtttt OOOOvvvveeeerrrrwwwweeeeiiiigggghhhhtttt OOOObbbbeeeesssseeee
NNNNoooorrrrmmmmaaaallll
WWWWeeeeiiiigggghhhhtttt OOOOvvvveeeerrrrwwwweeeeiiiigggghhhhtttt OOOObbbbeeeesssseeee
AAAAnnnngggglllloooo
18-24
25-44
45-64
65+
All ages
44.0
22.0
16.8
28.4
24.4
36.3
48.5
49.1
49.2
47.6
19.7
29.6
34.1
22.4
27.9
71.6
50.6
38.5
43.6
46.8
17.7
25.8
30.3
34.5
29.2
10.7
23.6
31.2
21.8
24.1
BBBBllllaaaacccckkkk
18-24
25-44
45-64
65+
All ages
37.3
6.6
13.2
25.3
15.7
40.6
46.0
45.3
26.0
41.8
22.1
47.4
41.4
48.7
42.5
35.2
21.6
6.9
26.0
19.5
31.7
32.1
39.7
34.7
35.0
33.1
46.3
53.4
39.3
45.5
HHHHiiiissssppppaaaannnniiiicccc
18-24
25-44
45-64
65+
All ages
36.8
10.1
7.9
17.0
14.3
41.0
48.3
49.2
47.9
47.4
22.2
41.6
43.0
35.1
38.3
51.1
21.8
16.5
24.2
24.9
26.3
35.3
32.1
36.8
33.2
22.6
43.0
51.4
39.1
41.9
OOOOtttthhhheeeerrrr
18-24
25-44
45-64
65+
All ages
58.3
41.2
35.4
52.1
43.4
38.8
40.1
40.4
37.5
39.5
2.9
18.7
24.2
10.4
17.1
82.0
62.8
37.2
41.6
49.9
12.8
22.7
33.0
30.2
27.4
5.2
14.5
29.8
28.2
22.7
OOOOvvvveeeerrrraaaallllllll 22220000....0000 44446666....5555 33333333....5555 33334444....6666 33331111....4444 33334444....0000

38
Resources | The Burden of Overweight & Obesity in Texas: A study by the Texas Department of Health
Table 11E: Prevalence (number per 100 persons) of normal weight, overweight and obeseadults by age, sex and race/ethnicity for Texas, 0.5 migration scenario, 2040
MMMMeeeennnn WWWWoooommmmeeeennnn
RRRRaaaacccceeee////EEEEtttthhhhnnnniiiicccciiiittttyyyy
aaaannnndddd AAAAggggeeee GGGGrrrroooouuuupppp
NNNNoooorrrrmmmmaaaallll
WWWWeeeeiiiigggghhhhtttt OOOOvvvveeeerrrrwwwweeeeiiiigggghhhhtttt OOOObbbbeeeesssseeee
NNNNoooorrrrmmmmaaaallll
WWWWeeeeiiiigggghhhhtttt OOOOvvvveeeerrrrwwwweeeeiiiigggghhhhtttt OOOObbbbeeeesssseeee
AAAAnnnngggglllloooo
18-24
25-44
45-64
65+
All ages
43.2
21.1
16.2
27.9
23.7
36.4
48.6
49.0
49.3
47.8
20.4
30.3
34.8
22.8
28.6
71.2
49.9
37.9
43.2
46.0
17.8
25.9
30.2
34.6
29.4
11.0
24.2
31.8
22.2
24.7
BBBBllllaaaacccckkkk
18-24
25-44
45-64
65+
All ages
36.5
5.1
12.4
24.4
14.9
40.8
46.0
45.2
26.1
41.5
22.8
48.8
42.4
49.5
43.6
34.0
20.4
6.0
25.3
18.2
31.9
32.3
39.5
34.8
35.2
34.2
47.4
54.5
40.0
46.6
HHHHiiiissssppppaaaannnniiiicccc
18-24
25-44
45-64
65+
All ages
35.9
8.9
7.2
16.3
13.2
41.2
48.5
49.4
48.1
47.7
22.9
42.6
43.3
35.7
39.1
50.2
20.6
15.4
23.4
23.6
26.4
35.4
32.1
36.9
33.5
23.4
44.0
52.5
39.7
43.0
OOOOtttthhhheeeerrrr
18-24
25-44
45-64
65+
All ages
58.0
40.4
34.6
51.8
43.6
39.0
40.6
40.5
37.7
39.5
3.0
19.0
24.8
10.6
16.9
81.8
61.9
36.7
41.1
48.7
12.9
23.2
32.8
30.3
27.7
5.3
14.9
30.4
28.6
23.6
OOOOvvvveeeerrrraaaallllllll 11118888....7777 44446666....7777 33334444....6666 33332222....5555 33331111....8888 33335555....7777

39
Resources | The Burden of Overweight & Obesity in Texas: A study by the Texas Department of Health
Table 12: Number (in millions) and prevalence (%) of normal weight, overweight and obese
Texas adults by population migration scenario, 2000-2040
YYYYeeeeaaaarrrr BBBBaaaasssseeeelllliiiinnnneeeePPPPrrrreeeevvvvaaaalllleeeennnncccceeee**** NNNN ((((%%%%))))
0000 MMMMiiiiggggrrrraaaattttiiiioooonnnnSSSScccceeeennnnaaaarrrriiiioooo NNNN ((((%%%%))))
0000....5555 MMMMiiiiggggrrrraaaattttiiiioooonnnnSSSScccceeeennnnaaaarrrriiiioooo NNNN ((((%%%%))))
1111....0000 MMMMiiiiggggrrrraaaattttiiiioooonnnnSSSScccceeeennnnaaaarrrriiiioooo NNNN ((((%%%%))))
2222000000000000Normal weightOverweightObese
5.9 (39.6%)5.5 (36.8%)3.5 (23.5%)
5.9 (39.6%)5.5 (36.8%)3.5 (23.5%)
5.9 (39.6%)5.5 (36.8%)3.5 (23.5%)
5.9 (39.6%)5.5 (36.8%)3.5 (23.5%)
2222000011110000Normal weightOverweightObese
6.8 (38.3%)6.6 (37.3%)4.3 (24.4%)
5.6 (33.4%)6.3 (37.9%)4.8 (28.6%)
5.9 (33.3%)6.8 (37.9%)5.1 (28.7%)
6.4 (33.2%)7.3 (38.0%)5.5 (28.8%)
2222000022220000Normal weightOverweightObese
7.8 (37.4%)7.9 (37.7%)5.2 (24.9%)
5.4 (29.9%)7.0 (38.5%)5.7 (31.5%)
6.1 (29.4%)8.1 (38.6%)6.7 (31.9%)
7.1 (29.0%)9.5 (38.7%)7.9 (32.3%)
2222000033330000Normal weightOverweightObese
8.9 (36.8%)9.1 (37.9%)6.1 (25.3%)
5.4 (28.0%)7.5 (38.9%)6.4 (33.1%)
6.6 (27.2%)9.4 (39.0%)8.1 (33.8%)
8.3 (26.5%)12.2 (39.1%)10.8 (34.4%)
2222000044440000Normal weightOverweightObese
9.9 (36.1%)10.4 (37.9%)7.1 (25.9%)
5.3 (26.7%)7.8 (39.1%)6.8 (34.2%)
7.0 (25.6%)10.7 (39.3%)9.6 (35.2%)
9.9 (24.8%)15.7 (39.4%)14.2 (35.8%)
*In this scenario, the prevalence of normal weight, overweight and obesity among Texasadults was not changed, and the 0.5 population migration scenario was used to projectpopulation changes

40
Resources | The Burden of Overweight & Obesity in Texas: A study by the Texas Department of Health
Table 13A: Number of normal weight, overweight and obese adults by age, sex andrace/ethnicity for Texas, 0.5 migration scenario, 2000
MMMMeeeennnn WWWWoooommmmeeeennnn
RRRRaaaacccceeee////EEEEtttthhhhnnnniiiicccciiiittttyyyy
aaaannnndddd AAAAggggeeee GGGGrrrroooouuuupppp
NNNNoooorrrrmmmmaaaallll
WWWWeeeeiiiigggghhhhtttt OOOOvvvveeeerrrrwwwweeeeiiiigggghhhhtttt OOOObbbbeeeesssseeee
NNNNoooorrrrmmmmaaaallll
WWWWeeeeiiiigggghhhhtttt OOOOvvvveeeerrrrwwwweeeeiiiigggghhhhtttt OOOObbbbeeeesssseeee
AAAAnnnngggglllloooo
18-24
25-44
45-64
65+
All ages
259,640
531,595
328,779
219,964
1,339,978
168,361
779,834
657,312
299,430
1,904,937
64,910
362,423
353,070
113,796
894,199
364,743
960,048
623,844
435,239
2,383,874
79,596
410,905
411,786
293,078
1,195,365
34,112
284,717
330,458
154,523
803,810
BBBBllllaaaacccckkkk
18-24
25-44
45-64
65+
All ages
63,419
82,064
45,459
24,447
215,389
51,528
164,652
89,041
17,007
322,228
19,819
127,668
65,882
26,573
239,942
65,271
143,248
45,136
37,956
291,611
40,574
123,853
88,730
36,009
289,166
29,990
136,202
94,695
34,063
294,950
HHHHiiiissssppppaaaannnniiiicccc
18-24
25-44
45-64
65+
All ages
219,279
264,582
79,472
37,749
601,082
181,522
507,819
221,522
67,490
978,353
69,705
328,981
154,517
41,181
594,384
246,446
361,060
139,343
66,739
813,588
101,477
342,203
153,088
70,783
667,551
61,852
314,100
189,297
62,694
627,943
OOOOtttthhhheeeerrrr
18-24
25-44
45-64
65+
All ages
24,354
62,187
25,114
8,080
119,735
14,460
48,571
27,430
5,252
95,713
761
17,244
13,020
1,212
32,237
31,311
88,658
32,245
9,322
161,536
4,473
28,053
23,310
5,594
61,430
1,278
13,654
16,777
4,351
36,060
OOOOvvvveeeerrrraaaallllllll 2222,,,,222277776666,,,,111188884444 3333,,,,333300001111,,,,222233331111 1111,,,,777766660000,,,,777766662222 3333,,,,666655550000,,,,666600009999 2222,,,,222211113333,,,,555511112222 1111,,,,777766662222,,,,777766663333
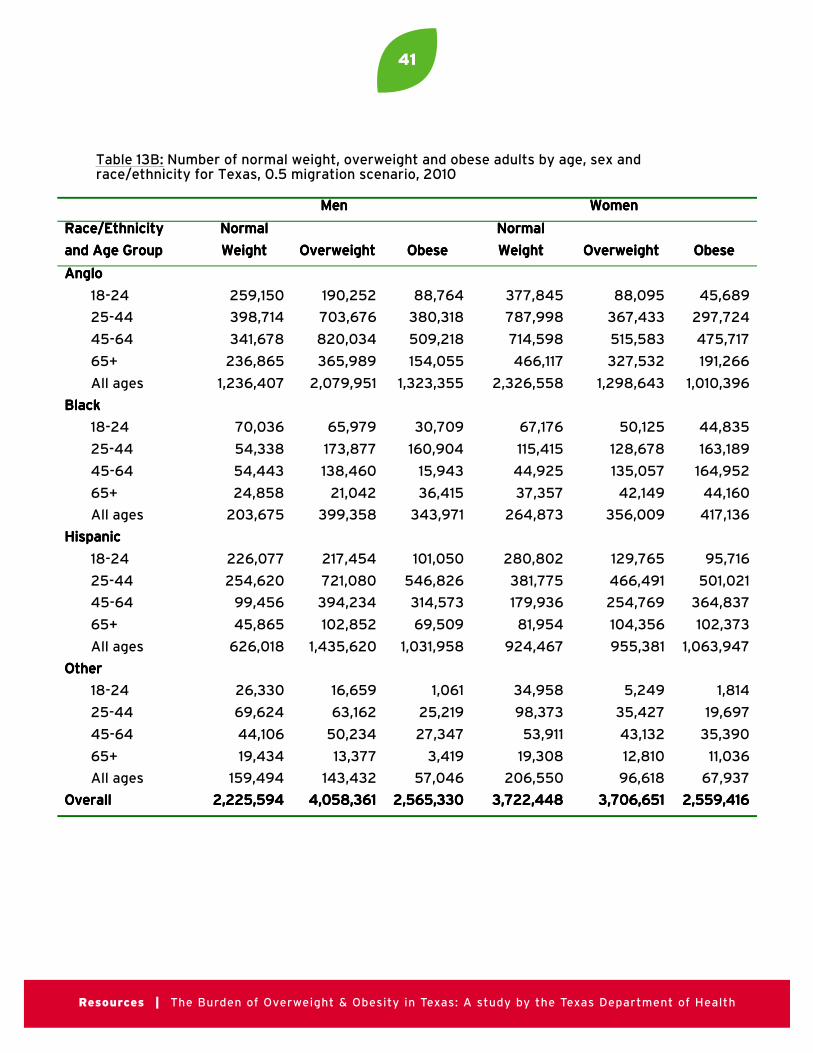
41
Resources | The Burden of Overweight & Obesity in Texas: A study by the Texas Department of Health
Table 13B: Number of normal weight, overweight and obese adults by age, sex andrace/ethnicity for Texas, 0.5 migration scenario, 2010
MMMMeeeennnn WWWWoooommmmeeeennnn
RRRRaaaacccceeee////EEEEtttthhhhnnnniiiicccciiiittttyyyy
aaaannnndddd AAAAggggeeee GGGGrrrroooouuuupppp
NNNNoooorrrrmmmmaaaallll
WWWWeeeeiiiigggghhhhtttt OOOOvvvveeeerrrrwwwweeeeiiiigggghhhhtttt OOOObbbbeeeesssseeee
NNNNoooorrrrmmmmaaaallll
WWWWeeeeiiiigggghhhhtttt OOOOvvvveeeerrrrwwwweeeeiiiigggghhhhtttt OOOObbbbeeeesssseeee
AAAAnnnngggglllloooo
18-24
25-44
45-64
65+
All ages
259,150
398,714
341,678
236,865
1,236,407
190,252
703,676
820,034
365,989
2,079,951
88,764
380,318
509,218
154,055
1,323,355
377,845
787,998
714,598
466,117
2,326,558
88,095
367,433
515,583
327,532
1,298,643
45,689
297,724
475,717
191,266
1,010,396
BBBBllllaaaacccckkkk
18-24
25-44
45-64
65+
All ages
70,036
54,338
54,443
24,858
203,675
65,979
173,877
138,460
21,042
399,358
30,709
160,904
15,943
36,415
343,971
67,176
115,415
44,925
37,357
264,873
50,125
128,678
135,057
42,149
356,009
44,835
163,189
164,952
44,160
417,136
HHHHiiiissssppppaaaannnniiiicccc
18-24
25-44
45-64
65+
All ages
226,077
254,620
99,456
45,865
626,018
217,454
721,080
394,234
102,852
1,435,620
101,050
546,826
314,573
69,509
1,031,958
280,802
381,775
179,936
81,954
924,467
129,765
466,491
254,769
104,356
955,381
95,716
501,021
364,837
102,373
1,063,947
OOOOtttthhhheeeerrrr
18-24
25-44
45-64
65+
All ages
26,330
69,624
44,106
19,434
159,494
16,659
63,162
50,234
13,377
143,432
1,061
25,219
27,347
3,419
57,046
34,958
98,373
53,911
19,308
206,550
5,249
35,427
43,132
12,810
96,618
1,814
19,697
35,390
11,036
67,937
OOOOvvvveeeerrrraaaallllllll 2222,,,,222222225555,,,,555599994444 4444,,,,000055558888,,,,333366661111 2222,,,,555566665555,,,,333333330000 3333,,,,777722222222,,,,444444448888 3333,,,,777700006666,,,,666655551111 2222,,,,555555559999,,,,444411116666
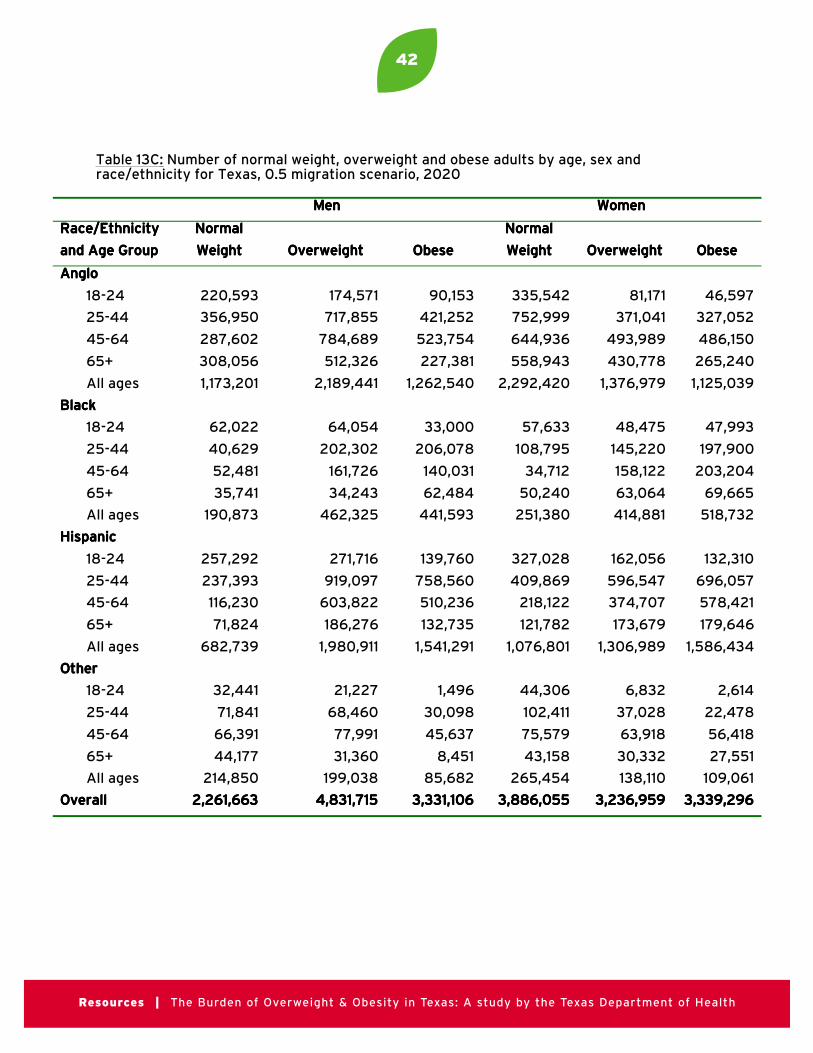
42
Resources | The Burden of Overweight & Obesity in Texas: A study by the Texas Department of Health
Table 13C: Number of normal weight, overweight and obese adults by age, sex andrace/ethnicity for Texas, 0.5 migration scenario, 2020
MMMMeeeennnn WWWWoooommmmeeeennnn
RRRRaaaacccceeee////EEEEtttthhhhnnnniiiicccciiiittttyyyy
aaaannnndddd AAAAggggeeee GGGGrrrroooouuuupppp
NNNNoooorrrrmmmmaaaallll
WWWWeeeeiiiigggghhhhtttt OOOOvvvveeeerrrrwwwweeeeiiiigggghhhhtttt OOOObbbbeeeesssseeee
NNNNoooorrrrmmmmaaaallll
WWWWeeeeiiiigggghhhhtttt OOOOvvvveeeerrrrwwwweeeeiiiigggghhhhtttt OOOObbbbeeeesssseeee
AAAAnnnngggglllloooo
18-24
25-44
45-64
65+
All ages
220,593
356,950
287,602
308,056
1,173,201
174,571
717,855
784,689
512,326
2,189,441
90,153
421,252
523,754
227,381
1,262,540
335,542
752,999
644,936
558,943
2,292,420
81,171
371,041
493,989
430,778
1,376,979
46,597
327,052
486,150
265,240
1,125,039
BBBBllllaaaacccckkkk
18-24
25-44
45-64
65+
All ages
62,022
40,629
52,481
35,741
190,873
64,054
202,302
161,726
34,243
462,325
33,000
206,078
140,031
62,484
441,593
57,633
108,795
34,712
50,240
251,380
48,475
145,220
158,122
63,064
414,881
47,993
197,900
203,204
69,665
518,732
HHHHiiiissssppppaaaannnniiiicccc
18-24
25-44
45-64
65+
All ages
257,292
237,393
116,230
71,824
682,739
271,716
919,097
603,822
186,276
1,980,911
139,760
758,560
510,236
132,735
1,541,291
327,028
409,869
218,122
121,782
1,076,801
162,056
596,547
374,707
173,679
1,306,989
132,310
696,057
578,421
179,646
1,586,434
OOOOtttthhhheeeerrrr
18-24
25-44
45-64
65+
All ages
32,441
71,841
66,391
44,177
214,850
21,227
68,460
77,991
31,360
199,038
1,496
30,098
45,637
8,451
85,682
44,306
102,411
75,579
43,158
265,454
6,832
37,028
63,918
30,332
138,110
2,614
22,478
56,418
27,551
109,061
OOOOvvvveeeerrrraaaallllllll 2222,,,,222266661111,,,,666666663333 4444,,,,888833331111,,,,777711115555 3333,,,,333333331111,,,,111100006666 3333,,,,888888886666,,,,000055555555 3333,,,,222233336666,,,,999955559999 3333,,,,333333339999,,,,222299996666

43
Resources | The Burden of Overweight & Obesity in Texas: A study by the Texas Department of Health
Table 13D: Number of normal weight, overweight and obese adults by age, sex andrace/ethnicity for Texas, 0.5 migration scenario, 2030
MMMMeeeennnn WWWWoooommmmeeeennnn
RRRRaaaacccceeee////EEEEtttthhhhnnnniiiicccciiiittttyyyy
aaaannnndddd AAAAggggeeee GGGGrrrroooouuuupppp
NNNNoooorrrrmmmmaaaallll
WWWWeeeeiiiigggghhhhtttt OOOOvvvveeeerrrrwwwweeeeiiiigggghhhhtttt OOOObbbbeeeesssseeee
NNNNoooorrrrmmmmaaaallll
WWWWeeeeiiiigggghhhhtttt OOOOvvvveeeerrrrwwwweeeeiiiigggghhhhtttt OOOObbbbeeeesssseeee
AAAAnnnngggglllloooo
18-24
25-44
45-64
65+
All ages
207,682
322,251
239,621
378,486
1,148,040
171,401
710,777
699,329
655,158
2,236,665
93,289
433,900
486,773
298,724
1,312,686
326,257
717,333
553,111
683,108
2,279,809
80,491
366,068
434,175
540,274
1,421,008
48,698
335,274
447,537
341,755
1,173,264
BBBBllllaaaacccckkkk
18-24
25-44
45-64
65+
All ages
57,538
31,157
49,065
50,683
188,443
62,610
218,463
167,917
52,133
501,123
33,994
225,293
153,478
97,728
510,493
52,208
102,129
27,633
70,116
252,086
47,120
151,889
159,877
93,463
452,349
49,167
219,003
214,734
106,072
588,976
HHHHiiiissssppppaaaannnniiiicccc
18-24
25-44
45-64
65+
All ages
304,178
232,791
134,415
117,966
789,350
338,790
1,112,738
837,105
332,912
2,621,545
183,655
957,573
731,540
243,710
2,116,478
393,268
458,699
256,198
188,687
1,296,852
202,641
743,259
498,771
286,932
1,731,603
174,364
904,983
799,720
304,905
2,183,972
OOOOtttthhhheeeerrrr
18-24
25-44
45-64
65+
All ages
36,876
83,531
82,979
82,436
285,822
24,552
81,407
94,821
59,465
260,245
1,824
37,926
56,778
16,464
112,992
50,150
123,283
85,872
78,033
337,338
7,841
44,622
76,130
56,571
185,164
3,162
28,409
68,795
52,789
153,155
OOOOvvvveeeerrrraaaallllllll 2222,,,,444411111111,,,,666655555555 5555,,,,666611119999,,,,555577778888 4444,,,,000055552222,,,,666644449999 4444,,,,111166666666,,,,000088885555 3333,,,,777799990000,,,,111122224444 4444,,,,000099999999,,,,333366667777
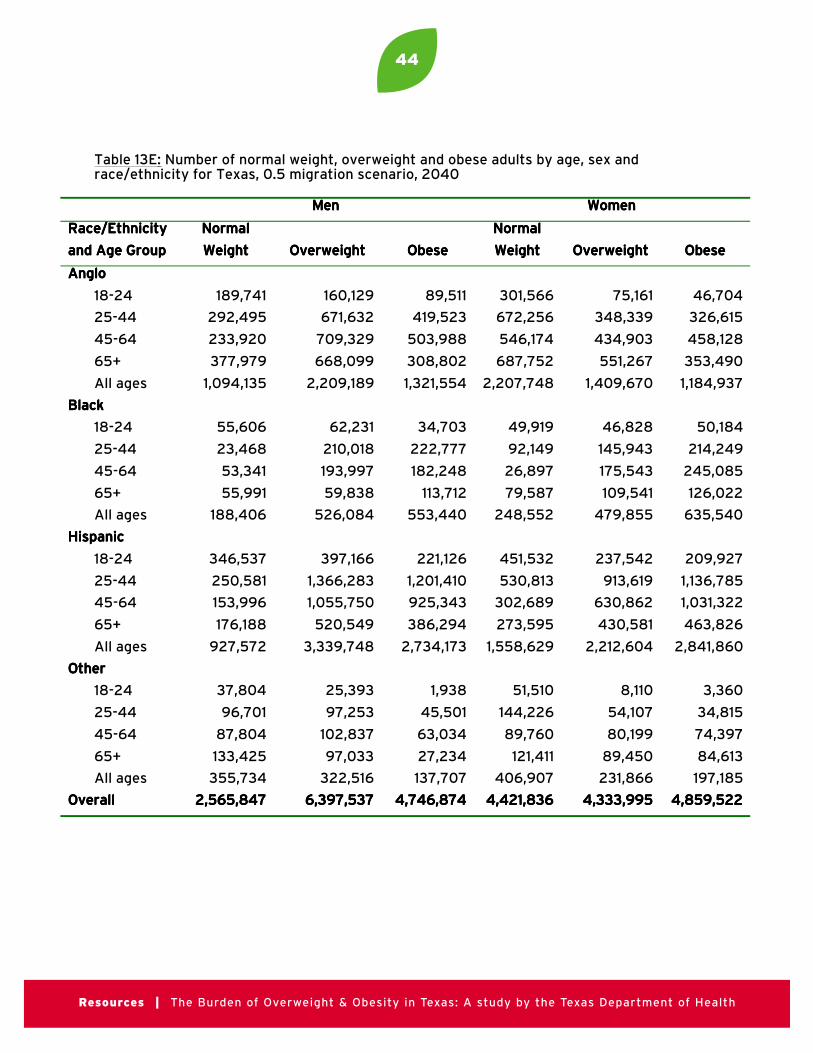
44
Resources | The Burden of Overweight & Obesity in Texas: A study by the Texas Department of Health
Table 13E: Number of normal weight, overweight and obese adults by age, sex andrace/ethnicity for Texas, 0.5 migration scenario, 2040
MMMMeeeennnn WWWWoooommmmeeeennnn
RRRRaaaacccceeee////EEEEtttthhhhnnnniiiicccciiiittttyyyy
aaaannnndddd AAAAggggeeee GGGGrrrroooouuuupppp
NNNNoooorrrrmmmmaaaallll
WWWWeeeeiiiigggghhhhtttt OOOOvvvveeeerrrrwwwweeeeiiiigggghhhhtttt OOOObbbbeeeesssseeee
NNNNoooorrrrmmmmaaaallll
WWWWeeeeiiiigggghhhhtttt OOOOvvvveeeerrrrwwwweeeeiiiigggghhhhtttt OOOObbbbeeeesssseeee
AAAAnnnngggglllloooo
18-24
25-44
45-64
65+
All ages
189,741
292,495
233,920
377,979
1,094,135
160,129
671,632
709,329
668,099
2,209,189
89,511
419,523
503,988
308,802
1,321,554
301,566
672,256
546,174
687,752
2,207,748
75,161
348,339
434,903
551,267
1,409,670
46,704
326,615
458,128
353,490
1,184,937
BBBBllllaaaacccckkkk
18-24
25-44
45-64
65+
All ages
55,606
23,468
53,341
55,991
188,406
62,231
210,018
193,997
59,838
526,084
34,703
222,777
182,248
113,712
553,440
49,919
92,149
26,897
79,587
248,552
46,828
145,943
175,543
109,541
479,855
50,184
214,249
245,085
126,022
635,540
HHHHiiiissssppppaaaannnniiiicccc
18-24
25-44
45-64
65+
All ages
346,537
250,581
153,996
176,188
927,572
397,166
1,366,283
1,055,750
520,549
3,339,748
221,126
1,201,410
925,343
386,294
2,734,173
451,532
530,813
302,689
273,595
1,558,629
237,542
913,619
630,862
430,581
2,212,604
209,927
1,136,785
1,031,322
463,826
2,841,860
OOOOtttthhhheeeerrrr
18-24
25-44
45-64
65+
All ages
37,804
96,701
87,804
133,425
355,734
25,393
97,253
102,837
97,033
322,516
1,938
45,501
63,034
27,234
137,707
51,510
144,226
89,760
121,411
406,907
8,110
54,107
80,199
89,450
231,866
3,360
34,815
74,397
84,613
197,185
OOOOvvvveeeerrrraaaallllllll 2222,,,,555566665555,,,,888844447777 6666,,,,333399997777,,,,555533337777 4444,,,,777744446666,,,,888877774444 4444,,,,444422221111,,,,888833336666 4444,,,,333333333333,,,,999999995555 4444,,,,888855559999,,,,555522222222

45
Resources | The Burden of Overweight & Obesity in Texas: A study by the Texas Department of Health
Table 14: Estimated annual costs ($ Billions) of overweight and obesity among Texas adults,2000-2040
YYYYeeeeaaaarrrr BBBBaaaasssseeeelllliiiinnnneeeePPPPrrrreeeevvvvaaaalllleeeennnncccceeee****
0000 MMMMiiiiggggrrrraaaattttiiiioooonnnnSSSScccceeeennnnaaaarrrriiiioooo
0000....5555 MMMMiiiiggggrrrraaaattttiiiioooonnnnSSSScccceeeennnnaaaarrrriiiioooo
1111....0000 MMMMiiiiggggrrrraaaattttiiiioooonnnnSSSScccceeeennnnaaaarrrriiiioooo
2222000000000000OverweightObeseTTTToooottttaaaallll
$2.4$7.9
$10.3
$2.4$7.9
$10.3
$2.4$7.9
$10.3
$2.4$7.9
$10.32222000011110000
OverweightObeseTTTToooottttaaaallll
$2.9$9.8
$12.7
$2.8$10.7$13.5
$3.0$11.5
$14.5
$3.2$12.4$15.6
2222000022220000OverweightObeseTTTToooottttaaaallll
$3.5$11.7
$15.2
$3.1$12.8$15.9
$3.6$15.0$18.6
$4.2$17.8
$22.02222000033330000
OverweightObeseTTTToooottttaaaallll
$4.0$13.8$17.8
$3.3$14.4$17.7
$4.1$18.3$22.5
$5.4$24.2$29.6
2222000044440000OverweightObeseTTTToooottttaaaallll
$4.6$15.9
$20.5
$3.4$15.3$18.8
$4.7$21.6
$26.3
$6.9$32.1$39.0
*In this scenario, the prevalence of normal weight, overweight and obesity among Texasadults was not changed, and the 0.5 population migration scenario was used to projectpopulation changes
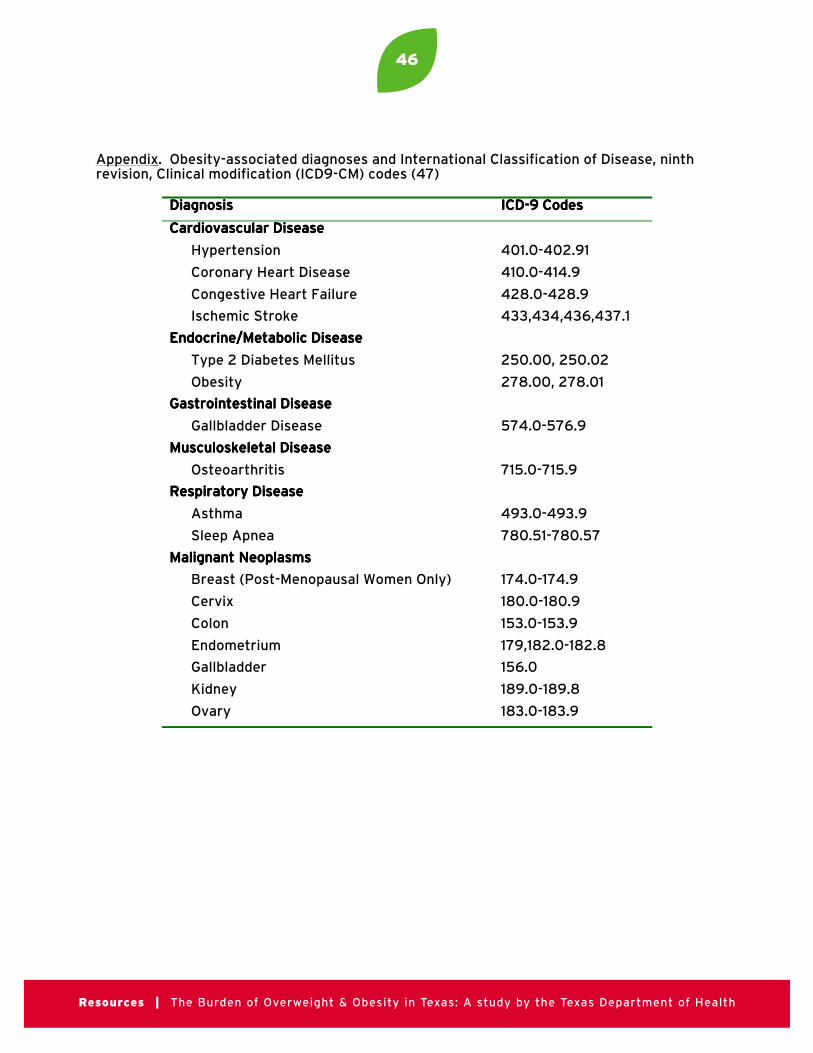
46
Resources | The Burden of Overweight & Obesity in Texas: A study by the Texas Department of Health
Appendix . Obesity-associated diagnoses and International Classification of Disease, ninthrevision, Clinical modification (ICD9-CM) codes (47)
DDDDiiiiaaaaggggnnnnoooossssiiiissss IIIICCCCDDDD----9999 CCCCooooddddeeeessss
CCCCaaaarrrrddddiiiioooovvvvaaaassssccccuuuullllaaaarrrr DDDDiiiisssseeeeaaaasssseeee
Hypertension 401.0-402.91
Coronary Heart Disease 410.0-414.9
Congestive Heart Failure 428.0-428.9
Ischemic Stroke 433,434,436,437.1
EEEEnnnnddddooooccccrrrriiiinnnneeee////MMMMeeeettttaaaabbbboooolllliiiicccc DDDDiiiisssseeeeaaaasssseeee
Type 2 Diabetes Mellitus 250.00, 250.02
Obesity 278.00, 278.01
GGGGaaaassssttttrrrrooooiiiinnnntttteeeessssttttiiiinnnnaaaallll DDDDiiiisssseeeeaaaasssseeee
Gallbladder Disease 574.0-576.9
MMMMuuuussssccccuuuulllloooosssskkkkeeeelllleeeettttaaaallll DDDDiiiisssseeeeaaaasssseeee
Osteoarthritis 715.0-715.9
RRRReeeessssppppiiiirrrraaaattttoooorrrryyyy DDDDiiiisssseeeeaaaasssseeee
Asthma 493.0-493.9
Sleep Apnea 780.51-780.57
MMMMaaaalllliiiiggggnnnnaaaannnntttt NNNNeeeeooooppppllllaaaassssmmmmssss
Breast (Post-Menopausal Women Only) 174.0-174.9
Cervix 180.0-180.9
Colon 153.0-153.9
Endometrium 179,182.0-182.8
Gallbladder 156.0
Kidney 189.0-189.8
Ovary 183.0-183.9
47
Resources | The Burden of Overweight & Obesity in Texas: A study by the Texas Department of Health
PROJECT STAFF
PRINCIPAL INVESTIGATOR
Margaret E. McCusker, MD, MSEpidemic Intelligence ServiceCenters for Disease Control and PreventionTexas Department of Health
CO-INVESTIGATORS
Eduardo J. Sanchez, MD, MPHTexas Commissioner of HealthTexas Department of Health
Steven H. Murdock, PhDTexas State Demographer
Texas State Data Center and Office of the State Demographer
Institute for Demographic and SocioeconomicResearch, University of Texas at San Antonio
Nazrul Hoque, PhDTexas State Data Center and Office of the State Demographer
Institute for Demographic and SocioeconomicResearch, University of Texas at San Antonio
Philip P. Huang, MD, MPHChief, Bureau of Chronic Disease and TobaccoPrevention, Texas Department of Health
TEXAS DEPARTMENT OF HEALTH OBESITY STUDY GROUP MEMBERS
David C. Warner, PhDProfessor of Public Affairs
Lyndon B. Johnson School of Public Affairs,The University of Texas at Austin
Steven H. Kelder, MPH, PhDAssociate Professor of Epidemiology & BehavioralScience, University of Texas Health Science Centerat Houston School of Public Health
Peter Hilsenrath, PhDProfessor of Health Management and Policy, University of North Texas Health Science CenterSchool of Public Health
Rick Danko, Dr. PHOffice of Executive SupportTexas Department of Health
Donna C. Nichols, MSEd, CHESOffice of Executive SupportTexas Department of Health
TEXAS DEPARTMENT OF AGRICULTURE
Susan CombsCommissioner
Food and Nutrition Division(888) TEX-KIDSwww.squaremeals.org
TEXAS BEHAVIORAL RISK FACTOR SURVEILLANCE SYSTEM
Jimmy BlantonCenter for Health StatisticsTexas Department of Health
Community Assessment TeamCenter for Health StatisticsTexas Department of Health
Related Documents