United States Department of Agriculture Forest Service Pacific Southwest Research Station General Technical Report PSW-GTR-213 January 2009 Historical Growth Plots in the Pacific Southwest Lawrence A. Rabin, William W. Oliver, Robert F. Powers, Martin W. Ritchie, Matt D. Busse, Eric E. Knapp

Welcome message from author
This document is posted to help you gain knowledge. Please leave a comment to let me know what you think about it! Share it to your friends and learn new things together.
Transcript

United StatesDepartment ofAgriculture
Forest Service
Pacific SouthwestResearch Station
General TechnicalReportPSW-GTR-213
January 2009
Historical Growth Plots in thePacific SouthwestLawrence A. Rabin, William W. Oliver, Robert F. Powers,Martin W. Ritchie, Matt D. Busse, Eric E. Knapp

The Forest Service of the U.S. Department of Agriculture is dedicated to theprinciple of multiple use management of the Nation’s forest resources for sus-tained yields of wood, water, forage, wildlife, and recreation. Through forestryresearch, cooperation with the States and private forest owners, and manage-ment of the national forests and national grasslands, it strives—as directed byCongress—to provide increasingly greater service to a growing Nation.
The U.S. Department of Agriculture (USDA) prohibits discrimination in all itsprograms and activities on the basis of race, color, national origin, age, disability,and where applicable, sex, marital status, familial status, parental status, religion,sexual orientation, genetic information, political beliefs, reprisal, or because all orpart of an individual’s income is derived from any public assistance program. (Notall prohibited bases apply to all programs.) Persons with disabilities who requirealternative means for communication of program information (Braille, large print,audiotape, etc.) should contact USDA’s TARGET Center at (202) 720-2600 (voiceand TDD).
To file a complaint of discrimination write USDA, Director, Office of Civil Rights,1400 Independence Avenue, S.W. Washington, DC 20250-9410, or call (800) 795-3272 (voice) or (202) 720-6382 (TDD). USDA is an equal opportunity provider andemployer.
AuthorsLawrence A. Rabin is a biological scientist, Office of the Director, 800 Buchanan
Street, Albany, CA 94710; William W. Oliver is a research silviculturist (emeritus);
Robert F. Powers is a senior research scientist (emeritus); Martin W. Ritchie is a
research statistician; Matt D. Busse is a research soil scientist; and Eric E. Knapp
is a research ecologist, Redding Silviculture Laboratory, 3644 Avtech Parkway,
Redding, CA 96002.

AbstractRabin, Lawrence A.; Oliver, William W.; Powers, Robert F.; Ritchie, Martin,
W.; Busse, Matt, D.; Knapp, Eric E. 2009. Historical growth plots in the
Pacific Southwest. Gen. Tech. Rep. PSW-GTR-213. Albany, CA: U.S. De-
partment of Agriculture, Forest Service, Pacific Southwest Research Station.
83 p.
In the past, researchers from the Pacific Southwest Research Station (PSW) under-
took forest growth studies to evaluate how best to manage timber resources. How-
ever, historical and future data collected at PSW growth plots also have the potential
to increase our understanding of the ecological processes occurring in our forests
and shed light on national issues of importance. This report provides information on
the history, geography, plant species studied, installation, and measurement interval
of each plot along with a list of publications arising from data gathered at these
plots. This will enable current and future researchers to reidentify these plots and
continue research at these locations.
Keywords: Growth and yield plots, levels of growing stock (LOGS), initial
spacing, methods of harvest cuttings, long term soil productivity (LTSP), Garden
of Eden.
Contents1 Background
2 I. Levels-of-Growing-Stock (LOGS) Studies
3 Big Lake (LOGS)
7 Crater Peak (LOGS)
8 Crawford Creek (LOGS)
11 Elliot Ranch Plantation (LOGS)
14 Jennie Springs (LOGS)
16 Lookout Mountain (LOGS)
18 S. B. Show Plantation (LOGS)
21 Sugar Hill Plantation (LOGS)
24 Swain Mountain Experimental Forest (LOGS)
26 Whiskey Springs (LOGS)
28 II. Spacing and Growth Studies
29 Blacks Mountain Experimental Forest (Methods-of-Harvest Cuttings Study)
33 Caspar Creek Precommercial Stocking Control of Coast Redwood
34 Challenge Experimental Forest (Initial Spacing Study)
37 Stanislaus-Tuolumne Experimental Forest (Methods-of-Harvest
Cuttings Study)
40 Swain Mountain Experimental Forest (Initial Spacing Study)
42 Trough Springs Ridge (Initial Spacing Study)
44 III. Garden of Eden Studies
51 Chester Garden of Eden Plantation
52 Elkhorn Garden of Eden Plantation
53 Feather Falls Garden of Eden Plantation
54 Jaws Garden of Eden Plantation
55 Pondosa Garden of Eden Plantation
56 Whitmore Garden of Eden Plantation
57 IV. Long-Term Soil Productivity Studies
65 Aspen LTSP Installation
66 Bend, Oregon LTSP Affiliate Sites
71 Blodgett LTSP Installation

72 Brandy City LTSP Installation
72 Bunchgrass LTSP Installation
73 Central Camp LTSP Installation
74 Challenge LTSP Installation
75 Cone LTSP Installation
75 Lowell Hill LTSP Installation
76 Owl LTSP Installation
77 Rogers LTSP Installation
77 Vista LTSP Installation
78 Wallace LTSP Installation
79 V. Continuous Forest Inventory Plots
79 Boggs Mountain Demonstration State Forest
80 Jackson Demonstration State Forest
80 LaTour Demonstration State Forest
81 Mountain Home Demonstration State Forest
81 Soquel Demonstration State Forest
82 Acknowledgments
82 Metric Equivalents
82 References

This Page Left Blank Intentionally

1
Historical Growth Plots in the Pacific Southwest
BackgroundAlthough the original intent in performing growth studies may have been to
investigate treatment effects on growth and yield, historical data collections and
data collected in the future can be analyzed to shed light on ecological processes
occurring in our forests as well as on issues of national importance. Such issues
include, but are not limited to, exploring the productivity of forests under different
management scenarios and the potential for carbon sequestration. For this reason,
studies using data from historical growth plots are important. Accordingly, this
document details a variety of historical growth studies that have been established in
California and southern Oregon to enable researchers to capitalize on, and build
upon, the research legacy at these locations. Each of the studies described herein
have been in place and maintained for more than a decade, and most have existed
for much longer.
Historically, forest yield studies were undertaken to evaluate how best to man-
age timber resources and forecast productivity. Because the realization of forests
yielding a product generally takes decades, foresters need to anticipate, or fore-
cast yields over long timespans. Yield studies are designed to determine standing
volume and tree dimensions for a forest plot at a given stage of stand development.
By combining plots across a range of ages and site qualities, trends over time may
be inferred, thus allowing managers to estimate the productive capacity of forest
stands. The results of many early yield studies were expressed as yield (e.g.,
volume, or basal area) tables indexed by age and productivity as indicated by
dominant height. These tabular values often were expressed graphically. Examples
include Meyer (1938), Dunning and Reineke (1933), and Schumacher (1930,
1938). Tree diameter at breast height (dbh) generally is observed for all trees to
provide an easily measured variable for estimating yield. To provide more preci-
sion, total height may be observed for all trees on a plot, or trees may be
subsampled for total height systematically or randomly, depending on the method
used. Upper stem diameter measurements also may be used to develop more precise
estimates of volume.
The advantage of yield studies is that one may infer long-term trends of forest
growth and mortality over time without investing decades of effort. However, there
are some significant shortcomings. Correlation between site productivity and age
can cause researchers to make incorrect inferences regarding trends in yield over
time. Furthermore, tabular forecasts are not flexible, and they cannot express the
effects of changing management practices or conditions, including climate change.
2
GENERAL TECHNICAL REPORT PSW-GTR-213
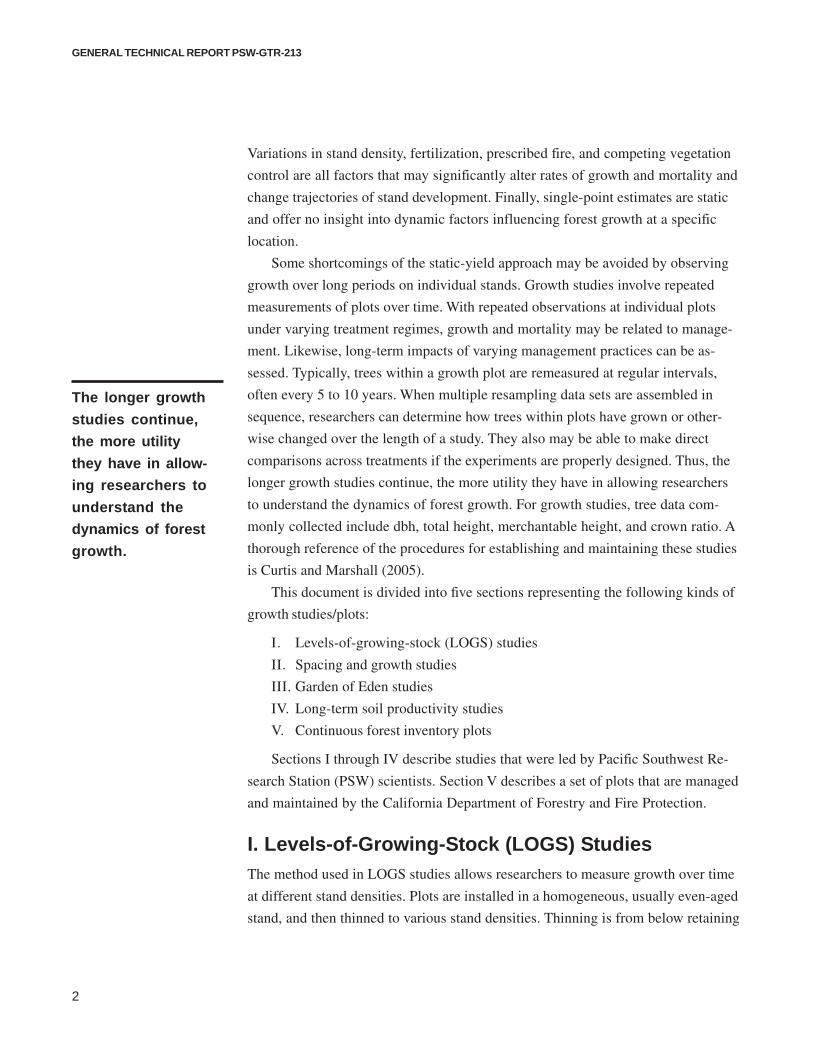
Variations in stand density, fertilization, prescribed fire, and competing vegetation
control are all factors that may significantly alter rates of growth and mortality and
change trajectories of stand development. Finally, single-point estimates are static
and offer no insight into dynamic factors influencing forest growth at a specific
location.
Some shortcomings of the static-yield approach may be avoided by observing
growth over long periods on individual stands. Growth studies involve repeated
measurements of plots over time. With repeated observations at individual plots
under varying treatment regimes, growth and mortality may be related to manage-
ment. Likewise, long-term impacts of varying management practices can be as-
sessed. Typically, trees within a growth plot are remeasured at regular intervals,
often every 5 to 10 years. When multiple resampling data sets are assembled in
sequence, researchers can determine how trees within plots have grown or other-
wise changed over the length of a study. They also may be able to make direct
comparisons across treatments if the experiments are properly designed. Thus, the
longer growth studies continue, the more utility they have in allowing researchers
to understand the dynamics of forest growth. For growth studies, tree data com-
monly collected include dbh, total height, merchantable height, and crown ratio. A
thorough reference of the procedures for establishing and maintaining these studies
is Curtis and Marshall (2005).
This document is divided into five sections representing the following kinds of
growth studies/plots:
I. Levels-of-growing-stock (LOGS) studies
II. Spacing and growth studies
III. Garden of Eden studies
IV. Long-term soil productivity studies
V. Continuous forest inventory plots
Sections I through IV describe studies that were led by Pacific Southwest Re-
search Station (PSW) scientists. Section V describes a set of plots that are managed
and maintained by the California Department of Forestry and Fire Protection.
I. Levels-of-Growing-Stock (LOGS) StudiesThe method used in LOGS studies allows researchers to measure growth over time
at different stand densities. Plots are installed in a homogeneous, usually even-aged
stand, and then thinned to various stand densities. Thinning is from below retaining
The longer growthstudies continue,the more utilitythey have in allow-ing researchers tounderstand thedynamics of forestgrowth.

3
Historical Growth Plots in the Pacific Southwest
the most vigorous, well-formed dominant and codominant trees as far as this is
compatible with reasonably uniform spacing. The plots may or may not be periodi-
cally rethinned back to the original densities. The purpose is to determine stand
growth and health resulting from various intensities of thinning. The LOGS studies
have also demonstrated the influence of stand density on mortality, understory
development, tree regeneration, and buildup of hazardous fuels.
Some LOGS installations were established as a part of the West-Wide Levels-
of-Growing-Stock Study of ponderosa pine. Work on this project began in the
1960s with a series of LOGS studies established in young even-aged stands
throughout the West. Researchers, using a common study plan (Myers 1967),
initiated studies in the Black Hills of South Dakota, eastern and central Oregon,
the Coconino Plateau of Arizona, and the west-side Sierra Nevada in California.
The study plan prescribes five or six growing stock levels (GSLs) replicated three
times. These GSLs are the basal area in square feet per acre that the stand has, or
will have, after thinning, when the quadratic mean diameter (QMD) is 10 in or
more. Where QMDs are less than 10 in, the prescribed basal area for each GSL is
tabulated in the study plan. As part of the West-Wide Levels of Growing Stock
Study of ponderosa pine, PSW established the California installation (Elliot Ranch
Plantation) and has assumed responsibility for the two in Oregon (Crawford Creek
and Lookout Mountain) following their abandonment by the Pacific Northwest
Research Station. Growing-stock studies similar in many respects to the prototype
effort, but expanded to other species, are described as well. Both the West-Wide
Levels of Growing Stock installations and other LOGS-type installations managed
by PSW are described below (see fig. 1 for plot locations):
Big Lake (LOGS)
History—
This study (fig. 2) was installed by the U.S. Department of Agriculture, Forest
Service, Pacific Southwest Regional Office’s Silviculture Development Unit to
demonstrate best practices in commercially thinning true fir stands. Merchant-
able logs were skidded to roadside with a small crawler tractor and the slash was
lopped and scattered over the plot. Following the thinning, Annosus root rot
(Heterobasidion annosum) was active in killing trees for several years but is now
inactive. Plots were rethinned in 1989 as described in table 1.
The purpose is todetermine standgrowth and healthresulting from vari-ous intensities ofthinning.

4
GENERAL TECHNICAL REPORT PSW-GTR-213
Figure 1—Levels-of-growing-stock plots in California.

5
Historical Growth Plots in the Pacific Southwest
Figure 2—Big Lake levels-of-growing-stock plot 7 in 1990.Plot was rethinned to 233 ft2 in1998.
Table 1—Big Lake 1989 rethinning treatments
Plot Original treatment Retreatment
Percent of normala Square feet
1 55 1802 70 2803 40 1004 40 1005 70 2806 Control 3887 70 233b
8 Control 326a Schumacher 1926.b Plot 7 was rethinned to 55 percent of normal (233 ft2) ratherthan to 280 ft2 of basal area because researchers wished tocontinue to use the area for field trips and to show this commonthinning prescription.

6
GENERAL TECHNICAL REPORT PSW-GTR-213
• Location—Sec. 15, T. 32 N, R. 3 E. on the Hat Creek Ranger District of
the Lassen National Forest
• Latitude/longitude—Lat. 40.62 N.; long. 121.63 W.
• Elevation—5,900 ft
• Soil parent material—Basalt
• Species studied—White fir (Abies concolor (Gord. & Glend.) Lindl. ex.
Hildebr.)
• Duration of data collection—1976-ongoing
• Measurement interval—5 years
Study design—
The plots are 0.5 ac and buffered with a 30-ft isolation strip. Treatments were
assigned in a fully randomized design with two replications. Stand densities tested
were percentages of the basal area shown in the Schumacher (1926) yield table for
that site and stand age (table 1).
Measurements—
All trees within the plots were measured for dbh. Stem deformities and evidence
of insect and disease attack were also noted. Total height and height to live crown
were measured on a 20-percent systematic sample of the trees. A probability-
proportional-to-size sample of six trees per plot was measured with a Barr and
Stroud optical dendrometer for stem volumes during several remeasurements.
Monumentation—
All measurement trees are tagged at breast height. Originally, trees just inside the
measurement plot boundary were banded with colors coded to the treatment: red =
control; blue = 40 percent of normal basal area stand density; orange = 55 percent
of normal basal area stand density; and yellow = 70 percent of normal basal area
stand density. In 1993, all boundary trees were rebanded in yellow regardless of
treatment. Trees sampled for total height are double banded. Plot corners are
monumented with T-fenceposts color coded as above.
Publications that used data from this study—
Cochran, P.H.; Oliver, W.W. 1988. Growth rates for managed stands of white fir.
In: Schmidt, W.C., comp. Proceedings, Future forests of the mountain west: a stand
culture symposium. Gen. Tech. Rep. INT-243. Missoula, MT: U.S. Department of
Agriculture, Forest Service, Intermountain Research Station: 197–200.

7
Historical Growth Plots in the Pacific Southwest
Zhang, J.W.; Oliver, W.W.; Ritchie, M.W. 2007. Effect of stand densities on
stand dynamics in white fir (Abies concolor) forests in northeast California, USA.
Forest Ecology and Management. 244: 50–59.
Crater Peak (LOGS)
History—
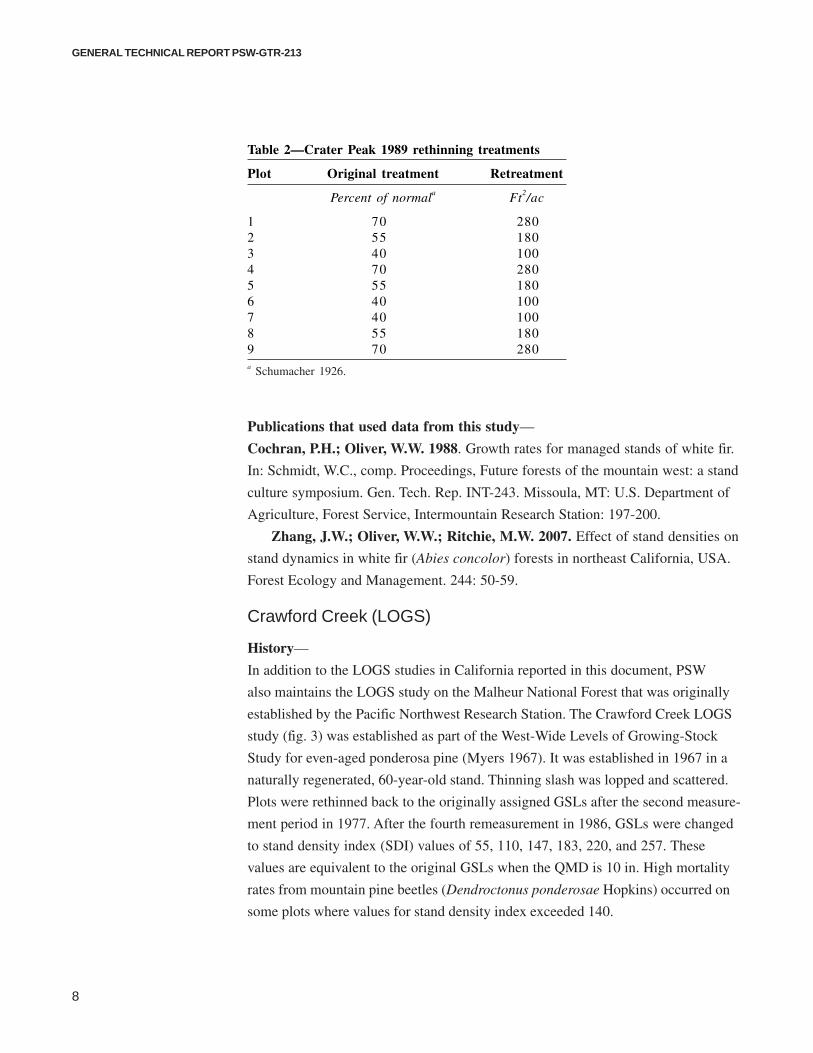
This installation was part of the Pacific Southwest Regional Office’s Silviculture
Development Unit’s commercial thinning investigations. Plots were rethinned in
1989 as reported in table 2.
• Location—NW1/4 of the NE1/4 of sec. 17, T. 33 N., R. 3 E. on the Hat
Creek Ranger District of the Lassen National Forest
• Latitude/longitude—Lat. 40.72 N; long. 121.67 W.
• Elevation—5,300 ft
• Species studied—White fir
• Soil parent material—Volcanic pyroclastics
• Duration of data collection—1978-ongoing
• Measurement interval—5 years
Study design—
The plots are 0.5 ac and buffered with a 30-ft isolation strip. Treatments were
assigned in a fully randomized design with three replications. Stand densities tested
were percentages of the basal area shown in the Schumacher (1926) yield table for
that site and stand age.
Measurements—
All trees within the plots were measured for dbh. Stem deformities and evidence
of insect and disease attack were also noted. Total height and height to live crown
were measured on a 20-percent systematic sample of the trees. A probability-
proportional-to-size sample of six trees per plot was measured with a Barr and
Stroud optical dendrometer for stem volumes during several remeasurements.
Monumentation—
All measurement trees are tagged at breast height. Originally, trees just inside the
measurement plot boundary were banded with colors coded to the treatment: blue =
40 percent of normal basal area stand density; orange = 55 percent of normal basal
area stand density; and yellow = 70 percent of normal basal area stand density. In
1993 all boundary trees were rebanded in yellow regardless of treatment. Trees
sampled for total height are double banded. Plot corners are monumented with T-
fenceposts color coded as above.
8
GENERAL TECHNICAL REPORT PSW-GTR-213
Publications that used data from this study—
Cochran, P.H.; Oliver, W.W. 1988. Growth rates for managed stands of white fir.
In: Schmidt, W.C., comp. Proceedings, Future forests of the mountain west: a stand
culture symposium. Gen. Tech. Rep. INT-243. Missoula, MT: U.S. Department of
Agriculture, Forest Service, Intermountain Research Station: 197-200.
Zhang, J.W.; Oliver, W.W.; Ritchie, M.W. 2007. Effect of stand densities on
stand dynamics in white fir (Abies concolor) forests in northeast California, USA.
Forest Ecology and Management. 244: 50-59.
Crawford Creek (LOGS)
History—
In addition to the LOGS studies in California reported in this document, PSW
also maintains the LOGS study on the Malheur National Forest that was originally
established by the Pacific Northwest Research Station. The Crawford Creek LOGS
study (fig. 3) was established as part of the West-Wide Levels of Growing-Stock
Study for even-aged ponderosa pine (Myers 1967). It was established in 1967 in a
naturally regenerated, 60-year-old stand. Thinning slash was lopped and scattered.
Plots were rethinned back to the originally assigned GSLs after the second measure-
ment period in 1977. After the fourth remeasurement in 1986, GSLs were changed
to stand density index (SDI) values of 55, 110, 147, 183, 220, and 257. These
values are equivalent to the original GSLs when the QMD is 10 in. High mortality
rates from mountain pine beetles (Dendroctonus ponderosae Hopkins) occurred on
some plots where values for stand density index exceeded 140.
Table 2—Crater Peak 1989 rethinning treatments
Plot Original treatment Retreatment
Percent of normala Ft2/ac
1 70 2802 55 1803 40 1004 70 2805 55 1806 40 1007 40 1008 55 1809 70 280a Schumacher 1926.

9
Historical Growth Plots in the Pacific Southwest
• Location—Sec. 11, 12, 14, 15, 22, 26, and 27, T. 11 S., R. 35 E.
Willamette Meridian on the Blue Mountain Ranger District, Malheur
National Forest
• Latitude/longitude—Lat. 44.60 N.; long. 118.44 W.
• Elevation—4,400 ft
• Soil parent material—Mazama ash
• Species studied—Ponderosa pine (Pinus ponderosa Dougl. ex Laws.)
• Duration of data collection—1967-ongoing
• Measurement interval—5 years
Study design—
The plots are grouped into three blocks on gentle slopes of all aspects within the
Crawford Creek drainage. Plots are 0.4 or 0.5 ac and buffered with a 33-ft isolation
strip. Six GSLs were assigned in a randomized complete block design with three
replications totaling 18 plots. The GSLs are the basal area in square feet per acre
that the stand has, or will have, after thinning, when the QMD is 10 in or more.
Where QMDs are less than 10 in, the prescribed basal area for each GSL is tabu-
lated in the study plan. Assigned GSLs were 30, 60, 80, 100, 120, and 140.
Figure 3—Crawford Creek levels-of-growing-stock plot in 1987 thinned to GSL 80.

10
GENERAL TECHNICAL REPORT PSW-GTR-213
Measurements—
All trees within the measurement plots were measured for dbh. Fifteen trees on each
thinned plot were selected for measuring with an optical dendrometer for total
height and stem volume determinations. Trees from each diameter class were
randomly selected so that the complete range of diameter classes was equally
represented.
Monumentation—
All measurement trees are tagged at breast height.
Publications that used data from this study—
Barrett, J.W. 1979. Silviculture of ponderosa pine in the Pacific Northwest: the
state of our knowledge. Gen. Tech. Rep. PNW-97. Portland, OR: U.S. Department
of Agriculture, Forest Service, Pacific Northwest Forest and Range Experiment
Station. 106 p.
Cochran, P.H.; Barrett, J.W. 1995. Growth and mortality of ponderosa pine
poles thinned to various densities in the Blue Mountains of Oregon. Res. Pap.
PNW-RP-483. Portland, OR: U.S. Department of Agriculture, Forest Service,
Pacific Northwest Research Station. 27 p.
DeMars, D.J.; Barrett, J.W. 1987. Ponderosa pine managed-yield simulator:
PPSIM users guide. Gen. Tech. Rep. PNW-GTR-203. Portland, OR: U.S. Depart-
ment of Agriculture, Forest Service, Pacific Northwest Forest and Range Experi-
ment Station. 36 p.
Edminster, C.B. 1988. Stand density and stocking in even-aged ponderosa
pine stands. In: Baumgartner, D.M.; Lotan, J.E., comps. Proceedings, ponderosa
pine the species and its management. Pulman, WA: Washington State University:
253–260.
Oliver, W.W.; Edminster, C.B. 1988. Growth of ponderosa pine thinned to
different stocking levels in the Western United States. In: Schmidt, W.C., comp.
Proceedings, Future forests of the mountain west: a stand culture symposium. Gen.
Tech. Rep. INT-243. Missoula, MT: U.S. Department of Agriculture, Forest
Service, Intermountain Research Station: 153–159.
Oliver, W.W. 2005. The West-Wide Ponderosa Pine Levels-of-Growing-Stock
Study at age 40. In: Ritchie, M.W.; Maguire, D.A.; Youngblood, A., tech. cords.
Proceedings, symposium on ponderosa pine: issues, trends, and management. Gen.
Tech. Rep. PSW-198. Albany, CA: U.S. Department of Agriculture, Forest Ser-
vice, Pacific Southwest Research Station: 71–80.

11
Historical Growth Plots in the Pacific Southwest
Elliot Ranch Plantation (LOGS)
History—
This plantation (fig. 4) originated in 1949 after the Elliot Ranch Fire, which burned
a deerbrush (Ceanothus integerrimus) brush and snag field that had developed
following the 1949 Elliot Ranch Burn. This is one of six installations in the West-
Wide Levels-of-Growing-Stock Study for even-aged ponderosa pine guided by
Myers’ (1967) study plan. Portions of the Elliot Ranch plantation were used in
developing yield tables for managed stands of ponderosa pine (Oliver and Powers
1978).
• Location—SW 1/4 of sec. 9, T.15. N., R.11 E. on the Foresthill Ranger
District, Tahoe National Forest
• Latitude/longitude—Lat. 39.16 N.; long. 120.74 W.
• Elevation—4,000 ft
• Soil parent material—Tuff breccia and stratified sands and gravels
• Species studied—Ponderosa pine
• Plot installation—1969
• Duration of data collection—1969-ongoing
• Measurement interval—5 years
Study design—
All plots are buffered with a 30-ft isolation strip. The study design is fully random-
ized with three replications. All plots are 0.5 ac, exclusive of buffer. Five GSLs of
40, 70, 100, 130, and 160 were applied in 1969. The GSLs are the basal area in
square feet per acre that the stand has, or will have, after thinning, when the QMD
is 10 in or more. Where QMDs are less that 10 in, the prescribed basal area for each
GSL is tabulated in the study plan. Rethinnings in 1974 and 1979 restored the
original GSLs. The third rethinning in 1989 used SDI as the measure of stand
density and resulted in an approximately 10-percent increase in growing stock for
each density treatment.
Measurements—
All trees within the plots were measured for dbh. Stem deformities and evidence
of insect and disease attack were also noted. Total height and height to live crown
was measured on a 20-percent systematic sample of the trees during all but the last
measurement in 2004. At that time, all trees were measured for total height. Height
to live crown measurements were discontinued in 2004. A probability-proportional-
to-size sample of six trees per plot was measured with a Barr and Stroud optical
dendrometer for stem volumes during several remeasurements.

12
GENERAL TECHNICAL REPORT PSW-GTR-213
Monumentation—
All trees in the plots are included as measurement trees and are tagged at breast
height. All measurement trees are banded in yellow, and height sample trees have
a double yellow band. Tag numbers are unique for each tree throughout the study.
Plot corners were monumented with T-fenceposts or with 4 by 4 cedar posts. The
Foresthill Ranger District posted signs at each plot that show the respective plot
numbers with a sign nearby describing the study.
Publications that used data from this study—
Oliver, W.W. 1980. Growth of planted ponderosa pine thinned to different stocking
levels in northern California. Res. Pap. PSW-147. Berkeley, CA: U.S. Department
of Agriculture, Forest Service, Pacific Southwest Research Station. 11 p.
Oliver, W.W. 1995. Is self-thinning of ponderosa pine ruled by Dendroctonus
bark beetles? In: Eskew, L.G., comp. Forest health through silviculture. Proceed-
ings of the 1995 national silviculture workshop. Gen. Tech. Rep. RM-267. Fort
Collins, CO: U.S. Department of Agriculture, Forest Service, Rocky Mountain
Forest and Range Experiment Station: 213–218.
Oliver, W.W. 1997. Twenty-five-year growth and mortality of planted ponde-
rosa pine repeatedly thinned to different stand densities in northern California.
Western Journal of Applied Forestry. 12(4): 122–130.
Figure 4—Elliot Ranch levels-of-growing-stock plot 15 after rethinning to 90 ft2 basal area in1989.
13
Historical Growth Plots in the Pacific Southwest
Oliver, W.W. 2005. The west-wide ponderosa pine levels-of-growing-stock
study at age 40. In: Ritchie, M.W.; Maguire, D.A.; Youngblood, A., technical
cords. Proceedings, Symposium on ponderosa pine: issues, trends and management.
Gen. Tech. Rep. PSW-198. Albany, CA: U.S. Department of Agriculture, Forest
Service, Pacific Southwest Research Station: 71–80.
Oliver, W.W.; Dolph, K.L. 1992. Mixed-conifer seedling growth varies in
response to overstory release. Forest Ecology and Management. 48: 179–183.
Oliver, W.W.; Edminster, C.B. 1988. Growth of ponderosa pine thinned to
different stocking levels in the Western United States. In: Schmidt, W.C., comp.
Proceedings, Future forests of the mountain west: a stand culture symposium. Gen.
Tech. Rep. INT-243. Missoula, MT: U.S. Department of Agriculture, Forest
Service, Intermountain Research Station: 153–159.
Oliver, W.W.; Ferrell, G.T.; Tappeiner, J.C. 1996. Density management
of Sierra Nevada forests. In: Sierra Nevada ecosystem project: final report to
Congress. Vol. III, assessments, commissioned reports, and background Informa-
tion. Davis, CA: University of California, Center for Water and Wildland Re-
sources: 491–500.
Oliver, W.W.; Powers, R.F. 1971. Early height growth of ponderosa pine
forecasts dominance in plantations. Res. Note PSW-250. Berkeley, CA: U.S.
Department of Agriculture, Forest Service, Pacific Southwest Forest and Range
Experiment Station. 4 p.
Oliver, W.W.; Powers, R.F. 1978. Growth models for ponderosa pine: I. Yield
of unthinned plantations in northern California. Res. Pap. PSW-133. Berkeley, CA:
U.S. Department of Agriculture, Forest Service, Pacific Southwest Forest and
Range Experiment Station. 21 p.
Oliver, W.W.; Uzoh, F.C.C. 1997. Maximum stand densities for ponderosa
pine and red and white fir in northern California. In: Proceedings, 18th annual
forest vegetation management conference. Redding, CA: University of California
Cooperative Extension: 57–65.
Powers, R.F.; Oliver, W.W. 1970. Snow breakage in a pole-sized ponderosa
pine plantation…more damage at high densities. Res. Note PSW-218. Berkeley,
CA: U.S. Department of Agriculture, Forest Service, Pacific Southwest Research
Station. 3 p.
Sindel, G.E. 1963. The use of cattle to control deerbrush growth during pine
plantation establishment. Society of American Foresters Proceedings. 1962: 71–72.
Uzoh, F.C.C.; Oliver, W.W. 2006. Individual tree height increment model for
managed even-aged stands of ponderosa pine throughout the Western United States
using linear mixed effects models. Forest Ecology and Management. 221: 147–154.

14
GENERAL TECHNICAL REPORT PSW-GTR-213
Jennie Springs (LOGS)
History—
This 80-ac stand of natural origin (fig. 5) lies on a very gentle south-facing slope
and is exceptionally uniform in site quality. Levels of growing stock is only one
feature of the multifaceted study that was initiated at this location. The study, as
originally envisioned, was to include investigations of all the intensive silvicultural
operations currently operational in true fir stands in California. These included
density control, fertilization, and prescribed fire both pre- and postharvest to reduce
fuel loads and to break dormancy on shrub seeds. Slash was lopped and scattered
over the plots. Merchantable logs were skidded by horses to the road side. At
present, only the LOGS study is actively maintained.
• Location—N1/2 of sec. 4, T. 29 N., R. 8 E., MDM on the southern flank of
Swain Mountain near Jennie Springs on the Almanor Ranger District,
Lassen National Forest
• Latitude/longitude—Lat. 40.40 N.; long. 121.09 W.
• Elevation—6,100 ft
• Soil parent material—Basalt
• Species studied—White fir
• Plot installation—1981
• Duration of data collection—1981-ongoing
• Measurement interval—5 years
Study design—
All plots are square, 0.49 ac, and buffered by a 30-ft isolation strip. The study de-
sign is fully randomized with three replications of five basal area stand densities—
80, 130, 180, 230, and unthinned at 385 ft2/ac. The plots have not been rethinned.
Measurements—
All trees within the plots were measured for dbh. Stem deformities and evidence
of insect and disease attack were also noted. Total height and height to live crown
was measured on a 20-percent systematic sample of the trees. A probability-propor-
tional-to-size sample of six trees per plot was measured with a Barr and Stroud
optical dendrometer for stem volumes during several remeasurements.
Monumentation—
All measurement trees in the thinned plots are tagged at breast height and banded in
yellow. Trees originally selected for height measurements are double banded in
yellow. In the unthinned plots, every other tree was tagged. No permanent corner
posts were set.

15
Historical Growth Plots in the Pacific Southwest
Publications that used data from this study—
Cochran, P.H.; Oliver, W.W. 1988. Growth rates for managed stands of white
fir. In: Schmidt, W.C., comp. Proceedings, Future forests of the mountain west: a
stand culture symposium. Gen. Tech. Rep. INT-243. Missoula, MT: U.S. Depart-
ment of Agriculture, Forest Service, Intermountain Research Station: 197–200.
Fieber, W.; Robson, T. 1985. Jennie Springs…Horse logging as a new
enterprise. Albany, CA: U.S. Department of Agriculture, Forest Service, Pacific
Southwest Region. 20 p.
Waters, J.R.; McKelvey, K.S.; Zabel, C.J.; Oliver, W.W. 1994. The
effects of thinning and broadcast burning on sporocarp production of hypogeous
fungi. Canadian Journal of Forest Research. 24: 1516–1522.
Zhang, J.W.; Oliver, W.W.; Ritchie, M.W. 2007. Effect of stand densities
on stand dynamics in white fir (Abies concolor) forests in northeast California,
USA. Forest Ecology and Management. 244: 50–59.
Figure 5—Jennie Springs levels-of-growing-stock plot 9 in 1986 thinned to230 ft2 basal area.
16
GENERAL TECHNICAL REPORT PSW-GTR-213
Lookout Mountain (LOGS)
History—
In addition to the LOGS studies in California reported in this document, PSW
Research Station also maintains the LOGS study on Lookout Mountain (fig. 6) that
was originally established by the Pacific Northwest Research Station. The Lookout
LOGS study was established as part of the West-Wide Levels of Growing-Stock
study for even-aged ponderosa pine (Myers 1967). The study was established in
1965 in a naturally regenerated 1,000-ac stand. Thinning slash was lopped and
scattered. Plots were rethinned back to the originally assigned GSLs after the
second measurement period in 1975. After the fourth remeasurement in 1985, GSLs
were changed to SDI values of 55, 110, 147, 183, 220, and 275. These values are
equivalent to the original GSLs when the QMD is 10 in. Mortality has been minor
and attributed to mountain pine beetles (Dendroctonus ponderosae Hopkins) attack-
ing weakened trees in the denser plots. Pandora moth (Coloradia pandora Blake)
caused partial defoliation during 1992 and 1994, which reduced growth rates during
those years.
• Location—Sec. 4, 5, 6, T. 21 S., R. 9 E. Willamette Meridian on Lookout
Mountain, Pringle Falls Experimental Forest, Oregon
• Latitude/longitude—Lat. 43.77 N.; long. 121.72 W.
• Elevation—5,000 ft
• Soil parent material—Dacite pumice 3 ft deep over older volcanic ash
• Species studied—Ponderosa pine
• Duration of data collection—1965–ongoing
• Measurement interval—5 years
Study design—
The plots were scattered throughout a quarter section on a south-facing slope
where site and stand density differences could be minimized. Plots are 0.5 ac and
buffered with a 33-ft isolation strip. Six GSLs were assigned in a fully randomized
design with three replications totaling 18 plots. The GSLs are the basal area in
square feet per acre that the stand has, or will have, after thinning, when the QMD
is 10 in or more. Where QMDs are less than 10 in, the prescribed basal area for
each GSL is tabulated in the study plan. Assigned GSL levels were 30, 60, 80, 100,
120, and 150.

17
Historical Growth Plots in the Pacific Southwest
Measurements—
All trees within the plots were measured for dbh. Fifteen trees on each thinned plot
were selected for measuring with an optical dendrometer for total height and stem
volume determinations. Trees were randomly selected from each diameter class so
that the complete range of diameter classes was equally represented.
Monumentation—
All measurement trees are tagged at breast height.
Publications that used data from this study—
Barrett, J.W. 1979. Silviculture of ponderosa pine in the Pacific Northwest: the
state of our knowledge. Gen. Tech. Rep. PNW-97. Portland, OR: U.S. Department
of Agriculture, Forest Service, Pacific Northwest Forest and Range Experiment
Station. 106 p.
Barrett, J.W. 1983. Growth of ponderosa pine poles thinned to different
stocking levels in central Oregon. Res. Pap. PNW-311. Portland, OR: U.S. Depart-
ment of Agriculture, Forest Service, Pacific Northwest Forest and Range Experi-
ment Station. 9 p.
Figure 6—Lookout Mountain levels-of-growing-stock plot in 1979 after rethinning to GSL 100.

18
GENERAL TECHNICAL REPORT PSW-GTR-213
Cochran, P.H.; Barrett, J.W. 1999. Growth of ponderosa pine thinned to
different stocking levels in central Oregon: 30-year results. Res. Pap. PNW-RP-
508. Portland, OR: U.S. Department of Agriculture, Forest Service, Pacific North-
west Research Station. 27 p.
DeMars, D.J.; Barrett, J.W. 1987. Ponderosa pine managed-yield simulator:
PPSIM users guide. Gen. Tech. Rep. PNW-GTR-203. Portland, OR: U.S. Depart-
ment of Agriculture, Forest Service, Pacific Northwest Forest and Range Experi-
ment Station. 36 p.
Edminster, C.B. 1988. Stand density and stocking in even-aged ponderosa
pine stands. In: Baumgartner, D.M.; Lotan, J.E., comps. Proceedings, Ponderosa
pine the species and its management. Pulman, WA: Washington State University:
253–260.
Oliver, W.W.; Edminster, C.B. 1988. Growth of ponderosa pine thinned to
different stocking levels in the Western United States. In: Schmidt, W.C., comp.
Proceedings, Future forests of the mountain west: a stand culture symposium. Gen.
Tech. Rep. INT-243. Missoula, MT: U.S. Department of Agriculture, Forest
Service, Intermountain Research Station: 153–159.
Oliver, W.W. 2005. The west-wide ponderosa pine levels-of-growing-stock
study at age 40. In: Ritchie, M.W.; Maguire, D.A.; Youngblood, A., tech. cords.
Proceedings, Symposium on ponderosa pine: issues, trends, and management. Gen.
Tech. Rep. PSW-198. Albany, CA: U.S. Department of Agriculture, Forest Ser-
vice, Pacific Southwest Research Station: 71–80.
S. B. Show Plantation (LOGS)
History—
This plantation was established in 1919 by S.B. Show and is thought to be the
oldest successful ponderosa pine plantation in California (fig. 7). For many years it
was a popular show piece for visiting land managers, and stem analyses made from
temporary plots were used in developing site index curves (Powers and Oliver 1978)
and yield tables (Oliver and Powers 1978) for managed stands of ponderosa pine.
The thinning plots were established by the Pacific Southwest Regional Office as part
of an administrative study of growth responses to operational commercial thinning.
The McCloud Ranger District underburned the plantation in spring 1995, consum-
ing a light cover of grass and needle litter. Over the life of the study, black stain
root disease (Leptographium wageneri) has weakened many trees leading to killing
by mountain pine beetle. As a result, net growth of the stand has been slow.

19
Historical Growth Plots in the Pacific Southwest
• Location—NE1/4 of the SE1/4, sec. 8, T. 41 N., R. 1 W. on the McCloud
Ranger District, Shasta-Trinity National Forests
• Latitude/longitude—Lat. 41.32 N.; long. 121.98 W.
• Elevation—3,900 ft
• Soil parent material—Volcanic ash over basalt
• Species studied—Ponderosa pine
• Plot installation—1972
• Duration of data collection—1972-ongoing
Study design—
Three unreplicated and unbuffered 1-ac plots were thinned to 40, 55, and 70 percent
of that shown in Meyer’s (1938) yield table for stands of that age and site quality.
Basal area equivalents were 85, 103, and 152 ft2/ac. The plots have not been
rethinned.
Measurements—
All trees within the plots were measured for dbh. Stem deformities and evidence
of insect and disease attack were also noted. Total height and height to live crown
was measured on a 20-percent systematic sample of the trees. A probability-
proportional-to-size sample of six trees per plot was measured with a Barr and
Stroud optical dendrometer for stem volumes during several remeasurements.
Figure 7—S. B. Show Plantation levels-of-growing-stock plot 1 in 1968 before thinning to 152 ft2
basal area.
20
GENERAL TECHNICAL REPORT PSW-GTR-213
Monumentation—
All measurement trees are tagged and banded in yellow at breast height. Trees
sampled for height are double banded in yellow. Subsequent to plot installation, the
Weyerhaeuser Co. superimposed a growth and yield plot over plot 1 as part of their
growth and yield study of ponderosa pine plantations. 1 As a result, some trees have
two tags and a confusing array of paint stripes and bands. The measurement trees in
this study use a stamped oblong aluminum tag, and Weyerhaeuser Co. study trees
used an embossed aluminum tag. T-fenceposts originally marked plot corners, but
most have disappeared.
Publications that used data from this study—
Oliver, W.W. 1995. Is self-thinning of ponderosa pine ruled by Dendroctonus bark
beetles? In: Eskew, L.G., comp. Forest health through silviculture. Proceedings,
1995 national silviculture workshop. Gen. Tech. Rep. RM-267. Fort Collins, CO:
U.S. Department of Agriculture, Forest Service, Rocky Mountain Forest and Range
Experiment Station: 213–218.
Oliver, W.W.; Powers, R.F. 1978. Growth models for ponderosa pine: I. Yield
of unthinned plantations in northern California. Res. Pap. PSW-133. Berkeley, CA:
U.S. Department of Agriculture, Forest Service, Pacific Southwest Forest and
Range Experiment Station. 21 p.
Oliver, W.W.; Uzoh, F.C.C. 1997. Maximum stand densities for ponderosa
pine and red and white fir in northern California. In: Proceedings, 18th annual
forest vegetation management conference. Redding, CA: University of California
Cooperative Extension: 57–65.
Powers, R.F.; Oliver, W.W. 1978. Site classification of ponderosa pine under
stocking control in California. Res. Pap. PSW-128. Berkeley, CA: U.S. Department
of Agriculture, Forest Service, Pacific Southwest Forest and Range Experiment
Station. 9 p.
Uzoh, F.C.C.; Oliver, W.W. 2006. Individual tree height increment model for
managed even-aged stands of ponderosa pine throughout the Western United States
using linear mixed effects models. Forest Ecology and Management. 221: 147–154.
1 The use of trade or firm names in this publication is for reader information and does notimply endorsement by the U.S. Department of Agriculture of any product or service.
21
Historical Growth Plots in the Pacific Southwest
Sugar Hill Plantation (LOGS)
History—
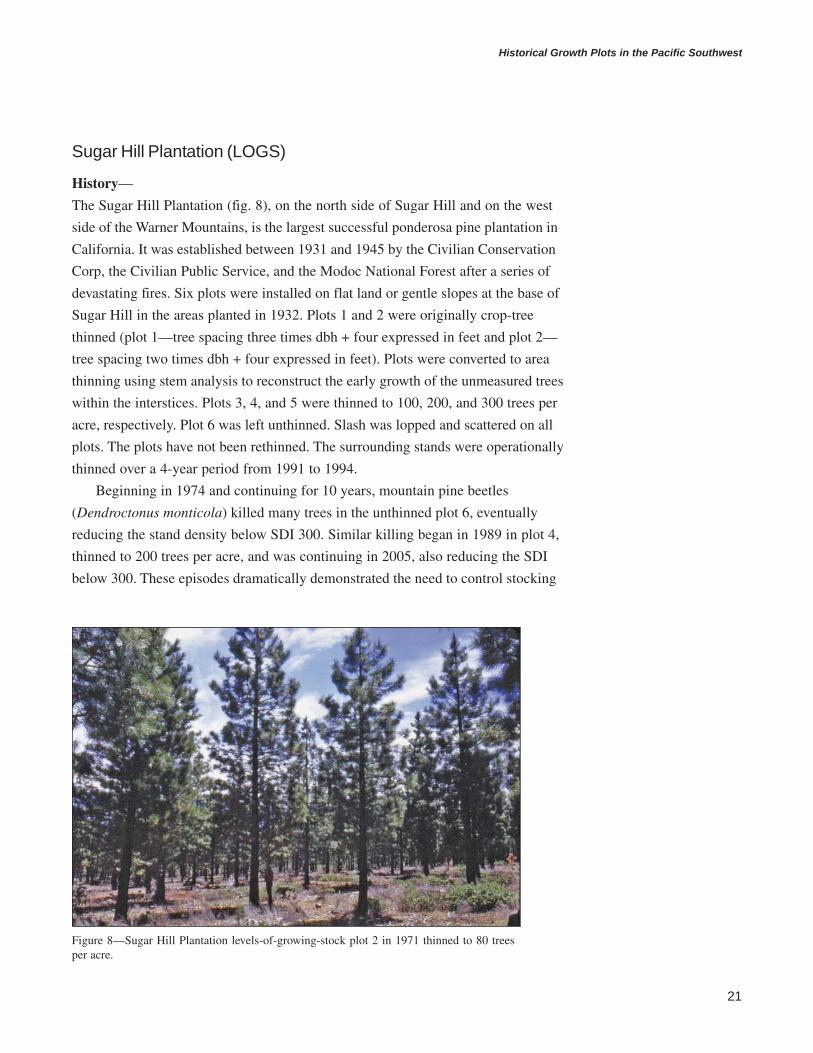
The Sugar Hill Plantation (fig. 8), on the north side of Sugar Hill and on the west
side of the Warner Mountains, is the largest successful ponderosa pine plantation in
California. It was established between 1931 and 1945 by the Civilian Conservation
Corp, the Civilian Public Service, and the Modoc National Forest after a series of
devastating fires. Six plots were installed on flat land or gentle slopes at the base of
Sugar Hill in the areas planted in 1932. Plots 1 and 2 were originally crop-tree
thinned (plot 1—tree spacing three times dbh + four expressed in feet and plot 2—
tree spacing two times dbh + four expressed in feet). Plots were converted to area
thinning using stem analysis to reconstruct the early growth of the unmeasured trees
within the interstices. Plots 3, 4, and 5 were thinned to 100, 200, and 300 trees per
acre, respectively. Plot 6 was left unthinned. Slash was lopped and scattered on all
plots. The plots have not been rethinned. The surrounding stands were operationally
thinned over a 4-year period from 1991 to 1994.
Beginning in 1974 and continuing for 10 years, mountain pine beetles
(Dendroctonus monticola) killed many trees in the unthinned plot 6, eventually
reducing the stand density below SDI 300. Similar killing began in 1989 in plot 4,
thinned to 200 trees per acre, and was continuing in 2005, also reducing the SDI
below 300. These episodes dramatically demonstrated the need to control stocking
Figure 8—Sugar Hill Plantation levels-of-growing-stock plot 2 in 1971 thinned to 80 treesper acre.

22
GENERAL TECHNICAL REPORT PSW-GTR-213
in ponderosa pine to maintain stand health. Unthinned portions of the Sugar Hill
plantation were used in developing yield tables for managed stands of ponderosa
pine (Oliver and Powers 1978).
• Location—Plots 1, 2, 3, 5, and 6 are in the N1/2 of sec. 13 and plot 4 is in
the SE1/4 of sec. 13, T. 46 N., R. 14 E. on the south side of Lassen Creek,
north of Sugar Hill, on the Warner Mountain Ranger District, Modoc
National Forest
• Latitude/longitude—Lat. 41.83 N.; long. 120.3 W.
• Elevation—5,400 ft
• Soil parent material—Obsidian
• Species studied—Ponderosa pine and Jeffrey pine (Pinus jeffreyi Grev. &
Balf.)
• Plot installation—1958–59
• Duration of data collection—1959-ongoing
• Measurement interval—4 to 6 years
Study design—
All plots are unbuffered and unreplicated. Plot sizes, stand density treatment, and
initial species composition can be found in table 3.
Measurements—
All trees within the plots were measured for dbh. Stem deformities and evidence
of insect and disease attack were also noted. Total height and height to live crown
was measured on a 20-percent systematic sample of the trees during all but the first
measurement in 1958-59 and the last measurement in 2004. At those times, all trees
were measured for total height. Height to live crown was measured during the 1965
through 1999 measurements. A probability-proportional-to-size sample of six trees
per plot was measured with a Barr and Stroud optical dendrometer for stem vol-
umes during several remeasurements.
Monumentation—
All measurement trees are tagged at breast height. Most plot corners are
monumented by metal fenceposts. All measurement trees are banded in yellow,
and height sample trees have a double yellow band.
23
Historical Growth Plots in the Pacific Southwest
Publications that used data from this study—
Oliver, W.W. 1972. Growth after thinning ponderosa and Jeffrey pine pole stands
in northeastern California. Res. Pap. PSW-85. Berkeley, CA: U.S. Department of
Agriculture, Forest Service, Pacific Southwest Forest and Range Experiment
Station. 8 p.
Oliver, W.W. 1979. Fifteen-year growth patterns after thinning a ponderosa-
Jeffrey pine plantation in northeastern California. Res. Pap. PSW-141. Berkeley,
CA: U.S. Department of Agriculture, Forest Service, Pacific Southwest Forest and
Range Experiment Station. 10 p.
Oliver, W.W. 1995. Is self-thinning of ponderosa pine ruled by Dendroctonus
bark beetles? In: Eskew, L.G., comp. Forest health through silviculture. Proceed-
ings, 1995 national silviculture workshop. Gen. Tech. Rep. RM-267. Forest
Collins, CO: U.S. Department of Agriculture, Forest Service, Rocky Mountain
Forest and Range Experiment Station: 213–218.
Oliver, W.W.; Ferrell, G.T.; Tappeiner, J.C. 1996. Density management
of Sierra Nevada forests. In: Sierra Nevada ecosystem project: final report to
Congress. Vol. III, assessments, commissioned reports, and background Informa-
tion. Davis, CA: University of California, Center for Water and Wildland Re-
sources: 491–500.
Oliver, W.W.; Powers, R.F. 1978. Growth models for ponderosa pine: I. Yield
of unthinned plantations in northern California. Res. Pap. PSW-133. Berkeley, CA:
U.S. Department of Agriculture, Forest Service, Pacific Southwest Forest and
Range Experiment Station. 21 p.
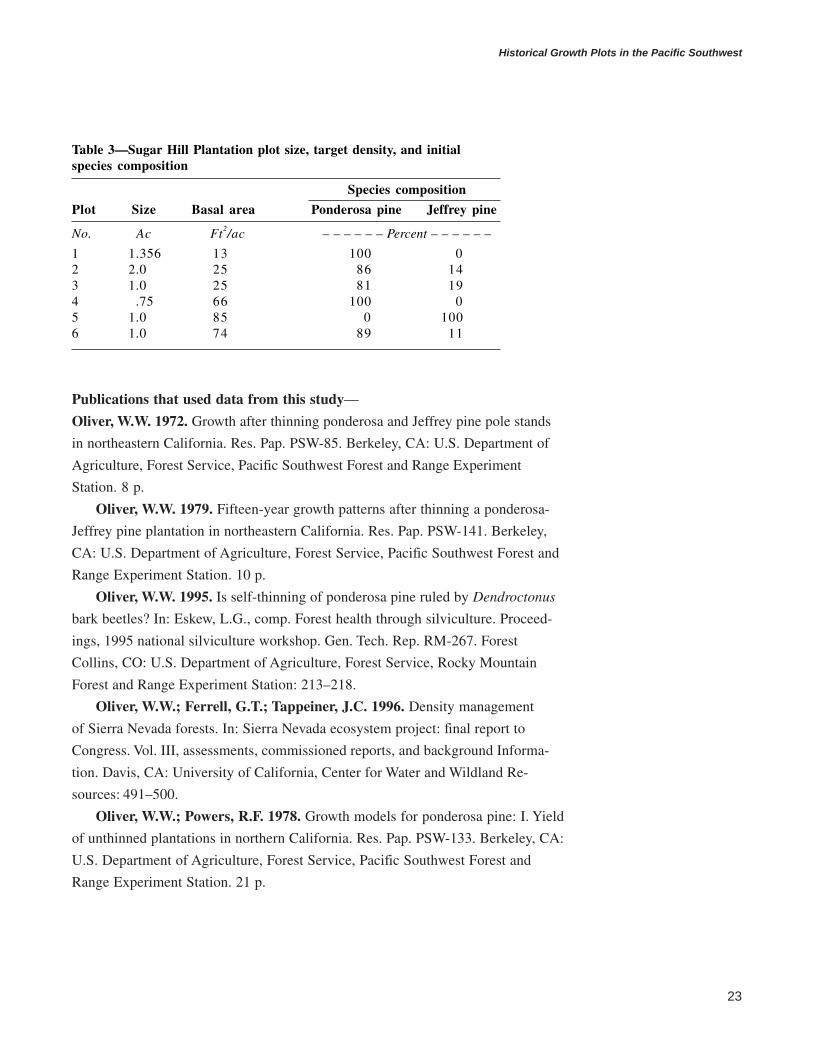
Table 3—Sugar Hill Plantation plot size, target density, and initialspecies composition
Species composition
Plot Size Basal area Ponderosa pine Jeffrey pine
No. Ac Ft2/ac – – – – – – Percent – – – – – –
1 1.356 13 100 02 2.0 25 86 143 1.0 25 81 194 .75 66 100 05 1.0 85 0 1006 1.0 74 89 11

24
GENERAL TECHNICAL REPORT PSW-GTR-213
Oliver, W.W.; Trask, J. 1983. Responses of eastside pine to precommercial
thinning. In: Proceedings, Symposium on management of the eastside pine type in
northeastern California. Reno, NV: Cooperative Extension, University of California
and Northern California Society of American Foresters: 107–113.
Oliver, W.W.; Uzoh, F.C.C. 1997. Maximum stand densities for ponderosa
pine and red and white fir in northern California. In: Proceedings, 18th annual
forest vegetation management conference. Redding, CA: University of California
Cooperative Extension: 57–65.
Uzoh, F.C.C.; Oliver, W.W. 2006. Individual tree height increment model for
managed even-aged stands of ponderosa pine throughout the Western United States
using linear mixed effects models. Forest Ecology and Management. 221: 147–154.
Swain Mountain Experimental Forest (LOGS)
History—
This small stand (fig. 9) on a gentle northwest-facing slope originated from a fire
over 100 years before the study was established, leaving a scattering of large old
trees that were removed several years before the study was established. Merchant-
able logs were skidded to roadside using a rubber-tired grapple skidder. Slash was
piled and burned in the buffer areas. The grapple skidder wounded about 10 percent
of the residual trees. Most of the wounded trees were removed in the rethinning.
Annosus root rot spreading from these old remnants killed some trees in plot 10
during the first few years after the study was established. Plots were rethinned in
November 1996 using SDI as the measure of stand density. Target densities for the
thinned plots were SDIs of 180, 230, 280, 330, 380, and unthinned at 651.
• Location—SE1/4, sec. 30, T. 30 N., R. 8 E. within the Swain Mountain
Experimental Forest
• Latitude/longitude—Lat. 40.43 N.; long. 121.12 W.
• Soil parent material—Basalt
• Elevation—6,400 ft
• Species studied—Mixed white fir and red fir (Abies magnifica A. Murr.)
• Plot installation—1975
• Duration of data collection—1975-ongoing
• Measurement interval—5 years

25
Historical Growth Plots in the Pacific Southwest
Study design—
The twelve 0.5-ac plots are buffered by an isolation strip at least 33 ft wide. The
study design is full randomized with two replications of five basal area stand
densities—140, 170, 200, 230, 260 and unthinned at 367 ft2/ac.
Measurements—
All trees within the plots were measured for dbh. Stem deformities and evidence of
insect and disease attack were also noted. Total height and height to live crown was
Figure 9—Swain Mountain Experimental Forest levels-of-growing-stockplot 8 in 1977 originally thinned to140 ft2 basal area.
Bill
Oliv
er
26
GENERAL TECHNICAL REPORT PSW-GTR-213
measured on a 20 percent systematic sample of the trees. A probability-
proportional-to-size sample of six trees per plot was measured with a Barr and
Stroud optical dendrometer for stem volumes during several remeasurements.
Monumentation—
All measurement trees are tagged and banded in yellow. Height sample trees have
double yellow bands. T-fenceposts marked the plot corners originally but have
mostly disappeared.
Publications that used data from this study—
Cochran, P.H.; Oliver, W.W. 1988. Growth rates for managed stands of white fir.
In: Schmidt, W.C., comp. Proceedings, Future forests of the mountain west: a stand
culture symposium. Gen. Tech. Rep. INT-243. Missoula, MT: U.S. Department of
Agriculture, Forest Service, Intermountain Research Station: 197–200.
Oliver, W.W. 1988. Ten-year growth response of a California red and white
fir sawtimber stand to several thinning intensities. Western Journal of Applied
Forestry. 3(2): 41–43.
Oliver. W.W.; Ferrell, G.T.; Tappeiner, J.C. 1996. Density management
of Sierra Nevada forests. In: Sierra Nevada ecosystem project: final report to
Congress. Vol. III, assessments, commissioned reports, and background informa-
tion. Davis, CA: University of California, Center for Water and Wildland Re-
sources: 491–500.
Zhang, J.W.; Oliver, W.W.; Ritchie, M.W. 2007. Effect of stand densities on
stand dynamics in white fir (Abies concolor) forests in northeast California, USA.
Forest Ecology and Management. 244: 50–59.
Whiskey Springs (LOGS)
History—
The Whiskey Springs study was planned in conjunction with the California Depart-
ment of Forestry and Fire Protection on the Jackson Demonstration State Forest
near Fort Bragg, California. This dense second-growth redwood stand (fig. 10)
originated from sprouts following clearcutting in late 1928. Evidence suggests that
some trees originated from planting. The merchantable logs were skidded from the
study plots by crawler tractors. Slash was lopped and scattered on the plots.

27
Historical Growth Plots in the Pacific Southwest
• Location—Whiskey Springs, along Truck Road (just west of the Whiskey
Springs Residence; At milepost 9.5, approximately 1,000 ft south of
Highway 20) on the Jackson Demonstration State forest
• Latitude/longitude—Lat. 39.37 N.; long. 123.67 W.
• Elevation—800 ft
• Soil parent material—Undivided marine sediments
• Species studied—Coast redwood (Sequoia sempervirens (D. Don) Endl.)
• Duration of data collection—1970 to 1985, 1991, 1999, 2005
• Measurement interval—5 years between 1970–1985; variable thereafter
Figure 10—WhiskeySprings levels-of-growing-stock study. This generalview was photographed in1995.
28
GENERAL TECHNICAL REPORT PSW-GTR-213
Study design—
Four stand density treatments were assigned to each of three plots in a fully ran-
domized design. The twelve 0.4-ac plots are on an east to northeast aspect with
slopes ranging from 15 to 30 degrees. Plots include a 20-ft buffer. Therefore, the
measured trees were restricted to the inner 0.2 ac. Four residual stand densities were
chosen for study—25, 50, 75, and 100 percent of the mean basal area as measured
on the three unthinned (100-percent treatment) plots. These percentages were
equivalent to 100, 200, 300, and 400 ft2 of basal area per acre, respectively. The
plots have not been rethinned.
Measurements—
All trees in the measurement plots were measured for dbh. Total height was mea-
sured on 6 to 15 randomly selected trees per plot.
Monumentation—
All measurement trees are tagged.
Publications that used data from this study—
Lindquist, J.L. 1979. Sprout regeneration of young-growth redwood: sampling
methods compared. Res. Note PSW-337. Berkeley, CA: U.S. Department of Agri-
culture, Forest Service, Pacific Southwest Forest and Range Experiment Station.
8 p.
Lindquist, J.L. 2004. Growth and yield report for the Whiskey Springs
Redwood Commercial Thinning Study: a twenty-nine year status report (1970–
1999). California Forestry Report No. 3. Sacramento, CA: California Department
of Forestry and Fire Protection. 26 p.
Oliver, W.W.; Lindquist, J.L.; Strothman(n), R.O. 1992. Stand response to
thinning young-growth redwoods: implications for management. In: Proceedings,
13th annual forest vegetation management conference. Redding, CA: University of
California Cooperative Extension: 33–43 p.
Oliver, W.W.; Lindquist, J.L.; Strothmann, R.O. 1994. Young-growth
redwood stands respond well to various thinning intensities. Western Journal of
Applied Forestry. 9(4): 106–112.
II. Spacing and Growth StudiesThe purpose of spacing and growth studies is to determine stand growth and health
resulting from various initial spacings. After initial thinning, no subsequent attempt
is made to modify density. Information about PSW spacing and growth studies is
provided below (see fig. 11 for a map of the plots):
The purpose ofspacing and growthstudies is to deter-mine stand growthand health resultingfrom various initialspacings.

29
Historical Growth Plots in the Pacific Southwest
Blacks Mountain Experimental Forest (Methods-of-HarvestCuttings Study)
History—
This massive undertaking (fig. 12) encompassed over 1,000 ac and outlived its
original objective of documenting the growth and mortality after initial entry into
interior pine stands. However, it became relevant again 50 years later when there
was interest in maintaining and creating late-seral stand structures in interior pine
stands. The study then demonstrated that the influx of a dense understory of white
fir and pine could lead to the loss of the large old trees and the creation of a more
uniform structure, heavy fuel loads, and an attendant high danger of wildfire. This
contradicted the popular belief that, in the absence of fire, old growth would
develop best in unmanaged forests.
After the last measurement in 1998–99, the study was terminated and the stands
incorporated into a new study designed to test the ecological effects of contrasting
stand structures, grazing, and prescribed fire on these interior pine forests (Oliver
2000).
Figure 11—Spacing and growth study plots in California.

30
GENERAL TECHNICAL REPORT PSW-GTR-213
• Location—Within the Blacks Mountain Experimental Forest
• Latitude/longitude—Lat. 41.72 N.; long. 121.13 W.
• Elevation—5,700 to 6,800 ft
• Soil parent material—Basalt
• Species studied—Ponderosa pine, Jeffrey pine, incense-cedar (Calocedrus
decurrens (Torr.) Florin), and white fir
• Plot installation—1938-1947
• Duration of data collection—1938 to 1999
• Measurement interval—5, 10, 20, and 30 years
Study design—
Each year from 1938 to 1947, a set of four to six 20-ac rectangular plots, 660 by
1,320 ft (10 by 20 chains), was established in previously unlogged stands. Plots
Figure 12—Marking trees in 1944 at the Blacks Mountain ExperimentalForest methods-of-harvest cuttings plot.
Cla
rk H
. G
leas
on

31
Historical Growth Plots in the Pacific Southwest
were buffered by a 100-ft isolation strip. Orientation of the rectangular plots was
perpendicular to the contour to reduce within-plot variation caused by elevation.
Treatments tested spanned the range from an unlogged control, to removal of
various proportions of the merchantable volume (trees 11.6 in dbh and larger), to
removal of all merchantable trees.
Measurements—
All saw-log trees were measured for dbh with a diameter tape and recorded by spe-
cies at each measurement. The only exception is the unit area control treatment,
which was not measured in 1998–99. During all but the last remeasurement in
1998–99, total height was ocularly estimated to the nearest 16-ft log and crown
shape, foliage compliment, and Dunning Crown Class (Dunning 1928), if pine, was
recorded. The location of all saw-log trees was ocularly estimated within the 66- by
66-ft grid (see Monumentation below), as was the location of ingrowth into this size
class in subsequent remeasurements. Evidence of insect and disease attack was also
noted.
Pole-sized trees (3.5 to 11.5 in dbh) were tallied by dbh within each 66- by
66-ft grid during the initial and 5-year remeasurements. During the last measure-
ment, pole-sized trees were sampled by tallying by dbh class all poles within five
randomly selected 66- by 660-ft strips across the short side of each plot. Seedlings
were tallied by height classes within 0.01-ac circular plots.
Monumentation—
Plot corners were marked with 4- by 4-in cedar or redwood posts and plot bound-
aries blazed and painted in yellow. A 66- by 66-ft (1-chain) grid was surveyed
within each plot and marked with 1- by 1-in redwood stakes. All trees 11.6 in dbh
and larger (saw-log trees) were tagged at breast height. Ingrowth was designated by
a horizontal bar on the tree tag. Smaller trees were not tagged.
Publications that used data from this study—
Dolph, K.L.; Mori, S.R.; Oliver, W.W. 1995. Height-diameter relationships for
conifer species on the Blacks Mountain Experimental Forest. Res. Note PSW-418.
Albany, CA: U.S. Department of Agriculture, Forest Service, Pacific Southwest
Research Station. 5 p.
Dolph, K.L.; Mori, S.R.; Oliver, W.W. 1995. Long-term response of old-
growth stands to varying levels of partial cutting in the eastside pine type. Western
Journal of Applied Forestry. 10(3): 101–108.

32
GENERAL TECHNICAL REPORT PSW-GTR-213
Dunning, D.; Hasel, A.A. 1945. The Blacks Mountain Experimental Forest: a
sustained yield experiment in ponderosa pine in northeastern California. Berkeley,
CA: U.S. Department of Agriculture, Forest Service, California Forest and Range
Experiment Station. 23 p.
Hasel, A.A. 1938. Methods-of-cutting demonstration plots. Berkeley, CA: U.S.
Department of Agriculture, Forest Service, California Forest and Range Experi-
ment Station. 3 p.
Eaton, C.B. 1959. Insect-caused mortality in relation to methods of cutting in
ponderosa pine on the Blacks Mountain Experimental Forest. Tech. Paper 43.
Berkeley, CA: U.S. Department of Agriculture, Forest Service, Pacific Southwest
Forest and Range Experiment Station. 33 p.
Furniss, M.M.; Hallin, W.E. 1955. Development of high-risk trees in pon-
derosa and Jeffrey pine stands following sanitation-salvage cutting. Res. Note 94.
Berkeley, CA: U.S. Department of Agriculture, Forest Service, California Forest
and Range Experiment Station. 2 p.
Hasel, A.A. 1946. Logging cost as related to tree size and intensity of cutting
in ponderosa pine. Journal of Forestry. 44(8): 552–560.
Hasel, A.A. 1949. Long-term silvicultural experiment on methods of cutting.
Proceedings of the Berkeley symposium on mathematical statistics and probability.
Berkeley, CA: University of California Press: 477–479.
Oliver, W.W. 2000. Ecological research at the Blacks Mountain Experimental
Forest in northeastern California. Gen. Tech. Rep. PSW-179. Albany, CA: U.S.
Department of Agriculture, Forest Service, Pacific Southwest Research Station.
66 p.
Oliver, W.W. 2002. Snag frequencies 50 years after partially cutting interior
ponderosa pine stands. In: Parker, S.; Hummel, S.S., comps. Beyond 2001: a
silviculture odyssey to sustaining terrestrial and aquatic ecosystems. Proceedings
of 2001 national silviculture workshop. Gen. Tech. Rep. PNW-546. Portland, OR:
U.S. Department of Agriculture, Forest Service, Pacific Northwest Research
Station: 47–51.
O’Regan, W.G.; Arvanitis, L.G. 1967. Cost-effectiveness in forest sampling.
Forest Science. 12(4): 406–414.
Salman, K.A.; Bongberg, J.W. 1942. Logging high-risk trees to control
insects in the pine stands of northeastern California. Journal of Forestry. 40(7):
533–539.
Vora, R.S. 1988. A comparison of the spherical densiometer and ocular
methods of estimating canopy cover. Great Basin Naturalist. 48(2): 224–227.

33
Historical Growth Plots in the Pacific Southwest
Vora, R.S. 1988. Potential soil compaction forty years after logging in north-
eastern California. Great Basin Naturalist. 48(1): 117–120.
Vora, R.S. 1988. Predicting biomass of five shrub species in northeastern
California. Journal of Range Management. 41(1): 63–65.
Vora, R.S. 1988. Species frequency in relation to timber harvest methods and
elevation in the pine type of northeastern California. Madrono. 35(2): 150–158.
Vora, R.S. 1993. Effects of timber harvest treatments on understory plants and
herbivores in northeastern California after 40 years. Madrono. 40(1): 31–37.
Wickman, B.E.; Eaton, C.B. 1962. The effects of sanitation-salvage cutting
on insect-caused pine mortality at Blacks Mountain Experimental Forest 1938–
1959. Tech. Pap. 66. Berkeley, CA: U.S. Department of Agriculture, Forest
Service, Pacific Southwest Forest and Range Experiment Station. 39 p.
Youngblood, A.; Max, T.; Coe, K. 2004. Stand structure in eastside old-
growth ponderosa pine forests of Oregon and northern California. Forest Ecology
and Management 199: 191–217.
Caspar Creek Precommercial Stocking Control of CoastRedwood
History—
In this study, completed in conjunction with the California Department of Forestry
and Fire Protection, precommercial thinning was performed on 18 plots within a
19-year-old stand. Each plot is 0.4 ac. The 14-ac unit, which was selected for study,
had previously been clearcut in 1961 as part of the Caspar Creek Cutting Trials. In
1981, five treatments were performed (100, 150, 200, 250, and 300 trees per acre
plus an unthinned control). Plots were measured immediately after precommercial
thinning, and again in 1986 and 1998. Because treatments were not performed
subsequent to 1981, this study functions as a spacing study.
• Location—Jackson Demonstration State Forest on the west side of Road
600, south of the junctions between Road 600 and Roads 620 and 630
• Latitude/longitude—Lat. 39.38 N.; long. 123.67 W.
• Species studied—Coast redwood
• Duration of data collection—1981, 1986, 1998
Publications that used data from this study—
Lindquist, J.L. 2004. Precommercial stocking control of coast redwood: a seven-
teen-year status report (1981–1998). California Forestry Report No. 2. Sacramento,
CA: California Department of Forestry and Fire Protection.
34
GENERAL TECHNICAL REPORT PSW-GTR-213
Challenge Experimental Forest (Initial Spacing Study)
History—
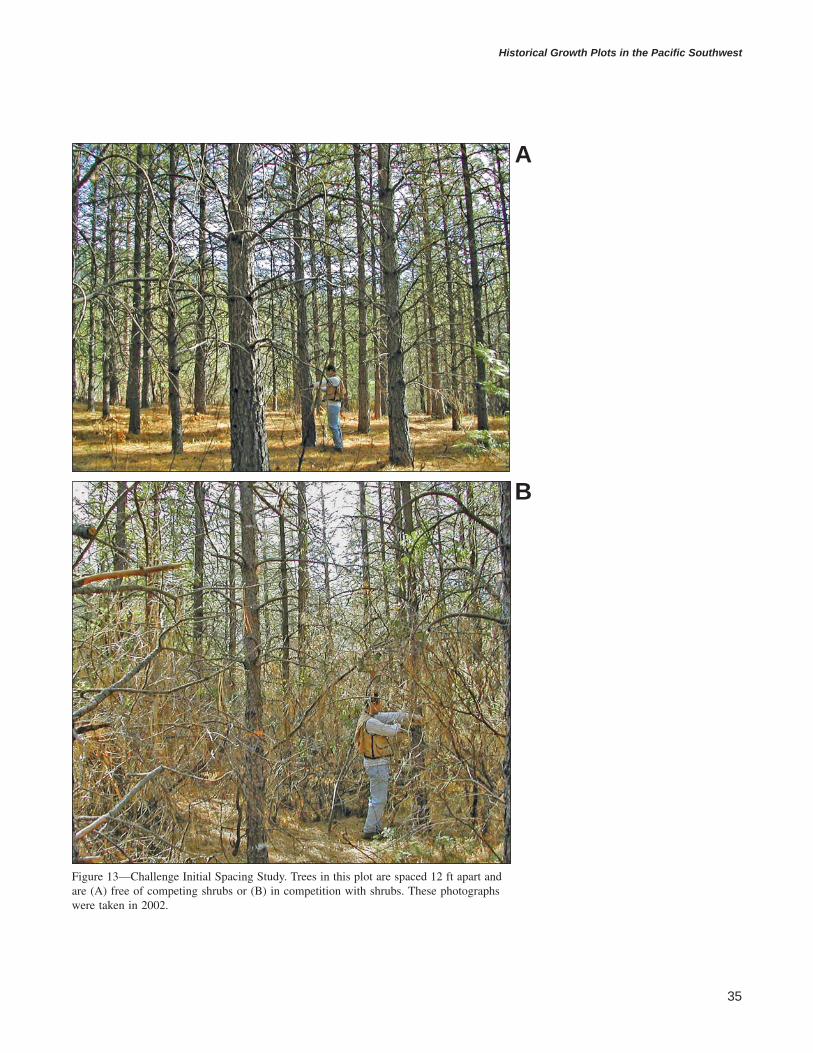
The study (fig. 13) was established within a 15-ac clearcut created especially for
this study. The study has proven to be a popular stop for tours of the experimental
forest because it demonstrates the dramatic effect of both intertree and shrub
competition on ponderosa pine growth.
• Location—NW1/4 of the SE1/4 of sec. 29, T. 19 N., R. 7 E., MDM within
the Challenge Experimental Forest
• Latitude/longitude—Lat. 39.48 N.; long. 121.22 W.
• Elevation—2,650 ft
• Soil parent material—Metavolcanics
• Species studied—Ponderosa pine
• Plot installation—1966
• Duration of data collection—1968-ongoing
• Measurement interval—1 to 5 years
Study design—
Plots are arranged in a randomized block design with split plots. Five square
spacings—6, 9, 12, 15, and 18 ft—were established by planting in each of two
blocks. Each spacing plot was split in half with shrubs allowed to develop naturally
on one half and shrubs removed on the other half. Shrubs were removed by hand
grubbing for the first 5 years and then periodically killed by herbicides, thereafter.
The spacing plots are buffered by three rows of trees or a minimum of 21 ft. The
interior division between subplots is buffered by two rows of trees. All subplots
contain 12 measurement trees regardless of spacing. Therefore, the size of subplots
with buffer differs by spacing from 0.11 ac for the 6-ft spacing to 0.36 ac for the
18-ft spacing.
Measurements—
All measurement trees were measured for dbh, total height, height to live crown,
and crown width. Evidence of insect and disease attack was also noted. Taped
measurements were taken at 1 ft and at the base of the live crown on all measure-
ment trees to determine stem volume during several remeasurements.
Monumentation—
Plot corners are monumented by metal fenceposts. Interior subplot corners are
monumented by short metal stakes. All measurement trees are numbered by a tag
attached to a wire stake in the ground adjacent to the tree. Diameter at breast height
is indicated by a yellow band.
35
Historical Growth Plots in the Pacific Southwest
Figure 13—Challenge Initial Spacing Study. Trees in this plot are spaced 12 ft apart andare (A) free of competing shrubs or (B) in competition with shrubs. These photographswere taken in 2002.
A
B

36
GENERAL TECHNICAL REPORT PSW-GTR-213
Publications that used data from this study—
McDonald, P.M.; Oliver, W.W. 1984. Woody shrubs retard growth of ponderosa
pine seedlings and saplings. In: Proceedings, 5th annual forest vegetation manage-
ment conference. Redding, CA: University of California Cooperative Extension:
65–89.
Oliver, W.W. 1974. Moisture stress related to spacing and brush competition in
a ponderosa pine plantation [Abstract]. In: Proceedings, 3rd North American forest
biology workshop. Fort Collins, CO: College of Forestry and Natural Resources,
Colorado State University: 378–379.
Oliver, W.W. 1980. Early response of ponderosa pine to spacing and brush:
observations on a 12-year-old plantation. Res. Note PSW-341. Albany, CA: U.S.
Department of Agriculture, Forest Service, Pacific Southwest Research Station.
7 p.
Oliver, W.W. 1990. Brush competition retards early stand development of
planted ponderosa pine: update on a 24-year study. In: Proceedings, 11th annual
forest vegetation management conference. Redding, CA: University of California
Cooperative Extension: 107–113.
Oliver, W.W. 1990. Spacing and shrub competition influence 20-year develop-
ment of planted ponderosa pine. Western Journal of Applied Forestry. 5(3): 79–82.
Oliver, W.W. 1995. Is self-thinning of ponderosa pine ruled by Dendroctonus
bark beetles? In: Eskew, L.G., comp. Forest health through silviculture. Proceed-
ings of the 1995 national silviculture workshop. Gen. Tech. Rep. RM-267. Fort
Collins, CO: U.S. Department of Agriculture, Forest Service, Rocky Mountain
Forest and Range Experiment Station: 213–218.
Oliver, W.W.; Ferrell, G.T.; Tappeiner, J.C. 1996. Density management of
Sierra Nevada forests. In: Sierra Nevada ecosystem project: final report to Con-
gress. Vol. III, assessments, commissioned reports, and background information.
Davis, CA: University of California, Center for Water and Wildland Resources:
491–500.
Oliver, W.W.; Uzoh, F.C.C. 1997. Maximum stand densities for ponderosa
pine and red and white fir in northern California. In: Proceedings, 18th annual
forest vegetation management conference. Redding, CA: University of California
Cooperative Extension: 57-65.Powers, R.F.; Oliver, W.W. 1984. Ponderosa pine plantation growth in
northern California…brush competition and response to release. In: Summaries ofthe proceedings of the 1984 western forestry conference. Sacramento, CA: WesternForestry and Conservation Association: 122–125.
37
Historical Growth Plots in the Pacific Southwest
Zhang, J.W; Oliver, W.W.; Busse, M.D. 2006. Growth and development of
ponderosa pine on sites of contrasting productivities: relative importance of stand
density and shrub competition effects. Canadian Journal of Forest Research. 36:
2426–2438.
Stanislaus-Tuolumne Experimental Forest (Methods-of-HarvestCuttings Study)
History—
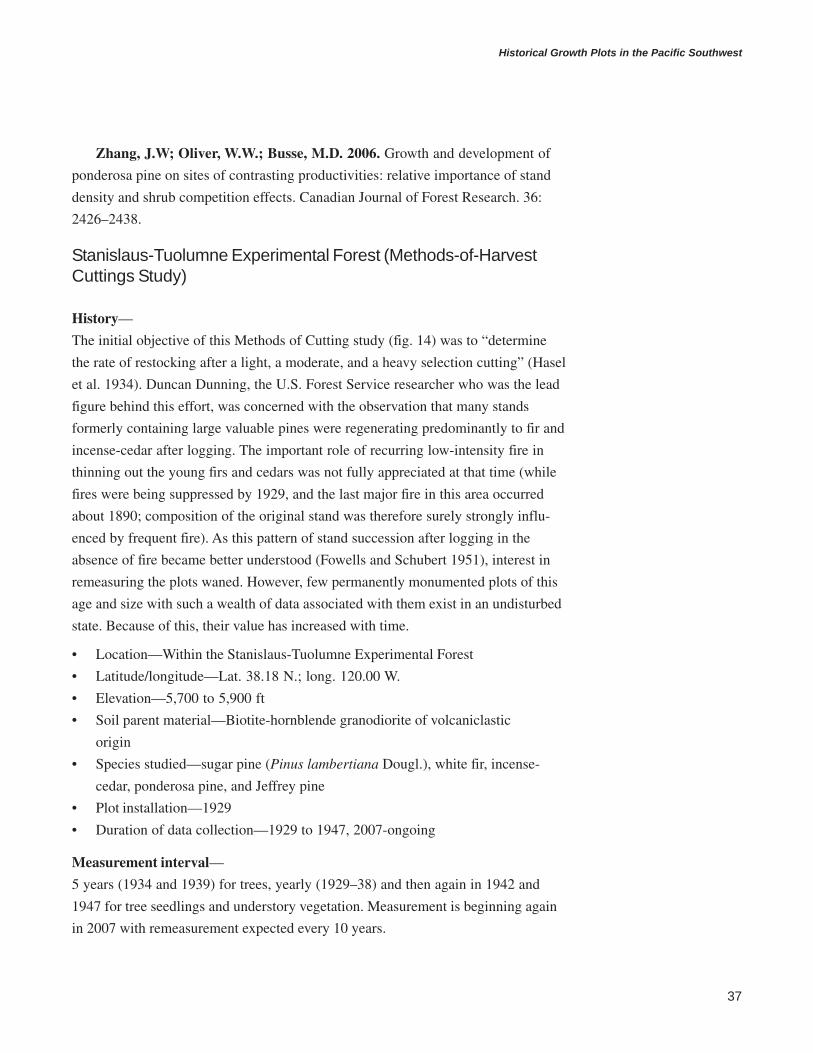
The initial objective of this Methods of Cutting study (fig. 14) was to “determine
the rate of restocking after a light, a moderate, and a heavy selection cutting” (Hasel
et al. 1934). Duncan Dunning, the U.S. Forest Service researcher who was the lead
figure behind this effort, was concerned with the observation that many stands
formerly containing large valuable pines were regenerating predominantly to fir and
incense-cedar after logging. The important role of recurring low-intensity fire in
thinning out the young firs and cedars was not fully appreciated at that time (while
fires were being suppressed by 1929, and the last major fire in this area occurred
about 1890; composition of the original stand was therefore surely strongly influ-
enced by frequent fire). As this pattern of stand succession after logging in the
absence of fire became better understood (Fowells and Schubert 1951), interest in
remeasuring the plots waned. However, few permanently monumented plots of this
age and size with such a wealth of data associated with them exist in an undisturbed
state. Because of this, their value has increased with time.
• Location—Within the Stanislaus-Tuolumne Experimental Forest
• Latitude/longitude—Lat. 38.18 N.; long. 120.00 W.
• Elevation—5,700 to 5,900 ft
• Soil parent material—Biotite-hornblende granodiorite of volcaniclastic
origin
• Species studied—sugar pine (Pinus lambertiana Dougl.), white fir, incense-
cedar, ponderosa pine, and Jeffrey pine
• Plot installation—1929
• Duration of data collection—1929 to 1947, 2007-ongoing
Measurement interval—
5 years (1934 and 1939) for trees, yearly (1929–38) and then again in 1942 and
1947 for tree seedlings and understory vegetation. Measurement is beginning again
in 2007 with remeasurement expected every 10 years.
38
GENERAL TECHNICAL REPORT PSW-GTR-213
A B
Figure 14—View from photo point within “Method of Cutting” plot 11 on the Stanislaus-TuolumneExperimental Forest. This plot was harvested using a system of heavy cutting, replicating the practice ofremoving all merchantable timber and abandoning the land, common in the private sector at that time. (A)Before logging, in May 1929; (B) After logging, in October 1929.
Dun
can
Dun
ning
Study design—
Three approximately 10-ac rectangular “Methods of Cutting” (MC) plots, were
established in spring 1929 within the boundaries of a larger study to evaluate the
economics of different logging and milling practices. The stand in which the plots
were placed was previously unlogged old-growth mixed conifer with a relatively
high proportion of sugar pine on excellent site quality land. The three logging treat-
ments were compared. The MC plot 9 was marked according to standard Forest
Service practices, which was a sanitation-salvage improvement cutting of all spe-
cies, focusing on release of pines, spacing of seed trees and improved growth of
the residual stand. The MC plot 10 was logged according to an economic selection
system proposed by a firm of consulting foresters. The objective was to remove
high-value trees (mainly larger defect-free pines), without improvement cutting for
sanitation salvage, or growth of the residual stand. The MC plot 11 was marked for

39
Historical Growth Plots in the Pacific Southwest
a heavy cut by the lead faller for the Pickering Lumber Company, with the objec-
tive of giving the highest return per acre to the landowner, who was then to abandon
the land. With this treatment, all merchantable trees were cut.
The MC plots 9 and 11 were each 594 by 792 ft (9 chains by 12 chains),
while MC plot 10 was 528 by 792 ft (8 chains by 12 chains). Plots were orientated
perpendicular to the contour on the same north-northwest facing slope to reduce
among-plot variation caused by elevation. Logging was done in June and July
1929.
Nine additional methods of cutting plots were established nearby on Stanislaus
National Forest lands during the 1920s, but only the three listed here are known to
be undisturbed since initial treatment entry.
Measurements—
Before logging, all trees with a diameter greater than 3.6 in dbh were mapped with
a transit and chain and labeled with a uniquely numbered metal tag. Diameter at
breast height and height were measured and species noted for all trees. Boundaries
of brush, logs, and rock outcrops were also drawn on the maps. Three transects (one
per plot) were established. Along each transect, there were 100 quadrats, each a
milacre (6.6 by 6.6 ft) in size, within which shrubs and tree seedlings were mapped
in greater detail. Height and species of each tree seedling were noted. On every 10th
quadrat, herbaceous vegetation was also quantified (for a total of 10 quadrats per
transect). After logging, plots were remapped to show damage and tags applied to
all trees greater than 3.6 in dbh.
Trees were remeasured in 1934 and again in 1939. As saplings reached the 3.6
in threshold, they were tagged and measured as well. Black and white photographs
were taken from points noted on the maps prior to logging, and photos were taken
of some points again after logging. Vegetation within the milacre quadrats was
evaluated yearly and remapped periodically through 1947. The three methods of
cutting plots and associated data were rediscovered in 2006. Original plot maps
were digitized, and remapping of trees was completed in 2008. Many of the trees
still contain their original numbered tags.
Monumentation—
Plot corners are marked with pieces of metal pipe pounded into the ground. A 66-
by 66-ft (1-chain) grid was surveyed within each plot, and many of the grid points
along the outer boundaries are marked with the same metal pipe. All four corners of
the 300 milacre quadrats are also marked with metal pipe, although a number of
these corner posts have been lost over time.

40
GENERAL TECHNICAL REPORT PSW-GTR-213
Publications that used data from this study—
Fowells, H.A.; Schubert, G.H. 1951. Natural reproduction in certain cutover pine-
fir stands of California. Journal of Forestry. 49: 192–196.
Fowells, H.A.; Schubert, G.H. 1956. Seed crops of forest trees in the pine
region of California. Tech. Bull. 1150. Washington, DC: U.S. Department of
Agriculture. 47 p.
Hasel, A.A.; Wohletz, E.; Tallmon, W.B. 1934. Methods-of-cutting, Califor-
nia Forest and Range Experiment Station, Stanislaus Branch, Plots 9, 10, 11,
Progress Report. 137 p. Unpublished report. On file with: USDA Forest Service,
Pacific Southwest Research Station, Silviculture Laboratory, 3644 Avtech Parkway,
Redding, CA 96002.
Wagener, W.W. 1961. Past fire incidence in Sierra Nevada forests. Journal of
Forestry. 59: 739–748.
Swain Mountain Experimental Forest (Initial Spacing Study)
History—
This extremely dense sapling stand, averaging 9,700 stems per acre, was released
from a ragged overstory of red fir 12 years before the study was installed. Conse-
quently, thinning treatments were performed in stages. All plots were thinned in
1972 to 20 ft2 per tree. The 40 ft2 treatment was rethinned to its designed spacing
in 1976, and the three wider spacings were established in 1980 (fig. 15).
• Location—The NE1/4 of sec. 32, T. 30. N., R. 8 E. MDM within the
Swain Mountain Experimental Forest
• Latitude/longitude—Lat. 40.43 N.; long. 121.10 W.
• Elevation—6,700 ft
• Soil parent material—Basalt
• Species studied—Red fir
• Plot installation—1972
• Duration of data collection—1972 to 2002
• Measurement interval—4 to 6 years
Study design—
The ten 0.2-ac plots are arranged in a fully randomized design with two replications
on a northeast-facing slope. Five spacings were assigned based on areas per tree of
20, 40, 80, 160, and 320 ft2. The plots are buffered with a 20-ft isolation strip.
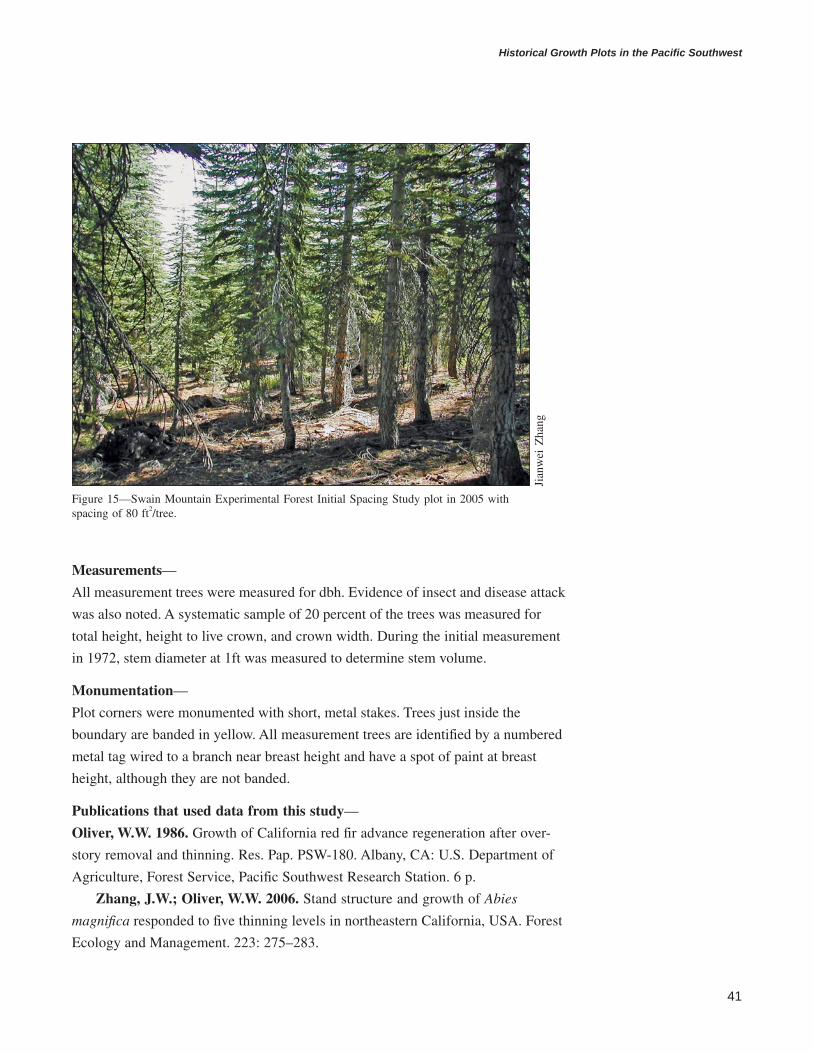
41
Historical Growth Plots in the Pacific Southwest
Measurements—
All measurement trees were measured for dbh. Evidence of insect and disease attack
was also noted. A systematic sample of 20 percent of the trees was measured for
total height, height to live crown, and crown width. During the initial measurement
in 1972, stem diameter at 1ft was measured to determine stem volume.
Monumentation—
Plot corners were monumented with short, metal stakes. Trees just inside the
boundary are banded in yellow. All measurement trees are identified by a numbered
metal tag wired to a branch near breast height and have a spot of paint at breast
height, although they are not banded.
Publications that used data from this study—
Oliver, W.W. 1986. Growth of California red fir advance regeneration after over-
story removal and thinning. Res. Pap. PSW-180. Albany, CA: U.S. Department of
Agriculture, Forest Service, Pacific Southwest Research Station. 6 p.
Zhang, J.W.; Oliver, W.W. 2006. Stand structure and growth of Abies
magnifica responded to five thinning levels in northeastern California, USA. Forest
Ecology and Management. 223: 275–283.
Figure 15—Swain Mountain Experimental Forest Initial Spacing Study plot in 2005 withspacing of 80 ft2/tree.
Jian
wei
Zha
ng

42
GENERAL TECHNICAL REPORT PSW-GTR-213
Trough Springs Ridge (Initial Spacing Study)
History—
This study (fig. 16) was established in an 11-year-old plantation that originated
after a fire. The soil, determined to be a shallow form of the Sheetiron Series
prefire, was degraded to a Maymen Series when much of the “A” horizon was
removed in clearing the site for planting. The Maymen Series is generally consid-
ered to support only shrubs. The study was originally designed to be an installation
in the West-Wide Levels-of-Growing-Stock study for even-aged ponderosa pine.
Thus, the tree spacings are equivalent to GSLs prescribed in Myers’ (1967) study
plan. However, after the 5-year remeasurement, it was determined that tree stand
density had no influence on tree growth because of the dense shrub understory.
Therefore, the field design was altered to investigate the interrelationships of
tree spacing and shrub density on growth of ponderosa pine on a site of low
productivity.
• Location—E1/2 of the W1/2 of sec. 32, T. 17 N., R. 7 W., MDM within the
Stonyford Ranger District, Mendocino National Forest
• Latitude/longitude—Lat. 39.28 N.; long. 122.67 W.
• Elevation—4,000 ft
• Soil parent material—Metasediments
• Species studied—Ponderosa pine
• Plot installation—1970
• Duration of data collection—1970-ongoing
• Measurement interval—5 to 9 years
Study design—
Fifteen 0.25-ac plots are arranged on various aspects along a narrow ridge in a
randomized block design with split plots. Plots were grouped into three blocks on
the basis of small differences in site quality. Five spacings are under test, each
replicated three times. Each spacing plot is split into three subplots. All shrubs were
allowed to develop naturally on one subplot, half were removed in the middle
subplot, and all were removed by cutting at ground line in the other outer subplot.
The nonsprouting forms of Arctostaphylos sp. made retreatment unnecessary. The
spacing plots are buffered by a 20-ft isolation strip. The interior divisions between
the subplots are not buffered.
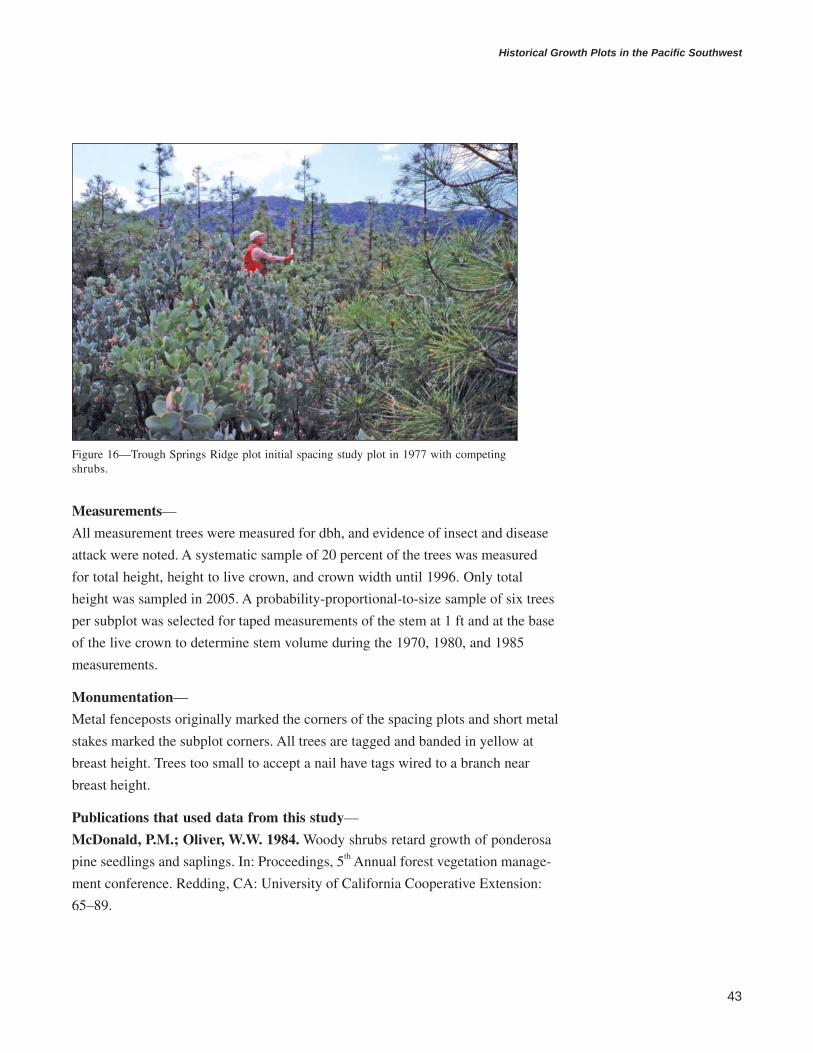
43
Historical Growth Plots in the Pacific Southwest
Measurements—
All measurement trees were measured for dbh, and evidence of insect and disease
attack were noted. A systematic sample of 20 percent of the trees was measured
for total height, height to live crown, and crown width until 1996. Only total
height was sampled in 2005. A probability-proportional-to-size sample of six trees
per subplot was selected for taped measurements of the stem at 1 ft and at the base
of the live crown to determine stem volume during the 1970, 1980, and 1985
measurements.
Monumentation—
Metal fenceposts originally marked the corners of the spacing plots and short metal
stakes marked the subplot corners. All trees are tagged and banded in yellow at
breast height. Trees too small to accept a nail have tags wired to a branch near
breast height.
Publications that used data from this study—
McDonald, P.M.; Oliver, W.W. 1984. Woody shrubs retard growth of ponderosa
pine seedlings and saplings. In: Proceedings, 5th Annual forest vegetation manage-
ment conference. Redding, CA: University of California Cooperative Extension:
65–89.
Figure 16—Trough Springs Ridge plot initial spacing study plot in 1977 with competingshrubs.

44
GENERAL TECHNICAL REPORT PSW-GTR-213
Oliver, W.W. 1984. Brush reduces growth of thinned ponderosa pine in
northern California. Res. Pap. PSW-172. Albany, CA: U.S. Department of Agricul-
ture, Forest Service, Pacific Southwest Research Station. 7 p.
Oliver, W.W.; Ferrell, G.T.; Tappeiner, J.C. 1996. Density management
of Sierra Nevada forests. In: Sierra Nevada ecosystem project: final report to
Congress. Vol. III, assessments, commissioned reports, and background Informa-
tion. Davis, CA: University of California, Center for Water and Wildland Re-
sources: 491–500.
Powers, R.F.; Oliver, W.W. 1984. Ponderosa pine plantation growth in
northern California: brush competition and response to release. In: Summaries
of the proceedings of the 1984 Western Forestry Conference. Sacramento, CA:
Western Forestry and Conservation Association: 122–125.
Zhang, J.W.; Oliver, W.W.; Busse, M.D. 2006. Growth and development of
ponderosa pine on sites of contrasting productivities: relative importance of stand
density and shrub competition effects. Canadian Journal of Forest Research. 36:
2426–2438.
III. Garden of Eden StudiesThe Garden of Eden experiment was established to determine how combinations of
intensive silviculture affect the productivity of ponderosa pine plantations. The
experiment centers on lands owned by industrial forestry cooperators throughout
northern California and across an extreme range of site qualities. Originally, nine
installations were established between 1986 and 1988. Of these, six remain today
(fig. 17). Each installation was prepared carefully and planted with families of
ponderosa pine recommended by the Forest Service, Pacific Southwest Region
geneticist for superior growth performance for that elevation and seed zone.
Installations were remeasured regularly (fig. 18). To ensure nursery uniformity,
seedlings were raised for planting at the PSW’s Institute of Forest Genetics at
Placerville.
Treatment plots measuring 0.11 ac each (64 by 72 ft) are arranged in four
columns and six rows, with an identical arrangement at all installations (fig. 19).
Treatments were applied in a completely randomized design of three replications
each of eight treatments. Unless otherwise noted, all treatments were the same at
each installation. Treatments consisted of a control (“C” no further treatment
beyond planting), herbicide (“H” applied annually to eliminate any competing
vegetation other than planted trees), insecticide (“I” applied annually as a spray of
systemic chemicals), and fertilization (“F” a mixture of macro- and micronutrients
The Garden of Edenexperiment wasestablished to de-termine how combi-nations of intensivesilviculture affectthe productivity ofponderosa pineplantations.

45
Historical Growth Plots in the Pacific Southwest
Figure 17—Garden of Eden plots.
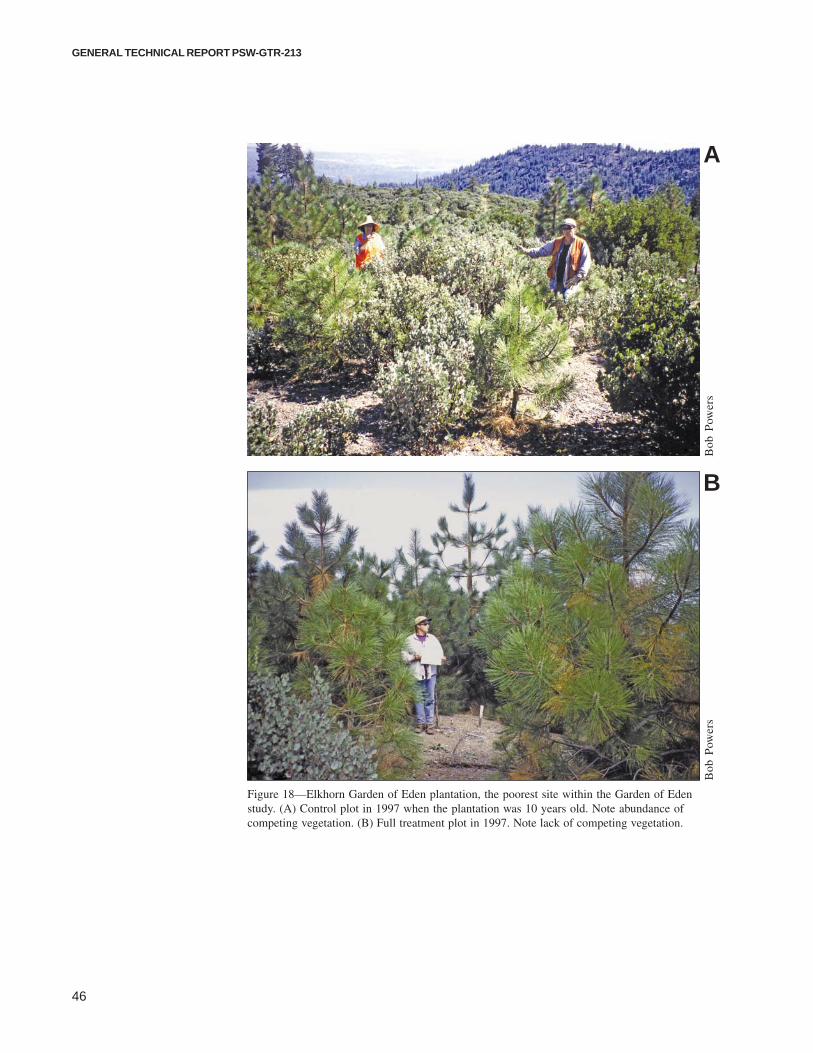
46
GENERAL TECHNICAL REPORT PSW-GTR-213
Bob
Pow
ers
Bob
Pow
ers
A
B
Figure 18—Elkhorn Garden of Eden plantation, the poorest site within the Garden of Edenstudy. (A) Control plot in 1997 when the plantation was 10 years old. Note abundance ofcompeting vegetation. (B) Full treatment plot in 1997. Note lack of competing vegetation.

47
Historical Growth Plots in the Pacific Southwest
applied biennially at a geometric rate). Applied in all factorial combinations, this
resulted in eight treatments and 24 treatment plots per installation (fig. 19). Herbi-
cides (primarily glyphosate) were applied to “H” plots by directed spray in con-
secutive springs until all competing vegetation was eliminated (usually by 6 years).
Insecticides (acephate and dimethoate) were applied each spring by backpack
sprayer directly to tree foliage in the “I” treatments to the point of crown drip. This
was discontinued after the 8th year when no insect problems had been observed in
any treatments. Fertilizers (nitrogen, phosphorus, potassium, calcium, magnesium,
sulfur, zinc, copper, boron) were applied at planting in holes at four sides of each
tree in the “F” treatment at a distance of about two-thirds the height of the tree.
Preweighed fertilizers were applied prior to growth in the spring in years 1, 3, 5,
Figure 19—Standard layout of 24 treatment plots in the Garden ofEden experiment. Plot numbers are tagged on wooden orange stakesin the lower right corner. C = control, H = herbicide, F = fertilizer,I = insecticide. Each of the 24 treatment plots measures 64 by 72 ft.
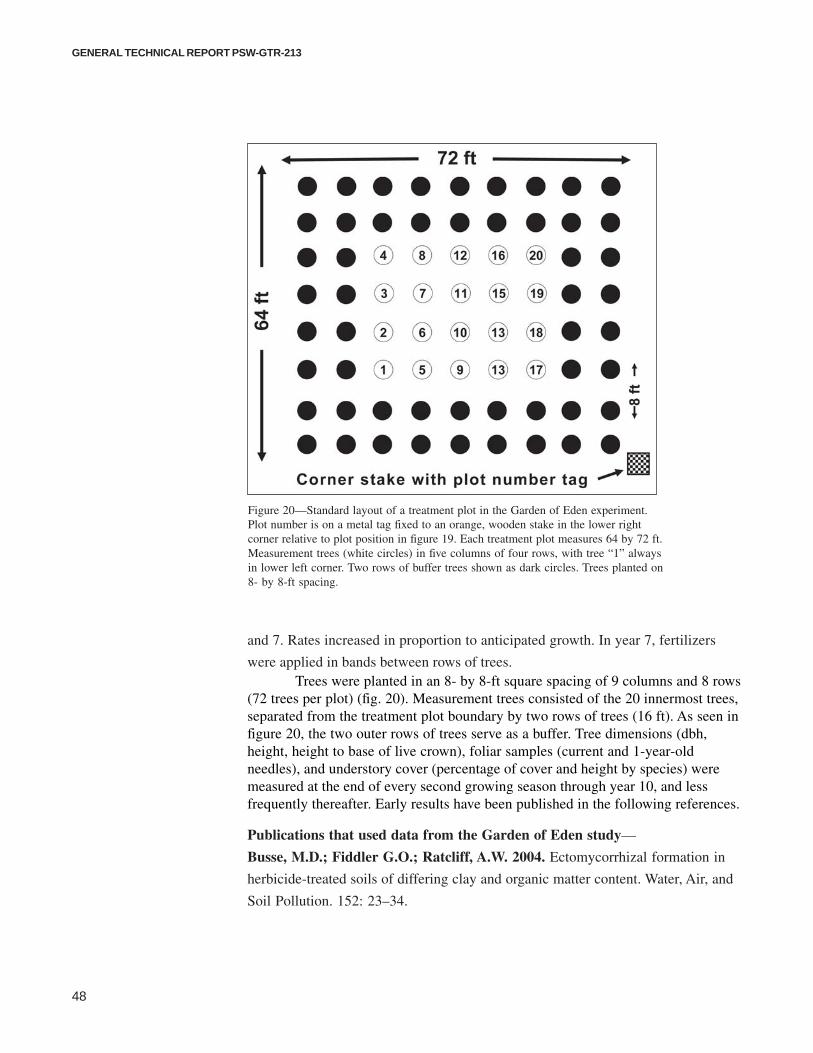
48
GENERAL TECHNICAL REPORT PSW-GTR-213
and 7. Rates increased in proportion to anticipated growth. In year 7, fertilizers
were applied in bands between rows of trees.Trees were planted in an 8- by 8-ft square spacing of 9 columns and 8 rows
(72 trees per plot) (fig. 20). Measurement trees consisted of the 20 innermost trees,separated from the treatment plot boundary by two rows of trees (16 ft). As seen infigure 20, the two outer rows of trees serve as a buffer. Tree dimensions (dbh,height, height to base of live crown), foliar samples (current and 1-year-oldneedles), and understory cover (percentage of cover and height by species) weremeasured at the end of every second growing season through year 10, and lessfrequently thereafter. Early results have been published in the following references.
Publications that used data from the Garden of Eden study—
Busse, M.D.; Fiddler G.O.; Ratcliff, A.W. 2004. Ectomycorrhizal formation in
herbicide-treated soils of differing clay and organic matter content. Water, Air, and
Soil Pollution. 152: 23–34.
Figure 20—Standard layout of a treatment plot in the Garden of Eden experiment.Plot number is on a metal tag fixed to an orange, wooden stake in the lower rightcorner relative to plot position in figure 19. Each treatment plot measures 64 by 72 ft.Measurement trees (white circles) in five columns of four rows, with tree “1” alwaysin lower left corner. Two rows of buffer trees shown as dark circles. Trees planted on8- by 8-ft spacing.

49
Historical Growth Plots in the Pacific Southwest
Busse, M.D.; Rappaport, N.G.; Powers, R.F. 2000. Tolerance of soil organ-
isms to herbicide applications in ponderosa pine plantations: Initial findings. In:
Cooper, S.L., comp. Reforestation for the New Millemium: back to our roots.
Proceedings of the 21st annual forest vegetation management conference, Redding,
CA: University of California Cooperative Extension: 33–38.
Busse, M.D.; Rappaport, N.G.; Powers, R.F. 2001. Hexazinone effects on
soil biota and processes: initial findings. In: Cooper, S.L., comp. Proceedings, 22nd
annual forest vegetation management conference. Redding, CA: University of
California Cooperative Extension: 66–72.
Busse, M.D.; Ratcliff, A.W.; Shestak, C.J.; Powers, R.F. 2000. Non-target
effects of glyphosate on soil microbes. In: Proceedings, California Weed Science
Society. California Weed Science Society. 52: 146–150.
Busse, M.D.; Ratcliff, A.W.; Shestak, C.J.; Powers, R.F. 2001. Glyphosate
toxicity and the effects of long-term vegetation control on soil microbial communi-
ties. Soil Biology and Biochemistry. 33: 1777–1789.
Hayes, J.P.; Schoenholtz, S.H.; Hartley, M.J.; Murphy, G.; Powers, R.F.;
Berg, D.; Radosevich, S.R. 2005. Environmental consequences of intensively
managed forest plantations in the Pacific Northwest. Journal of Forestry. 103(2):
83–87.
McFarlane, K.J.; Schoenholtz, S.H.; Powers, R.F. [In press]. Plantation
management intensity affects belowground carbon and nitrogen storage in northern
California. Manuscript accepted. Soil Science Society of America Journal.
Mahoney, R.L.; Powers, R.F. 2005. Silvicultural decisions X: Is there a
future for growing and processing timber in the inland Northwest? Woodland
Notes, University of Idaho, Moscow. 15(2): 2, 4.
Powers, R.F. 1999. The “Garden of Eden” experiment: assessing the potential
productivity of planted ponderosa pine. In: Ramsay, C., comp. Vegetation manage-
ment in the era of threatened and endangered species. Proceedings of the 3rd annual
PNW-IVMA forestry and rights-of-way conference. Portland, OR: Pacific North-
west Integrated Vegetation Management Association: 40–45.
Powers, R.F. 1999. On the sustainability productivity of planted forests. New
Forests. 17: 253–306.
Powers, R.F. 2000. Balderston plantation revisited: Does vegetation control or
fertilization really matter? In: Fiddler, G.O., comp. Progress report 2000. Sierra
Cascade Intensive Forest Management Research Cooperative Newsletter Series Rep.
No. 1. Davis, CA: University of California: 9–15.
50
GENERAL TECHNICAL REPORT PSW-GTR-213
Powers, R.F. 2000. The role of planted forests in a “green certified” century.
In: Cooper, S.L., comp. Reforestation for the New Millennium: back to our roots.
Proceedings, 21st forest vegetation management conference. Redding, CA: Univer-
sity of California Cooperative Extension: 1–17.
Powers, R.F. 2001. Further analyses from Balderston Plantation. In: Fiddler,
G.O., comp. Progress Report 2001. Sierra Cascade Intensive Forest Management
Research Cooperative Series Rep. No. 2. Davis, CA: University of California:
8–10.
Powers, R.F. 2003. World trends in forests, forest use, wood supply. The irony
of California forestry. The challenge to our profession. In: Cooper, S.L., comp.
Proceedings, 24th annual forest vegetation management conference. Redding, CA:
University of California Cooperative Extension: 1–16.
Powers, R.F.; Ferrell, G.T. 1995. Plantation development as constrained by
moisture, nutrition, and insects: The “Garden of Eden” study. In: Gaskin, R.E.;
Zabkiewicz, J.A., comp. Proceedings, 2nd international conference on forest vegeta-
tion management. Forest Research Institute Bulletin, 192. Rotorua, New Zealand:
Forest Research Institute: 92–94.
Powers, R.F.; Ferrell, G.T. 1996. The “Garden of Eden” study revisited:
findings at eight years. In: Landram, M., comp. Proceedings, 17th annual forest
vegetation management conference. Redding, CA: University of California Coop-
erative Extension: 8–31.
Powers, R.F.; Ferrell, G.T. 1996. Moisture, nutrient, and insect constraints
on plantation growth: The “Garden of Eden” experiment. New Zealand Journal
of Forestry Science. 26: 126–144.
Powers, R.F.; Koerber, T.W.; Ferrell, G.T. 1992. The Garden of Eden
experiment: four-year growth of ponderosa pine plantations. In: Proceedings,
13th annual forest vegetation management conference. Redding, CA: University
of California Cooperative Extension: 46–63.
Powers, R.F.; Reynolds, P.E. 1999. Ten-year responses of ponderosa pine
plantations to repeated vegetation and nutrient control along an environmental
gradient. Canadian Journal of Forest Research. 29: 1027–1038.
Powers, R.F.; Reynolds, P.E. 2000. Intensive management of ponderosa pine
plantations: sustainable productivity for the 21st century. Journal of Sustainable
Forestry. 10(3-4): 249–255.
51
Historical Growth Plots in the Pacific Southwest
Powers, R.F.; Spear, T. 1997. Weed competition and plantation management:
The “Garden of Eden” experiment. In: Weed science. In search of excellence.
Proceedings, 49th annual conference of the California Weed Science Society.
Fremont, CA: California Weed Science Society: 118–130.
Powers, R.F.; Young, D.H.; Fiddler, G.O.; Spear, T.H. 2005. Balderston
plantation revisited: a tale of two sites 25 years after early treatments. In: Cooper,
S.L., comp. Where we’ve been, where we are, and where we’re going. Proceed-
ings, 25th forest vegetation management conference. Redding, CA: University of
California Cooperative Extension: 61–72.
Reynolds, P.E.; Powers, R.F. 2000. Gas exchange for managed ponderosa
pine stands positioned along a climatic gradient. Journal of Sustainable Forestry.
10(3-4): 257–265.
Chester Garden of Eden Plantation
History—
The site is in the rain shadow of the southern Cascade Mountains. It was originally
railroad logged by the Red River Lumber Company in the early 1900s. The site
eventually reverted to a brushfield comprised largely of greenleaf manzanita
(Arctostaphylos patula) and snowbrush (Ceanothus velutinus). Brush was removed
by tractor and brush rake in 1986 and piled offsite. It received one hexazinone
application to temporarily inhibit resprouting brush. A wire fence was constructed
to reduce animal damage to young seedlings (primarily by porcupines). The HI and
HFI plots were thinned from below in August 2003, and samples were taken for
biomass analysis.
• Location—SE1/4 of SE1/4 sec. 5, T. 28 N., R 8 E., MDM on land man-
aged by Roseburg Resources, Weed, California
• Latitude/longitude—Lat. 40.30 N.; long. 121.10 W.
• Elevation—4,805 ft
• Soil parent material—Andesite and volcanic ash
• Species studied—Ponderosa pine
• Plot installation—1987
• Duration of data collection—1987-ongoing
• Measurement interval—2 years, changing to 5 years by age 10
52
GENERAL TECHNICAL REPORT PSW-GTR-213
Study design—
A completely randomized design with three replications was used. All measurement
plots of 20 original trees are buffered with two rows of planted trees.
Measurements—
All trees within the plots were measured using diameter tapes (nearest 0.1 in) and
height poles (nearest 0.1 ft). Stem deformities and evidence of insect and disease
attack were also noted. Total height and height to live crown were measured on all
trees, as well as crown diameter at the widest point (mean of two right-angle
measurements).
Monumentation—
Treatment plot corners are numbered orange stakes, and measurement plot corners
are white stakes. However, some of the stakes may be missing. All measurement
trees are painted at 2 in below breast height.
Elkhorn Garden of Eden Plantation
History—
The site is on a north-northeastern exposure at the eastern edge of the California
Coast Ranges. The area supported mature, mixed-conifer forest prior to 1977, and
had received sanitation harvests in 1965 and again in 1973. The site was burned in
a severe wildfire in August, 1977. It was salvage logged immediately after the fire
and again in 1983 following wind damage to residual trees. Ponderosa pine was
planted in 1979 and 1980.
The site was prepared by D-6 tractor and brush rake in July 1987 to create a
planting area for this study, and vegetation was piled along the edge of a 4-ac
clearing. Planting spots were surveyed using transit and tape in early spring 1987
and bare root pine of superior families were planted in March 1988. Survival on
F and FI treatments was poor, ranging between 0 and 70 percent. Of this, some was
associated with lower slope plots that included old skid trails or landings. Survival
on remaining plots ranged between 60 and 100 percent.
• Location—NW1/4 of sec. 26, T. 26 N., R. 8 W., MDM on land managed by
Crane Mills, Corning, California
• Latitude/longitude—Lat. 40.08 N.; long. 122.75 W.
• Elevation—5,050 ft
• Soil parent material—Metamorphosed metasediments
• Species studied—Ponderosa pine
• Plot installation—1988

53
Historical Growth Plots in the Pacific Southwest
• Duration of data collection—1988-ongoing
• Measurement interval—2 years, changing to 5 years after age 10
Study design—
A completely randomized design with three replications was used. All measurement
plots of 20 original trees are buffered with two rows of planted trees.
Measurements—
All trees within the plots were measured using diameter tapes (nearest 0.1 in) and
height poles (nearest 0.1 ft). Stem deformities and evidence of insect and disease
attack were also noted. Total height and height to live crown were measured on
all trees, as well as crown diameter at the widest point (mean of two right-angle
measurements). Forest floor samples and soil cores, to a 4-ft depth, were collected
from C, F, H, and HF plots in 2006 for mass and chemical analyses. All vegetation
was sampled in spring 2008 for complete analysis of above- and belowground
biomass.
Monumentation—
Treatment plot corners are numbered orange stakes, and measurement plot corners
are white stakes. However, some of the stakes may be missing.
Feather Falls Garden of Eden Plantation
History—
The site is on a western slope of the northern Sierra Nevada in an area supporting
mixed-conifer forest. The brushy understory and overstory of tanoak (Lithocarpus
sp.) were cleared by the Louisiana-Pacific Corporation for this study. Eventually,
the land was purchased by the present owner, Sierra Pacific. The HI and HFI plots
were thinned from below in March 1996, and samples were taken for biomass
analysis.
• Location—SW1/4 sec. 4, T. 20 N., R. 7 E., MDM on land managed by
Sierra Pacific Industries
• Latitude/longitude—Lat. 39.62 N.; long. 121.20 W.
• Elevation—4,080 ft
• Soil parent material—Basalt
• Species studied—Ponderosa pine
• Plot installation—1988
• Duration of data collection—1988-ongoing
• Measurement interval—2 years, changing to 5 years by age 10

54
GENERAL TECHNICAL REPORT PSW-GTR-213
Study design—
A completely randomized design with three replications was used. All measurement
plots of 20 original trees are buffered with two rows of planted trees.
Measurements—
All trees within the plots were measured using diameter tapes (nearest 0.1 in) and
height poles (nearest 0.1 ft). Stem deformities and evidence of insect and disease
attack were also noted. Total height and height to live crown were measured on all
trees, as well as crown diameter at the widest point (mean of two right-angle
measurements). Forest floor samples and soil cores, to a 4-ft depth, were collected
from C, F, H, and HF plots in 2006 for mass and chemical analyses. All vegetation
was sampled in spring 2008 for complete analysis of above- and belowground
biomass.
Monumentation—
Treatment plot corners are numbered orange stakes, and measurement plot corners
are white stakes. However, some of the stakes may be missing. All measurement
trees are painted at 2 in below breast height.
Jaws Garden of Eden Plantation
History—
The site faces south toward the Klamath River in the Klamath Mountains. The HI
and HFI plots were thinned from below in August 1997, and samples were taken for
biomass analysis.
• Location—NW1/4 sec. 31, T. 47 N., R. 10 W. MDM on land managed by
Fruit Growers Supply, Hilt, California
• Latitude/longitude—Lat. 41.89 N.; long. 123.05 W.
• Elevation—3,300 ft
• Soil parent material—Metamorphosed sediments
• Species studied—Ponderosa pine
• Plot installation—1988
• Duration of data collection—1988-ongoing
• Measurement interval—2 years, changing to 5 years by age 10
Study design—
A completely randomized design with three replications was used. All measurement
plots of 20 original trees are buffered with two rows of planted trees.

55
Historical Growth Plots in the Pacific Southwest
Measurements—
All trees within the plots were measured using diameter tapes (nearest 0.1 in) and
height poles (nearest 0.1 ft). Stem deformities and evidence of insect and disease
attack were also noted. Total height and height to live crown were measured on all
trees, as well as crown diameter at the widest point (mean of two right-angle
measurements).
Monumentation—
Treatment plot corners are numbered orange stakes, and measurement plot corners
are white stakes. However, some of the stakes may be missing. All measurement
trees are painted at 2 in below breast height.
Pondosa Garden of Eden Plantation
History—
The site is in the southern Cascade Mountains. The original forest was mixed
conifer with a heavy component of ponderosa pine. This was consumed in the
Pondosa Fire of 1977. The site was salvage logged and planted with ponderosa pine.
Part of the area was cleared by brush rake for the Garden of Eden study. The HI
and HFI plots were thinned from below in August 2003, and samples were taken for
biomass analysis.
• Location—SW1/4 of NE1/4 sec. 21, T. 39 N., R. 3 E., MDM on land
managed by Roseburg Resources, Weed, California
• Latitude/longitude—Lat. 41.21 N.; long. 121.63 W.
• Elevation—3,865 ft
• Soil parent material—Andesite and volcanic ash
• Species studied—Ponderosa pine
• Plot installation—1988
• Duration of data collection—1988-ongoing
• Measurement interval—2 years, changing to 5 years by age 10
Study design—
A completely randomized design with three replications was used. All measurement
plots of 20 original trees are buffered with two rows of planted trees.

56
GENERAL TECHNICAL REPORT PSW-GTR-213
Measurements—
All trees within the plots were measured using diameter tapes (nearest 0.1 in) and
height poles (nearest 0.1 ft). Stem deformities and evidence of insect and disease
attack were also noted. Total height and height to live crown were measured on all
trees, as well as crown diameter at the widest point (mean of two right-angle
measurements).
Monumentation—
Treatment plot corners are numbered orange stakes, and measurement plot corners
are white stakes. However, some of the stakes may be missing.
Whitmore Garden of Eden Plantation
History—
The area was site prepared in 1985 by tractor and brush rake from a manzanita
brushfield that originated following a 1967 wildfire. Planting spots were surveyed
by using transit and tape in early spring 1986 and bare root pine were planted
shortly thereafter. Survival was essentially 100 percent. In March 1996, plots
receiving the HI and HFI treatments were marked for thinning from below. Half the
trees were thinned in March 1996, and two trees per plot (a smaller and a larger
tree) were sampled for reconstructing stem and crown biomass. In 2006 soil cores
were taken to a depth of 1 m for fine root analysis.
• Location—SE1/4 of sec. 18, T. 32 N., R.1 E., MDM on property managed
by William Beaty and Associates, Redding, California
• Latitude/longitude—Lat. 40.62 N.; long. 121.90 W.
• Elevation—2,395 ft
• Soil parent material—Andesitic mudflow
• Species studied—Ponderosa pine
• Plot installation—1986
• Duration of data collection—1986-ongoing
• Measurement interval—2 years, changing to 5 years after age 10
Study design—
A completely randomized design with three replications was used. All measurement
plots of 20 original trees are buffered with two rows of planted trees.

57
Historical Growth Plots in the Pacific Southwest
Measurements—
All trees within the plots were measured using diameter tapes (nearest 0.1 in) and
height poles (nearest 0.1 ft). Stem deformities and evidence of insect and disease
attack were also noted. Total height and height to live crown were measured on all
trees, as well as crown diameter at the widest point (mean of two right-angle
measurements). Forest floor samples and soil cores, to a 4-ft depth, were collected
from C, F, H, and HF plots in 2005 for mass and chemical analyses. All vegetation
was sampled in spring 2007 for complete analysis of above- and belowground
biomass.
Monumentation—
Treatment plot corners are numbered orange stakes, and measurement plot corners
are white stakes. However, some of the stakes may be missing.
IV. Long-Term Soil Productivity StudiesLong-Term Soil Productivity (LTSP) installations are part of the world’s largest
effort to understand how soil and site disturbances associated with tree harvest
affect the capacity of the land to capture carbon and grow vegetation. The installa-
tions (12 in California, more than 100 in the United States and Canada) are provid-
ing soil-based indicators of sustainable site productivity (fig. 21). The treatments
consist of two main factors: organic matter removal and soil compaction, and are
designed to bracket the range of conditions likely to occur under such management
practices as thinning for fuel reduction or wood production. Organic matter treat-
ments consist of three treatment levels: stem removal (all slash retained), whole tree
removal (forest floor retained), and complete removal (all vegetation and forest
floor removed) (fig. 22). These organic matter treatments are crossed factorially
with three levels of soil compaction: none, moderate, and severe (see fig. 23). The
treatment plots are 1 ac each, usually nine plots per installation. All but one are on
national forest lands, the exception being a research forest managed by the Univer-
sity of California. The California phase of LTSP began in 1991 and centers on
mixed-conifer forests of the Sierra Nevada located on a broad range of soil types.
All sites supported mature, mixed-conifer forests at the start of the study and all
forests were sampled before treatment by felling trees for crown and stem biomass
of the overstory, biomass of the understory, and mass of the forest floor to mineral
soil, allowing the standing mass of organic matter to be estimated before treatments
began. Soils also were sampled for a variety of physical and chemical properties.
Plots (not necessarily contiguous) with similar degrees of variation in stand and soil
Long-Term SoilProductivity (LTSP)installations arepart of the world’slargest effort tounderstand howsoil and site disturb-ances associatedwith tree harvestaffect the capacity ofthe land to capturecarbon and growvegetation.
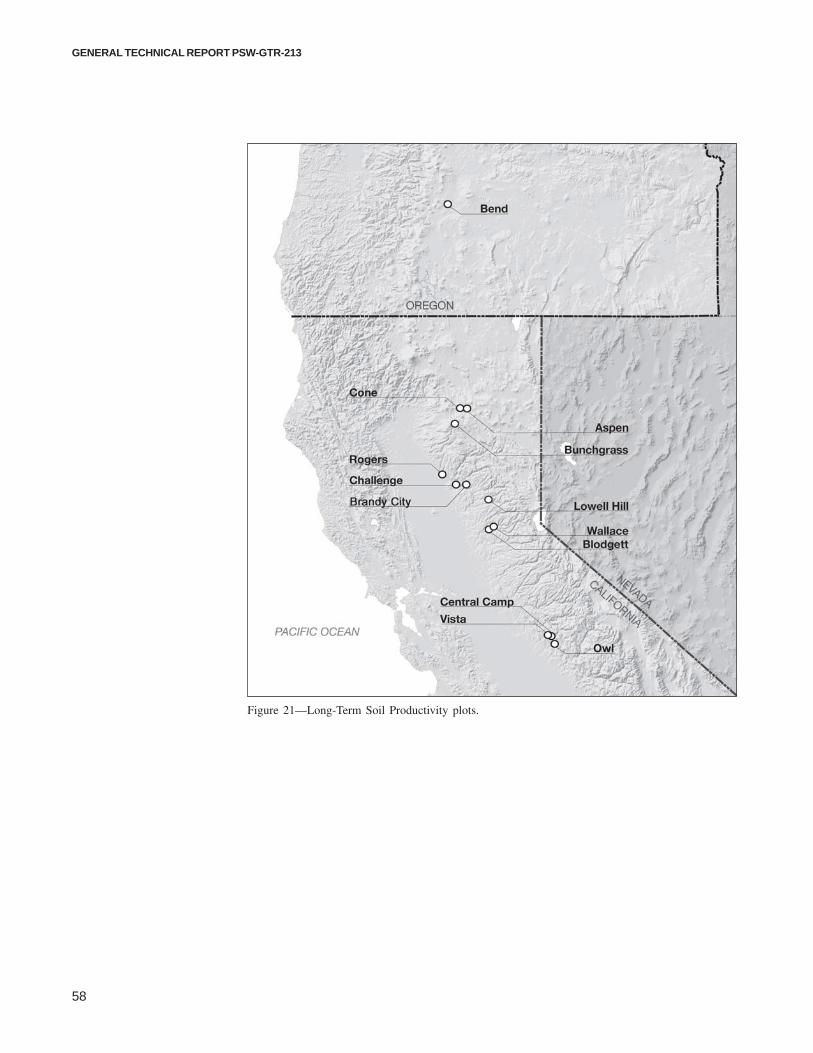
58
GENERAL TECHNICAL REPORT PSW-GTR-213
Figure 21—Long-Term Soil Productivity plots.

59
Historical Growth Plots in the Pacific Southwest
A
B
Figure 22—Challenge Long-Term Soil Productivity installation. Challenge is the oldest of theCalifornia installations. (A) Stem-only harvest in 1999 when the plantation was 2 years old.All logging slash is retained. (B) Complete organic matter removal in 1990. Mineral soil isexposed.
Bob
Pow
ers
Bob
Pow
ers
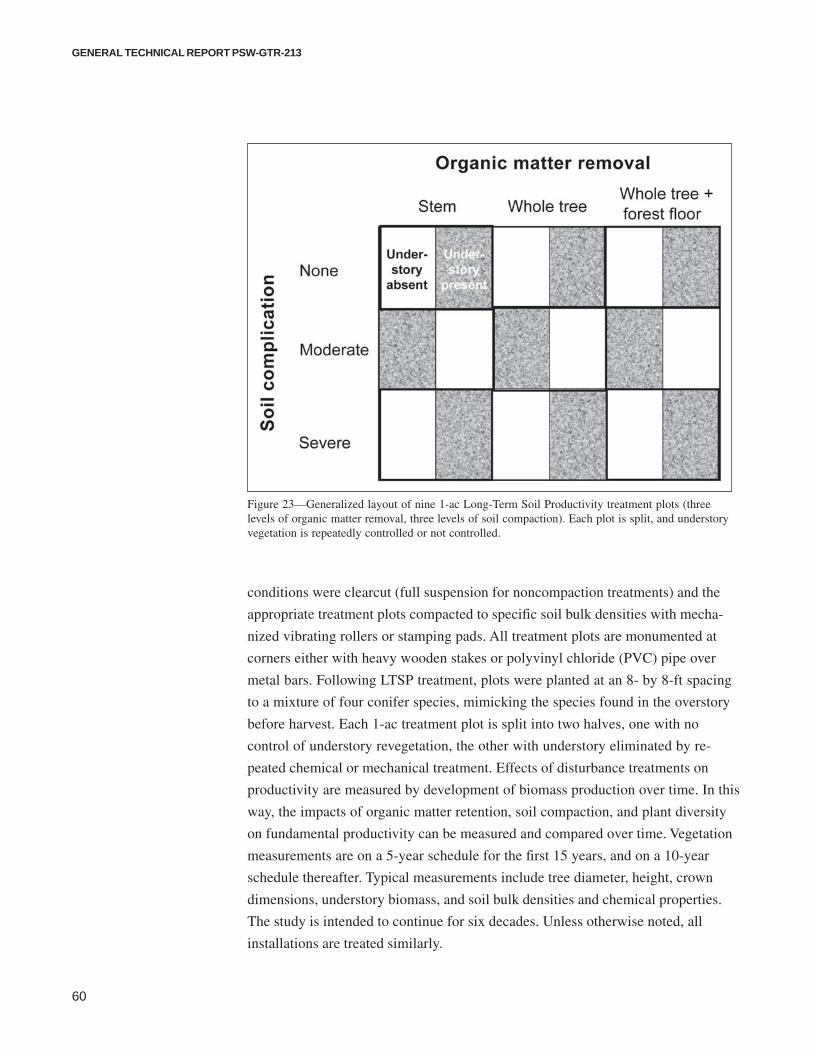
60
GENERAL TECHNICAL REPORT PSW-GTR-213
conditions were clearcut (full suspension for noncompaction treatments) and the
appropriate treatment plots compacted to specific soil bulk densities with mecha-
nized vibrating rollers or stamping pads. All treatment plots are monumented at
corners either with heavy wooden stakes or polyvinyl chloride (PVC) pipe over
metal bars. Following LTSP treatment, plots were planted at an 8- by 8-ft spacing
to a mixture of four conifer species, mimicking the species found in the overstory
before harvest. Each 1-ac treatment plot is split into two halves, one with no
control of understory revegetation, the other with understory eliminated by re-
peated chemical or mechanical treatment. Effects of disturbance treatments on
productivity are measured by development of biomass production over time. In this
way, the impacts of organic matter retention, soil compaction, and plant diversity
on fundamental productivity can be measured and compared over time. Vegetation
measurements are on a 5-year schedule for the first 15 years, and on a 10-year
schedule thereafter. Typical measurements include tree diameter, height, crown
dimensions, understory biomass, and soil bulk densities and chemical properties.
The study is intended to continue for six decades. Unless otherwise noted, all
installations are treated similarly.
Figure 23—Generalized layout of nine 1-ac Long-Term Soil Productivity treatment plots (threelevels of organic matter removal, three levels of soil compaction). Each plot is split, and understoryvegetation is repeatedly controlled or not controlled.

61
Historical Growth Plots in the Pacific Southwest
Publications that used data from the LTSP study—
Boyle, J.R.; Powers, R.F., eds. 2001. Forest soils and ecosystem sustainability.
Amsterdam, The Netherlands: Elsevier.
Burger, J.A.; Powers, R.F. 1991. Field designs for testing hypotheses in long-
term site productivity studies. In: Dyck, W.J.; Mees, C.A., eds. Long-term field
trials to assess environmental impacts of harvesting. IEA/BE T6/A6 Rep. No. 5.
Forest Research Institute Bulletin No. 161. Rotorua, New Zealand: Forest Research
Institute: 79–105.
Busse, M.D.; Beattie, S.E.; Powers, R.F.; Sanchez, F.G.; Tiarks, A.E. 2006.
Microbial community responses to forest soil compaction, organic residue removal,
and vegetation control. Canadian Journal of Forest Research. 36: 577–588.
Curran, M.P.; Heninger, R.L.; Maynard, D.G.; Powers, R.F. 2005. Har-
vesting effects on soils, tree growth, and long-term productivity. In: Harrington,
C.A.; Schoenholtz, S.H., tech. eds. Productivity of western forests: a forest prod-
ucts focus. Gen. Tech. Rep. PNW-GTR-642. Portland, OR: U.S. Department of
Agriculture, Forest Service, Pacific Northwest Research Station: 3–15.
Curran, M.P.; Maynard, D.G.; Heninger, R.L.; Terry, T.A.; Howes,
S.W.; Stone, D.M.; Niemann, T.; Miller, R.E.; Powers, R.F. 2005. An adaptive
management process for forest soil conservation. The Forestry Chronicle. 81(5):
717–722.
Fleming, R.L.; Powers, R.F.; Foster, N.W.; Kranabetter, J.M.; Scott,
D.A.; Ponder, F., Jr.; Berch, S.; Chapman, W.; Kabzems, R.D.; Ludovici, K.;
Morris, D.M.; Page-Dumroese, D.S.; Sanborn, P.T.; Sanchez, F.G.; Stone,
D.M.; Tiarks, A.E. 2006. Effects of organic matter removal, soil compaction, and
vegetation control on 5-year seedling performance: a regional comparison of long-
term soil productivity sites. Canadian Journal of Forest Research. 36: 529–550.
Gomez, A.G.; Powers, R.F.; Singer, M.J.; Horwath, W.W. 2002. N uptake
and N status in ponderosa pine as affected by soil compaction and forest floor
removal. Plant and Soil. 242: 263–275.
Gomez, A.G.; Powers, R.F.; Singer, M.J.; Horwath, W.R. 2002. Soil
compaction effects on growth of young ponderosa pine following litter removal
in California’s Sierra Nevada. Soil Science Society of America Journal. 66:
1334–1343.
Gomez, A.G.; Singer, M.J.; Powers, R.F.; Howath, W.W. 2002. Soil
compaction effects on water status of ponderosa pine assessed through 13C/12C
composition. Tree Physiology. 22: 459–467.

62
GENERAL TECHNICAL REPORT PSW-GTR-213
Gressel, N.; McColl, J.G.; Preston, C.M.; Newman, R.H.; Powers, R.F.
1996. Linkages between phosphorus transformations and carbon decomposition in a
forest soil. Biogeochemistry. 33: 97–123.
Page-Dumroese, D.S.; Jurgensen, M.F.; Tiarks, A.E.; Ponder, F., Jr.;
Sanchez, F.G.; Fleming, R.L.; Kranabetter, J.M.; Powers, R.F.; Stone, D.M.;
Elioff, J.D.; Scott, D.A. 2006. Soil physical property changes at the North Ameri-
can long-term soil productivity study sites: 1 and 5 years after compaction. Cana-
dian Journal of Forest Research. 36: 551–564.
Powers, R.F. 1990. Are we maintaining the productivity of forest lands?
Establishing guidelines through a cooperative national program. In: Schwitzer,
D.L.; MacNaughton, M.J., comp. Proceedings, national workshop on monitoring
forest plan implementation. Washington, DC: U.S. Department of Agriculture,
Forest Service, Land Management Planning: 98–112.
Powers, R.F. 1990. Designed stress experiments to evaluate the impacts of
management practices on long-term site productivity. In: Proceedings, forestry and
the world around us. 1989 Western Forestry conference. Portland, OR: Western
Forestry and Conservation Association: 39–40.
Powers, R.F. 1990. Do timber management practices degrade long-term site
productivity? What we know and what we need to know. In: Proceedings, 11th
annual forest vegetation management conference. Redding, CA: University of
California Cooperative Extension: 87–106.
Powers, R.F. 1991. Are we maintaining the productivity of forest lands?
Establishing guidelines through a network of long-term studies. In: Harvey, A.E.;
Neuenschwander, L.F., comps. Proceedings, symposium on management and
productivity of western-montane forest soils. Gen. Tech. Rep. INT-280. Ogden,
UT: U.S. Department of Agriculture, Forest Service, Intermountain Research
Station: 70–81.
Powers, R.F. 1991. Do timber management operations degrade long-term
productivity? A research and national forest systems cooperative study. In: Proceed-
ings, national silviculture workshop. Washington, DC: U.S. Department of Agricul-
ture, Forest Service, Timber Management: 101–115.
Powers, R.F. 1992. Are we maintaining the productivity of forest lands?
Establishing guidelines through a network of long-term studies. In: Pacific rim
forestry-bridging the world. Proceedings, 1991 annual convention, Society of
American Foresters. Bethesda, MD: Society of American Foresters: 240–248.
Powers, R.F. 2001. Assessing potential sustainable wood yield. In: Evans, J.,
ed. The Forests Handbook. Oxford: Blackwell Science: 105–128. Chapter 5.

63
Historical Growth Plots in the Pacific Southwest
Powers, R.F. 2002. Effects of soil disturbance on the fundamental, sustainable
productivity of managed forests. In: Verner, J., ed. Proceedings of a symposium on
the Kings River sustainable forest ecosystems project: progress and current status.
Gen. Tech. Rep. PSW-GTR-183. Albany, CA: U.S. Department of Agriculture,
Forest Service, Pacific Southwest Research Station: 63–82.
Powers, R.F. 2006. Long-term soil productivity: genesis of the concept
and principles behind the program. Canadian Journal of Forest Research. 36(3):
516–528.
Powers, R.F.; Alban, D.H.; Miller, R.E.; Tiarks, A.E.; Wells, C.G.; Avers,
P.E.; Cline, R.G.; Fitzgerald, R.O.; Loftus, N.S., Jr. 1990. Sustaining site
productivity in North America: problems and prospects. In: Gessel, S.P.; Lacate,
D.S.; Weetman, G.F.; Powers, R.F., eds. Sustained productivity of forest soils.
Proceedings, 7th North American forest soils conference. Vancouver, BC: Faculty of
Forestry, University of British Columbia: 49–79.
Powers, R.F.; Alban, D.H.; Ruark, G.A.; Tiarks, A.E. 1990. A soils re-
search approach to evaluating management impacts on long-term productivity. In:
Dyck, W.J.; Mees, C.J., eds. Impact of intensive harvesting on forest site productiv-
ity. IEA/BE T6/A6 Report No. 2. Forest Research Institute Bulletin No. 159.
Rotorua, New Zealand: Forest Research Institute: 127–145.
Powers, R.F.; Alves, T.M.; Spear, T.H. 1999. Soil compaction: Can it be
mitigated? Reporting a work in progress. In: Proceedings, 20th annual forest
vegetation management conference. Redding, CA: University of California Coop-
erative Extension: 47–56.
Powers, R.F.; Avers, P.E. 1995. Sustaining forest productivity through soil
quality standards: a coordinated U.S. effort. In: Abboud, S.A.; McGill, W.B., eds.
Environmental soil science: anthropogenic chemicals and soil quality criteria.
Brandon, Manitoba: Canadian Society of Soil Science: 147–190.
Powers, R.F.; Fiddler, G.O. 1997. The North American long-term soil
productivity study: progress through the first 5 years. In: Proceedings, 18th annual
forest vegetation conference. Redding, CA: University of California Cooperative
Extension: 88–102.
Powers, R.F.; Goudey, C.; Ragus, J.; Tiarks, A.; Alban, D.; Ruark, G.
1989. A proposed national study: evaluating timber management impacts on long-
term soil productivity: a Research and National Forest Systems cooperative study.
In: Proceedings, 1989 national soil and water monitoring workshop. WO-WSA-1.
Washington, DC: U.S. Department of Agriculture, Forest Service: 121–138.

64
GENERAL TECHNICAL REPORT PSW-GTR-213
Powers, R.F.; Mead, D.J.; Burger, M.W.; Ritchie, M.W. 1994. Designing
long-term site productivity experiments. In: Dyck, W.J.; Cole, D.W.; Comerford,
N.B., eds. Impacts of forest harvesting on long-term site productivity. London:
Chapman and Hall: 247–286.
Powers, R.F.; Morrison, I.K. 1996. Soil and sustainable forest productivity: a
preamble. Soil Science Society of America Journal. 60: 1613.
Powers, R.F.; Sanchez, F.G.; Scott, D.A.; Page-Dumroese, D. 2004. The
North American long-term soil productivity experiment: coast-to-coast findings
from the first decade. In: Shepperd, W.D.; Eskew, L.G., comp. Silviculture in
special places: proceedings of the national silviculture workshop. Proceedings
RMRS-P-34. Fort Collins, CO: U.S. Department of Agriculture, Forest Service,
Rocky Mountain Research Station: 191–206.
Powers, R.F.; Scott, D.A.; Sanchez, F.; Voldseth, R.A.; Page-Dumroese,
D.; Eliof, J.D.; Stone, D.M. 2005. The North American long-term soil productiv-
ity experiment: findings from the first decade of research. Forest Ecology and
Management. 220: 31–50.
Powers, R.F.; Tiarks, A.E.; Boyle, J.R. 1998. Assessing soil quality: practi-
cable standards for sustainable forest productivity in the United States. In:
Davidson, E.A., ed. Criteria and indicators of soil quality for sustainable forest
productivity. Special Publ. 53. Madison, WI: Soil Science Society of America:
53–80.
Powers, R.F.; Tiarks, A.E.; Buford, M.A. 1995. Influence of site disturbance
on fundamental productivity and soil processes in pine plantations of the U.S.:
The “LTSP experiment.” In: Gaskin, R.E.; Zabkiewicz, J.A., comp. Proceedings,
Second international conference on forest vegetation management. Forest Research
Institute Bulletin 192. Rotorua, New Zealand: Forest Research Institute: 68–70.
Powers, R.F.; Tiarks, A.E.; Burger, J.A.; Carter, M.C. 1996. Sustaining the
productivity of planted forests. In: Carter, M.C., ed. Growing trees in a greener
world: industrial forestry in the 21st century. Proceedings, 35th forestry symposium,
School of Forestry, Wildlife and Fisheries. Baton Rouge, LA: Louisiana State
University: 97–134.
Powers, R.F.; Van Cleve, K. 1991. Long-term ecological research in temper-
ate and boreal forest ecosystems. Agronomy Journal. 83: 11–24.

65
Historical Growth Plots in the Pacific Southwest
Sanchez, F.G.; Tiarks, A.E.; Kranabetter, J.M.; Page-Dumroese, D.S.;
Powers, R.F.; Sanborn, P.T.; Chapman, W.K. 2006. Effects of organic matter
removal and soil compaction on fifth-year mineral soil carbon and nitrogen con-
tents for sites across the United States and Canada. Canadian Journal of Forest
Research. 36: 565–576.
Siegel-Issem, C.M.; Burger, J.A.; Powers, R.F.; Ponder, F.; Patterson, S.C.
2005. Seedling root growth as a function of soil density and water content. Soil
Science Society of America Journal. 69: 215–226.
Tiarks, A.E.; Buford, M.A.; Powers, R.F.; Ragus, J.F.; Page-Dumroese,
D.S.; Ponder, F., Jr.; Stone, D.M. 1998. North American long term soil produc-
tivity research program. In: Communicating the role of silviculture in managing
the national forests. Proceedings, national silviculture workshop. Gen Tech. Rep.
NE-238. Radnor, PA: U.S. Department of Agriculture, Forest Service, Northeast-
ern Forest Experiment Station: 140–147
Tiarks, A.E.; Powers, R.F.; Alban, D.H.; Ruark, G.A.; Page-Dumroese,
D.S. 1993. USFS long-term soil productivity national research project: A USFS
cooperative research program. In: Kimble, J., ed. Utilization of soil survey infor-
mation for sustainable land use. Proceedings of the 8th international soil manage-
ment workshop. Lincoln, NB: U.S. Department of Agriculture, Soil Conservation
Service: 236–241.
Waldrop, M.P.; McColl, J.G.; Powers, R.F. 2003. Effects of forest post-
harvest management practices on enzyme activities in decomposing litter. Soil
Science Society of America Journal. 67: 1250–1256.
Aspen LTSP Installation
History—
The site is in the southern Cascade Mountains. The original forest was a 262-year-
old, even-aged, mixed-conifer forest with a high proportion of ponderosa pine and
white fir. Standing biomass was 171 Mg/ha (152,703 lb/ac).
• Location—NW1/4 sec. 21, T. 33 N., R. 8 E., MDM on land managed by
the Lassen National Forest
• Latitude/longitude—Lat. 40.72 N.; long. 121.09 W.
• Elevation—5,870 ft
• Soil parent material—Andesite and volcanic ash
• Species studied—Ponderosa pine, sugar pine, white fir, Douglas-fir
(Pseudotsuga menziesii (Mirb.) Franco)

66
GENERAL TECHNICAL REPORT PSW-GTR-213
• Plot installation—1998
• Duration of data collection—1998-2007
• Measurement interval—5 years, changing to 10 years by age 15 on most
installations
Study design—
Design follows the standard template shown in figure 23, although plots are not
contiguous. Plot layout maps are available from the Pacific Southwest Research
Station, Redding, California.
Monumentation—
All plots are 1 ac or 1/2 ac with large numbered posts at the plot corners. Measure-
ment plots begin the third row of trees in from the treated edge.
Bend, Oregon, LTSP Affiliate Sites
History—
The Bend LTSP study (fig. 24) was identified as an affiliate site in the North
American LTSP network based on its gradient of organic matter treatments. The
purpose of the Bend study was to determine how combinations of thinning, pre-
scribed fire, and nutrient additions affect ecosystem sustainability, productivity, and
plant diversity in second-growth ponderosa pine forests. The scientific lead for the
study was stationed at the Pacific Northwest Research Station’s Bend Silviculture
Laboratory, and was formally transferred to PSW, Redding, California, in 1996
following the closure of the Bend laboratory. The study is included in this publica-
tion because of its scientific value and because it is now overseen by PSW.
The pine forests in central Oregon burned frequently prior to the 20th century.
Wildfires were predominantly low-severity ground fires, with less-frequent stand-
replacement fires. The three study sites have been free of fire disturbance since
clearcut harvesting in the 1920s and 1930s. Following railroad logging in the 1920s
and 1930s, the forests were heavily stocked with naturally regenerated ponderosa
pine. Precommercial thinning in the 1960s left 500 to 800 trees/hectare (202 to 324
trees/acre). By the mid-1980s, national forest concerns for potential catastrophic
wildfire and insect mortality were acute, leading to accelerated treatment (thinning
and burning) of the most actively-growing stands (“black bark” pine), and to the
establishment of this large-scale study.
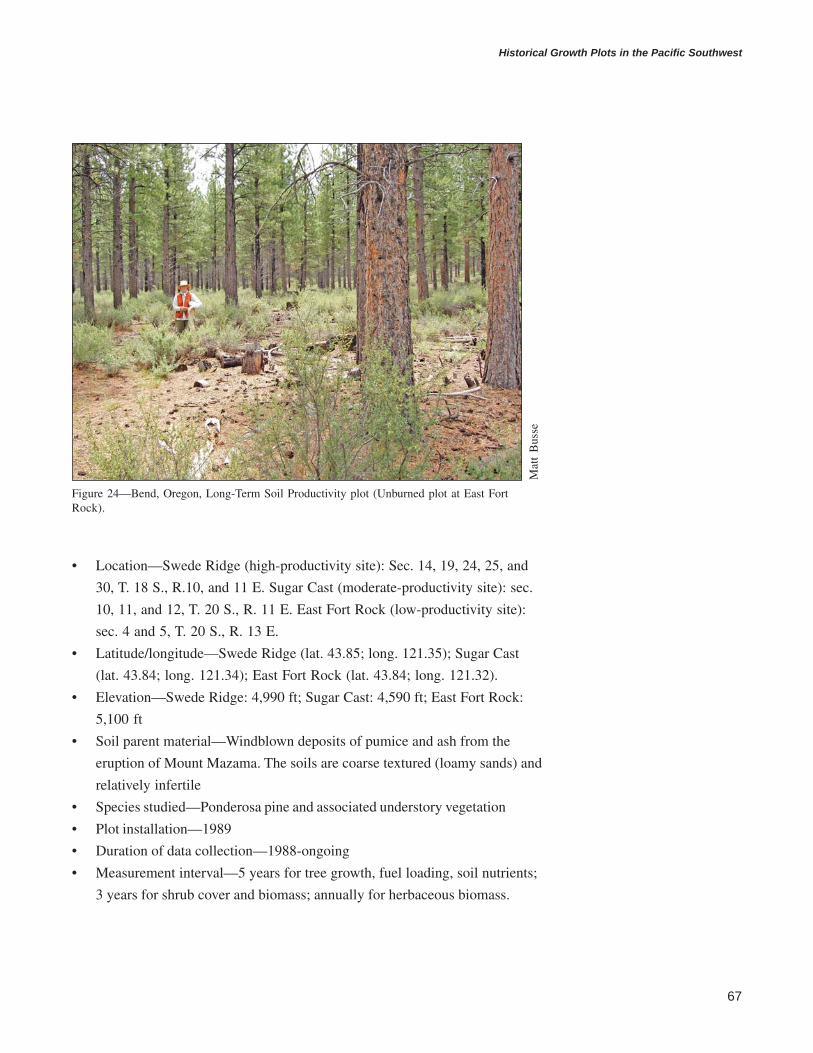
67
Historical Growth Plots in the Pacific Southwest
• Location—Swede Ridge (high-productivity site): Sec. 14, 19, 24, 25, and
30, T. 18 S., R.10, and 11 E. Sugar Cast (moderate-productivity site): sec.
10, 11, and 12, T. 20 S., R. 11 E. East Fort Rock (low-productivity site):
sec. 4 and 5, T. 20 S., R. 13 E.
• Latitude/longitude—Swede Ridge (lat. 43.85; long. 121.35); Sugar Cast
(lat. 43.84; long. 121.34); East Fort Rock (lat. 43.84; long. 121.32).
• Elevation—Swede Ridge: 4,990 ft; Sugar Cast: 4,590 ft; East Fort Rock:
5,100 ft
• Soil parent material—Windblown deposits of pumice and ash from the
eruption of Mount Mazama. The soils are coarse textured (loamy sands) and
relatively infertile
• Species studied—Ponderosa pine and associated understory vegetation
• Plot installation—1989
• Duration of data collection—1988-ongoing
• Measurement interval—5 years for tree growth, fuel loading, soil nutrients;
3 years for shrub cover and biomass; annually for herbaceous biomass.
Figure 24—Bend, Oregon, Long-Term Soil Productivity plot (Unburned plot at East FortRock).
Mat
t B
usse

68
GENERAL TECHNICAL REPORT PSW-GTR-213
Study design—
Study sites were selected along a west-to-east transect on the Deschutes National
Forest to encompass the range of growing conditions for ponderosa pine (based on
precipitation and site quality) on the pumice plateau in central Oregon. All trees
within plots were measured prior to treatment for dbh and were cored for increment
growth to (1) identify and, if necessary, eliminate nonrepresentative plots and (2)
provide data for covariate analysis. Sixteen treatments were arranged in a 4 by 4
factorial design to compare combinations of thinning method, prescribed fire, and
fertilization. Three additional treatments (pile and burn, pile and burn plus fertilize,
and crush slash) were included to compare the long-term effects of slash treatment
on soils and vegetation (see table 4).
Thinning was completed in 1989 by removing the smallest diameter trees plus
those with visual signs of damage (forked tops, mechanical injury, insects, mistle-
toe). The prescription was selected by forest silviculturists to reduce stand basal
areas from 25 to 32 m2/ha (109.25 to 139.84 ft2/ac) to 14 m2/ha (61.18 ft2/ac).
Postthinning tree spacing was generally uniform at 6 by 6 m (19.68 by 19.68 ft).
The objective of the thinning treatments (whole tree removal, bole-only removal,
leave trees on sites) was to create a gradient of site organic matter, allowing for
Table 4—Treatment design of the Bend Long-Term SoilProductivity study
Treatment Thinning method Additional treatment
1 Whole-tree harvest Fire2 Whole-tree harvest Fire + fertilize3 Whole-tree harvest Fertilize4 Whole-tree harvest None5 Bole-only harvest Fire6 Bole-only harvest Fire + fertilize7 Bole-only harvest Fertilize8 Bole-only harvest None9 Thin, leave trees on site Fire10 Thin, leave trees on site Fire + fertilize11 Thin, leave trees on site Fertilize12 Thin, leave trees on site None13 No thin Fire14 No thin Fire + fertilize15 No thin Fertilize16 No thin None17 Bole-only harvest Pile and burn18 Bole-only harvest Pile and burn + fertilize19 Bole-only harvest Crush slash
69
Historical Growth Plots in the Pacific Southwest
hypothesis testing that the retention of surface organics will lead to long-term
changes in soil productivity.
Prescribed burning was conducted during late spring 1991, and repeated burns
were conducted in spring 2002 to reduce the rapid buildup of woody shrubs.
However, plots receiving fertilizer applications were not reburned in 2002 due to
budget constraints (27 plots were burned in 1991; 12 plots were reburned in 2002).
Pile burning was conducted in fall 1991.
Fertilizer (200 lb/ac nitrogen; 100 lb/ac phosphorus; 33 lb/ac sulfur) was
applied in fall 1991 and 1996 based on soil nutrient limitations identified in earlier
studies of ponderosa pine growth by Cochran (1978, 1979).
Each site contains a full replicate of 19 combinations of thinning, burning, and
fertilizer treatments. The experimental design is a completely randomized block,
with three replicate blocks (sites). Treatment plots are 0.92 ac and the interior
measurement plots are 0.41 ac.
Measurements—
All trees within each plot were measured every 5 years using diameter tapes (nearest
0.1 in) and optical dendrometers (total height to nearest 0.1 ft). Tree damage,
deformity, and evidence of insect and disease attack were noted. Shrub species,
canopy cover, and biomass (using nondestructive site equations) were measured
within three, 100-m (328-ft) belt transects per plot. Species richness and peak-
season biomass of herbaceous plants were measured within 10 systematically located
microplots per plot. Litter decay was measured in situ during a 3-year period (1992
to 1994) using fine-mesh litterbags. Wood decay was measured as the change in
wood density of downed trees during periodic sampling between 1989 and 2007.
Fuel loading and soil nutrients were measured every 5 years using conventional
methods, and soil microbial community characteristics were measured periodically
by substrate-induced respiration, phospholipid fatty acids, and carbon utilization
patterns.
Monumentation—
Treatment plot corners and interior measurement plot corners (nondestructive
sampling area) are monumented with T-fenceposts. Plot and treatment identification
are scribed on 3-by 5-in metal tags attached to the corner T-fenceposts. All plot
corners were global positioning system (GPS)-monumented, and their digitized
locations are recorded and maintained by the Deschutes National Forest. All over-
story trees were identified with numbered metal tags in 1989; understory trees are
rare and have not been tagged.

70
GENERAL TECHNICAL REPORT PSW-GTR-213
Publications that used data from this study—
Busse, M.D. 2000. Ecological significance of nitrogen fixation by actinorhizal
shrubs in interior forests of California and Oregon. In: Powers, R.F.; Hauxwell,
D.L.; Nakamura, G.M., eds. Proceedings of the California forest soils council
conference on forest soils biology and forest management. Gen. Tech. Rep. PSW-
GTR-178. Albany, CA: U.S. Department of Agriculture, Forest Service, Pacific
Southwest Research Station: 23–41.
Busse, M.D. 2000. Suitability and use of 15N-isotope dilution method to
estimate nitrogen fixation by actinorhizal shrubs. Forest Ecology and Management.
136: 85–95.
Busse, M.D.; Cochran, P.H.; Hopkins, W.E.; Johnson, W.; Fiddler, G.O.;
Riegel, G.M.; Ratcliff, A.W.; Shestak, C.J. [N.d.]. Is mechanical thinning an
ecological surrogate for fire in ponderosa pine forests? Manuscript in preparation.
On file with: Matt Busse, Silviculture Laboratory, 3644 Avtech Parkway, Redding,
CA 96002.
Busse, M.D.; Riegel, G.M. 2005. Managing ponderosa pine forests in central
Oregon: Who will speak for the soil? In: Ritchie, M.W.; Youngblood, D.A.;
Youngblood, A., tech eds. Proceedings of the symposium on ponderosa pine:
issues, trends, and management. Gen. Tech. Rep. PSW-GTR-198. Albany, CA:
U.S. Department of Agriculture, Forest Service, Pacific Southwest Research
Station: 109–122.
Busse, M.; Riegel, G.M.; Johnson, W. 2006. Long-term effects of prescribed
fire and thinning in central Oregon ponderosa pine forests. Proceedings of the 3rd
international fire ecology and management congress. www.emmps.wsu.edu/
2006firecongressproceedings. (24 April 2008).
Busse, M.D.; Riegel, G.M. [In press]. Response of antelope bitterbrush to
repeated prescribed burning in central Oregon ponderosa pine forests. Forest
Ecology and Management.
Parker, R.T.; Maguire, D.A.; Marshall, D.D.; Cochran, P. 2007. Ponderosa
pine growth response to soil strength in the volcanic ash soils of central Oregon.
Western Journal of Applied Forestry. 22: 134–141.
Shea, R.W. 1993. Effects of prescribed fire and silvicultural activities on fuel
mass and nitrogen redistribution in Pinus ponderosa ecosystems of central Oregon.
Corvallis, OR: Oregon State University. 132 p. M.S. thesis.

71
Historical Growth Plots in the Pacific Southwest
Youngblood, A.; Everett, R.; Busse, M. 1994. Building National Forest
System-research partnerships for ecosystem management of east-side Oregon and
Washington forests. In: Silviculture: from the cradle of forestry to ecosystem man-
agement. Gen. Tech. Rep. SE-88. Asheville, NC: U.S. Department of Agriculture,
Forest Service, Southeastern Forest Experiment Station: 207–214.
Blodgett LTSP Installation
History—
The site is on the western slope of the Sierra Nevada. The gentle relief led to
railroad logging in the late 1800s, and most of the area had been logged by the
1930s. The forest existing at the time of this study was a 65-year-old, even-aged,
mixed-conifer forest. Standing biomass was 352 Mg/ha (314,336 lb/ac).
• Location—SW1/4 sec. 16, T. 12 N., R. 12 E., MDM at Blodgett Research
Forest managed by University of California
• Latitude/longitude—Lat. 38.89 N.; long. 120.64 W.
• Elevation—4,310 ft
• Soil parent material—Andesitic mudflow
• Species studied—Ponderosa pine, sugar pine, white fir, giant sequoia
(Sequoiadendron giganteum (Lindl.) Buchholz)
• Plot installation—1994
• Duration of data collection—1994 to 2007
• Measurement interval—5 years, changing to 10 years by age 15 on most
installations
Study design—
Design follows the standard template shown in figure 23, although plots are not
contiguous. The Blodgett LTSP installation differs from the standard treatment
format by the addition of mitigative treatments following severe disturbance. Two
half-acre plots receiving complete surface organic removal and severe soil compac-
tion were treated with a followup subsoiling treatment. Plot layout maps are avail-
able from the PSW Research Station in Redding, California.
Monumentation—
All plots are 1 or 1/2 ac with large numbered posts at the plot corners. Measurement
plots begin the third row of trees in from the treated edge.
72
GENERAL TECHNICAL REPORT PSW-GTR-213
Brandy City LTSP Installation
History—
The site is on the western slope of the Sierra Nevada. The original forest was a
115-year-old, even-aged, mixed-conifer forest. Standing biomass was 357 Mg/ha
(318,801 lb/ac).
• Location—E1/2 sec. 2, T. 19 N., R. 8 E., MDM on land managed by the
Tahoe National Forest
• Latitude/longitude—Lat. 69.54 N.; long. 121.04 W.
• Elevation—3,725 ft
• Soil parent material—Andesitic mudflow
• Species studied—Ponderosa pine, sugar pine, white fir, giant sequoia
• Plot installation—1995
• Duration of data collection—1995 to 2007
• Measurement interval—5 years, changing to 10 years by age 15 on most
installations
Study design—
Design follows the standard template shown in figure 23, although plots are not
contiguous. Plot layout maps are available from the PSW Research Station in
Redding, California.
Monumentation—
All plots are 1 or 1/2 ac with large numbered posts at the plot corners. Measurement
plots begin the third row of trees in from the treated edge.
Bunchgrass LTSP Installation
History—
The site is in the southern Cascade Mountains. The original forest was a 242-year-
old, even-aged, mixed-conifer forest with a high proportion of ponderosa pine and
white fir. The stand probably originated following wildfire. Past entries primarily
consisted of removals of beetle-killed trees until 1987 when there was some over-
story removal in the vicinity of the LTSP study area, although the study site itself
was not touched. Standing biomass averaged 207 Mg/ha (184,851 lb/ac) on the
LTSP site.
• Location—Sec. 28, T. 32 N., R. 5 E., MDM on land managed by the
Lassen National Forest

73
Historical Growth Plots in the Pacific Southwest
• Latitude/longitude—Lat. 40.61 N.; long. 121.43 W.
• Elevation—5,260 ft
• Soil parent material—Andesite and volcanic ash
• Species studied—Ponderosa pine, sugar pine, white fir, Douglas-fir
• Plot installation—1998
• Duration of data collection—1998 to 2007
• Measurement interval—5 years, changing to 10 years by age 15 on most
installations
Study design—
Design follows the standard template shown in figure 23, although plots are not
contiguous. Plot layout maps are available from the PSW Research Station in
Redding, California.
Monumentation—
All plots are 1 or 1/2 ac with large numbered posts at the plot corners. Measurement
plots begin the third row of trees in from the treated edge.
Central Camp LTSP Installation
History—
The site is on the western slope of the Sierra Nevada. The original forest was a
117-year-old, even-aged, mixed-conifer forest that regenerated naturally following
railroad logging in the 1920s and 1930s. Standing biomass on the LTSP site aver-
aged 422 Mg/ha (376,846 lb/ac).
• Location—S1/2 sec. 8, T. 7 S., R. 23 E., MDM on land managed by the
Sierra National Forest
• Latitude/longitude—Lat. 37.33 N.; long. 119.48 W.
• Elevation—5,400 ft
• Soil parent material—Granodiorite
• Species studied—Ponderosa pine, sugar pine, white fir, giant sequoia
• Plot installation—1993
• Duration of data collection—1993 to 2007
• Measurement interval—5 years, changing to 10 years by age 15 on most
installations

74
GENERAL TECHNICAL REPORT PSW-GTR-213
Study design—
Design follows the standard template shown in figure 23, although plots are not
contiguous. Plot layout maps are available from the PSW Research Station in
Redding, California.
Monumentation—
All plots are 1 or 1/2 ac with large numbered posts at the plot corners. Measurement
plots begin the third row of trees in from the treated edge.
Challenge LTSP Installation
History—
The site is on the western slope of the northern Sierra Nevada. The original forest
was a 108-year-old, even-aged, low-elevation, Sierra Nevada mixed-conifer forest
with a high proportion of ponderosa pine. It originated following clearcutting and
railroad logging and the slash fires that followed during the late 1800s. Standing
biomass prior to LTSP treatment averaged 473 Mg/ha (422,389 lb/ac).
• Location—NW1/4 sec. 20, NE1/4 sec. 19, SE1/4 sec. 18, T. 19 N., R. 8 E.,
MDM on land managed by the PSW Research Station
• Latitude/longitude—Lat. 39.50 N.; long. 121.22 W.
• Elevation—2,765 ft
• Soil parent material—Metamorphosed basalt
• Species studied—Ponderosa pine, sugar pine, white fir, Douglas-fir
• Plot installation—1991
• Duration of data collection—1991 to 2007
• Measurement interval—5 years, changing to 10 years by age 15 on most
installations
Study design—
Design follows the standard template shown in figure 23, although plots are not
contiguous. Plot layout maps are available from the PSW Research Station in
Redding, California. Following the initial treatments, herbicides were applied in
June 1997, to the area bordering the plots, to reduce wildfire risk and improve
access.
Monumentation—
All plots are 1 or 1/2 ac with large numbered posts at the plot corners. Measurement
plots begin the third row of trees in from the treated edge.
75
Historical Growth Plots in the Pacific Southwest
Cone LTSP Installation
History—
The site is in the southern Cascade Mountains. The original forest was a 258-year-
old, even-aged, mixed-conifer forest with a high proportion of ponderosa pine and
white fir. Standing biomass was 213 Mg/ha (190,209 lb/ac).
• Location—SE1/4 sec. 7, T. 33 N., R. 8 E., MDM, at Blacks Mountain
Experimental Forest managed by PSW Research Station
• Latitude/longitude—Lat. 40.73 N.; long. 121.12 W.
• Elevation—6,050 ft
• Soil parent material—Andesite and volcanic ash
• Species studied—Ponderosa pine, sugar pine, white fir, Douglas-fir
• Plot installation—1998
• Duration of data collection—1998 to 2007
• Measurement interval—5 years, changing to 10 years by age 15 on most
installations
Study design—
Plot layout maps are available from the PSW Research Station in Redding,
California.
Monumentation—
All plots are 1 or 1/2 ac with large numbered posts at the plot corners. Measurement
plots begin the third row of trees in from the treated edge.
Lowell Hill LTSP Installation
History—
The site is on the western slope of the Sierra Nevada. The original forest was a
117-year-old, even-aged, mixed-conifer forest with a high proportion of ponderosa
pine and sugar pine. Standing biomass was 438 Mg/ha (391,134 lb/ac).
• Location—S1/2 sec. 7, T. 16 N., R. 11 E., MDM on land managed by the
Tahoe National Forest
• Latitude/longitude—Lat. 39.36 N.; long. 120.78 W.
• Elevation—4,160 ft
• Soil parent material—Basaltic mudflow
• Species studied—Ponderosa pine, sugar pine, white fir, giant sequoia
• Plot installation—1995
• Duration of data collection—1995 to 2007
76
GENERAL TECHNICAL REPORT PSW-GTR-213
• Measurement interval—5 years, changing to 10 years by age 15 on most
installations
Study design—
Design follows the standard template shown in figure 23, although plots are not
contiguous. The Lowell Hill LTSP installation differs from others in this series in
the addition of mitigative treatments following severe disturbance. Three additional
1-ac units received complete organic matter removal and severe soil compaction.
These also received full factorial followup combinations of subsoiling and nitrogen
and phosphorus fertilization. Plot layout maps are available from the PSW Research
Station in Redding, California.
Monumentation—
All plots are 1 or 1/2 ac with large numbered posts at the plot corners. Measurement
plots begin the third row of trees in from the treated edge.
Owl LTSP Installation
History—
The site is on the western slope of the Sierra Nevada. The original forest was a
115-year-old, even-aged, mixed-conifer forest that regenerated naturally following
railroad logging in the 1920s and 1930s. Standing biomass averaged 576 Mg/ha
(514,368 lb/ac) on the LTSP site.
• Location—S1/2 sec. 12, N. 1/2 sec. 13, T. 8 S., R. 23 E., MDM on land
managed by the Sierra National Forest
• Latitude/longitude—Lat. 37.24 N.; long. 119.41 W.
• Elevation—6,060 ft
• Soil parent material—Granodiorite
• Species studied—Ponderosa pine, sugar pine, white fir, giant sequoia
• Plot installation—1993
• Duration of data collection—1993 to 2007
• Measurement interval—5 years, changing to 10 years by age 15 on most
installations
Study design—
Design follows the standard template shown in figure 23, although plots are not
contiguous. Plot layout maps are available from PSW Research Station in Redding,
California.

77
Historical Growth Plots in the Pacific Southwest
Monumentation—
All plots are 1 or 1/2 ac with large numbered posts at the plot corners. Measurement
plots begin the third row of trees in from the treated edge.
Rogers LTSP Installation
History—
The site is on the western slope of the Sierra Nevada. The original forest was a
112-year-old, even-aged, mixed-conifer forest with a high proportion of ponderosa
pine and sugar pine. Standing biomass was 494 Mg/ha (441,142 lb/ac). The original
forest was logged by the Swain Lumber Company in the early 1900s, and some of
the area burned after the logging.
• Location—SE1/4 sec. 8, SW1/4 sec. 9, T. 22 N., R. 6 E., MDM on land
managed by the Plumas National Forest
• Latitude/longitude—Lat. 39.77 N.; long. 121.32 W.
• Elevation—4,100 ft
• Soil parent material—Granodiorite
• Species studied—Ponderosa pine, sugar pine, white fir, Douglas-fir
• Plot installation—1996
• Duration of data collection—1996 to 2007
• Measurement interval—5 years, changing to 10 years by age 15 on most
installations
Study design—
Design follows the standard template shown in figure 23, although plots are not
contiguous. Plot layout maps are available from PSW Research Station in Redding,
California.
Monumentation—
All plots are 1 or 1/2 ac with large numbered posts at the plot corners. Measurement
plots begin the third row of trees in from the treated edge.
Vista LTSP Installation
History—
The site is on the western slope of the Sierra Nevada. The original forest was a
132-year-old, even-aged, mixed-conifer forest that regenerated naturally following
railroad logging in the 1920s and 1930s. Standing biomass on the LTSP site aver-
aged 374 Mg/ha (333,982 lb/ac).

78
GENERAL TECHNICAL REPORT PSW-GTR-213
• Location—E1/2 sec. 28, T. 6 S., R. 22 E., MDM on land managed by the
Sierra National Forest
• Latitude/longitude—Lat. 37.38 N.; long. 119.56 W.
• Elevation—5,220 ft
• Soil parent material—Granodiorite
• Species studied—Ponderosa pine, sugar pine, white fir, giant sequoia
• Plot installation—1993
• Duration of data collection—1993 to 2007
• Measurement interval—5 years, changing to 10 years by age 15 on most
installations
Study design—
Plot layout maps are available from PSW Station in Redding, California.
Monumentation—
All plots are 1 or 1/2 ac with large numbered posts at the plot corners. Measurement
plots begin the third row of trees in from the treated edge.
Wallace LTSP Installation
History—
The site is on the western slope of the Sierra Nevada. The original forest was a
230-year-old, even-aged, mixed-conifer forest. Standing biomass was 230 Mg/ha
(205,390 lb/ac).
• Location—SW1/4 sec. 15, T. 13 N., R. 13 E., MDM on land managed by
the Eldorado National Forest
• Latitude/longitude—Lat. 38.97 N.; long. 120.52 W.
• Elevation—5,150 ft
• Soil parent material—Volcanic ash
• Species studied—Ponderosa pine, sugar pine, white fir, giant sequoia
• Plot installation—1993
• Duration of data collection—1993 to 2007
• Measurement interval—5 years, changing to 10 years by age 15 on most
installations

79
Historical Growth Plots in the Pacific Southwest
Study design—
Plot layout maps are available from PSW Research Station in Redding, California.
Monumentation—
All plots are 1 or 1/2 ac with large numbered posts at the plot corners. Measurement
plots begin the third row of trees in from the treated edge.
V. Continuous Forest Inventory PlotsBelow is a supplemental list of growth plots that have been managed and main-
tained by The California Department of Forestry and Fire Protection (CDF). The
CDF is currently digitizing publications from the past 50 years that were produced
from research undertaken at Demonstration State Forests. These digitized publica-
tions are now available online at http://www.demoforests.net/. A brief description
of Demonstration State Forests can be found at http://www.fire.ca.gov/rsrc-
mgt_sf.php. For more information regarding these plots, their relevant publica-
tions, and Demonstration State Forests, contact the California State Forests
Program, California Department of Forestry and Fire Protection, 916-653-7209.
Boggs Mountain Demonstration State Forest
History—
Boggs Mountain Demonstration State Forest was established in 1949 for the pur-
pose of studying and demonstrating forest management practices in second-growth
coast range mixed-conifer forest.
• Location—Lake County
• Latitude/longitude—Lat. 38.83 N.; long. 122.70 W.
• Species studied—Ponderosa pine and Douglas-fir
Monitoring plots—
These are ten 2.5-ac plots that have been measured 10 times since 1952. Trees over
11 in dbh are stem mapped. There is a subsample of tree heights. All data resides in
an Access database. The latest measurement took place in 2005.
Continuous Forest Inventory (CFI)—
There are four measurements (5-year intervals) of these permanent plots (first in
1991). The last measurement took place in 2006.

80
GENERAL TECHNICAL REPORT PSW-GTR-213
Jackson Demonstration State Forest
History—
The Jackson Demonstration State Forest was established in 1947 for the purpose of
studying and demonstrating economical forest management practices for young-
growth coast redwood forest.
• Location—Mendocino County
• Latitude/longitude—Lat. 39.35 N.; long. 123.63 W.
• Species studied—Coast redwood
Railroad Gulch—
These permanent plots were established in 1982 and measured three times. Growth
is monitored for redwood and Douglas-fir in individual-tree and group-selection
cutting treatments. Uncut controls are also included. The last inventory in 2002
included a botanical survey.
Continuous Forest Inventory—
These plots were installed in 1958 through 1959 on a systematic grid (142 plots).
They have been remeasured every 5 years with the last measurement occurring in
2005. These plots were a major source of growth information for CRYPTOS, the
primary redwood region tree growth simulator. These data are in an Access data-
base.
LaTour Demonstration State Forest
History—
LaTour Demonstration State Forest was established in 1949 for the purpose of
studying and demonstrating forest management practices in second-growth Sierra
Nevada mixed-conifer forest, as well as in true fir stands.
• Location—Shasta County
• Latitude/longitude—Lat. 40.63 N.; long. 121.70 W.
• Species studied—Mixed conifer and true fir
Continuous Forest Inventory—
These 221 permanent plots were installed in 1964 through 1965 and have been
remeasured every 5 years. The latest measurement was in 2005. These data reside in
an Access database.

81
Historical Growth Plots in the Pacific Southwest
Mountain Home Demonstration State Forest
History—
Mountain Home Demonstration State Forest was established in 1946 both for the
purpose of demonstrating forest management practices in second-growth forests and
to provide recreational opportunities to the public. This dual purpose stems from
California’s desire to preserve old-growth sequoias in the forest and provide the
public with opportunities to visit those sequoias.
• Location—Tulare County
• Latitude/longitude—Lat. 36.23 N.; long. 118.66 W.
• Species studied—Mixed conifer and giant sequoia
Continuous Forest Inventory—
Plots were installed in 1970 and are remeasured every 5 years. The data reside in an
Access database.
Giant Sequoia Old-Growth Inventory—
Approximately three-quarters of the 6,000+ old-growth giant sequoia trees on the
forest have been located using GPS and measured.
Soquel Demonstration State Forest
History—
Established in 1988 on land that was originally part of a Mexican land grant,
the Soquel Demonstration State Forest provides public access to coast redwoods
and opportunities for forestry education and outdoor recreation. It is close to
both the San Francisco and Monterey Bay regions, making it accessible to urban
communities.
• Location—Santa Cruz County
• Latitude/longitude—Lat. 37.08 N.; long. 121.90 W.
• Species studied—Redwood; close to urban center
Sudden oak death plots and transects—
These permanent plots were installed in 2001 and have been measured three times
to determine the severity of infection and ecological response.
82
GENERAL TECHNICAL REPORT PSW-GTR-213
AcknowledgmentsInformation in this document was compiled with help from Phil Aune, Jim
Lindquist, Todd Hamilton, and Brian Wing, as well as Tim Robards, from the
California Department of Forestry and Fire Protection. The authors are indebted
to Jianwei Zhang, research forester with the Pacific Southwest Research Station,
for continuing the maintenance and remeasurement of the levels-of-growing-stock
and initial spacing studies upon the retirement of William W. Oliver.
Metric EquivalentsWhen you know: Multiply by: To find:
Inches (in) 2.54 Centimeters (cm)
Feet (ft) .3048 Meters (m)
Acres (ac) .405 Hectares (ha)
Milacres .000405 Hectares (ha)
Square feet (ft2) .0929 Square meters (m2)
Square feet per acre (ft2/ac) .229 Square meters per hectare (m2/ha)
Pounds per acre (lb/ac) 1.12 Kilograms per hectare (kg/ha)
Pounds per acre (lb/ac) .00112 Metric tons per hectare (Mg/ha)
Trees per acre 2.471 Trees per hectare
ReferencesCochran, P.H. 1978. Response of pole-sized ponderosa pine stand to nitrogen,
phosphorus, and sulfur. Res. Note PNW-319. Portland, OR: U.S. Department
of Agriculture, Forest Service, Pacific Northwest Forest and Range Experiment
Station. 8 p.
Cochran, P.H. 1979. Response of thinned ponderosa pine to fertilization. Res.
Note PNW-339. Portland, OR: U.S. Department of Agriculture, Forest Ser-
vice, Pacific Northwest Forest and Range Experiment Station. 8 p.
Curtis, R.O.; Marshall, D.D. 2005. Permanent-plot procedures for silvicultural
and yield research. Gen. Tech. Rep. PNW-634. Portland, OR: U.S. Department
of Agriculture, Forest Service, Pacific Northwest Research Station. 84 p.
Dunning, D. 1928. A tree classification for the selection forests of the Sierra
Nevada. Journal of Agricultural Research. 36(9): 755–771.
Dunning, D.; Reineke, L.H. 1933. Preliminary yield tables for second-growth
stands in the California pine region. Tech. Bull. 354. Washington, DC: U.S.
Department of Agriculture.
83
Historical Growth Plots in the Pacific Southwest
Fowells, H.A.; Shubert, G.H. 1951. Natural reproduction in certain cutover pine-
fir stands of California. Journal of Forestry. 49: 192–196.
Hasel, A.A.; Wohletz, E.; Tallmon, W.B. 1934. Methods-of-cutting, California
Forest and Range Experiment Station, Stanislaus Branch, Plots 9, 10, 11,
Progress Report. 137 p. Unpublished report. On file with: USDA Forest Ser-
vice, Pacific Southwest Research Station, Redding Silviculture Laboratory,
3644 Avtech Parkway, Redding, CA 96002.
Meyer, W.H. 1938. Yield of even-aged stands of ponderosa pine. Tech. Bull. 630.
Washington, DC: U.S. Department of Agriculture.
Myers, C.A. 1967. Growing stock levels in even-aged ponderosa pine. Res. Pap.
RM-33. Fort Collins, CO: U.S. Department of Agriculture, Forest Service,
Rocky Mountain Forest and Range Experiment Station. 8 p.
Oliver, W.W. 2000. Ecological research at the Blacks Mountain Experimental
Forest in northeastern California. Gen. Tech. Rep. PSW-179. Albany, CA:
U.S. Department of Agriculture, Forest Service, Pacific Southwest Research
Station. 66 p.
Oliver, W.W.; Powers, R.F. 1978. Growth models for ponderosa pine: I. Yield
of unthinned plantations in northern California. Res. Pap. PSW-133. Berkeley,
CA: U.S. Department of Agriculture, Forest Service, Pacific Southwest Forest
and Range Experiment Station. 21 p.
Powers, R.F.; Oliver, W.W. 1978. Site classification of ponderosa pine under
stocking control in California. Res. Pap. PSW-128. Berkeley, CA: U.S. Depart-
ment of Agriculture, Forest Service, Pacific Southwest Forest and Range
Experiment Station. 9 p.
Schumacher, F.X. 1926. Yield, stand and volume tables for white fir in the
California pine region. Bull. 407. Berkeley, CA: University of California,
Agricultural Experiment Station.
Schumacher, F.X. 1930. Yield, stand and volume tables for Douglas-fir in
California. Bull. 491. Berkeley, CA: University of California, Agricultural
Experiment Station.
Schumacher, F.X. 1938. Yield, stand and volume tables for red fir in California.
Bull. 456. Berkeley, CA: University of California, Agricultural Experiment
Station.

i
Fort Collins Service Center
Web site
Telephone
FAX
Mailing address

This Page Left Blank Intentionally

This Page Left Blank Intentionally
Related Documents