SURE: Shizuoka University REpository http://ir.lib.shizuoka.ac.jp/ This document is downloaded at: 2012-04-12T01:52:25Z Title Historical effect in the territoriality of ayu fish. Author(s) Tanaka, Yumi; Iguchi, Kei'ichiro; Yoshimura, Jin; Nakagiri, Nariyuki; Tainaka, Kei-ichi Citation Journal of Theoretical Biology. 268(1), p. 98-104 Issue Date 2011-01-07 URL http://hdl.handle.net/10297/5460 Version author Rights Copyright © 2010 Elsevier Ltd All rights reserved.

Welcome message from author
This document is posted to help you gain knowledge. Please leave a comment to let me know what you think about it! Share it to your friends and learn new things together.
Transcript
SURE: Shizuoka University REpository
http://ir.lib.shizuoka.ac.jp/
This document is downloaded at: 2012-04-12T01:52:25Z
Title Historical effect in the territoriality of ayu fish.
Author(s) Tanaka, Yumi; Iguchi, Kei'ichiro; Yoshimura, Jin; Nakagiri,Nariyuki; Tainaka, Kei-ichi
Citation Journal of Theoretical Biology. 268(1), p. 98-104
Issue Date 2011-01-07
URL http://hdl.handle.net/10297/5460
Version author
Rights Copyright © 2010 Elsevier Ltd All rights reserved.
1
Historical effect in the territoriality of Ayu fish 1
2
Yumi Tanaka1, Kei’ichiro Iguchi2, Jin Yoshimura3,4,5, Nariyuki Nakagiri1 and Kei-ichi 3 Tainaka3* 4
1School of Human Science and Environment, University of Hyogo, Himeji, 670-0092, 5 Japan (e-mail: Y.T.: [email protected], N.N.: 6 [email protected]). 7
2National Research Institute of Fisheries Science, Fisheries Research Agency, 1088 8 Komaki, Ueda 386-0031, Japan (e-mail: [email protected]). 9
3Department of Systems Engineering, Shizuoka University, Hamamatsu 432-8561, 10 Japan (e-mail: J.Y.: [email protected], K.T.: [email protected]) 11
4Marine Biosystems Research Center, Chiba University, 1 Uchiura, Kamogawa 12 299-5502, Japan. 13
5Department of Environmental and Forest Biology, State University of New York 14 College of Environmental Science and Forestry, Syracuse, New York 13210, USA. 15
*Corresponding author: Kei-ichi Tainaka 16
17
Keywords: fish behavior, territory formation, territory breakdown, historical effect, 18 phase transition 19
20
2
Abstract 21
Ayu fish form algae-feeding territories in a river during a non-breeding (growing) 22
season. We build a cost-benefit theory to describe the breakdown and formation of 23
territory. In the early stage of a growing season, all fish hold territories at low densities. 24
Once all territory sites are occupied, excess fish become floaters. When fish density 25
further increases, a phase transition occurs: all the territories suddenly break down and 26
fish form a school. In contrast, when the fish density is decreased, territories are 27
suddenly formed from the school. Both theory and experiments demonstrate that ayu 28
should exhibit a historical effect: the breakdown and formation processes of territory are 29
largely different. In particular, the theory in formation process predicts a specific fish 30
behavior: an “attempted territory holder” that tries to have a small territory emerges just 31
before the formation of territory. 32
33
3
1. Introduction 34
Animals have evolved various behavioral strategies as an adaptation for 35
different ecological circumstances (Krebs and Davies 1987). Territoriality and group 36
foraging are the two different ways of adaptation (Foster 1985). Territorial behavior is a 37
life history adaptation in the solitary state of animals (Brown and Orians 1970; Ebersole 38
1977; Davies and Houston 1984), while group foraging is an adaptation by forming a 39
group (Schaller 1972; Robertson et al. 1976). In many species, mating pairs often form 40
a breeding territory, while they forage in group during non-breeding seasons, e.g., most 41
of migratory birds. However, it is rather rare to see a transition between territoriality and 42
group foraging in a single (non-breeding) season. 43
Whether territory formation is adaptive or not can be answered by usual the 44
cost-benefit analysis comparing the individuals with/without a territory, within a 45
solitary state (Krebs 1971). Group foraging is also compared with solitary foraging in a 46
species with some group foraging (Pulliam and Caraco 1984; Clark and Mangel 1986). 47
These two different evolutionary adaptations may occur in a closely related species, e.g., 48
fishes (Foster 1985). However, it should be extremely rare to find both territorial 49
foraging and group foraging in a single species. The cost-benefit analyses of these 50
behavioral strategies can provide a single framework to view the adaptive evolution of 51
4
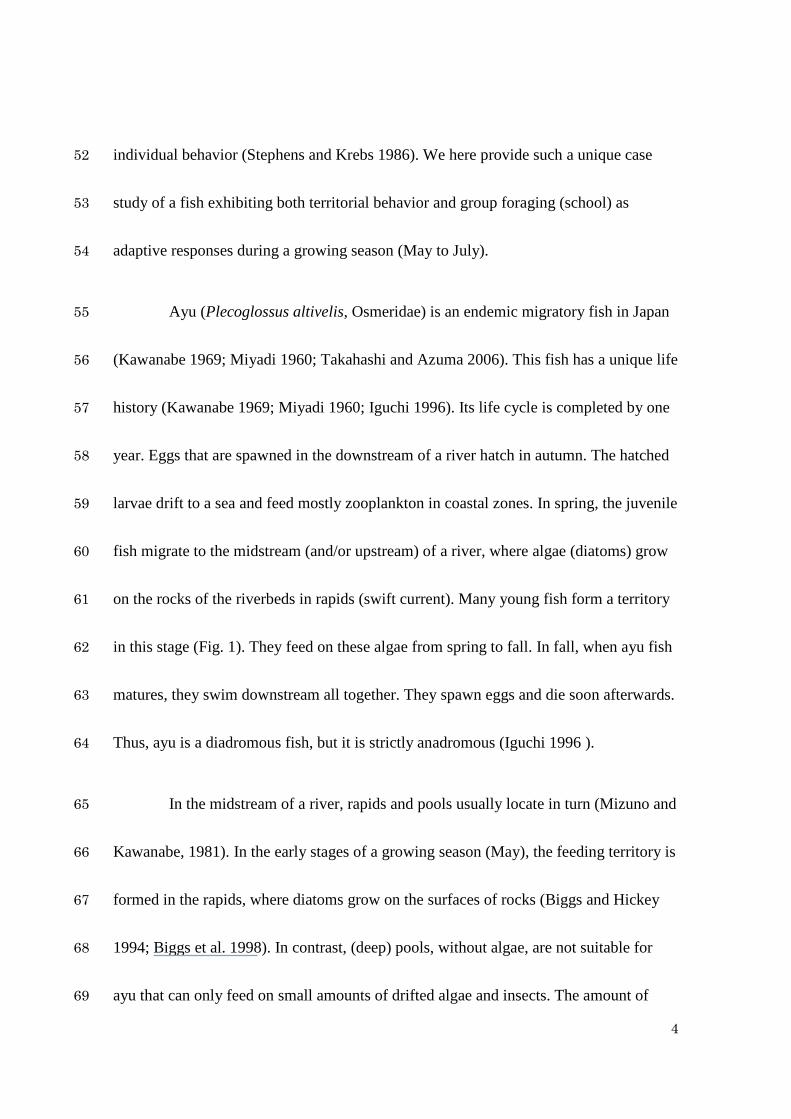
individual behavior (Stephens and Krebs 1986). We here provide such a unique case 52
study of a fish exhibiting both territorial behavior and group foraging (school) as 53
adaptive responses during a growing season (May to July). 54
Ayu (Plecoglossus altivelis, Osmeridae) is an endemic migratory fish in Japan 55
(Kawanabe 1969; Miyadi 1960; Takahashi and Azuma 2006). This fish has a unique life 56
history (Kawanabe 1969; Miyadi 1960; Iguchi 1996). Its life cycle is completed by one 57
year. Eggs that are spawned in the downstream of a river hatch in autumn. The hatched 58
larvae drift to a sea and feed mostly zooplankton in coastal zones. In spring, the juvenile 59
fish migrate to the midstream (and/or upstream) of a river, where algae (diatoms) grow 60
on the rocks of the riverbeds in rapids (swift current). Many young fish form a territory 61
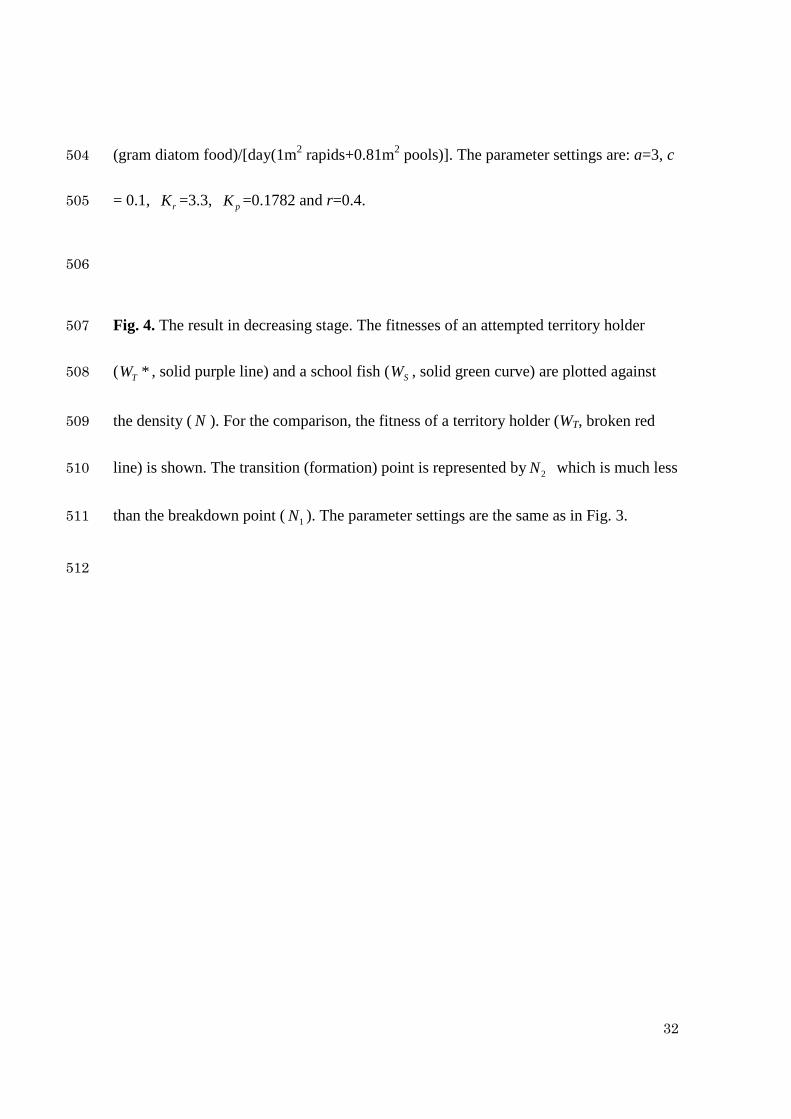
in this stage (Fig. 1). They feed on these algae from spring to fall. In fall, when ayu fish 62
matures, they swim downstream all together. They spawn eggs and die soon afterwards. 63
Thus, ayu is a diadromous fish, but it is strictly anadromous (Iguchi 1996 ). 64
In the midstream of a river, rapids and pools usually locate in turn (Mizuno and 65
Kawanabe, 1981). In the early stages of a growing season (May), the feeding territory is 66
formed in the rapids, where diatoms grow on the surfaces of rocks (Biggs and Hickey 67
1994; Biggs et al. 1998). In contrast, (deep) pools, without algae, are not suitable for 68
ayu that can only feed on small amounts of drifted algae and insects. The amount of 69
5
algae growing in one territory is several times more than the necessary amounts for one 70
fish to grow to maturity (Iguchi and Abe 2002; Gill and Wolf 1975). During the 71
growing season, many fish swim into a river and the fish density increases daily. 72
Those that cannot hold a territory become a floater. A floater, usually staying in a pool, 73
cannot feed well. It sometimes intrudes into a territory in the rapids and steals algae 74
while intruding. In order to defend its own territory, the territory holder attacks a floater 75
violently (Fig. 1). The unique “tomo-dsuri” fishing exploits such violent attacks: 76
fishermen use a live decoy as an intruder to catch the territory holder. When the fish 77
number in the midstream increases, all fish form a school. In contrast, when the fish 78
number decreases, the state of fish conversely changes from school to territory. In the 79
present paper, we estimate the fitness (Gross 1982; 1985; Tainaka et al. 2007; Tanaka et 80
al. 2009) of an individual fish, and report a historical effect by the comparison between 81
breakdown and formation processes of territories. 82
83
2. Model 84
An individual fish takes one of three strategies: territorial holder (Th), floater (Fl) and 85
school (Sc). The optimal strategies for the energy (food) gain of an individual fish 86
6
depend not only on total fish density but also on the time difference of density. We 87
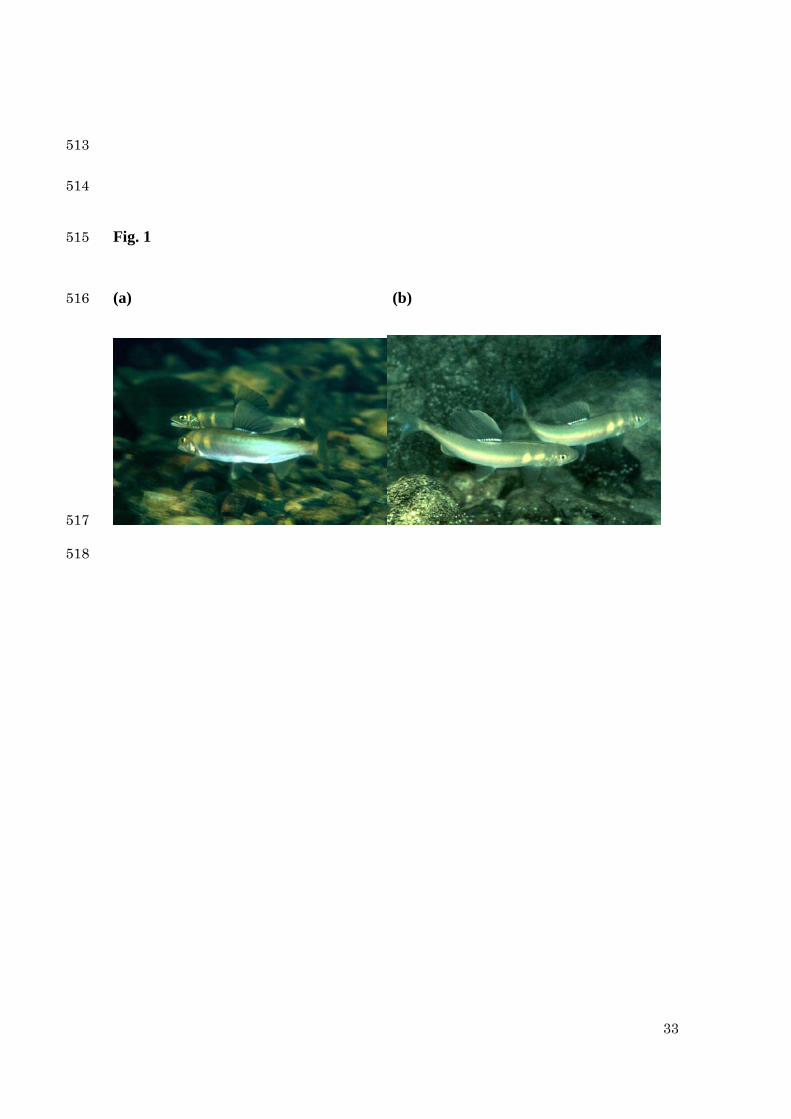
expect the breakdown and formation of a territory as illustrated in Fig. 2. First, we deal 88
with the case that the overall density ( N ) increases. From the previous studies 89
(Kawanabe 1969; Iguchi 1996; Kawanabe 1958, 1970, 1973), we assume the following 90
three phases: 91
i) Th-phase 92
At low density, all fish can hold territories in the rapids and some territories are not 93
occupied (Kawanabe 1973). When the density of fish increases, all incoming fish can 94
hold a new territory in a vacant site, until all the territory sites are occupied ( maxTNN ≤ ). 95
Here maxTN is the maximal number (density) of territories. 96
ii) Coexisting phase: (Th+Fl)-phase 97
When the population size exceeds the territory capacity ( maxTNN > ), newcomers 98
cannot hold territories. These fish become a floater staying in the pool. Hence, we 99
suspect that a floater is not an available option, but a forced action. Each territory holder 100
defends own territory against intruders (floaters). 101
iii) Sc-phase 102
7
Due to more newcomers, the number of floaters increases. Since territory intrusions by 103
floaters become frequent, territory holders have to spend much more time in defending 104
their own territory. They lose the time to feed on algae. When the density of fish 105
exceeds a critical density ( 1N ), all the territories suddenly break down (Kawanabe 1958, 106
1970, 1973). For 1NN > , all fish form a school at once (Fig. 2). 107
In summary, in the increasing stage of density, the fish behavior changes as 108
Th→ (Th+Fl)→Sc. The total density ( N ) is represented by 109
)()(
)(
1
1max
max
NNNNN
NN
NNNNN
NN
T
T
S
FT
T
<≤<
≤
=+=
= (1) 110
where TN , FN and SN denote the densities of territorial holder, floater and school, 111
respectively. 112
At the high density, all fish form a school. However, even when the fish 113
density decreases less than the breakdown point 1N , territories cannot be observed. The 114
fish schools should persist up to a very low density, until every fish can hold a territory 115
at once. This is because the territory formation is very hard. When 1NN < , a fish has 116
two options: either to attempt to make a territory or remain in a school. We call the 117
former 'attempted territory holders' (Th*). Even if one fish attempts to hold a territory, 118
8
other remaining fish become intruders. The defense against school fish is very hard, 119
while the defense against a solitary intruder is highly effective (Iguchi 1996; Tachihara 120
and Kimura 1992). 121
However, if the density becomes lower below a critical value ( 2NN < ), then 122
territory holders can emerge at once. The formation point of territory ( 2N ) can be 123
estimated by the timing when all fish can hold a territory, or when no fish are 124
necessarily forced to be a floater. When 2NN < , all fish become territory holders. The 125
formation point 2N is much less than the breakdown point 1N , and it should be 126
almost equal to the maximum density maxTN of territory. In the decreasing stage, the 127
fish behaviors change as Sc→Th. The density of each strategy is given by 128
≤>
=2
2
NNNNNN
NT
S (2) 129
There is no forced option to be a floater in the decreasing stage (Fig. 2). The attempted 130
territory holder (Th*) can emerge for 21 NNN >> . 131
132
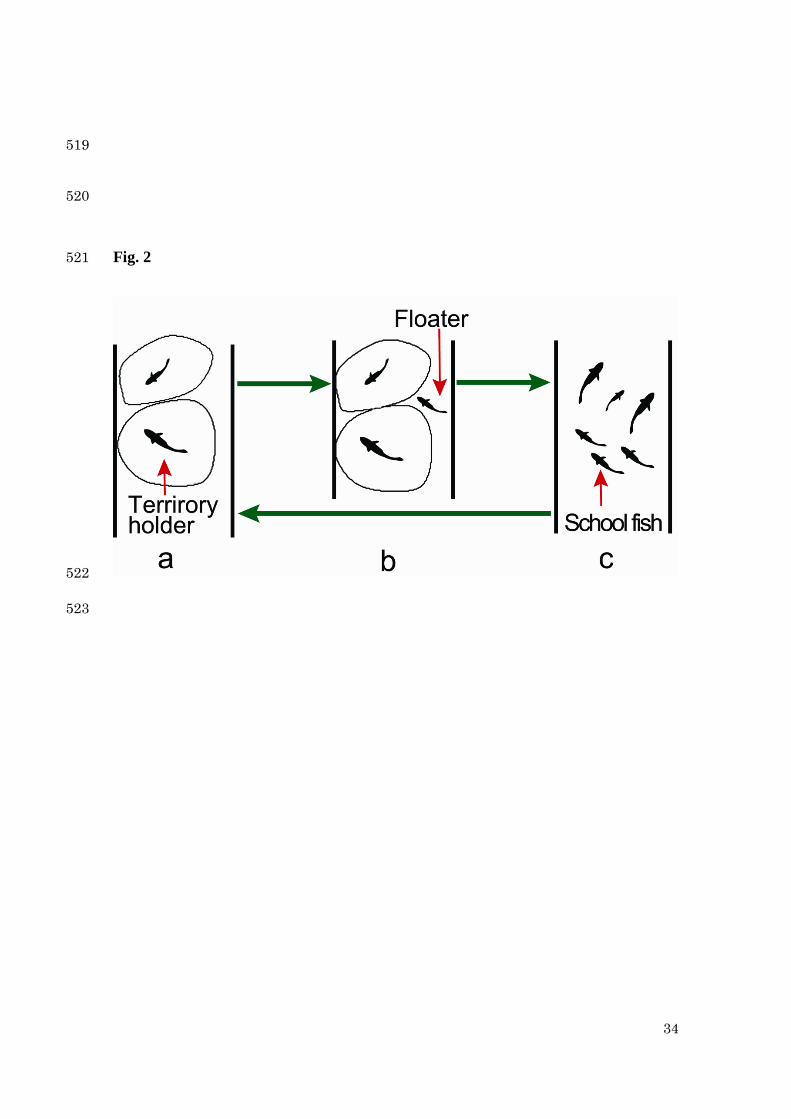
9
3. Theory 133
3-1. Cost-benefit theory in an increasing stage 134
We estimate the fitness of an individual fish for three strategies: territorial holder (Th), 135
floater (Fl) and school (Sc). The fitness is composed of both cost and benefit, where the 136
cost is defined by a defense cost to protect a territory, and the benefit is assumed to be 137
the food amount each fish can eat. 138
When the overall density N is increased, the choice changes according to the 139
following three phases: 140
i) Th-phase ( maxTNN ≤ ) 141
When all fish have territories, the fitness of a territory holder ( TW ) takes the maximum 142
value. Let Kr be the algal food amount in the rapids, then TW can be expressed as 143
TW = maxmax/ TTr WNK = =const. (3) 144
ii) Coexisting phase ( 1max NNNT ≤< ) 145
The territory holder bumps its body against the intruding floater repeatedly until the 146
floater leaves its territory. Let fτ and dτ be the dimensionless ratios of the feeding 147
10
and defense time durations of a territory holder, respectively ( 1=+ df ττ ) (Brown 148
1964; Pyke 1979). The fitness of a territory holder TW can be expressed as 149
TW = ddFfTr cNK ττ −)/( max (4) 150
where dFc is the defense cost of a fish against a floater. For simplicity, we assume dτ 151
is a linear function of floater density: 152
Fd aN=τ (5) 153
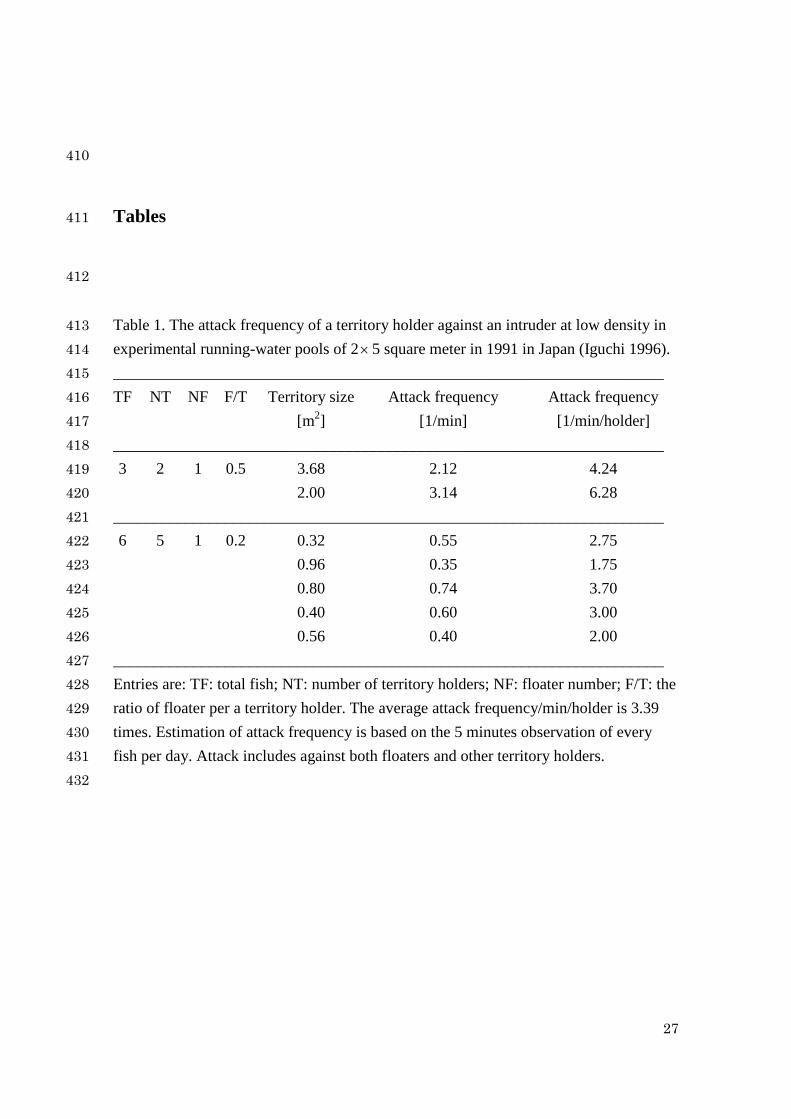
where a is a constant. Equation (5) comes from the experimental data as listed in 154
Table 1. We find from this table that the attack frequency increases as the floater 155
number increases. 156
Next, we evaluate the fitness FW of a floater. Since the floater is the forced 157
option, FW is always smaller than TW . The floater fitness is not important to 158
determine the optimal strategy. Note the profile of FW has the following properties: (i) 159
if the density ( FN ) of floaters is low, FW is nearly constant. (ii) On the contrary, if 160
FN is high, FW may be represented by Fp NK / , where pK is the food amount in 161
the pools. 162
iii) Sc-phase )( 1NN > 163
11
Now, we evaluate the fitness SW of a school fish for Sc-phase. Since the school fish 164
feeds both in the rapids and pools, the fitness of a school fish is given by 165
NKrKW prS /)( += (6) 166
where r is the feeding rate of school fish in rapids relative to a territory holder ( 1<r ). 167
In Fig. 3, both FW and TW are depicted against the total density N . The breakdown 168
point 1N of territoriality can be determined by 169
TS WW = (7) 170
In the above model, to guarantee the cross point at N1, we assume that prr KrKK +> . 171
The optimal strategy is territory holder ( ≥TW SW ) for 1NN ≤ , while school fish is 172
optimal ( SW > TW ) for 1NN > (Fig. 3). 173
174
3-2. Cost-benefit theory in a decreasing stage 175
At high density, the fitness SW of school fish is same as that in the increasing stage 176
[see Eq. (6)]. With decreasing fish density ( 1NN < ), the fitness SW becomes smaller 177
than TW . Here a fish has two options: either to attempt to make a new territory or 178
remain in a school. We specifically consider the fitness of an attempted territory holder 179
12
( *TW ). Note that there is an essential difference between increasing and decreasing 180
stages: in the increasing stage, the intruders are floaters, while in the decreasing stage 181
the intruders are school fish. Hence, the defense time ratio dτ is proportional to the 182
density of school fish. 183
Sd aN=τ (8) 184
The fitness *TW of an attempted territory holder can be expressed as 185
ddSfTrT cNKW ττ −= )/(* max (9) 186
where dSc is the defense cost of a fish against school fish. Note that the defense cost 187
against school fish is much larger than that of floaters, such that dSc >> dFc . This 188
difference is very important. Below the critical density ( 2NN < ), all school fish should 189
switch to the territory option; we have the critical point ( 2N ) of territory formation by 190
ST WW =* (10) 191
When all fish can hold a territory, they become territory holder. Their fitness jumps up 192
to the maximum value maxTW . 193
194
13
3-3. Numerical estimations 195
We insert the empirical data into the model to estimate the expected dynamics and 196
transition points numerically. Since an ayu fish forms a territory of ca. 1 [m2] (Miyadi 197
1960; Kawanabe 1973), we set that maxTN = 1 [/m2 rapids]. (We consider the fitness 198
based on 1 m2 rapids in a midstream of a river.) In a typical Japanese river, the 199
midstream consists of about 55% of rapids and about 45% of pools (Kawanabe 1973). 200
This means that 1 m2 rapids are associated with 0.81 [m2 pools]. The defense time ( dτ ) 201
and feeding time ( fτ ) are estimated from empirical studies (Kawanabe 1969, Kawanabe 202
1970) as follows. Let nf and nd be the times (numbers: [/min]) of feeding and defense 203
(attack), respectively, per one territory holder. The maximum number of defense in a 204
minute is 15 times, whereas that of feeding is 30 times. Therefore, we get dτ = nd/15 205
and fτ = nf /30 = 1 - nd/15, since dτ + fτ = 1. Because the times of defense (attack) nd, 206
increases with the number of floaters, we assume that nd = aNF. From low density (NF ≤ 207
1) experiments in pools, the attack rate is estimated that a = 1.8~6.3, on average, ca. 3.4 208
(Table 1). Therefore, we set a = 3.0. 209
The algal food amount in the rapids, Kr, is estimated 3.3 [g /day/ (m2 rapids)] 210
for a 20cm long fish (11 Kcal equivalent) (Kawanabe 1969). Since the defense cost dFc 211
14
against a floater is estimated between 0.01 ~ 0.2 (Iguchi and Hino 1996), we set dFc = 212
0.1. Numerically, we derive that WT = Kr - (Kr+ dFc )(a/15)(N-1) Next, we estimate the 213
amount of food available in pools, Kp. The average diatom dry weight for rapids and 214
pools are 6.25 and 0.42 [g/m2] (Miyadi 1960). Therefore, numerically, we get Kp = 215
[(0.42・0.81)/6.25)]Kr = 0.054Kr. 216
Now we estimate the fitness of a school fish, WS. The relative feeding rate of 217
fish is estimated that r = 0.4 from the relative sizes of territory holders and school fish 218
(Kawanabe 1969). Therefore, we get WS = 0.454Kr (if N≤1) or 0.454Kr/N (if N>1). 219
Finally, we estimate the fitness WT* of an attempted territory holder. We estimate the 220
defense cost against school fish, dSc = 10 (Iguchi 1996). Therefore, the defense time of 221
an attempted territory holder is Td* = (a/15)(N-1). Then we derive numerically that WT* 222
= Kr - (Kr+ dSc )(a/15)(N-1). 223
224
4. Analysis and Results 225
We compare the theory with empirical data which were obtained previously. 226
First we deal with the case that the fish density increases. The fitnesses of ayu fish 227
against the population density are plotted in Fig. 3. When the density exceeds maxTN , 228
15
floaters emerge in the pool. Above the breakdown point ( 1NN > ), territory holders 229
should give up the territory and switch to schooling. The breakdown point is given by 230
1N =5.486 [fish/m2] in the current model. 231
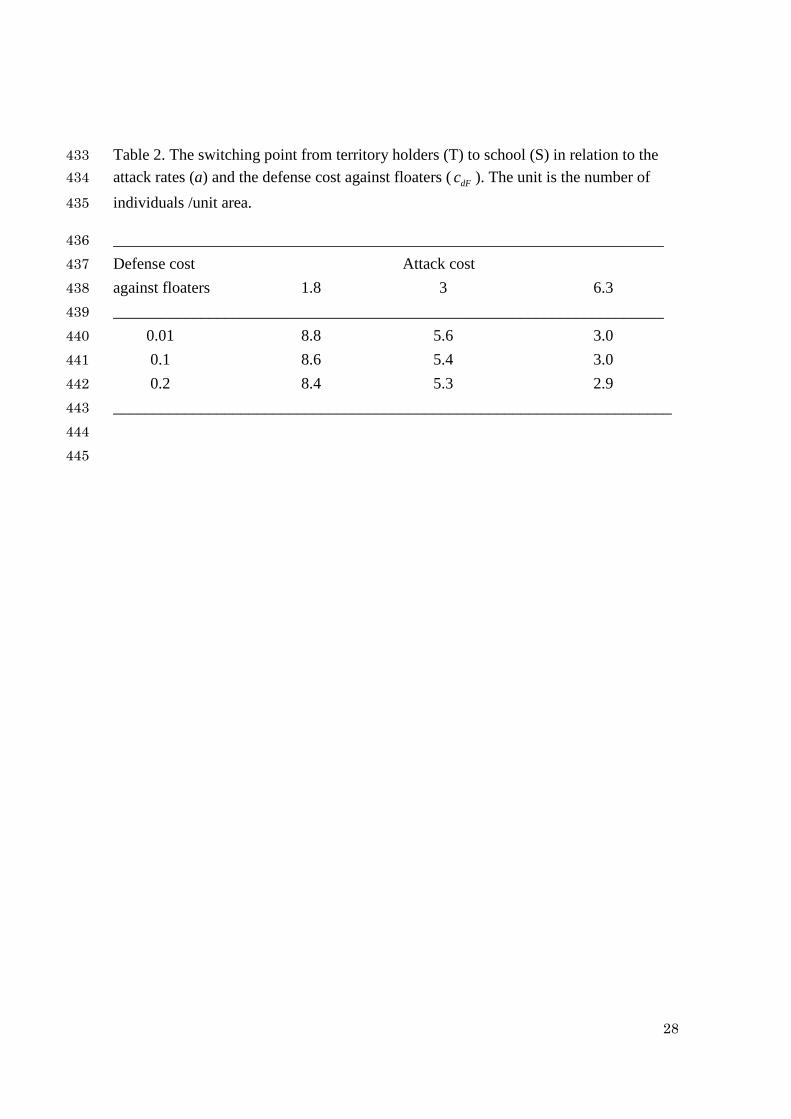
Table 2 shows the sensitivity of the attack rates and the defense cost against 232
floaters for their observed ranges and selected values. These results indicate that the 233
defense costs against floaters ( dFc ) have almost no effects on the outcomes. On the 234
other hand, the attack rates have much more profound effects on the optimal switching 235
points from 2 to 8 individuals. As our best estimate, we here keep the optimal switching 236
point for a = 3 and dFc = 0.1. 237
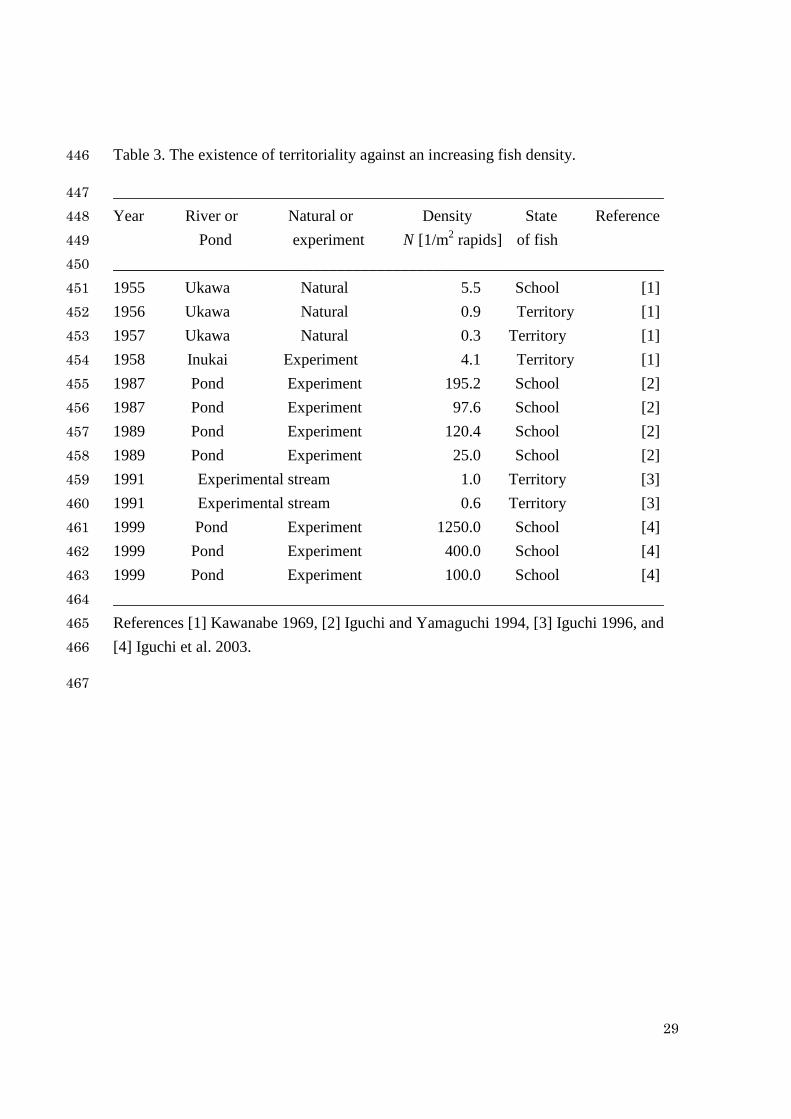
Table 3 shows the observation data of fish state in increasing fish density. 238
From Table 3, territoriality is maintained for N <4.1 [fish/m2] and schooling is seen for 239
N >5.5 [fish/m2]. These data mean 5.51.4 1 << N , which are consistent with the 240
theoretical estimation ( 1N =5.486). We should also note that the estimated breakdown 241
point is fairly robust in the estimated range of defense cost dSc (=5~15). 242
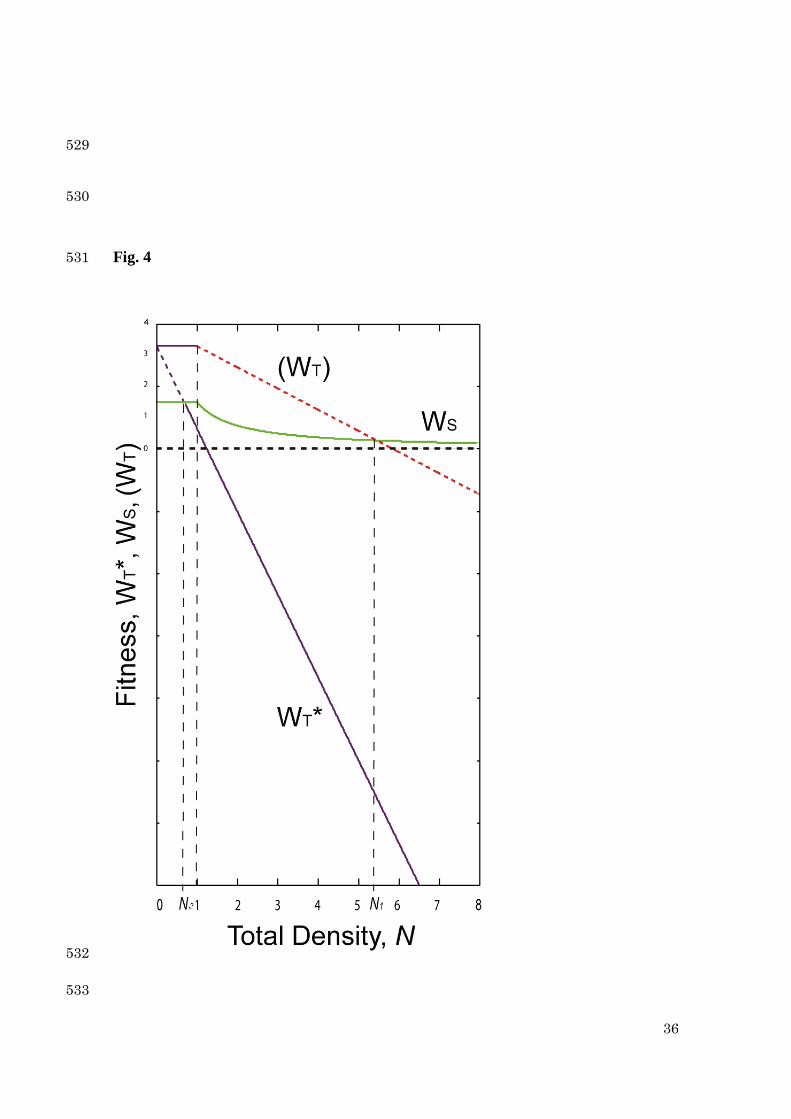
Next, we deal with the case that the fish density decreases. At a high density, 243
all fish form a school ( 1NN > ). In Fig. 4, the fitnesses in decreasing process are 244
depicted against the density N . When the density decreases below 1N , a school fish 245
16
attempts to have a territory. The fitness of territory holders ( TW ) is not available for an 246
attempted territory holder. Even if 1NN < , the fitness of attempted territory holder 247
( *TW ) may be smaller than that of school fish ( SW ). However, when 2NN < 248
( ST WW >* ), all school fish should switch to the territory option. 249
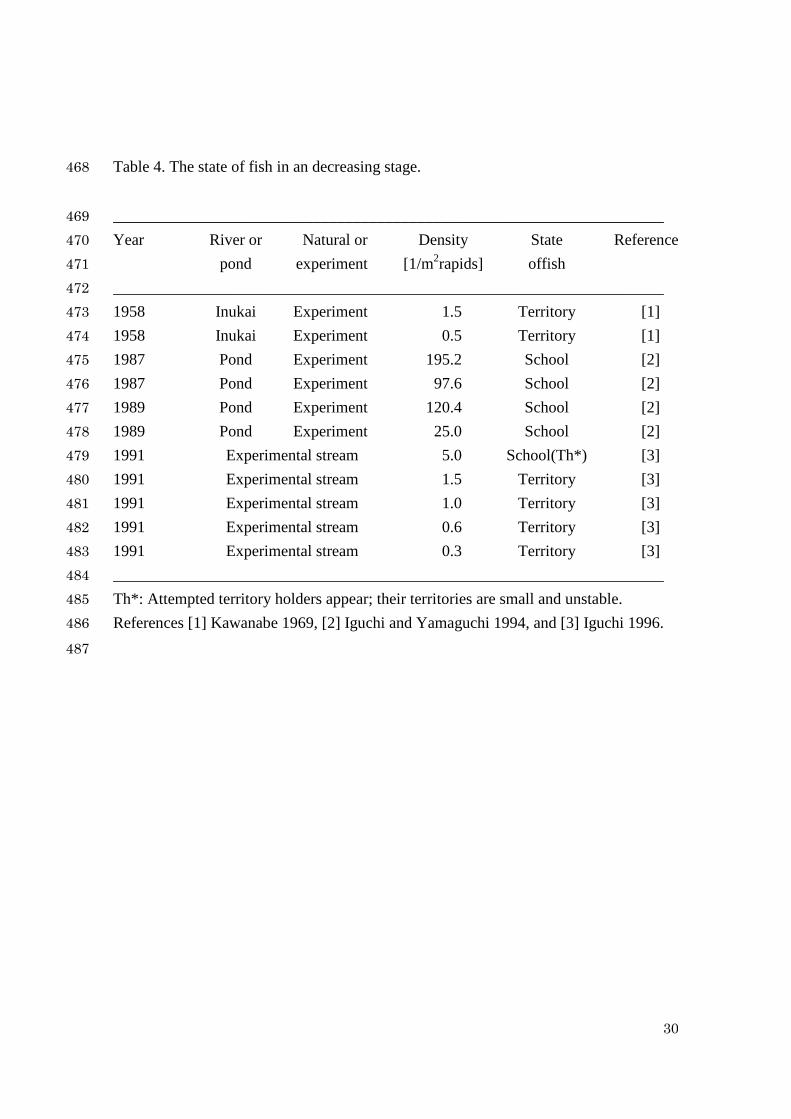
The observation data of fish state in decreasing process are listed in Table 4. 250
When 0.25>N , all fish form school. In contrast, when 5.1<N , all have territories. In 251
the intermediate case, the fitness SW is lower than TW , but larger than *TW 252
( *TST WWW >> ). Thus, few school fish attempt to have their territories, but they 253
cannot have stable territories. The data N =5.0 in Table 4 just indicate the emergence 254
of attempted territory holders (Th*). In this case, the territories are small and unstable 255
and a floater never emerges. This observation agrees with the theoretical prediction at 256
12 NNN << . When the density further decreases at or below 2N , then every fish can 257
hold a territory. Hence, the fish switch to territoriality to keep a higher fitness. The 258
critical value may be close to maxTN . Although maxTN is unity for natural river, it takes 259
a value larger than unity in experimental (rich food) condition. 260
261
17
5. Discussion and Conclusion 262
We apply a fitness theory (Gross 1982; Tainaka et al. 2007; Tanaka et al. 2009) 263
to obtain both cost and benefit for three behavioral strategies: territory holder (Th), 264
floater (Fl), and school fish (Sc). The empirical data (see Tables 1 and 3) show the 265
behavior of ayu fish changes depending on its density. When the density ( N ) increases, 266
the fish state changes as Th→ (Th+Fl)→Sc (see Fig. 2 a→b→c). In contrast, in the 267
decreasing process of N , the phase changes as Sc→Th (Fig. 2 c→a). The different 268
phase transitions between increasing and decreasing processes denotes the historical 269
effect (hysteresis). The breakdown point ( 1N ) of territory should be larger than the 270
formation point ( 2N ). This is because each fish easily forms the territory in increasing 271
stage, but the territory formation is very hard against school fish in decreasing stage. 272
The value 1N is determined by TW = SW [see Eq. (7)], while 2N is determined by 273
*TW = SW [see Eq. (10)]. 274
Our results show the unique properties of ayu decisions along with the increase 275
(decrease) in density. When the density increases, the decision maker is not a floater, 276
but a territory holder (Th). When TW = SW , then the Th fish gives up the territoriality. In 277
contrast, when the density decreases, a school fish is a decision maker: when *TW = SW , 278
then the Sc fish gives up schooling. In both processes, the floater is not an option but a 279
18
forced option. No fish wants to be a floater (loser)! Such a difference of transition 280
points causes the emergence of attempted territory holder (Th*) in the decreasing 281
process of fish density. Even if a fish tries to hold a territory (Th*), school fish ignore 282
and swim over the territory and feed algae freely (Iguchi 1996; Tachihara and Kimura 283
1992). The fitness of Sc is much smaller than that of Th, but is larger than that of Th*. 284
This is because Th* defends against school fish, while Th defends against 285
scattered/sporadic floaters. Note that the defense against school fish is known to be very 286
hard (Iguchi 1996; Tachihara and Kimura 1992). 287
The historical effect (hysteresis) is well known in physics, such as ice-water 288
transition and magnetism. However, biological hysteresis was rare (Caraco 1980; Ronce 289
and Kirkpatrick 2001). Caraco (1980) dealt with dynamics of avian flocks foraging in 290
two patches, and reported the animal hysteresis. When a population size increases, the 291
incoming birds continue to join a single crowded feeding ground, until choosing a 292
vacant risky site becomes better than joining the already crowded patch. When the 293
population size decreases with birds leaving the feeding grounds, the number of birds in 294
both grounds becomes much less than the optimal flock size. The dynamics of flock 295
sizes are shifted from the optimal flock size (a single transition point) when flock sizes 296
are increasing or decreasing (Caraco 1980). The territoriality in ayu is another case of 297
19
animal hysteresis. We show the different phase transitions as illustrated in Fig. 2. 298
Moreover, we report a distinct property never seen in other hysteresis systems. Namely, 299
we can see the historical effect in fish behaviors. In the decreasing process of the 300
population size N , attempt territory holders (Th*) often appear instead of floaters. 301
The empirical data in increasing stage (Table 3) indicate that the breakdown 302
point ( 1N ) of territoriality can be represented by 5.51.4 1 << N . This result is 303
consistent with the theoretical estimation ( 1N =5.486). On the other hand, empirical data 304
in decreasing stage (Table 4) suggest that 0.55.1 2 << N . This slightly differs from our 305
prediction ( 12 ≈N ). The discrepancy may come from the estimation of parameters. In 306
particular, the number of fish which intrudes into the territory of Th* may be 307
overestimated [see Eq. (8)]. Our model is an extremely simple cost benefit model, so 308
that other important factors are not included, e.g., individual variations in fish traits 309
(Katano and Iguchi 1996), interference by other fish species (Katano et al. 2000), the 310
quality and size variations of the territories (Iguchi and Hino 1996), and the time scale 311
of increasing/decreasing fish densities. The reproduction (regeneration) of algae after 312
feeding may be also important, because the rate of regeneration is different between 313
territorial feedings and school foraging (Katano et al. 2000). 314
315
20
Acknowledgments 316
We thank Fugo Takasu and Hiroya Kawanabe for valuable comments. This 317
work was partly supported by grants-in-aids from the Ministry of Education, Culture, 318
Sports, Science and Technology of Japan to J. Y. and to K. T. 319
320
21
321
References 322
Biggs, B. J. F., D. G. Goring, and V. I. Nokora. 1998. Subsidy and stress responses of 323
stream periphyton to gradients in water velocity as a function of community growth rate. 324
Journal of Phycology 34: 598-607. 325
Biggs, B. J. F., and C. W. Hickey. 1994. Periphyton responses to a hydraulic gradient in 326
a regulated river in New Zealand. Freshwater Biology 32: 49-59. 327
Brown, J. L. 1964. The evolution of diversity in avian territorial systems. Wilson Bull. 328
76: 160-169. 329
Brown, J. L. and G. H. Orians. 1970. Spacing patterns in mobile animals. Annual 330
Review of Ecology and Systematics 1:239-262. 331
Caraco, T. 1980. Stochastic dynamics of avian foraging flocks. American Naturalist 332
115: 262-275. 333
Clark C. W. and M. Mangel. 1986. The evolutionary advantages of group foraging. 334
Theoretical Population Biology 30: 45-75. 335
22
Davies, N. B. and A. I. Houston. 1984. Territory Economics. In J. R. Krebs and N. B. 336
Davies (eds.), Behavioral Ecology: An Evolutionary Approach, 2nd ed., pp. 148–169. 337
Blackwell Scientific Publications, Oxford. 338
Ebersole, J. P. 1977. The adaptive significance of interspecific territoriality in the reef 339
fish Eupomacentrus leucosticus. Ecology 58: 914-920. 340
Foster, S. A. 1985. Group foraging by a coral reef fish : a mechanism for gaining access 341
to defended resources. Animal Behaviour 85: 782-792. 342
Gill, F. B., and L. L. Wolf. 1975. Economics of feeding territoriality in the 343
golden-winged sunbird. Ecology 56: 333-345. 344
Gross, M.R. 1982. Sneakers, satellites and parentals: polymorphic mating strategies in 345
North American sunfishes. Zeitschrift für Tierpsychol. 60: 1–26. 346
Gross, M. R. 1985. Disruptive selection for alternative life histories in salmon. Nature 347
313, 47–48. 348
Iguchi, K. 1996. “The territory of Ayu” revisited. Gekkan Kaiyo 28: 281-285 (In 349
Japanese). 350
23
Iguchi, K., and S. Abe. 2002. Territorial defense of an excess food supply by an algal 351
grazing fish, ayu. Ecological Research 17: 373-380. 352
Iguchi, K., and T. Hino. 1996. Effect of competitor abundance on feeding territoriality 353
in a grazing fish, the ayu Plecoglossus altivelis. Ecological Research 11: 165-173. 354
Iguchi, K., K. Ogawa, M. Nagae and F. Ito. 2003. The influence of rearing density on 355
stress response and disease susceptibility of ayu (Plecoglossus altiveilis). Aquaculture 356
220: 515-523. 357
Iguchi, K. and M. Yamaguchi. 1994. Adaptive significance of inter- and 358
intra-populational egg size variation in ayu Plecoglossus altivelis (Osmeridae). Copeia 359
1994: 184-190. 360
Katano, O., S. Abe, K. Matsuzaki, and K. Iguchi. 2000. Interspecific interactions 361
between ayu, Plecoglossus altivelis, and plae chub, Zacco platypus, in artificial streams. 362
Fisheries Science 66: 452-459 (In Japanese). 363
Katano, O., and K. Iguchi. 1996. Individual differences in territory and growth of ayu, 364
Plecoglossus altivelis (Osmeridae). Canadian Journal of Zoology 74: 2170-2177. 365
24
Katano, O., K. Uchida, and Y. Aonuma. 2004. Experimental analysis of the territorial 366
establishment of ayu, Plecoglossus altivelis. Ecological Research 19: 433-444. 367
Kawanabe, H. 1958. On the significance of the social structure for the mode of density 368
effect in a salmon-like fish, “Ayu”, Plecoglossus altivelis Temminkck et Schlegel. 369
Memoirs of the College of Science, University of Kyoto, Series B 25: 171-180 (In 370
Japanese). 371
Kawanabe, H. 1970. Social behaviour and production of ayu-fish in the River Ukawa 372
between 1955 and 1969, with reference to the stability of its territoriality. Japanese 373
Journal of Ecology 20: 144-151 (In Japanese). 374
Kawanabe, H. 1969. Kawa-to-Mizuumi-no-Sakanatati (Fishes in Rivers and Lakes). 375
Tokyo: Chuo Koronsha, Tokyo (In Japanese). 376
Kawanabe, H. 1973. What is the ‘Nawabari (territory)’ of ayu?: an attempt for the 377
theory of community. Kagaku 43: 74-83 (In Japanese). 378
Krebs, J. R. 1971. Territory and breeding density in the great tit, Parus major L. 379
Ecology 52: 2-22. 380
25
Miyadi, D. 1960. Ayu-no-hanashi (Stories of Ayu). Iwanami-shoten, Tokyo (In 381
Japanese). 382
Mizuno, N., and H. Kawanabe. 1981. A topographical classification of streams, with an 383
introduction of the system widely used in Japan. I. Reach type, stream zone and stream 384
type. Verhandlungen der Internationale Vereinigung für Limnologie 21: 913. 385
Pyke, G. H. 1979. The economics of territory size and time budget in the golden-winged 386
sunbird. Am. Nat. 114: 131-145. 387
Pulliam H. R. and T. Caraco. 1984. Living in groups: Is there an optimal group size? In 388
J. R. Krebs and N. B. Davies (eds.), Behavioral Ecology: An Evolutionary Approach, 389
2nd ed., pp. 148–169. Blackwell Scientific Publications, Oxford. 390
Robertson, D. R., H. P. A. Sweatman, E. A. Fletcher and M. G. Cleland. 1976. 391
Schooling as a mechanism for circumventing the territoriality of competitors. Ecology 392
57: 1208-1220. 393
Ronce, O. and M. Kirkpatrick. 2001. When sources become sinks: migrational 394
meltdown in heterogeneous habitats. Evolution 55: 1520-1531. 395
26
Schaller, G. B. 1972. The Serengeti Lion: A Study of Predator-Prey Relations. Chicago 396
University Press, Chicago. 397
Stephens, D. W. and J. R. Krebs. 1986. Foraging Theory. Princeton University Press, 398
Princeton. 399
Tachihara, K., and S. Kimura. 1992. The ecological significance of the yellow oval 400
marks on body of landlocked ayu in Lake Ikeda. Nippon Suisan Gakkaishi 58: 1191 (In 401
Japanese). 402
Tainaka, K., J. Yoshimura and M. L. Rosenzweig. 2007. Do male orangutans play a 403
hawk-dove game? Evolutionary Ecology Research 9: 1043-1049. 404
Takahashi, I., and K. Azuma. 2006. Kokomade Wakatta Ayu No Hon (The Up-to-now 405
Knowledge Book of Ayu). Tsukiji-shokan, Tokyo, xviii+267pp. (In Japanese). 406
Tanaka, Y., T. Hayashi, D. G. Miller III, K. Tainaka and J. Yoshimura. 2009. Breeding 407
games and dimorphism in male salmon. Animal Behaviour 77: 1409–1413. 408
409
27
410
Tables 411
412
Table 1. The attack frequency of a territory holder against an intruder at low density in 413 experimental running-water pools of 2× 5 square meter in 1991 in Japan (Iguchi 1996). 414 _____________________________________________________________________ 415 TF NT NF F/T Territory size Attack frequency Attack frequency 416 [m2] [1/min] [1/min/holder] 417 _____________________________________________________________________ 418 3 2 1 0.5 3.68 2.12 4.24 419 2.00 3.14 6.28 420 _____________________________________________________________________ 421 6 5 1 0.2 0.32 0.55 2.75 422 0.96 0.35 1.75 423 0.80 0.74 3.70 424 0.40 0.60 3.00 425 0.56 0.40 2.00 426 _____________________________________________________________________ 427 Entries are: TF: total fish; NT: number of territory holders; NF: floater number; F/T: the 428 ratio of floater per a territory holder. The average attack frequency/min/holder is 3.39 429 times. Estimation of attack frequency is based on the 5 minutes observation of every 430 fish per day. Attack includes against both floaters and other territory holders. 431
432
28
Table 2. The switching point from territory holders (T) to school (S) in relation to the 433 attack rates (a) and the defense cost against floaters ( dFc ). The unit is the number of 434
individuals /unit area. 435
_____________________________________________________________________ 436 Defense cost Attack cost 437 against floaters 1.8 3 6.3 438 _____________________________________________________________________ 439 0.01 8.8 5.6 3.0 440 0.1 8.6 5.4 3.0 441 0.2 8.4 5.3 2.9 442 ______________________________________________________________________ 443 444
445
29
Table 3. The existence of territoriality against an increasing fish density. 446
_____________________________________________________________________ 447 Year River or Natural or Density State Reference 448 Pond experiment N [1/m2 rapids] of fish 449 _____________________________________________________________________ 450 1955 Ukawa Natural 5.5 School [1] 451 1956 Ukawa Natural 0.9 Territory [1] 452 1957 Ukawa Natural 0.3 Territory [1] 453 1958 Inukai Experiment 4.1 Territory [1] 454 1987 Pond Experiment 195.2 School [2] 455 1987 Pond Experiment 97.6 School [2] 456 1989 Pond Experiment 120.4 School [2] 457 1989 Pond Experiment 25.0 School [2] 458 1991 Experimental stream 1.0 Territory [3] 459 1991 Experimental stream 0.6 Territory [3] 460 1999 Pond Experiment 1250.0 School [4] 461 1999 Pond Experiment 400.0 School [4] 462 1999 Pond Experiment 100.0 School [4] 463 _____________________________________________________________________ 464 References [1] Kawanabe 1969, [2] Iguchi and Yamaguchi 1994, [3] Iguchi 1996, and 465 [4] Iguchi et al. 2003. 466
467
30
Table 4. The state of fish in an decreasing stage. 468
_____________________________________________________________________ 469 Year River or Natural or Density State Reference 470 pond experiment [1/m2rapids] offish 471 _____________________________________________________________________ 472 1958 Inukai Experiment 1.5 Territory [1] 473 1958 Inukai Experiment 0.5 Territory [1] 474 1987 Pond Experiment 195.2 School [2] 475 1987 Pond Experiment 97.6 School [2] 476 1989 Pond Experiment 120.4 School [2] 477 1989 Pond Experiment 25.0 School [2] 478 1991 Experimental stream 5.0 School(Th*) [3] 479 1991 Experimental stream 1.5 Territory [3] 480 1991 Experimental stream 1.0 Territory [3] 481 1991 Experimental stream 0.6 Territory [3] 482 1991 Experimental stream 0.3 Territory [3] 483 _____________________________________________________________________ 484 Th*: Attempted territory holders appear; their territories are small and unstable. 485 References [1] Kawanabe 1969, [2] Iguchi and Yamaguchi 1994, and [3] Iguchi 1996. 486
487
31
488
Figure Captions 489
Fig. 1. The territoriality in ayu. (a) Two fish check with each other at the boundary of 490
both territories. (b) A territory holder (behind) attacks against an intruder. 491
492
Fig. 2. The breakdown and formation models of territoriality. When the fish density 493
increases, phases (stages) change as a→b→c. Stage a: when the density is low, all fish 494
hold a territory. Stage b: when the density increases, some fish become a floater. Stage 495
c: when the density further increases, all the territories break down and fish swim in 496
schools. When the fish density decreases, the change c→a occurs: when the density 497
decreases to a low density, all the fish begin to form a territory almost simultaneously. 498
499
Fig. 3. The theoretical result with increasing of fish density. The fitnesses of a territory 500
holder ( TW , red), a floater ( FW , blue) and a school fish ( SW , green) are depicted against 501
the density ( N ). The maximum density (capacity) of territory is assumed maxTN =1, 502
and the transition (breakdown) point is given by 1N =5.486. The unit for fitness is 503
32
(gram diatom food)/[day(1m2 rapids+0.81m2 pools)]. The parameter settings are: a=3, c 504
= 0.1, rK =3.3, pK =0.1782 and r=0.4. 505
506
Fig. 4. The result in decreasing stage. The fitnesses of an attempted territory holder 507
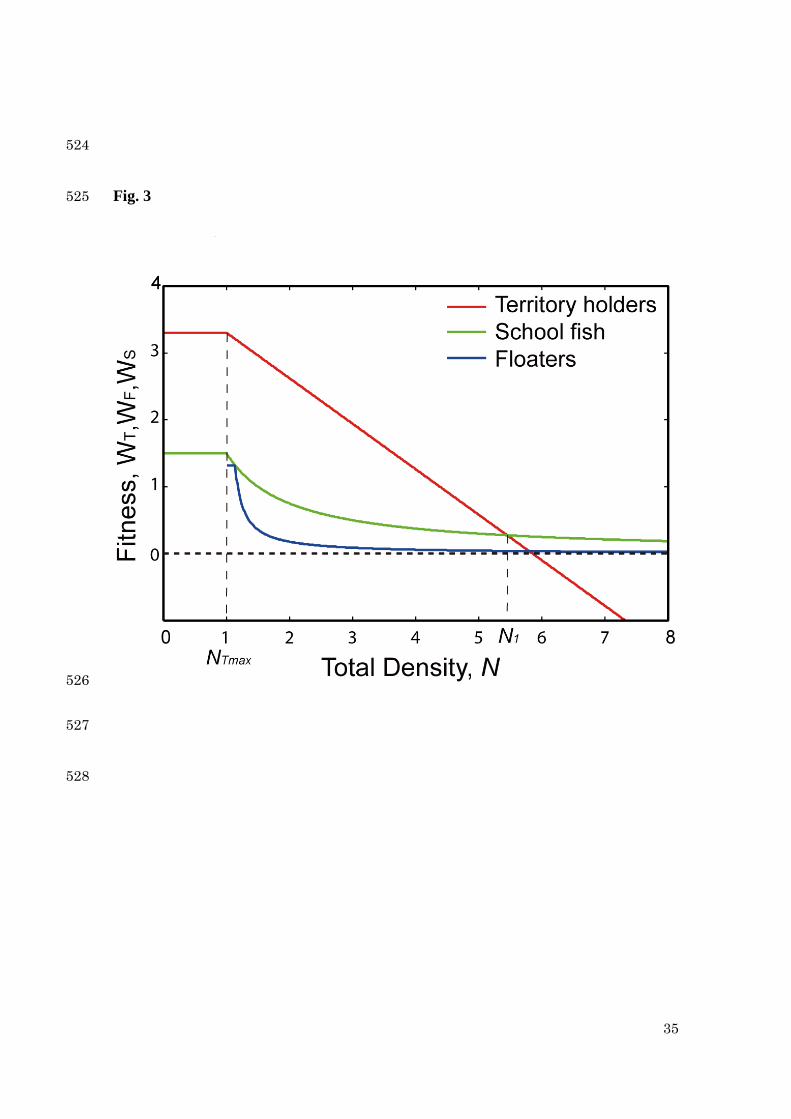
( *TW , solid purple line) and a school fish ( SW , solid green curve) are plotted against 508
the density ( N ). For the comparison, the fitness of a territory holder (WT, broken red 509
line) is shown. The transition (formation) point is represented by 2N which is much less 510
than the breakdown point ( 1N ). The parameter settings are the same as in Fig. 3. 511
512
33
513
514
Fig. 1 515
(a) (b) 516
517
518
34
519
520
Fig. 2 521
522
523
35
524
Fig. 3 525
526
527
528
36
529
530
Fig. 4 531
532
533
Related Documents


