Title Histological correlation of diffusional kurtosis and white matter modeling metrics in cuprizone-induced corpus callosum demyelination Author(s) Falangola, MF; Guilfoyle, DN; Tabesh, A; Hui, ESK; Nie, X; Jensen, JH; Gerum, SV; Hu, C; LaFrancois, J; Collins, HR; Helpern, JA Citation NMR in Biomedicine, 2014, v. 27 n. 8, p. 948-57 Issued Date 2014 URL http://hdl.handle.net/10722/199057 Rights NMR in Biomedicine. Copyright © John Wiley & Sons Ltd.; This is a preprint of an article published in NMR in Biomedicine, 2014, v. 27 n. 8, p. 948-57; This work is licensed under a Creative Commons Attribution-NonCommercial-NoDerivatives 4.0 International License.

Welcome message from author
This document is posted to help you gain knowledge. Please leave a comment to let me know what you think about it! Share it to your friends and learn new things together.
Transcript
TitleHistological correlation of diffusional kurtosis and white mattermodeling metrics in cuprizone-induced corpus callosumdemyelination
Author(s)Falangola, MF; Guilfoyle, DN; Tabesh, A; Hui, ESK; Nie, X;Jensen, JH; Gerum, SV; Hu, C; LaFrancois, J; Collins, HR;Helpern, JA
Citation NMR in Biomedicine, 2014, v. 27 n. 8, p. 948-57
Issued Date 2014
URL http://hdl.handle.net/10722/199057
Rights
NMR in Biomedicine. Copyright © John Wiley & Sons Ltd.; Thisis a preprint of an article published in NMR in Biomedicine, 2014,v. 27 n. 8, p. 948-57; This work is licensed under a CreativeCommons Attribution-NonCommercial-NoDerivatives 4.0International License.
Histological Correlation of Diffusional Kurtosis and White Matter Modeling Metrics
in the Cuprizone-Induced Corpus Callosum Demyelination Maria F. Falangola1,2,3,*, David N. Guilfoyle4, Ali Tabesh,1,2, Edward S. Hui1,2, Xingju Nie1,2,
Jens H. Jensen1,2, Scott V. Gerum4, Caixia Hu4 , John LaFrancois5, Heather R. Collins2,
Joseph A. Helpern1,2,3
1Department of Radiology and Radiological Science, Medical University of South Carolina,
Charleston, SC 29425; 2Center for Biomedical Imaging, Medical University of South
Carolina, Charleston, SC 29425; 3Department of Neurosciences, Medical University of
South Carolina, Charleston, SC 29425. 4Center for Advanced Brain Imaging, Nathan S.
Kline Institute, Orangeburg, NY 10962. 5Dementia Research, Nathan S. Kline Institute,
Orangeburg, NY 10962.
*Corresponding Author: Maria F. Falangola, M.D., Ph.D. Department of Radiology and Radiological Science Center for Biomedical Imaging, MSC 120 Medical University of South Carolina 68 President St, Bioengineering Building Rm 212 Charleston SC 29425-0120 Email: [email protected] Tel: 843.876.2466 Fax: 843.876.2469 Word count: 7833 Short title: DK and WMM in the Cuprizone-Induced Mouse Brain Demyelination Key words: DKI, cuprizone, corpus callosum, mouse, demyelination, MRI, diffusion Abbreviations: diffusion MRI (dMRI); diffusion tensor imaging (DTI); diffusion tensor (DT); diffusional kurtosis imaging (DKI); axial kurtosis (K//); radial kurtosis (K┴); white matter modeling (WMM); extra-axonal space (EAS); axonal water fraction (AWF); intrinsic diffusivity inside the axons(Da); axial diffusivity in the extra-axonal space (De||); radial diffusivity in the extra-axonal space (De┴); tortuosity (α); cuprizone treated group (CPZ); control group (NC); corpus callosum (rostral (aCC), middle (bCC), and caudal (pCC)); immunohistochemistry (IHC); Glial fibrillary acidic protein (GFAP); ionized calcium binding adapter molecule 1 (Iba1). Grant support: This work was supported by the NIH grants NIH 5R03EB009711-2 (MFF) and 1S10RR023534-01.
1
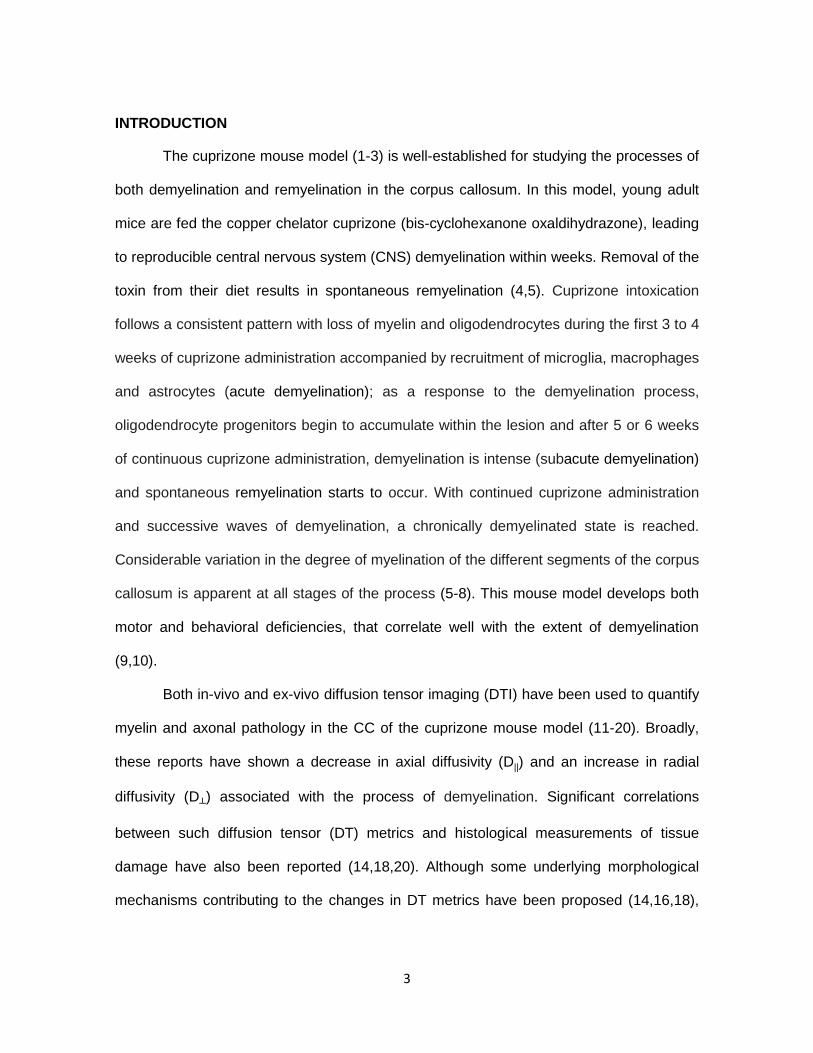
ABSTRACT: The cuprizone mouse model is well-established for studying the processes of both
demyelination and remyelination in the corpus callosum, and it has been utilized together
with diffusion tensor imaging (DTI) to investigate myelin and axonal pathology. Although
some underlying morphological mechanisms contributing to the changes in diffusion
tensor (DT) metrics have been identified, the understanding of specific associations
between histology and diffusion measures remains limited. Diffusional kurtosis imaging
(DKI) is an extension of DTI that provides metrics of diffusional non-Gaussianity, for which
an associated white matter modeling (WMM) method has been developed. The main goal
of the present study was to quantitatively assess the relationships between diffusion
measures and histological measures in the mouse model of cuprizone-induced corpus
callosum demyelination. The diffusional kurtosis (DK) and WMM metrics were found to
provide additional information that enhances the sensitivity to detect the morphological
heterogeneity in the chronic phase of the disease process in the rostral segment of the
corpus callosum. Specifically, in the rostral segment axonal water fraction (d = 2.6;
p<0.0001), radial kurtosis (d = 2.0; p=0.001) and mean kurtosis (d = 1.5; p=0.005) showed
the most sensitivity between groups with respect to yielding statistically significant p-
values and high Cohen's d values. These results demonstrate the ability of DK and WMM
metrics to detect white mater changes and inflammatory processes associated with
cuprizone-induced demyelination. They also validate, in part, the application of these new
WMM metrics for studying neurological diseases, as well as help to elucidate their
biophysical meaning.
2
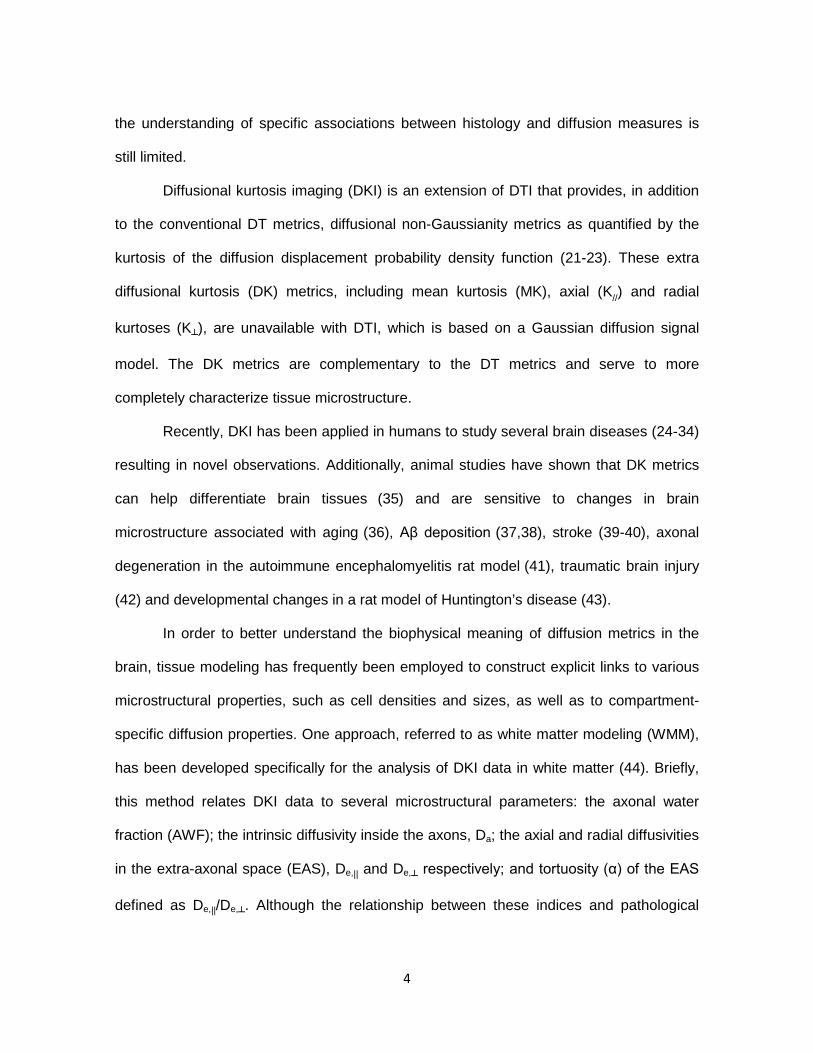
INTRODUCTION
The cuprizone mouse model (1-3) is well-established for studying the processes of
both demyelination and remyelination in the corpus callosum. In this model, young adult
mice are fed the copper chelator cuprizone (bis-cyclohexanone oxaldihydrazone), leading
to reproducible central nervous system (CNS) demyelination within weeks. Removal of the
toxin from their diet results in spontaneous remyelination (4,5). Cuprizone intoxication
follows a consistent pattern with loss of myelin and oligodendrocytes during the first 3 to 4
weeks of cuprizone administration accompanied by recruitment of microglia, macrophages
and astrocytes (acute demyelination); as a response to the demyelination process,
oligodendrocyte progenitors begin to accumulate within the lesion and after 5 or 6 weeks
of continuous cuprizone administration, demyelination is intense (subacute demyelination)
and spontaneous remyelination starts to occur. With continued cuprizone administration
and successive waves of demyelination, a chronically demyelinated state is reached.
Considerable variation in the degree of myelination of the different segments of the corpus
callosum is apparent at all stages of the process (5-8). This mouse model develops both
motor and behavioral deficiencies, that correlate well with the extent of demyelination
(9,10).
Both in-vivo and ex-vivo diffusion tensor imaging (DTI) have been used to quantify
myelin and axonal pathology in the CC of the cuprizone mouse model (11-20). Broadly,
these reports have shown a decrease in axial diffusivity (D||) and an increase in radial
diffusivity (D┴) associated with the process of demyelination. Significant correlations
between such diffusion tensor (DT) metrics and histological measurements of tissue
damage have also been reported (14,18,20). Although some underlying morphological
mechanisms contributing to the changes in DT metrics have been proposed (14,16,18),
3
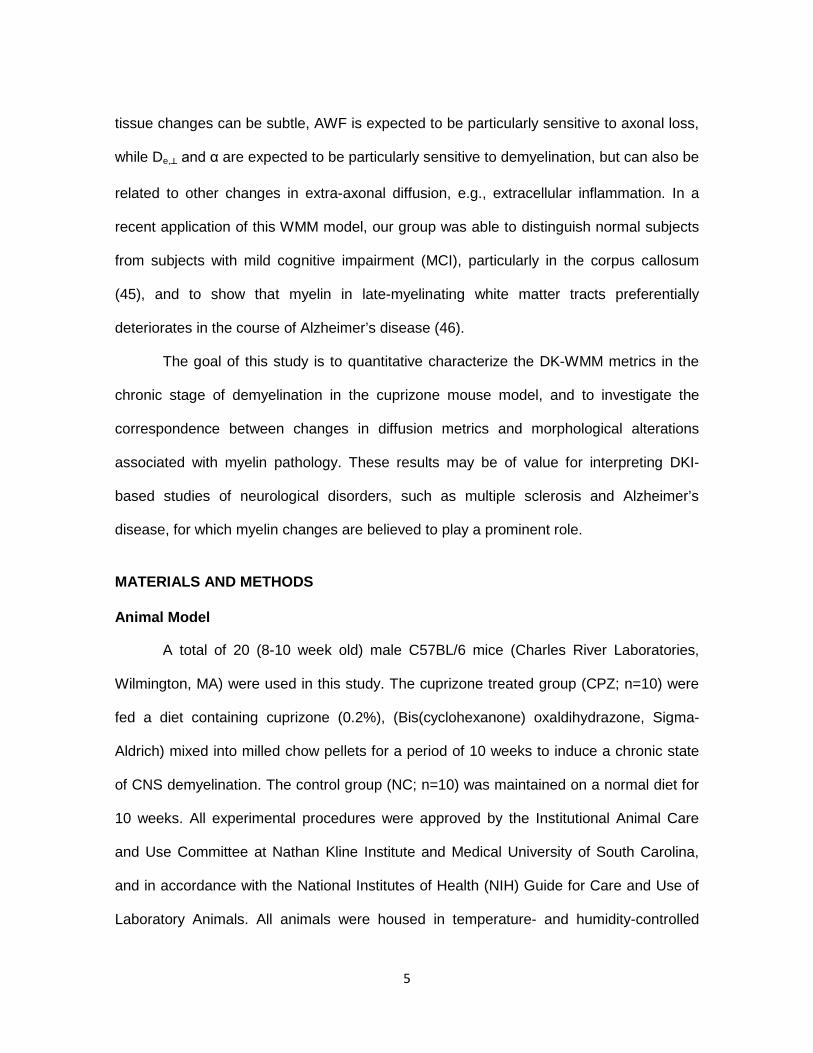
the understanding of specific associations between histology and diffusion measures is
still limited.
Diffusional kurtosis imaging (DKI) is an extension of DTI that provides, in addition
to the conventional DT metrics, diffusional non-Gaussianity metrics as quantified by the
kurtosis of the diffusion displacement probability density function (21-23). These extra
diffusional kurtosis (DK) metrics, including mean kurtosis (MK), axial (K//) and radial
kurtoses (K┴), are unavailable with DTI, which is based on a Gaussian diffusion signal
model. The DK metrics are complementary to the DT metrics and serve to more
completely characterize tissue microstructure.
Recently, DKI has been applied in humans to study several brain diseases (24-34)
resulting in novel observations. Additionally, animal studies have shown that DK metrics
can help differentiate brain tissues (35) and are sensitive to changes in brain
microstructure associated with aging (36), Aβ deposition (37,38), stroke (39-40), axonal
degeneration in the autoimmune encephalomyelitis rat model (41), traumatic brain injury
(42) and developmental changes in a rat model of Huntington’s disease (43).
In order to better understand the biophysical meaning of diffusion metrics in the
brain, tissue modeling has frequently been employed to construct explicit links to various
microstructural properties, such as cell densities and sizes, as well as to compartment-
specific diffusion properties. One approach, referred to as white matter modeling (WMM),
has been developed specifically for the analysis of DKI data in white matter (44). Briefly,
this method relates DKI data to several microstructural parameters: the axonal water
fraction (AWF); the intrinsic diffusivity inside the axons, Da; the axial and radial diffusivities
in the extra-axonal space (EAS), De,|| and De,┴ respectively; and tortuosity (α) of the EAS
defined as De,||/De,┴. Although the relationship between these indices and pathological
4
tissue changes can be subtle, AWF is expected to be particularly sensitive to axonal loss,
while De,┴ and α are expected to be particularly sensitive to demyelination, but can also be
related to other changes in extra-axonal diffusion, e.g., extracellular inflammation. In a
recent application of this WMM model, our group was able to distinguish normal subjects
from subjects with mild cognitive impairment (MCI), particularly in the corpus callosum
(45), and to show that myelin in late-myelinating white matter tracts preferentially
deteriorates in the course of Alzheimer’s disease (46).
The goal of this study is to quantitative characterize the DK-WMM metrics in the
chronic stage of demyelination in the cuprizone mouse model, and to investigate the
correspondence between changes in diffusion metrics and morphological alterations
associated with myelin pathology. These results may be of value for interpreting DKI-
based studies of neurological disorders, such as multiple sclerosis and Alzheimer’s
disease, for which myelin changes are believed to play a prominent role.
MATERIALS AND METHODS
Animal Model
A total of 20 (8-10 week old) male C57BL/6 mice (Charles River Laboratories,
Wilmington, MA) were used in this study. The cuprizone treated group (CPZ; n=10) were
fed a diet containing cuprizone (0.2%), (Bis(cyclohexanone) oxaldihydrazone, Sigma-
Aldrich) mixed into milled chow pellets for a period of 10 weeks to induce a chronic state
of CNS demyelination. The control group (NC; n=10) was maintained on a normal diet for
10 weeks. All experimental procedures were approved by the Institutional Animal Care
and Use Committee at Nathan Kline Institute and Medical University of South Carolina,
and in accordance with the National Institutes of Health (NIH) Guide for Care and Use of
Laboratory Animals. All animals were housed in temperature- and humidity-controlled
5
rooms on a 12-h light/dark cycle (lights on at 6:00 AM) in an accredited animal care
facility.
MRI Protocol
Mice were anesthetized using an isoflurane vaporizer set at the following
percentages: 3% for induction, 2% during pilot scanning, and 1.5% during data
acquisition. An animal monitoring unit (SA instruments, Inc., model 1025, Stony Brook,
NY) was used to record respiration and rectal temperature. Respiration was measured
with a pressure transducer placed under the abdomen just below the ribcage. Body
temperature was maintained using forced warm air, controlled by a feedback circuit
between the heater and thermistor. After induction, mice were placed on a holder and
restrained using a bite bar and ear bars placed half way into the auditory canal. Oxygen
was used as the carrier gas and delivered at a low flow rate (≤ 0.5 L/min.) to a cone
positioned before the bite bar, where gases mixed with air and passed over the rodent’s
nose. All animals were maintained at 37.0 ± 0.2 °C and respiration ranged between 50 to
70 breaths per minute with a median heart rate of 500 beats per minute during scanning.
All data were obtained on a 7.0 T Agilent (Santa Clara, CA) 40 cm bore system. The
gradient coil insert had an internal diameter of 12 cm with a maximum gradient strength of
600 mT/m and minimum rise time of 200 µs with customized second and third order shim
coils. A Rapid (Rimpar, Germany) volume transmit coil (72 mm ID) and a 2 channel
receive-only surface coil was used for RF transmission and reception, respectively. A
respiration-gated 4-shot SE-EPI sequence was used for DKI acquisition. The sequence
parameters were: TR/TE=3000/30ms, δ/Δ=5/17ms, slices=7, slice thickness = 1mm, data
matrix = 128 × 128, image resolution = 234 × 234 μm2, number of averages = 4, 30
6
gradient directions (47) and 5 b-values for each gradient direction (0.5, 1.0, 1.5, 2.0 and
2.5 ms/μm2).
DKI post-processing was performed using in-house software (48)
(http://nitrc.org/projects/dke). The software generates parametric maps by fitting the DKI
signal model (21,22) to the diffusion MRI (dMRI) signal measurements for each voxel
using a linearly constrained weighted linear least squares fitting algorithm (Tabesh et al.,
2011), resulting in parametric maps of the conventional DT metrics of mean diffusivity
(MD), D||, D┴, and fractional anisotropy (FA), as well as the additional kurtosis metrics of
MK, K||, and K┴. All of these metrics are estimated from the DT and DK tensors (22). The
MD corresponds to the diffusivity averaged over all possible diffusion directions, D||
corresponds to the diffusivity in the direction of the principal diffusion tensor eigenvector,
and D┴ corresponds to the diffusivity averaged over all diffusion directions perpendicular
to the principal diffusion tensor eigenvector. The additional metrics of MK, K|| and K┴, are
kurtosis analogs of MD, D|| and D┴ that quantify the diffusional non-Gaussianity (21). It is
worth noting that, due to the inclusion of non-Gaussian effects, the DKI-derived estimates
of diffusivities will generally be more accurate than those obtained with DTI (49). In
addition, parametric maps were estimated for WMM metrics of: AWF, Da, De,||, De,┴ and α
as described previously (44).
Brain regions of interest (ROIs) at the level of corpus callosum (rostral (aCC),
middle (bCC), and caudal (pCC)) were manually drawn on the FA map using ImageJ
software (version 1.42q; http://rsb.info.nih.gov/ij/) (50) (Fig.1). To meet the WMM
assumption (44) of fiber bundles that are highly oriented in a uniform parallel pattern, we
limited the ROIs to the center of the CC at each level. We sampled two MRI slices for aCC
and bCC and one MRI slice at the level of pCC. All ROIs contained at least 9 voxels. The
7
average regional value for each metric was obtained from the voxels within each ROI. To
minimize the effect of cerebrospinal fluid (CSF) contamination, all voxels with MD>1.5
μm2/ms were excluded from the ROIs prior to parameter quantification.
Histological Protocol
Following the MRI scan, while still under anesthesia, mice were perfused with ice-
cold phosphate buffered saline (PBS) followed by paraformaldehyde (4%) in PBS. Mice
brains were then removed and post-fixed overnight in the same fixative, and then
transferred to a storage buffer (Na Cacodylate). All mice brain samples were processed
by NeuroScience Associates (Knoxville, TN) using MultiBrain® Technology, where 25
mouse brains are embedded together per block, and freeze-sectioned at 30 μm in the
coronal plane through the CC area of the mouse brain (~3 mm in length). Sections were
stained free-floating at room temperature for: A) Solochrome to reveal myelin (51); B)
Amino cupric silver to reveal axonal degeneration (52); C) Glial fibrillary acidic protein
(GFAP) to reveal astrocyte activity (53), and D) ionized calcium binding adapter molecule
1 (Iba1) to reveal microglia (54). It is important to note that all immunohistochemistry
(IHC), for each antibody, was performed at the same time for all sections used in the
quantitative analysis.
All slices were then digitized using a National Optical model DC5-163 SD Series
digital microscope with a built-in 2.0 mega pixel camera and version 2.0 of Motic® Images
Plus software. All slices for each histological marker were imaged in one session to avoid
possible image intensity variation. Images (4x magnification) were acquired and split into
multicolor channels. The blue channel was chosen for the solochrome stain images and
the red channel for the amino cupric silver and GFAP and Iba1 IHC images. The channels
were then converted and saved as 8-bit grayscale (1600 x 1200 pixels) images.
8
Approximately 18 consecutive 30 μm corpus callosum histological digital images were
analyzed for each mouse using ImageJ. The immuno-stain intensity for each of the
digitized images was then quantified. Histological ROIs at the level of corpus callosum
were manually drawn, centered at bregma 1.10 for rostral (aCC), -1.46 for middle (bCC)
and -2.54 for caudal (pCC) segments (Figure 1) (55). For each immuno-stain, the mean
intensity values from all pixels in each ROI were averaged. In this analysis, we used the
mean intensity value to represent the degree of histological staining.
Statistical Analysis:
One-way ANOVA, corrected for multiple comparisons using the Sidak method,
was performed to compare the means of the two groups for all the metrics. All error bars
correspond to the standard error of the mean (SEM).
Spearman’s rank correlation was used to examine the association between
diffusion metrics and immunohistochemistry metrics. The correlation analysis was
performed for the entire CC, including all three segments for each group (control and
cuprizone) separately (intra-group correlations), based on z-scores from values obtained
at each CC segment. The z-score for each mouse and each metric was calculated as the
departure from the mean of the control group for each segment of the CC, divided by the
standard deviation of the control group (z-score = (metric – NC mean)/NC stdev).
To investigate which morphological, diffusion and WMM metrics would yield the
strongest differentiation between the NC and CPZ an effect size (Cohen's d) was
calculated for each metric at each CC level. All analyses were performed using SPSS
version 20.0 (IBM SPSS Statistics for Windows, Version 20.0. Armonk, NY: IBM Corp).
All reported p values were considered statistically significant at p ≤ 0.05.
9
RESULTS:
Morphological and Diffusion MRI Assessment for the Control Group
Here we present an overview of the control group, based on a two-tailed t-test for
two samples of equal variance, uncorrected; the mean values for all morphological and
diffusion metrics are presented in Tables 1-4.
In agreement with the morphological heterogeneity previously described between
the segments of the CC [56-61], our histological results for the control group
demonstrated a lesser degree of myelination in the aCC compared with bCC and pCC.
Interestingly, our results also showed more microglia cells in the aCC and bCC when
compared with pCC, but no differences in the number of astrocytes. Finally, the amino
cupric silver stain revealed some degree of axonal damage in the aCC, when compared
with bCC and pCC.
The diffusion MRI results for the control group associated well with the
morphological aspects in each CC segment. Briefly, FA had a caudal-rostral pattern,
where higher FA was present in the pCC, accompanied by higher D||, De,|| and α values,
and with lower D┴ and De,┴ values compared with aCC and bCC. This is probably due to
the high density/packing of highly myelinated axons at this level. FA was also higher in
the bCC when compared with aCC, with lower D┴, K┴, De,┴, perhaps due to the presence
of highly myelinated axons and a broader distribution in axonal caliber and more extra-
cellular space than aCC. No MD, MK, AWF or Da differences were detected between the
three CC segments in the control group.
Morphological and Diffusion MRI Assessment between Groups
Histological Assessment
10
As expected, after 10 weeks of cuprizone treatment, which is considered a chronic
phase, the Solochrome stain revealed intense, complete demyelination in the CC of the
CPZ mice, as indicated by higher pixel intensity values relative to NC mice. The aCC was
characterized by being the least affected segment and the one with the greatest
morphological heterogeneity. Group differences were statistically significant in all three
regions of the CC. The demyelination process was accompanied by mild
neurodegeneration and intense inflammation represented by the statistically significant
increase in the amino cupric silver stain and in the immunoreactivity for Iba1
(macrophage/microglia) and GFAP (astrocyte activity) markers in the CPZ group. For the
entire CC, and in each of the three regions of the CC, the inflammatory markers GFAP
and Iba1 were the best differentiators between the two groups. Specifically, GFAP (d =
15.19; p<0.0001) in the bCC and Iba1 (d = 10.23; p<0.0001) in the aCC were the best
differentiators between the two groups. All histological measures for each segment of the
corpus callosum are presented in Table 1.
Diffusion MRI Assessment
For the DT metrics (FA, MD and D┴), results consistent with previous reports
throughout the entire CC of the CPZ mice were observed (i.e. reduced FA and increased
MD and D┴ in comparison to NC mice, except for the FA in the aCC). D|| was significantly
increased in the aCC and bCC, but did not change in the pCC. All DT metrics for each
segment of the corpus callosum are presented in Table 2.
All kurtosis metrics in the CPZ mice showed significant decreases, except for K||
which did not change in the aCC. All DK metrics for each segment of the corpus callosum
are presented in Table 3.
11
For the WMM metrics, CPZ mice had a significant AWF decrease in the entire CC,
more intensely in the bCC and pCC. Significant Da increase was only seen in the bCC,
with no significant change in the aCC or pCC. For the extra axonal metrics, De,|| showed a
slight increase in the bCC and a decrease in pCC, with no change in the aCC; De,┴
increased in both bCC and pCC, with no change in the aCC. A significant decrease in
tortuosity was seen in the bCC, and more intensely in the pCC, with no change in the
aCC. All WMM metrics for each segment of the corpus callosum are presented in Table 4.
In the aCC, AWF (d = 2.6; p<0.0001), K┴ (d = 2.0; p=0.001) and MK (d = 1.5;
p=0.005) showed the most sensitivity between groups with respect to yielding statistically
significant p-values and high Cohen's d values. In the bCC, where demyelination was
especially pronounced, D┴ (d = 4.1; p<0.0001), MD (d = 3.8; p<0.0001), AWF (d = 3.6;
p<0.0001) and K┴, (d = 3.1; p<0.0001) yielded the best differentiation. In the pCC, D┴ (d =
3.4; p<0.0001), FA (d = 2.4; p<0.0001) and AWF (d = 2.3; p=0.0001) best differentiated
the two groups.
Correlation between Diffusion and Histological Metrics
A series of Spearman rank-order correlations were conducted in order to
determine if any relationships existed between the diffusion metrics and the morphological
metrics for the entire CC. This correlation analysis was performed for the entire CC for
each group (control and cuprizone) separately (intra-group correlations). No significant
correlations were detected in the control group, except for a negative correlation between
FA and Iba1 (r(28) = -0.449; p=0.01) and a positive correlation between MK and Iba1 (r
(28) = 0.393; p= 0.03).
There was a statistically significant relationship between diffusion and
morphological metrics for the CPZ group. Solochrome, a myelin marker, correlated with all
12
diffusion metrics, except De,|| and α. The strongest correlation was found between
Solochrome and MD (r(28) = 0.837; p<0.0001), followed by FA (r(28) = -0.637; p=0.0001),
D┴ (r(28) = -0.672; p<0.0001), and De,┴ (r(28) = 0.623; p=0.0002). The inflammatory
marker for microglia, Iba1, also correlated with several diffusion metrics, but the GFAP
marker for astrocyte reactivity correlated only with D|| (r(28) = -0.441; p=0.01). No
correlation was observed for the marker of neurodegeneration (amino cupric silver) with
any diffusion metric (Table 5).
DISCUSSION:
This study is the first to use DK and associated WMM metrics to investigate the
non-Gaussian diffusion patterns of chronic demyelination observed in the cuprizone
mouse model. We demonstrated the ability of DK and WMM metrics to detect the CC
white mater changes and inflammatory response associated with cuprizone-induced
demyelination. Our results also replicate previous studies utilizing DTI (11-20).
The morphological assessment revealed demyelination with a rostro-caudal
gradient (i.e., more intense in the body and posterior segment of the corpus callosum),
accompanied by a mild degree of axonal damage and intense inflammatory response.
These results are consistent with several previous studies (4-8) that reported activation of
microglia and astrocytosis, predominantly in the caudal CC, associated with the
breakdown of the myelin. Differently from the normal morphological aspect that shows
less myelinated axons in the aCC compared with bCC and pCC (56), in the chronic stage
of demyelination the rostral segment of the CC is less affected in the process (14,16) and
maintain more myelinated axons compared with both bCC and pCC (Table 1).
DT, DK and WMM metrics estimated well the extent of the demyelination process
in the bCC and pCC, but DT metrics underestimated the disease process at the aCC
13
level. In the aCC, FA was not able to distinguish the two groups, and the diffusivity metrics
showed marginal statistical significance, probably due to the greatest morphological
heterogeneity being present at this level. Indeed, it is well-described (14,16) that the
anterior part of the CC is less damaged during the cuprizone toxicity-induced
demyelination process, presenting with a heterogeneous pattern of demyelination, as our
morphological results also demonstrated (Figure 3). Similar to DT metrics, changes in the
DK and WMM metrics were more evident in the bCC and pCC, with statistical significance
differentiating the two animal groups. However, DK and WMM metrics were also able to
capture the heterogeneity of the process in the aCC, and despite the variability in the
degree of myelin loss at this level, we observed significant decrease in MK, K┴ and AWF,
likely reflecting myelin breakdown and decrease in axonal packing which, albeit less, is
still morphologically evident at this level.
Based on the morphological changes represented by myelin breakdown and loss,
one would expect fewer diffusion barriers and less structural complexity in the CC
microenvironment, thereby causing a decrease in the diffusion metrics. Indeed,
associated with an increase in the diffusivities (MD, D|| and D┴) we observed decreases in
MK, K||, K┴ and AWF.
However, since the aCC, bCC and pCC differ in the degree of myelination, axonal
density, distribution and alignment, which lead to differences in extra cellular space, not all
the dMRI changes are straightforward to interpret. Additionally, the morphological
changes due to the toxic process is complex, not only with demyelination and presence of
myelin debris, but with damaged axons, decrease in axonal diameter and changes in
cellularity (apoptotic oligodendrocytes, reactive microglia and astrocytes) (5-8).
Therefore, the individual components of this process and the combination of
14
morphological components have different effects on the behavior of water diffusion as
reflected in the dMRI metrics. This is evident in the WMM metrics for example, where Da
increased in bCC, but did not significantly change in the aCC and pCC. We can speculate
that because bCC has a broader distribution containing axons with large and mid-size
(mixed) caliber, the decrease in axonal diameter that occurs during the toxic process in
this chronic stage (62) narrows the axonal distribution, leading to a better alignment of the
axons, and subsequently increase in Da. Additionally, reactive astrocytes known for high
diffusion rates, and intimately associated with small damaged axons, may also contribute
to the increase in Da. In this segment, the demyelination process leads to an increase in
De,┴ and De,||, but a decrease in tortuosity due to the stronger effect of the De,┴ increase
(Table 4).
On the other hand, in the pCC, which has a high density of small packed axons,
the dMRI patterns behaved slightly differently. As a result of the demyelination process
De,┴ increased; however, at this level, the uneven demyelination probably creates
imperfections in the original dense fiber alignment resulting in less tension of the fibers
and changing the geometry of the extracellular space, which may be the reason we see
decrease in De,||. In this segment, the effect size of the De,┴ increase is higher than the
decrease in De,||, explaining the decrease in tortuosity.
One interesting observation that may appear to be contradictory to previous results
(12-14,19,63) is the increase in D|| in the aCC and bCC. However, previous studies
showed a decrease in D|| in the acute phase of the demyelinating process, not in the
chronic phase. Indeed, both in vivo and ex vivo previous studies reported no significant
difference or slightly increased D|| after 6 weeks of toxin exposure (11,12,16,20). Another
possible explanation for this difference is that DKI-derived estimates of diffusivities are
15
assumed to provide more accurate estimates of diffusion metrics (49), and kurtosis
metrics are less sensitive to CSF partial volume (64).
The strong correlation between dMRI metrics and Solocrome, particularly MD, FA, D┴ and
De,┴ confirms that these metrics are sensitive to myelin abnormalities. The inflammatory
marker for microglia, Iba1, also correlated with several diffusion metrics, particularly with
D┴, which is in agreement with the fact that microglia infiltration is correlated with intense
myelin breakdown (4-8). The lack of correlation between the amino cupric silver and the
diffusion metrics is an unexpected observation and needs to be investigated in a future
study. Similarly, the presence of a correlation between Iba1 with FA (negative) and MK
(positive) in the CC of normal mice is also interesting, but at this time the reason is still
unknown and needs to be further investigated. Likewise, the presence of a correlation
between Iba1 with FA (negative) and MK (positive) in the CC of normal mice is interesting,
but at this time the reason is still unknown and needs to be further investigated.
Confirming the WMM assumptions for regions such as the CC, which is formed
predominantly with WM fiber bundles aligned in a consistent parallel orientation (57,65),
the DKI-WMM metrics provided unique information regarding the underlying
morphological alterations associated with the demyelination process, particularly in the
rostral segment of the CC, where DKI-WMM metrics such MK, K┴ and AWF were more
sensitive to the heterogeneity of the toxic process.
One limitation of this study is the fact that we did not investigate the temporal
process of demyelination and/or the recovery phase. We acknowledge the importance of
investigating water diffusion at those stages of the pathological process, but since we
were investigating new diffusion metrics we decided to focus only on the phase where the
demyelination is intense and complete. Therefore, these results should be carefully
16
interpreted since they represent only the chronic phase and would probably be different in
the acute and/or recovery stage. Additionally, technical limitations for both dMRI and
histology techniques, with different spatial resolutions, should be considered when
interpreting the results. Finally, partial volume effects due to the larger voxel size,
particularly in the body of the CC, may have had an effect in the results; however it is
known that DKI metrics are less sensitive to partial volume effects (64), and masking for
CSF using MD > 1.5um2/ms, reduced the possibility of the results being determined by
CSF contamination.
In conclusion, we have demonstrated that kurtosis and WMM metrics can be used
as markers of the morphological changes associated with chronic demyelination in the
cuprizone model. We have found that DK and WMM metrics provide complementary
information enhancing the sensitivity to the morphological heterogeneity of the disease
processes seen in the rostral segment of the corpus callosum. However, further studies
are needed to delineate the underlying mechanisms associated with the temporal
changes in the dMRI parameters, particularly with the WMM metrics. In part, these results
also help validate these new WMM metrics, which should assist in the interpretation of
results from future DKI studies using these metrics to investigate WM abnormalities in
neurological diseases.
17

Acknowledgements
We thank Dr. Hiroko Hama, from Medical University of South Carolina, for her assistance
with laboratory space and with the experimental cuprizone treatment.
18
REFERENCES
1. Matsushima GK, Morell P. The neurotoxicant, cuprizone, as a model to study demyelination and remyelination in the central nervous system. Brain Pathol. 2001; 11(1):107-16.
2. Torkildsen O, Brunborg LA, Myhr KM, Bø L. The cuprizone model for
demyelination. Acta Neurol Scand. 2008; 188:72-6.
3. Kipp M, Clarner T, Dang J, Copray S, Beyer C. The cuprizone animal model: new insights into an old story. Acta Neuropathol. 2009; 118(6):723-36.
4. Stidworthy MF, Genoud S, Suter U, Mantei N, Franklin RJ. Quantifying the early stages of remyelination following cuprizone-induced demyelination. Brain Pathol. 2003;13(3):329-39.
5. Skripuletz T, Gudi V, Hackstette D, Stangel M. De- and remyelination in the CNS white and grey matter induced by cuprizone: the old, the new, and the unexpected. Histol Histopathol. 2011 Dec;26(12):1585-97. Review.
6. Hiremath MM, Saito Y, Knapp GW, Ting JP, Suzuki K, Matsushima GK.
Microglial/macrophage accumulation during cuprizone-induced demyelination in C57BL/6 mice. J Neuroimmunol. 1998;92(1-2):38-49.
7. Remington LT, Babcock AA, Zehntner SP, Owens T. Microglial recruitment, activation, and proliferation in response to primary demyelination. Am J Pathol. 2007;170(5):1713-24.
8. Hibbits N, Yoshino J, Le TQ, Armstrong RC. Astrogliosis during acute and chronic cuprizone demyelination and implications for remyelination. ASN Neuro. 2012; 4(6):393-408.
9. Franco-Pons N, Torrente M, Colomina MT, Vilella E. Behavioral deficits in the cuprizone-induced murine model of demyelination/remyelination. Toxicol Lett. 2007;169(3):205-13.
10. Hibbits N, Pannu R, Wu TJ, Armstrong RC. Cuprizone demyelination of the corpus callosum in mice correlates with altered social interaction and impaired bilateral sensorimotor coordination. ASN Neuro. 2009;1(3).
11. Song SK, Yoshino J, Le TQ, Lin SJ, Sun SW, Cross AH, Armstrong RC. Demyelination increases radial diffusivity in corpus callosum of mouse brain. Neuroimage. 2005; 26(1):132-40.
12. Sun SW, Liang HF, Trinkaus K, Cross AH, Armstrong RC, Song SK. Noninvasive detection of cuprizone induced axonal damage and demyelination in the mouse corpus callosum. Magn Reson Med. 2006; 55(2):302-8.
19
13. Harsan LA, Poulet P, Guignard B, Steibel J, Parizel N, de Sousa PL, Boehm N, Grucker D, Ghandour MS. Brain dysmyelination and recovery assessment by noninvasive in vivo diffusion tensor magnetic resonance imaging. J Neurosci Res. 2006; 83(3):392-402.
14. Wu QZ, Yang Q, Cate HS, Kemper D, Binder M, Wang HX, Fang K, Quick MJ, Marriott M, Kilpatrick TJ, Egan GF. MRI identification of the rostral-caudal pattern of pathology within the corpus callosum in the cuprizone mouse model. J Magn Reson Imaging. 2008; 27(3):446-53.
15. Yang HJ, Wang H, Zhang Y, Xiao L, Clough RW, Browning R, Li XM, Xu H. Region specific susceptibilities to cuprizone-induced lesions in the mouse forebrain: Implications for the pathophysiology of schizophrenia. Brain Res. 2009; 1270:121-30.
16. Xie M, Tobin JE, Budde MD, Chen CI, Trinkaus K, Cross AH, McDaniel DP, Song SK, Armstrong RC. Rostrocaudal analysis of corpus callosum demyelination and axon damage across disease stages refines diffusion tensor imaging correlations with pathological features. J Neuropathol Exp Neurol. 2010; 69(7):704-16.
17. Boretius S, Escher A, Dallenga T, Wrzos C, Tammer R, Brück W, Nessler S, Frahm J, Stadelmann C. Assessment of lesion pathology in a new animal model of MS by multiparametric MRI and DTI. Neuroimage. 2012; 59(3):2678-88
18. Chandran P, Upadhyay J, Markosyan S, Lisowski A, Buck W, Chin CL, Fox G, Luo F, Day M. Magnetic resonance imaging and histological evidence for the blockade of cuprizone-induced demyelination in C57BL/6 mice. Neuroscience. 2012; 202:446-53.
19. Zhang J, Jones MV, McMahon MT, Mori S, Calabresi PA. In vivo and ex vivo diffusion tensor imaging of cuprizone-induced demyelination in the mouse corpus callosum. Magn Reson Med. 2012; 67(3):750-9.
20. Thiessen JD, Zhang Y, Zhang H, Wang L, Buist R, Del Bigio MR, Kong J, Li XM, Martin M. Quantitative MRI and ultrastructural examination of the cuprizone mouse model of demyelination. NMR Biomed. 2013;26(11):1562-81.
21. Jensen JH, Helpern JA, Ramani A, Lu H, Kaczynski K. Diffusional Kurtosis
Imaging: The Quantification of Non-Gaussian Water Diffusion by Means of MRI. Magn. Reson. Med. 2005; 53:1432-1440.
22. Lu H, Jensen JH, Ramani A, Helpern JA. Three-dimensional characterization of non-gaussian water diffusion in humans using diffusion kurtosis imaging. NMR Biomed. 2006; 19(2):236-247.
23. Jensen JH, Helpern JA. MRI quantification of non-Gaussian water diffusion by kurtosis analysis. NMR Biomed. 2010; 23(7):698-710.
20
24. Falangola MF, Jensen JH, Babb JS, Hu C, Castellanos FX, Di Martino A, et al.
Age-related non-Gaussian diffusion patterns in the prefrontal brain. J MagnReson Imaging 2008; 28(6):1345-50.
25. Jensen JH, Falangola MF, Hu C, Tabesh A, Rapalino O, Lo C, et al. Preliminary observations of increased diffusional kurtosis in human brain following recent cerebral infarction. NMR Biomed. 2011; 24(5):452-7.
26. Fung SH, Roccatagliata L, Gonzalez RG, Schaefer PW. MR diffusion imaging in ischemic stroke. Neuroimaging Clin N Am. 2011; 21(2):345-77.
27. Hui ES, Fieremans E, Jensen JH, Tabesh A, Feng W, Bonilha L, Spampinato MV, Adams R, Helpern JA. Stroke assessment with diffusional kurtosis imaging. Stroke. 2012; 43(11):2968-73.
28. Raab P, Hattingen E, Franz K, Zanella FE, Lanfermann H. Cerebral gliomas: diffusional kurtosis imaging analysis of microstructural differences. Radiology. 2010; 254(3):876-81.
29. Van Cauter S, Veraart J, Sijbers J, Peeters RR, Himmelreich U, De Keyzer F, Van Gool SW, Van Calenbergh F, De Vleeschouwer S, Van Hecke W, Sunaert S. Gliomas: Diffusion Kurtosis MR Imaging in Grading. Radiology. 2012; 263(2):492-501.
30. Helpern JA, Adisetiyo V, Falangola MF, Hu C, Di Martino A, Williams K, et al. Preliminary evidence of altered gray and white matter microstructural development in the frontal lobe of adolescents with attention-deficit hyperactivity disorder: a diffusional kurtosis imaging study. J Magn Reson Imaging. 2011; 33(1):17-23.
31. Grossman EJ, Ge Y, Jensen JH, Babb JS, Miles L, Reaume J, et al. Thalamus and Cognitive Impairment in Mild Traumatic Brain Injury: A Diffusional Kurtosis Imaging Study. Journal of Neurotrauma. 2011; 29(13):2318-27.
32. Gao Y, Zhang Y, Wong CS, Wu PM, Zhang Z, Gao J, Qiu D, Huang B. Diffusion abnormalities in temporal lobes of children with temporal lobe epilepsy: a preliminary diffusional kurtosis imaging study and comparison with diffusion tensor imaging. NMR Biomed. 2012; 25(12):1369-77.
33. Falangola MF, Jensen JH, Tabesh A, Hu C, Deardorff RL, Babb JS, Ferris S, Helpern JA. Non-Gaussian diffusion MRI assessment of brain microstructure in mild cognitive impairment and Alzheimer's disease. Magn Reson Imaging. 2013; 31(6):840-6.
34. Coutu JP, Chen JJ, Rosas HD, Salat DH. Non-Gaussian water diffusion in aging white matter. Neurobiol Aging. pii: S0197-4580(13)00619-2. doi:10.1016 / j.neurobiolaging. 2013. [Epub ahead of print] PubMed PMID: 24378085.
21
35. Cheung MM, Hui ES, Chan KC, Helpern JA, Qi L, Wu EX. Does diffusion kurtosis
imaging lead to better neural tissue characterization? A rodent brain maturation study. Neuroimage. 2009; 45(2):386-92. PMID: 19150655.
36. Falangola MF, Guilfoyle D, Hui ES, Hu C, Gerum S, LaFrancois J, Nie X, Jensen JH, Tabesh A, Helpern JA. Diffusional Kurtosis Imaging Detects Age-related Grey matter Changes in the Normal Mouse Brain. Proc Intl Soc Mag Reson Med. 2012; 20:1241.
37. Falangola MF, Branch C, Jensen JH, Hu C, Xuan L, Duff K, Nixon R, Helpern JA. Assessment of Brain Microstructure in a Transgenic Mouse Model of AB-Amyloid Deposition. Proc Intl Soc Mag Reson Med. 2007; 15:310.
38. Vanhoutte G, Pereson S, Delgado Y Palacios R, Guns PJ, Asselbergh B, Veraart
J, Sijbers J, Verhoye M, Van Broeckhoven C, Van der Linden A. Diffusion kurtosis imaging to detect amyloidosis in an APP/PS1 mouse model for Alzheimer's disease. Magn Reson Med. 2013;69(4):1115-21.
39. Hui ES, Du F, Huang S, Shen Q, Duong TQ. Spatiotemporal dynamics of diffusional kurtosis, mean diffusivity and perfusion changes in experimental stroke. Brain Res. 2012; 1451:100-9.
40. F. Grinberg, et al., Diffusion Kurtosis Imaging and Lognormal Distribution Function Imaging Enhance Visualization of Lesions in Animal Stroke Models; NMR Biomed. 2012; 25(11):1295-304.
41. Cheung MM, Hui ES, Wu EX. Comparison of directional diffusion kurtoses and diffusivities in EAE-induced spinal cord. Proc Intl Soc Mag Reson Med. 2008; 16:3328.
42. Zhuo J, Xu S, Proctor JL, Mullins RJ, Simon JZ, Fiskum G, Gullapalli RP. Diffusion kurtosis as an in vivo imaging marker for reactive astrogliosis in traumatic brain injury. Neuroimage. 2012;59(1):467-77.
43. Blockx I, De Groof G, Verhoye M, Van Audekerke J, Raber K, Poot D, Sijbers J, Osmand AP, Von Hörsten S, Van der Linden A. Microstructural changes observed with DKI in a transgenic Huntington rat model: evidence for abnormal neurodevelopment. Neuroimage. 2012;59(2):957-967.
44. Fieremans E, Jensen JH, Helpern JA. White matter characterization with
diffusional kurtosis imaging. Neuroimage. 2011; 58(1):177–188.
45. Fieremans E, Benitez A, Jensen JH, Falangola MF, Tabesh A, Deardorff RL, Spampinato MV, Babb JS, Novikov DS, Ferris SH, Helpern JA. Novel white matter tract integrity metrics sensitive to Alzheimer disease progression. AJNR Am J Neuroradiol. 2013 [Epub ahead of print] PubMed PMID: 23764722.
22
46. Benitez A, Fieremans E, Jensen JH, Falangola MF, Tabesh A, Ferris SH, Helpern JA. (2013) White matter tract integrity metrics reflect the vulnerability of late-myelinating tracts in Alzheimer's disease. Neuroimage Clin; 4:64-71. doi: 10.1016/j.nicl.2013.11.001.
47. Jones DK, Horsfield MA, Simmons A. Optimal strategies for measuring diffusion in anisotropic systems by magnetic resonance imaging. Magn Reson Med 1999; 42:515–525.
48. Tabesh A, Jensen JH, Ardekani BA, Helpern JA. Estimation of tensors and tensor-derived measures in diffusional kurtosis imaging.Magn Reson Med. 2011; 65(3):823-36.
49. Veraart J, Poot DHJ, Van Hecke W, et al. More accurate estimation of diffusion tensor parameters using diffusion Kurtosis imaging. Magn Reson Med. 2011;65(1):138–145
50. Rasband, W.S., ImageJ, U. S. National Institutes of Health, Bethesda, Maryland, USA, http://imagej.nih.gov/ij/, 1997-2012.
51. Page KM. A stain for myelin using solochrome cyanin. J Med Lab Technol. 1965; 22(4):224-5.
52. Switzer RC 3rd. Application of silver degeneration stains for neurotoxicity testing. Toxicol Pathol. 2000; 28(1):70-83.
53. Jacque CM, Vinner C, Kujas M, Raoul M, Racadot J, Baumann NA (January 1978). "Determination of glial fibrillary acidic protein (GFAP) in human brain tumors". J. Neurol. Sci. 1978; 35 (1): 147–55.
54. Gómez-Nicola D, Fransen NL, Suzzi S, Perry VH. Regulation of microglial proliferation during chronic neurodegeneration. J Neurosci. 2013; 33(6):2481-93.
55. Paxinos G, Franklin K. The Mouse Brain in Stereotaxic Coordinates: Compact (Academic,San Diego), 2003; 2nd Ed.
56. Sargon MF, Mas N, Senan S, Ozdemir B, Celik HH, Cumhur M. Quantitative analysis of myelinated axons of commissural fibers in the rat brain. Anat Histol Embryol. 2003; 32(3):141-4.
57. Innocenti, Giorgio M.: General Organization of Callosal Connections in the Cerebral Cortex. Cerebral Cortex, 1986, Vol. 5, Jones, E. G., and A. Peters, eds. New York: Plenum, pp. 291–353.
58. Schmidt T, Awad H, Slowik A, Beyer C, Kipp M, Clarner T. Regional heterogeneity
of cuprizone-induced demyelination: topographical aspects of the midline of the corpus callosum. J Mol Neurosci. 201349(1):80-8.
23
59. Barazany D, Basser PJ, Assaf Y. In vivo measurement of axon diameter distribution in the corpus callosum of rat brain. Brain. 2009; 132(Pt 5):1210-20.
60. Reyes-Haro D, Mora-Loyola E, Soria-Ortiz B, García-Colunga J. Regional density
of glial cells in the rat corpus callosum. Biol Res. 2013; 46(1):27-32.
61. Olivares R, Michalland S, Aboitiz F. Cross-species and intraspecies morphometric analysis of the corpus callosum. Brain Behav Evol. 2000; 55(1):37-43.
62. Mason JL, Langaman C, Morell P, Suzuki K, Matsushima GK. Episodic
demyelination and subsequent remyelination within the murine central nervous system: changes in axonal calibre. Neuropathol Appl Neurobiol. 2001; 27(1):50-8.
63. Wang Y, Wang Q, Haldar JP, Yeh FC, Xie M, Sun P, Tu TW, Trinkaus K, Klein
RS, Cross AH, Song SK. Quantification of increased cellularity during inflammatory demyelination. Brain. 2011;134(Pt 12):3590-601.
64. Yang AW, Jensen JH, Hu CC, Tabesh A, Falangola MF, Helpern JA. Effect of
cerebral spinal fluid suppression for diffusional kurtosis imaging. J Magn Reson Imaging. 2013; 37(2):365-71.
65. Leergaard TB, White NS, de Crespigny A, Bolstad I, D'Arceuil H, Bjaalie JG, Dale
AM. Quantitative histological validation of diffusion MRI fiber orientation distributions in the rat brain. PLoS One. 2010; 5(1):e8595.
24
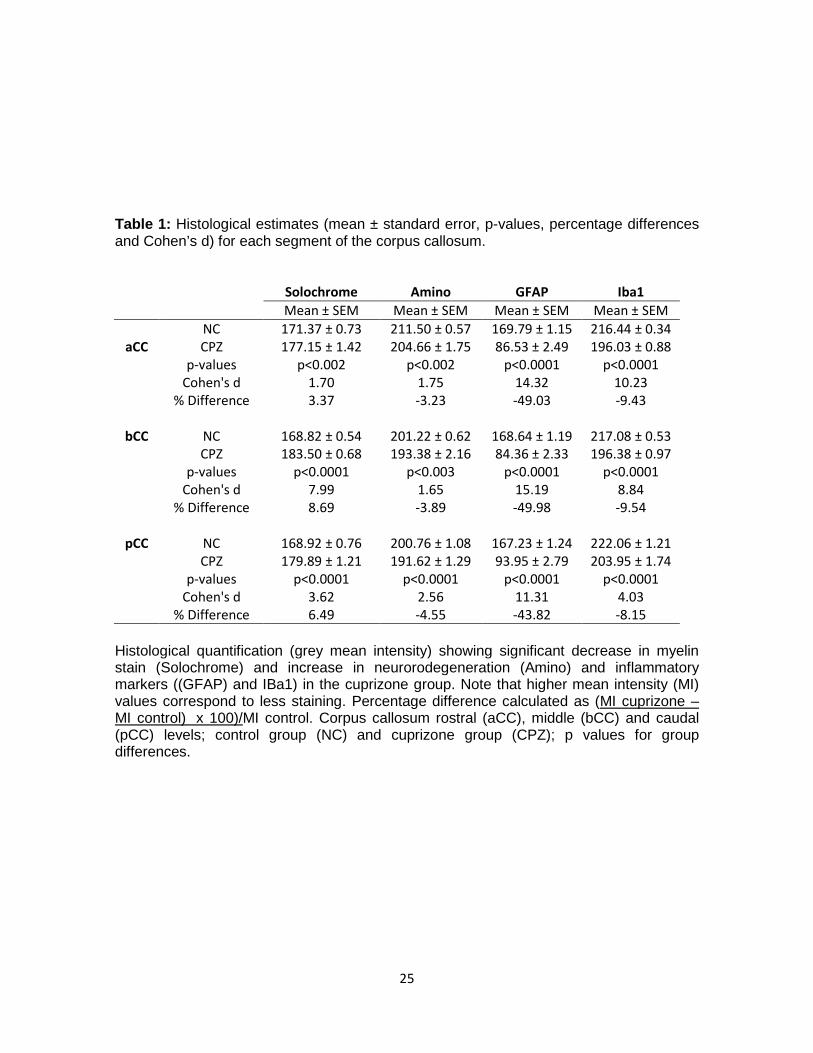
Table 1: Histological estimates (mean ± standard error, p-values, percentage differences and Cohen’s d) for each segment of the corpus callosum. Solochrome Amino GFAP Iba1
Mean ± SEM Mean ± SEM Mean ± SEM Mean ± SEM NC 171.37 ± 0.73 211.50 ± 0.57 169.79 ± 1.15 216.44 ± 0.34
aCC CPZ 177.15 ± 1.42 204.66 ± 1.75 86.53 ± 2.49 196.03 ± 0.88 p-values p<0.002 p<0.002 p<0.0001 p<0.0001 Cohen's d 1.70 1.75 14.32 10.23 % Difference 3.37 -3.23 -49.03 -9.43
bCC NC 168.82 ± 0.54 201.22 ± 0.62 168.64 ± 1.19 217.08 ± 0.53 CPZ 183.50 ± 0.68 193.38 ± 2.16 84.36 ± 2.33 196.38 ± 0.97 p-values p<0.0001 p<0.003 p<0.0001 p<0.0001 Cohen's d 7.99 1.65 15.19 8.84 % Difference 8.69 -3.89 -49.98 -9.54
pCC NC 168.92 ± 0.76 200.76 ± 1.08 167.23 ± 1.24 222.06 ± 1.21 CPZ 179.89 ± 1.21 191.62 ± 1.29 93.95 ± 2.79 203.95 ± 1.74 p-values p<0.0001 p<0.0001 p<0.0001 p<0.0001 Cohen's d 3.62 2.56 11.31 4.03 % Difference 6.49 -4.55 -43.82 -8.15
Histological quantification (grey mean intensity) showing significant decrease in myelin stain (Solochrome) and increase in neurorodegeneration (Amino) and inflammatory markers ((GFAP) and IBa1) in the cuprizone group. Note that higher mean intensity (MI) values correspond to less staining. Percentage difference calculated as (MI cuprizone – MI control) x 100)/MI control. Corpus callosum rostral (aCC), middle (bCC) and caudal (pCC) levels; control group (NC) and cuprizone group (CPZ); p values for group differences.
25
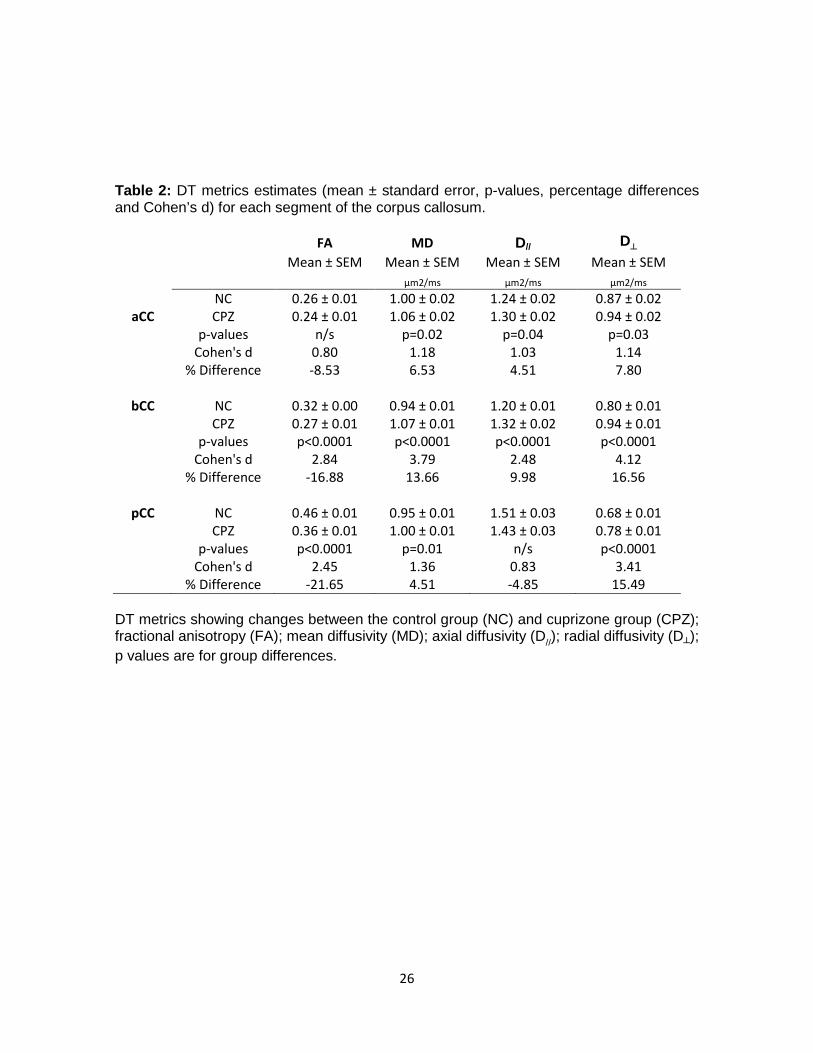
Table 2: DT metrics estimates (mean ± standard error, p-values, percentage differences and Cohen’s d) for each segment of the corpus callosum. FA MD D// D┴
Mean ± SEM Mean ± SEM Mean ± SEM Mean ± SEM μm2/ms μm2/ms μm2/ms NC 0.26 ± 0.01 1.00 ± 0.02 1.24 ± 0.02 0.87 ± 0.02
aCC CPZ 0.24 ± 0.01 1.06 ± 0.02 1.30 ± 0.02 0.94 ± 0.02 p-values n/s p=0.02 p=0.04 p=0.03 Cohen's d 0.80 1.18 1.03 1.14 % Difference -8.53 6.53 4.51 7.80
bCC NC 0.32 ± 0.00 0.94 ± 0.01 1.20 ± 0.01 0.80 ± 0.01 CPZ 0.27 ± 0.01 1.07 ± 0.01 1.32 ± 0.02 0.94 ± 0.01 p-values p<0.0001 p<0.0001 p<0.0001 p<0.0001 Cohen's d 2.84 3.79 2.48 4.12 % Difference -16.88 13.66 9.98 16.56
pCC NC 0.46 ± 0.01 0.95 ± 0.01 1.51 ± 0.03 0.68 ± 0.01 CPZ 0.36 ± 0.01 1.00 ± 0.01 1.43 ± 0.03 0.78 ± 0.01 p-values p<0.0001 p=0.01 n/s p<0.0001 Cohen's d 2.45 1.36 0.83 3.41 % Difference -21.65 4.51 -4.85 15.49
DT metrics showing changes between the control group (NC) and cuprizone group (CPZ); fractional anisotropy (FA); mean diffusivity (MD); axial diffusivity (D//); radial diffusivity (D┴); p values are for group differences.
26
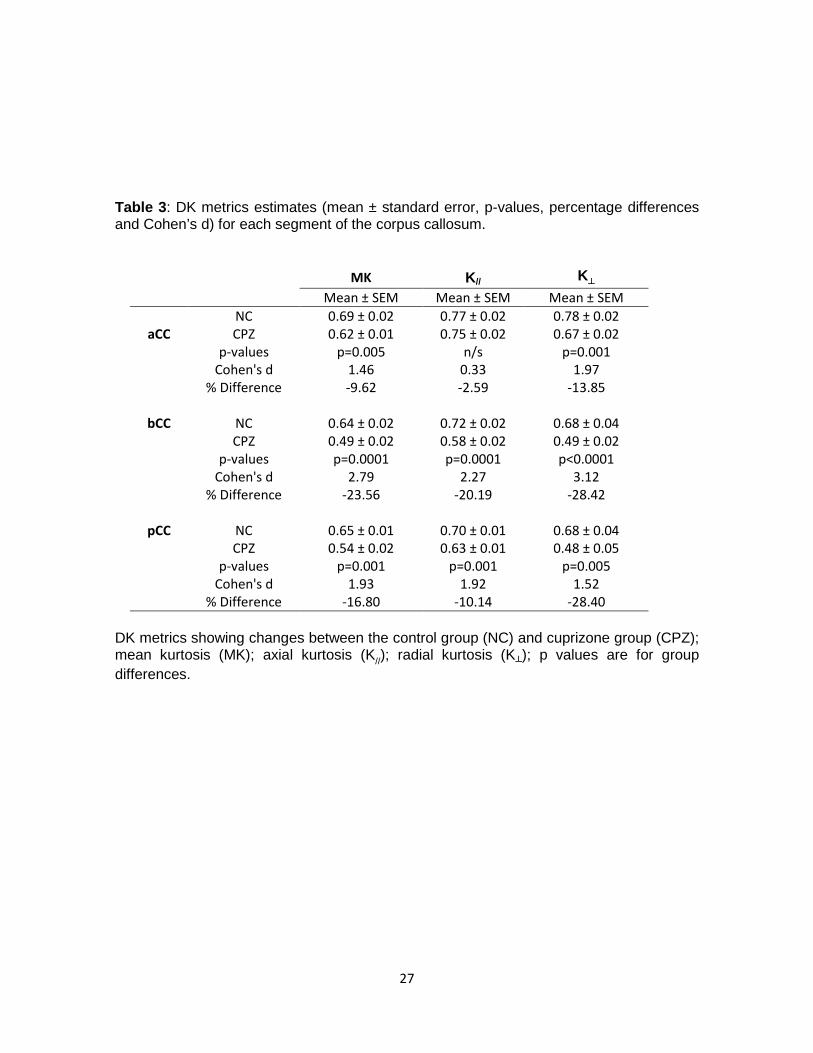
Table 3: DK metrics estimates (mean ± standard error, p-values, percentage differences and Cohen’s d) for each segment of the corpus callosum.
MK K// K┴
Mean ± SEM Mean ± SEM Mean ± SEM NC 0.69 ± 0.02 0.77 ± 0.02 0.78 ± 0.02
aCC CPZ 0.62 ± 0.01 0.75 ± 0.02 0.67 ± 0.02 p-values p=0.005 n/s p=0.001 Cohen's d 1.46 0.33 1.97 % Difference -9.62 -2.59 -13.85
bCC NC 0.64 ± 0.02 0.72 ± 0.02 0.68 ± 0.04 CPZ 0.49 ± 0.02 0.58 ± 0.02 0.49 ± 0.02 p-values p=0.0001 p=0.0001 p<0.0001 Cohen's d 2.79 2.27 3.12 % Difference -23.56 -20.19 -28.42
pCC NC 0.65 ± 0.01 0.70 ± 0.01 0.68 ± 0.04 CPZ 0.54 ± 0.02 0.63 ± 0.01 0.48 ± 0.05 p-values p=0.001 p=0.001 p=0.005 Cohen's d 1.93 1.92 1.52 % Difference -16.80 -10.14 -28.40
DK metrics showing changes between the control group (NC) and cuprizone group (CPZ); mean kurtosis (MK); axial kurtosis (K//); radial kurtosis (K┴); p values are for group differences.
27
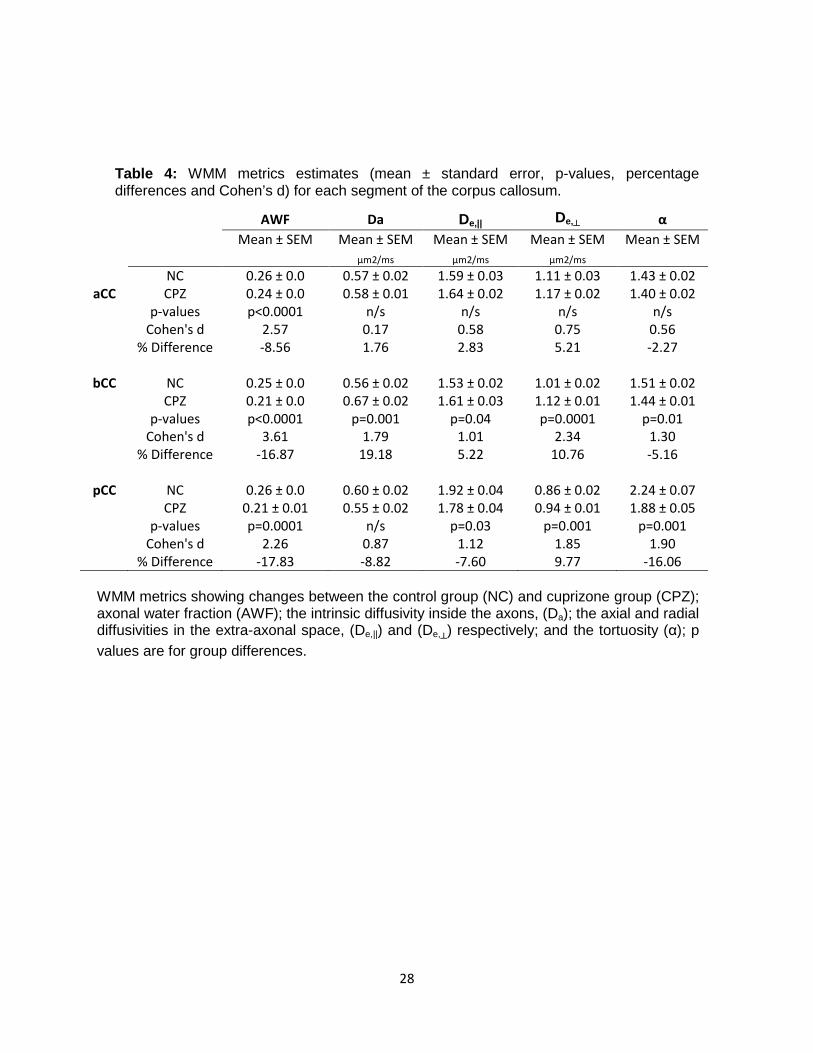
Table 4: WMM metrics estimates (mean ± standard error, p-values, percentage differences and Cohen’s d) for each segment of the corpus callosum.
WMM metrics showing changes between the control group (NC) and cuprizone group (CPZ); axonal water fraction (AWF); the intrinsic diffusivity inside the axons, (Da); the axial and radial diffusivities in the extra-axonal space, (De,||) and (De,┴) respectively; and the tortuosity (α); p values are for group differences.
AWF Da De,|| De,┴ α Mean ± SEM Mean ± SEM Mean ± SEM Mean ± SEM Mean ± SEM μm2/ms μm2/ms μm2/ms NC 0.26 ± 0.0 0.57 ± 0.02 1.59 ± 0.03 1.11 ± 0.03 1.43 ± 0.02
aCC CPZ 0.24 ± 0.0 0.58 ± 0.01 1.64 ± 0.02 1.17 ± 0.02 1.40 ± 0.02 p-values p<0.0001 n/s n/s n/s n/s Cohen's d 2.57 0.17 0.58 0.75 0.56 % Difference -8.56 1.76 2.83 5.21 -2.27
bCC NC 0.25 ± 0.0 0.56 ± 0.02 1.53 ± 0.02 1.01 ± 0.02 1.51 ± 0.02 CPZ 0.21 ± 0.0 0.67 ± 0.02 1.61 ± 0.03 1.12 ± 0.01 1.44 ± 0.01 p-values p<0.0001 p=0.001 p=0.04 p=0.0001 p=0.01 Cohen's d 3.61 1.79 1.01 2.34 1.30 % Difference -16.87 19.18 5.22 10.76 -5.16
pCC NC 0.26 ± 0.0 0.60 ± 0.02 1.92 ± 0.04 0.86 ± 0.02 2.24 ± 0.07 CPZ 0.21 ± 0.01 0.55 ± 0.02 1.78 ± 0.04 0.94 ± 0.01 1.88 ± 0.05 p-values p=0.0001 n/s p=0.03 p=0.001 p=0.001 Cohen's d 2.26 0.87 1.12 1.85 1.90 % Difference -17.83 -8.82 -7.60 9.77 -16.06
28
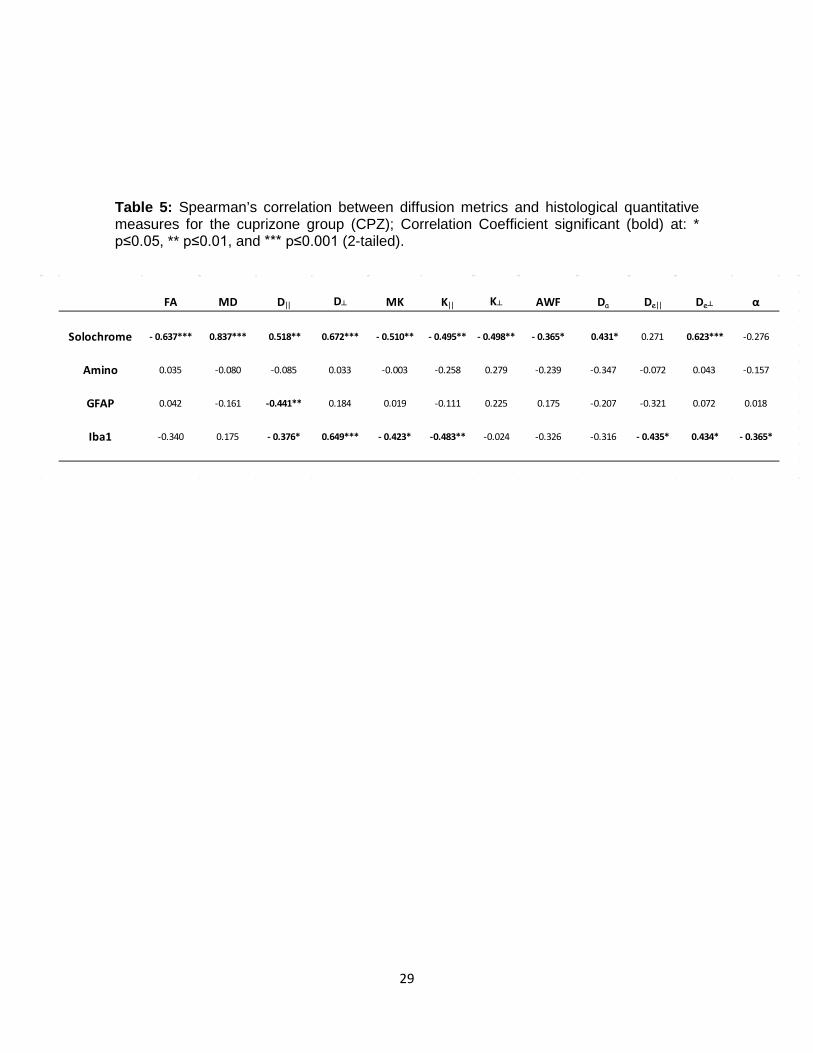
Table 5: Spearman’s correlation between diffusion metrics and histological quantitative measures for the cuprizone group (CPZ); Correlation Coefficient significant (bold) at: * p≤0.05, ** p≤0.01, and *** p≤0.001 (2-tailed).
29
FA MD D|| D┴ MK K|| K┴ AWF Da De|| De┴ α
Solochrome - 0.637*** 0.837*** 0.518** 0.672*** - 0.510** - 0.495** - 0.498** - 0.365* 0.431* 0.271 0.623*** -0.276
Amino 0.035 -0.080 -0.085 0.033 -0.003 -0.258 0.279 -0.239 -0.347 -0.072 0.043 -0.157
GFAP 0.042 -0.161 -0.441** 0.184 0.019 -0.111 0.225 0.175 -0.207 -0.321 0.072 0.018
Iba1 -0.340 0.175 - 0.376* 0.649*** - 0.423* -0.483** -0.024 -0.326 -0.316 - 0.435* 0.434* - 0.365*
LEGENDS
Figure 1: First Row: Coronal diagram of the mouse brain with slices (Paxinos’ mouse Brain Atlas) centered at anatomical positions corresponding to the bregma location for corpus callosum (CC) rostral (aCC), middle (bCC) and caudal (pCC) levels; Second Row: Representative fraction anisotropy (FA) maps (NC mice) with CC ROIs at each level. Third Row: Representative of the Solochrome stain (NC mice) with CC ROIs at each level. Figure 2: Histological examples (4x) of the solochrome (A) and amino cupric silver (B) stains, and GFAP (C) and Iba1 (D) immunohistochemistry with detailed insert (100x) at the body from of the CC. Control group (NC) and cuprizone group (CPZ). Scale bar = 100 µm. Figure 3: Morphological heterogeneity of the demyelination process in the cuprizone group; the figure illustrates histological sections from 3 cuprizone mice, showing the different degree of demyelination in the aCC (177.15±4.50) and similar, complete demyelination at the bCC (183.50±2.14) and pCC(179.89±3.83) for all three mice. Note the higher SD at the level of the aCC when compared is bCC and pCC, reflecting the morphological demyelination heterogeneity in the aCC. Intensity values as mean ± SD (arbitrary units).
30
Related Documents