Open Access Mendoza-Mari et al., J Diabetes Metab 2013, 4:8 DOI: 10.4172/2155-6156.1000296 Volume 4 • Issue 8 • 1000296 J Diabetes Metab ISSN: 2155-6156 JDM, an open access journal Research Article Histological and Transcriptional Expression differences between Diabetic Foot and Pressure Ulcers Yssel Mendoza-Mari 1 , Calixto Valdés-Pérez 2 , Elena Rodríguez-Corrales 3 , José Suárez-Alba 4 , Ariana García-Ojalvo 1 , Diana García del Barco 1 , Gerardo Guillén-Nieto 1 , Luis Herrera-Martínez 1 and Jorge Berlanga-Acosta 1* 1 Wound Healing, Tissue Repair and Cyto-protection Laboratory, Center for Genetic Engineering and Biotechnology, Cuba 2 Diabetic Angiopathy Ward, National Institute of Angiology and Vascular Surgery, Cuba 3 Diabetic Angiopathy Ward, National Institute of Dermatology “Dr. Ramón Hernández Vaquero”, Cuba 4 Department of Pathology, Center for Genetic Engineering and Biotechnology, Cuba Keywords: Diabetes; Diabetic ulcer; Decubitus ulcer; Wound healing; Chronic ulcer Abbreviations: PU: Pressure Ulcer; DFU: Diabetic Foot Ulcer; MMP2: Matrix Metallopeptidase 2; MMP9: Matrix Metallopeptidase 9; HIF-1α or HIF1A: Hypoxia Inducible Factor 1, Alpha Subunit; VEGF: Vascular Endotelial Growth Factor; HSP: Heat Shock Protein; ROS: Reactive Oxygen Species; AGE: Advanced Glycation End Products; RAGE: Receptor for Advanced Glycation End Products; FOXO: Forkhead Box Protein O; yrs: years; H/E: Hematoxylin/Eosin; RNA: Ribonucleic Acid; EGFR: Receptor for Epidermic Growth Factor; AKT1: Human v-akt Murine ymoma Viral Oncogene Homolog 1; PIK3CA: Phosphatidylinositol-4,5-bisphosphate 3-Kinase, Catalytic Subunit Alpha; PTEN: Phosphatase and Tensin Homolog; MTOR: Mechanistic Target of Rapamycin; CCND1: Cyclin D1; CDK4: Cyclin-dependent Kinase 4; PCNA: Proliferating Cell Nuclear Antigen; RB1: Retinoblastoma 1; E2F1: E2F Transcription Factor 1; MYC: v-myc Avian Myelocytomatosis Viral Oncogene Homolog; TP53: Tumor Protein p53; COL1A1: Collagen, Type I, Alpha 1; COL3A1: Collagen, Type III, Alpha 1; TGFB1: Transforming Growth Factor, Beta 1; ILK: Integrin-Linked Kinase; INSR: Insulin Receptor; SLC2A1: Solute Carrier Family 2 (facilitated glucose transporter), Member 1; HK1: Hexokinase 1; HK2: Hexokinase 2; PFKP: Phosphofructokinase, Platelet; PKM: Pyruvate Kinase, Muscle; PDHA1: Pyruvate Dehydrogenase (lipoamide) Alpha 1; PDK4: Pyruvate Dehydrogenase Kinase, Isozyme 4; PPARG: Peroxisome Proliferator-Activated Receptor Gamma; PPARGC1: Peroxisome Proliferator-Activated Receptor Gamma, Coactivator 1 Alpha; SIRT1: Sirtuin 1; SOD2: Superoxide Dismutase 2, Mitochondrial; TNF: Tumor Necrosis Factor; RNA18S1: RNA, 18S Ribosomal 1 Introduction Pressure or decubitus ulcers (PU) and diabetic foot ulcers (DFU) are among the most common chronic wounds representing individual clinical entities but sharing a significant socioeconomic impact [1]. ese chronic ulcers translate in systemic repercussion as they may act as pro-inflammatory and pro-oxidant organs super-imposed to a host that could evolve to a chronic low-grade inflammatory response [2]. Pressure ulcers continue to be a worldwide common health problem, particularly among the neurologically impaired or bedridden elderly. Its medical history dates back to the renaissance when the French surgeon Ambrose Paré enlisted; nutrition, pain relief and debridement as key factors to heal these ulcers. Surprisingly, it is not quite different than the present modality to some extent [3]. To date, a large percent of grades 3 and 4 pressure ulcers evolve to chronification and lead the patient to death due to ulcer complications such as sepsis or osteomyelitis [4]. *Corresponding author: Jorge Berlanga-Acosta, Wound Healing and Cyto- Protection Research Group, Biomedical Research Direction, Center for Genetic Engineering and Biotechnology, Havana 10600, PO Box: 6162, Havana, Cuba, Tel: 53-7-271 60 22; Fax: 53-7-250 44 94; E-mail: [email protected] Received September 02, 2013; Accepted October 07, 2013; Published October 12, 2013 Citation: Mendoza-Mari Y, Valdés-Pérez C, Rodríguez-Corrales E, Suárez-Alba J, García-Ojalvo A, et al. (2013) Histological and Transcriptional Expression differences between Diabetic Foot and Pressure Ulcers. J Diabetes Metab 4: 296. doi:10.4172/2155-6156.1000296 Copyright: © 2013 Mendoza-Mari Y, et al. This is an open-access article distributed under the terms of the Creative Commons Attribution License, which permits unrestricted use, distribution, and reproduction in any medium, provided the original author and source are credited. Abstract Decubitus and diabetic foot ulcers remain as important clinical challenges with significant socioeconomic impact. Both are individual forms of chronic wounds with diverse proximal ethiopathogenic triggers. This study aimed to characterize and compare the main histological features as the transcriptional expression profile of a set of wound-healing relevant genes of the ulcers’ granulation tissue. Following patients’ consent, biopsies were collected from sacrolumbar pressure ulcers (N=5, stage IV) and diabetic foot ulcers (N=9, both of neuropathic and ischemic origin) with clean, non-infected granulation tissue. Biopsies fragments were processed for histological analysis and for RNA extraction and subsequent transcriptional expression characterization via RT-PCR. The group of targeted genes included cell proliferation control, extracellular matrix, glucose metabolism, anabolism- survival, as anti-hypoxia and anti-oxidant defense. Gene expression was determined, normalized with an internal housekeeping gene, and statistically compared. Each class of chronic ulcer granulation tissue: decubitus, and diabetics’ ischemic and neuropathic proved to develop a particular histological pattern thus establishing individual differences. Moreover, diabetes appeared to significantly reduce the expression of numerous genes irrespective to their biological significance. Most importantly, we found that diabetic granulation tissue cells exhibit a sort of “genetic or epigenetic imprinting” for the expression of glucose-metabolism related genes which are deeply involved in type-2 diabetes pathophysiology. Our data indicate that in addition to a protracted inflammation and abnormal angiogenesis, diabetic granulation tissue cells are affected by gene expression failures that may lead to a negative pro-anabolic and energetic balance. J o u r n a l o f D i a b e t e s & M e t a b o l i s m ISSN: 2155-6156 Journal of Diabetes and Metabolism

Welcome message from author
This document is posted to help you gain knowledge. Please leave a comment to let me know what you think about it! Share it to your friends and learn new things together.
Transcript
Open Access
Mendoza-Mari et al., J Diabetes Metab 2013, 4:8 DOI: 10.4172/2155-6156.1000296
Volume 4 • Issue 8 • 1000296J Diabetes MetabISSN: 2155-6156 JDM, an open access journal
Research Article
Histological and Transcriptional Expression differences between Diabetic Foot and Pressure UlcersYssel Mendoza-Mari1, Calixto Valdés-Pérez2, Elena Rodríguez-Corrales3, José Suárez-Alba4, Ariana García-Ojalvo1, Diana García del Barco1, Gerardo Guillén-Nieto1, Luis Herrera-Martínez1 and Jorge Berlanga-Acosta1*
1Wound Healing, Tissue Repair and Cyto-protection Laboratory, Center for Genetic Engineering and Biotechnology, Cuba2Diabetic Angiopathy Ward, National Institute of Angiology and Vascular Surgery, Cuba3Diabetic Angiopathy Ward, National Institute of Dermatology “Dr. Ramón Hernández Vaquero”, Cuba4Department of Pathology, Center for Genetic Engineering and Biotechnology, Cuba
Keywords: Diabetes; Diabetic ulcer; Decubitus ulcer; Woundhealing; Chronic ulcer
Abbreviations: PU: Pressure Ulcer; DFU: Diabetic Foot Ulcer;MMP2: Matrix Metallopeptidase 2; MMP9: Matrix Metallopeptidase 9; HIF-1α or HIF1A: Hypoxia Inducible Factor 1, Alpha Subunit; VEGF: Vascular Endotelial Growth Factor; HSP: Heat Shock Protein; ROS: Reactive Oxygen Species; AGE: Advanced Glycation End Products; RAGE: Receptor for Advanced Glycation End Products; FOXO: Forkhead Box Protein O; yrs: years; H/E: Hematoxylin/Eosin; RNA: Ribonucleic Acid; EGFR: Receptor for Epidermic Growth Factor; AKT1: Human v-akt Murine Thymoma Viral Oncogene Homolog 1; PIK3CA: Phosphatidylinositol-4,5-bisphosphate 3-Kinase, Catalytic Subunit Alpha; PTEN: Phosphatase and TensinHomolog; MTOR: Mechanistic Target of Rapamycin; CCND1: CyclinD1; CDK4: Cyclin-dependent Kinase 4; PCNA: Proliferating CellNuclear Antigen; RB1: Retinoblastoma 1; E2F1: E2F TranscriptionFactor 1; MYC: v-myc Avian Myelocytomatosis Viral OncogeneHomolog; TP53: Tumor Protein p53; COL1A1: Collagen, Type I,Alpha 1; COL3A1: Collagen, Type III, Alpha 1; TGFB1: Transforming Growth Factor, Beta 1; ILK: Integrin-Linked Kinase; INSR: InsulinReceptor; SLC2A1: Solute Carrier Family 2 (facilitated glucosetransporter), Member 1; HK1: Hexokinase 1; HK2: Hexokinase 2;PFKP: Phosphofructokinase, Platelet; PKM: Pyruvate Kinase, Muscle; PDHA1: Pyruvate Dehydrogenase (lipoamide) Alpha 1; PDK4:Pyruvate Dehydrogenase Kinase, Isozyme 4; PPARG: PeroxisomeProliferator-Activated Receptor Gamma; PPARGC1: PeroxisomeProliferator-Activated Receptor Gamma, Coactivator 1 Alpha; SIRT1: Sirtuin 1; SOD2: Superoxide Dismutase 2, Mitochondrial; TNF:Tumor Necrosis Factor; RNA18S1: RNA, 18S Ribosomal 1
IntroductionPressure or decubitus ulcers (PU) and diabetic foot ulcers (DFU)
are among the most common chronic wounds representing individual clinical entities but sharing a significant socioeconomic impact [1]. These chronic ulcers translate in systemic repercussion as they may act as pro-inflammatory and pro-oxidant organs super-imposed to a host that could evolve to a chronic low-grade inflammatory response [2].
Pressure ulcers continue to be a worldwide common health problem, particularly among the neurologically impaired or bedridden elderly. Its medical history dates back to the renaissance when the French surgeon Ambrose Paré enlisted; nutrition, pain relief and debridement as key factors to heal these ulcers. Surprisingly, it is not quite different than the present modality to some extent [3]. To date, a large percent of grades 3 and 4 pressure ulcers evolve to chronification and lead the patient to death due to ulcer complications such as sepsis or osteomyelitis [4].
*Corresponding author: Jorge Berlanga-Acosta, Wound Healing and Cyto-Protection Research Group, Biomedical Research Direction, Center for GeneticEngineering and Biotechnology, Havana 10600, PO Box: 6162, Havana, Cuba, Tel: 53-7-271 60 22; Fax: 53-7-250 44 94; E-mail: [email protected]
Received September 02, 2013; Accepted October 07, 2013; Published October 12, 2013
Citation: Mendoza-Mari Y, Valdés-Pérez C, Rodríguez-Corrales E, Suárez-Alba J, García-Ojalvo A, et al. (2013) Histological and Transcriptional Expression differences between Diabetic Foot and Pressure Ulcers. J Diabetes Metab 4: 296. doi:10.4172/2155-6156.1000296
Copyright: © 2013 Mendoza-Mari Y, et al. This is an open-access article distributed under the terms of the Creative Commons Attribution License, which permits unrestricted use, distribution, and reproduction in any medium, provided the original author and source are credited.
AbstractDecubitus and diabetic foot ulcers remain as important clinical challenges with significant socioeconomic
impact. Both are individual forms of chronic wounds with diverse proximal ethiopathogenic triggers. This study aimed to characterize and compare the main histological features as the transcriptional expression profile of a set of wound-healing relevant genes of the ulcers’ granulation tissue. Following patients’ consent, biopsies were collected from sacrolumbar pressure ulcers (N=5, stage IV) and diabetic foot ulcers (N=9, both of neuropathic and ischemic origin) with clean, non-infected granulation tissue. Biopsies fragments were processed for histological analysis and for RNA extraction and subsequent transcriptional expression characterization via RT-PCR. The group of targeted genes included cell proliferation control, extracellular matrix, glucose metabolism, anabolism-survival, as anti-hypoxia and anti-oxidant defense. Gene expression was determined, normalized with an internal housekeeping gene, and statistically compared. Each class of chronic ulcer granulation tissue: decubitus, and diabetics’ ischemic and neuropathic proved to develop a particular histological pattern thus establishing individual differences. Moreover, diabetes appeared to significantly reduce the expression of numerous genes irrespective to their biological significance. Most importantly, we found that diabetic granulation tissue cells exhibit a sort of “genetic or epigenetic imprinting” for the expression of glucose-metabolism related genes which are deeply involved in type-2 diabetes pathophysiology. Our data indicate that in addition to a protracted inflammation and abnormal angiogenesis, diabetic granulation tissue cells are affected by gene expression failures that may lead to a negative pro-anabolic and energetic balance.
Jour
nal o
f Diabetes & Metabolism
ISSN: 2155-6156Journal of Diabetes and Metabolism
Citation: Mendoza-Mari Y, Valdés-Pérez C, Rodríguez-Corrales E, Suárez-Alba J, García-Ojalvo A, et al. (2013) Histological and Transcriptional Expression differences between Diabetic Foot and Pressure Ulcers. J Diabetes Metab 4: 296. doi:10.4172/2155-6156.1000296
Page 2 of 11
Volume 4 • Issue 8 • 1000296J Diabetes MetabISSN: 2155-6156 JDM, an open access journal
From the ethiopathogenic perspective, cutaneous ischemia appears to be the proximal trigger of a downstream cascade of molecular events that converge to impose a chronic evolution. These include the over-activation of molecular regulators toward a pro-apoptotic program [5], imbalance in matrix metalloproteinases regulation (MMP2 and MMP9) [6], and adhesion molecules overexpression [7]. At the experimental level, a reduction of the cutaneous cells constitutive expression of endogenous cytoprotective molecules such as hypoxia-inducible factor-1 alpha (HIF-1α), VEGF, HSP 70 and 90 and hemeoxigenase-1 [8] have been demonstrated. Despite the medical and social problem that the pressure ulcer represents, still remains a paucity of data aimed to characterize its molecular pathophysiology in clinical samples.
Within the diabetic context, hyperglycemia stands as the proximal ethiopathogenic trigger for the onset and progression of biochemical disturbances that steers the systemic complications, in which ulcer healing failure and amputation are included. The vicious circle between wound chronicity and deficient local infection control, determines that 85% of all non-traumatic lower extremity amputations are rendered by diabetic subjects [9]. At the molecular level, this high glucose burden unleashes acute and chronic self-perpetuating loops, which include ROS-lipid peroxidation, hyperinflammation/disimmunity, AGE-RAGE toxicity, mitochondrial dysfunction, nytrosilation end-products accumulation, FOXO genes deregulation and a perspicuous reduction of growth factors physiology. The concerted action of these elements enforces granulation tissue-producing cells to senescence, arrest and apoptosis. Furthermore, the failure of the agonistic stimulation of the insulin axis and other tyrosine kinase receptors, negatively impacts on the biology of diabetic wound cells [10].
This study intends to be a modest contribution to the characterization of the chronic wound microenvironment, by characterizing and comparing granulation tissue samples histology, as the gene expression profiles in these two common and devastating types of human chronic wounds.
Experimental ProceduresPopulation and study enrollment criteria
The enrollment of patients was based on the following criteria addressed to preserve as “clean” as possible the experimental substrate for a neat constitutive gene expression profile. Diabetic co-morbids and pressure ulcer-affected patients with concurrent clinical conditions, requiring medication that we understood as potentially gene expression modifiers were not enrolled in the study. Thus, for diabetics, only those with oral hypoglycemic treatment were sampled. Insulin-dependent and uncompensated patients were not included. Furthermore, patients with clinical depression, heart failure, renal insufficiency, unstable angina, asthma, angiotensin-converting-enzyme inhibitors-medicated, and subjects with auto-immune processes were excluded. As all the pressure ulcer samples population had a spinal injury (lumbar segment) as the primary process, the only subjects included were those free of lower limbs hyperspastic episodes, simply receiving physical therapy/postural rotation and no pharmacological intervention. Obviously, patients with malignant diseases and history of chemotherapy were discarded. No pregnant or breast feeding women were conceived to be included.
All the patients were consulted about the experimental procedure and approved to offer a biopsy fragment for the study. For the chronic wounds, the granulation tissue fragment was obtained from a productive area, with no macroscopic evidence of infection, during a routine wound debridement and cleansing. The investigation material was
collected from: (1) sacrolumbar pressure ulcers (stage IV) from non-emaciated patients with history of spinal trauma [11], and (2) diabetic foot ulcers of both neuropathic and ischemic origin from reasonably compensated in-hospital patients [12]. As control of an acute wound we used a fragment derived from granulation tissue, obtained from a healthy female donor (20-yrs old) who experienced wound dehiscence following esthetic breast surgery. The sample was collected during the final surgical wound closure when the exuberant granulation was trimmed.
Tissue processingSix-millimeter diameter punch biopsies were collected days after a
series of surgical debridements and ulcers bed preparation, as part of the standard wound care procedures; using disposable sterile biotomes (Acuderm Inc., USA), washed in normal saline to remove blood and immediately hemisectioned along its longitudinal axis. A hemisection was fixed in 10% buffered formalin, horizontally paraffin-embedded, processed, and 5-µm slides stained with H/E and Mallory trichrome for a better definition of collagen accumulation. The other hemisection was preserved in RNA later solution (Ambion, Life Technologies, USA) and processed for gene expression analysis.
Gene expression analyses by semiquantitative RT-PCRTotal RNA was purified according to TRI Reagent standard
procedure (Sigma, USA), followed digestion with RQ1 DNase I (Promega, USA) to remove contaminating genomic DNA. Afterward, 500 nanograms of DNA-free RNA were reverse transcribed using a commercial available kit (Omniscript RT, Qiagen, Germany) with oligo-dT primer. The RT reaction was performed at 42°C for 60 min. PCR mixtures contained 2 μL cDNA, 1 μL of each primer (10 μM), 12.5 μL 2X Taq MasterMix (Qiagen, Germany) in a final volume of 25 μL. Specific sense and antisense primers, annealing temperatures and number of repeating cycles are referred in Table 1. Amplifying conditions were performed as followed: a first step of 95°C for 5 minutes, thereafter repeating cycles comprised of 95°C for 30 seconds, specific annealing temperature for 30 seconds and 72°C for 30 seconds, and a final extension step of 5 minutes at 72°C. PCR bands (8 µL of PCR product with 2 µL of gel loading buffer) were resolved on a 1.5% (w/v) agarose gel electrophoresis and visualized under ultraviolet light subsequent to being stained with ethidium bromide. PCR products were quantified using the Kodak ID 3.6 software package (Kodak Inc, USA). Ribosomal subunit 18S was used as housekeeping gene for normalization. Despite the broad spectrum of biological functions of some of the genes studied, for practical reasons we have grouped them as follows:
1. Genes involved in signaling pathways: EGFR, AKT1, PIK3CA, PTEN, MTOR
2. Genes involved in cell proliferation control: CCND1, CDK4, PCNA, RB1, E2F1, MYC, TP53
3. Genes involved in extracellular matrix biology: COL1A1, COL3A1, TGFB1, ILK
4. Genes involved in glucose metabolic pathways: INSR, SLC2A1, HK1, HK2, PFKP, PKM1, PKM2, PDHA1, PDK4
5. Genes involved in survival and anabolism: FOXO1, FOXO3, PPARG, PPARGC1, SIRT1
6. Anti-oxidant and anti-hypoxia defense: SOD2, HIF1A
7. Pro-inflammatory: TNF
8. Housekeeping gene: RNA18S1

Citation: Mendoza-Mari Y, Valdés-Pérez C, Rodríguez-Corrales E, Suárez-Alba J, García-Ojalvo A, et al. (2013) Histological and Transcriptional Expression differences between Diabetic Foot and Pressure Ulcers. J Diabetes Metab 4: 296. doi:10.4172/2155-6156.1000296
Page 3 of 11
Volume 4 • Issue 8 • 1000296J Diabetes MetabISSN: 2155-6156 JDM, an open access journal
Gene Approved symbol Gene Bank accession number Primer sequence Tm (°C) No.
cycles Product length (bp)
EGFR EGFR NM_005228.3 sense CAGCAGAGACCCACACTACCAG 58 35 213antisense GAGCCCTTAAAGATGCCATTTG
Akt AKT1 NM_005163.2 sense ACAAGGACGGGCACATTAAGAT 62 35 189antisense GACCGCACATCATCTCGTACAT
PI3K PIK3CA NM_006218.2sense TGGTGAAAGACGATGGACAACT
54 35 151antisense GTGCATTCTTGGGCTCCTTTAC
PTEN PTEN NM_000314.4 sense CAATCCTCAGTTTGTGGTCTGC 54 35 226antisense GGTTTCCTCTGGTCCTGGTATG
mTOR MTOR NM_004958.3 sense GGGACTGCTTTGAGGTTGCTAT 56 35 249antisense ATCGCTTGTTGCCTTTGGTATT
Cyclin D1 CCND1 NM_053056.2 sense CCCCAACAACTTCCTGTCCTAC 60 35 186antisense ACCTCCTCCTCCTCCTCTTCCT
CDK4 CDK4 NM_000075.3 sense CGAAACGATCAAGGATCTGATG 55 35 188antisense TAACAACCACGGGTGTAAGTGC
PCNA PCNA NM_002592.2 sense TCAGCCATATTGGAGATGCTGT 55 35 228antisense GTGTCACCGTTGAAGAGAGTGG
RB RB1 NM_000321.2 sense CCCCTACCTTGTCACCAATACC 62 35 246antisense CACGGTCGCTGTTACATACCAT
E2F1 E2F1 NM_005225.2 sense CGTGGACTCTTCGGAGAACTTT 58 35 187antisense AGATGATGGTGGTGGTGACACT
c-myc MYC NM_002467.4 sense TCCACACATCAGCACAACTACG 58 35 171antisense GTGTGTTCGCCTCTTGACATTC
p53 TP53 NM_000546.4 sense TTGGCTCTGACTGTACCACCAT 56 35 203antisense TTTCTTGCGGAGATTCTCTTCC
Collagen I COL1A1 NM_000088.3 sense CCAGAACATCACCTACCACTGC 60 35 218antisense GGGAGGTCTTGGTGGTTTTGTA
Collagen III COL3A1 NM_000090.3 sense TGCAAATTGGATGCTATCAAGG 56 35 205antisense GCACATCAAGGACATCTTCAGG
TGF β1 TGFB1 NM_000660.4 sense ACAATTCCTGGCGATACCTCAG 58 35 196antisense GTAGTGAACCCGTTGATGTCCA
ILK ILK U40282.1 sense GCATGGCTGATGTCAAGTTCTC 56 35 156antisense GTGTCACCAGTTCCCACAGAAG
Glut1 SLC2A1 NM_006516.2 sense ACCCTGGATGTCCTATCTGAGC 58 35 360antisense TCCTCGGGTGTCTTGTCACTT
Insulin Receptor INSR M10051.1 sense TGTCATGGATGGAGGGTATCTG 56 35 174antisense CTGTGGAAGAACGACACCTCTG
Hexokinase I HK1 NM_000188.2 sense CCTAAATGCTGGGAAACAAAGG 58 35 193antisense CAGTGCTAATCGGTCACTCTCG
Hexokinase II HK2 NM_000189.4 sense ACCAAGCGTGGACTACTCTTCC 58 35 156antisense ACAGGTGCTCTCAAGCCCTAAG
PFK PFKP NM_002627.4 sense TGGAGTGGATCACTGCAAAACT 54 35 165antisense GTTCTTTGGGAATCCTGTGCTC
PKM1 PKM NM_182470.2 sense GAGCCTCAAGTCACTCCACAGA 58 35 227antisense CTTGCACAGCACAGGGAAGAT
PKM2 PKM NM_002654.4 sense AGAGGCTGCCATCTACCACTTG 58 35 150antisense CCAGACTTGGTGAGGACGATTA
PDH PDHA1 NM_000284.3 sense AAGAGAGGCGATTTCATTCCTG 56 35 248antisense TTCACCATCCTGTCCTTGAGAA
PDK4 PDK4 NM_002612.3 sense TCCAGACCAACCAATTCACATC 56 35 194antisense GAACACCACCTCCTCTGTCTGA
FOXO1 FOXO1 NM_002015.3 sense CCTGACCCAAGTGAAGACACCT 56 35 159antisense ATGAACATGCCATCCAAGTCAC
FOXO3 FOXO3 NM_001455.3 sense CTCTCTCTCAGGCTCCTCCTTG 56 35 215antisense CCACGTTCAAACCAACAACATT
PPAR γ PPARG NM_138712.3 sense AGATGACAGCGACTTGGCAATA 56 35 207antisense TCCGTGACAATCTGTCTGAGGT
PGC1 α PPARGC1A NM_013261.3 sense GCCGTGTGATTTATGTCGGTAA 56 35 237antisense GCTTGCGTCCACAAAAGTACAG
SIRT-1 SIRT1 NM_001142498.1 sense GCAGATTAGTAGGCGGCTTGAT 56 35 153antisense CTCTGGCATGTCCCACTATCAC
Mn-SOD SOD2 X14322.1 sense CTGCATCTGTTGGTGTCCAAG 56 35 160antisense TAGTAAGCGTGCTCCCACACAT
HIF-1 α HIF1A NM_001530.3 sense TACTCAAAGTCGGACAGCCTCA 54 35 179antisense TTCGCTTTCTCTGAGCATTCTG
TNF-α TNF NM_000594.3 sense CCATGTTGTAGCAAACCCTCAA 58 35 155antisense CCTTGAAGAGGACCTGGGAGTA
18S RNA18S1 M10098.1 sense GTAACCCGTTGAACCCCATT 62 30 151antisense CCATCCAATCGGTAGTAGCG
Table 1: Genes investigated and amplification data.
Citation: Mendoza-Mari Y, Valdés-Pérez C, Rodríguez-Corrales E, Suárez-Alba J, García-Ojalvo A, et al. (2013) Histological and Transcriptional Expression differences between Diabetic Foot and Pressure Ulcers. J Diabetes Metab 4: 296. doi:10.4172/2155-6156.1000296
Page 4 of 11
Volume 4 • Issue 8 • 1000296J Diabetes MetabISSN: 2155-6156 JDM, an open access journal
Statistical analysis
Statistical analysis of normalized values was carried out using GraphPad Prism 6 for Windows, version 6.01. For gene expression data, normal distribution (Kolmogorov-Smirnov) and variance homogeneity (Brown-Forsythe) tests were performed. Once normality was demonstrated, differences between pressure and diabetic foot ulcers for each gene were analyzed using two-tailed unpaired Student’s t-test. In all cases, p-values <0.05 were considered statistically significant. The values shown represent mean ± S.D. (error bars).
ResultsDemographic characterization of the study population
As shown in Table 2, diabetic foot granulation tissue donors included both genders; in contrast, pressure ulcers samples were solely from male patients who had suffered spine compressive traumas. Although the study population is small, the racial profile is representative of the Cuban ethnicity and for the case of diabetics; the basic disease duration almost tripled the one detected for pressure ulcers. Thus, we succeeded in confronting a substrate of chronicity for the basic disease as for the wounds evolution age. As for the later, all the wounds studied met clinical criteria of non-infection, chronicity given the ulcer bed heterogeneity, and of complexity given the strata depth involvement as illustrated by the grades and stage of each classification scale. Importantly, diabetics’ derived samples included the most important ethiopathogenic classes: neuropathics and ischemics (above 0.5 ankle-brachial index). Furthermore, the samples were taken from a selected population of relatively well-compensated subjects in which at least the acute effects of a hyperglycemic burden may not be an interference factor for gene expression studies. We also ensured to include only pressure ulcer patients with normal glycemia. All these measures, although somewhat tended to reduce the sample size, were necessary to render confident experimental data.
Histological imprinting in pressure and diabetic foot ulcers
Pressure ulcers, ischemic and neuropathic diabetic foot ulcers show
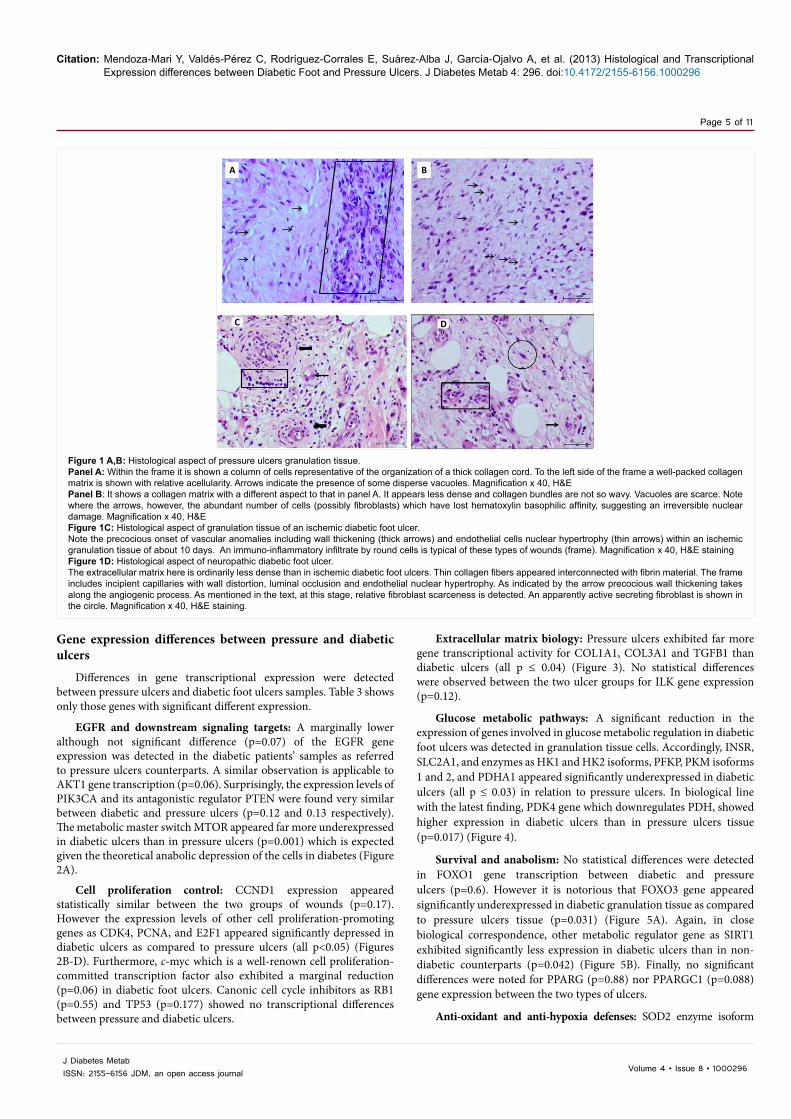
particular histological aspects that seem to distinguish each of these lesions. The granulation tissue sections from the group of pressure ulcers appeared characterized by the presence of thick, densely packed, wavy, and Mallory positive collagen fibers. Scattered fat vacuoles embedded within the granulation tissue were seen along with an outsized hyperplasic epidermal layer at the wound edge indicating epithelial edge migration abortion. Moreover two main qualitative findings appeared notorious: (1) the limited amount of immuno-inflammatory cells infiltrating the granulation tissue as compared to other forms of chronic wounds, and (2) the relative scarcity of fibroblasts in relation to the amount and density of the collagen deposited. The fibroblasts population appeared polarized within the field of evolving collagen bundles. In other microscopic fields, closer to the wound surface, irreversible nuclear changes in fibroblasts were distinguished (Figure 1A and 1B). Ischemic diabetic foot ulcers-derived granulation tissue exhibited the onset of a matrix of hyaline aspect and general scarceness of functional neovessels. An impressive constellation of neo-angiogenesis defects appears since early stages which can be described as: endothelial cells co-opting failure, precocious thickening of vascular wall with hypertrophic tunica media, endothelial cells nuclei hypertrophy, perivascular collagenization, venular lumen collapse, and thick fibrin-like perivascular cuffs. Furthermore a diffuse infiltration of mononuclear cells was observed. Some of these features are shown in Figure 1C. In sharp contrast to the ischemic ulcers-derived material, neuropathic lesions appeared to granulate earlier; exhibiting a poor collagen deposition as a relatively reduced density of extracellular matrix-producing cells (Figure 1D). These neuropathic ulcers matrix often provided the image of a spider web, made up by thin collagen fibers that weakly reacted to Mallory staining. Definitively a substantial difference between both types of wound extracellular matrix was observed. As opposed to ischemic ulcers, a large number of small capillaries were observed, often with endothelial hypertrophy and/or peripheral fibrin cuffs suggesting hyperpermeability. As noted for ischemic diabetic ulcers, these wounds also exhibited an abnormal, mixed inflammatory infiltration.
Variable Diabetic foot ulcers (DFU) Pressure ulcers(PU)
Age (years; mean ± SD) 60.1 ± 15.4 46.2 ± 14.6Male 6 (66.7%) 6 (100%)
Female 3 (33.3%) -Ethnicity All mixed Afro-Cuban All white Latin/Hispanic
Basic disease duration (yrs, mean; range) 15.8 (0.1 - 30) 5.9 (0.6 - 19)
Glycemia level 7.3 ± 1.17 mmol/L ulcer sampling timeHbA1c 7.1 2 ± 1.55%
3.11 ± 0.91 mmol/L ulcer sampling timeHbA1c: ND
Ulcer duration (in days)(mean; range) 50 (36 – 195) 180 (60 – 540)
Ethiopathogenic classification 5 ischemics4 neuropathics Not applicable
Classification (University of Texas DFU scale and NPUAP* staging, respectively)
Grade 3. Stage C: 3 patientsGrade 2. Stage C: 2 patients
_________________Grade 2. Stage A: 3 patientsGrade 3. Stage A: 1 patient
stage IV
NPAUP: National Pressure Ulcer Advisory Panel (United States of America). Stage IV: Full thickness wound with bone, tendon or muscle exposed/damaged.HbA1c: Glycated Hemoglobin; ND: Not Determined.University of Texas Classification for DFUs:Grade 2: Wound penetrating to tendon or capsule. Grade 3: Wound penetrating to bone or joint. Stage A: Non-infected and non-ischemic wound. Stage C: Non-infected, ischemic wound.
Table 2: Demographic characteristic of the chronic ulcers-affected patients.
Citation: Mendoza-Mari Y, Valdés-Pérez C, Rodríguez-Corrales E, Suárez-Alba J, García-Ojalvo A, et al. (2013) Histological and Transcriptional Expression differences between Diabetic Foot and Pressure Ulcers. J Diabetes Metab 4: 296. doi:10.4172/2155-6156.1000296
Page 5 of 11
Volume 4 • Issue 8 • 1000296J Diabetes MetabISSN: 2155-6156 JDM, an open access journal
Gene expression differences between pressure and diabetic ulcers
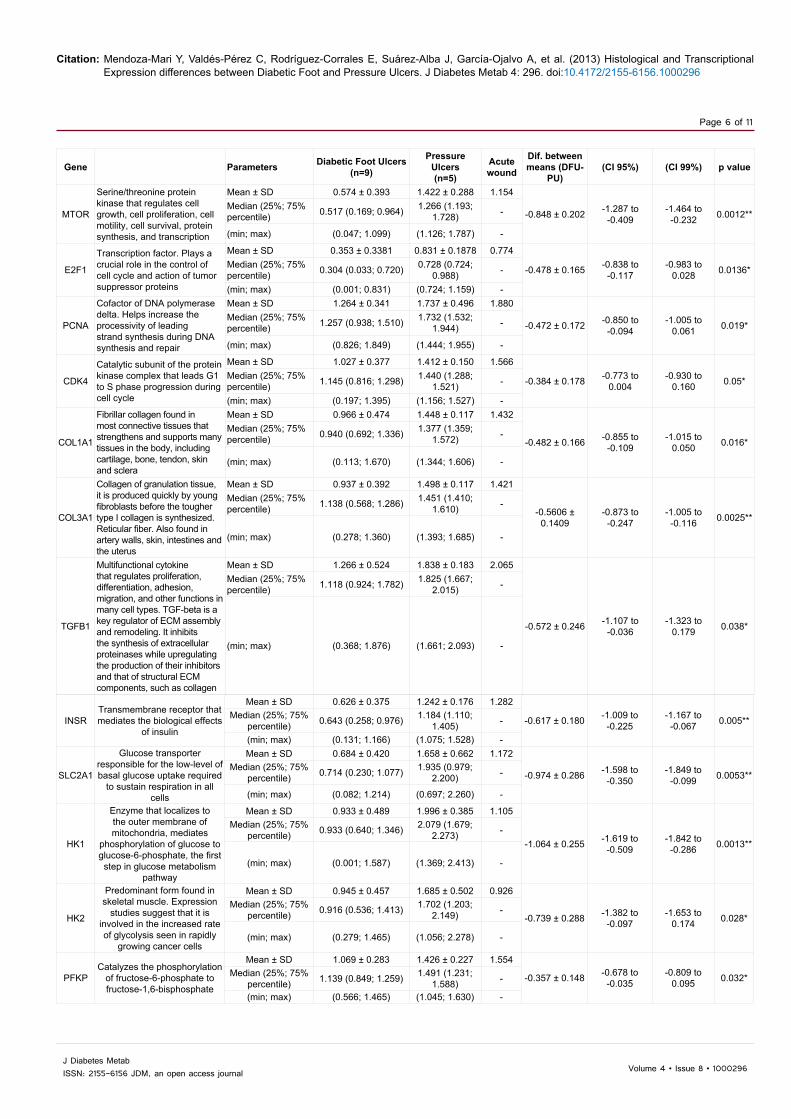
Differences in gene transcriptional expression were detected between pressure ulcers and diabetic foot ulcers samples. Table 3 shows only those genes with significant different expression.
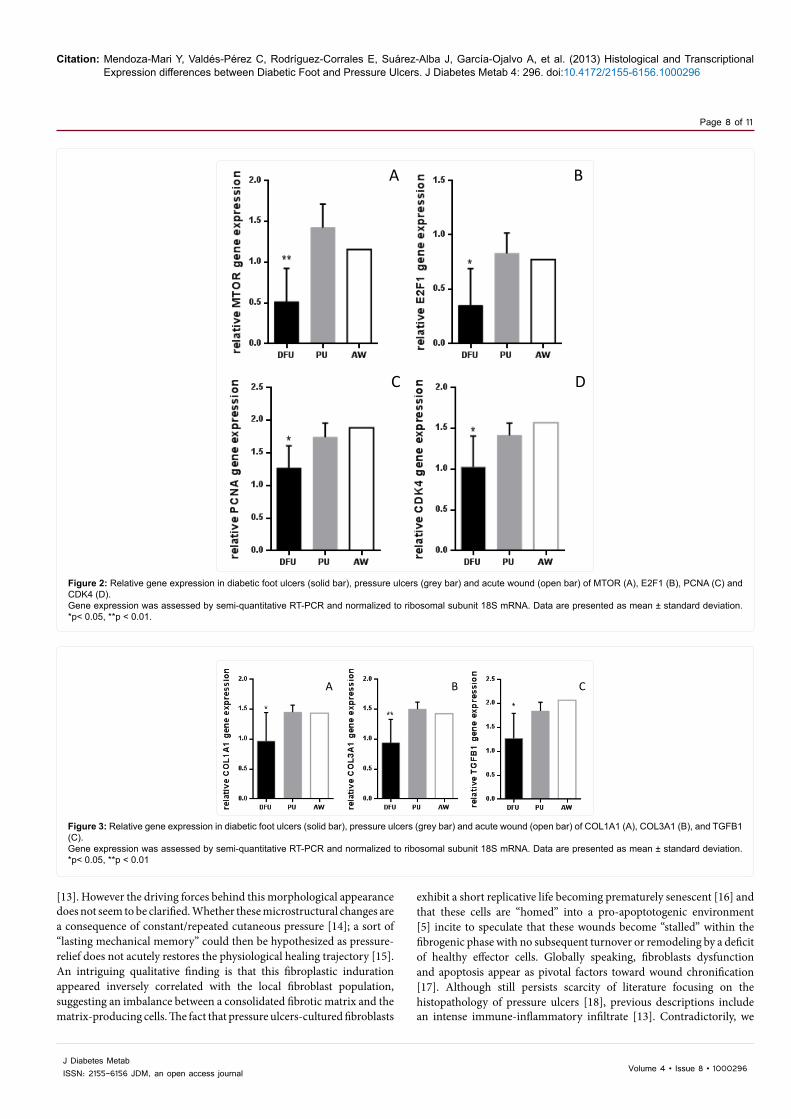
EGFR and downstream signaling targets: A marginally lower although not significant difference (p=0.07) of the EGFR gene expression was detected in the diabetic patients’ samples as referred to pressure ulcers counterparts. A similar observation is applicable to AKT1 gene transcription (p=0.06). Surprisingly, the expression levels of PIK3CA and its antagonistic regulator PTEN were found very similar between diabetic and pressure ulcers (p=0.12 and 0.13 respectively). The metabolic master switch MTOR appeared far more underexpressed in diabetic ulcers than in pressure ulcers (p=0.001) which is expected given the theoretical anabolic depression of the cells in diabetes (Figure 2A).
Cell proliferation control: CCND1 expression appeared statistically similar between the two groups of wounds (p=0.17). However the expression levels of other cell proliferation-promoting genes as CDK4, PCNA, and E2F1 appeared significantly depressed in diabetic ulcers as compared to pressure ulcers (all p<0.05) (Figures 2B-D). Furthermore, c-myc which is a well-renown cell proliferation-committed transcription factor also exhibited a marginal reduction (p=0.06) in diabetic foot ulcers. Canonic cell cycle inhibitors as RB1 (p=0.55) and TP53 (p=0.177) showed no transcriptional differences between pressure and diabetic ulcers.
Extracellular matrix biology: Pressure ulcers exhibited far more gene transcriptional activity for COL1A1, COL3A1 and TGFB1 than diabetic ulcers (all p ≤ 0.04) (Figure 3). No statistical differences were observed between the two ulcer groups for ILK gene expression (p=0.12).
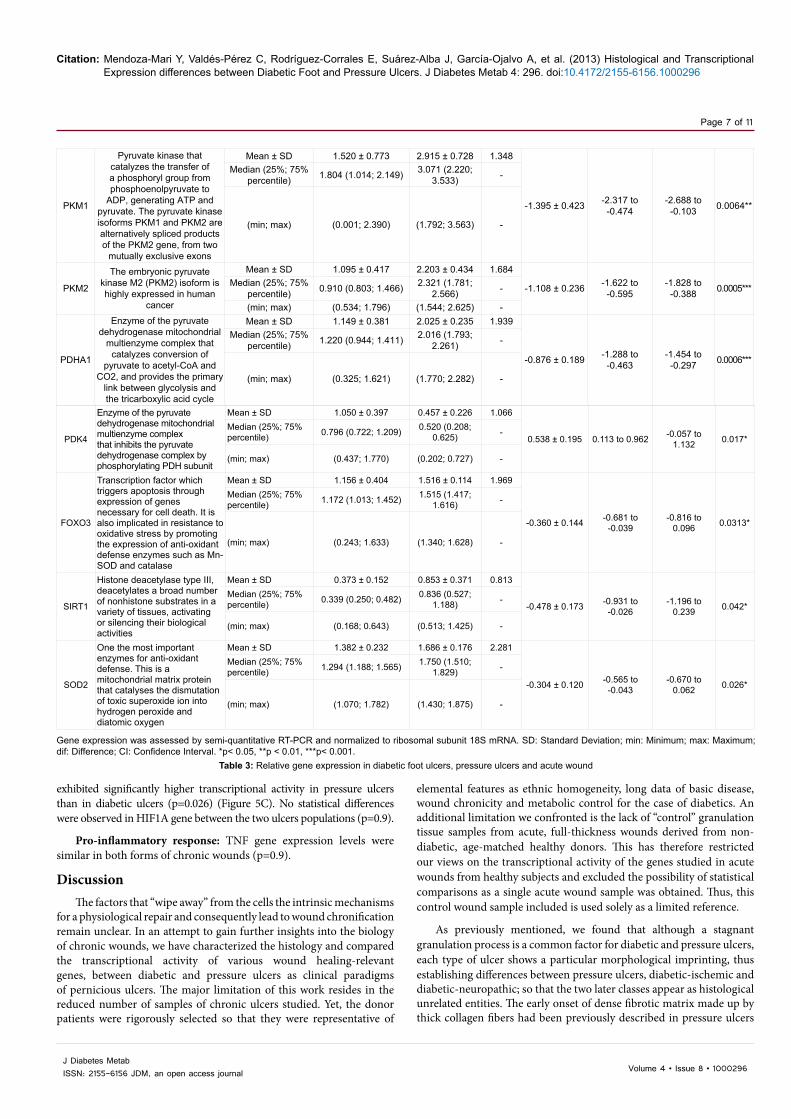
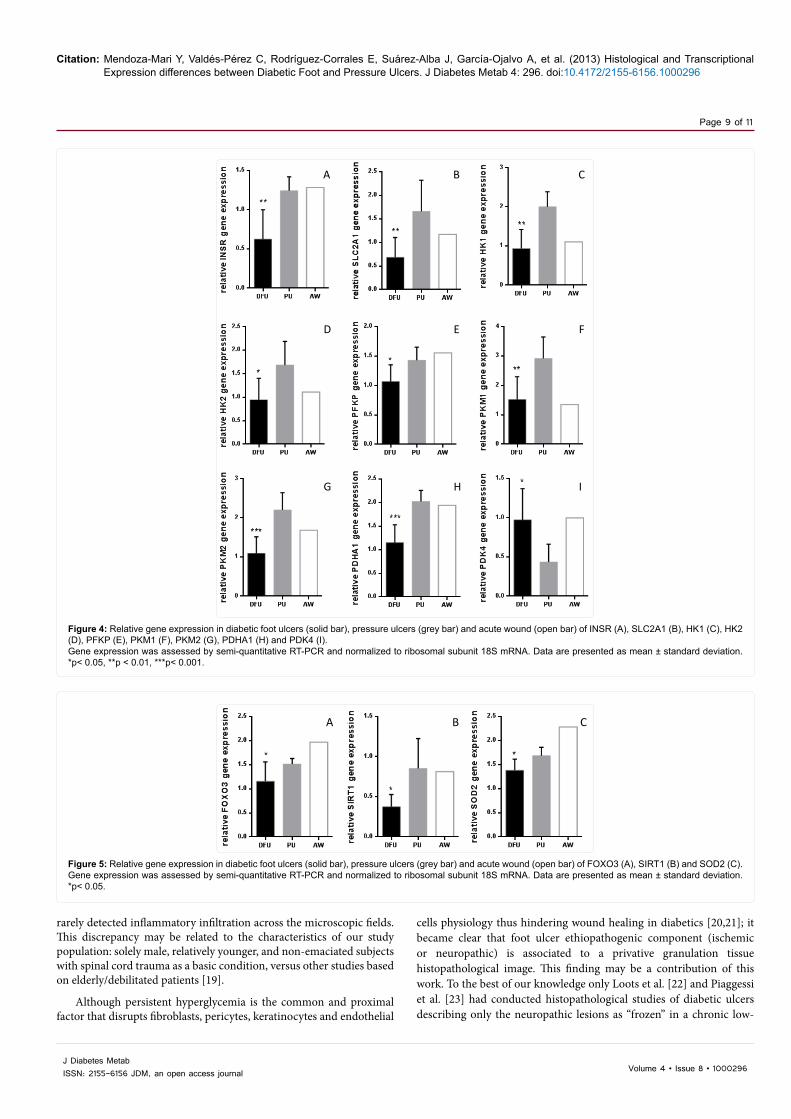
Glucose metabolic pathways: A significant reduction in the expression of genes involved in glucose metabolic regulation in diabetic foot ulcers was detected in granulation tissue cells. Accordingly, INSR, SLC2A1, and enzymes as HK1 and HK2 isoforms, PFKP, PKM isoforms 1 and 2, and PDHA1 appeared significantly underexpressed in diabetic ulcers (all p ≤ 0.03) in relation to pressure ulcers. In biological line with the latest finding, PDK4 gene which downregulates PDH, showed higher expression in diabetic ulcers than in pressure ulcers tissue (p=0.017) (Figure 4).
Survival and anabolism: No statistical differences were detected in FOXO1 gene transcription between diabetic and pressure ulcers (p=0.6). However it is notorious that FOXO3 gene appeared significantly underexpressed in diabetic granulation tissue as compared to pressure ulcers tissue (p=0.031) (Figure 5A). Again, in close biological correspondence, other metabolic regulator gene as SIRT1 exhibited significantly less expression in diabetic ulcers than in non-diabetic counterparts (p=0.042) (Figure 5B). Finally, no significant differences were noted for PPARG (p=0.88) nor PPARGC1 (p=0.088) gene expression between the two types of ulcers.
Anti-oxidant and anti-hypoxia defenses: SOD2 enzyme isoform
A B
C D
Figure 1 A,B: Histological aspect of pressure ulcers granulation tissue.Panel A: Within the frame it is shown a column of cells representative of the organization of a thick collagen cord. To the left side of the frame a well-packed collagen matrix is shown with relative acellularity. Arrows indicate the presence of some disperse vacuoles. Magnification x 40, H&EPanel B: It shows a collagen matrix with a different aspect to that in panel A. It appears less dense and collagen bundles are not so wavy. Vacuoles are scarce. Note where the arrows, however, the abundant number of cells (possibly fibroblasts) which have lost hematoxylin basophilic affinity, suggesting an irreversible nuclear damage. Magnification x 40, H&EFigure 1C: Histological aspect of granulation tissue of an ischemic diabetic foot ulcer. Note the precocious onset of vascular anomalies including wall thickening (thick arrows) and endothelial cells nuclear hypertrophy (thin arrows) within an ischemic granulation tissue of about 10 days. An immuno-inflammatory infiltrate by round cells is typical of these types of wounds (frame). Magnification x 40, H&E stainingFigure 1D: Histological aspect of neuropathic diabetic foot ulcer. The extracellular matrix here is ordinarily less dense than in ischemic diabetic foot ulcers. Thin collagen fibers appeared interconnected with fibrin material. The frame includes incipient capillaries with wall distortion, luminal occlusion and endothelial nuclear hypertrophy. As indicated by the arrow precocious wall thickening takes along the angiogenic process. As mentioned in the text, at this stage, relative fibroblast scarceness is detected. An apparently active secreting fibroblast is shown in the circle. Magnification x 40, H&E staining.
Citation: Mendoza-Mari Y, Valdés-Pérez C, Rodríguez-Corrales E, Suárez-Alba J, García-Ojalvo A, et al. (2013) Histological and Transcriptional Expression differences between Diabetic Foot and Pressure Ulcers. J Diabetes Metab 4: 296. doi:10.4172/2155-6156.1000296
Page 6 of 11
Volume 4 • Issue 8 • 1000296J Diabetes MetabISSN: 2155-6156 JDM, an open access journal
Gene Parameters Diabetic Foot Ulcers(n=9)
Pressure Ulcers(n=5)
Acute wound
Dif. between means (DFU-
PU)(CI 95%) (CI 99%) p value
MTOR
Serine/threonine protein kinase that regulates cell growth, cell proliferation, cell motility, cell survival, protein synthesis, and transcription
Mean ± SD 0.574 ± 0.393 1.422 ± 0.288 1.154
-0.848 ± 0.202 -1.287 to -0.409
-1.464 to -0.232 0.0012**
Median (25%; 75% percentile) 0.517 (0.169; 0.964) 1.266 (1.193;
1.728) -
(min; max) (0.047; 1.099) (1.126; 1.787) -
E2F1
Transcription factor. Plays a crucial role in the control of cell cycle and action of tumor suppressor proteins
Mean ± SD 0.353 ± 0.3381 0.831 ± 0.1878 0.774
-0.478 ± 0.165 -0.838 to -0.117
-0.983 to 0.028 0.0136*Median (25%; 75%
percentile) 0.304 (0.033; 0.720) 0.728 (0.724; 0.988) -
(min; max) (0.001; 0.831) (0.724; 1.159) -
PCNA
Cofactor of DNA polymerase delta. Helps increase the processivity of leading strand synthesis during DNA synthesis and repair
Mean ± SD 1.264 ± 0.341 1.737 ± 0.496 1.880
-0.472 ± 0.172 -0.850 to -0.094
-1.005 to 0.061 0.019*
Median (25%; 75% percentile) 1.257 (0.938; 1.510) 1.732 (1.532;
1.944) -
(min; max) (0.826; 1.849) (1.444; 1.955) -
CDK4
Catalytic subunit of the protein kinase complex that leads G1 to S phase progression during cell cycle
Mean ± SD 1.027 ± 0.377 1.412 ± 0.150 1.566
-0.384 ± 0.178 -0.773 to 0.004
-0.930 to 0.160 0.05*Median (25%; 75%
percentile) 1.145 (0.816; 1.298) 1.440 (1.288; 1.521) -
(min; max) (0.197; 1.395) (1.156; 1.527) -
COL1A1
Fibrillar collagen found in most connective tissues that strengthens and supports many tissues in the body, including cartilage, bone, tendon, skin and sclera
Mean ± SD 0.966 ± 0.474 1.448 ± 0.117 1.432
-0.482 ± 0.166 -0.855 to -0.109
-1.015 to 0.050 0.016*
Median (25%; 75% percentile) 0.940 (0.692; 1.336) 1.377 (1.359;
1.572) -
(min; max) (0.113; 1.670) (1.344; 1.606) -
COL3A1
Collagen of granulation tissue, it is produced quickly by young fibroblasts before the tougher type I collagen is synthesized. Reticular fiber. Also found in artery walls, skin, intestines and the uterus
Mean ± SD 0.937 ± 0.392 1.498 ± 0.117 1.421
-0.5606 ± 0.1409
-0.873 to -0.247
-1.005 to -0.116 0.0025**
Median (25%; 75% percentile) 1.138 (0.568; 1.286) 1.451 (1.410;
1.610) -
(min; max) (0.278; 1.360) (1.393; 1.685) -
TGFB1
Multifunctional cytokine that regulates proliferation, differentiation, adhesion, migration, and other functions in many cell types. TGF-beta is a key regulator of ECM assembly and remodeling. It inhibits the synthesis of extracellular proteinases while upregulating the production of their inhibitors and that of structural ECM components, such as collagen
Mean ± SD 1.266 ± 0.524 1.838 ± 0.183 2.065
-0.572 ± 0.246 -1.107 to -0.036
-1.323 to 0.179 0.038*
Median (25%; 75% percentile) 1.118 (0.924; 1.782) 1.825 (1.667;
2.015) -
(min; max) (0.368; 1.876) (1.661; 2.093) -
INSRTransmembrane receptor that mediates the biological effects
of insulin
Mean ± SD 0.626 ± 0.375 1.242 ± 0.176 1.282
-0.617 ± 0.180 -1.009 to -0.225
-1.167 to -0.067 0.005**Median (25%; 75%
percentile) 0.643 (0.258; 0.976) 1.184 (1.110; 1.405) -
(min; max) (0.131; 1.166) (1.075; 1.528) -
SLC2A1
Glucose transporter responsible for the low-level of basal glucose uptake required
to sustain respiration in all cells
Mean ± SD 0.684 ± 0.420 1.658 ± 0.662 1.172
-0.974 ± 0.286 -1.598 to -0.350
-1.849 to -0.099 0.0053**
Median (25%; 75% percentile) 0.714 (0.230; 1.077) 1.935 (0.979;
2.200) -
(min; max) (0.082; 1.214) (0.697; 2.260) -
HK1
Enzyme that localizes to the outer membrane of mitochondria, mediates
phosphorylation of glucose to glucose-6-phosphate, the first step in glucose metabolism
pathway
Mean ± SD 0.933 ± 0.489 1.996 ± 0.385 1.105
-1.064 ± 0.255 -1.619 to -0.509
-1.842 to -0.286 0.0013**
Median (25%; 75% percentile) 0.933 (0.640; 1.346) 2.079 (1.679;
2.273) -
(min; max) (0.001; 1.587) (1.369; 2.413) -
HK2
Predominant form found in skeletal muscle. Expression
studies suggest that it is involved in the increased rate of glycolysis seen in rapidly
growing cancer cells
Mean ± SD 0.945 ± 0.457 1.685 ± 0.502 0.926
-0.739 ± 0.288 -1.382 to -0.097
-1.653 to 0.174 0.028*
Median (25%; 75% percentile) 0.916 (0.536; 1.413) 1.702 (1.203;
2.149) -
(min; max) (0.279; 1.465) (1.056; 2.278) -
PFKPCatalyzes the phosphorylation
of fructose-6-phosphate to fructose-1,6-bisphosphate
Mean ± SD 1.069 ± 0.283 1.426 ± 0.227 1.554
-0.357 ± 0.148 -0.678 to -0.035
-0.809 to 0.095 0.032*Median (25%; 75%
percentile) 1.139 (0.849; 1.259) 1.491 (1.231; 1.588) -
(min; max) (0.566; 1.465) (1.045; 1.630) -
Citation: Mendoza-Mari Y, Valdés-Pérez C, Rodríguez-Corrales E, Suárez-Alba J, García-Ojalvo A, et al. (2013) Histological and Transcriptional Expression differences between Diabetic Foot and Pressure Ulcers. J Diabetes Metab 4: 296. doi:10.4172/2155-6156.1000296
Page 7 of 11
Volume 4 • Issue 8 • 1000296J Diabetes MetabISSN: 2155-6156 JDM, an open access journal
exhibited significantly higher transcriptional activity in pressure ulcers than in diabetic ulcers (p=0.026) (Figure 5C). No statistical differences were observed in HIF1A gene between the two ulcers populations (p=0.9).
Pro-inflammatory response: TNF gene expression levels were similar in both forms of chronic wounds (p=0.9).
DiscussionThe factors that “wipe away” from the cells the intrinsic mechanisms
for a physiological repair and consequently lead to wound chronification remain unclear. In an attempt to gain further insights into the biology of chronic wounds, we have characterized the histology and compared the transcriptional activity of various wound healing-relevant genes, between diabetic and pressure ulcers as clinical paradigms of pernicious ulcers. The major limitation of this work resides in the reduced number of samples of chronic ulcers studied. Yet, the donor patients were rigorously selected so that they were representative of
elemental features as ethnic homogeneity, long data of basic disease, wound chronicity and metabolic control for the case of diabetics. An additional limitation we confronted is the lack of “control” granulation tissue samples from acute, full-thickness wounds derived from non-diabetic, age-matched healthy donors. This has therefore restricted our views on the transcriptional activity of the genes studied in acute wounds from healthy subjects and excluded the possibility of statistical comparisons as a single acute wound sample was obtained. Thus, this control wound sample included is used solely as a limited reference.
As previously mentioned, we found that although a stagnant granulation process is a common factor for diabetic and pressure ulcers, each type of ulcer shows a particular morphological imprinting, thus establishing differences between pressure ulcers, diabetic-ischemic and diabetic-neuropathic; so that the two later classes appear as histological unrelated entities. The early onset of dense fibrotic matrix made up by thick collagen fibers had been previously described in pressure ulcers
Gene expression was assessed by semi-quantitative RT-PCR and normalized to ribosomal subunit 18S mRNA. SD: Standard Deviation; min: Minimum; max: Maximum; dif: Difference; CI: Confidence Interval. *p< 0.05, **p < 0.01, ***p< 0.001.
Table 3: Relative gene expression in diabetic foot ulcers, pressure ulcers and acute wound
PDK4
Enzyme of the pyruvate dehydrogenase mitochondrial multienzyme complex that inhibits the pyruvate dehydrogenase complex by phosphorylating PDH subunit
Mean ± SD 1.050 ± 0.397 0.457 ± 0.226 1.066
0.538 ± 0.195 0.113 to 0.962 -0.057 to 1.132 0.017*
Median (25%; 75% percentile) 0.796 (0.722; 1.209) 0.520 (0.208;
0.625) -
(min; max) (0.437; 1.770) (0.202; 0.727) -
FOXO3
Transcription factor which triggers apoptosis through expression of genes necessary for cell death. It is also implicated in resistance to oxidative stress by promoting the expression of anti-oxidant defense enzymes such as Mn-SOD and catalase
Mean ± SD 1.156 ± 0.404 1.516 ± 0.114 1.969
-0.360 ± 0.144 -0.681 to -0.039
-0.816 to 0.096 0.0313*
Median (25%; 75% percentile) 1.172 (1.013; 1.452) 1.515 (1.417;
1.616) -
(min; max) (0.243; 1.633) (1.340; 1.628) -
SIRT1
Histone deacetylase type III, deacetylates a broad number of nonhistone substrates in a variety of tissues, activating or silencing their biological activities
Mean ± SD 0.373 ± 0.152 0.853 ± 0.371 0.813
-0.478 ± 0.173 -0.931 to -0.026
-1.196 to 0.239 0.042*
Median (25%; 75% percentile) 0.339 (0.250; 0.482) 0.836 (0.527;
1.188) -
(min; max) (0.168; 0.643) (0.513; 1.425) -
SOD2
One the most important enzymes for anti-oxidant defense. This is a mitochondrial matrix protein that catalyses the dismutation of toxic superoxide ion into hydrogen peroxide and diatomic oxygen
Mean ± SD 1.382 ± 0.232 1.686 ± 0.176 2.281
-0.304 ± 0.120 -0.565 to -0.043
-0.670 to 0.062 0.026*
Median (25%; 75% percentile) 1.294 (1.188; 1.565) 1.750 (1.510;
1.829) -
(min; max) (1.070; 1.782) (1.430; 1.875) -
PKM1
Pyruvate kinase that catalyzes the transfer of a phosphoryl group from phosphoenolpyruvate to
ADP, generating ATP and pyruvate. The pyruvate kinase isoforms PKM1 and PKM2 are alternatively spliced products of the PKM2 gene, from two
mutually exclusive exons
Mean ± SD 1.520 ± 0.773 2.915 ± 0.728 1.348
-1.395 ± 0.423 -2.317 to -0.474
-2.688 to -0.103 0.0064**
Median (25%; 75% percentile) 1.804 (1.014; 2.149) 3.071 (2.220;
3.533) -
(min; max) (0.001; 2.390) (1.792; 3.563) -
PKM2
The embryonic pyruvate kinase M2 (PKM2) isoform is highly expressed in human
cancer
Mean ± SD 1.095 ± 0.417 2.203 ± 0.434 1.684
-1.108 ± 0.236 -1.622 to -0.595
-1.828 to -0.388 0.0005***Median (25%; 75%
percentile) 0.910 (0.803; 1.466) 2.321 (1.781; 2.566) -
(min; max) (0.534; 1.796) (1.544; 2.625) -
PDHA1
Enzyme of the pyruvate dehydrogenase mitochondrial
multienzyme complex that catalyzes conversion of
pyruvate to acetyl-CoA and CO2, and provides the primary
link between glycolysis and the tricarboxylic acid cycle
Mean ± SD 1.149 ± 0.381 2.025 ± 0.235 1.939
-0.876 ± 0.189 -1.288 to -0.463
-1.454 to -0.297 0.0006***
Median (25%; 75% percentile) 1.220 (0.944; 1.411) 2.016 (1.793;
2.261) -
(min; max) (0.325; 1.621) (1.770; 2.282) -
Citation: Mendoza-Mari Y, Valdés-Pérez C, Rodríguez-Corrales E, Suárez-Alba J, García-Ojalvo A, et al. (2013) Histological and Transcriptional Expression differences between Diabetic Foot and Pressure Ulcers. J Diabetes Metab 4: 296. doi:10.4172/2155-6156.1000296
Page 8 of 11
Volume 4 • Issue 8 • 1000296J Diabetes MetabISSN: 2155-6156 JDM, an open access journal
[13]. However the driving forces behind this morphological appearance does not seem to be clarified. Whether these microstructural changes are a consequence of constant/repeated cutaneous pressure [14]; a sort of “lasting mechanical memory” could then be hypothesized as pressure-relief does not acutely restores the physiological healing trajectory [15]. An intriguing qualitative finding is that this fibroplastic induration appeared inversely correlated with the local fibroblast population, suggesting an imbalance between a consolidated fibrotic matrix and the matrix-producing cells. The fact that pressure ulcers-cultured fibroblasts
exhibit a short replicative life becoming prematurely senescent [16] and that these cells are “homed” into a pro-apoptotogenic environment [5] incite to speculate that these wounds become “stalled” within the fibrogenic phase with no subsequent turnover or remodeling by a deficit of healthy effector cells. Globally speaking, fibroblasts dysfunction and apoptosis appear as pivotal factors toward wound chronification [17]. Although still persists scarcity of literature focusing on the histopathology of pressure ulcers [18], previous descriptions include an intense immune-inflammatory infiltrate [13]. Contradictorily, we
A B
C D
Figure 2: Relative gene expression in diabetic foot ulcers (solid bar), pressure ulcers (grey bar) and acute wound (open bar) of MTOR (A), E2F1 (B), PCNA (C) and CDK4 (D). Gene expression was assessed by semi-quantitative RT-PCR and normalized to ribosomal subunit 18S mRNA. Data are presented as mean ± standard deviation. *p< 0.05, **p < 0.01.
A B C
Figure 3: Relative gene expression in diabetic foot ulcers (solid bar), pressure ulcers (grey bar) and acute wound (open bar) of COL1A1 (A), COL3A1 (B), and TGFB1 (C). Gene expression was assessed by semi-quantitative RT-PCR and normalized to ribosomal subunit 18S mRNA. Data are presented as mean ± standard deviation. *p< 0.05, **p < 0.01
Citation: Mendoza-Mari Y, Valdés-Pérez C, Rodríguez-Corrales E, Suárez-Alba J, García-Ojalvo A, et al. (2013) Histological and Transcriptional Expression differences between Diabetic Foot and Pressure Ulcers. J Diabetes Metab 4: 296. doi:10.4172/2155-6156.1000296
Page 9 of 11
Volume 4 • Issue 8 • 1000296J Diabetes MetabISSN: 2155-6156 JDM, an open access journal
rarely detected inflammatory infiltration across the microscopic fields. This discrepancy may be related to the characteristics of our study population: solely male, relatively younger, and non-emaciated subjects with spinal cord trauma as a basic condition, versus other studies based on elderly/debilitated patients [19].
Although persistent hyperglycemia is the common and proximal factor that disrupts fibroblasts, pericytes, keratinocytes and endothelial
cells physiology thus hindering wound healing in diabetics [20,21]; it became clear that foot ulcer ethiopathogenic component (ischemic or neuropathic) is associated to a privative granulation tissue histopathological image. This finding may be a contribution of this work. To the best of our knowledge only Loots et al. [22] and Piaggessi et al. [23] had conducted histopathological studies of diabetic ulcers describing only the neuropathic lesions as “frozen” in a chronic low-
A B C
D E F
G H I
Figure 4: Relative gene expression in diabetic foot ulcers (solid bar), pressure ulcers (grey bar) and acute wound (open bar) of INSR (A), SLC2A1 (B), HK1 (C), HK2 (D), PFKP (E), PKM1 (F), PKM2 (G), PDHA1 (H) and PDK4 (I). Gene expression was assessed by semi-quantitative RT-PCR and normalized to ribosomal subunit 18S mRNA. Data are presented as mean ± standard deviation. *p< 0.05, **p < 0.01, ***p< 0.001.
A B C
Figure 5: Relative gene expression in diabetic foot ulcers (solid bar), pressure ulcers (grey bar) and acute wound (open bar) of FOXO3 (A), SIRT1 (B) and SOD2 (C). Gene expression was assessed by semi-quantitative RT-PCR and normalized to ribosomal subunit 18S mRNA. Data are presented as mean ± standard deviation. *p< 0.05.

Citation: Mendoza-Mari Y, Valdés-Pérez C, Rodríguez-Corrales E, Suárez-Alba J, García-Ojalvo A, et al. (2013) Histological and Transcriptional Expression differences between Diabetic Foot and Pressure Ulcers. J Diabetes Metab 4: 296. doi:10.4172/2155-6156.1000296
Page 10 of 11
Volume 4 • Issue 8 • 1000296J Diabetes MetabISSN: 2155-6156 JDM, an open access journal
grade inflammatory state associated to a scarce provisional extracellular matrix. These studies did not include ischemics-derived samples. The mechanisms mediating the differences of each type of extracellular matrix, angiogenic response, its organization and density; and even in fibroblasts cytology appear far to be elucidated. Similarly, it remains to be explained how and why, long-term evolution events like diabetic microvascular disease (i.e., media thickening or neointimal hypertrophy) can be so rapidly recreated by a growing neovessel within an incipient granulation tissue. Since the most aberrant morphological changes we found emerged from ischemic granulation tissue samples; hypoxia and its downstream biochemical disturbances could be raised as an instrumental ethiopathogenic ingredient for these vascular aberrancies.
The data derived from statistical comparisons described above indicate that the expression of different functional classes of genes, appear far more affected in diabetic patients ulcer cells rather than in decubitus ulcers counterparts. EGFR and some of its downstream phosphorylation targets were selected as paradigms of tyrosine kinase signaling pathways which may be disrupted by hyperglycemia [24]. Globally speaking our evidences support the notion that these pathways are dysfunctional in diabetic wound cells as compared to decubitus ulcers. This alteration has been attributed to glucose toxicity, receptors’ non-enzymatic glycation or by the local inflammation [10,25,26] all of which appear to reduce kinase receptors phosphorylation activation. Furthermore, although we found no significant differences in the expression of two major cell proliferation cycle inhibitors (TP53 and RB1) between diabetic and pressure ulcers; critical mitosis promoters as CDK4, PCNA and E2F1 appeared underexpressed by diabetic wound cells. CDK4 and PCNA expression failure have been previously invoked as molecular markers of chronic wounds fibroblasts proliferation reluctance [27,28]. In line with these findings is that TGF-β1 appears significantly down-regulated in diabetic ulcers as compared to pressure ulcers. This growth factor is a well-reputed actor for fibroblasts proliferation, migration and secretion, which offers theoretical explanation for the remarkable transcriptional reduction in collagens I and III as for the fibroblasts proliferation promoters, observed in the diabetic wound samples [29]. As curious note with no major biological translation, the expression of all the above mentioned genes was arithmetically similar between pressure ulcers and the single acute-wound granulation tissue sample.
Perhaps, the most relevant contribution of this work with no previous anticipation in the field; is that we found that diabetic granulation tissue cells, although “de novo” cells exhibit a sort of “genetic or epigenetic imprinting” for the deranged expression of glucose-metabolism related genes which have been largely implicated in type-2 diabetes pathophysiology [30]. As compared to decubitus ulcers, diabetic wound cells express far less insulin receptor, hexokinase isoforms 1 and 2, phosphofructokinase, pyruvate kinase isoforms 1 and 2, pyruvate dehydrogenase, and significantly more of its inhibitor enzyme pyruvate dehydrogenase kinase isoform 4. Interestingly, all of them have been considered as molecular markers of insulin resistance, glucose intolerance and predictors for the onset of type-2 diabetes [30]. Most remarkable is the fact that all of these and other genes deregulations had solely been described in the liver, skeletal muscle and adipose tissue as the most important glucose consumers and major insulin targets [30-32]. Thus, for the first time it is shown that a transient, de novo multicellular material, as the diabetic granulation tissue, somewhat “inherits” and reflects the same molecular derangements detected in the most important glucose clearance tissues/organs. In other words, granulation tissue, despite its early age, is also a diabetic
tissue. Again, and as a curious comment, all these genes exhibit similar expression between decubitus granulation tissue and the single-acute granulation tissue control sample; suggesting that the above described derangements are diabetics’ privative traits.
Although we found no differences between pressure and diabetic ulcers in critical genes involved in energy homeostasis and cytoprotection as PPARG and PPARGC1; a complementary finding around the metabolic disorders that prevail in diabetic granulation tissue is the significant underexpression of other important genes such as FOXO3 and SIRT1. The observation that SOD2 expression is significantly lower in diabetic granulation tissue, may contribute to explain the well-described pathogenic role of the pro-oxidant environment in diabetic complications [33]. The fact that FOXO transcription factors reduce the level of oxidative stress by the transcriptional induction of SOD [34] may assist us to explain why SOD2 appeared underexpressed in diabetic wound samples. A meaningful finding to suggest that diabetic granulation tissue cells may be under a negative pro-anabolic and energetic balance is supported by the complementary underexpression of SIRT1. SIRT1 is known to regulate metabolism, to stimulate mitochondrial protein synthesis and activity, as to selectively regulate FOXO to certain targets genes involved in cells self-defense [35]. Taken together these data incite to suggest that diabetic foot ulcer cells may be endowed with a myriad of molecular disorders that may encompass from insulin receptor underexpression to mitochondrial functional failure.
This study, has allowed for a more comprehensive idea of the intrinsic histological aspects of different types of chronic ulcers, has offered a broader notion of the transcriptional profile of wound healing and metabolically-relevant genes, and has further strengthened our hypothesis that wound chronification is a distal destiny reachable from different or alternative roads. It has the merit to show for the first time that not only the major glucose-clearance organs, but the young-aged granulation tissue cells also exhibit a molecular “imprinting” toward glucose homeostasis failure. Moreover, we still miss however to gain a major enlightening on the core of pressure ulcers pathobiology.
References
1. Pfeffer F, von Dobschuetz E, Riediger H, Moosmann C, Hopt UT (2004) [The non-healing wound]. MMW Fortschr Med 146: 45-48.
2. Cordeiro MB, Antonelli EJ, da Cunha DF, Júnior AA, Júnior VR, et al. (2005) Oxidative stress and acute-phase response in patients with pressure sores. Nutrition 21: 901-907.
3. Levine JM (1992) Historical notes on pressure ulcers: the cure of Ambrose Paré. Decubitus 5: 23-24, 26.
4. Jaul E (2010) Assessment and management of pressure ulcers in the elderly: current strategies. Drugs Aging 27: 311-325.
5. Jiang L, Zhang E, Yang Y, Zhang C, Fu X, et al. (2012) Effectiveness of apoptotic factors expressed on the wounds of patients with stage III pressure ulcers. J Wound Ostomy Continence Nurs 39: 391-396.
6. Yager DR, Zhang LY, Liang HX, Diegelmann RF, Cohen IK (1996) Wound fluids from human pressure ulcers contain elevated matrix metalloproteinase levels and activity compared to surgical wound fluids. J Invest Dermatol 107: 743-748.
7. Cruse JM, Wang H, Lewis RE, Cespedes J, Morrison RS 3rd, et al. (2002) Cellular and molecular alterations in spinal cord injury patients with pressure ulcers: a preliminary report. Exp Mol Pathol 72: 124-131.
8. Sisco M, Liu WR, Kryger ZB, Mustoe TA (2007) Reduced up-regulation of cytoprotective genes in rat cutaneous tissue during the second cycle of ischemia-reperfusion. Wound Repair Regen 15: 203-212.
9. Berlanga J, Valdéz C, Savigne W, Mendoza Y, Franco N, et al. (2010) Cellular and molecular insights into the wound healing mechanism in diabetes. Biotecnología Aplicada 27: 255-261.
Citation: Mendoza-Mari Y, Valdés-Pérez C, Rodríguez-Corrales E, Suárez-Alba J, García-Ojalvo A, et al. (2013) Histological and Transcriptional Expression differences between Diabetic Foot and Pressure Ulcers. J Diabetes Metab 4: 296. doi:10.4172/2155-6156.1000296
Page 11 of 11
Volume 4 • Issue 8 • 1000296J Diabetes MetabISSN: 2155-6156 JDM, an open access journal
10. Berlanga-Acosta JB, Schultz GS, López-Mola E, Guillén-Nieto GE, García-Siverio M, et al. (2013) Glucose Toxic Effects on Granulation Tissue Productive Cells: The Diabetics’ Impaired Healing. Biomed Research International.
11. (2000) National Pressure Ulcer Advisory Panel: Pressure ulcer definition and etiology.
12. Armstrong DG, Lavery LA (1998) Diabetic foot ulcers: prevention, diagnosisand classification. Am Fam Physician 57: 1325-1332, 1337-8.
13. Vande Berg JS, Rudolph R (1995) Pressure (decubitus) ulcer: variation inhistopathology--a light and electron microscope study. Hum Pathol 26: 195-200.
14. Huang L, Nakagami G, Minematsu T, Kinoshita A, Sugama J, et al. (2010)Ulceration and Delayed Healing Following Pressure Loading in Hyperglycemic Rats With an Immature Dermal Collagen Fiber Network. Wounds 22: 237-244.
15. Edsberg LE, Cutway R, Anain S, Natiella JR (2000) Microstructural andmechanical characterization of human tissue at and adjacent to pressureulcers. J Rehabil Res Dev 37: 463-471.
16. Vande Berg JS, Rose MA, Haywood-Reid PL, Rudolph R, Payne WG, etal. (2005) Cultured pressure ulcer fibroblasts show replicative senescence with elevated production of plasmin, plasminogen activator inhibitor-1, andtransforming growth factor-beta1. Wound Repair Regen 13: 76-83.
17. Wall IB, Moseley R, Baird DM, Kipling D, Giles P, et al. (2008) Fibroblastdysfunction is a key factor in the non-healing of chronic venous leg ulcers. JInvest Dermatol 128: 2526-2540.
18. Edsberg LE (2007) Pressure ulcer tissue histology: an appraisal of currentknowledge. Ostomy Wound Manage 53: 40-49.
19. Seiler WO, Stähelin HB (1986) Recent findings on decubitus ulcer pathology: implications for care. Geriatrics 41: 47-50, 53-7, 60.
20. Stojadinovic O, Brem H, Vouthounis C, Lee B, Fallon J, et al. (2005) Molecular pathogenesis of chronic wounds: the role of beta-catenin and c-myc in theinhibition of epithelialization and wound healing. Am J Pathol 167: 59-69.
21. Tomic-Canic M, Ayello EA, Stojadinovic O, Golinko MS, Brem H (2008) Usinggene transcription patterns (bar coding scans) to guide wound debridementand healing. Adv Skin Wound Care 21: 487-492.
22. Loots MA, Lamme EN, Zeegelaar J, Mekkes JR, Bos JD, et al. (1998)Differences in cellular infiltrate and extracellular matrix of chronic diabetic and venous ulcers versus acute wounds. J Invest Dermatol 111: 850-857.
23. Piaggesi A, Viacava P, Rizzo L, Naccarato G, Baccetti F, et al. (2003)Semiquantitative analysis of the histopathological features of the neuropathicfoot ulcer: effects of pressure relief. Diabetes Care 26: 3123-3128.
24. Bazley LA, Gullick WJ (2005) The epidermal growth factor receptor family.Endocr Relat Cancer 12: S17-27.
25. Hehenberger K, Hansson A (1997) High glucose-induced growth factorresistance in human fibroblasts can be reversed by antioxidants and protein kinase C-inhibitors. Cell Biochem Funct 15: 197-201.
26. Lamers ML, Almeida ME, Vicente-Manzanares M, Horwitz AF, Santos MF(2011) High glucose-mediated oxidative stress impairs cell migration. PLoSOne 6: e22865.
27. Vande Berg JS, Rose MA, Payne WG, Haywood-Reid PL, Robson MC (2003)Significance of cell cycle for wound stratification in clinical trials: analysis of a pressure ulcer clinical trial utilizing cyclin D/cdk4. Wound Repair Regen 11:11-18.
28. Wang CJ, Ko JY, Kuo YR, Yang YJ (2011) Molecular changes in diabetic footulcers. Diabetes Res Clin Pract 94: 105-110.
29. Mi Q, Rivière B, Clermont G, Steed DL, Vodovotz Y (2007) Agent-based model of inflammation and wound healing: insights into diabetic foot ulcer pathology and the role of transforming growth factor-beta1. Wound Repair Regen 15: 671-682.
30. Bouché C, Serdy S, Kahn CR, Goldfine AB (2004) The cellular fate of glucose and its relevance in type 2 diabetes. Endocr Rev 25: 807-830.
31. Taniguchi CM, Emanuelli B, Kahn CR (2006) Critical nodes in signallingpathways: insights into insulin action. Nat Rev Mol Cell Biol 7: 85-96.
32. Roussel D, Dumas JF, Simard G, Malthièry Y, Ritz P (2004) Kinetics and control of oxidative phosphorylation in rat liver mitochondria after dexamethasonetreatment. Biochem J 382: 491-499.
33. Giacco F, Brownlee M (2010) Oxidative stress and diabetic complications. Circ Res 107: 1058-1070.
34. Kops GJ, Dansen TB, Polderman PE, Saarloos I, Wirtz KW, et al. (2002)Forkhead transcription factor FOXO3a protects quiescent cells from oxidativestress. Nature 419: 316-321.
35. Brunet A, Sweeney LB, Sturgill JF, Chua KF, Greer PL, et al. (2004) Stress-dependent regulation of FOXO transcription factors by the SIRT1 deacetylase. Science 303: 2011-2015.
Related Documents
![Differences in the Histopathology and Cytokine Expression ... · cally damaged integument . The histological differences between the two states are mainly attributed to di[9] f- The](https://static.cupdf.com/doc/110x72/5e0957154651ca1248525d1a/differences-in-the-histopathology-and-cytokine-expression-cally-damaged-integument.jpg)