This article was downloaded by: [Anil Haritash] On: 14 November 2012, At: 09:43 Publisher: Taylor & Francis Informa Ltd Registered in England and Wales Registered Number: 1072954 Registered office: Mortimer House, 37-41 Mortimer Street, London W1T 3JH, UK Polycyclic Aromatic Compounds Publication details, including instructions for authors and subscription information: http://www.tandfonline.com/loi/gpol20 Association of Polycyclic Aromatic Hydrocarbons (PAHs) with Different Sizes of Atmospheric Particulate in Hisar City and its Health Aspects C. P. KAUSHIK a , PARMILA SANGWAN a & A. K. HARITASH b a Department of Environmental Science & Engineering, Guru Jambheshwar University of Science & Technology, Hisar, Haryana, India b Department of Environmental Engineering, Delhi Technological University, Shahbad, Delhi, India Version of record first published: 13 Nov 2012. To cite this article: C. P. KAUSHIK, PARMILA SANGWAN & A. K. HARITASH (2012): Association of Polycyclic Aromatic Hydrocarbons (PAHs) with Different Sizes of Atmospheric Particulate in Hisar City and its Health Aspects, Polycyclic Aromatic Compounds, 32:5, 626-642 To link to this article: http://dx.doi.org/10.1080/10406638.2012.695318 PLEASE SCROLL DOWN FOR ARTICLE Full terms and conditions of use: http://www.tandfonline.com/page/terms-and-conditions This article may be used for research, teaching, and private study purposes. Any substantial or systematic reproduction, redistribution, reselling, loan, sub-licensing, systematic supply, or distribution in any form to anyone is expressly forbidden. The publisher does not give any warranty express or implied or make any representation that the contents will be complete or accurate or up to date. The accuracy of any instructions, formulae, and drug doses should be independently verified with primary sources. The publisher shall not be liable for any loss, actions, claims, proceedings, demand, or costs or damages whatsoever or howsoever caused arising directly or indirectly in connection with or arising out of the use of this material.

Welcome message from author
This document is posted to help you gain knowledge. Please leave a comment to let me know what you think about it! Share it to your friends and learn new things together.
Transcript
This article was downloaded by: [Anil Haritash]On: 14 November 2012, At: 09:43Publisher: Taylor & FrancisInforma Ltd Registered in England and Wales Registered Number: 1072954 Registeredoffice: Mortimer House, 37-41 Mortimer Street, London W1T 3JH, UK
Polycyclic Aromatic CompoundsPublication details, including instructions for authors andsubscription information:http://www.tandfonline.com/loi/gpol20
Association of Polycyclic AromaticHydrocarbons (PAHs) with Different Sizesof Atmospheric Particulate in Hisar Cityand its Health AspectsC. P. KAUSHIK a , PARMILA SANGWAN a & A. K. HARITASH ba Department of Environmental Science & Engineering, GuruJambheshwar University of Science & Technology, Hisar, Haryana,Indiab Department of Environmental Engineering, Delhi TechnologicalUniversity, Shahbad, Delhi, IndiaVersion of record first published: 13 Nov 2012.
To cite this article: C. P. KAUSHIK, PARMILA SANGWAN & A. K. HARITASH (2012): Association ofPolycyclic Aromatic Hydrocarbons (PAHs) with Different Sizes of Atmospheric Particulate in Hisar Cityand its Health Aspects, Polycyclic Aromatic Compounds, 32:5, 626-642
To link to this article: http://dx.doi.org/10.1080/10406638.2012.695318
PLEASE SCROLL DOWN FOR ARTICLE
Full terms and conditions of use: http://www.tandfonline.com/page/terms-and-conditions
This article may be used for research, teaching, and private study purposes. Anysubstantial or systematic reproduction, redistribution, reselling, loan, sub-licensing,systematic supply, or distribution in any form to anyone is expressly forbidden.
The publisher does not give any warranty express or implied or make any representationthat the contents will be complete or accurate or up to date. The accuracy of anyinstructions, formulae, and drug doses should be independently verified with primarysources. The publisher shall not be liable for any loss, actions, claims, proceedings,demand, or costs or damages whatsoever or howsoever caused arising directly orindirectly in connection with or arising out of the use of this material.
Polycyclic Aromatic Compounds, 32:626–642, 2012Copyright C© Taylor & Francis Group, LLCISSN: 1040-6638 print / 1563-5333 onlineDOI: 10.1080/10406638.2012.695318
Association of PolycyclicAromatic Hydrocarbons (PAHs)with Different Sizesof Atmospheric Particulatein Hisar City and its HealthAspects
C. P. Kaushik,1 Parmila Sangwan,1 and A. K. Haritash2
1Department of Environmental Science & Engineering, Guru JambheshwarUniversity of Science & Technology, Hisar, Haryana, India2Department of Environmental Engineering, Delhi Technological University,Shahbad, Delhi, India
The concentration of polycyclic aromatic hydrocarbons (PAHs) associated with differentparticulate sizes of suspended particulate matter (SPM) was studied in Hisar city withthe help of a MOUDI-NR 10-stage (18 μm to 0.056 μm) cascade impactor. The vehicular-cum-commercial, vehicular, commercial, and institutional/residential locations had theaverage concentration (ng/g) of 11.39, 10.39/10.22 (NH 10/Bus Terminus), 8.89, and8.93, respectively. Vehicular emission was the chief source and diesel-vehicle dominatedareas represented higher concentration of PAHs associated with coarse fraction. An in-crease in PAH associated with fine fraction was observed with an increase in vehiculardensity. Maximum average concentration (11.26 ng/g) was found to be associated inparticle range of <0.56–0.32 μm. It was followed by particle range (μm) of <18–10,<1.8–1, <0.18–0.1, <1–0.56, <5.6–3.2, <0.32–0.18, <3.2–1.8 <0.1–0.056, and <10–5.6with average values (ng/g) of 10.75, 10.35, 10.22, 10.16, 10.06, 9.50, 9.18, 9.18, and9.00, respectively. Among the PAHs studied, maximum levels were observed for pyrene,followed by Benzo(b)fluoranthene, Benzo(e)pyrene, benzo(k)fluoranthene, fluoranthene,phenanthrene, benzo(ghi)perylene, anthracene, and naphthalene. With respect to thepercent fraction of PAHs studied, the vehicular-cum-commercial area represented max-imum fraction (22%) followed by vehicular area (21% each for NH-10 and Bus Ter-minus), institutional/residential area (18%), and commercial area (18%). The isomericratios revealed that most of the PAHs originate from combustion of diesel, gasoline,
Received 9 February 2012; accepted 16 May 2012.Address correspondence to A. K. Haritash, Department of Environmental Engineering,Delhi Technological University, Shahbad, Delhi 110 042, India. E-mail: [email protected]
626
Dow
nloa
ded
by [
Ani
l Har
itash
] at
09:
43 1
4 N
ovem
ber
2012
PAHs with Different Sizes of Atmospheric Particulate 627
used engine oil, and coal/wood. The association of PAHs with fine fraction of healthconcern since it can penetrate and get accumulated in deep respiratory regions.
Key Words: carcinogenic, PAH, PM2.5, respiratory system, RSPM
INTRODUCTION
PAHs are aromatic hydrocarbons with two or more fused benzene rings. Theyoccur as colorless, white or pale yellow solids with low solubility in water, highmelting and boiling points, and low vapor pressure (1, 2). With an increase inmolecular weight, their solubility in water decreases, melting and boiling pointincreases, and vapor pressure decreases (3, 4). They are formed during thethermal decomposition of organic molecules and their subsequent recombina-tion. Incomplete combustion at high temperature (500–800◦C) or subjection oforganic material at low temperature (100–300◦C) for long periods of time resultin PAH formation. The common sources of PAHs in the environment includenatural as well as anthropogenic sources. Natural sources include forest firesand volcanic eruptions, and anthropogenic sources include vehicles and in-dustries. PAHs are widely distributed environmental contaminants that havedetrimental biological effects, including acute and chronic toxicity, mutagenic-ity, and carcinogenicity (5). Many individual PAHs are carcinogenic to animalsand may be carcinogenic to humans, and exposure to several PAH-containingmixtures has been shown to increase the incidence of cancer in human popula-tion. There is concern that those PAHs found to be carcinogenic in experimen-tal animals are likely to be carcinogenic in humans (6). About 4–8% of prema-ture deaths on a global scale are due to the exposure to high levels of particu-late matter in ambient air (7). The particulate matter, especially the respirablesuspended particulate matter (RSPM), is of major concern as most of the pollu-tants of air are associated with it and they have a high probability of depositingon the respiratory tract (8). Although there are studies regarding the estima-tion of commonly occurring pollutants of air, such as oxides of sulphur andnitrogen (9) and heavy metals (10), estimation of PAHs with particle size char-acterization has become imperative for studying associated health aspects.
The fate of PAHs in the environment includes volatilization, photo-oxidation, chemical oxidation, bio-accumulation, adsorption on soil particles,leaching, and microbial degradation (11, 12). PAHs are present in every com-ponent of environment and are chief pollutants of air. Atmospheric PAHs havea strong affinity for particles since they have lower vapor pressure and there-fore readily can condense onto particulate matter in air and move to distantplaces with the wind currents. These PAHs occur in two phases in air. Thelow molecular weight (MW< 200) PAHs occur in the vapor phase whereasthe heavier (MW> 250) occur in the particulate phase. They partition betweenthe particulate phase and vapor phase depending upon the prevailing atmo-spheric conditions and the particular physical characteristics of the compounds
Dow
nloa
ded
by [
Ani
l Har
itash
] at
09:
43 1
4 N
ovem
ber
2012
628 C. P. Kaushik et al.
themselves. The particulate-bound PAHs are further associated with differentparticle sizes. The ones deposited on smaller particles(<PM2.5) of respirabledust is of special health concern as they penetrate deep up to alveoli in therespiratory system (13). It is observed that vehicles are major sources of PAHsand a majority of the volatile PAHs is observed in the gas phase whereas theless volatile and carcinogenic PAHs are especially adsorbed on particles (14).
Keeping in view the toxicity associated with PAHs, the site-specific activ-ities and sources, association with different particle sizes, and contributionof diesel and gasoline vehicles, the present study was undertaken to assessthe levels of different PAHs in atmospheric suspended dust in Hisar city ofHaryana state.
MATERIALS & METHODS
Study AreaThe present study was undertaken in Hisar city of Haryana state, India.
Hisar is a suburban city located at 29◦10′ North latitude and 75◦46′ East lon-gitude. Hisar has moderate to high industrial activity with a steel plant, dis-tillery, number of small- and medium-scale industries, and a fair number ofregistered vehicles. Most of the industries are located in an industrial estatesituated in its northeast outskirts. The climate is characterized by its drynessand extremes of temperature: the mean temperature is 40◦C and 10◦C in sum-mer and winter, respectively. On average, there are 24 rainy days in the yearwith an average annual rainfall of 450 mm. Generally, light winds blow butdust storms occur in summer and thunderstorms in monsoon season. Weakinversions are commonly observed in winter.
Sample CollectionFor the collection of air samples, five sites, namely National Highway
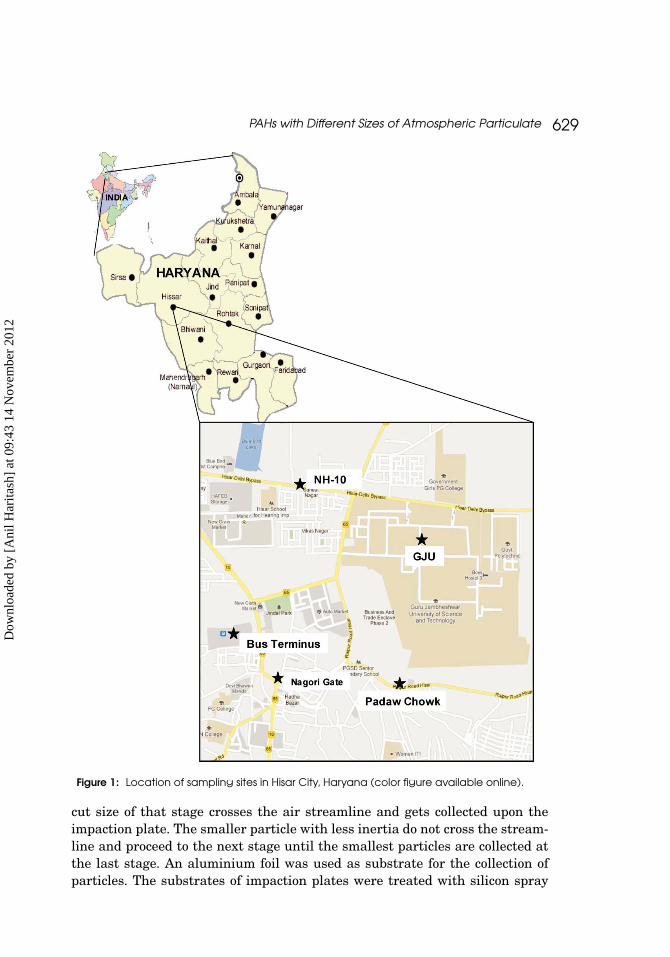
(NH)-10 (vehicular), Nagori Gate (commercial-cum-vehicular), Padaw Chowk(commercial), Bus Terminus (vehicular), and University Campus (GJU) (res-idential/institutional) within the city were selected (Figure 1). The sampleswere collected October–December 2004, once in every month from each loca-tion on the same day. A total of 15 samplings were done during the study.A group of nine PAHs, namely Benzo(k)fluoranthene (B(k)F), Pyrene (Py),Benzo[b]fluoranthene (B(b)F), Benzo(e)pyrene (B(e)P), anthracene (Anth),Napthalene (Naph), Benzo[ghi]perylene (Bply), Phenanthrene (Phe), and Fluo-ranthene (Fluo) was detected. The sampling was carried out using a MOUDITM
100-NR multistage (10 stage) cascade impactor (MSP, USA) with the particlesize range from 10 μm to 0.056 μm (15). The instrument was operated for 8 hat each sampling point at an inlet flow of 30 Lmin−1. At each stage, jets ofparticle-laden air impinge upon an impaction plate. Particles larger than the
Dow
nloa
ded
by [
Ani
l Har
itash
] at
09:
43 1
4 N
ovem
ber
2012
PAHs with Different Sizes of Atmospheric Particulate 629
Figure 1: Location of sampling sites in Hisar City, Haryana (color figure available online).
cut size of that stage crosses the air streamline and gets collected upon theimpaction plate. The smaller particle with less inertia do not cross the stream-line and proceed to the next stage until the smallest particles are collected atthe last stage. An aluminium foil was used as substrate for the collection ofparticles. The substrates of impaction plates were treated with silicon spray
Dow
nloa
ded
by [
Ani
l Har
itash
] at
09:
43 1
4 N
ovem
ber
2012
630 C. P. Kaushik et al.
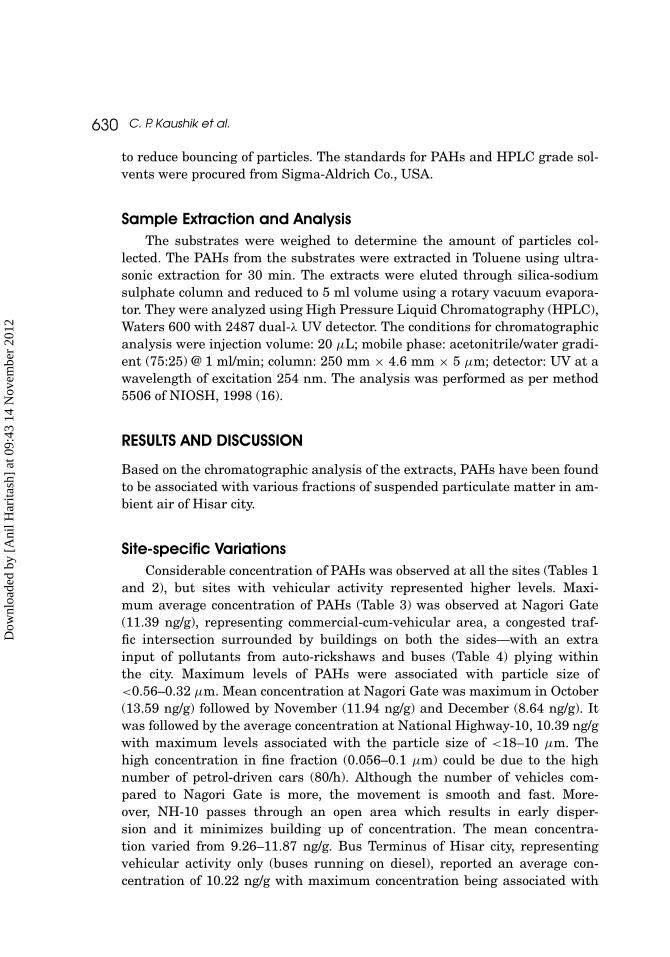
to reduce bouncing of particles. The standards for PAHs and HPLC grade sol-vents were procured from Sigma-Aldrich Co., USA.
Sample Extraction and AnalysisThe substrates were weighed to determine the amount of particles col-
lected. The PAHs from the substrates were extracted in Toluene using ultra-sonic extraction for 30 min. The extracts were eluted through silica-sodiumsulphate column and reduced to 5 ml volume using a rotary vacuum evapora-tor. They were analyzed using High Pressure Liquid Chromatography (HPLC),Waters 600 with 2487 dual-λ UV detector. The conditions for chromatographicanalysis were injection volume: 20 μL; mobile phase: acetonitrile/water gradi-ent (75:25) @ 1 ml/min; column: 250 mm × 4.6 mm × 5 μm; detector: UV at awavelength of excitation 254 nm. The analysis was performed as per method5506 of NIOSH, 1998 (16).
RESULTS AND DISCUSSION
Based on the chromatographic analysis of the extracts, PAHs have been foundto be associated with various fractions of suspended particulate matter in am-bient air of Hisar city.
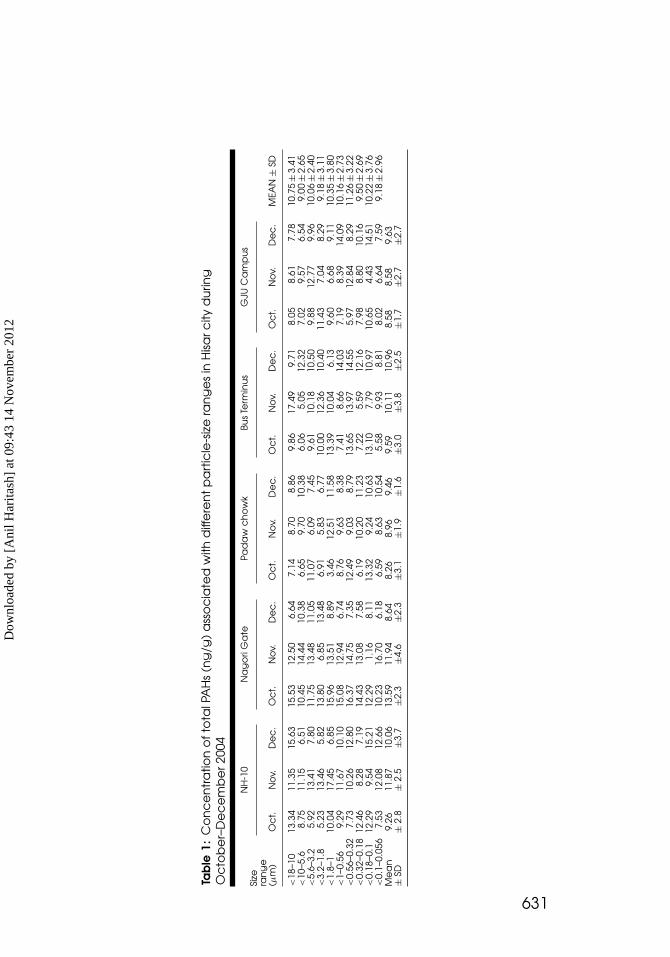
Site-specific VariationsConsiderable concentration of PAHs was observed at all the sites (Tables 1
and 2), but sites with vehicular activity represented higher levels. Maxi-mum average concentration of PAHs (Table 3) was observed at Nagori Gate(11.39 ng/g), representing commercial-cum-vehicular area, a congested traf-fic intersection surrounded by buildings on both the sides—with an extrainput of pollutants from auto-rickshaws and buses (Table 4) plying withinthe city. Maximum levels of PAHs were associated with particle size of<0.56–0.32 μm. Mean concentration at Nagori Gate was maximum in October(13.59 ng/g) followed by November (11.94 ng/g) and December (8.64 ng/g). Itwas followed by the average concentration at National Highway-10, 10.39 ng/gwith maximum levels associated with the particle size of <18–10 μm. Thehigh concentration in fine fraction (0.056–0.1 μm) could be due to the highnumber of petrol-driven cars (80/h). Although the number of vehicles com-pared to Nagori Gate is more, the movement is smooth and fast. More-over, NH-10 passes through an open area which results in early disper-sion and it minimizes building up of concentration. The mean concentra-tion varied from 9.26–11.87 ng/g. Bus Terminus of Hisar city, representingvehicular activity only (buses running on diesel), reported an average con-centration of 10.22 ng/g with maximum concentration being associated with
Dow
nloa
ded
by [
Ani
l Har
itash
] at
09:
43 1
4 N
ovem
ber
2012
Tab
le1:
Co
nc
en
tra
tion
of
tota
lPA
Hs
(ng
/g)
ass
oc
iate
dw
ithd
iffe
ren
tp
art
icle
-siz
era
ng
es
inH
isarc
ityd
urin
gO
cto
be
r–D
ec
em
be
r200
4
NH
-10
Na
go
riG
ate
Pad
aw
ch
ow
kBu
sTe
rmin
us
GJU
Ca
mp
us
Size
ran
ge
(µm
)O
ct.
No
v.D
ec
.O
ct.
No
v.D
ec
.O
ct.
No
v.D
ec
.O
ct.
No
v.D
ec
.O
ct.
No
v.D
ec
.M
EAN
±SD
<18
–10
13.3
411
.35
15.6
315
.53
12.5
06.
647.
148.
708.
869.
8617
.49
9.71
8.05
8.61
7.78
10.7
5±
3.41
<10
–5.6
8.75
11.1
56.
5110
.45
14.4
410
.38
6.65
9.70
10.3
86.
065.
0512
.32
7.02
9.57
6.54
9.00
±2.
65<
5.6–
3.2
5.92
13.4
17.
8011
.75
13.4
811
.05
11.0
76.
097.
459.
6110
.18
10. 5
09.
8812
.77
9.96
10.0
6±
2.40
<3.
2–1.
85.
2313
.46
5.82
13.8
06.
8513
.48
6.91
5.83
6.77
10.0
012
.36
10.4
011
.43
7.04
8.29
9.18
±3.
11<
1.8–
110
.04
17.4
56.
8515
.96
13.5
18.
893.
4612
.51
11.5
813
.39
10.0
46.
139.
606.
689.
1110
.35
±3.
80<
1–0.
569.
2911
.67
10.1
015
.08
12.9
46 .
748.
769.
638.
387.
418.
6614
.03
7.19
8.39
14.0
910
.16
±2.
73<
0.56
–0.3
27.
7310
.26
12.8
016
.37
14.7
57.
3512
.49
9.03
8.79
13.6
513
.97
14.5
55.
9712
.84
8.29
11.2
6±
3.22
<0.
32–0
.18
12.4
68.
287.
1914
.43
13.0
87.
586.
1910
.20
11.2
37.
225.
5912
.16
7.98
8.80
10.1
69.
50±
2.69
<0.
18–0
.112
.29
9.54
15.2
112
.29
1.16
8.11
13.3
29.
2410
.63
13.1
07.
7910
.97
10.6
54.
4314
.51
10.2
2±
3.76
<0.
1–0.
056
7.53
12.0
812
.66
10.2
316
.70
6.18
6.59
8.63
10.5
45.
589.
938.
818.
026.
647.
599.
18±
2.96
Me
an
±SD
9.26
±2.
811
.87
±2.
510
.06
±3.7
13.5
9±2
.311
.94
±4.6
8.64
±2.3
8.26
±3.1
8.96
±1.9
9.46
±1.6
9.59
±3.0
10.1
1±3
.810
.96
±2.5
8.58
±1.7
8.58
±2.7
9.63
±2.7
631
Dow
nloa
ded
by [
Ani
l Har
itash
] at
09:
43 1
4 N
ovem
ber
2012
Tab
le2:
Co
nc
en
tra
tion
of
ind
ivid
ua
lPA
Hs
(ng
/g)
at
diff
ere
nt
loc
atio
ns
inH
isarc
ityd
urin
gO
cto
be
r–D
ec
em
be
r200
4
Loc
atio
nM
on
th,2
004
B(K
)fP
yB(
b)F
B(e
)PA
nth
Na
ph
Bply
Ph
eFl
uo
NH
-10
Oc
t.4.
5322
.79
25.4
014
.20
2.00
5.57
5.34
3.76
8.98
No
v.21
.55
33.6
019
.20
20.6
01.
144.
208.
544.
625.
22D
ec
.21
.18
23.9
021
.10
11.5
02.
053.
394.
377.
275.
81N
ag
ori
Ga
teO
ct.
25.3
447
.13
21.3
913
.75
3.19
2.37
5.81
9.55
7.37
No
v.33
.75
15.7
928
.99
15.9
94.
834.
496.
276.
718.
59D
ec
.0.
092.
30N
D1.
500.
600.
070.
030.
401.
20Pa
da
wC
ho
wk
Oc
t.4.
2219
.60
14.0
015
.60
5.07
5.16
3.49
5.14
10.3
2N
ov.
1.27
27.8
012
.08
20.6
03.
509.
160.
358.
3110
.74
De
c.
1.27
27.8
012
.18
20.5
04.
320.
358.
798.
7910
.65
Bus
Term
inu
sO
ct.
2.56
26.3
026
.14
18.4
34.
453.
540.
797.
736.
03N
ov.
3.80
27.2
019
.10
13.1
06.
993.
1912
.89
7.38
7.43
De
c.
1.25
31.9
822
.05
19.2
08.
182.
9810
.87
6.30
6.76
GJU
Ca
mp
us
Oc
t.0.
9215
.70
24.1
014
.70
3.44
3.99
6.22
7.00
9.74
No
v.6.
3323
.02
19.7
013
.20
3.59
3.36
4.12
6.88
5.57
De
c.
5.95
22.7
016
.80
17.7
64.
032.
319.
967.
469.
35M
ea
n±
SD9.
15±
10.8
25.7
5±
0.2
20.4
2±
5.1
15.2
1±
4.9
3.81
±2.
03.
70±
2.2
5.56
±3.
96.
42±
2.3
7.46
±2.
6
632
Dow
nloa
ded
by [
Ani
l Har
itash
] at
09:
43 1
4 N
ovem
ber
2012
PAHs with Different Sizes of Atmospheric Particulate 633
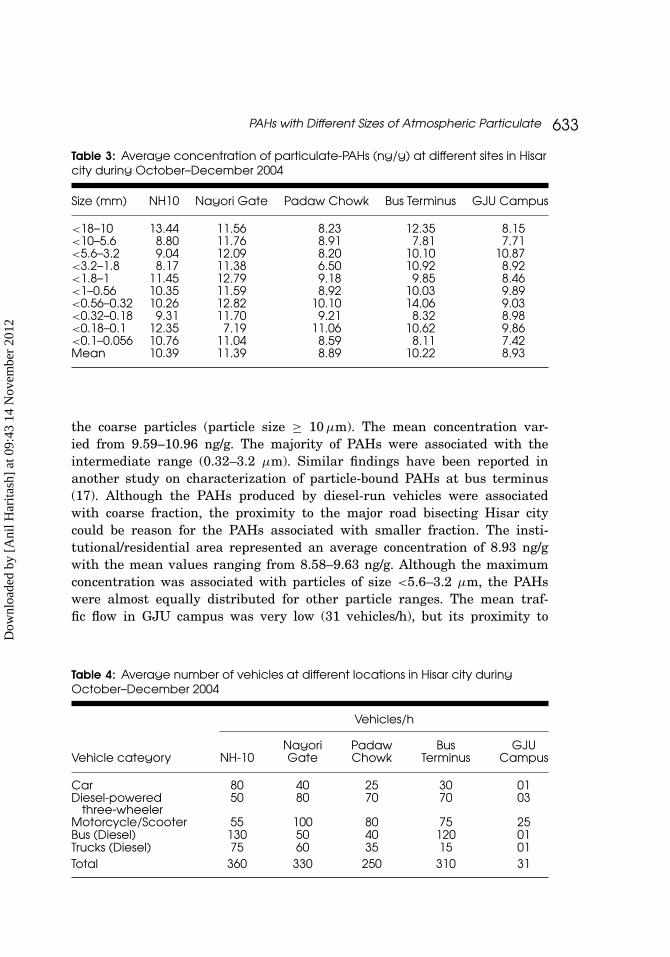
Table 3: Average concentration of particulate-PAHs (ng/g) at different sites in Hisarcity during October–December 2004
Size (mm) NH10 Nagori Gate Padaw Chowk Bus Terminus GJU Campus
<18–10 13.44 11.56 8.23 12.35 8.15<10–5.6 8.80 11.76 8.91 7.81 7.71<5.6–3.2 9.04 12.09 8.20 10.10 10.87<3.2–1.8 8.17 11.38 6.50 10.92 8.92<1.8–1 11.45 12.79 9.18 9.85 8.46<1–0.56 10.35 11.59 8.92 10.03 9.89<0.56–0.32 10.26 12.82 10.10 14.06 9.03<0.32–0.18 9.31 11.70 9.21 8.32 8.98<0.18–0.1 12.35 7.19 11.06 10.62 9.86<0.1–0.056 10.76 11.04 8.59 8.11 7.42Mean 10.39 11.39 8.89 10.22 8.93
the coarse particles (particle size ≥ 10 μm). The mean concentration var-ied from 9.59–10.96 ng/g. The majority of PAHs were associated with theintermediate range (0.32–3.2 μm). Similar findings have been reported inanother study on characterization of particle-bound PAHs at bus terminus(17). Although the PAHs produced by diesel-run vehicles were associatedwith coarse fraction, the proximity to the major road bisecting Hisar citycould be reason for the PAHs associated with smaller fraction. The insti-tutional/residential area represented an average concentration of 8.93 ng/gwith the mean values ranging from 8.58–9.63 ng/g. Although the maximumconcentration was associated with particles of size <5.6–3.2 μm, the PAHswere almost equally distributed for other particle ranges. The mean traf-fic flow in GJU campus was very low (31 vehicles/h), but its proximity to
Table 4: Average number of vehicles at different locations in Hisar city duringOctober–December 2004
Vehicles/h
Nagori Padaw Bus GJUVehicle category NH-10 Gate Chowk Terminus Campus
Car 80 40 25 30 01Diesel-powered
three-wheeler50 80 70 70 03
Motorcycle/Scooter 55 100 80 75 25Bus (Diesel) 130 50 40 120 01Trucks (Diesel) 75 60 35 15 01Total 360 330 250 310 31
Dow
nloa
ded
by [
Ani
l Har
itash
] at
09:
43 1
4 N
ovem
ber
2012
634 C. P. Kaushik et al.
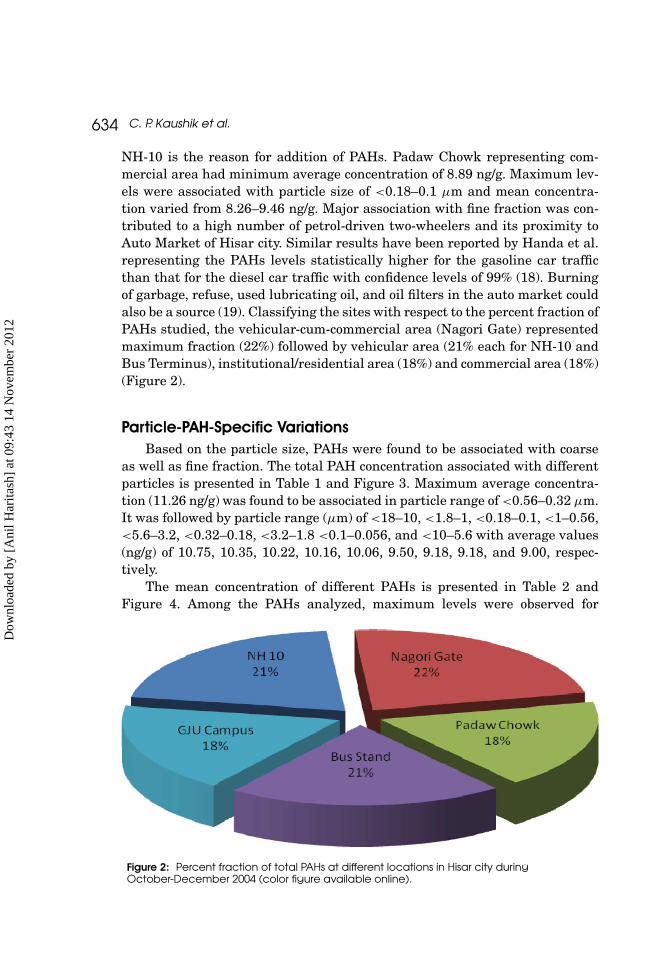
NH-10 is the reason for addition of PAHs. Padaw Chowk representing com-mercial area had minimum average concentration of 8.89 ng/g. Maximum lev-els were associated with particle size of <0.18–0.1 μm and mean concentra-tion varied from 8.26–9.46 ng/g. Major association with fine fraction was con-tributed to a high number of petrol-driven two-wheelers and its proximity toAuto Market of Hisar city. Similar results have been reported by Handa et al.representing the PAHs levels statistically higher for the gasoline car trafficthan that for the diesel car traffic with confidence levels of 99% (18). Burningof garbage, refuse, used lubricating oil, and oil filters in the auto market couldalso be a source (19). Classifying the sites with respect to the percent fraction ofPAHs studied, the vehicular-cum-commercial area (Nagori Gate) representedmaximum fraction (22%) followed by vehicular area (21% each for NH-10 andBus Terminus), institutional/residential area (18%) and commercial area (18%)(Figure 2).
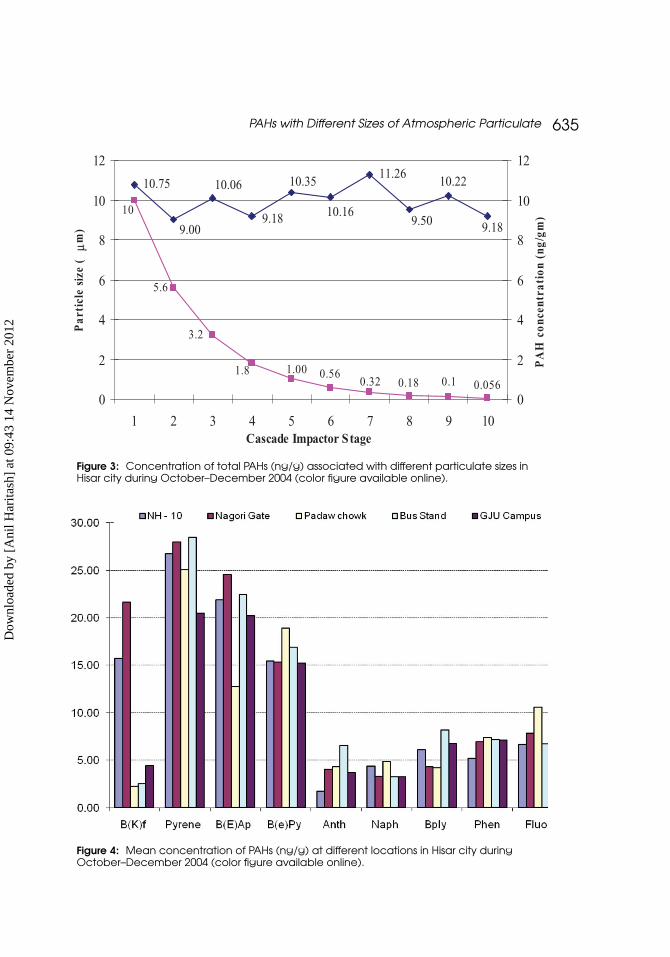
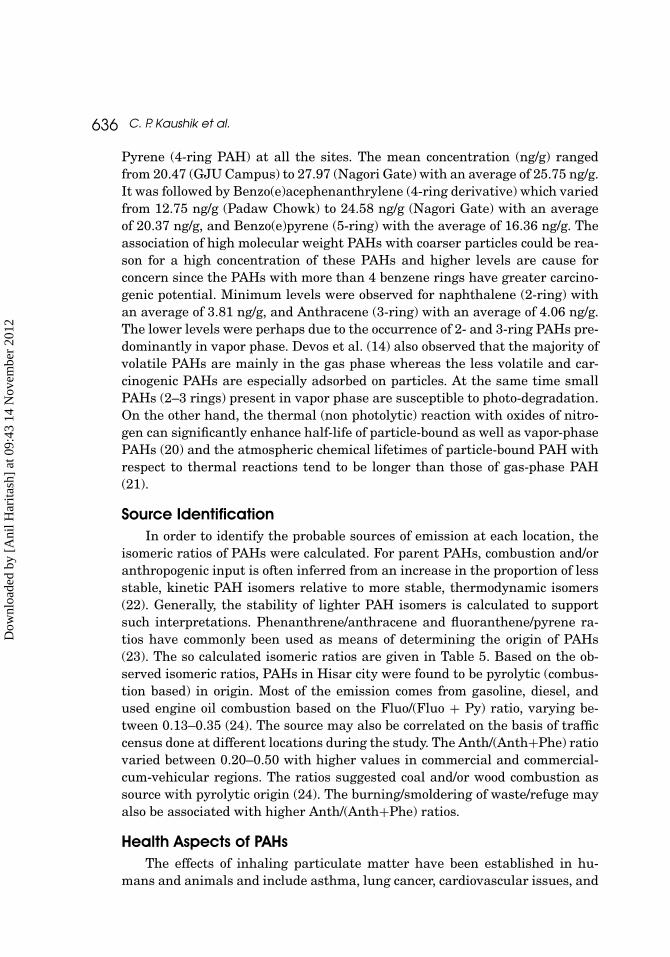
Particle-PAH-Specific VariationsBased on the particle size, PAHs were found to be associated with coarse
as well as fine fraction. The total PAH concentration associated with differentparticles is presented in Table 1 and Figure 3. Maximum average concentra-tion (11.26 ng/g) was found to be associated in particle range of <0.56–0.32 μm.It was followed by particle range (μm) of <18–10, <1.8–1, <0.18–0.1, <1–0.56,<5.6–3.2, <0.32–0.18, <3.2–1.8 <0.1–0.056, and <10–5.6 with average values(ng/g) of 10.75, 10.35, 10.22, 10.16, 10.06, 9.50, 9.18, 9.18, and 9.00, respec-tively.
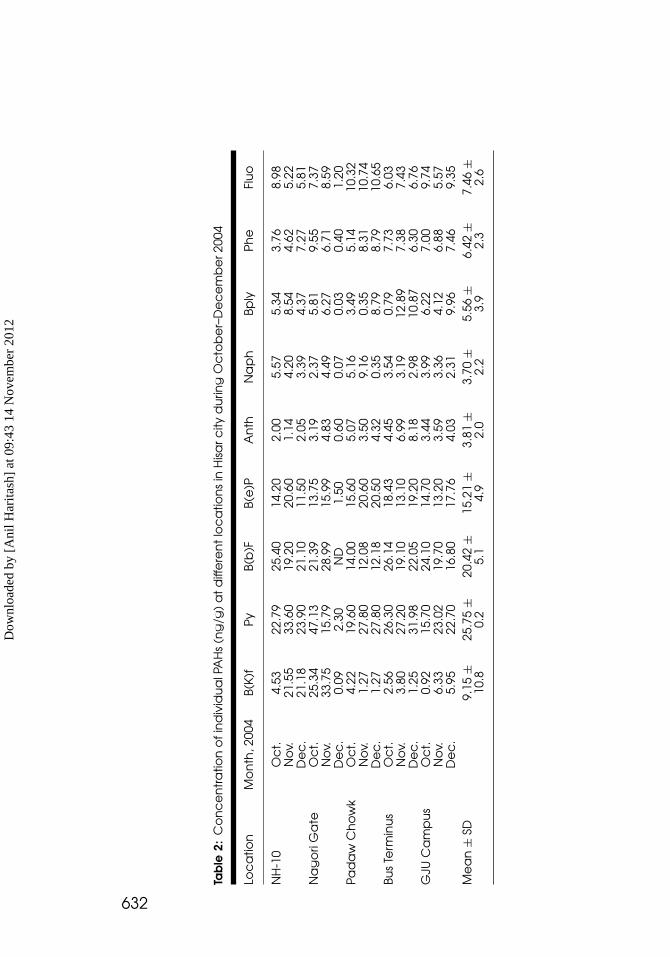
The mean concentration of different PAHs is presented in Table 2 andFigure 4. Among the PAHs analyzed, maximum levels were observed for
Figure 2: Percent fraction of total PAHs at different locations in Hisar city duringOctober-December 2004 (color figure available online).
Dow
nloa
ded
by [
Ani
l Har
itash
] at
09:
43 1
4 N
ovem
ber
2012
PAHs with Different Sizes of Atmospheric Particulate 635
10
5.6
3.2
1.8 1.00 0.560.32 0.18 0.1 0.056
10.7511.26
9.509.00
10.06
9.18
10.35
10.16
10.22
9.18
0
2
4
6
8
10
12
1 2 3 4 5 6 7 8 9 10Cascade Impactor Stage
Par
ticl
e si
ze (
µm)
0
2
4
6
8
10
12
PA
H c
once
ntra
tion
(ng
/gm
)
Figure 3: Concentration of total PAHs (ng/g) associated with different particulate sizes inHisar city during October–December 2004 (color figure available online).
Figure 4: Mean concentration of PAHs (ng/g) at different locations in Hisar city duringOctober–December 2004 (color figure available online).
Dow
nloa
ded
by [
Ani
l Har
itash
] at
09:
43 1
4 N
ovem
ber
2012
636 C. P. Kaushik et al.
Pyrene (4-ring PAH) at all the sites. The mean concentration (ng/g) rangedfrom 20.47 (GJU Campus) to 27.97 (Nagori Gate) with an average of 25.75 ng/g.It was followed by Benzo(e)acephenanthrylene (4-ring derivative) which variedfrom 12.75 ng/g (Padaw Chowk) to 24.58 ng/g (Nagori Gate) with an averageof 20.37 ng/g, and Benzo(e)pyrene (5-ring) with the average of 16.36 ng/g. Theassociation of high molecular weight PAHs with coarser particles could be rea-son for a high concentration of these PAHs and higher levels are cause forconcern since the PAHs with more than 4 benzene rings have greater carcino-genic potential. Minimum levels were observed for naphthalene (2-ring) withan average of 3.81 ng/g, and Anthracene (3-ring) with an average of 4.06 ng/g.The lower levels were perhaps due to the occurrence of 2- and 3-ring PAHs pre-dominantly in vapor phase. Devos et al. (14) also observed that the majority ofvolatile PAHs are mainly in the gas phase whereas the less volatile and car-cinogenic PAHs are especially adsorbed on particles. At the same time smallPAHs (2–3 rings) present in vapor phase are susceptible to photo-degradation.On the other hand, the thermal (non photolytic) reaction with oxides of nitro-gen can significantly enhance half-life of particle-bound as well as vapor-phasePAHs (20) and the atmospheric chemical lifetimes of particle-bound PAH withrespect to thermal reactions tend to be longer than those of gas-phase PAH(21).
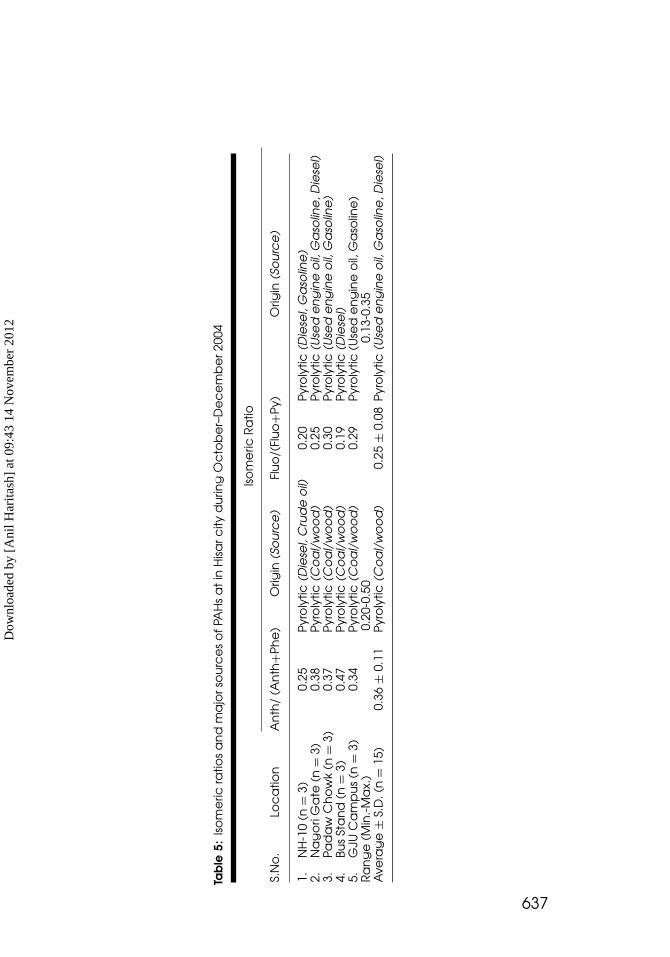
Source IdentificationIn order to identify the probable sources of emission at each location, the
isomeric ratios of PAHs were calculated. For parent PAHs, combustion and/oranthropogenic input is often inferred from an increase in the proportion of lessstable, kinetic PAH isomers relative to more stable, thermodynamic isomers(22). Generally, the stability of lighter PAH isomers is calculated to supportsuch interpretations. Phenanthrene/anthracene and fluoranthene/pyrene ra-tios have commonly been used as means of determining the origin of PAHs(23). The so calculated isomeric ratios are given in Table 5. Based on the ob-served isomeric ratios, PAHs in Hisar city were found to be pyrolytic (combus-tion based) in origin. Most of the emission comes from gasoline, diesel, andused engine oil combustion based on the Fluo/(Fluo + Py) ratio, varying be-tween 0.13–0.35 (24). The source may also be correlated on the basis of trafficcensus done at different locations during the study. The Anth/(Anth+Phe) ratiovaried between 0.20–0.50 with higher values in commercial and commercial-cum-vehicular regions. The ratios suggested coal and/or wood combustion assource with pyrolytic origin (24). The burning/smoldering of waste/refuge mayalso be associated with higher Anth/(Anth+Phe) ratios.
Health Aspects of PAHsThe effects of inhaling particulate matter have been established in hu-
mans and animals and include asthma, lung cancer, cardiovascular issues, and
Dow
nloa
ded
by [
Ani
l Har
itash
] at
09:
43 1
4 N
ovem
ber
2012
Tab
le5:
Iso
me
ricra
tios
an
dm
ajo
rso
urc
es
of
PAH
sa
tin
Hisa
rcity
du
ring
Oc
tob
er–
De
ce
mb
er2
004
Iso
me
ricR
atio
S.N
o.
Loc
atio
nA
nth
/(A
nth
+Ph
e)
Orig
in(S
ou
rce
)Fl
uo
/(Fl
uo+P
y)O
rigin
(So
urc
e)
1.N
H-1
0(n
=3)
0.25
Pyr
oly
tic(D
iese
l,C
rud
eo
il)0.
20P
yro
lytic
(Die
sel,
Ga
solin
e)
2.N
ag
ori
Ga
te(n
=3)
0.38
Pyr
oly
tic(C
oa
l/w
oo
d)
0.25
Pyr
oly
tic(U
sed
en
gin
eo
il,G
aso
line
,Die
sel)
3.Pa
da
wC
ho
wk
(n=
3)0.
37P
yro
lytic
(Co
al/
wo
od
)0.
30P
yro
lytic
(Use
de
ng
ine
oil,
Ga
solin
e)
4.Bu
sSt
an
d(n
=3)
0.47
Pyr
oly
tic(C
oa
l/w
oo
d)
0.19
Pyr
oly
tic(D
iese
l)5.
GJU
Ca
mp
us
(n=
3)0.
34P
yro
lytic
(Co
al/
wo
od
)0.
29P
yro
lytic
(Use
de
ng
ine
oil,
Ga
solin
e)
Ra
ng
e(M
in.-
Ma
x.)
0.20
-0.5
00.
13-0
.35
Ave
rag
e±
S.D
.(n
=15
)0.
36±
0.11
Pyr
oly
tic(C
oa
l/w
oo
d)
0.25
±0.
08P
yro
lytic
(Use
de
ng
ine
oil,
Ga
solin
e,D
iese
l)
637
Dow
nloa
ded
by [
Ani
l Har
itash
] at
09:
43 1
4 N
ovem
ber
2012
Tab
le6:
Phy
sico
-ch
em
ica
lpro
pe
rtie
sa
nd
toxi
city
of
ind
ivid
ua
lPA
Hs
CA
S#re
gist
ryB.
Pt.
M.P
t.V.
P.A
qu
eo
us
IAR
CG
en
o-t
oxi
city
No
.PA
Hc
om
po
un
dM
.F.
CA
S#re
gist
ryN
o.
#(◦ C
)#
(◦ C)
#(P
aa
t25
◦ C)
solu
bili
ty(m
g/l
)∗@
gro
up
(WH
O)€
TEF$
1Be
nzo
[k]fl
uo
ran
the
ne
C20
H12
207-
08-9
480
215.
75.
2×
10−8
7.6
×10
−42B
Posit
ive
0.1
2A
nth
rac
en
eC
14H
1012
0-12
-734
221
6.4
1×
10−3
0.01
53
Ne
ga
tive
0.01
3Be
nzo
[b]fl
uo
ran
the
ne
C20
H12
205-
99-2
481
168.
36.
7×
10−5
-2B
Posit
ive
0.1
4Be
nzo
(e)p
yre
ne
C20
H12
192-
97-2
493
178.
74
×10
−76.
3×
10−3
3Po
sitiv
e0.
015
Flu
ora
nth
en
eC
16H
1020
6-44
-037
510
8.8
1.2
×10
−30.
253
Posit
ive
0.00
16
Na
ph
tha
len
eC
10H
891
-20-
321
880
.211
30n
.e.
Ne
ga
tive
0.00
17
Ph
en
an
thre
ne
C14
H10
85-0
1-8
340
100.
52
×10
−21-
23
Qu
est
ion
ab
le0.
001
8Be
nzo
[gh
i]pe
ryle
ne
C22
H12
191-
24-2
500
277
6×
10−8
2.6
×10
−43
Posit
ive
0.01
9P
yre
ne
C16
H10
129-
00-0
150.
439
36.
0×
10−4
0.12
–0.1
83
Qu
est
ion
ab
le0.
001
#(2
1);∗
(2);
@(5
);€
(6);
$ (33
)
638
Dow
nloa
ded
by [
Ani
l Har
itash
] at
09:
43 1
4 N
ovem
ber
2012
PAHs with Different Sizes of Atmospheric Particulate 639
O
OH
OH
O
OH
OH
OH
OH
OH
dG
EpoxidehydrolaseP450
P450Oxidase
Benzo(a)pyrene B(a)P 7,8-oxide B(a)P 7,8-dihydrodiol B(a)P 7,8-dihydrodiol9,10-epoxide
(+)-trans-anti-B(a)PDE-N2-dG
PAH Compound Epoxide Dihydrodiol Dihydrodiol-epoxide PAH-DNA adduct
O
OH
OH
O
OH
OH
OH
OH
OH
dG
EpoxidehydrolaseP450
P450Oxidase
Benzo(a)pyrene B(a)P 7,8-oxide B(a)P 7,8-dihydrodiol B(a)P 7,8-dihydrodiol9,10-epoxide
(+)-trans-anti-B(a)PDE-N2-dG
PAH Compound Epoxide Dihydrodiol Dihydrodiol-epoxide PAH-DNA adduct
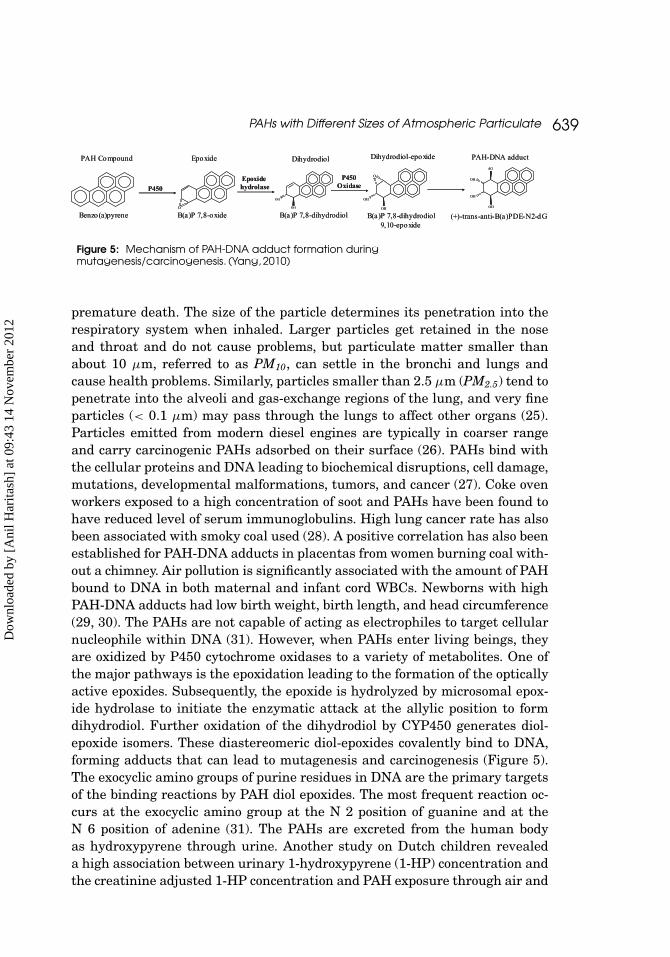
Figure 5: Mechanism of PAH-DNA adduct formation duringmutagenesis/carcinogenesis. (Yang, 2010)
premature death. The size of the particle determines its penetration into therespiratory system when inhaled. Larger particles get retained in the noseand throat and do not cause problems, but particulate matter smaller thanabout 10 μm, referred to as PM10, can settle in the bronchi and lungs andcause health problems. Similarly, particles smaller than 2.5 μm (PM2.5) tend topenetrate into the alveoli and gas-exchange regions of the lung, and very fineparticles (< 0.1 μm) may pass through the lungs to affect other organs (25).Particles emitted from modern diesel engines are typically in coarser rangeand carry carcinogenic PAHs adsorbed on their surface (26). PAHs bind withthe cellular proteins and DNA leading to biochemical disruptions, cell damage,mutations, developmental malformations, tumors, and cancer (27). Coke ovenworkers exposed to a high concentration of soot and PAHs have been found tohave reduced level of serum immunoglobulins. High lung cancer rate has alsobeen associated with smoky coal used (28). A positive correlation has also beenestablished for PAH-DNA adducts in placentas from women burning coal with-out a chimney. Air pollution is significantly associated with the amount of PAHbound to DNA in both maternal and infant cord WBCs. Newborns with highPAH-DNA adducts had low birth weight, birth length, and head circumference(29, 30). The PAHs are not capable of acting as electrophiles to target cellularnucleophile within DNA (31). However, when PAHs enter living beings, theyare oxidized by P450 cytochrome oxidases to a variety of metabolites. One ofthe major pathways is the epoxidation leading to the formation of the opticallyactive epoxides. Subsequently, the epoxide is hydrolyzed by microsomal epox-ide hydrolase to initiate the enzymatic attack at the allylic position to formdihydrodiol. Further oxidation of the dihydrodiol by CYP450 generates diol-epoxide isomers. These diastereomeric diol-epoxides covalently bind to DNA,forming adducts that can lead to mutagenesis and carcinogenesis (Figure 5).The exocyclic amino groups of purine residues in DNA are the primary targetsof the binding reactions by PAH diol epoxides. The most frequent reaction oc-curs at the exocyclic amino group at the N 2 position of guanine and at theN 6 position of adenine (31). The PAHs are excreted from the human bodyas hydroxypyrene through urine. Another study on Dutch children revealeda high association between urinary 1-hydroxypyrene (1-HP) concentration andthe creatinine adjusted 1-HP concentration and PAH exposure through air and
Dow
nloa
ded
by [
Ani
l Har
itash
] at
09:
43 1
4 N
ovem
ber
2012
640 C. P. Kaushik et al.
soil (32). The International Agency for Research on Cancer (IARC) has clas-sified 48 PAH compounds likely to be carcinogenic to humans. From humanepidemiological data, the estimated risk of lung cancer by PAHs is 1.3 × 10⁻⁴
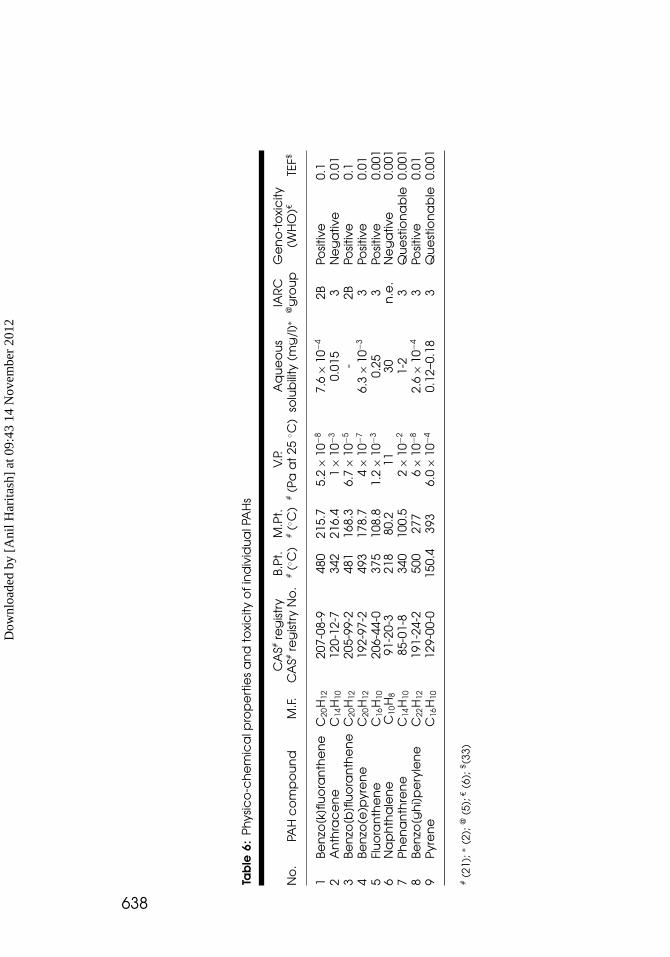
to 2.4 × 10⁻³ μg/m3 (5). The physico-chemical properties, carcinogenicity, geno-toxicity, and toxic equivalency factor (TEF) of individual PAHs are discussedin Table 6.
CONCLUSION
The higher average concentration of PAHs in a vehicular region correlatedwith the number of diesel driven vehicles and maximum concentration wasobserved for high molecular weight PAHs like Pyrene, Benzo[b]fluoranthene,and Benzo(e)pyrene associated with particulate range of 10–18 μm. It showsthat diesel engines emitted coarser particles and high molecular weight PAHs.The diesel auto-rickshaws and petrol motorcycles correlated with high con-centration of PAHs in vehicular and commercial areas chiefly associated withcomparatively fine particulate matter (0.32–0.56 μm) signifying that petroldriven vehicles emit finer particulate. The added number of motorcycles andthree wheelers added to PAH levels at Nagori Gate, Padaw Chowk, and BusTerminus. The fluo/(fluo + Py) ratios also suggested that the major source wascombustion of gasoline, diesel, and used engine oil. The other reason for a highconcentration of pollutants could be reduced dispersion in congested areas sur-rounded by buildings. The open areas as NH-10 favored early dispersion anddilution of pollutants and resulted in comparatively lower levels though thenumber of vehicles passing per hour was found to be maximum. The disper-sion to adjacent institutional/residential area resulted in slightly higher levelsalthough the number of vehicles was minimal. Diesel engines produce moreamounts of PAHs than the petrol driven engines and the total concentration(vapur phase + particulate) could be around 1.5 times higher than the par-ticulate bound as about two-thirds of carcinogenic PAHs are adsorbed on theparticles, whatever the fuel used (14). It is a cause of concern with respect tohealth since it increases the exposure to higher levels of PAHs especially incongested areas. PAHs associated with coarse fraction in vehicular regions areof less concern as they may get trapped within the nasal and throat regionbut exposure of population suffering from respiratory disorders may exacer-bate the effects. Those associated with particulate size range of 0.1–0.18 μmin commercial and vehicular region is of major concern as these can penetratedeep up to the alveoli, possibly reaching other organs after crossing the alveo-lar region.
REFERENCES
1. Katz, M., C. Chan, H. Tosine, and T. Sakuma. “Relative rates of photochemicaland biological oxidation (in vitro) of polynuclear aromatic hydrocarbons,” Polynuclear
Dow
nloa
ded
by [
Ani
l Har
itash
] at
09:
43 1
4 N
ovem
ber
2012
PAHs with Different Sizes of Atmospheric Particulate 641
Aromatic Hydrocarbons, eds. P. W. Jones, P. Leber (Ann Arbor, MI: Ann Arbor Science,1979): 171–179.
2. Mackay, D., W. Y. Shiu, and K. C. Ma, Illustrated Handbook of Physical-ChemicalProperties and Environmental Fate for Organic Chemicals (Boca Raton, FL: Lewis Pub-lishing, 1991).
3. Clar, E., Polycyclic Hydrocarbons (New York: Academic Press, 1964).
4. Patnaik, P. A., Comprehensive Guide to the Properties of Hazardous Chemical Sub-stances, 2nd ed. (Hoboken, NJ: John Wiley & Sons Publishers, 1999).
5. International Agency for Research on Cancer (IARC). “Benzo[a]pyrene,” in Polynu-clear Aromatic Compounds, Part 1, Chemical, Environmental and Experimental Data.Vol. 32. Monographs on the Evaluation of the Carcinogenic Risk of Chemicals to Hu-mans (Lyon: IARC, 1983), 211–4.
6. World Health Organization (WHO). Environmental Health Criteria 202, SelectedNon-heterocyclic PAHs (Geneva: WHO, 1998). http://www.inchem.org/documents/ehc/ehc/ehc202.htm
7. World Health Organisation (WHO). Guidelines for Air Quality (Geneva: WHO,2000). http://www.airimpacts.org/documents/local/AQGUIDE.pdf
8. Pope, A., M. Thun, and M. Namboodiri. “Particulate Air Pollution as a Predictorof Mortality in a Prospective Study of US Adults.” Amer. J. Respir. Crit. Care Med. 151(1995): 669–74.
9. Kaushik, C. P., R. Khaiwal, K. Yadav, S. Mehta, and A. K. Haritash. “Assessmentof Ambient Air Quality in Urban Centres of Haryana (India) in Relation to DifferentAnthropogenic Activities and Health Risks.” Environ. Monit. Assess. 122 (2006): 27–40.
10. Haritash, A. K. and C. P. Kaushik. “Assessment of Seasonal Enrichment of HeavyMetals in Respirable Suspended Particulate Matter of a Sub-Urban Indian City.” Env-iron. Monit. Assess. 128, no. 1–3 (2007): 411–20.
11. Wild, S. R. and K. C. Jones. “Polynuclear Aromatic Hydrocarbons in the UnitedKingdom Environment: A Preliminary Source Inventory and Budget.” Environ. Pollut.88, no. 1 (1995): 91–108.
12. Haritash, A. K. and C. P. Kaushik. “Biodegradation Aspects of Polycyclic AromaticHydrocarbons.” J. Hazard. Mater. 169 (2009): 1–15.
13. Kirso, U., G. Urb, M. Laja, E. Teinema, J. Reinik, I. Gebefugi, and A. Kettrup.“PAH in Airborne Particulate Matter.” Polycycl. Arom. Comp. 26 (2006): 111–19.
14. Devos, O., E. Combet, P. Tassel, and L. Paturel. “Exhaust Emissions of PAHs ofPassenger Cars.” Polycycl. Arom. Comp. 26 (2006): 69–78.
15. Marple, V. A., K. L. Rubow, and S. M. Behm. “A Microorifice Uniform DepositImpactor (MOUDI): Description, Calibration, and Use.” Aerosol Sci. Technol. 14, no. 4(1991): 434–46.
16. National Institute of Occupational Health and Safety (NIOSH). Manual of Analyt-ical Methods (NMAM), 4th ed. Polynuclear Aromatic Hydrocarbons by HPLC: Method5506, Issue 3, 1998.
17. Chen, S. J., W. I. Hwang, S. C. Chiu, M. C. Hung, and C. C. Lin. “Size Distributionof Particle-Bound PAH Composition in the Ambient Air of Bus Station.” J. Environ. Sci.Health (A) 32, no. 6 (1997): 1781–1805.
18. Handa, T., Y. Kato, T. Yamamura, T. Ishii, and H. Matsushita. “In Situ Emis-sion Levels of Polynuclear Aromatic Hydrocarbons from Gasoline and Diesel En-gine Vehicles on an Expressway.” J. Environ. Sci. Health (A) 15, no. 6 (1980):573–99.
Dow
nloa
ded
by [
Ani
l Har
itash
] at
09:
43 1
4 N
ovem
ber
2012
642 C. P. Kaushik et al.
19. Kaushik, C. P. and A. K. Haritash. “Polycyclic Aromatic Hydrocarbons (PAHs) andEnvironmental Health.” Our Earth 3, no. 3 (2006): 1–7.
20. Wayne, R. P., I. Barnes, P. Biggs, J. P. Burrows, C. E. Canosa-Mas, J. Hjorth, G.LeBras, G. K. Moortgat, D. Perner, G. Poulet, G. Restelli, and H. Sidebottom. “TheNitrate Radical: Physics, Chemistry and the Atmosphere.” Atmos. Environ. (A) 25, no.1 (1991): 1–203.
21. Working Group on Polycyclic Aromatic Hdrocarbons (WGPAH). 2001. “AmbientAir Pollution by Polycyclic Aromatic Hydrocarbons: Position Paper, Annexes.” July,(2001), 1–66. ec.europa.eu/environment/air/pdf/pp pah.pdf.
22. Yunker, M. B. and R. W. Macdonald. “Composition and Origin of Polycyclic Aro-matic Hydrocarbons in the Mackenzie River and on the Beaufort Sea Shelf.” Arctic 48(1995): 118–29.
23. Orecchio, S. “Assessment of Polycyclic Aromatic Hydrocarbons (PAHs) in Soil ofa Natural Reserve (Isola delle Femmine) (Italy) Located in Front of a Plant for theProduction of Cement.” J. Hazard. Mater. 173 (2010): 358–6.8
24. Yunker, M. B., R. W. Macdonald, R. Vingarzan, R. H. Mitchell, D. Goyette, andS. Sylvestre. “PAHs in the Fraser River Basin: A Critical Appraisal of PAH Ratios asIndicators of PAH Source and Composition.” Organ. Geochem. 33 (2002): 489–515.
25. U.S. Environmental Protection Agency (USEPA). Region 4: PM 2.5 Objectives andHistory: Laboratory and Field Operations - PM 2.5. (Washington, D.C.: USEPA, 2008).
26. Saldarriaga, H., R. Villalobos, G. Solano, O. Amador, R. Gasparino, R. Palma, andZ. Munive. “Aliphatic, Polycyclic Aromatic Hydrocarbons and Nitrated-Polycyclic Aro-matic Hydrocarbons in PM10 in Southwestern Mexico City.” Polycycl. Arom. Comp. 28(2008): 578–97.
27. R. Edwards. “Smog Blights Babies in the Womb.” New Sci. 152, no. 2052 (1996): 4.
28. Xu, P., J. Gao, D. W. Doekery, and Y. Chen. “Air Pollution and Daily Mortality inResidential Areas of Beijing.” China Arch. Environ. Health 49, no. 4 (1994): 216–22.
29. Perera, F. P., D. Tang, V. Rauh, K. Lester, W. Y. Tsai, and Y. H. Tu. “Relation-ship between Polycyclic Aromatic Hydrocarbon–DNA Adducts and Proximity to theWorld Trade Center and Effects on Fetal Growth.” Environ. Health Perspect. 113 (2005):1062–7.
30. Madhavan, N. D. and K. A. Naidu. “Polycyclic Aromatic Hydrocarbons in Placenta,Maternal Blood, Umbilical Cord Blood and Milk of Indian Women.” Human Exper. Tox-icol. 14, no. 6 (1995): 503–6.
31. Conney, A. H. “Induction of Microsomal Enzymes by Foreign Chemicals and Car-cinogenesis by Polycyclic Aromatic Hydrocarbons: GHA Cloves Memorial Lecture.” Can-cer Res. 42 (1982): 4875–917.
32. Winjen, J. H., R. Slob, G. J-Liedekerken, R. H. J. Weerdt, and F. Woudenberg. “Ex-posure to Polycyclic Aromatic Hydrocarbons among Dutch Children.” Environ. HealthPerspect. 104, no. 5 (1996): 530–4.
33. Liao, C. M. and K. C. Chiang. “Probabilistic Risk Assessment for Personal Expo-sure to Carcinogenic Polycyclic Aromatic Hydrocarbons in Taiwanese Temples.” Chemo-sphere 63, no. 9 (2006): 1610–19.
Dow
nloa
ded
by [
Ani
l Har
itash
] at
09:
43 1
4 N
ovem
ber
2012
Related Documents