ARTICLE doi:10.1038/nature11618 Hippocampal–cortical interaction during periods of subcortical silence N. K. Logothetis 1,2 , O. Eschenko 1 , Y. Murayama 1 , M. Augath 1 , T. Steudel 1 , H. C. Evrard 1 , M. Besserve 1,3 & A. Oeltermann 1 Hippocampal ripples, episodic high-frequency field-potential oscillations primarily occurring during sleep and calmness, have been described in mice, rats, rabbits, monkeys and humans, and so far they have been associated with retention of previously acquired awake experience. Although hippocampal ripples have been studied in detail using neurophysiological methods, the global effects of ripples on the entire brain remain elusive, primarily owing to a lack of methodologies permitting concurrent hippocampal recordings and whole-brain activity mapping. By combining electrophysiological recordings in hippocampus with ripple-triggered functional magnetic resonance imaging, here we show that most of the cerebral cortex is selectively activated during the ripples, whereas most diencephalic, midbrain and brainstem regions are strongly and consistently inhibited. Analysis of regional temporal response patterns indicates that thalamic activity suppression precedes the hippocampal population burst, which itself is temporally bounded by massive activations of association and primary cortical areas. These findings suggest that during off-line memory consolidation, synergistic thalamocortical activity may be orchestrating a privileged interaction state between hippocampus and cortex by silencing the output of subcortical centres involved in sensory processing or potentially mediating procedural learning. Such a mechanism would cause minimal interference, enabling consolidation of hippocampus-dependent memory. Episodic memory—that is, memory of places, specific events and their contexts—depends on a synergistic interaction between anatomically related structures within the medial temporal lobe and the neocor- tex 1–3 . The process of consolidating such memories occurs in two consecutive steps that both involve an interplay between hippocam- pus and cortex 4–7 . During the encoding phase, hippocampus rapidly binds neocortical representations to local memory traces, while dur- ing subsequent ‘off-line’ periods of calmness or slow wave sleep (SWS) the new labile traces are concurrently reactivated in hippocampus and cortex to potentiate the corticocortical connections underlying stored representations 5,8 . An increasing number of studies support the view that the memory reactivation phase may be partly instantiated in the occurrences of so- called sharp wave-ripple (SPW-R) complexes 9,10 , which are prom- inent during the off-line states. SPW-Rs are aperiodic, recurrent instances of large deflections (sharp waves) in the hippocampal local-field potential, and they are associated with synchronous fast- field oscillations (ripples), whose frequency depends on anatomical site (for example, CA1, CA3 or entorhinal cortex), animal state (alert or anaesthetized) and animal species 9–13 . Many of the ripple properties support the idea that SPW-Rs may indeed be involved in off-line memory consolidation 5,14 . Their intrinsic frequency and temporal structure are optimal for inducing synaptic plasticity in downstream neurons. Moreover, SPW-Rs have a global nature, reflecting the activation of hippocampal subnetworks and a behaviourally relevant spike content. For example, reactivation of neuronal ensembles that were active during awake experience occurs primarily during rip- ples 15–18 , the number of ripples increases after learning, and the increase seems to predict memory recall both in rats 19–21 and in humans 12 . Conversely, elimination of ripples by the electrical stimu- lation of hippocampus during the post-learning SWS interferes with memory consolidation 22,23 . It is worth noting that SPW-Rs are not idiosyncratic hippocampal episodes, but part of a large-scale complex system of many oscillatory networks, the coupling of which coordinates specific information transfer between neocortical and hippocampal cell assemblies 24–27 . One prominent self-organized oscillatory network involves thalamic and cortical structures, and generates the pattern of slow oscil- lation 28,29 . During this slow (0.5–1.5 Hz) oscillation, the membrane potential of both excitatory and inhibitory cells alternates between depolarized (up) and hyperpolarized (down) states, and these exci- tability phases and their transitions strongly affect the frequency of occurrence of other cortical 30,31 and hippocampal 27,32,33 oscillatory patterns. Specifically, SPW-Rs are temporally linked to cortical spin- dles 24,34,35 , and therefore their frequency of occurrence also correlates with slow oscillations 27,33 . It has been suggested that the slow-oscillation network mentioned above underlies off-line information processing and that it has properties that are affected by learning 36,37 . Clearly, such organization suggests that memory consolidation is a complex system property emerging from the concerted, context- dependent operations of micro- and macro-networks of the brain. In such systems, the organization and operational principles of com- plex systems may be better investigated by using multimodal approaches, including concurrent measurements on multiple spatio- temporal scales. Here we used a novel multimodal methodology, which we call neural-event-triggered functional magnetic resonance imaging (NET-fMRI), to record ripples physiologically in the rhesus monkey (Macaca mulatta) and use them as events to align and average the time courses of brain activations (see Supplementary Methods). Concurrent multi-site hippocampal recordings and whole-brain fMRI were conducted during epochs of spontaneous activity or electrical stimulation of the CA1 and CA3 hippocampal fields to investigate the full extent of brain regions whose activity is modulated at times of ripple occurrence. 1 Max Planck Institute for Biological Cybernetics, Spemannstraße 38, 72076 Tuebingen, Germany. 2 Centre for Imaging Sciences, Biomedical Imaging Institute, The University of Manchester, Manchester M13 9PT, UK. 3 Max Planck Institute for Intelligent Systems, Spemannstraße 38, 72076 Tuebingen, Germany. 22 NOVEMBER 2012 | VOL 491 | NATURE | 547 Macmillan Publishers Limited. All rights reserved ©2012

Welcome message from author
This document is posted to help you gain knowledge. Please leave a comment to let me know what you think about it! Share it to your friends and learn new things together.
Transcript
ARTICLEdoi:10.1038/nature11618
Hippocampal–cortical interaction duringperiods of subcortical silenceN. K. Logothetis1,2, O. Eschenko1, Y. Murayama1, M. Augath1, T. Steudel1, H. C. Evrard1, M. Besserve1,3 & A. Oeltermann1
Hippocampal ripples, episodic high-frequency field-potential oscillations primarily occurring during sleep andcalmness, have been described in mice, rats, rabbits, monkeys and humans, and so far they have been associatedwith retention of previously acquired awake experience. Although hippocampal ripples have been studied in detailusing neurophysiological methods, the global effects of ripples on the entire brain remain elusive, primarily owing toa lack of methodologies permitting concurrent hippocampal recordings and whole-brain activity mapping. Bycombining electrophysiological recordings in hippocampus with ripple-triggered functional magnetic resonanceimaging, here we show that most of the cerebral cortex is selectively activated during the ripples, whereas mostdiencephalic, midbrain and brainstem regions are strongly and consistently inhibited. Analysis of regional temporalresponse patterns indicates that thalamic activity suppression precedes the hippocampal population burst, which itself istemporally bounded by massive activations of association and primary cortical areas. These findings suggest that duringoff-line memory consolidation, synergistic thalamocortical activity may be orchestrating a privileged interaction statebetween hippocampus and cortex by silencing the output of subcortical centres involved in sensory processing orpotentially mediating procedural learning. Such a mechanism would cause minimal interference, enablingconsolidation of hippocampus-dependent memory.
Episodic memory—that is, memory of places, specific events and theircontexts—depends on a synergistic interaction between anatomicallyrelated structures within the medial temporal lobe and the neocor-tex1–3. The process of consolidating such memories occurs in twoconsecutive steps that both involve an interplay between hippocam-pus and cortex4–7. During the encoding phase, hippocampus rapidlybinds neocortical representations to local memory traces, while dur-ing subsequent ‘off-line’ periods of calmness or slow wave sleep (SWS)the new labile traces are concurrently reactivated in hippocampus andcortex to potentiate the corticocortical connections underlying storedrepresentations5,8.
An increasing number of studies support the view that the memoryreactivation phase may be partly instantiated in the occurrences of so-called sharp wave-ripple (SPW-R) complexes9,10, which are prom-inent during the off-line states. SPW-Rs are aperiodic, recurrentinstances of large deflections (sharp waves) in the hippocampallocal-field potential, and they are associated with synchronous fast-field oscillations (ripples), whose frequency depends on anatomicalsite (for example, CA1, CA3 or entorhinal cortex), animal state (alertor anaesthetized) and animal species9–13. Many of the ripple propertiessupport the idea that SPW-Rs may indeed be involved in off-linememory consolidation5,14. Their intrinsic frequency and temporalstructure are optimal for inducing synaptic plasticity in downstreamneurons. Moreover, SPW-Rs have a global nature, reflecting theactivation of hippocampal subnetworks and a behaviourally relevantspike content. For example, reactivation of neuronal ensembles thatwere active during awake experience occurs primarily during rip-ples15–18, the number of ripples increases after learning, and theincrease seems to predict memory recall both in rats19–21 and inhumans12. Conversely, elimination of ripples by the electrical stimu-lation of hippocampus during the post-learning SWS interferes withmemory consolidation22,23.
It is worth noting that SPW-Rs are not idiosyncratic hippocampalepisodes, but part of a large-scale complex system of many oscillatorynetworks, the coupling of which coordinates specific informationtransfer between neocortical and hippocampal cell assemblies24–27.One prominent self-organized oscillatory network involves thalamicand cortical structures, and generates the pattern of slow oscil-lation28,29. During this slow (0.5–1.5 Hz) oscillation, the membranepotential of both excitatory and inhibitory cells alternates betweendepolarized (up) and hyperpolarized (down) states, and these exci-tability phases and their transitions strongly affect the frequency ofoccurrence of other cortical30,31 and hippocampal27,32,33 oscillatorypatterns. Specifically, SPW-Rs are temporally linked to cortical spin-dles24,34,35, and therefore their frequency of occurrence also correlateswith slow oscillations27,33. It has been suggested that the slow-oscillationnetwork mentioned above underlies off-line information processingand that it has properties that are affected by learning36,37.
Clearly, such organization suggests that memory consolidation is acomplex system property emerging from the concerted, context-dependent operations of micro- and macro-networks of the brain.In such systems, the organization and operational principles of com-plex systems may be better investigated by using multimodalapproaches, including concurrent measurements on multiple spatio-temporal scales. Here we used a novel multimodal methodology,which we call neural-event-triggered functional magnetic resonanceimaging (NET-fMRI), to record ripples physiologically in the rhesusmonkey (Macaca mulatta) and use them as events to align andaverage the time courses of brain activations (see SupplementaryMethods). Concurrent multi-site hippocampal recordings andwhole-brain fMRI were conducted during epochs of spontaneousactivity or electrical stimulation of the CA1 and CA3 hippocampalfields to investigate the full extent of brain regions whose activity ismodulated at times of ripple occurrence.
1Max Planck Institute for Biological Cybernetics, Spemannstraße 38, 72076 Tuebingen, Germany. 2Centre for Imaging Sciences, Biomedical Imaging Institute, The University of Manchester, ManchesterM13 9PT, UK. 3Max Planck Institute for Intelligent Systems, Spemannstraße 38, 72076 Tuebingen, Germany.
2 2 N O V E M B E R 2 0 1 2 | V O L 4 9 1 | N A T U R E | 5 4 7
Macmillan Publishers Limited. All rights reserved©2012
Identification of SPW-R complexes in monkeysRecording electrodes were positioned on the basis of individual, high-resolution structural MRI scans and online observation of neuralresponse profiles (Supplementary Methods and SupplementaryFig. 1). Further classification of electrode contacts in pyramidal-layerand stratum radiatum was based on visual detection of oscillationsand inspection of synchronous activity (Supplementary Fig. 2).
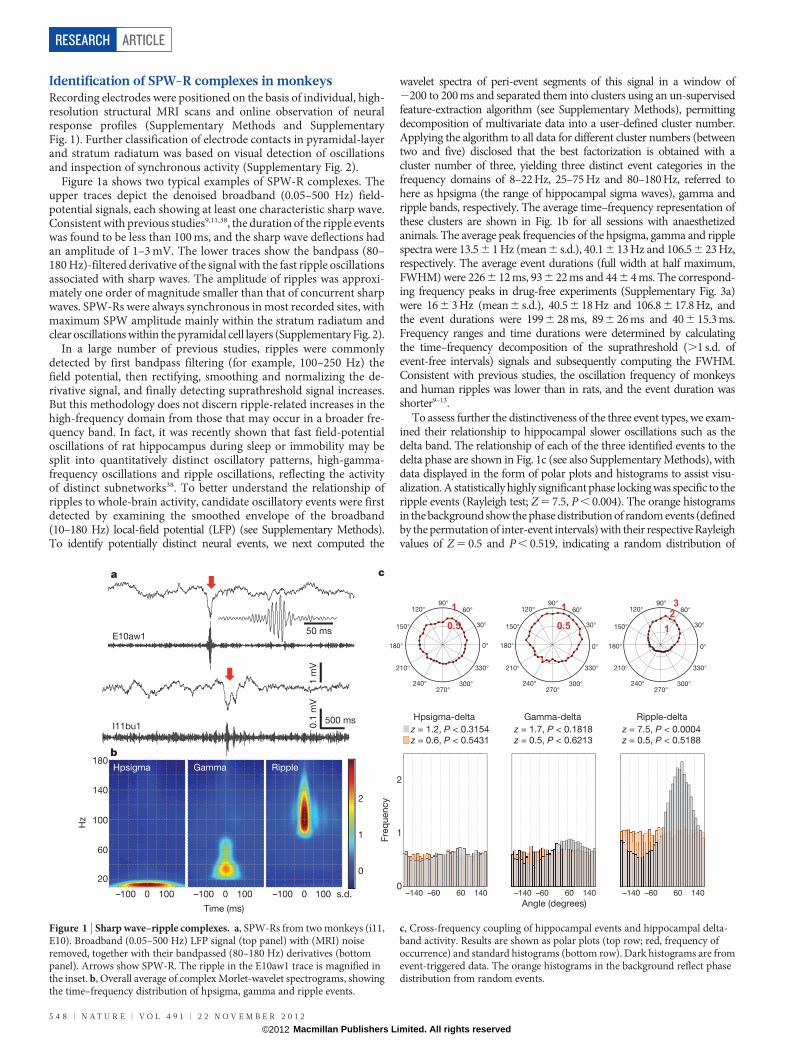
Figure 1a shows two typical examples of SPW-R complexes. Theupper traces depict the denoised broadband (0.05–500 Hz) field-potential signals, each showing at least one characteristic sharp wave.Consistent with previous studies9,11,38, the duration of the ripple eventswas found to be less than 100 ms, and the sharp wave deflections hadan amplitude of 1–3 mV. The lower traces show the bandpass (80–180 Hz)-filtered derivative of the signal with the fast ripple oscillationsassociated with sharp waves. The amplitude of ripples was approxi-mately one order of magnitude smaller than that of concurrent sharpwaves. SPW-Rs were always synchronous in most recorded sites, withmaximum SPW amplitude mainly within the stratum radiatum andclear oscillations within the pyramidal cell layers (Supplementary Fig. 2).
In a large number of previous studies, ripples were commonlydetected by first bandpass filtering (for example, 100–250 Hz) thefield potential, then rectifying, smoothing and normalizing the de-rivative signal, and finally detecting suprathreshold signal increases.But this methodology does not discern ripple-related increases in thehigh-frequency domain from those that may occur in a broader fre-quency band. In fact, it was recently shown that fast field-potentialoscillations of rat hippocampus during sleep or immobility may besplit into quantitatively distinct oscillatory patterns, high-gamma-frequency oscillations and ripple oscillations, reflecting the activityof distinct subnetworks38. To better understand the relationship ofripples to whole-brain activity, candidate oscillatory events were firstdetected by examining the smoothed envelope of the broadband(10–180 Hz) local-field potential (LFP) (see Supplementary Methods).To identify potentially distinct neural events, we next computed the
wavelet spectra of peri-event segments of this signal in a window of2200 to 200 ms and separated them into clusters using an un-supervisedfeature-extraction algorithm (see Supplementary Methods), permittingdecomposition of multivariate data into a user-defined cluster number.Applying the algorithm to all data for different cluster numbers (betweentwo and five) disclosed that the best factorization is obtained with acluster number of three, yielding three distinct event categories in thefrequency domains of 8–22 Hz, 25–75 Hz and 80–180 Hz, referred tohere as hpsigma (the range of hippocampal sigma waves), gamma andripple bands, respectively. The average time–frequency representation ofthese clusters are shown in Fig. 1b for all sessions with anaesthetizedanimals. The average peak frequencies of the hpsigma, gamma and ripplespectra were 13.5 6 1 Hz (mean 6 s.d.), 40.1 6 13 Hz and 106.56 23 Hz,respectively. The average event durations (full width at half maximum,FWHM) were 2266 12 ms, 936 22 ms and 44 6 4 ms. The correspond-ing frequency peaks in drug-free experiments (Supplementary Fig. 3a)were 166 3 Hz (mean 6 s.d.), 40.5 6 18 Hz and 106.8 6 17.8 Hz, andthe event durations were 199 6 28 ms, 896 26 ms and 40 6 15.3 ms.Frequency ranges and time durations were determined by calculatingthe time–frequency decomposition of the suprathreshold (.1 s.d. ofevent-free intervals) signals and subsequently computing the FWHM.Consistent with previous studies, the oscillation frequency of monkeysand human ripples was lower than in rats, and the event duration wasshorter9–13.
To assess further the distinctiveness of the three event types, we exam-ined their relationship to hippocampal slower oscillations such as thedelta band. The relationship of each of the three identified events to thedelta phase are shown in Fig. 1c (see also Supplementary Methods), withdata displayed in the form of polar plots and histograms to assist visu-alization. A statistically highly significant phase locking was specific to theripple events (Rayleigh test; Z 5 7.5, P , 0.004). The orange histogramsin the background show the phase distribution of random events (definedby the permutation of inter-event intervals) with their respective Rayleighvalues of Z 5 0.5 and P , 0.519, indicating a random distribution of
c
Fre
qu
en
cy
0
1
2
–140 –60 60 140
z = 1.2, P < 0.3154z = 0.6, P < 0.5431
Hpsigma-delta
–140 –60 60 140
Angle (degrees)
z = 1.7, P < 0.1818z = 0.5, P < 0.6213
Gamma-delta
–140 –60 60 140
z = 7.5, P < 0.0004z = 0.5, P < 0.5188
Ripple-delta
30°
210°
60°
240°
90°
270°
120°
300°
150°
330°
180° 0°
30°
210°
60°
240°
90°
270°
120°
300°
150°
330°
180° 0°
30°
210°
60°
240°
90°
270°
120°
300°
150°
330°
180° 0°
a
b
I11bu1
1 m
V
500 ms
0.1
mV
E10aw1 50 ms
20
60
100
140
180
Hz
0
1
2
Hpsigma Gamma Ripple
Time (ms)
–100 0 100 –100 0 100 –100 0 100 s.d.
Figure 1 | Sharp wave–ripple complexes. a, SPW-Rs from two monkeys (i11,E10). Broadband (0.05–500 Hz) LFP signal (top panel) with (MRI) noiseremoved, together with their bandpassed (80–180 Hz) derivatives (bottompanel). Arrows show SPW-R. The ripple in the E10aw1 trace is magnified inthe inset. b, Overall average of complex Morlet-wavelet spectrograms, showingthe time–frequency distribution of hpsigma, gamma and ripple events.
c, Cross-frequency coupling of hippocampal events and hippocampal delta-band activity. Results are shown as polar plots (top row; red, frequency ofoccurrence) and standard histograms (bottom row). Dark histograms are fromevent-triggered data. The orange histograms in the background reflect phasedistribution from random events.
RESEARCH ARTICLE
5 4 8 | N A T U R E | V O L 4 9 1 | 2 2 N O V E M B E R 2 0 1 2
Macmillan Publishers Limited. All rights reserved©2012
phases. The mean delta-phase value at which ripples occurred was closeto 90u (84u), that is, preceding but close to the positive–negative transitionof the hippocampal delta wave (see also the average peri-ripple fieldpotential changes in Supplementary Fig. 4a). Similar results wereobtained in the awake monkey experiments (Supplementary Figs 3band 5a).
We then examined the ripple-associated whole-brain activationpatterns using NET-fMRI. Based on the detection and classificationcriteria described above, we observed overall more than 5,000 hpsigmaand gamma events, and more than 11,000 ripple events. However,given the slow nature of the blood-oxygen-level-dependent (BOLD)fMRI signal, we excluded short (,1 s) inter-event intervals and insteadused 3,966 hpsigma, 4,191 gamma and 9,482 ripple events from all theanaesthetized animal sessions to align and average the fMRI timeseries. The average LFP time course for the events used for NET-fMRI are shown in Supplementary Figs 4 and 5, together with thedistribution of their inter-event intervals for anaesthetized and awakeanimal experiments. In addition, Supplementary Fig. 6 shows the dis-tinct nature of individual events by showing selective increases in onefrequency range but not in the others.
Neural-event-triggered BOLD MRIThe aforementioned events were used to map brain response patternsassociated with signal increases in each frequency band. Neural andfMRI time courses were aligned to the time of each event, and theiraverages were convolved with a haemodynamic response function(HRF) and subsequently used as regressors in a standard event-relateddesign (see Supplementary Methods and Supplementary Fig. 6c, d).
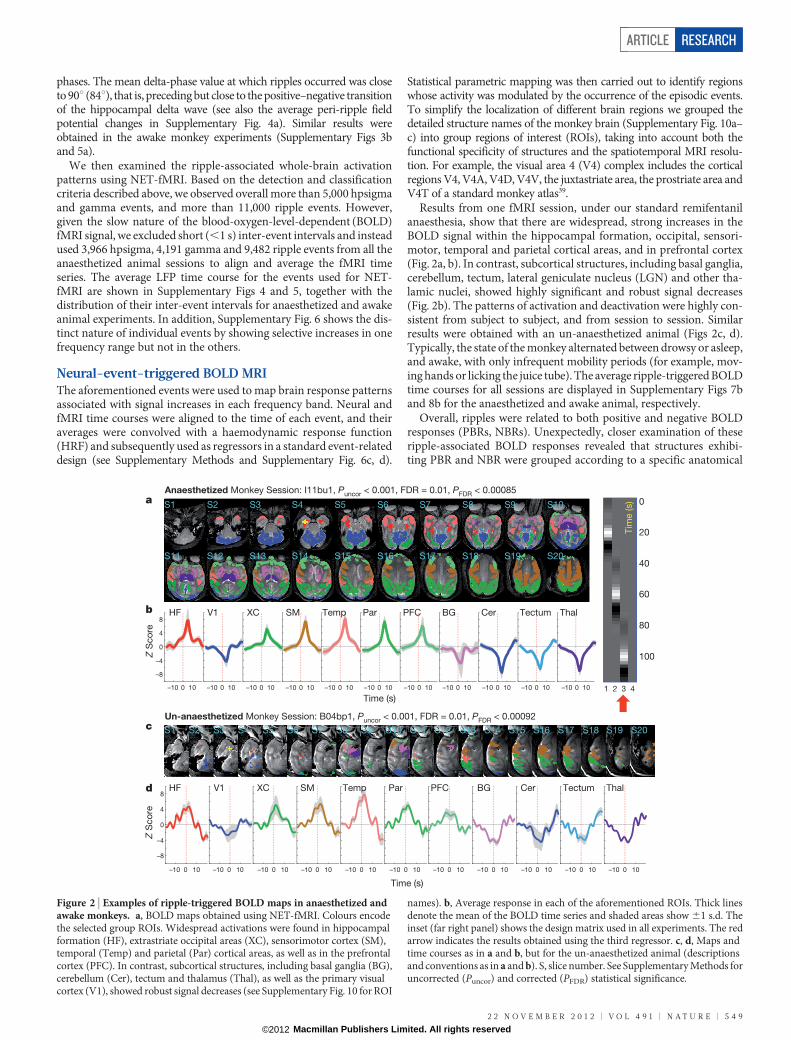
Statistical parametric mapping was then carried out to identify regionswhose activity was modulated by the occurrence of the episodic events.To simplify the localization of different brain regions we grouped thedetailed structure names of the monkey brain (Supplementary Fig. 10a–c) into group regions of interest (ROIs), taking into account both thefunctional specificity of structures and the spatiotemporal MRI resolu-tion. For example, the visual area 4 (V4) complex includes the corticalregions V4, V4A, V4D, V4V, the juxtastriate area, the prostriate area andV4T of a standard monkey atlas39.
Results from one fMRI session, under our standard remifentanilanaesthesia, show that there are widespread, strong increases in theBOLD signal within the hippocampal formation, occipital, sensori-motor, temporal and parietal cortical areas, and in prefrontal cortex(Fig. 2a, b). In contrast, subcortical structures, including basal ganglia,cerebellum, tectum, lateral geniculate nucleus (LGN) and other tha-lamic nuclei, showed highly significant and robust signal decreases(Fig. 2b). The patterns of activation and deactivation were highly con-sistent from subject to subject, and from session to session. Similarresults were obtained with an un-anaesthetized animal (Figs 2c, d).Typically, the state of the monkey alternated between drowsy or asleep,and awake, with only infrequent mobility periods (for example, mov-ing hands or licking the juice tube). The average ripple-triggered BOLDtime courses for all sessions are displayed in Supplementary Figs 7band 8b for the anaesthetized and awake animal, respectively.
Overall, ripples were related to both positive and negative BOLDresponses (PBRs, NBRs). Unexpectedly, closer examination of theseripple-associated BOLD responses revealed that structures exhibi-ting PBR and NBR were grouped according to a specific anatomical
S1
S1 S2 S3 S4 S5 S6 S7 S8 S9 S10 S11 S12 S13 S14 S15 S16 S17 S18 S19 S20
S2 S3 S4 S5 S6 S7 S8 S9 S10
S11 S12 S13 S14 S15 S16 S17 S18 S19 S20
a
1 2 3 4
0
20
40
Tim
e (s)
60
80
100
Un-anaesthetized Monkey Session: B04bp1, Puncor < 0.001, FDR = 0.01, PFDR < 0.00092
Z S
co
re
–8
–4
0
4
8
c
d
Anaesthetized Monkey Session: I11bu1, Puncor < 0.001, FDR = 0.01, PFDR < 0.00085
Time (s)
Time (s)
Z S
co
re
–10 0 10
–10 0 10 –10 0 10 –10 0 10 –10 0 10 –10 0 10 –10 0 10 –10 0 10 –10 0 10 –10 0 10 –10 0 10 –10 0 10
–10 0 10 –10 0 10 –10 0 10 –10 0 10 –10 0 10 –10 0 10 –10 0 10 –10 0 10 –10 0 10 –10 0 10
–8
–4
0
4
8HF ParV1 XC PFC BG Cer Tectum ThalSM Temp
HF ParV1 XC PFC BG Cer Tectum ThalSM Temp
b
Figure 2 | Examples of ripple-triggered BOLD maps in anaesthetized andawake monkeys. a, BOLD maps obtained using NET-fMRI. Colours encodethe selected group ROIs. Widespread activations were found in hippocampalformation (HF), extrastriate occipital areas (XC), sensorimotor cortex (SM),temporal (Temp) and parietal (Par) cortical areas, as well as in the prefrontalcortex (PFC). In contrast, subcortical structures, including basal ganglia (BG),cerebellum (Cer), tectum and thalamus (Thal), as well as the primary visualcortex (V1), showed robust signal decreases (see Supplementary Fig. 10 for ROI
names). b, Average response in each of the aforementioned ROIs. Thick linesdenote the mean of the BOLD time series and shaded areas show 61 s.d. Theinset (far right panel) shows the design matrix used in all experiments. The redarrow indicates the results obtained using the third regressor. c, d, Maps andtime courses as in a and b, but for the un-anaesthetized animal (descriptionsand conventions as in a and b). S, slice number. See Supplementary Methods foruncorrected (Puncor) and corrected (PFDR) statistical significance.
ARTICLE RESEARCH
2 2 N O V E M B E R 2 0 1 2 | V O L 4 9 1 | N A T U R E | 5 4 9
Macmillan Publishers Limited. All rights reserved©2012
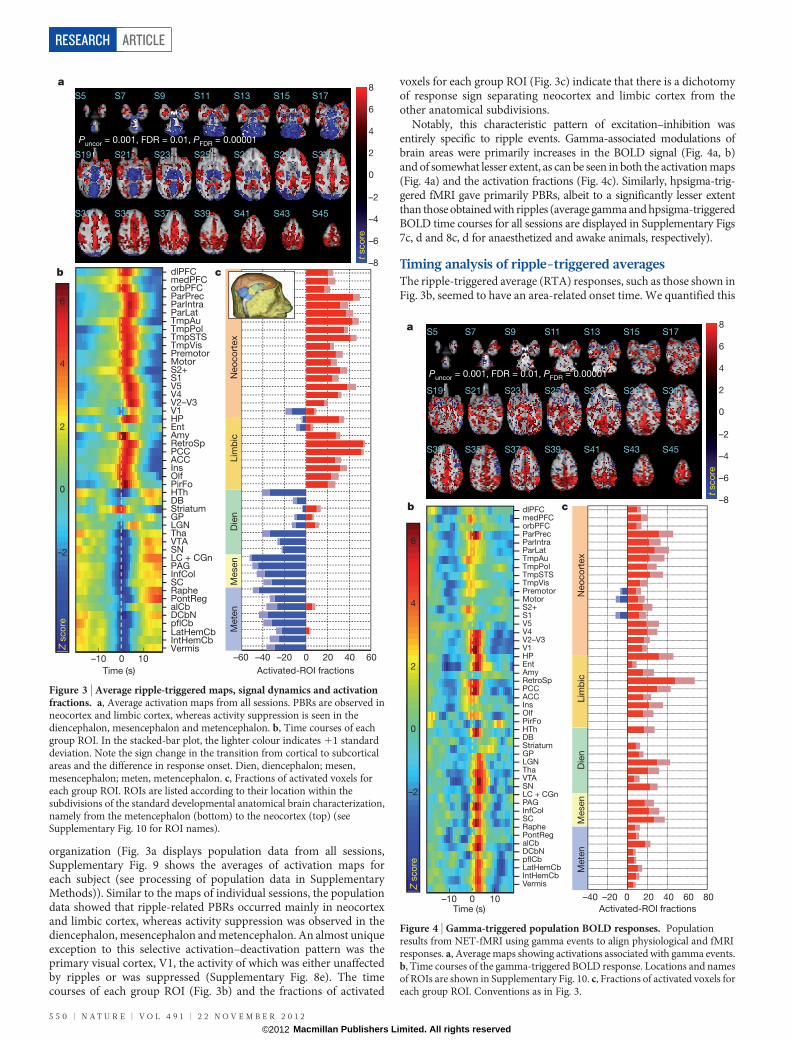
organization (Fig. 3a displays population data from all sessions,Supplementary Fig. 9 shows the averages of activation maps foreach subject (see processing of population data in SupplementaryMethods)). Similar to the maps of individual sessions, the populationdata showed that ripple-related PBRs occurred mainly in neocortexand limbic cortex, whereas activity suppression was observed in thediencephalon, mesencephalon and metencephalon. An almost uniqueexception to this selective activation–deactivation pattern was theprimary visual cortex, V1, the activity of which was either unaffectedby ripples or was suppressed (Supplementary Fig. 8e). The timecourses of each group ROI (Fig. 3b) and the fractions of activated
voxels for each group ROI (Fig. 3c) indicate that there is a dichotomyof response sign separating neocortex and limbic cortex from theother anatomical subdivisions.
Notably, this characteristic pattern of excitation–inhibition wasentirely specific to ripple events. Gamma-associated modulations ofbrain areas were primarily increases in the BOLD signal (Fig. 4a, b)and of somewhat lesser extent, as can be seen in both the activation maps(Fig. 4a) and the activation fractions (Fig. 4c). Similarly, hpsigma-trig-gered fMRI gave primarily PBRs, albeit to a significantly lesser extentthan those obtained with ripples (average gamma and hpsigma-triggeredBOLD time courses for all sessions are displayed in Supplementary Figs7c, d and 8c, d for anaesthetized and awake animals, respectively).
Timing analysis of ripple-triggered averagesThe ripple-triggered average (RTA) responses, such as those shown inFig. 3b, seemed to have an area-related onset time. We quantified this
a
VermisIntHemCbLatHemCbpflCbDCbNalCbPontRegRapheSCInfColPAGLC + CGnSNVTAThaLGNGPStriatumDBHThPirFoOlfInsACCPCCRetroSpAmyEntHPV1V2–V3V4V5S1S2+MotorPremotorTmpVisTmpSTSTmpPolTmpAuParLatParIntraParPrecorbPFCmedPFCdlPFC
Time (s)–10 0 10 –40 –20 0 20 40 60 80
Neo
co
rtex
Lim
bic
Die
nM
esen
Mete
n
Activated-ROI fractions
b c
–2
0
2
4
6
Z s
co
re
S5 S7 S9 S11 S13 S15 S17
S19 S21 S23 S25 S27 S29 S31
S33 S35 S37 S39 S41 S43 S45
Puncor = 0.001, FDR = 0.01, PFDR = 0.00001
–8
–6
–4
–2
0
2
4
6
8
t sco
re
Figure 4 | Gamma-triggered population BOLD responses. Populationresults from NET-fMRI using gamma events to align physiological and fMRIresponses. a, Average maps showing activations associated with gamma events.b, Time courses of the gamma-triggered BOLD response. Locations and namesof ROIs are shown in Supplementary Fig. 10. c, Fractions of activated voxels foreach group ROI. Conventions as in Fig. 3.
a
b c
S5 S7 S9 S11 S13 S15 S17
S19 S21 S23 S25 S27 S29 S31
S33 S35 S37 S39 S41 S43 S45
Puncor = 0.001, FDR = 0.01, PFDR = 0.00001
–8
–6
–4
–2
0
2
4
6
8
t sco
re
VermisIntHemCbLatHemCbpflCbDCbNalCbPontRegRapheSCInfColPAGLC + CGnSNVTAThaLGNGPStriatumDBHThPirFoOlfInsACCPCCRetroSpAmyEntHPV1V2–V3V4V5S1S2+MotorPremotorTmpVisTmpSTSTmpPolTmpAuParLatParIntraParPrecorbPFCmedPFCdlPFC
Time (s)
–10 0 10
–2
0
2
4
6
Z s
co
re
–60 –40 –20 0 20 40 60
Activated-ROI fractions
Neo
co
rtex
Lim
bic
D
ien
M
esen
M
ete
n
Figure 3 | Average ripple-triggered maps, signal dynamics and activationfractions. a, Average activation maps from all sessions. PBRs are observed inneocortex and limbic cortex, whereas activity suppression is seen in thediencephalon, mesencephalon and metencephalon. b, Time courses of eachgroup ROI. In the stacked-bar plot, the lighter colour indicates 11 standarddeviation. Note the sign change in the transition from cortical to subcorticalareas and the difference in response onset. Dien, diencephalon; mesen,mesencephalon; meten, metencephalon. c, Fractions of activated voxels foreach group ROI. ROIs are listed according to their location within thesubdivisions of the standard developmental anatomical brain characterization,namely from the metencephalon (bottom) to the neocortex (top) (seeSupplementary Fig. 10 for ROI names).
RESEARCH ARTICLE
5 5 0 | N A T U R E | V O L 4 9 1 | 2 2 N O V E M B E R 2 0 1 2
Macmillan Publishers Limited. All rights reserved©2012
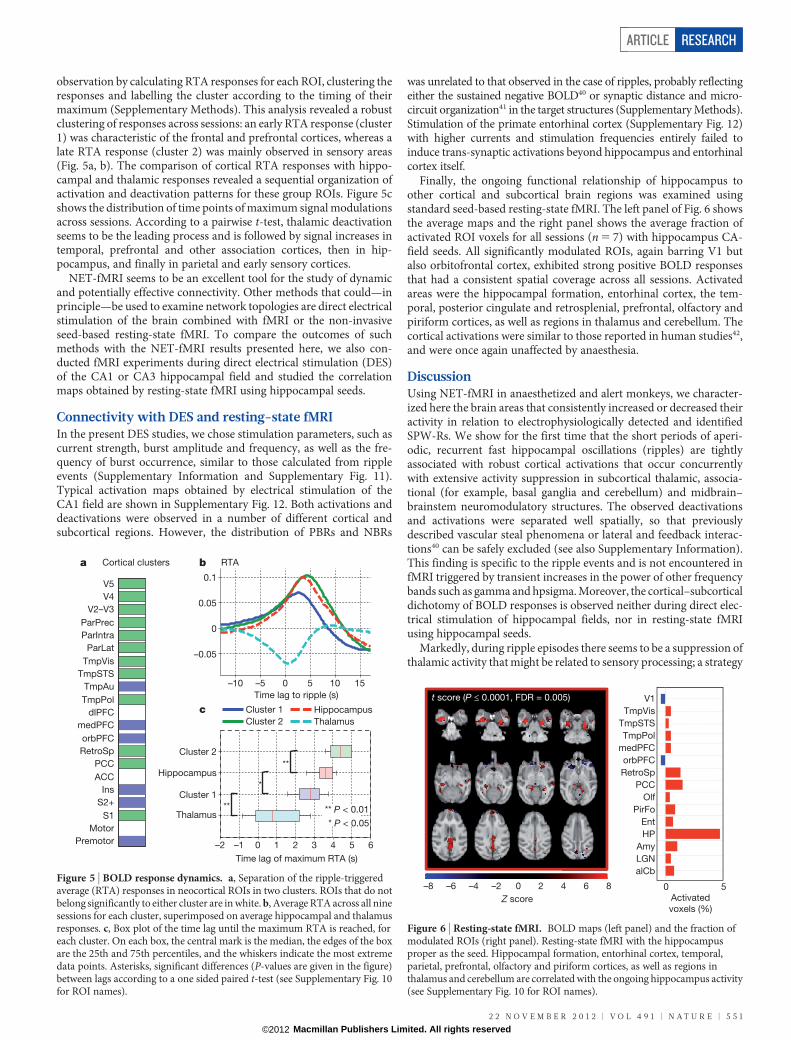
observation by calculating RTA responses for each ROI, clustering theresponses and labelling the cluster according to the timing of theirmaximum (Sepplementary Methods). This analysis revealed a robustclustering of responses across sessions: an early RTA response (cluster1) was characteristic of the frontal and prefrontal cortices, whereas alate RTA response (cluster 2) was mainly observed in sensory areas(Fig. 5a, b). The comparison of cortical RTA responses with hippo-campal and thalamic responses revealed a sequential organization ofactivation and deactivation patterns for these group ROIs. Figure 5cshows the distribution of time points of maximum signal modulationsacross sessions. According to a pairwise t-test, thalamic deactivationseems to be the leading process and is followed by signal increases intemporal, prefrontal and other association cortices, then in hip-pocampus, and finally in parietal and early sensory cortices.
NET-fMRI seems to be an excellent tool for the study of dynamicand potentially effective connectivity. Other methods that could—inprinciple—be used to examine network topologies are direct electricalstimulation of the brain combined with fMRI or the non-invasiveseed-based resting-state fMRI. To compare the outcomes of suchmethods with the NET-fMRI results presented here, we also con-ducted fMRI experiments during direct electrical stimulation (DES)of the CA1 or CA3 hippocampal field and studied the correlationmaps obtained by resting-state fMRI using hippocampal seeds.
Connectivity with DES and resting-state fMRIIn the present DES studies, we chose stimulation parameters, such ascurrent strength, burst amplitude and frequency, as well as the fre-quency of burst occurrence, similar to those calculated from rippleevents (Supplementary Information and Supplementary Fig. 11).Typical activation maps obtained by electrical stimulation of theCA1 field are shown in Supplementary Fig. 12. Both activations anddeactivations were observed in a number of different cortical andsubcortical regions. However, the distribution of PBRs and NBRs
was unrelated to that observed in the case of ripples, probably reflectingeither the sustained negative BOLD40 or synaptic distance and micro-circuit organization41 in the target structures (Supplementary Methods).Stimulation of the primate entorhinal cortex (Supplementary Fig. 12)with higher currents and stimulation frequencies entirely failed toinduce trans-synaptic activations beyond hippocampus and entorhinalcortex itself.
Finally, the ongoing functional relationship of hippocampus toother cortical and subcortical brain regions was examined usingstandard seed-based resting-state fMRI. The left panel of Fig. 6 showsthe average maps and the right panel shows the average fraction ofactivated ROI voxels for all sessions (n 5 7) with hippocampus CA-field seeds. All significantly modulated ROIs, again barring V1 butalso orbitofrontal cortex, exhibited strong positive BOLD responsesthat had a consistent spatial coverage across all sessions. Activatedareas were the hippocampal formation, entorhinal cortex, the tem-poral, posterior cingulate and retrosplenial, prefrontal, olfactory andpiriform cortices, as well as regions in thalamus and cerebellum. Thecortical activations were similar to those reported in human studies42,and were once again unaffected by anaesthesia.
DiscussionUsing NET-fMRI in anaesthetized and alert monkeys, we character-ized here the brain areas that consistently increased or decreased theiractivity in relation to electrophysiologically detected and identifiedSPW-Rs. We show for the first time that the short periods of aperi-odic, recurrent fast hippocampal oscillations (ripples) are tightlyassociated with robust cortical activations that occur concurrentlywith extensive activity suppression in subcortical thalamic, associa-tional (for example, basal ganglia and cerebellum) and midbrain–brainstem neuromodulatory structures. The observed deactivationsand activations were separated well spatially, so that previouslydescribed vascular steal phenomena or lateral and feedback interac-tions40 can be safely excluded (see also Supplementary Information).This finding is specific to the ripple events and is not encountered infMRI triggered by transient increases in the power of other frequencybands such as gamma and hpsigma. Moreover, the cortical–subcorticaldichotomy of BOLD responses is observed neither during direct elec-trical stimulation of hippocampal fields, nor in resting-state fMRIusing hippocampal seeds.
Markedly, during ripple episodes there seems to be a suppression ofthalamic activity that might be related to sensory processing; a strategy
alCb
LGN
Amy
HP
Ent
PirFo
Olf
PCC
RetroSp
orbPFC
medPFC
TmpPol
TmpSTS
TmpVis
V1
0 5–8 –6 –4 –2 0 2 4 6 8
t score (P ≤ 0.0001, FDR = 0.005)
Z score Activated
voxels (%)
Figure 6 | Resting-state fMRI. BOLD maps (left panel) and the fraction ofmodulated ROIs (right panel). Resting-state fMRI with the hippocampusproper as the seed. Hippocampal formation, entorhinal cortex, temporal,parietal, prefrontal, olfactory and piriform cortices, as well as regions inthalamus and cerebellum are correlated with the ongoing hippocampus activity(see Supplementary Fig. 10 for ROI names).
Cortical clustersa RTAb
Premotor
Motor
S1
S2+
Ins
ACC
PCC
RetroSp
orbPFC
medPFC
dlPFC
TmpPol
TmpAu
TmpSTS
TmpVis
ParLat
ParIntra
ParPrec
V2–V3
V4
V5
Cluster 1
Cluster 2
Hippocampus
Thalamus
–2 –1 0 1 2 3 4 5 6
Thalamus
Cluster 1
Hippocampus
Cluster 2
Time lag of maximum RTA (s)
**
*
** ** P < 0.01
* P < 0.05
–10 –5 0 5 10 15
–0.05
0
0.05
0.1
Time lag to ripple (s)
c
Figure 5 | BOLD response dynamics. a, Separation of the ripple-triggeredaverage (RTA) responses in neocortical ROIs in two clusters. ROIs that do notbelong significantly to either cluster are in white. b, Average RTA across all ninesessions for each cluster, superimposed on average hippocampal and thalamusresponses. c, Box plot of the time lag until the maximum RTA is reached, foreach cluster. On each box, the central mark is the median, the edges of the boxare the 25th and 75th percentiles, and the whiskers indicate the most extremedata points. Asterisks, significant differences (P-values are given in the figure)between lags according to a one sided paired t-test (see Supplementary Fig. 10for ROI names).
ARTICLE RESEARCH
2 2 N O V E M B E R 2 0 1 2 | V O L 4 9 1 | N A T U R E | 5 5 1
Macmillan Publishers Limited. All rights reserved©2012
that could increase the signal-to-noise ratio of hippocampal–corticalcommunication. In addition, there is a strong inhibition of large por-tions of the associational subcortical brain structures that are closelyinvolved in the mechanisms of neural plasticity. For example, the deac-tivation of the basal ganglia, the pontine region and the cerebellar cortexseems to be consistent with prior evidence of competition between thefundamentally distinct declarative and non-declarative memory sys-tems (see ref. 43 and discussion in Supplementary Information).
The majority of previous studies report competition between mem-ory systems during the execution of various learning tasks, but evid-ence of post-learning antagonistic interactions between memorysystems has also been reported in animal lesion and intra-hippocam-pal inactivation studies44,45. These findings suggested that competitiveinterference between multiple memory systems may in part occurduring the memory consolidation period46. Such ‘competition’ mayreflect an adaptive mechanism for optimizing behaviour that isdependent on learning demands, and its physiological basis is ofparamount importance for both basic research and clinical applica-tions. Evidently, the actual neuroanatomical interaction nodesbetween various memory systems that may underlie the deactivationsobserved here remain to be elucidated in future experiments involvingfurther imaging and multi-site electrophysiological recordings.Nevertheless, we show here for the first time that some form of com-petition between various memory systems may exist at the time ofoccurrence of SPW-Rs, during the off-line states. If competitive oreven mutually exclusive dynamic connectivity does actually exist itcould provide low interference during the consolidation of multiplememory traces.
Another observation is the selective suppression of V1 activityduring SPW-Rs, despite the overall positive BOLD responses in theother primary sensory and associational cortices. Such distinct deac-tivation of V1 may be the result of brief, selective suppression of thebrain sites related to so-called ponto-geniculo-occipital (PGO) waves,that is, the phasic field potentials recorded from the pons, LGN, andV1 (ref. 47) during the hippocampal–cortical dialogue (see Sup-plementary Information).
The dynamics of regional fMRI responses suggest that an initialthalamic activity suppression is followed by signal increases in asso-ciation cortices, then in hippocampus, and finally in parietal and earlysensory cortices. Ripples were the only events that were significantlylocked to the positive–negative transition phase of the local slowoscillation, at least in the delta-band cycles. This temporal structuremay well reflect the systematic relationship between thalamocorticaland hippocampal oscillations that is well known from several electro-physiological studies in animal and humans. As briefly mentionedabove, neocortical slow wave oscillations were shown to temporallyorganize other cortical and hippocampal patterns26,27,30–33, whichthemselves are temporally linked to spindles24,34,35. In addition,human SPW-Rs seem to be phase locked to hippocampal delta oscil-lations, indicating that the coupling between neocortical slow oscilla-tions and SPW-Rs may be accomplished by the intermediate phaselocking of ripples to the local, hippocampal delta-band activity, whichis itself phase locked to neocortical slow oscillations48,49. Our currentfindings further support the idea that hippocampal delta provides anintermediate synchronization mechanism between cortex and hip-pocampus. However, it is surprising that such a synchronizationoccurs concurrently with the interruption of activity in a large numberof other structures.
It is worth noting again here that both gamma and hpsigma eventscorrelated with widespread (albeit of lesser spatial extent) modula-tions of brain areas, and that these modulations were primarilyincreases in the BOLD signal. As BOLD is known to be particularlysensitive to increase in gamma power50, such widespread gamma-related activations may be indicative of episodic synchronousincreases of subcortical and cortical regional gamma power that occurduring the off-line states. Hippocampal transient high-gamma
episodes have already been described in rats38, but their functionalsignificance is yet to be studied.
In summary, the present study demonstrates the advantage of usingmultimodal methodologies for the study of emerging properties of acomplex system such as the brain. Ripples are characteristic hippo-campal events, and their use as a ‘trigger’ has revealed up- and down-regulation of widespread network activity. Yet, a note of caution maybe necessary to avoid misinterpretation of the functional importanceof such events. Neither the activation maps nor the sequences of up-and down-regulation should be thought of indicating a causal rela-tionship between the trigger event and the network activity changes.The state of widespread networks probably depends on a large num-ber of variables (for example, activity changes in individual structures,or changes in inter-structure correlations), a subset of which may beeventually characterized following intensive future experimentation.The outcome of each experimental session may be conceived as apartially ordered sequence of system states, and such a sequencemay indeed provide information related to memory. However, eventsin isolation are likely to be indicators rather than effectors of anycognitive capacity.
METHODS SUMMARYAll surgical and experimental procedures were approved by the local authorities(Regierungspraesidium, Tubingen Referat 35, Veterinarwesen) and were in fullcompliance with the guidelines of the European Community (EUVD 86/609/EEC) for the care and use of laboratory animals.
Received 3 June; accepted 24 September 2012.
1. Squire, L. R. Memory and the hippocampus: a synthesis from findings with rats,monkeys, and humans. Psychol. Rev. 99, 195–231 (1992).
2. Eichenbaum, H. Declarative memory: insights from cognitive neurobiology. Annu.Rev. Psychol. 48, 547–572 (1997).
3. Nadel, L. & Hardt, O. Update on memory systems and processes.Neuropsychopharmacology 36, 251–273 (2011).
4. Buzsaki, G. Two-stage model of memory trace formation: a role for ‘‘noisy’’ brainstates. Neuroscience 31, 551–570 (1989).
5. Buzsaki, G. The hippocampo–neocortical dialogue. Cereb. Cortex 6, 81–92 (1996).6. Hasselmo, M. E. Neuromodulation and the hippocampus: memory function and
dysfunction in a network simulation. Prog. Brain Res. 121, 3–18 (1999).7. Pennartz, C. M. A., Uylings, H. B. M., Barnes, C. A. & McNaughton, B. L. Memory
reactivation and consolidation during sleep: from cellular mechanisms to humanperformance. Prog. Brain. Res. 138, 143–166 (2002).
8. Eichenbaum, H. A cortical-hippocampal system for declarative memory. NatureRev. Neurosci. 1, 41–50 (2000).
9. Buzsaki, G., Horvath, Z., Urioste, R., Hetke, J. & Wise, K. High-frequency networkoscillation in the hippocampus. Science 256, 1025–1027 (1992).
10. O’Keefe, J. & Nadel, L. The Hippocampus as a Cognitive Map 114–152 (Oxford Univ.Press, 1978).
11. Skaggs, W. E. et al. EEG sharp waves and sparse ensemble unit activity in themacaque hippocampus. J. Neurophysiol. 98, 898–910 (2007).
12. Axmacher, N., Elger, C. E. & Fell, J. Ripples in the medial temporal lobe are relevantfor human memory consolidation. Brain 131, 1806–1817 (2008).
13. Ylinen, A. et al. Sharp wave-associated high-frequency oscillation (200 Hz) in theintact hippocampus: network and intracellular mechanisms. J. Neurosci. 15,30–46 (1995).
14. Girardeau, G. & Zugaro, M. Hippocampal ripples and memory consolidation. Curr.Opin. Neurobiol. 21, 452–459 (2011).
15. Wilson, M. A. & McNaughton, B. L. Reactivation of hippocampal ensemblememories during sleep. Science 265, 676–679 (1994).
16. Kudrimoti, H. S., Barnes, C. A. & McNaughton, B. L. Reactivation of hippocampalcell assemblies: effects of behavioral state, experience, and EEG dynamics.J. Neurosci. 19, 4090–4101 (1999).
17. Nadasdy, Z., Hirase, H., Czurko, A., Csicsvari, J. & Buzsaki, G. Replay and timecompression of recurring spike sequences in the hippocampus. J. Neurosci. 19,9497–9507 (1999).
18. Skaggs, W. E. & McNaughton, B. L. Replay of neuronal firing sequences in rathippocampus during sleep following spatial experience.Science 271, 1870–1873(1996).
19. Eschenko, O., Ramadan, W., Molle, M., Born, J. & Sara, S. J. Sustained increase inhippocampal sharp-wave ripple activity during slow-wave sleep after learning.Learn. Mem. 15, 222–228 (2008).
20. O’Neill, J., Senior, T. J., Allen, K., Huxter, J. R. & Csicsvari, J. Reactivation ofexperience-dependent cell assembly patterns in the hippocampus. NatureNeurosci. 11, 209–215 (2008).
21. Ramadan, W., Eschenko, O. & Sara, S. J. Hippocampal sharp wave/ripples duringsleep for consolidation of associative memory. PloS ONE 4, e6697 (2009).
RESEARCH ARTICLE
5 5 2 | N A T U R E | V O L 4 9 1 | 2 2 N O V E M B E R 2 0 1 2
Macmillan Publishers Limited. All rights reserved©2012
22. Girardeau, G., Benchenane, K., Wiener, S. I., Buzsaki, G. & Zugaro, M. B. Selectivesuppression of hippocampal ripples impairs spatial memory. Nature Neurosci. 12,1222–1223 (2009).
23. Ego-Stengel, V. & Wilson, M. A. Disruption of ripple-associated hippocampalactivity during rest impairs spatial learning in the rat. Hippocampus 20, 1–10(2010).
24. Siapas, A. G. & Wilson, M. A. Coordinated interactions between hippocampalripples and cortical spindles during slow-wave sleep. Neuron 21, 1123–1128(1998).
25. Wierzynski, C. M., Lubenov, E. V., Gu, M. & Siapas, A. G. State-dependent spike-timing relationships between hippocampal and prefrontal circuits during sleep.Neuron 61, 587–596 (2009).
26. Isomura, Y. et al. Integration andsegregation of activity in entorhinal–hippocampalsubregions by neocortical slow oscillations. Neuron 52, 871–882 (2006).
27. Sirota, A., Csicsvari, J., Buhl, D. & Buzsaki, G. Communication between neocortexand hippocampus during sleep in rodents. Proc. Natl Acad. Sci. USA 100,2065–2069 (2003).
28. Steriade, M., Nunez, A. & Amzica, F. A novel slow ( 1Hz) oscillation of neocorticalneurons in vivo: depolarizing and hyperpolarizing components. J. Neurosci. 13,3252–3265 (1993).
29. McCormick,D. A. & Bal, T. Sleep andarousal—thalamocorticalmechanisms. Annu.Rev. Neurosci. 20, 185–215 (1997).
30. Molle, M., Marshall, L., Gais, S. & Born, J. Grouping of spindle activity during slowoscillations in human non-rapid eye movement sleep. J. Neurosci. 22,10941–10947 (2002).
31. Amzica, F. & Steriade, M. The K-complex: its slow ( 1-Hz) rhythmicity and relationto delta waves. Neurology 49, 952–959 (1997).
32. Battaglia,F.P.,Sutherland,G.R.&McNaughton,B.L.Hippocampalsharpwaveburstscoincide with neocortical ‘‘up-state’’ transitions. Learn. Mem. 11, 697–704 (2004).
33. Molle, M., Yeshenko, O., Marshall, L., Sara, S. J. & Born, J. Hippocampal sharp wave-ripples linked to slowoscillations in rat slow-wave sleep. J. Neurophysiol. 96, 62–70(2006).
34. Clemens, Z. et al. Temporal coupling of parahippocampal ripples, sleep spindlesand slow oscillations in humans. Brain 130, 2868–2878 (2007).
35. Axmacher, N., Mormann, F., Fernandez, G., Elger, C. E. & Fell, J. Memory formationby neuronal synchronization. Brain Res. Rev. 52, 170–182 (2006).
36. Born, J. Slow-wave sleep and the consolidation of long-term memory. World J. Biol.Psychiatry 11, 16–21 (2010).
37. Steriade,M. Thecorticothalamic system insleep. Front. Biosci. 8,d878–d899 (2003).38. Sullivan, D. et al. Relationships between hippocampal sharp waves, ripples, and
fast gamma oscillation: influence of dentate and entorhinal cortical activity.J. Neurosci. 31, 8605–8616 (2011).
39. Paxinos, G., Huang, X. F., Petrides, M. & Toga, A. W. The Rhesus Monkey Brain inStereotactic Coordinates (Elsevier, 2008).
40. Shmuel, A., Augath, M. A., Oeltermann, A. & Logothetis, N. K. Negative functionalMRI response correlates with decreases in neuronal activity in monkey visual areaV1. Nature Neurosci. 9, 569–577 (2006).
41. Logothetis, N. K. et al. The effects of electrical microstimulation on cortical signalpropagation. Nature Neurosci. 13, 1283–1291 (2010).
42. Vincent, J. L.et al.Coherent spontaneousactivity identifies a hippocampal–parietalmnemonic network. J. Neurophysiol. 96, 3517–3531 (2006).
43. Poldrack, R. A. & Packard, M. G. Competition among multiple memory systems:converging evidence from animal and human brain studies. Neuropsychologia 41,245–251 (2003).
44. Schroeder, J. P., Wingard, J.C.& Packard,M.G.Post-training reversible inactivationofhippocampus reveals interference between memorysystems. Hippocampus12,280–284 (2002).
45. Oliveira, A. M., Hawk, J. D., Abel, T. & Havekes, R. Post-training reversibleinactivation of the hippocampus enhances novel object recognition memory.Learn. Mem. 17, 155–160 (2010).
46. Poldrack, R. A. & Rodriguez, P. How do memory systems interact? Evidence fromhuman classification learning. Neurobiol. Learn. Mem. 82, 324–332 (2004).
47. Mouret, J., Jeannero, M. & Jouvet, M. L9activite electrique du systeme visuel aucours de la phase paradoxale du sommeil chez le chat. J. Physiol. (Paris) 55,305–306 (1963).
48. Wolansky, T., Clement, E. A., Peters, S. R., Palczak, M. A. & Dickson, C. T.Hippocampal slow oscillation: a novel EEG state and its coordination with ongoingneocortical activity. J. Neurosci. 26, 6213–6229 (2006).
49. Axmacher, N., Elger, C. E. & Fell, J. Memory formation by refinement of neuralrepresentations: the inhibition hypothesis. Behav. Brain Res. 189, 1–8 (2008).
50. Logothetis, N. K. What we can do and what we cannot do with fMRI. Nature 453,869–878 (2008).
Supplementary Information is available in the online version of the paper.
Acknowledgements We thank D. Omer and M. Munk for reading the manuscript andfor useful suggestions, D. Blaurock for English language corrections and editing, andP. Douay for help with the alert monkey experiments. This research was supported bythe Max Planck Society.Weapologize to those whosework wehavenot been able to citefor reasons of space.
Author Contributions N.K.L and O.E. designed the experiments and carried outresearch. N.K.L. analysed the data, wrote the manuscript and supervised the research.Y.M. carried out research and, together with M.B., contributed data analysis. M.A. andT.S. collected the physiology fMRI data, H.C.E. helped with all anatomical detailsrequired to define ROIs andenable three-dimensional registration of functional imagesto standard anatomical scans, and A.O. designed and developed all electronics andelectrodespermittingconcurrentmultiple-contactelectrophysiological recordingsandfMRI.
Author Information Reprints and permissions information is available atwww.nature.com/reprints. The authors declare no competing financial interests.Readers are welcome to comment on the online version of the paper. Correspondenceand requests for materials should be addressed to N.K.L.([email protected]).
ARTICLE RESEARCH
2 2 N O V E M B E R 2 0 1 2 | V O L 4 9 1 | N A T U R E | 5 5 3
Macmillan Publishers Limited. All rights reserved©2012
Related Documents