Gautam Duggad ([email protected]); +91 22 3982 5404 Manish Poddar ([email protected]) / Vishal Punmiya ([email protected]) 9 June 2015 Annual Report Update | Sector: Consumer Hindustan Unilever CMP: INR820 TP: INR875 (+7%) Neutral Fundamentals strengthened; demand growth is key RoE contracts (still in triple digits); payout ratio at ~86% Key takeaways from HUVR’s FY15 annual report are: Though ahead of market, HUVR’s volume growth remains muted; FY15 witnessed moderation in demand despite improved consumer sentiment. New initiatives in Go-To-Market; accelerated pace of innovation. RoE contracts, but still in triple digits. Higher working capital impacts FCF. Overall, HUVR has further strengthened its fundamentals in FY15. Retain Neutral on expensive valuations. Domestic volume growth continues to be soft; broad-based moderation: HUVR posted sales growth of 9.9% YoY to INR308b, with even volume and price/mix-led growth. Volume growth of 4.8% was slightly better than 4% in FY14, but lower than the five-year average volume growth (7.5%). Demand environment continued to be soft across categories, channels and geographies, as per the management. Soaps & detergent and personal products segments posted sales growth of 8.7% and 10.9% respectively. Beverages registered 9.7% revenue growth and processed foods 12.2%. Soaps and detergents contributed 43% of incremental value growth, while personal products contributed 32%. Gross and EBITDA margins expand 30bp and 60bp, respectively: Gross margin expanded 30bp to 49.1% in FY15, led by softening in crude and crude derivatives prices in 2HFY15 (PFAD prices corrected by 23% and LAB prices by 25% YoY). Lower ad spends (down 30bp YoY) aided EBITDA margin expansion of 60bps to 16.6%. Soaps and detergents EBIT margin expanded 60bp YoY (lower input costs offset by price cuts initiated in 2HFY15). Personal products EBIT margin expanded 150bp YoY, led by mix improvement and lower input costs. Recurring PBT grew 12.9% YoY to INR54b; however higher tax rate (up 420bp YoY) resulted in modest 6.5% recurring PAT growth. Balance sheet: Slight contraction in RoE (still in triple digits); payout ratio 86%: Cash conversion cycle went up by two days over FY14, led by decline in payable days (working capital still negative). RoE came off from 120% to 108%, primarily due to lower PAT margins (impacted by higher tax rate). FCF declined 19% due to higher tax rate and working capital. Dividend payout stood at 86%. Project WIMI (Winning in Many Indias): HUVR has launched Project WIMI for better focus on market execution and store throughput. As part of this project, it has added branches in UP, MP, Bihar, Chhattisgarh and Rajasthan. It now has five branches and 14 consumer clusters v/s four branches earlier. The combined population of these is ~500mn, with much lower per capita consumption and penetration v/s average levels (50-60% of average BSE Sensex S&P CNX 26,481 8,022 Stock Info Bloomberg HUVR IN Equity Shares (m) 2,163.1 52-Week Range (INR) 979/610 1, 6, 12 Rel. Per (%) -6/7/26 M.Cap. (INR b) 1,872.2 M.Cap. (USD b) 29.9 AvgVal. INRm/Vol‘000 1228/1550 Free float (%) 32.8 Financial Snapshot (INR Billion) Y/E March 2015 2016E 2017E Net Sales 301.7 340.5 392.2 EBITDA 51.0 61.6 74.7 Adj PAT 37.9 45.2 53.5 EPS (INR) 17.5 20.9 24.7 Gr. (%) 6.4 19.5 18.3 BV/Sh.INR 17.2 18.4 19.1 RoE (%) 108.2 117.4 131.8 RoCE (%) 145.0 160.2 185.7 P/E (x) 46.9 39.2 33.2 P/BV (x) 47.6 44.6 42.8 Shareholding pattern (%) As on Mar-15 Dec-14 Mar-14 Promoter 67.2 67.2 67.3 DII 3.8 3.9 4.1 FII 15.0 15.0 14.1 Others 13.9 13.9 14.5 *Note: FII includes depository receipts Stock Performance (1-year) 500 650 800 950 1,100 Jun-14 Sep-14 Dec-14 Mar-15 Jun-15 Hind. Unilever Sensex - Rebased Investors are advised to refer through disclosures made at the end of the Research Report. Motilal Oswal research is available on www.motilaloswal.com/Institutional-Equities , Bloomberg, Thomson Reuters, Factset and S&P Capital.

Welcome message from author
This document is posted to help you gain knowledge. Please leave a comment to let me know what you think about it! Share it to your friends and learn new things together.
Transcript
Gautam Duggad ([email protected]); +91 22 3982 5404
Manish Poddar ([email protected]) / Vishal Punmiya ([email protected])
9 June 2015
Annual Report Update | Sector: Consumer
Hindustan Unilever CMP: INR820 TP: INR875 (+7%) Neutral
Fundamentals strengthened; demand growth is key RoE contracts (still in triple digits); payout ratio at ~86%
Key takeaways from HUVR’s FY15 annual report are: Though ahead of market, HUVR’s volume growth remains muted; FY15 witnessed
moderation in demand despite improved consumer sentiment. New initiatives in Go-To-Market; accelerated pace of innovation. RoE contracts, but still in triple digits. Higher working capital impacts FCF. Overall, HUVR has further strengthened its fundamentals in FY15. Retain Neutral
on expensive valuations.
Domestic volume growth continues to be soft; broad-based moderation: HUVR posted sales growth of 9.9% YoY to INR308b, with even volume and price/mix-led growth. Volume growth of 4.8% was slightly better than 4% in FY14, but lower than the five-year average volume growth (7.5%). Demand environment continued to be soft across categories, channels and geographies, as per the management. Soaps & detergent and personal products segments posted sales growth of 8.7% and 10.9% respectively. Beverages registered 9.7% revenue growth and processed foods 12.2%. Soaps and detergents contributed 43% of incremental value growth, while personal products contributed 32%.
Gross and EBITDA margins expand 30bp and 60bp, respectively: Gross margin expanded 30bp to 49.1% in FY15, led by softening in crude and crude derivatives prices in 2HFY15 (PFAD prices corrected by 23% and LAB prices by 25% YoY). Lower ad spends (down 30bp YoY) aided EBITDA margin expansion of 60bps to 16.6%. Soaps and detergents EBIT margin expanded 60bp YoY (lower input costs offset by price cuts initiated in 2HFY15). Personal products EBIT margin expanded 150bp YoY, led by mix improvement and lower input costs. Recurring PBT grew 12.9% YoY to INR54b; however higher tax rate (up 420bp YoY) resulted in modest 6.5% recurring PAT growth.
Balance sheet: Slight contraction in RoE (still in triple digits); payout ratio 86%: Cash conversion cycle went up by two days over FY14, led by decline in payable days (working capital still negative). RoE came off from 120% to 108%, primarily due to lower PAT margins (impacted by higher tax rate). FCF declined 19% due to higher tax rate and working capital. Dividend payout stood at 86%.
Project WIMI (Winning in Many Indias): HUVR has launched Project WIMI for better focus on market execution and store throughput. As part of this project, it has added branches in UP, MP, Bihar, Chhattisgarh and Rajasthan. It now has five branches and 14 consumer clusters v/s four branches earlier. The combined population of these is ~500mn, with much lower per capita consumption and penetration v/s average levels (50-60% of average
BSE Sensex S&P CNX 26,481 8,022
Stock Info Bloomberg HUVR IN
Equity Shares (m) 2,163.1
52-Week Range (INR) 979/610
1, 6, 12 Rel. Per (%) -6/7/26
M.Cap. (INR b) 1,872.2
M.Cap. (USD b) 29.9
AvgVal. INRm/Vol‘000 1228/1550
Free float (%) 32.8
Financial Snapshot (INR Billion) Y/E March 2015 2016E 2017E Net Sales 301.7 340.5 392.2 EBITDA 51.0 61.6 74.7 Adj PAT 37.9 45.2 53.5 EPS (INR) 17.5 20.9 24.7 Gr. (%) 6.4 19.5 18.3 BV/Sh.INR 17.2 18.4 19.1 RoE (%) 108.2 117.4 131.8 RoCE (%) 145.0 160.2 185.7 P/E (x) 46.9 39.2 33.2 P/BV (x) 47.6 44.6 42.8
Shareholding pattern (%)
As on Mar-15 Dec-14 Mar-14
Promoter 67.2 67.2 67.3
DII 3.8 3.9 4.1
FII 15.0 15.0 14.1 Others 13.9 13.9 14.5 *Note: FII includes depository receipts
Stock Performance (1-year)
500
650
800
950
1,100
Jun-
14
Sep-
14
Dec
-14
Mar
-15
Jun-
15
Hind. Unilever Sensex - Rebased
Investors are advised to refer through disclosures made at the end of the Research Report.
Motilal Oswal research is available on www.motilaloswal.com/Institutional-Equities, Bloomberg, Thomson Reuters, Factset and S&P Capital.

Hindustan Unilever
9 June 2015 2
consumption). This is expected to result in a) faster response in market, b) smaller teams with better focus, c) better execution, and d) better infrastructure for improved delivery standards.
Valuation and view: During the last two years of consumer demand slowdown, HUVR built strong fundamentals through distribution expansion, cost savings in P&L and sharper in-market execution on innovations. This has bolstered its ability to respond to the competitive forces faster. However, valuations at 39x FY16E and 33x FY17E EPS are rich, in our view. Maintain Neutral with a target price of INR875 (35x FY17E EPS).

Hindustan Unilever
9 June 2015 3
Sales up 9.9% in FY15; domestic volume growth remains soft HUVR posted sales growth of 9.9% YoY to INR308b, with even volume and
price/mix-led growth. Volume growth of 4.8% was slightly better than 4% in FY14, but lower than the five-year average volume growth (7.5%). Demand environment remained soft across categories, channels and geographies, as per the management. Soaps & detergents segment contributed 43% of incremental value growth, while personal products segment contributed 32%.
Exhibit 1: HUVR posted 11.8% sales CAGR over FY11-15
Source: Company, MOSL
Exhibit 2: …with even volume and price/mix-led growth in FY15
Source: Company, MOSL
Exhibit 3: Financial overview of Hindustan Unilever INR m FY10 % FY11 % FY12 % FY13 % FY14 % FY15 %
Total Revenues 177,253 100.0 197,355 100.0 221,164 100.0 258,102 100.0 280,191 100.0 308,056 100.0
Raw Material Consumed 52,523 29.6 58,854 29.8 66,833 30.2 82,882 32.1 89,122 31.8 94,359 30.6
Oils, fats and resins 8,293 4.7 11,637 5.9 13,951 6.3 16,155 6.3 17,110 6.1 19,289 6.3
Chemical and perfumes 25,143 14.2 29,071 14.7 36,399 16.5 46,126 17.9 48,882 17.4 50,726 16.5
Tea 10,576 6.0 11,130 5.6 9,198 4.2 11,871 4.6 13,365 4.8 14,654 4.8
Others 8,511 4.8 7,017 3.6 7,286 3.3 8,730 3.4 9,765 3.5 9,691 3.1
Change in stock -227 -0.1 -2,905 -1.5 1,287 0.6 -311 -0.1 -1,664 -0.6 583 0.2
Purchase of finished goods 22,917 12.9 28,181 14.3 30,241 13.7 32,353 12.5 33,502 12.0 37,695 12.2
Packaging Material 13,566 7.7 16,651 8.4 19,016 8.6 19,965 7.7 22,476 8.0 24,314 7.9
Gross Profit 88,474 49.9 96,574 48.9 103,786 46.9 123,214 47.7 136,755 48.8 151,106 49.1
Manpower expenses 9,363 5.3 9,613 4.9 11,073 5.0 13,183 5.1 14,360 5.1 16,438 5.3
Manufacturing Expenses 8,057 4.5 9,108 4.6 9,225 4.2 10,108 3.9 10,778 3.8 11,123 3.6
Processing charges 1793.5 1.0 1964.3 1.0 2460 1.1 2710.1 1.1 3541.2 1.3 3807.8 1.2
Heat light and power 2,443 1.4 2,747 1.4 2,852 1.3 3,199 1.2 3,211 1.1 3,046 1.0
Selling, Gen & Admin Expenses 19,060 10.8 22,541 11.4 23,268 10.5 26,270 10.2 29,376 10.5 32,745 10.6
Freight 8,676 4.9 10,452 5.3 10,705 4.8 11,430 4.4 12,977 4.6 14,115 4.6
Royalty 1,578 0.9 2,689 1.4 2,933 1.3 3,761 1.5 5,253 1.9 7,355 2.4
Miscellaneous expenses 7,286 4.1 7,741 3.9 7,805 3.5 9,103 3.5 9,176 3.3 9,778 3.2
Advertising expenses 23,914 13.5 27,642 14.0 26,348 11.9 32,319 12.5 36,136 12.9 38,749 12.6
EBITDA 27,500 15.5 26,784 13.6 32,913 14.9 40,038 15.5 44,753 16.0 51,043 16.6
Less: Interest Expense 70 2 12 252 360 168
Less: Depreciation 1,840 2,208 2,183 2,360 2,606 2,867
Add: Other Income 1,481 2728.8 2783.1 6069 6210.3 6,184
Profit before Tax (PBT) 27,071 15.3 27,302 13.8 33,502 15.1 43,495 16.9 47,997 17.1 54,192 17.6
Tax 6,044 6,310 7,776 11,612 12,444 16,333
Profit after Tax (PAT) 21,027 11.9 20,992 10.6 25,725 11.6 31,883 12.4 35,553 12.7 37,859 12.3
Source: Company, MOSL
197.
4
221.
2
258.
1
280.
2
308.
1 11.3 12.1
16.7
8.6 9.9
FY11 FY12 FY13 FY14 FY15
Sales (INR b) Sales growth (%)
13.0 9.3
6.8 4.0 4.8
-1.7
2.8 10.0
4.6 5.2
FY11 FY12 FY13 FY14 FY15
Volume growth (%) Price growth (%)

Hindustan Unilever
9 June 2015 4
Exhibit 4: Segmental details Segmental FY10 FY11 FY12 FY13 FY14 FY15
Net Sales (INR m) Soaps and Detergents 82,656 87,916 106,363 127,018 136,834 148,766
Personal Products 50,479 58,441 65,855 74,717 81,209 90,065 Beverages 21,424 23,440 26,174 29,747 33,119 36,315 Processed Foods 9,618 11,745 17,138 19,192 21,032 24,433 Others 2,467 4,380 5,425 6,793 7,014 7,614 Net sales growth (%) Soaps and Detergents 1.5 6.4 21.0 19.4 7.7 8.7 Personal Products 16.1 15.8 12.7 13.5 8.7 10.9 Beverages 15.0 9.4 11.7 13.6 11.3 9.7 Processed Foods 12.2 22.1 45.9 12.0 9.6 16.2 Others -35.0 77.5 23.9 25.2 3.2 8.6 EBIT (INR m)
Soaps and Detergents 11,853 8,341 12,333 16,155 17,858 20,337 Personal Products 12,965 14,948 17,446 19,489 20,681 24,244 Beverages 3,198 3,578 3,667 4,746 5,807 6,146 Processed Foods 298 518 242 370 613 832 Others -720 -750 -249 -390 -370 -155 EBIT Margin (%) Soaps and Detergents 14.3 9.5 11.6 12.7 13.1 13.7 Personal Products 25.7 25.6 26.5 26.1 25.5 26.9 Beverages 14.9 15.3 14.0 16.0 17.5 16.9 Processed Foods 1.8 2.8 1.4 1.9 2.9 3.4 Others -29.2 -17.1 -4.6 -5.7 -5.3 -2.0
Source: Company, MOSL
Exhibit 5: Volume growth remained soft in FY15 HUL Volume growth (%) Sales growth (%) Category FY12 FY13 FY14 FY15 FY12 FY13 FY14 FY15 Soaps and Detergents 5.9 8.0 5.0 3.0 20.8 19.0 8.0 9.0 Personal Products 17.0 6.0 4.0 6.0 17.3 13.0 9.0 11.0 Beverages 5.6 5.0 3.0 5.0 11.6 13.0 12.0 9.0 Processed Foods 11.9 3.0 3.0 10.0 15.5 10.0 10.0 15.0 Company 9.0 7.0 4.0 4.8 18.0 16.0 9.0 9.9
Source: Company, MOSL
Hindustan Unilever
9 June 2015 5
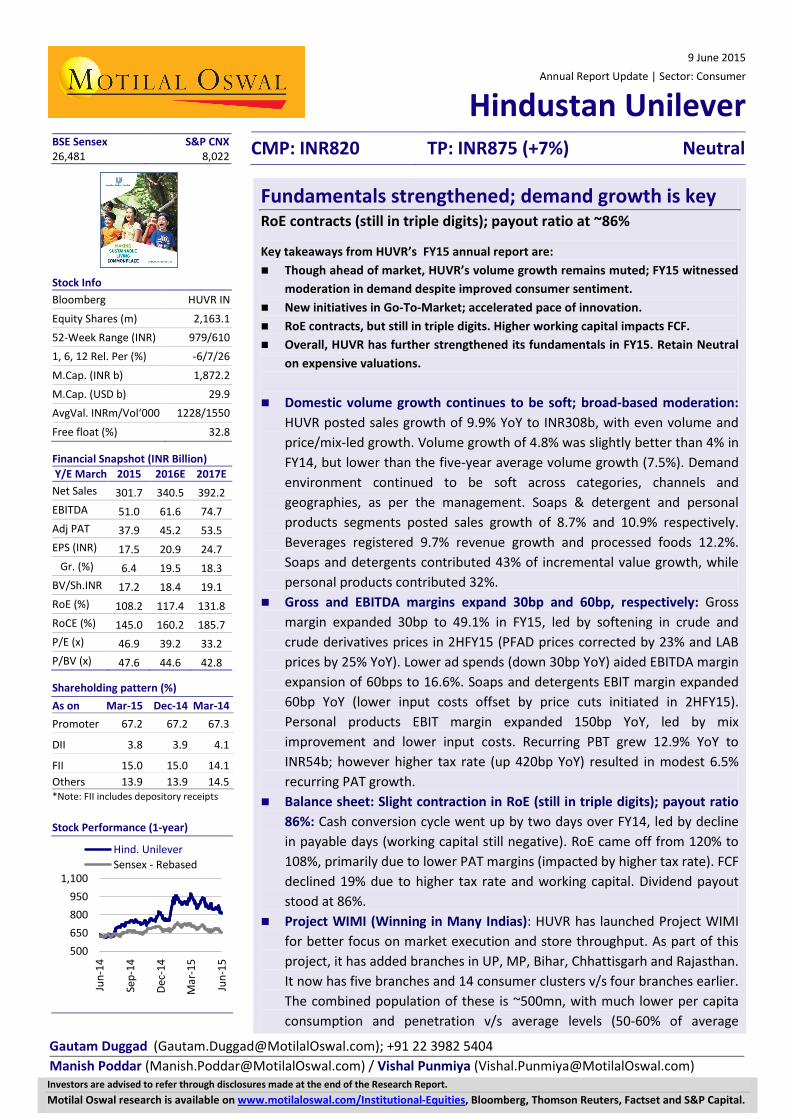
Home and Personal Care A. Soaps & detergents (48% of sales): Soaps and detergent segment sales increased 8.7% in FY15 (v/s 7.7% in FY14), with underlying volume growth of 3%. EBIT margin expanded 60bp YoY to 13.7% despite increased brand spends. Soaps: The segment posted subdued volume growth, with pricing cuts initiated
across brands in 2HFY15 to pass on the raw material softening benefit and drive the incipient volume growth (PFAD prices have corrected 23% YoY). Brand Lifebuoy crossed INR20b in sales and attained its highest ever market share in FY15.
Detergents: The segment growth was largely driven by price hikes and mix improvement. However, for HUVR, premiumization continued with Surf (driven by Surf Excel Easy Wash) and Comfort posting high double-digit growth. Within Rin, bars portfolio continued to lead upgradation while growth for the powders portfolio moderated. Despite its re-launch in FY14, Wheel powder witnessed muted growth during FY15. The three laundry brands— Surf, Wheel and Rin—are now INR20b brands, with Surf being the largest brand for HUVR.
Household Care segment posted healthy double-digit growth, led by Vim (tub and liquids portfolio). HUVR introduced a new sku of 250gm in the tub segment to complement its existing offering in 500gm.
Exhibit 6: S&D revenues clocked 12.5% CAGR over FY10-15..
Source: Company, MOSL
Exhibit 7: ..while PP posted 12.3% revenue CAGR
Source: Company, MOSL
B. Personal products: Personal Products sales growth was 10.9% in FY15 (v/s 8.7% in FY14), impacted by weak discretionary consumption. Underlying volumes posted 6% growth, an over 4% in FY14. EBIT margin expanded 150bp YoY to 26.9% (v/s 25.5% in FY14). Skin care posted modest growth in a slowing market. Face care segment
delivered growth ahead of markets across skin lightening, anti-ageing and men’s formats. FAL delivered healthy growth post its re-launch in FY14. Ponds delivered double-digit growth, buoyed by skin lightening and talc portfolios. During FY15, Pond’s also forayed into the male grooming segment with the launch of Pond’s Men (face washes and moisturizers). Lakme sustained its growth momentum with the launch of a new hydration range Lakme Absolute.
Hair care continued its robust performance and posted volume-led double-digit growth, with both Dove and Clinic Plus posting strong double-digit growth. TRESemme portfolio performed well and HUVR launched a new variant called
82.7 87.9 106.4 127.0 136.8 148.8
14.3
9.5
11.6
12.7 13.1 13.7
FY10 FY11 FY12 FY13 FY14 FY15
S&D-Net Sales (INR b) EBIT margin (%)
50.5 58.4 65.9 74.7 81.2 90.1
25.7 25.6
26.5
26.1
25.5
26.9
FY10 FY11 FY12 FY13 FY14 FY15
PP-Net Sales (INR b) EBIT margin (%)

Hindustan Unilever
9 June 2015 6
“Spa Rejuvenation”. Toni&Guy was further rolled out in key premium outlets during FY15.
Oral care growth moderated due to increased competitive and promotional intensity. Re-launch of Pepsodent Gum Care has been successful, as per the management. Close Up forayed into the premium segment with the launch of Closeup Diamond Attraction.
Within the Deodorant segment, HUVR launched Axe Signature to foray into the perfume spray segment. During FY15, Unilever also commissioned a deodorant manufacturing facility in Khamgaon to cater to the Asian market.
Cosmetics segment posted strong sales growth, with Lakme’s Colors witnessing double-digit growth.
Exhibit 8: Beverages margins came off in FY15
Source: Company, MOSL
Exhibit 9: But Packaged Foods profitability continued to trend up
Source: Company, MOSL
Food and Beverages Sales growth picked up slightly (12.2%) during FY15, with a slight margin contraction (down 40 bp YoY). Beverages segment recorded 9.7% revenue growth, with 5% volume growth and
broad-based growth across tea and coffee. However, benign commodity costs impacted pricing growth during 2HFY15. Taj Mahal and 3 Roses continued to drive premiumization while Red Label aided in attracting new consumers from the unbranded segment. Instant coffee segment posted healthy growth, with Bru Gold performing well. EBIT margin contracted 60bp YoY in to 16.9% in FY15.
Packaged foods delivered 15% sales growth, with strong performance in Kissan (double-digit growth, led by product activation) and Knorr in the soups portfolio. HUVR re-launched the entire Kissan range with new packaging. Within the desserts portfolio, HUVR re-launched Brown & Polson and Rex brands—the initial response for which was positive, as per the management. Within the bakery segment, Modern Foods maintained its leadership in various markets.
Frozen desserts segment delivered double-digit growth and improved margins. Post the successful launch, Magnum was extended into Delhi and Kolkata during FY15.
21.4 23.4 26.2 29.7 33.1 36.3
14.9 15.3 14.0
16.0
17.5 16.9
FY10 FY11 FY12 FY13 FY14 FY15
Bev-Net Sales (INR b) EBIT margin (%)
7.3 9.0 13.6 15.1 16.5 18.9
2.3
3.6
1.8 2.5
3.7 4.4
FY10 FY11 FY12 FY13 FY14 FY15
Processed Foods-Net Sales (INR b) EBIT margin (%)
Hindustan Unilever
9 June 2015 7
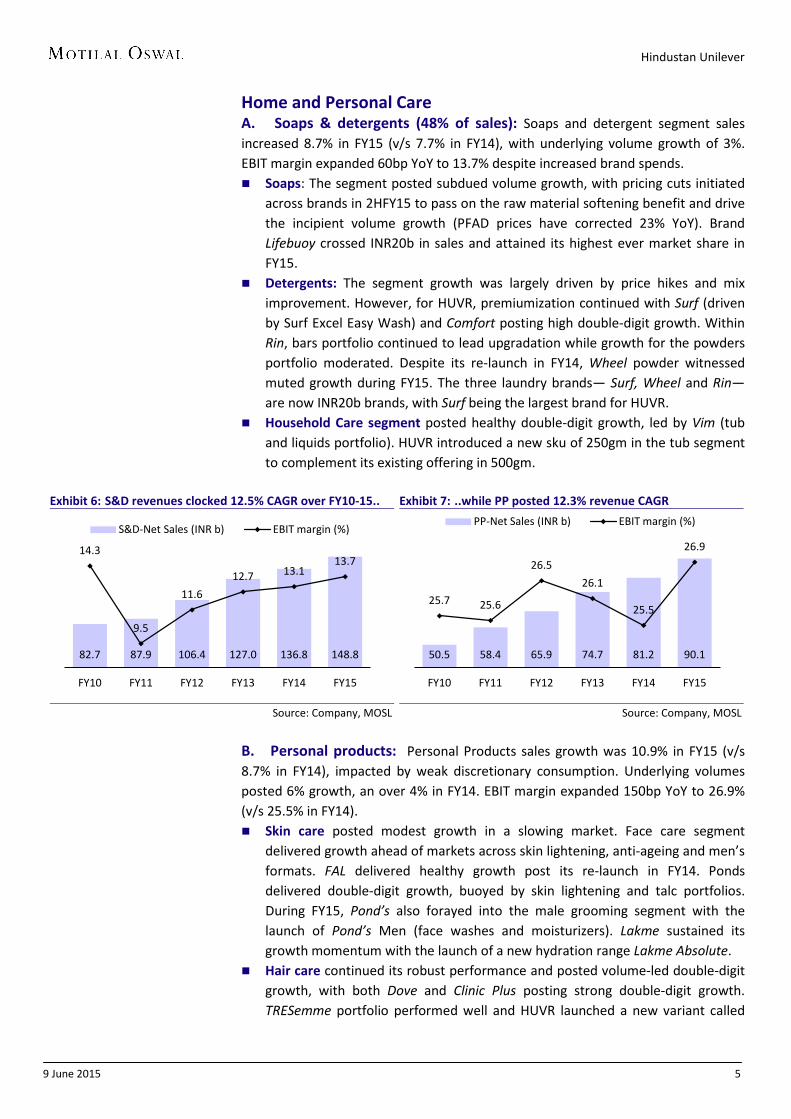
Increased focus on innovation in the last three years
Exhibit 10: Axe launches new range of perfumes under “Axe Signature”
Source: Company, MOSL
Exhibit 11: TRESemme added a variant “Spa Rejuvenation”
Source: Company, MOSL
Exhibit 12: Vim introduced a 250gm sku in the tub format bar
Source: Company, MOSL
Exhibit 13: Pureit launched Ultima with RO+UV technology
Source: Company, MOSL
Exhibit 14: Closeup forayed in the premium whitening segment
Source: Company, MOSL
Exhibit 15: Re-launch of Pepsodent GumCare
Source: Company, MOSL
Exhibit 16: Men’s range of products introduced under Pond’s
Source: Company, MOSL
Exhibit 17: New range under Lakme
Source: Company, MOSL

Hindustan Unilever
9 June 2015 8
Other levers of growth Reorganized Go–To-Market (GTM) operations (WIMI) + E-commerce
Strategy
Project WIMI (Winning in Many Indias): HUVR has launched Project WIMI to better focus on market execution and store throughput. As part of this project, it has added branches in UP, MP, Bihar, Chattisgarh and Rajasthan. It now has five branches and 14 consumer clusters v/s four branches earlier. The combined population of these is ~500mn, with much lower per capita consumption and penetration v/s average levels (50-60% of average consumption). This is expected to result in a) faster response in market, b) smaller teams with better focus, c) better execution, and d) better infrastructure for improved delivery standards.
Thus, we believe HUVR is well placed to capitalize on the expected demand recovery. To illustrate this, we highlight the example of market share gains in soaps.
Exhibit 18: Project WIMI to ensure better focus on market execution and store throughput
Source: Company, MOSL
HUVR has also developed a comprehensive e-commerce strategy and execution
roadmap to drive higher growth from this channel in the coming years. HUVR is test marketing Hamarashop.com in select markets to understand the market opportunity in this segment.

Hindustan Unilever
9 June 2015 9
Financial performance RoE contracts, but still in triple digits; FCF declines led by higher WC
HUVR posted sales growth of 9.9% during FY15, led by 4.8% volume growth v/s 4% in FY14. However, correction in input costs during 2HFY15, led by softening in crude and crude derivative prices, provided margin tailwinds. We note PFAD and LAB prices have corrected by 23% and 25% YoY, respectively. Excise duty (as a percentage of sales) increased 70bp YoY to 6.3% due to phase-out of excise benefits.
HUVR has initiated price cuts in the soaps portfolio to pass on the benefits of raw material correction. In detergents, it continues to focus on volume promotions on price point packs and price-offs in bulk packs. Overall price cuts in the soaps & detergents portfolio would be ~10%, in our view. However, price cuts/discounts have not yet changed the volume trajectory materially—as per the management. While activities from local unbranded players have increased, competition from organized players remains rational QoQ—as per the management. In our view, this is a positive development and also strengthens our belief that HUVR is managing this RM downturn cycle much better than in the past (FY09).
Gross margin expanded 30bp YoY to 49.1%, led by benign commodity costs. However, lower ad spends (down 30bp YoY to 12.6%) and lower input costs led to EBITDA margin expansion of 60bp YoY to 16.6%. Royalty increased 50bp YoY to 2.4%.
Exhibit 19: Gross margin expanded 30bp in FY15
Source: Company, MOSL
Exhibit 20: …while EBITDA margin expanded 60bp
Source: Company, MOSL
Exhibit 21: A&P spends down 30bp in FY15
Source: Company, MOSL
Exhibit 22: Royalty expenses expanded 50bp in FY15
Source: Company, MOSL
49.9
48.9
46.9
47.7
48.8 49.1
FY10 FY11 FY12 FY13 FY14 FY15
Gross Margin (%)
15.5
13.6
14.9 15.5
16.0 16.6
FY10 FY11 FY12 FY13 FY14 FY15
EBITDA Margin (%)
13.5 14.0
11.9 12.5
12.9 12.6
FY10 FY11 FY12 FY13 FY14 FY15
Ad spend (%)
0.9
1.4 1.3 1.5 1.9
2.4
FY10 FY11 FY12 FY13 FY14 FY15
Royalty (%)
Hindustan Unilever
9 June 2015 10
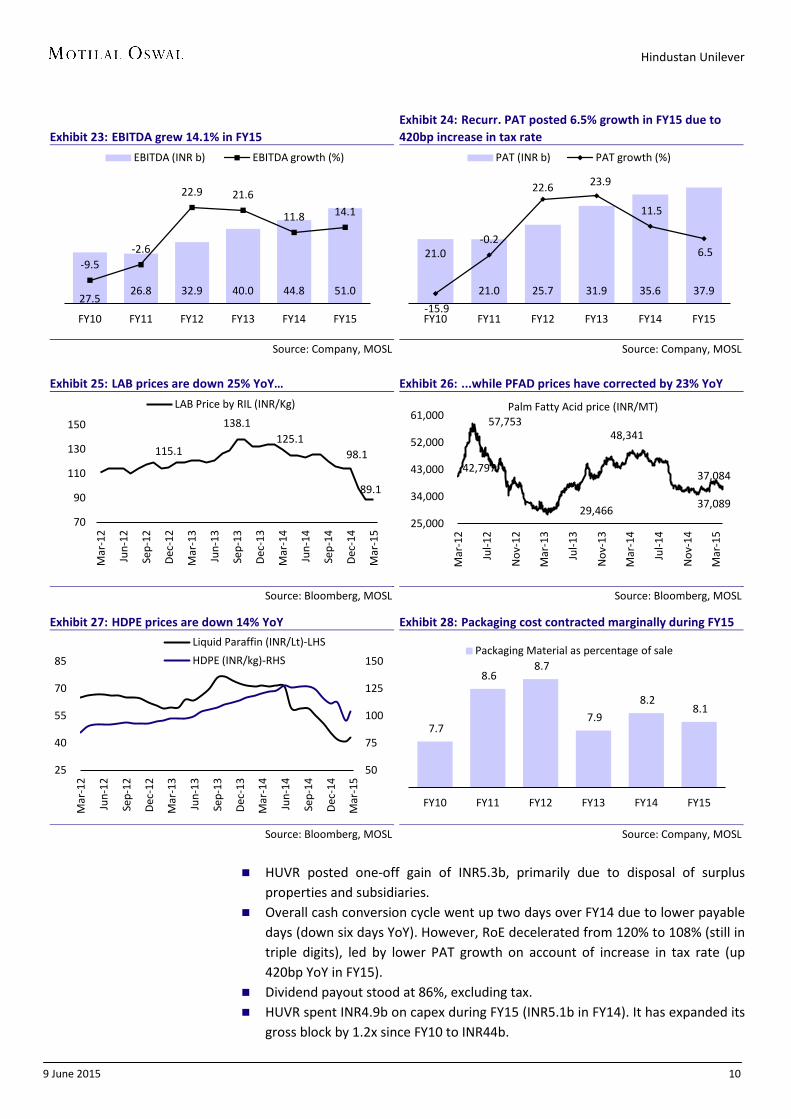
Exhibit 23: EBITDA grew 14.1% in FY15
Source: Company, MOSL
Exhibit 24: Recurr. PAT posted 6.5% growth in FY15 due to 420bp increase in tax rate
Source: Company, MOSL
Exhibit 25: LAB prices are down 25% YoY…
Source: Bloomberg, MOSL
Exhibit 26: ...while PFAD prices have corrected by 23% YoY
Source: Bloomberg, MOSL
Exhibit 27: HDPE prices are down 14% YoY
Source: Bloomberg, MOSL
Exhibit 28: Packaging cost contracted marginally during FY15
Source: Company, MOSL
HUVR posted one-off gain of INR5.3b, primarily due to disposal of surplus
properties and subsidiaries. Overall cash conversion cycle went up two days over FY14 due to lower payable
days (down six days YoY). However, RoE decelerated from 120% to 108% (still in triple digits), led by lower PAT growth on account of increase in tax rate (up 420bp YoY in FY15).
Dividend payout stood at 86%, excluding tax. HUVR spent INR4.9b on capex during FY15 (INR5.1b in FY14). It has expanded its
gross block by 1.2x since FY10 to INR44b.
27.5 26.8 32.9 40.0 44.8 51.0
-9.5 -2.6
22.9 21.6
11.8 14.1
FY10 FY11 FY12 FY13 FY14 FY15
EBITDA (INR b) EBITDA growth (%)
21.0
21.0 25.7 31.9 35.6 37.9
-15.9
-0.2
22.6 23.9
11.5
6.5
FY10 FY11 FY12 FY13 FY14 FY15
PAT (INR b) PAT growth (%)
115.1
138.1 125.1
98.1
89.1
70
90
110
130
150
Mar
-12
Jun-
12
Sep-
12
Dec
-12
Mar
-13
Jun-
13
Sep-
13
Dec
-13
Mar
-14
Jun-
14
Sep-
14
Dec
-14
Mar
-15
LAB Price by RIL (INR/Kg)
42,797
57,753
29,466
48,341
37,084
37,089
25,000
34,000
43,000
52,000
61,000
Mar
-12
Jul-1
2
Nov
-12
Mar
-13
Jul-1
3
Nov
-13
Mar
-14
Jul-1
4
Nov
-14
Mar
-15
Palm Fatty Acid price (INR/MT)
50
75
100
125
150
25
40
55
70
85
Mar
-12
Jun-
12
Sep-
12
Dec
-12
Mar
-13
Jun-
13
Sep-
13
Dec
-13
Mar
-14
Jun-
14
Sep-
14
Dec
-14
Mar
-15
Liquid Paraffin (INR/Lt)-LHS
HDPE (INR/kg)-RHS
7.7
8.6 8.7
7.9
8.2 8.1
FY10 FY11 FY12 FY13 FY14 FY15
Packaging Material as percentage of sale

Hindustan Unilever
9 June 2015 11
Exhibit 29: Cash conversion cycle deteriorates marginally due to higher payable days
FY10 FY11 FY12 FY13 FY14 FY15
Inventory days 49 47 45 37 35 32
Debtor days 13 15 14 11 11 10
Creditor days 98 96 81 71 73 67 Cash conversion cycle -36 -34 -23 -23 -27 -25
Source: Company, MOSL
Exhibit 30: RoE decline led by lower profitability due to higher effective tax rate DU Pont FY10 FY11 FY12 FY13 FY14 FY15
PAT Margin 12.0 10.8 11.8 12.6 13.0 12.5 Asset Turnover 6.9 7.4 7.0 8.1 9.2 8.6 Leverage factor 1.1 1.0 1.0 1.0 1.0 1.0 ROE 90.5 80.1 83.4 103.1 119.5 108.1
Source: Company, MOSL
Exhibit 31: FCF declined in FY15 due to higher tax rate and increased WC
Source: Company, MOSL
Exhibit 32: FCF to PAT conversion down but still healthy
Source: Company, MOSL
Valuation and view: Fundamentals strong, but valuations expensive During the last two years of consumer demand slowdown, HUVR built strong
fundamentals through distribution expansion, cost savings in P&L and sharper in-market execution on innovations. This has bolstered its ability to respond to the competitive forces faster, which is already visible in its faster response to market (price cuts, promotions, etc).
Combination of benign raw material environment and improving demand environment should augur well going ahead for HUL.
However, valuations at 39x FY16E and 33x FY17E EPS are rich, in our view. Maintain NEUTRAL with a target price of INR875 (35x FY17E EPS).
Key risks: a) Prolonged periods of deflationary environment, which can rob the consumer companies of pricing power; b) deep-pocket players like P&G may engage in price war/irrational competition to gain market share.
105
59
80 78 72
51
FY10 FY11 FY12 FY13 FY14 FY15
FCF/EBITDA (%) 137
75
102 98 90
69
FY10 FY11 FY12 FY13 FY14 FY15
FCF/PAT (%)

Hindustan Unilever
9 June 2015 12
Financials and valuations
Income Statement (INR Million) Y/E March FY10 FY11 FY12 FY13 FY14 FY15 FY16E FY17E Net Sales 175,238 193,810 217,356 252,064 274,083 301,705 340,468 392,221 Other Oper. Income 2,015 3,545 3,808 6,038 6,108 6,351 6,918 7,900 Total Revenue 177,253 197,355 221,164 258,102 280,191 308,056 347,386 400,121 Change (%) -14.0 11.3 12.1 16.7 8.6 9.9 12.8 15.2 COGS 88,779 100,781 117,378 134,888 143,436 156,951 170,948 193,620 Gross Profit 88,474 96,574 103,786 123,214 136,755 151,106 176,438 206,501 Gross Margin (%) 49.9 48.9 46.9 47.7 48.8 49.1 50.8 51.6 Operating Exp 60,975 69,790 70,873 83,176 92,003 100,063 114,872 131,820 % of sales 34.4 35.4 32.0 32.2 32.8 32.5 33.1 32.9 EBIDTA 27,500 26,784 32,913 40,038 44,753 51,043 61,566 74,681 Change (%) -9.5 -2.6 22.9 21.6 11.8 14.1 20.6 21.3 Margin (%) 15.5 13.6 14.9 15.5 16.0 16.6 17.7 18.7 Depreciation 1,840 2,208 2,183 2,360 2,606 2,867 3,115 3,377 Int. and Fin. Charges 70 2 12 252 360 168 201 221 Other Income - Recurring 1,481 2,729 2,783 6,069 6,210 6,184 7,296 8,786 Profit before Taxes 27,071 27,302 33,502 43,495 47,997 54,192 65,546 79,868 Change (%) -10.5 0.9 22.7 29.8 10.4 12.9 21.0 21.9 Margin (%) 15.4 14.1 15.4 17.3 17.5 18.0 19.3 20.4 Tax 5,823 5,919 7,769 11,518 12,196 16,671 19,664 25,558 Deferred Tax 221 392 8 95 248 -338 655 799 Tax Rate (%) 22.3 23.1 23.2 26.7 25.9 30.1 31.0 33.0 Profit after Taxes 21,027 20,992 25,725 31,883 35,553 37,859 45,226 53,511 Change (%) -15.9 -0.2 22.6 23.9 11.5 6.5 19.5 18.3 Margin (%) 12.0 10.8 11.8 12.6 13.0 12.5 13.3 13.6 Non-rec. (Exp)/Income 994 2,068 1,189 6,084 3,122 5,293 0 0 Reported PAT 22,020 23,060 26,914 37,967 38,675 43,152 45,226 53,511 FY09 Fifteen month ending
Balance Sheet
(INR Million) Y/E March FY10 FY11 FY12 FY13 FY14 FY1 FY16E FY17E Share Capital 2,182 2,160 2,162 2,163 2,163 2,164 2,164 2,164 Reserves 23,653 24,436 32,968 24,578 30,608 35,084 37,646 39,267 Net Worth 25,835 26,595 35,129 26,740 32,771 37,248 39,809 41,430 Capital Employed 25,835 26,595 35,129 26,740 32,771 37,248 39,809 41,430 Gross Block 35,820 36,037 35,747 38,793 41,706 44,306 47,306 51,306 Less: Accum. Depn. -14,199 -13,624 -14,169 -15,761 -17,409 -19,731 -22,846 -26,223 Net Fixed Assets 21,621 22,413 21,578 23,032 24,298 24,575 24,460 25,083 Capital WIP 2,740 2,166 2,051 2,053 3,121 4,790 4,790 4,790 Investments in Subsidiaries 1,088 1,206 1,863 5,480 6,362 6,541 6,541 6,541 Current Investments 28,161 11,401 22,519 17,826 24,580 26,238 25,845 27,316 Deferred Charges 2,488 2,097 2,142 2,048 1,617 1,960 2,120 2,293 Curr. Assets, L&A 37,069 62,345 59,429 64,685 70,007 72,236 83,752 100,209 Inventory 21,799 28,108 25,167 25,270 27,475 26,027 32,425 35,656 Account Receivables 6,716 9,432 6,790 8,335 8,164 7,829 9,328 11,820 Cash and Bank Balance 2,314 16,285 18,300 17,079 22,210 25,376 27,903 37,438 Others 6,240 8,520 9,172 14,001 12,158 13,005 14,096 15,294 Curr. Liab. and Prov. 67,332 75,031 74,453 88,385 97,214 99,093 107,699 124,802 Account Payables 43,737 38,904 37,826 41,336 49,115 48,515 54,313 61,740 Other Liabilities 15,374 28,569 27,981 34,073 30,558 29,828 30,329 35,255 Provisions 8,221 7,558 8,646 12,975 17,540 20,749 23,057 27,807 Net Current Assets -30,263 -12,687 -15,024 -23,700 -27,206 -26,857 -23,947 -24,593 Application of Funds 25,835 26,595 35,129 26,740 32,771 37,248 39,809 41,430 E: MOSL Estimates

Hindustan Unilever
9 June 2015 13
Financials and valuations
Ratios
464 549 651
Y/E March FY10 FY11 FY12 FY13 FY14 FY15 FY16E FY17E Basic (INR)
EPS 9.6 9.7 11.9 14.7 16.4 17.5 20.9 24.7 Cash EPS 10.5 10.7 12.9 15.8 17.6 18.8 22.3 26.3 BV/Share 11.8 12.3 16.3 12.4 15.2 17.2 18.4 19.1 DPS 6.5 6.5 7.5 18.5 13.0 15.0 16.9 20.5 Payout % 67.4 67.2 63.0 125.5 79.1 85.7 80.8 82.9
Valuation (x)
P/E
46.9 39.2 33.2 Cash P/E
43.6 36.7 31.2
EV/Sales
5.8 5.1 4.4 EV/EBITDA
34.1 28.3 23.2
P/BV
47.6 44.6 42.8 Dividend Yield (%)
1.8 2.1 2.5
Return Ratios (%)
RoE 90.5 80.1 83.4 103.1 119.5 108.1 117.4 131.7 RoCE 101.3 93.7 99.6 121.8 141.6 137.6 151.7 175.5
Cash Flow Statement
Y/E March FY10 FY11 FY12 FY13 FY14 FY15 FY16E FY17E OP/(loss) before Tax 27,071 27,302 33,502 43,495 47,997 54,192 65,546 79,868 Int./Div. Received -1,481 -2,729 -2,783 -6,069 -6,210 -6,184 -7,296 -8,786 Depreciation -1,840 -2,208 -2,183 -2,360 -2,606 -2,867 -3,115 -3,377 Interest Paid -70 -2 -12 -252 -360 -168 -201 -221 Direct Taxes Paid 5,823 5,919 7,769 11,518 12,196 16,671 19,664 25,558 (Incr)/Decr in WC -12,975 3,605 -4,353 -7,454 -8,638 -2,816 382 -10,181 CF from Operations 16,527 31,886 31,939 38,878 42,379 58,828 74,980 82,860 Extraordinary Items 994 2,068 1,189 6,084 3,122 5,293 0 0 (Incr)/Decr in FA -5,021 357 404 -3,048 -3,981 -4,269 -3,000 -4,000 (Pur)/Sale of Investments -10,055 16,643 -11,775 1,076 -7,635 -1,838 394 -1,471 CF from Invest. -14,083 19,068 -10,182 4,112 -8,494 -814 -2,606 -5,471 Change in Networth -240 -5,880 459 201 85 137 114 1 change in equity 2 -22 2 1 0 1 0 0 change in reserves -242 -5,858 457 200 85 136 114 1 (Incr)/Decr in Debt -4,219 0 0 0 0 0 0 0 Dividend Paid -16,560 -16,420 -18,839 -46,557 -32,730 -38,812 -42,779 -51,892 Others 18,983 -14,683 -1,361 2,144 3,890 -16,172 -27,182 -15,963 CF from Fin. Activity -2,037 -36,983 -19,741 -44,212 -28,755 -54,847 -69,847 -67,854
Incr/Decr of Cash 408 13,971 2,016 -1,222 5,131 3,166 2,527 9,535 Add: Opening Balance 1,906 2,314 16,285 18,300 17,079 22,210 25,376 27,903 Closing Balance 2,314 16,285 18,301 17,078 22,210 25,376 27,903 37,438
Hindustan Unilever
9 June 2015 14
Disclosures This document has been prepared by Motilal Oswal Securities Limited (hereinafter referred to as Most) to provide information about the company(ies) and/sector(s), if any, covered in the report and may be distributed by it and/or its affiliated company(ies). This report is for personal information of the selected recipient/s and does not construe to be any investment, legal or taxation advice to you. This research report does not constitute an offer, invitation or inducement to invest in securities or other investments and Motilal Oswal Securities Limited (hereinafter referred as MOSt) is not soliciting any action based upon it. This report is not for public distribution and has been furnished to you solely for your general information and should not be reproduced or redistributed to any other person in any form. This report does not constitute a personal recommendation or take into account the particular investment objectives, financial situations, or needs of individual clients. Before acting on any advice or recommendation in this material, investors should consider whether it is suitable for their particular circumstances and, if necessary, seek professional advice. The price and value of the investments referred to in this material and the income from them may go down as well as up, and investors may realize losses on any investments. Past performance is not a guide for future performance, future returns are not guaranteed and a loss of original capital may occur.
MOSt and its affiliates are a full-service, integrated investment banking, investment management, brokerage and financing group. We and our affiliates have investment banking and other business relationships with a some companies covered by our Research Department. Our research professionals may provide input into our investment banking and other business selection processes. Investors should assume that MOSt and/or its affiliates are seeking or will seek investment banking or other business from the company or companies that are the subject of this material and that the research professionals who were involved in preparing this material may educate investors on investments in such business. The research professionals responsible for the preparation of this document may interact with trading desk personnel, sales personnel and other parties for the purpose of gathering, applying and interpreting information. Our research professionals are paid on the profitability of MOSt which may include earnings from investment banking and other business.
MOSt generally prohibits its analysts, persons reporting to analysts, and members of their households from maintaining a financial interest in the securities or derivatives of any companies that the analysts cover. Additionally, MOSt generally prohibits its analysts and persons reporting to analysts from serving as an officer, director, or advisory board member of any companies that the analysts cover. Our salespeople, traders, and other professionals or affiliates may provide oral or written market commentary or trading strategies to our clients that reflect opinions that are contrary to the opinions expressed herein, and our proprietary trading and investing businesses may make investment decisions that are inconsistent with the recommendations expressed herein. In reviewing these materials, you should be aware that any or all of the foregoing among other things, may give rise to real or potential conflicts of interest. MOSt and its affiliated company(ies), their directors and employees and their relatives may; (a) from time to time, have a long or short position in, act as principal in, and buy or sell the securities or derivatives thereof of companies mentioned herein. (b) be engaged in any other transaction involving such securities and earn brokerage or other compensation or act as a market maker in the financial instruments of the company(ies) discussed herein or act as an advisor or lender/borrower to such company(ies) or may have any other potential conflict of interests with respect to any recommendation and other related information and opinions.; however the same shall have no bearing whatsoever on the specific recommendations made by the analyst(s), as the recommendations made by the analyst(s) are completely independent of the views of the affiliates of MOSt even though there might exist an inherent conflict of interest in some of the stocks mentioned in the research report Reports based on technical and derivative analysis center on studying charts company's price movement, outstanding positions and trading volume, as opposed to focusing on a company's fundamentals and, as such, may not match with a report on a company's fundamental analysis. In addition MOST has different business segments / Divisions with independent research separated by Chinese walls catering to different set of customers having various objectives, risk profiles, investment horizon, etc, and therefore may at times have different contrary views on stocks sectors and markets.
Unauthorized disclosure, use, dissemination or copying (either whole or partial) of this information, is prohibited. The person accessing this information specifically agrees to exempt MOSt or any of its affiliates or employees from, any and all responsibility/liability arising from such misuse and agrees not to hold MOSt or any of its affiliates or employees responsible for any such misuse and further agrees to hold MOSt or any of its affiliates or employees free and harmless from all losses, costs, damages, expenses that may be suffered by the person accessing this information due to any errors and delays. The information contained herein is based on publicly available data or other sources believed to be reliable. Any statements contained in this report attributed to a third party represent MOSt’s interpretation of the data, information and/or opinions provided by that third party either publicly or through a subscription service, and such use and interpretation have not been reviewed by the third party. This Report is not intended to be a complete statement or summary of the securities, markets or developments referred to in the document. While we would endeavor to update the information herein on reasonable basis, MOSt and/or its affiliates are under no obligation to update the information. Also there may be regulatory, compliance, or other reasons that may prevent MOSt and/or its affiliates from doing so. MOSt or any of its affiliates or employees shall not be in any way responsible and liable for any loss or damage that may arise to any person from any inadvertent error in the information contained in this report. MOSt or any of its affiliates or employees do not provide, at any time, any express or implied warranty of any kind, regarding any matter pertaining to this report, including without limitation the implied warranties of merchantability, fitness for a particular purpose, and non-infringement. The recipients of this report should rely on their own investigations.
This report is intended for distribution to institutional investors. Recipients who are not institutional investors should seek advice of their independent financial advisor prior to taking any investment decision based on this report or for any necessary explanation of its contents.
Most and it’s associates may have managed or co-managed public offering of securities, may have received compensation for investment banking or merchant banking or brokerage services, may have received any compensation for products or services other than investment banking or merchant banking or brokerage services from the subject company in the past 12 months. Most and it’s associates have not received any compensation or other benefits from the subject company or third party in connection with the research report. Subject Company may have been a client of Most or its associates during twelve months preceding the date of distribution of the research report
MOSt and/or its affiliates and/or employees may have interests/positions, financial or otherwise of over 1 % at the end of the month immediately preceding the date of publication of the research in the securities mentioned in this report. To enhance transparency, MOSt has incorporated a Disclosure of Interest Statement in this document. This should, however, not be treated as endorsement of the views expressed in the report.
Motilal Oswal Securities Limited is registered as a Research Analyst under SEBI (Research Analyst) Regulations, 2014. SEBI Reg. No. INH000000412
There are no material disciplinary action that been taken by any regulatory authority impacting equity research analysis activities
Analyst Certification The views expressed in this research report accurately reflect the personal views of the analyst(s) about the subject securities or issues, and no part of the compensation of the research analyst(s) was, is, or will be directly or indirectly related to the specific recommendations and views expressed by research analyst(s) in this report. The research analysts, strategists, or research associates principally responsible for preparation of MOSt research receive compensation based upon various factors, including quality of research, investor client feedback, stock picking, competitive factors and firm revenues
Disclosure of Interest Statement HINDUSTAN UNILEVER Analyst ownership of the stock No Served as an officer, director or employee No
A graph of daily closing prices of securities is available at www.nseindia.com and http://economictimes.indiatimes.com/markets/stocks/stock-quotes
Regional Disclosures (outside India) This report is not directed or intended for distribution to or use by any person or entity resident in a state, country or any jurisdiction, where such distribution, publication, availability or use would be contrary to law, regulation or which would subject MOSt & its group companies to registration or licensing requirements within such jurisdictions.
For U.S. Motilal Oswal Securities Limited (MOSL) is not a registered broker - dealer under the U.S. Securities Exchange Act of 1934, as amended (the"1934 act") and under applicable state laws in the United States. In addition MOSL is not a registered investment adviser under the U.S. Investment Advisers Act of 1940, as amended (the "Advisers Act" and together with the 1934 Act, the "Acts), and under applicable state laws in the United States. Accordingly, in the absence of specific exemption under the Acts, any brokerage and investment services provided by MOSL, including the products and services described herein are not available to or intended for U.S. persons.
This report is intended for distribution only to "Major Institutional Investors" as defined by Rule 15a-6(b)(4) of the Exchange Act and interpretations thereof by SEC (henceforth referred to as "major institutional investors"). This document must not be acted on or relied on by persons who are not major institutional investors. Any investment or investment activity to which this document relates is only available to major institutional investors and will be engaged in only with major institutional investors. In reliance on the exemption from registration provided by Rule 15a-6 of the U.S. Securities Exchange Act of 1934, as amended (the "Exchange Act") and interpretations thereof by the U.S. Securities and Exchange Commission ("SEC") in order to conduct business with Institutional Investors based in the U.S., MOSL has entered into a chaperoning agreement with a U.S. registered broker-dealer, Motilal Oswal Securities International Private Limited. ("MOSIPL"). Any business interaction pursuant to this report will have to be executed within the provisions of this chaperoning agreement.
The Research Analysts contributing to the report may not be registered /qualified as research analyst with FINRA. Such research analyst may not be associated persons of the U.S. registered broker-dealer, MOSIPL, and therefore, may not be subject to NASD rule 2711 and NYSE Rule 472 restrictions on communication with a subject company, public appearances and trading securities held by a research analyst account.
For Singapore Motilal Oswal Capital Markets Singapore Pte Limited is acting as an exempt financial advisor under section 23(1)(f) of the Financial Advisers Act(FAA) read with regulation 17(1)(d) of the Financial Advisors Regulations and is a subsidiary of Motilal Oswal Securities Limited in India. This research is distributed in Singapore by Motilal Oswal Capital Markets Singapore Pte Limited and it is only directed in Singapore to accredited investors, as defined in the Financial Advisers Regulations and the Securities and Futures Act (Chapter 289), as amended from time to time. In respect of any matter arising from or in connection with the research you could contact the following representatives of Motilal Oswal Capital Markets Singapore Pte Limited: Anosh Koppikar Kadambari Balachandran Email : [email protected] Email : [email protected] Contact : (+65)68189232 Contact : (+65) 68189233 / 65249115 Office Address : 21 (Suite 31),16 Collyer Quay,Singapore 04931
Motilal Oswal Securities Ltd
Motilal Oswal Tower, Level 9, Sayani Road, Prabhadevi, Mumbai 400 025 Phone: +91 22 3982 5500 E-mail: [email protected]
Related Documents