Original scientific paper UDC 551.556.8 Hindcasting the Adriatic Sea surface temperature and salinity: A recent modeling experience Ivica Janekovi}, Mathieu Dutour Sikiri}, Igor Toma`i} and Milivoj Kuzmi} Ru|er Bo{kovi} Institute, Department of Marine and Environmental Research, P.O. Box 180, 10002 Zagreb, Croatia Received 6 November 2009, in final form 24 July 2010 Oceanographic model simulations of the Adriatic temperature and salin- ity fields for the year 2008 were compared against coastal Conductivity Tem- perature Depth (CTD) observations and satellite detected Sea Surface Tem- perature (SST) in order to evaluate the model hindcasting skills. To that end, the Regional Ocean Modeling System (ROMS) configured with horizontal res- olution of 2 km and forced with 8 km resolution output from the atmospheric model ALADIN (Aire Limitée Adaptation Dynamique développement Inter- National), was applied to the Adriatic Sea. Temperature and salinity CTD measurements collected along the east- ern Adriatic coast, within the framework of the Adriatic Sea Monitoring Pro- gram, exhibits correlation with model in the temperature field between 0.75 and 0.95, depending on the season/cruise, while for salinity those values are between 0.32 and 0.78. Comparison of the modeled and daily derived satellite SST for the whole 2008 year was made on each data pixel. Results show that the hindcasts are characterized with small model-to-data RMSE, namely with values in the North Adriatic 0.90 °C, in the Middle Adriatic 0.79 °C and in the South Adriatic 0.80 °C. There is a high correlation between modeled and sat- ellite SST data with values in a range of 0.44 to 0.92, depending on month and region, with a value of 0.99 for all time records and in any of three regions. Keywords: Adriatic Sea, Sea Surface Temperature, ROMS, in situ data 1. Introduction Within the framework of the Adriatic Sea Monitoring Program – ASMP (Andro~ec et al., 2009), numerical modeling of the whole Adriatic Sea was ini- tiated in order to provide the boundary conditions for the smaller domains hy- drodynamic, biological and chemical models. Hindcasts were conducted for the period 15 November 2007 until 15 November 2008. Temperature and salinity Conductivity Temperature Depth (CTD) mea- surements were made along the eastern Adriatic coast with the primary aim to improve the smaller-domain ecological models. The same data, grouped into GEOFIZIKA VOL. 27 2010

Welcome message from author
This document is posted to help you gain knowledge. Please leave a comment to let me know what you think about it! Share it to your friends and learn new things together.
Transcript
Original scientific paper
UDC 551.556.8
Hindcasting the Adriatic Sea surface temperature
and salinity: A recent modeling experience
Ivica Janekovi}, Mathieu Dutour Sikiri}, Igor Toma`i} and Milivoj Kuzmi}
Ru|er Bo{kovi} Institute, Department of Marine and Environmental Research,P.O. Box 180, 10002 Zagreb, Croatia
Received 6 November 2009, in final form 24 July 2010
Oceanographic model simulations of the Adriatic temperature and salin-ity fields for the year 2008 were compared against coastal Conductivity Tem-perature Depth (CTD) observations and satellite detected Sea Surface Tem-perature (SST) in order to evaluate the model hindcasting skills. To that end,the Regional Ocean Modeling System (ROMS) configured with horizontal res-olution of 2 km and forced with 8 km resolution output from the atmosphericmodel ALADIN (Aire Limitée Adaptation Dynamique développement Inter-National), was applied to the Adriatic Sea.
Temperature and salinity CTD measurements collected along the east-ern Adriatic coast, within the framework of the Adriatic Sea Monitoring Pro-gram, exhibits correlation with model in the temperature field between 0.75and 0.95, depending on the season/cruise, while for salinity those values arebetween 0.32 and 0.78. Comparison of the modeled and daily derived satelliteSST for the whole 2008 year was made on each data pixel. Results show thatthe hindcasts are characterized with small model-to-data RMSE, namely withvalues in the North Adriatic 0.90 °C, in the Middle Adriatic 0.79 °C and in theSouth Adriatic 0.80 °C. There is a high correlation between modeled and sat-ellite SST data with values in a range of 0.44 to 0.92, depending on month andregion, with a value of 0.99 for all time records and in any of three regions.
Keywords: Adriatic Sea, Sea Surface Temperature, ROMS, in situ data
1. Introduction
Within the framework of the Adriatic Sea Monitoring Program – ASMP(Andro~ec et al., 2009), numerical modeling of the whole Adriatic Sea was ini-tiated in order to provide the boundary conditions for the smaller domains hy-drodynamic, biological and chemical models. Hindcasts were conducted for theperiod 15 November 2007 until 15 November 2008.
Temperature and salinity Conductivity Temperature Depth (CTD) mea-surements were made along the eastern Adriatic coast with the primary aim toimprove the smaller-domain ecological models. The same data, grouped into
GEOFIZIKA VOL. 27 2010

coastal regions, were used in this study to assess the hindcast modeling skill.In addition to CTD measurements, remotely sensed Sea Surface Temperature(SST) data, for the whole 2008 at 2 km resolution, provided appropriate spa-tial and temporal resolution to address the hindcast error for the entire Adri-atic Sea. Those daily Level 4 (L4) SST products were made available withinMedspiration project.
In this paper, we evaluate the skill of the temperature and salinity hind-casts generated for the ASMP using both mentioned data sources. To that end,a primitive equation Regional Ocean Modeling System (ROMS) forced withwinds and other meteorological fields from the ALADIN (Aire Limitée Adapta-tion Dynamique développement InterNational) model output and configuredfor the Adriatic region was used to generate the hindcasts.
A recent study (Chiggiato and Oddo, 2008) with similar model-to-data com-parison for three different operational systems, one being the AdriaROMS, pro-vides an additional source of data for comparison for this study. They utilizedin-situ and remote sensing data collected from the Advanced Very High Reso-lution Radiometer – AVHRR and a collection of CTD data confined to thewestern Adriatic to evaluate the mentioned forecasting systems. In that re-spect, the present study with data-biased on the eastern side, complements thework reported in Chiggiato and Oddo (2008). It should be pointed out that inthis study, in a similar manner as the authors before, we used results from alarger model to define open boundary conditions located at the Otranto Strait(Oddo et al., 2006). In addition, assimilation capabilities of the ROMS modelwere not utilized, as usually done in operational forecasting (e.g. Powell et al.,2008).
The rest of the paper is organized as followed. The study area, model setupand forcing are described in section 2. The data used in assessment are brieflypresented in section 3. We examine the results of simulation comparison toCTD and satellite-derived data in section 4. Conclusions are drawn in the finalsection.
2. Study area, model setup and forcing
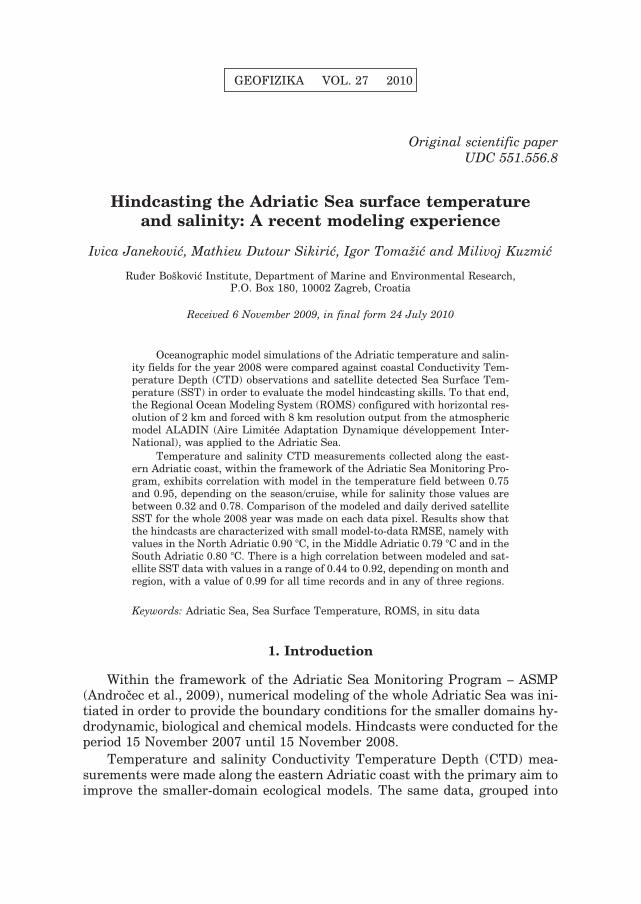
The study area encompasses the whole Adriatic Sea, a narrow epiconti-nental marginal basin, communicating with only one open boundary at thesouth with the Ionian Sea (Figure 1). Its complex topography, many narrowchannels, and islands of various sizes make it a challenging modeling problem.The bathymetry varies over three orders of magnitude with a mean depth of35 m on the shallow north end, and a depth about 1200 m in the South Adri-atic Pit. Figure 1 shows the intermediate structures of Jabuka Pit and Pala-gru`a Sill, but one should bear in mind the bathymetry between islands can beof similar depth. This complex bathymetry as well as orography that sur-rounds the basin contribute to the rich dynamics of the Adriatic Sea in which
86 I. JANEKOVI] ET AL.: HINDCASTING THE ADRIATIC SEA SURFACE TEMPERATURE ...
air-sea exchange, riverine inflows, and exchange at the Otranto Strait eachplay a role. These processes, as well as the Adriatic physical oceanography fea-tures in general, are reviewed extensively in Cushman-Roisin et al. (2001).
For modeling the Adriatic Sea, we use ROMS version 3.3 (Shchepetkinand McWilliams, 2005). It is a finite difference, free surface model that solvesthe primitive equations in curvilinear grids by using the Boussinesq and hy-drostatic approximations. A major problem of this class of models is the treat-ment of free surface modes which impose a strong constraint on the time step-ping. In the case of ROMS, the solution to the problem is the use of theoperator splitting method, by applying a much shorter time step for free sur-face and barotropic momentum than for temperature, salinity and baroclinicmomentum. The advection scheme for temperature and salinity used in thestudy is multidimensional positive definite advection transport algorithm(Smolarkiewicz and Margolin, 1998), which is a conservative and positive defi-nite scheme. For baroclinic momentum, we used the upwind 3rd order scheme.Sigma coordinates are used for the vertical discretization, and the implied er-rors in the horizontal pressure gradient are minimized using the spline method(Shchepetkin and McWilliams, 2003). A comparison of turbulent closure para-
GEOFIZIKA, VOL. 27, NO. 2, 2010, 85–100 87
Figure 1. Bathymetry of the Adriatic Sea with CTD stations sorted from North to South alongEastern coast, marked with “o” and corresponding numbers. Across basin lines define northern,middle and southern Adriatic regions used in model to data SST comparison.
meterizations (Warner et al, 2005) demonstrated that general length scalemethods are better than the Mellor Yamada 2.5 formulation, with no signifi-cant difference between k-e, k-w, and gen. schemes. Therefore, we used thegeneral length scale parameterization gen. with the parameter values given inof Warner et al. (2005) and the background vertical viscosity of 10–6 m2/s (Liand Boicourt, 2005). The bottom friction is of quadratic form with a coefficientcomputed from the logarithmic profile. For bulk fluxes of surface heat ex-change and momentum, we used Fairall et al. (1996) while equivalent salt ex-change is computed from the evaporation within ROMS, and rainfall rateswere prescribed from ALADIN model. At the open boundary of our model (lo-cated at the Otranto Strait), we used tidal forcing with Chapman and Flatherboundary conditions (Chapman, 1985; Flather, 1976) for free surface andbarotropic velocities. Tidal variability of free surface and currents for the ma-jor 7 tidal constituents (Janekovi} and Kuzmi}, 2005) is added to the boundaryvalues of daily average Adriatic REGional model (AREG) outputs (Oddo et. al.,2005). For temperature and salinity fields, we used AREG values along withradiation type conditions imposed at the open boundary.
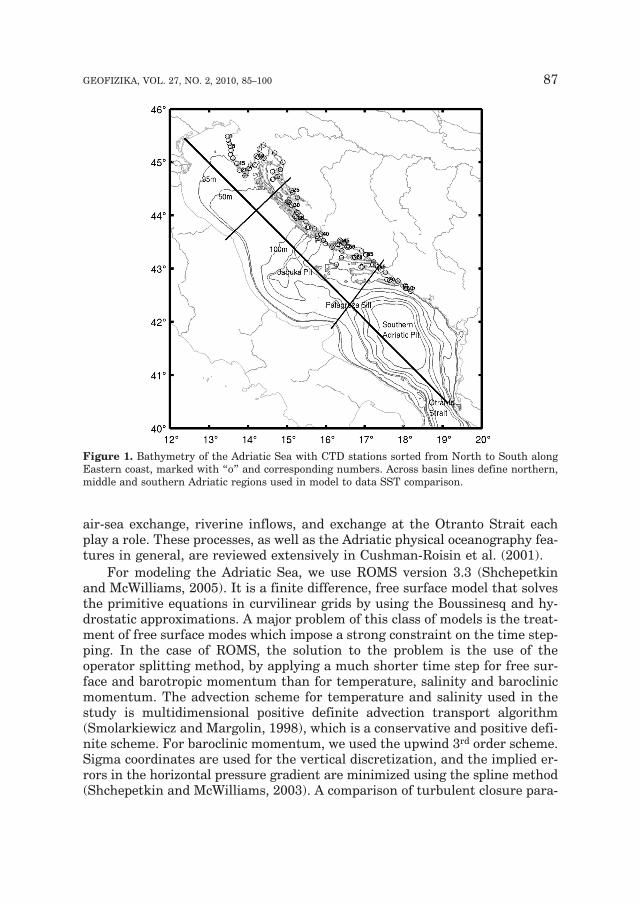
The curvilinear grid used in the study has a spatial horizontal resolutionof 2 km. It has been chosen so that the numerous islands and straits of theAdriatic Sea are reproduced as faithfully as possible, while still providing an-nual and/or near-real time simulations in a timely fashion on available hard-ware. The available bathymetry with a spatial resolution of 7.5 sec is averagedon the 2 km grid. In order to make the necessary bathymetry smoothing andreproduce as much as possible the real features of the basin, we used the lin-ear programming method (Dutour Sikiri} et al., 2009). In the vertical, we used20 sigma levels with a nonlinear transformation to ensure that the near-sur-face layer is adequately resolved (Figure 2).
Numerical simulations were performed from 15 August 2007 till 15 No-vember 2008, starting 3 months before the start of the project. The tempera-ture, salinity, free surface and velocity fields of the initial state were obtainedfrom the AREG model. The initial values for turbulent kinetic energy and tur-bulent length scale were problematic; they are governed by the two-equationmodel of the GLS. Spin up periods of turbulence models are rarely considered,but in our case, the vertical viscosity reached at some grid cells a value biggerthan 100 m2/s. Those excessively high values lead to destruction of the verticalT/S profiles at those respective cells. To remedy this problem, we used athree-day spinup period in which the effect of vertical viscosity on tempera-ture and salinity was limited to 0.01 m2/s.
At the surface, the model was forced with atmospheric data originatedfrom the ALADIN atmospheric model, with 8 km spatial resolution and tem-poral resolution of 3 hours. The model provided shortwave radiation, 2 m tem-perature, relative humidity, 10 m wind, mean sea level pressure, total cloudcover and precipitation. Longwave radiation was computed from cloud coverfraction, and air/sea temperatures using the Berliand formula (Berliand and
88 I. JANEKOVI] ET AL.: HINDCASTING THE ADRIATIC SEA SURFACE TEMPERATURE ...
Berliand, 1952). It should be noted that we use rain fall rate (P) from theALADIN model, but evaporation (E) was computed inside the ROMS modelfrom the bulk flux formulation. This could introduce imbalance in the freshwater flux at the air-sea interface. In our case, it means that evaporation couldbe slightly underestimated and that the resulting E-P is sometimes negative,while it is expected to be positive over the whole year (Maggiore et al., 1998).Coupling ocean and atmosphere models could solve the problem but only ifboth models use the same boundary layer formulation, which is not usuallythe case. When interpolating ALADIN values onto the ROMS grid, we firstcomputed the coefficients of linear interpolation and discarded the cells thatare located on the land. If all points were discarded, we took the values at thenearest point of the atmospheric model over the sea in order to avoid contami-nation of ocean forcing fields by using meteo values over the land. The short-wave heating of the water column is modeled by exponential decay parameters(Paulson and Simpson, 1977) obtained by assuming that the sea waters are ofJerlov type I.B (Jerlov, 1976). More accurate description of near-surface condi-tions in space and time were not available. Fresh water inflow was taken intoaccount by applying 48 fresh water sources around the basin according toRaicich (1994) climatology and modified with real time measurements of tem-perature and river flux for the Po and Neretva rivers. In addition to the twomajor fresh water sources we had access to real time data for small rivers onthe eastern side of the Adriatic Sea: Ombla, Jadro, Krka, Zrmanja, Cetina,
GEOFIZIKA, VOL. 27, NO. 2, 2010, 85–100 89
Figure 2. Vertical model levels along the longitudinal transect marked in Figure 1.

Rje~ina, Dubra~ina and Ra{a which we used during the simulation. For riversMirna, Dragonja, Timav, Drnica, Bada{evica, Ri`ana and So~a, we used re-cently published climatological values (Mala~i~ and Petelin, 2009). For the restof the rivers located at the western side of the Adriatic Sea, we scaled their cli-matological flux values with respect to the measured Po river flux. The scalingfactor as function of time was computed as the ratio between measured Poriver fluxes and climatological values for Po river in that particular time. Onthe other hand, for fresh water springs located predominantly in the VelebitChannel and Rijeka Bay, we used scaled climatological values with respect tothe Neretva river, computed in the same manner as for the Po river. This ap-proach assumed that if there is a dry or rainy period at the western side of theAdriatic Sea (according to the Po river flux) then it is propagated into all otherfresh water sources on the side for that period. A similar situation holds forthe eastern side of the Adriatic coast and rivers where we had no observations.This can seem wrong for certain episodes, but generally, we think this im-proves the crude climatological values for the rivers and springs without avail-able measurements.
3. Data
The complex topography and the size of the Adriatic Sea, as seen on Fig-ure 1, will always result in undersampling of 3D variables needed for modelinitialization or comparison. During the project, CTD data were collected inthe proximity of Croatian coast (1 Nm off the coast) and were designed to beused in local small domain models and not for direct comparison with theROMS 2 km model. Still, we found the data valuable for estimating the errorof our model near the coast. Therefore, one has to bear in mind that this is thevery first wet grid cell in the model where lateral boundary conditions play animportant role, and physical processes are still not fully developed. Neverthe-less, we used the CTD data observations in four different periods, one at thebeginning of the project – November 2007, then in March 2008, following withMay – June 2008 and July 2008. Data were sampled at 77 CTD stations alongthe Croatian coast (Figure 1) making an overall large number (13629 = 4 casts* 77 stations * depths every 1 m) of available data for model comparison. Mis-match between model and CTD depths were more pronounced at the southernpart of the stations, hence we decided to use only the CTD data at depths thatare presented within our model so that no vertical extrapolation was madefrom the model to CTD data.
The second type of data used in model skill estimation is produced by theEuropean Space Agency’s Medspiration project (http://www.medspiration.org).We used the daily L4 high resolution SST product retrieved from Jan to Sep2008 at 2 km resolution. These are merged SST data, derived from both infra-red and microwave sensors, into a single daily product that provides the bestestimate of foundation SST, i.e. the SST free of diurnal warming influence and
90 I. JANEKOVI] ET AL.: HINDCASTING THE ADRIATIC SEA SURFACE TEMPERATURE ...

cool skin effect. SST skin or sub-skin data from different sensors are first con-verted to foundation SST by applying skin layer and diurnal thermoclinestructure parameterization. Afterwards, the optimal interpolation techniqueis used to merge the converted data. Since foundation temperature representsthe temperature of the upper mixed layer, this temperature should correspondto the surface layer of the ocean model and therefore is adequate for compari-son with model data. However, one problem that arises in the winter monthsfor the Adriatic Sea, specifically the northern part, is the lack of observationaldata over the Adriatic Sea; higher resolution infrared sensors cannot provideany observation for prolonged periods of time due to the prevailing cloud cov-erage, while microwave sensors, unaffected by clouds, have near-land SSTcontamination of around 75 km with a rather coarse sensor resolution (1/4deg). In absence of available high resolution observation, analyzed SST fieldsare sometimes overly smoothed. When producing L4 SST analysis, each singlesensor measurement contributes its own error statistic to the value of eachpixel, and the overall L4 absolute error is targeted to be less than 0.4 °C(Donlon et al., 2005).
When compared to the CTD data, the SST L4 data, are limited only to thesurface layer and have a significantly higher observation error. Nevertheless,they are available over the entire domain on a daily basis, which makes themextremely useful for assessing model SST skill.
4. Results and discussion
As noted in Greenberg et al. (2007), comparing model with data has an in-trinsic difficulty: numerical schemes, and thus models, have good error esti-mates in the middle of the domain but are inaccurate on the boundaries,where measurements are performed. This makes it quite hard to evaluate thequality of oceanographic modeling; especially in our study, since the reliablewater column oceanographic data sets we have are CTD data near the coastand SST data on the surface. Within the study, we performed simulations us-
GEOFIZIKA, VOL. 27, NO. 2, 2010, 85–100 91
Table 1. Statistical parameters for model to CTD data comparison. The columns represent in order
mean cruise date, number of CTD stations used for comparison, temperature and salinity RMSE,
ME and Correlation coefficient.
Mean Cruisedate
NTemperature (°C) Salinity (psu)
RMSE ME Correlation RMSE ME Correlation
01-11-2007 75 1.18 0.84 0.75 0.47 –0.17 0.32
20-03-2008 78 0.61 0.33 0.92 0.69 –0.30 0.64
01-06-2008 77 0.92 –0.21 0.92 0.92 –0.44 0.76
01-07-2008 77 1.38 –0.37 0.95 0.79 –0.41 0.78
ing the previously described setup without any data assimilation techniques.Comparison of measurements with model results was done by interpolating inspace and time from model hourly outputs into observation data space.
4.1 Model to CTD data comparison
Model-to-data comparison was done for CTD data sampled during fourcruises (November 2007, March, May and July 2008) by applying 3D interpola-tion of observed CTD data to model depths. We found some inconsistencies be-tween the depth measured by CTD and the existing bathymetry in the model,mainly due to the fact that bathymetry of the model grid is the average of ob-served bathymetry over 2 km x 2 km grid cells. Nevertheless, for stations 23, 27,44, 47, 74 and 77 the differences are more than 20 m, which leads us to suspectthat some of bathymetry measurements used in the model grid are incorrect.
Comparisons for temperature in November 2007 yield relatively largeRMSE at all depths with a mean value of 1.18 °C. We believe that the largemodel-to-data discrepancy reflects the fact that the model was still in spinupphase from the AREG fields, which were warmer than CTD observations atthe end of year 2007; this is evident in the high value for ME of 0.84 °C (pres-ents bias of the model with respect to the observations). The situation is muchbetter for salinity; the overall RMSE is 0.47 PSU, with its highest value at thesurface of 0.56 PSU (from surface till 20 m depth), as opposed to 0.15 PSU fordeeper ones (20 m till bottom). The overall ME for salinity is –0.21 PSU for theshallow part and –0.09 PSU for the deeper part of the water column with a col-umn mean value of –0.17 PSU. The correlation coefficient, with a confidencelevel of 95 %, between model and CTD data for all depths is 0.75 and 0.32 fortemperature and salinity, respectively.
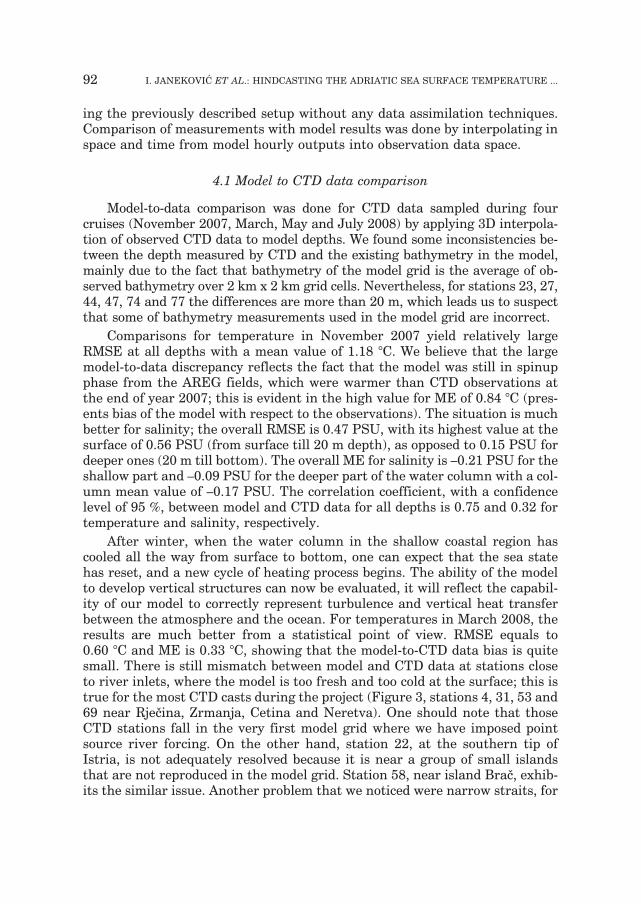
After winter, when the water column in the shallow coastal region hascooled all the way from surface to bottom, one can expect that the sea statehas reset, and a new cycle of heating process begins. The ability of the modelto develop vertical structures can now be evaluated, it will reflect the capabil-ity of our model to correctly represent turbulence and vertical heat transferbetween the atmosphere and the ocean. For temperatures in March 2008, theresults are much better from a statistical point of view. RMSE equals to0.60 °C and ME is 0.33 °C, showing that the model-to-CTD data bias is quitesmall. There is still mismatch between model and CTD data at stations closeto river inlets, where the model is too fresh and too cold at the surface; this istrue for the most CTD casts during the project (Figure 3, stations 4, 31, 53 and69 near Rje~ina, Zrmanja, Cetina and Neretva). One should note that thoseCTD stations fall in the very first model grid where we have imposed pointsource river forcing. On the other hand, station 22, at the southern tip ofIstria, is not adequately resolved because it is near a group of small islandsthat are not reproduced in the model grid. Station 58, near island Bra~, exhib-its the similar issue. Another problem that we noticed were narrow straits, for
92 I. JANEKOVI] ET AL.: HINDCASTING THE ADRIATIC SEA SURFACE TEMPERATURE ...
GEOFIZIKA, VOL. 27, NO. 2, 2010, 85–100 93
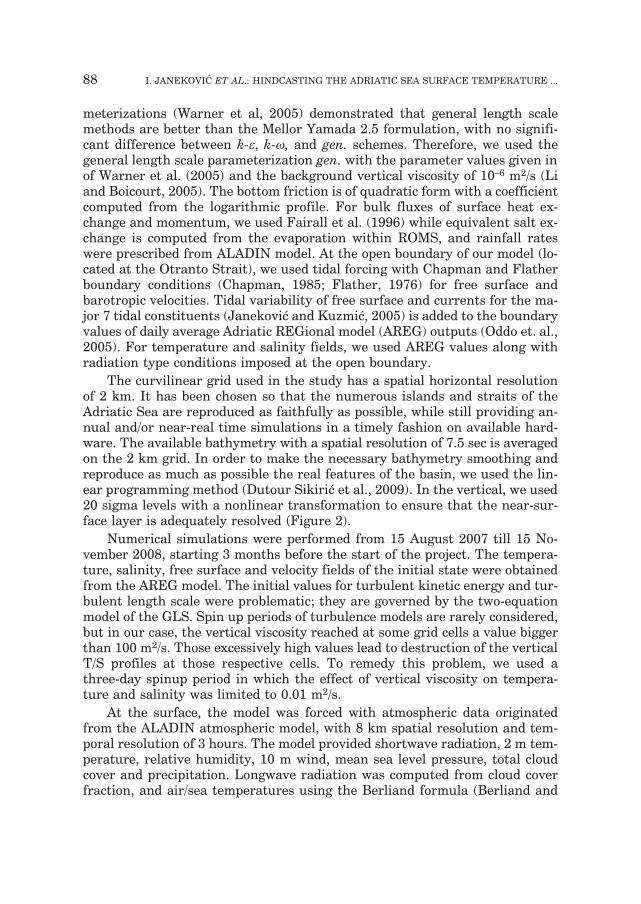
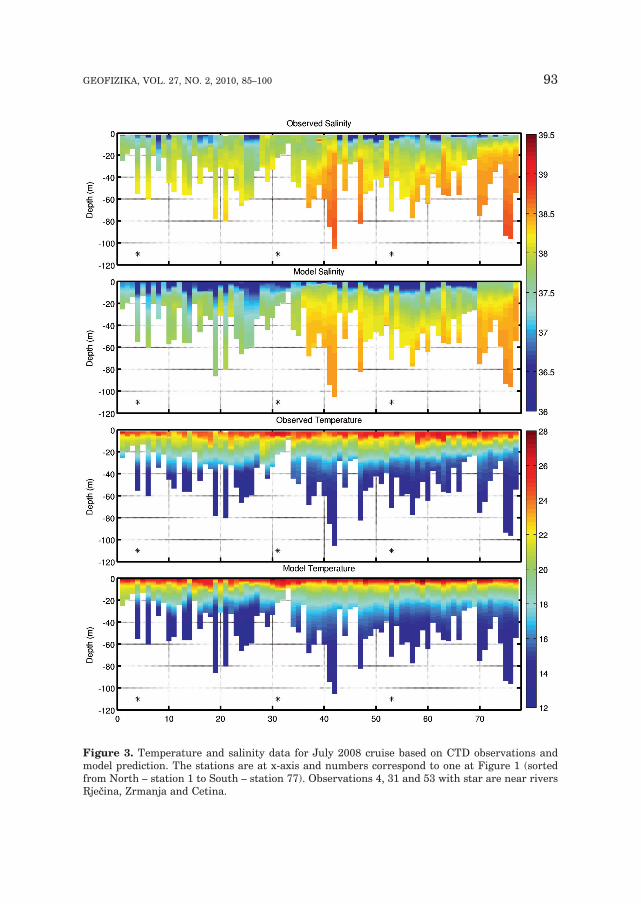
Figure 3. Temperature and salinity data for July 2008 cruise based on CTD observations andmodel prediction. The stations are at x-axis and numbers correspond to one at Figure 1 (sortedfrom North – station 1 to South – station 77). Observations 4, 31 and 53 with star are near riversRje~ina, Zrmanja and Cetina.
example the one between the island Pag and Krk, which are important for cir-culation but almost impossible to reproduce adequately within numerical mo-del grid. Stations 8 and 28 are flawed for this reason. For the most of the CTDdata, the model is too fresh with the exception at the south (Figure 3) wherewe have the opposite situation, the model is slightly saltier than observations,probably because we had poor representation of the Albanian rivers inside ourmodel.
In May–June–July, the thermocline develops, and it is apparent from Fig-ure 3 and transect plots (not shown) that the model represents this develop-ment well. The model predicted thermocline in the majority of the stations atcorrect depths, with somewhat a bit shallower thermocline for southern sta-tions (Figure 3). Therefore, this gives us confidence in the turbulence closurescheme used in the model, at least in comparison with available CTD data.
In the Southern part of the Adriatic Sea, observed CTD values are well re-presented within the model throughout all casts, with correct values for tem-perature and salinity and a relatively small error overall. All of these resultsindicate that exchange between Adriatic and Ionian Sea waters are well mod-eled by the AREG model and thus, by the ROMS model as well. However, thequality of results for stations strongly influenced by topography or in the prox-imity of rivers was worse.
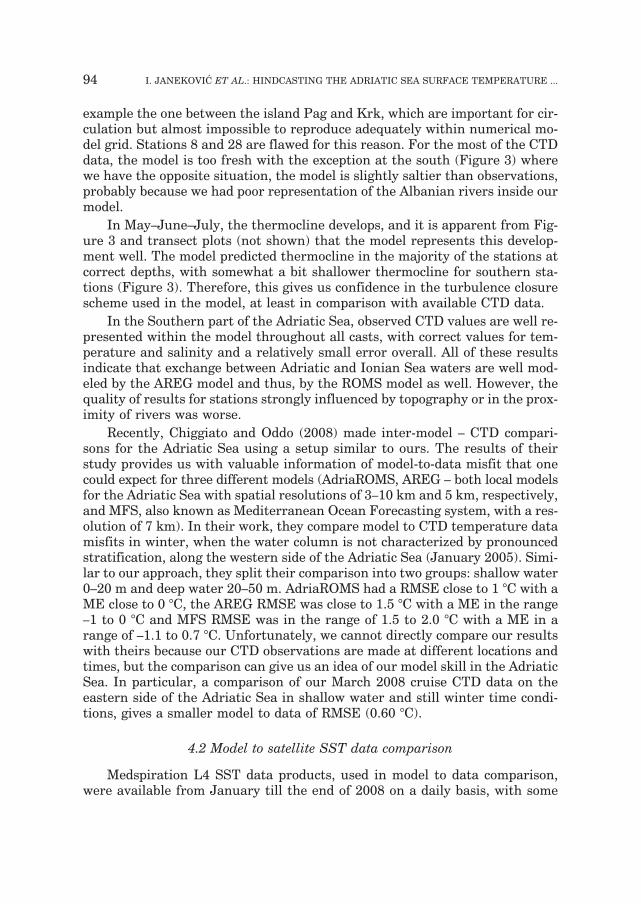
Recently, Chiggiato and Oddo (2008) made inter-model – CTD compari-sons for the Adriatic Sea using a setup similar to ours. The results of theirstudy provides us with valuable information of model-to-data misfit that onecould expect for three different models (AdriaROMS, AREG – both local modelsfor the Adriatic Sea with spatial resolutions of 3–10 km and 5 km, respectively,and MFS, also known as Mediterranean Ocean Forecasting system, with a res-olution of 7 km). In their work, they compare model to CTD temperature datamisfits in winter, when the water column is not characterized by pronouncedstratification, along the western side of the Adriatic Sea (January 2005). Simi-lar to our approach, they split their comparison into two groups: shallow water0–20 m and deep water 20–50 m. AdriaROMS had a RMSE close to 1 °C with aME close to 0 °C, the AREG RMSE was close to 1.5 °C with a ME in the range–1 to 0 °C and MFS RMSE was in the range of 1.5 to 2.0 °C with a ME in arange of –1.1 to 0.7 °C. Unfortunately, we cannot directly compare our resultswith theirs because our CTD observations are made at different locations andtimes, but the comparison can give us an idea of our model skill in the AdriaticSea. In particular, a comparison of our March 2008 cruise CTD data on theeastern side of the Adriatic Sea in shallow water and still winter time condi-tions, gives a smaller model to data of RMSE (0.60 °C).
4.2 Model to satellite SST data comparison
Medspiration L4 SST data products, used in model to data comparison,were available from January till the end of 2008 on a daily basis, with some
94 I. JANEKOVI] ET AL.: HINDCASTING THE ADRIATIC SEA SURFACE TEMPERATURE ...

gaps in April and May. We used daily fields from the individual scenes andcompared them against model values at 3 UTC time. In that sense, model tem-perature values were not affected by diurnal heating and thus were equivalentto foundation temperature.
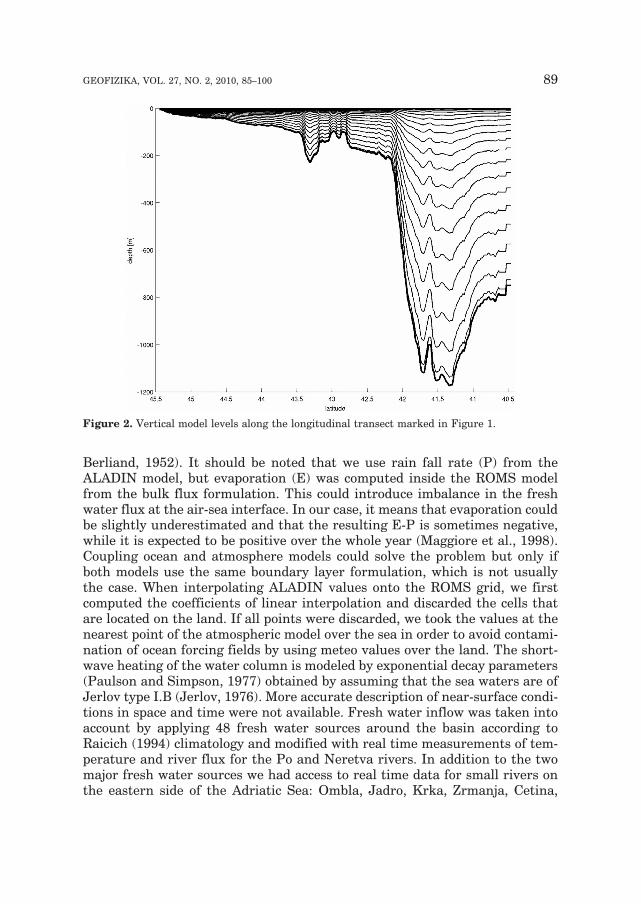
To further investigate and locate the regions that contribute the most tothe model mismatch, we divided the Adriatic Sea into three subdomains; north-ern, middle and southern Adriatic regions (see Figure 1 for the regions). Foreach of the regions, we performed statistical analysis using the same method,we interpolated the model results onto satellite grid. We had a total number of8372 pixels for the northern, 13488 for the middle and 14372 for the southernregion on a daily basis. Using the values, we computed the ME, Correlation Co-efficient (CORR) and RMSE as measure of model-to-data skill. In general, simi-lar performance is found for the whole Adriatic Sea (Figure 4, Table 2), withsubtle differences in each region whether affected by lateral forcing, rivers oropen boundary. When using numerical models based on sigma vertical coordi-nate it is difficult to reproduce the thermocline adequately in deep waters. Thetop sigma layer should not be too deep, and the number of levels should be suffi-cient in order to constrain the vertical temperature structure well. In order toresolve that, we used proper boundary conditions from AREG model, as well asnew, nonlinear vertical, sigma transformation characterized with denser andthinner layers in the surface region. The slightly larger error found during Junein the Northern Adriatic can be attributed partly to the problem of river forcingthat is difficult for the model to resolve fully and adequately. Moreover, whenlooked closer to the source of the discrepancy at the specific days in June, wefound that for certain scenes there were no AVHRR data available, meaningthat the Medspiration data were obtained solely from coarse resolution micro-wave data. The same holds for some days in July demonstrating that we shoulduse the data with additional caution.
Transect plots (not shown) and previous CTD plots indicate that theROMS model reproduces the thermocline in shallow water regions well sincethe surface is adequately resolved. The ME (Figure 4, C) remains low over thewhole period but the correlation (Figure 4, D) is lower for August until Octo-ber, probably due to the more important subgrid scale processes at the sur-face.
If we calculate ME for all available data and for all pixels in the NorthernAdriatic with respect to the satellite SST, there is a small model bias of–0.03 °C with a RMSE equal to 0.90 °C. The Middle Adriatic overall ME forSST is –0.12 °C with a RMSE equal to 0.79 °C, while for the Southern Adriaticthe numbers are –0.03 °C and 0.80 °C, respectively. The correlation coefficienthas a value in the Northern Adriatic between 0.70 and 0.89, in the Middle be-tween 0.44 and 0.92 and in the Southern Adriatic between 0.50 and 0.91. How-ever, if we take all available data in time for the model and the satellite andthen compute statistics in the same way, we got correlation coefficient of 0.99for any of the three regions in the Adriatic Sea.
GEOFIZIKA, VOL. 27, NO. 2, 2010, 85–100 95
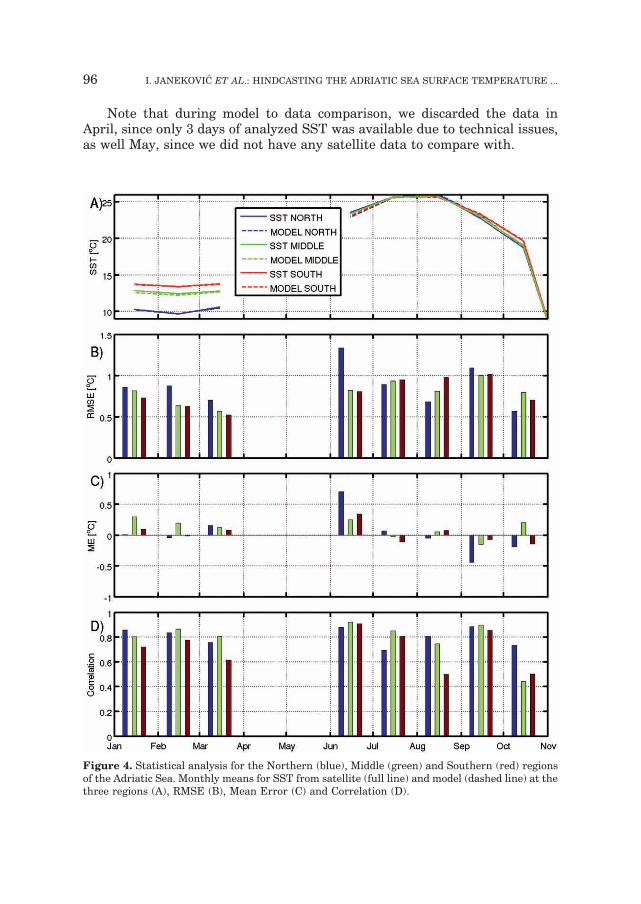
Note that during model to data comparison, we discarded the data inApril, since only 3 days of analyzed SST was available due to technical issues,as well May, since we did not have any satellite data to compare with.
96 I. JANEKOVI] ET AL.: HINDCASTING THE ADRIATIC SEA SURFACE TEMPERATURE ...
Figure 4. Statistical analysis for the Northern (blue), Middle (green) and Southern (red) regionsof the Adriatic Sea. Monthly means for SST from satellite (full line) and model (dashed line) at thethree regions (A), RMSE (B), Mean Error (C) and Correlation (D).

GEOFIZIKA, VOL. 27, NO. 2, 2010, 85–100 97
Table 2. Statistical parameters for model and remotely sensed SST monthly mean fields in 2008
year at different regions.
ME
MONTH NORTH MIDDLE SOUTH WHOLE
January –0.00 –0.29 –0.10 –0.15
February 0.05 –0.20 0.01 –0.06
March –0.15 –0.12 –0.08 –0.11
Jun –0.71 –0.26 –0.34 –0.39
July –0.08 0.02 0.11 0.04
August 0.05 –0.06 –0.08 –0.04
September 0.44 0.15 0.07 0.19
October 0.19 –0.21 0.14 0.02
Whole period –0.03 –0.12 –0.03 –0.06
RMSE
MONTH NORTH MIDDLE SOUTH WHOLE
January 0.86 0.82 0.73 0.79
February 0.87 0.63 0.63 0.69
March 0.70 0.57 0.52 0.58
Jun 1.33 0.82 0.80 0.96
July 0.89 0.93 0.95 0.93
August 0.68 0.81 0.98 0.85
September 1.09 1.00 1.02 1.03
October 0.57 0.79 0.70 0.71
Whole period 0.90 0.79 0.80 0.82
CORRELATION
MONTH NORTH MIDDLE SOUTH WHOLE
January 0.86 0.80 0.72 0.90
February 0.84 0.87 0.78 0.93
March 0.76 0.81 0.62 0.93
Jun 0.88 0.92 0.91 0.90
July 0.70 0.85 0.81 0.81
August 0.81 0.75 0.50 0.68
September 0.89 0.90 0.86 0.88
October 0.74 0.44 0.50 0.63
Whole period 0.99 0.99 0.99 0.99
5. Conclusions
In this study, we have addressed the skill of the Adriatic Sea temperatureand salinity hindcasts obtained with the implementation of the ROMS model.The hindcast error estimate was obtained by comparing the ROMS model re-sults with CTD observations in the coastal zone, collected during four cruisesat 77 stations, as well as with the remotely sensed SST produced by the Med-spiration project. The comparison has shown that the model hindcasts are ca-pable of reproducing the near coastal fields of temperature and salinity (Table1) with accuracy agreeable, or better, to operational model predictions re-ported in Chiggiato and Oddo (2008). The period of renewed, spring heatingproved to be a rather demanding test for the turbulent closure schemes, butthe model successfully reproduced the formation of the seasonal thermocline,in terms of magnitudes and depths. Comparison with previous results (Chiggi-ato and Oddo, 2008) indicate that the present hindcast has a smaller RMSE,although direct comparison is not strictly valid (observations are made in dif-ferent time and at different locations). The overall model-to-CTD data hind-cast RMSE for 2008 was 1.02 °C for temperature and 0.72 PSU for salinity.The lack of complete river discharge data and exact positions and fluxes of thebottom springs seems to be a considerable problem. The major part of themodel to CTD data mismatch is found in the surface layers where river effectis dominant. Climatological values for river runoff are usually limited to themean values providing low frequency signals that can become problematic forcoastal regions due to large variability in time. Comparison with the remotelysensed SST data during the period January 2008 – September 2008 revealedthat the ME is similar in the whole Adriatic; in the northern part it is –0.03 °C,middle –0.12 °C and in the southern –0.03 °C. Overall RMSE during the simu-lation is less than 0.90 °C in all regions. However, we would expect that insigma based models, where vertical layers have different thickness, more prob-lems would appear in the deeper regions of the model domain (in our case inthe Southern Adriatic). In that sense, it is difficult to reproduce seasonalthermocline variability in deeper waters simply by using sparse and thicksigma levels at the surface. In order to minimize the effect, we used a new non-linear vertical sigma stretching formulation, recently available in ROMS mo-del rev. 322, to provide us far more surface levels in the problematic deep re-gion. Another problem that contributed to the error was the influence of theboundary condition and initial state; we initially used simple radiation bound-ary conditions along with climatological initial fields, but using AREG initialfields and daily boundary values from the same model proved to be more suc-cessful. It is worth mentioning that the ocean model used to generate hind-casts used 2 km spatial resolution whereas the atmospheric forcing was pro-vided at 8 km spatial resolution. The complex eastern side of the Adriatic Seais characterized by many narrow channels and islands in Croatian waters, sug-gesting that model solutions could still benefit from higher and better bal-anced atmospheric and marine model resolution. Another cause of concern is
98 I. JANEKOVI] ET AL.: HINDCASTING THE ADRIATIC SEA SURFACE TEMPERATURE ...

the inaccurate bathymetry measurements in the available bathymetry data-base. Improvements along any of the mentioned lines are likely to improve theskill of the hindcasts; some of which are already under way.
Acknowledgements: We thank John Warner for helpful discussions concerning the turbu-lence parameterization and Jacopo Chiggiato, Rich Signell for information on the rivers. Weare thankful to the INGV physical oceanography group for Adriatic Forecasting System pro-viding us boundary and initial fields from their AREG model. The Ministry of EnvironmentalProtection kindly made the CTD data available through The Adriatic Sea Monitoring Pro-gram. We are thankful to ARPA-SIM, ARPA Emilia-Romagna, Italy for real time Po riverdata, Croatian Meteorological and Hydrological Service for providing us river data as well.
The work was supported by the Ministry of Science, Education and Sports of the Re-public of Croatia (grant No. 098-0982705-2707).
References
Andro~ec, V., Beg-Paklar, G., Dadi}, V., Djakovac, T., Grbec, B., Janekovi}, I., Krstulovi}, N.,Ku{pili}, G., Leder, N., Lon~ar, G., Marasovi}, I., Precali, R. and [oli}, M. (2009): The Adriatic
Sea Monitoring Program, Final Report, Project No. M-C-1, Ministry of Environmental Protec-tion, Physical Planning and Construction of Republic of Croatia, Zagreb.
Berliand, M. E. and Berliand, T. G. (1952): Determination of effective radiation of the earth as in-fluenced by cloud cover, Izv. Akad. Nauk SSR, Ser. Geofiz., 1.
Chapman, D. C. (1985): Numerical treatment of cross shelf open boundaries in a barotropic coa-stal ocean model, J. Phys. Oceanogr., 15, 1060–1075.
Chiggiato, J. and Oddo, P. (2008): Operational ocean models in the Adriatic Sea: a skill assess-ment, Ocean Sci., 4, 61–71.
Cushman-Roisin, B., Ga~i}, M., Poulain, P.-M. and Artegiani, A. (2001): Physical Oceanography of
the Adriatic Sea: Past, Present and Future, Kluwer Academic Publishers, Dordrecht, 304 pp.Donlon, C. W. and the GHRSST-PP Science Team (2005): The GHRSST-PP Product User Man-
ual, GDSv1.6, International GHRSST-PP Project Office, Oxford, 245 pp.Dutour Sikiri}, M. A., Janekovi}, I. and Kuzmi}, M. (2009): A new approach to bathymetry
smoothing in sigma-coordinate ocean models, Ocean Modell., 29, 128–136.Fairall, C. W., Bradley, E. F., Rogers, D. P., Edson, J. B. and Young, G. S. (1996): Bulk parameteri-
zation of air-sea fluxes for tropical ocean-global atmosphere coupled-Ocean Atmosphere Re-sponse experiment, J. Geophys. Res., 101, 3747–3764.
Flather, R. A. (1976): A tidal model of the northwest European continental shelf, Memoires de la
Societe Royale des Sciences de Liege, 6, 141–164.Greenberg, D. A., Dupont, F., Lyard, F. H., Lynch, D. R. and Werner, F. E. (2007): Resolution is-
sues in numerical models of oceanic and coastal circulation, Cont. Shelf. Res., 27, 1312–1343.Janekovi}, I. and Kuzmi}, M. (2005): Numerical simulation of the Adriatic Sea principal tidal con-
stituents, Ann. Geophys., 23, 3207–3218.Jerlov, N. G. (1976): Marine Optics, Elsevier, New York, 231 pp.Li, M., Zhong, L. and Boicourt, W. C. (2005): Simulations of Chesapeake Bay estuary: Sensitivity
to turbulence mixing parameterizations and comparison with observations, J. Geophys. Res.,
110, C12004.Mala~i~, V. and Petelin, B. (2009): Climactic circulation in the gulf of Trieste (northern Adriatic),
J. Geophys. Res., 114, C07002, doi:10.1029/2008JC004904.Maggiore, A., Zavatarelli, M., Angelucci, M. G. and Pinardi, N. (1998): Surface heat and water
fluxes in the Adriatic Sea: seasonal interannual variability, Phys. Chem. Earth., 23, 561–567.
GEOFIZIKA, VOL. 27, NO. 2, 2010, 85–100 99
Oddo, P., Pinardi, N., Zavatarelli, M. and Coluccelli, A. (2006): The Adriatic Basin ForecastingSystem, Acta Adriatica, 47 (Suppl.), 169–184.
Paulson, C. A. and Simpson, J. J. (1977): Irradiance measurements in the upper ocean, J. Phys.
Oceanogr., 7, 952–956.Powell, B., Arango, H. G., Moore, A. M., Di Lorenzo, E., Milliff, R. F. and Foley, D. (2008): 4DVAR
data assimilation in the Intra-Americas Sea with the Regional Ocean Modeling System (ROMS),Ocean Modell., 23, 130–145.
Raicich, F. (1994): Notes on the flow rates of the Adriatic rivers. Tech. Rep. RF 02/94, 8 pp., CNR.Ist Sper Talassografico, Trieste, Italy.
Shchepetkin, A. F. and McWilliams, J. C. (2003): A method for computing horizontal pressure-gra-dient force in an oceanic model with a non-aligned vertical coordinate, J. Geophys. Res., 108,doi: 10.1029/2001GL013990.
Shchepetkin, A. F. and McWilliams, J. C. (2005): The Regional Ocean Modeling System: A split-ex-plicit, free-surface, topography following coordinates ocean model, Ocean Modell., 9, 347–404.
Smolarkiewicz, P. K. and Margolin, L. G. (1998): MPDATA: A finite-difference solver for geophys-ical flows, J. Comput. Phys., 140, 459–480.
Warner, J. C., Sherwood, C. R., Arango, H. G. and Signell, R. P. (2005): Performance of four turbulen-ce closure models implemented using a generic length scale method, Ocean Modell., 8, 81–113.
SA@ETAK
Predikcija povr{inske temporature i slanosti Jadranskog mora:
novije iskustvo u modeliranju
Ivica Janekovi}, Mathieu Dutour Sikiri}, Igor Toma`i} i Milivoj Kuzmi}
Modelske simulacije jadranske temperature i saliniteta u 2008 godini uspore|enesu s priobalnim CTD mjerenjima i satelitski detektiranim povr{inskim temperaturamamora u cilju vrednovanja prediktivnih sposobnosti modela u priobalnom moru. S timciljem je Regional Ocean Modeling System (ROMS), forsiran atmosferskim modelomALADIN (Aire Limitée Adaptation Dynamique développement InterNational) uz razlu-~ivanje od 8 km, primijenjen na Jadransko more uz horizontalno razlu~ivanje od 2 km.
Mjerenja temperature i saliniteta pomo}u CTD sonde, obavljena u isto~no-jadran-skom priobalju u okviru Programa monitoringa Jadranskog mora, imaju visoku korela-ciju s modelom u temperaturnom polju s vrijednostima izme|u 0.75 i 0.95, ovisno o go-di{njem dobu/krstarenju, dok za polje saliniteta vrijednosti su izme|u 0.32 i 0.78.Usporedba s daljinski detektiranim podacima o povr{inskoj temperaturi mora (SST), zacijelu 2008. godinu, napravljena je za svaki pojedina~ni pixel s podacima. Rezultati us-poredbi pokazuju da aposteriorne simulacije (hindcasts) za cijelu 2008 godinu imaju ma-lu RMS pogre{ku, u sjevernom Jadranu 0.90 °C, u podru~ju srednjeg Jadrana 0.79 °C,te ju`nog Jadrana 0.80 °C. Koeficijent korelacije izme|u modeliranih i satelitski dobive-nih povr{inskih temperatura mora ima vrijednosti izme|u 0.44 i 0.92, ovisno o mjesecui podru~ju Jadrana, dok za sve vrijednosti u vremenu iznosi 0.99 za bilo koje podru~je.
Klju~ne rije~i: Jadransko more, povr{inska temperatura mora, ROMS, in situ podaci
Corresponding author’s address: Ivica Janekovi}, Ru|er Bo{kovi} Institute, Department of Marine and Environ-mental Research, P.O. Box 180, 10002 Zagreb, Croatia, e-mail: [email protected]
100 I. JANEKOVI] ET AL.: HINDCASTING THE ADRIATIC SEA SURFACE TEMPERATURE ...
Related Documents