5/17/2019 1 Peter Buffon, Luke Bohanan, Jeff Strekas, Hildegarde Heymann, and David E. Block Department of Viticulture and Enology University of California, Davis “Some wine makers, especially those at smaller, artisanal wineries, believe that this process may strip subtle aromas and flavors from the finished wine, along with the haze, and so they make their wines by more traditional processes. The clarity may suffer (although most well-made wines come out clear even without filtering), but these wines are certainly as good, and perhaps even better, than the industrial-type wines.” --wine lovers page The easiest way to tell whether a wine has been filtered is to observe its level of clarity. An unfiltered red wine may appear murky, "polluted" or dark. This is not a bad thing, it simply means that the wine was probably not filtered. Like coffee, wine is put through a filtration process that removes small particles. Many winemakers argue, however, that this process is not only unnecessary but actually bad for the wine as filtration can affect the wine's flavor and aroma. Read more: What Is an Unfiltered Red Wine? | eHow.com However, these filtering processes may also remove elements that affect the flavors and aromas of a wine, so some winemakers choose not to filter. They believe that filtering strips the wine of its true character, and employ other methods of getting the wine as clear as possible (racking, cold stabilization, and other old-school techniques are the alternative). There are also wineries that avoid filtering — or keep it to an absolute minimum — to maintain organic status. --wine weekly Some wine makers believe that this process may strip subtle aromas and flavors from the finished wine Many winemakers argue, however, that this process is not only unnecessary but actually bad for the wine as filtration can affect the wine's flavor and aroma. some winemakers choose not to filter. They believe that filtering strips the wine of its true character Clarity Microbial Stability Need a systematic study to examine the effects of filtration

Welcome message from author
This document is posted to help you gain knowledge. Please leave a comment to let me know what you think about it! Share it to your friends and learn new things together.
Transcript
5/17/2019
1
Peter Buffon, Luke Bohanan, Jeff Strekas, Hildegarde Heymann, and David E. BlockDepartment of Viticulture and EnologyUniversity of California, Davis
“Some wine makers, especially those at smaller, artisanal wineries, believe that this process may strip subtle aromas and flavors from the finished wine, along with the haze, and so they make their wines by more traditional processes. The clarity may suffer (although most well-made wines come out clear even without filtering), but these wines are certainly as good, and perhaps even better, than the industrial-type wines.”--wine lovers page
The easiest way to tell whether a wine has been filtered is to observe its level of clarity. An unfiltered red wine may appear murky, "polluted" or dark. This is not a bad thing, it simply means that the wine was probably not filtered. Like coffee, wine is put through a filtration process that removes small particles. Many winemakers argue, however, that this process is not only unnecessary but actually bad for the wine as filtration can affect the wine's flavor and aroma. Read more: What Is an Unfiltered Red Wine? | eHow.com
However, these filtering processes may also remove elements that affect the flavors and aromas of a wine, so some winemakers choose not to filter. They believe that filtering strips the wine of its true character, and employ other methods of getting the wine as clear as possible (racking, cold stabilization, and other old-school techniques are the alternative). There are also wineries that avoid filtering — or keep it to an absolute minimum — to maintain organic status.--wine weekly
Some wine makers believe that this process may strip subtle aromas and flavors from the finished wine
Many winemakers argue, however, that this process is not only unnecessary but actually bad for the wine as filtration can affect the wine's flavor and aroma.
some winemakers choose not to filter. They believe that filtering strips the wine of its true character
Clarity
Microbial Stability
Need a systematic study to examine the effects of filtration
5/17/2019
2
Discuss common wine filtration processes Investigate any transient changes in chemical composition during filtration
Evaluate the sensory and chemical impact of pad sterile cartridge filtration on red and white wines
Evaluate the effects of cross‐flow filtration Evaluate the effects of pumping
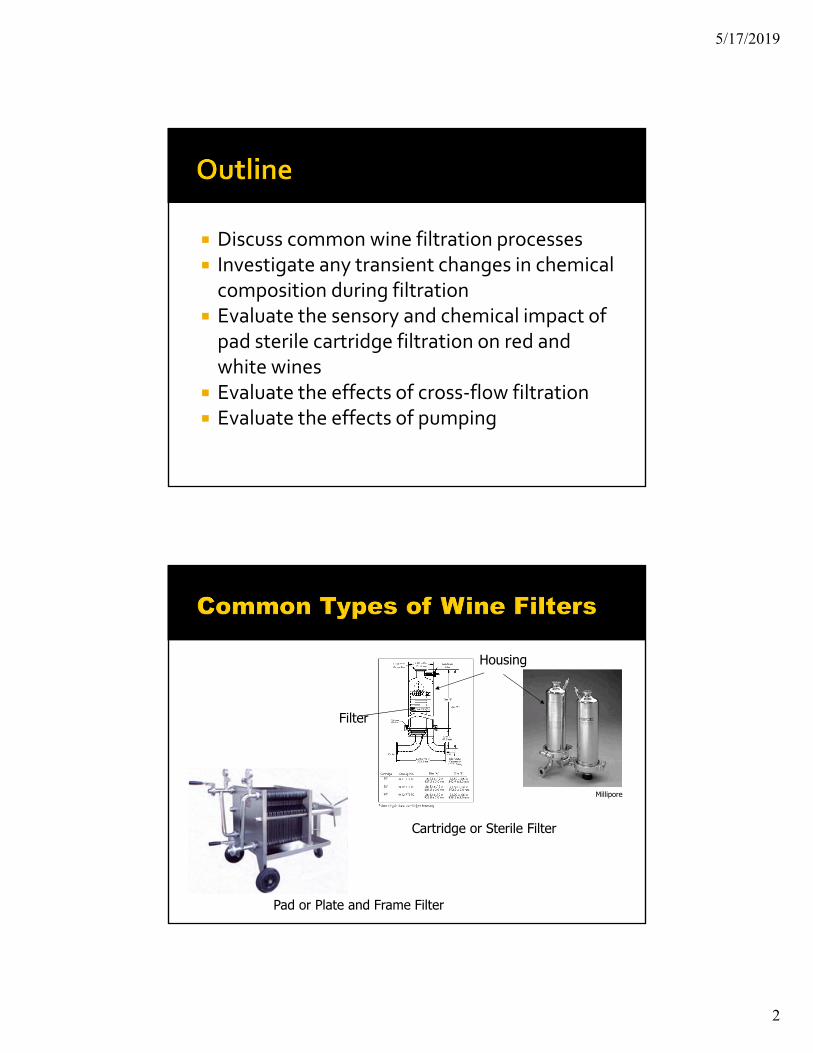
Millipore
Housing
Filter
Pad or Plate and Frame Filter
Cartridge or Sterile Filter
5/17/2019
3
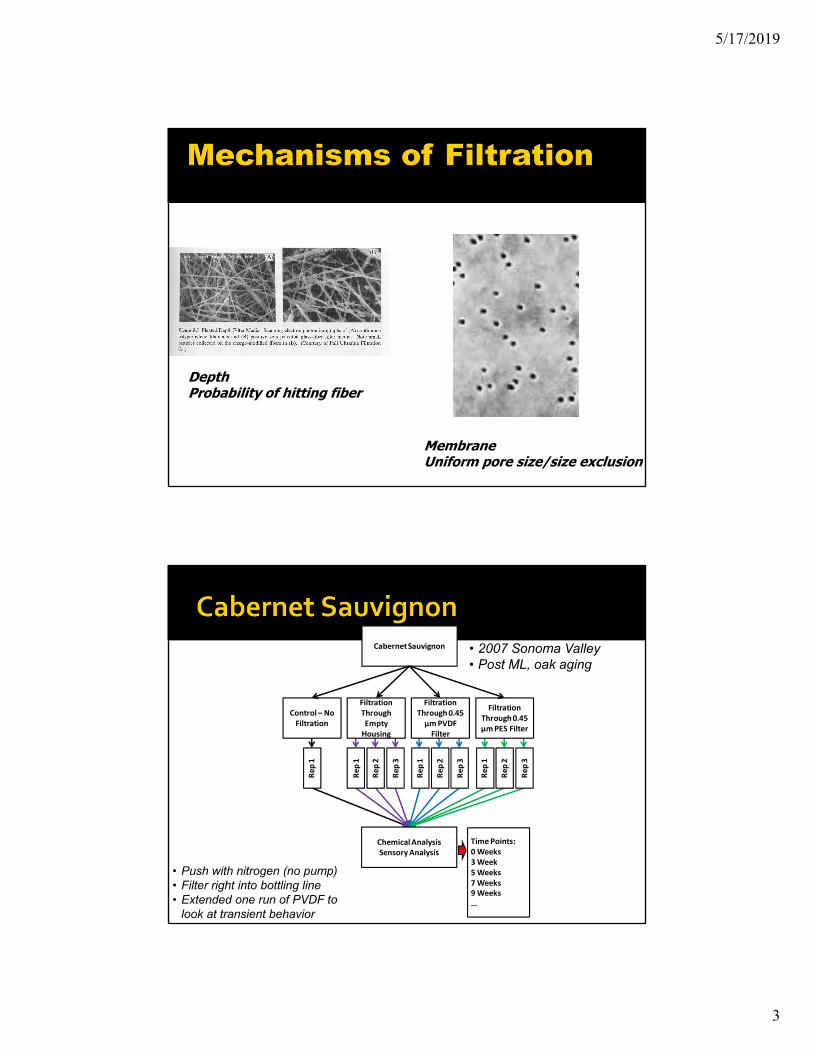
DepthProbability of hitting fiber
MembraneUniform pore size/size exclusion
Cabernet Sauvignon
Control – No Filtration
Filtration Through Empty Housing
Filtration Through 0.45 µm PVDF Filter
Filtration Through 0.45 µm PES Filter
Chemical AnalysisSensory Analysis
Time Points:0 Weeks3 Week5 Weeks7 Weeks9 Weeks…
Rep
1
Rep
1
Rep
2
Rep
3
Rep
1
Rep
2
Rep
3
Rep
1
Rep
2
Rep
3
• Push with nitrogen (no pump)• Filter right into bottling line• Extended one run of PVDF to
look at transient behavior
• 2007 Sonoma Valley• Post ML, oak aging
5/17/2019
4
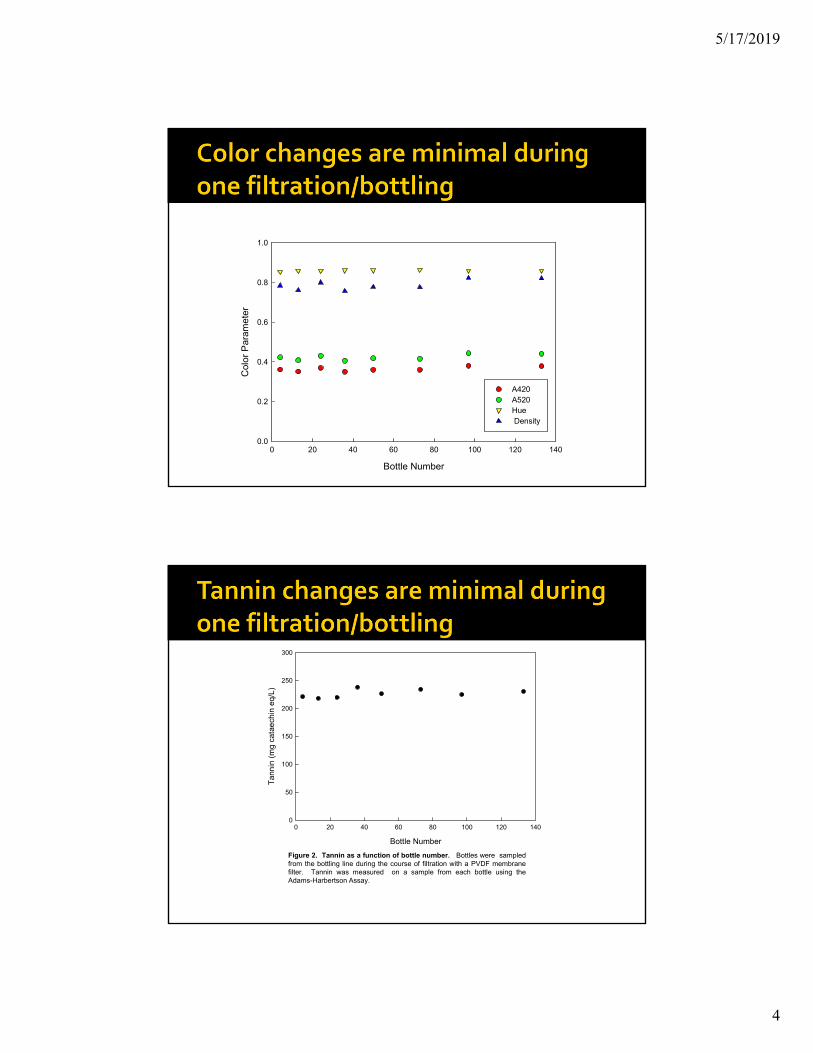
Bottle Number
0 20 40 60 80 100 120 140
Col
or P
aram
eter
0.0
0.2
0.4
0.6
0.8
1.0
A420 A520 Hue Density
Bottle Number
0 20 40 60 80 100 120 140
Ta
nnin
(m
g ca
taec
hin
eq/L
)
0
50
100
150
200
250
300
Figure 2. Tannin as a function of bottle number. Bottles were sampledfrom the bottling line during the course of filtration with a PVDF membranefilter. Tannin was measured on a sample from each bottle using theAdams-Harbertson Assay.
5/17/2019
5
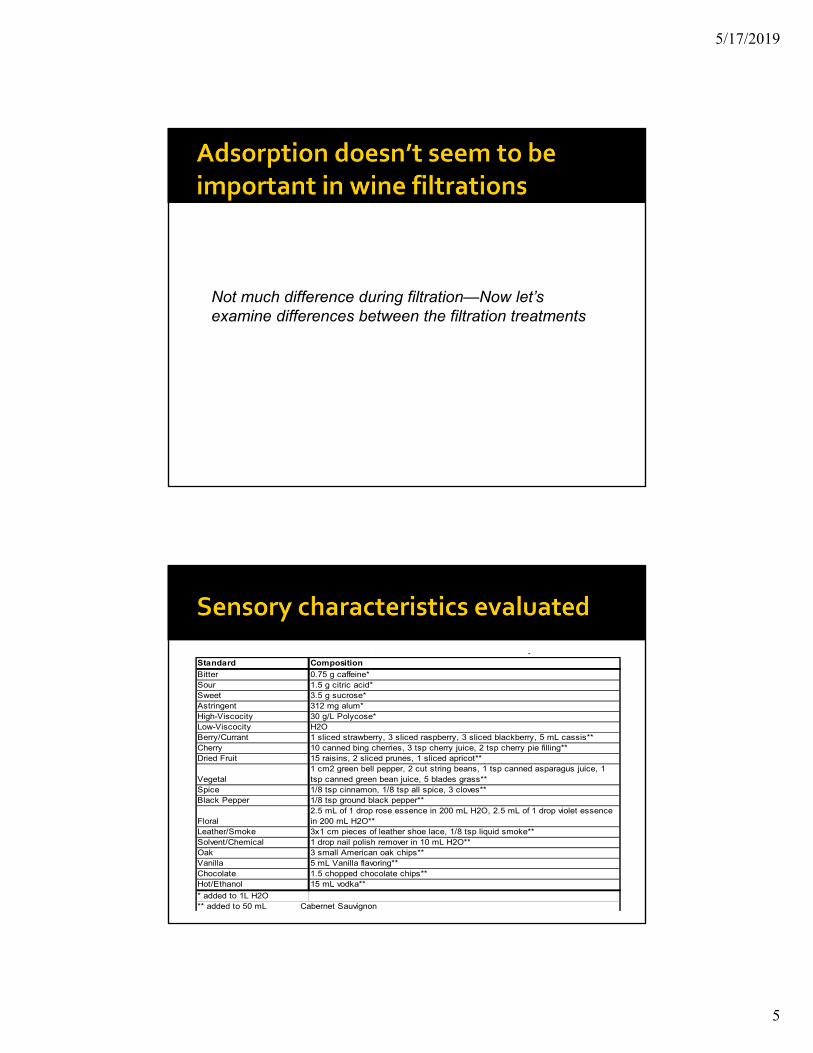
Not much difference during filtration—Now let’s examine differences between the filtration treatments
, , pStandard Composition
Bitter 0.75 g caffeine*Sour 1.5 g citric acid*Sweet 3.5 g sucrose*Astringent 312 mg alum*High-Viscocity 30 g/L Polycose*Low-Viscocity H2OBerry/Currant 1 sliced strawberry, 3 sliced raspberry, 3 sliced blackberry, 5 mL cassis**Cherry 10 canned bing cherries, 3 tsp cherry juice, 2 tsp cherry pie filling**Dried Fruit 15 raisins, 2 sliced prunes, 1 sliced apricot**
Vegetal1 cm2 green bell pepper, 2 cut string beans, 1 tsp canned asparagus juice, 1 tsp canned green bean juice, 5 blades grass**
Spice 1/8 tsp cinnamon, 1/8 tsp all spice, 3 cloves**Black Pepper 1/8 tsp ground black pepper**
Floral2.5 mL of 1 drop rose essence in 200 mL H2O, 2.5 mL of 1 drop violet essence in 200 mL H2O**
Leather/Smoke 3x1 cm pieces of leather shoe lace, 1/8 tsp liquid smoke**Solvent/Chemical 1 drop nail polish remover in 10 mL H2O**Oak 3 small American oak chips**Vanilla 5 mL Vanilla flavoring**Chocolate 1.5 chopped chocolate chips**Hot/Ethanol 15 mL vodka**
* added to 1L H2O** added to 50 mL Franzia Cabernet Sauvignon
5/17/2019
6
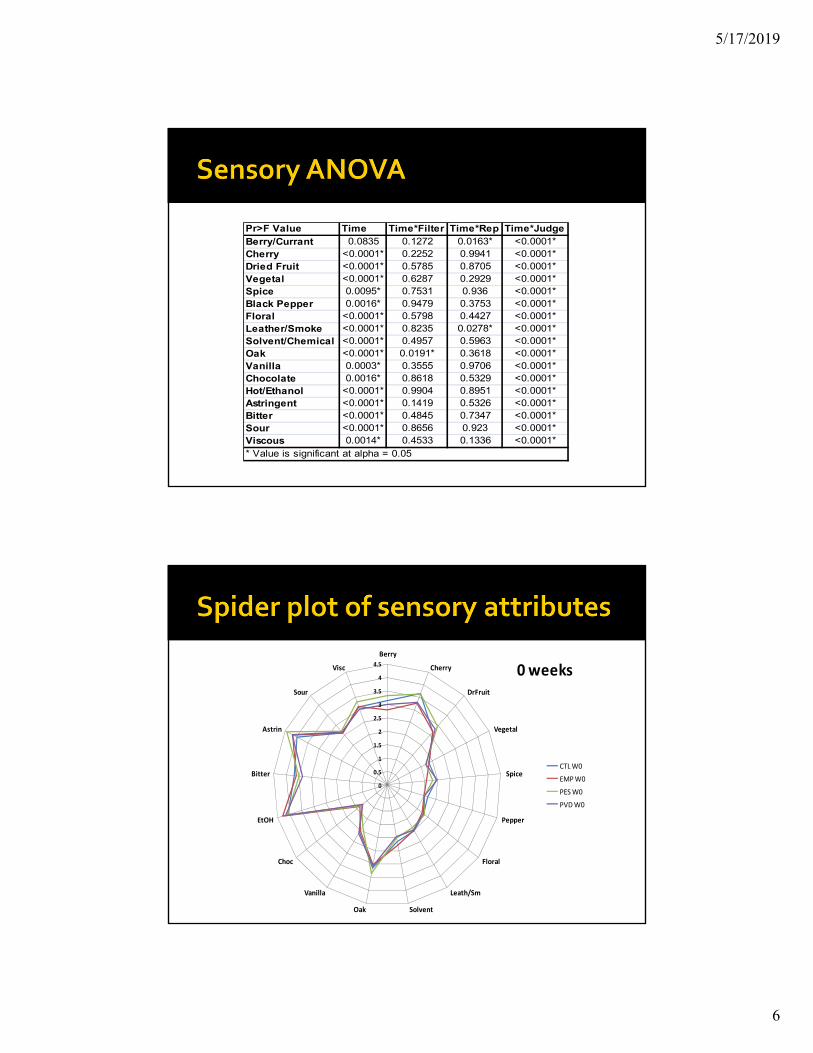
Pr>F Value Time Time*Filter Time*Rep Time*JudgeBerry/Currant 0.0835 0.1272 0.0163* <0.0001*Cherry <0.0001* 0.2252 0.9941 <0.0001*Dried Fruit <0.0001* 0.5785 0.8705 <0.0001*Vegetal <0.0001* 0.6287 0.2929 <0.0001*Spice 0.0095* 0.7531 0.936 <0.0001*Black Pepper 0.0016* 0.9479 0.3753 <0.0001*Floral <0.0001* 0.5798 0.4427 <0.0001*Leather/Smoke <0.0001* 0.8235 0.0278* <0.0001*Solvent/Chemical <0.0001* 0.4957 0.5963 <0.0001*Oak <0.0001* 0.0191* 0.3618 <0.0001*Vanilla 0.0003* 0.3555 0.9706 <0.0001*Chocolate 0.0016* 0.8618 0.5329 <0.0001*Hot/Ethanol <0.0001* 0.9904 0.8951 <0.0001*Astringent <0.0001* 0.1419 0.5326 <0.0001*Bitter <0.0001* 0.4845 0.7347 <0.0001*Sour <0.0001* 0.8656 0.923 <0.0001*Viscous 0.0014* 0.4533 0.1336 <0.0001** Value is significant at alpha = 0.05
0
0.5
1
1.5
2
2.5
3
3.5
4
4.5
Berry
Cherry
DrFruit
Vegetal
Spice
Pepper
Floral
Leath/Sm
SolventOak
Vanilla
Choc
EtOH
Bitter
Astrin
Sour
Visc
CTL W0
EMP W0
PES W0
PVD W0
0 weeks
5/17/2019
7
0
0.5
1
1.5
2
2.5
3
3.5
4
4.5
Berry
Cherry
DrFruit
Vegetal
Spice
Pepper
Floral
Leath/Sm
SolventOak
Vanilla
Choc
EtOH
Bitter
Astrin
Sour
Visc
CTL W0
EMP W0
PES W0
PVD W0
0
0.5
1
1.5
2
2.5
3
3.5
4
Berry
Cherry
DrFruit
Vegetal
Spice
Pepper
Floral
Leath/Sm
SolventOak
Vanilla
Choc
EtOH
Bitter
Astrin
Sour
Visc
CTL W3
EMP W3
PES W3
PVD W3
0
0.5
1
1.5
2
2.5
3
3.5
4
Berry
Cherry
DrFruit
Vegetal
Spice
Pepper
Floral
Leath/Sm
SolventOak
Vanilla
Choc
EtOH
Bitter
Astrin
Sour
Visc
CTL W5
EMP W5
PES W5
PVD W5
0
0.5
1
1.5
2
2.5
3
3.5
4
Berry
Cherry
DrFruit
Vegetal
Spice
Pepper
Floral
Leath/Sm
SolventOak
Vanilla
Choc
EtOH
Bitter
Astrin
Sour
Visc
CTL W7
EMP W7
PES W7
PVD W7
0
0.5
1
1.5
2
2.5
3
3.5
4
Berry
Cherry
DrFruit
Vegetal
Spice
Pepper
Floral
Leath/Sm
SolventOak
Vanilla
Choc
EtOH
Bitter
Astrin
Sour
Visc
CTL W9
EMP W9
PES W9
PVD W9
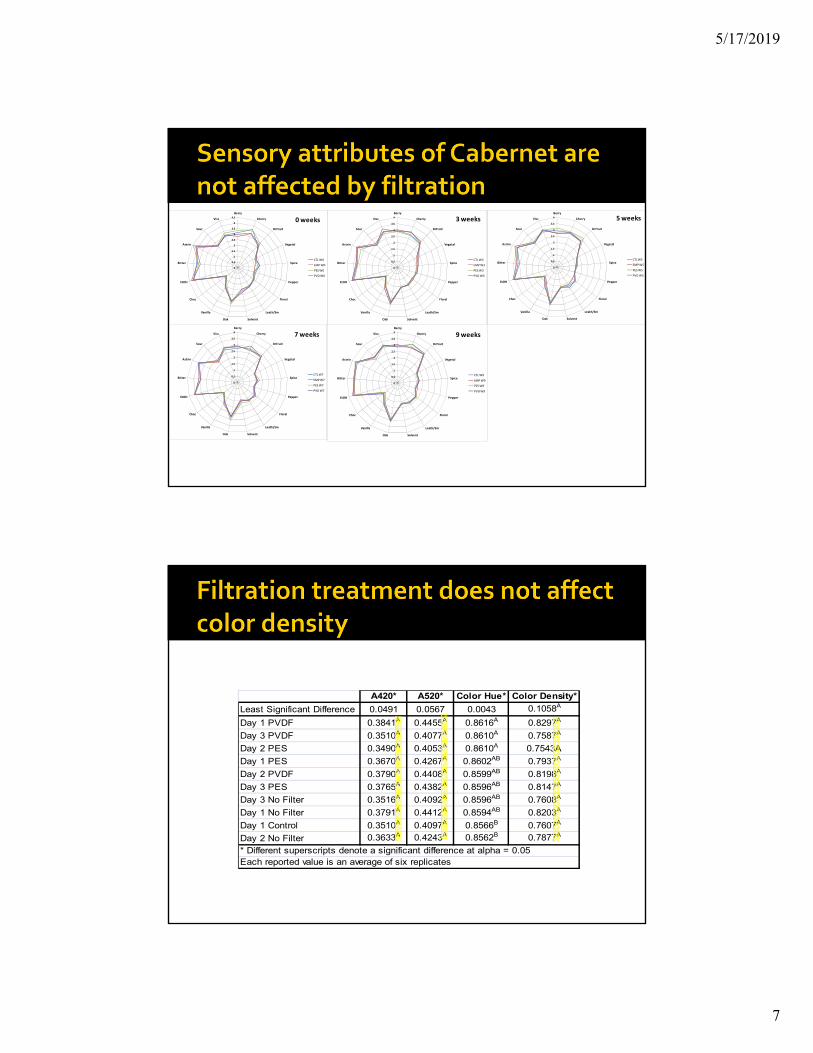
0 weeks 3 weeks 5 weeks
9 weeks7 weeks
A420* A520* Color Hue* Color Density*
Least Significant Difference 0.0491 0.0567 0.0043 0.1058A
Day 1 PVDF 0.3841A 0.4455A 0.8616A 0.8297A
Day 3 PVDF 0.3510A 0.4077A 0.8610A 0.7587A
Day 2 PES 0.3490A 0.4053A 0.8610A 0.7543A
Day 1 PES 0.3670A 0.4267A 0.8602AB 0.7937A
Day 2 PVDF 0.3790A 0.4408A 0.8599AB 0.8198A
Day 3 PES 0.3765A 0.4382A 0.8596AB 0.8147A
Day 3 No Filter 0.3516A 0.4092A 0.8596AB 0.7608A
Day 1 No Filter 0.3791A 0.4412A 0.8594AB 0.8203A
Day 1 Control 0.3510A 0.4097A 0.8566B 0.7607A
Day 2 No Filter 0.3633A 0.4243A 0.8562B 0.7877A
* Different superscripts denote a significant difference at alpha = 0.05Each reported value is an average of six replicates

5/17/2019
8
Tannin*mg catechin eq/L
Least Significant Difference 20.868
Day 1 PES 232.42A
Day 2 PES 231.03A
Day 1 No Filter 230.84A
Day 2 PVDF 230.58A
Day 3 No Filter 230.35A
Day 1 Control 230.16A
Day 1 PVDF 227.20A
Day 3 PES 226.56A
Day 3 PVDF 225.58A
Day 2 No Filter 217.85A
*Different superscripts denote a significant difference at alpha = 0.05Each reported value is an average of six reps
Merlot
Control – No Filtration
Filtration Through Pad
Filter
Filtration Through Pad and 1 µm Depth Filter
Filtration Through Pad, 1 µm Depth, and 0.45 µm PVDF Filter
Time Points:1Weeks2Week4Weeks6Weeks12Weeks16 Weeks…
Rep
1
Rep
1
Rep
2
Rep
3
Rep
1
Rep
2
Rep
3
Rep
1
Rep
2
Rep
3
Filtration Through Pad, 1 µm Depth, and 0.45 µm PES
Filter
Rep
1
Rep
2
Rep
3
Chemical AnalysisSensory Analysis
• 2009 Oakville• Post ML, oak aging
• Push with nitrogen (no pump)• Filter right into bottling line
5/17/2019
9
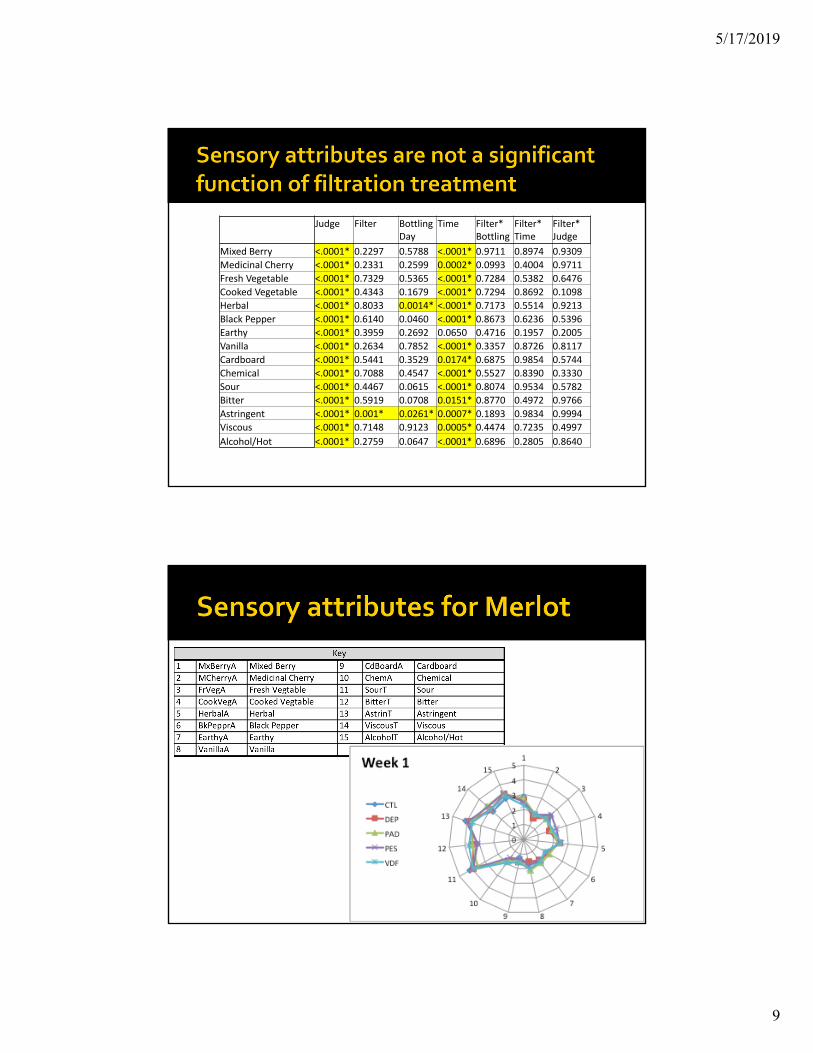
Judge Filter Bottling Day
Time Filter* Bottling
Filter* Time
Filter* Judge
Mixed Berry <.0001* 0.2297 0.5788 <.0001* 0.9711 0.8974 0.9309
Medicinal Cherry <.0001* 0.2331 0.2599 0.0002* 0.0993 0.4004 0.9711
Fresh Vegetable <.0001* 0.7329 0.5365 <.0001* 0.7284 0.5382 0.6476
Cooked Vegetable <.0001* 0.4343 0.1679 <.0001* 0.7294 0.8692 0.1098
Herbal <.0001* 0.8033 0.0014* <.0001* 0.7173 0.5514 0.9213
Black Pepper <.0001* 0.6140 0.0460 <.0001* 0.8673 0.6236 0.5396
Earthy <.0001* 0.3959 0.2692 0.0650 0.4716 0.1957 0.2005
Vanilla <.0001* 0.2634 0.7852 <.0001* 0.3357 0.8726 0.8117
Cardboard <.0001* 0.5441 0.3529 0.0174* 0.6875 0.9854 0.5744
Chemical <.0001* 0.7088 0.4547 <.0001* 0.5527 0.8390 0.3330
Sour <.0001* 0.4467 0.0615 <.0001* 0.8074 0.9534 0.5782
Bitter <.0001* 0.5919 0.0708 0.0151* 0.8770 0.4972 0.9766
Astringent <.0001* 0.001* 0.0261* 0.0007* 0.1893 0.9834 0.9994
Viscous <.0001* 0.7148 0.9123 0.0005* 0.4474 0.7235 0.4997
Alcohol/Hot <.0001* 0.2759 0.0647 <.0001* 0.6896 0.2805 0.8640
5/17/2019
10
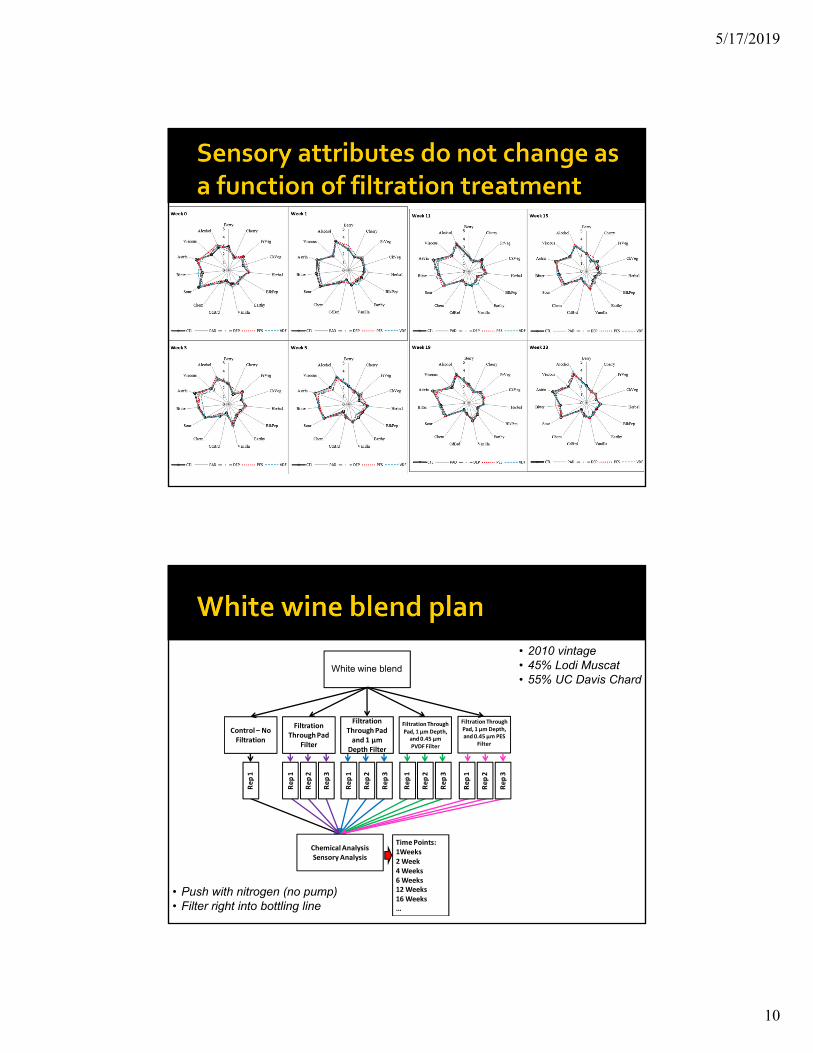
• 2010 vintage• 45% Lodi Muscat• 55% UC Davis Chard
• Push with nitrogen (no pump)• Filter right into bottling line
Merlot
Control – No Filtration
Filtration Through Pad
Filter
Filtration Through Pad and 1 µm Depth Filter
Filtration Through Pad, 1 µm Depth, and 0.45 µm PVDF Filter
Time Points:1Weeks2Week4Weeks6Weeks12Weeks16 Weeks…
Rep
1
Rep
1
Rep
2
Rep
3
Rep
1
Rep
2
Rep
3
Rep
1
Rep
2
Rep
3
Filtration Through Pad, 1 µm Depth, and 0.45 µm PES
Filter
Rep
1
Rep
2
Rep
3
Chemical AnalysisSensory Analysis
White wine blend
5/17/2019
11
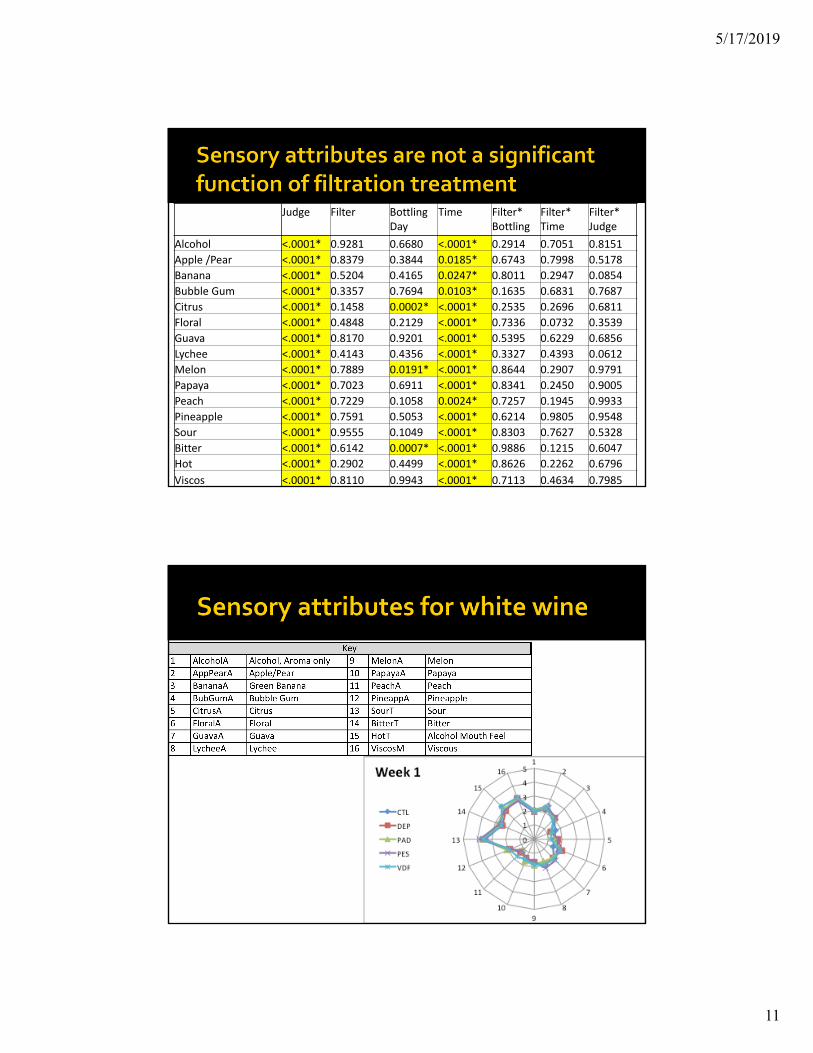
Judge Filter Bottling Day
Time Filter* Bottling
Filter* Time
Filter* Judge
Alcohol <.0001* 0.9281 0.6680 <.0001* 0.2914 0.7051 0.8151
Apple /Pear <.0001* 0.8379 0.3844 0.0185* 0.6743 0.7998 0.5178
Banana <.0001* 0.5204 0.4165 0.0247* 0.8011 0.2947 0.0854
Bubble Gum <.0001* 0.3357 0.7694 0.0103* 0.1635 0.6831 0.7687
Citrus <.0001* 0.1458 0.0002* <.0001* 0.2535 0.2696 0.6811
Floral <.0001* 0.4848 0.2129 <.0001* 0.7336 0.0732 0.3539
Guava <.0001* 0.8170 0.9201 <.0001* 0.5395 0.6229 0.6856
Lychee <.0001* 0.4143 0.4356 <.0001* 0.3327 0.4393 0.0612
Melon <.0001* 0.7889 0.0191* <.0001* 0.8644 0.2907 0.9791
Papaya <.0001* 0.7023 0.6911 <.0001* 0.8341 0.2450 0.9005
Peach <.0001* 0.7229 0.1058 0.0024* 0.7257 0.1945 0.9933
Pineapple <.0001* 0.7591 0.5053 <.0001* 0.6214 0.9805 0.9548
Sour <.0001* 0.9555 0.1049 <.0001* 0.8303 0.7627 0.5328
Bitter <.0001* 0.6142 0.0007* <.0001* 0.9886 0.1215 0.6047
Hot <.0001* 0.2902 0.4499 <.0001* 0.8626 0.2262 0.6796
Viscos <.0001* 0.8110 0.9943 <.0001* 0.7113 0.4634 0.7985
5/17/2019
12
5/17/2019
13
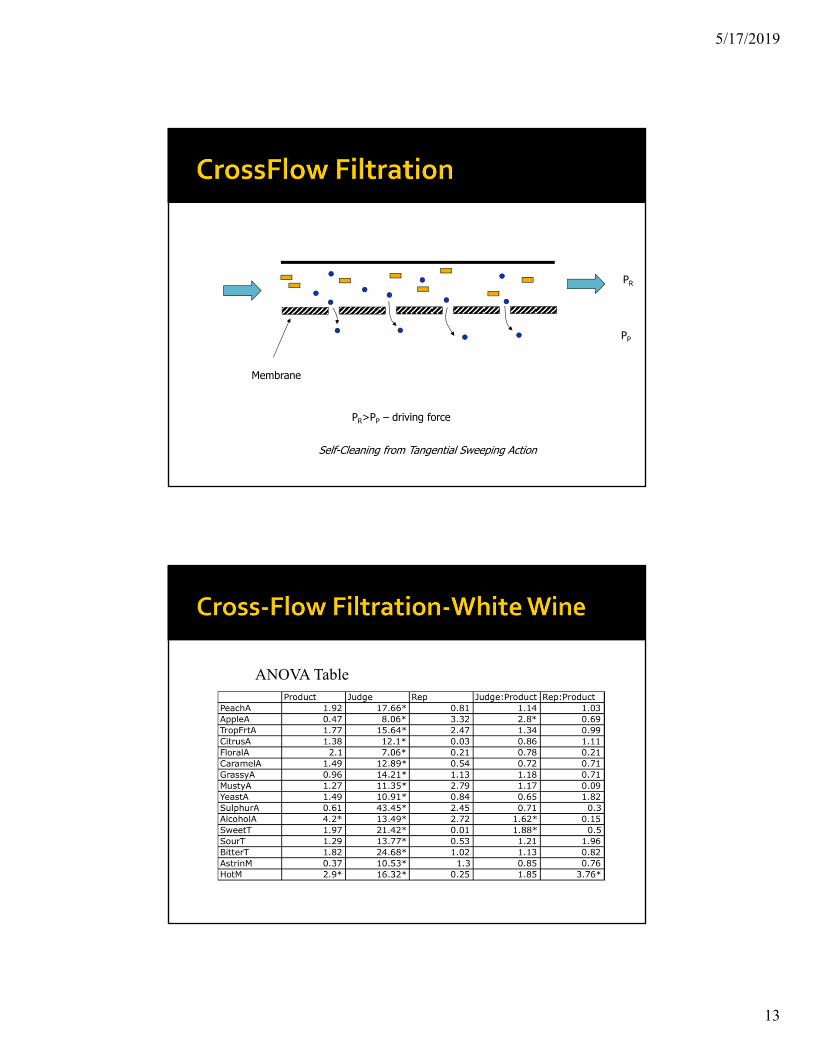
Membrane
PR
PP
Self-Cleaning from Tangential Sweeping Action
PR>PP – driving force
ANOVA Table
5/17/2019
14
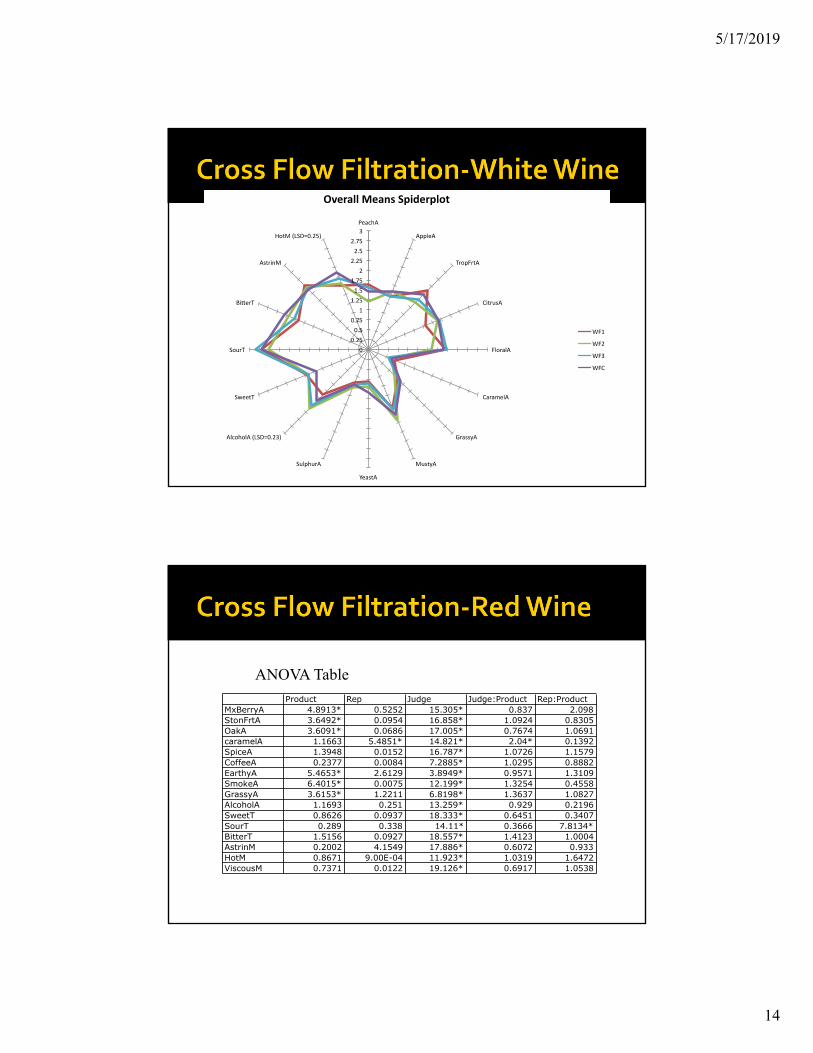
Product Rep Judge Judge:Product Rep:ProductMxBerryA 4.8913* 0.5252 15.305* 0.837 2.098StonFrtA 3.6492* 0.0954 16.858* 1.0924 0.8305OakA 3.6091* 0.0686 17.005* 0.7674 1.0691caramelA 1.1663 5.4851* 14.821* 2.04* 0.1392SpiceA 1.3948 0.0152 16.787* 1.0726 1.1579CoffeeA 0.2377 0.0084 7.2885* 1.0295 0.8882EarthyA 5.4653* 2.6129 3.8949* 0.9571 1.3109SmokeA 6.4015* 0.0075 12.199* 1.3254 0.4558GrassyA 3.6153* 1.2211 6.8198* 1.3637 1.0827AlcoholA 1.1693 0.251 13.259* 0.929 0.2196SweetT 0.8626 0.0937 18.333* 0.6451 0.3407SourT 0.289 0.338 14.11* 0.3666 7.8134*BitterT 1.5156 0.0927 18.557* 1.4123 1.0004AstrinM 0.2002 4.1549 17.886* 0.6072 0.933HotM 0.8671 9.00E-04 11.923* 1.0319 1.6472ViscousM 0.7371 0.0122 19.126* 0.6917 1.0538
Filter Red Sensory
ANOVA Table
5/17/2019
15
0.00#
0.50#
1.00#
1.50#
2.00#
2.50#
3.00#
3.50#
4.00#
MxBerryA#(LSD=0.42)#
StonFrtA#(LSD=0.31)#
OakA#(LSD=0.32)#
caramelA#
SpiceA#
CoffeeA#
EarthyA#(LSD=0.35)#
SmokeA#(LSD=0.24)#
GrassyA#(LSD=0.22)#
AlcoholA#
SweetT#
SourT#
BiKerT#
AstrinM#
HotM#
ViscousM#
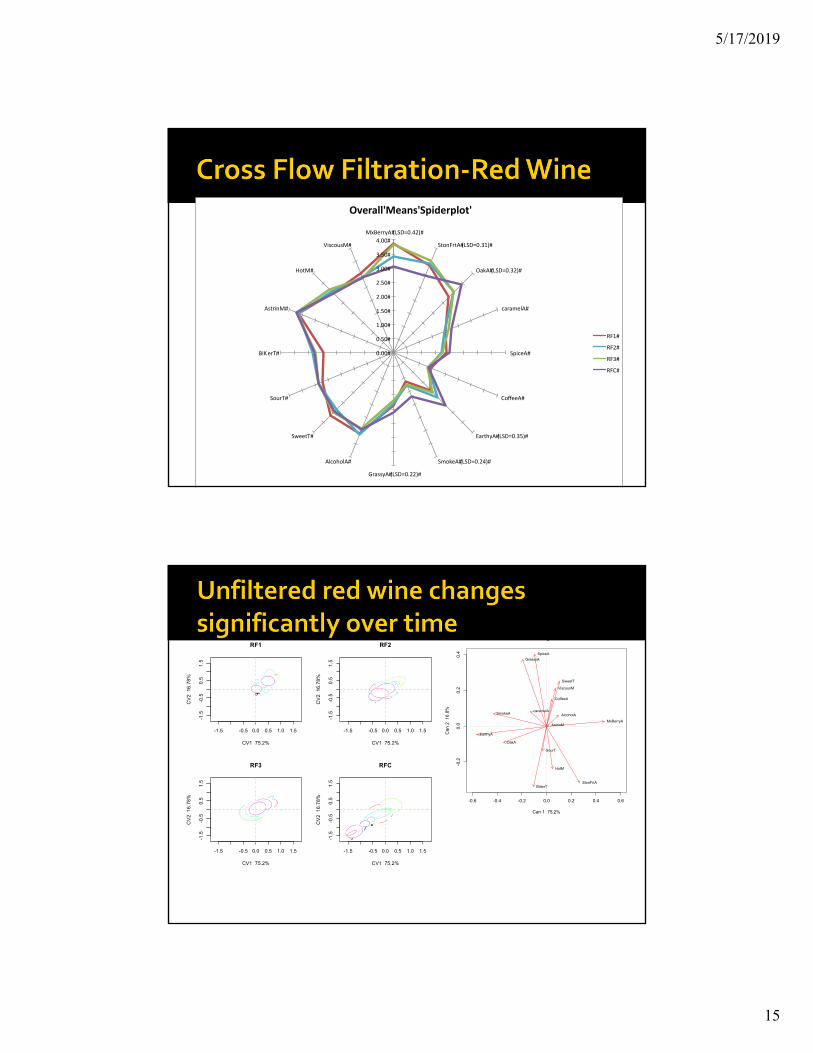
Overall'Means'Spiderplot'
RF1#
RF2#
RF3#
RFC#
Filter Red Sensory
+
++++
+++
+
-1.5 -0.5 0.0 0.5 1.0 1.5
-1.5
-0.5
0.5
1.5
RF1
CV1 75.2%
CV
2 1
6.7
8%
1
2345
678
9 ++++
++
+
++
-1.5 -0.5 0.0 0.5 1.0 1.5
-1.5
-0.5
0.5
1.5
RF2
CV1 75.2%
CV
2 1
6.7
8%
1234
56
78
9
++ +
++
++
++
-1.5 -0.5 0.0 0.5 1.0 1.5
-1.5
-0.5
0.5
1.5
RF3
CV1 75.2%
CV
2 1
6.7
8%
123
45
67
89 +
+
++
++
+
++
-1.5 -0.5 0.0 0.5 1.0 1.5
-1.5
-0.5
0.5
1.5
RFC
CV1 75.2%
CV
2 1
6.7
8%
12
34
56
789
CVA Over Time
-0.6 -0.4 -0.2 0.0 0.2 0.4 0.6
-0.2
0.0
0.2
0.4
Loadings Plot
Can 1 75.2%
Can
2 1
6.8
%
MxBerryA
StonFrtA
OakA
caramelA
SpiceA
CoffeeA
EarthyA
SmokeA
GrassyA
AlcoholA
SweetT
SourT
BitterT
AstrinM
HotM
ViscousM
Filter Red Sensory

5/17/2019
16
+
++
+
-1.5 -0.5 0.5 1.5
-1.5
-0.5
0.5
1.5
Week 0
CV 1 75.2%
CV
2 1
6.7
8%
RF1
RF2
RF3RFC
++
++
-1.5 -0.5 0.5 1.5
-1.5
-0.5
0.5
1.5
Week 1
CV 1 75.2%
CV
2 1
6.7
8%
RF1
RF2RF3
RFC++
+
+
-1.5 -0.5 0.5 1.5
-1.5
-0.5
0.5
1.5
Week 2
CV 1 75.2%
CV
2 1
6.7
8%
RF1RF2RF3
RFC
++++
-1.5 -0.5 0.5 1.5
-1.5
-0.5
0.5
1.5
Week 3
CV 1 75.2%
CV
2 1
6.7
8%
RF1RF2RF3RFC
+++
+
-1.5 -0.5 0.5 1.5-1
.5-0
.50
.51.
5
Week 4
CV 1 75.2%
CV
2 1
6.7
8%
RF1RF2RF3
RFC+++
+
-1.5 -0.5 0.5 1.5
-1.5
-0.5
0.5
1.5
Month 2
CV 1 75.2%
CV
2 1
6.7
8%
RF1
RF2RF3
RFC
+
+++
-1.5 -0.5 0.5 1.5
-1.5
-0.5
0.5
1.5
Month 4
CV 1 75.2%
CV
2 1
6.7
8%
RF1
RF2
RF3RFC
++ ++
-1.5 -0.5 0.5 1.5
-1.5
-0.5
0.5
1.5
Month 6
CV 1 75.2%
CV
2 1
6.7
8%
RF1RF2RF3RFC
++++
-1.5 -0.5 0.5 1.5-1
.5-0
.50
.51
.5
Month 8
CV 1 75.2%
CV
2 1
6.7
8%
RF1RF2RF3RFC
CVA Over Time
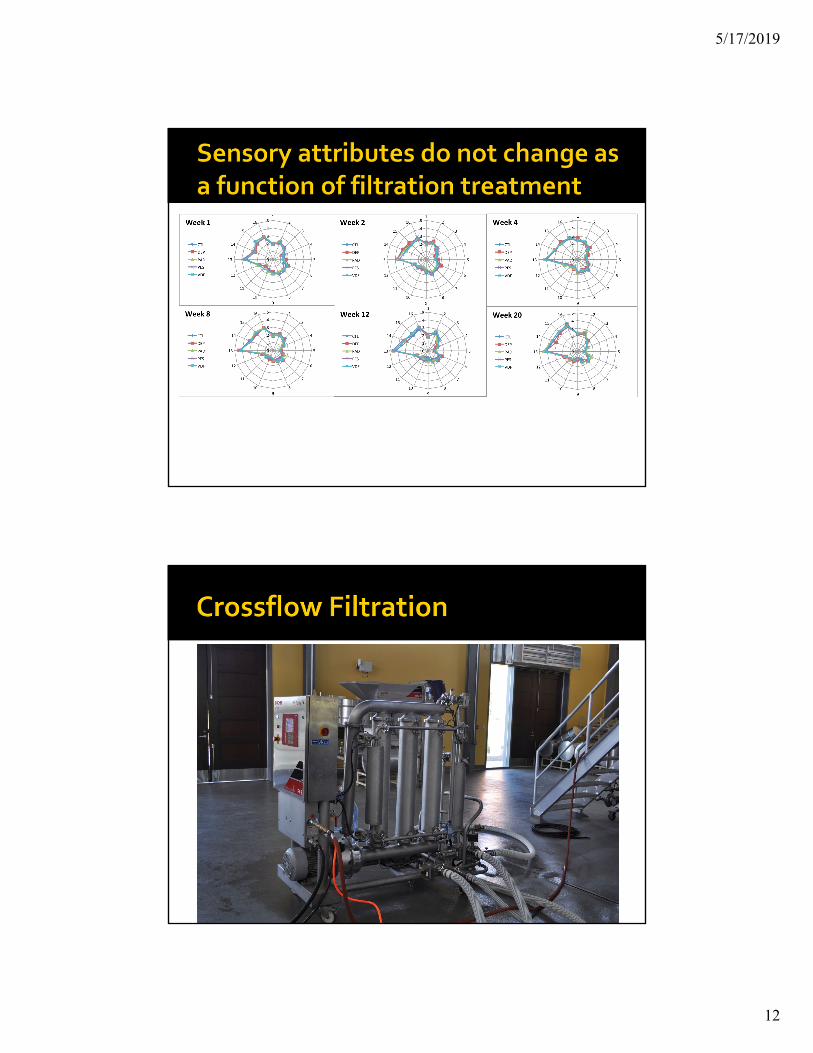
Red and white wines from cross‐flow experiment
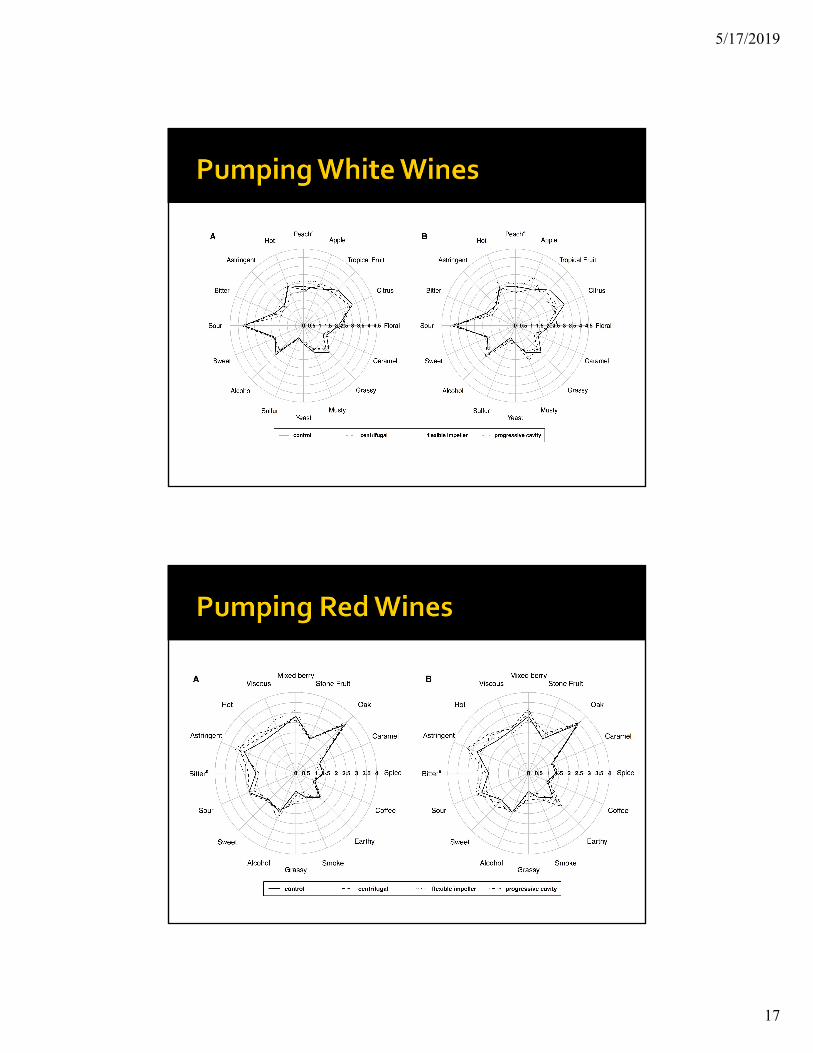
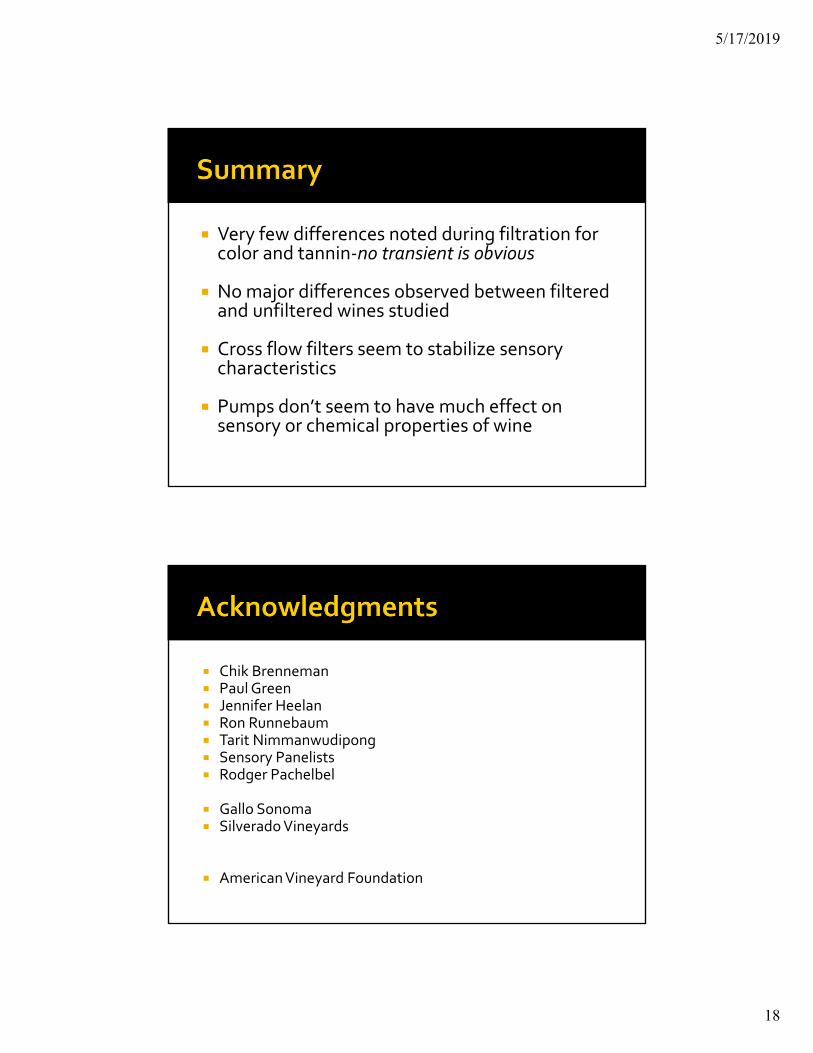
Three pumps Centrifugal
Flexible Impeller
Progressive Cavity Two times (4.5 min and 44 min) Corresponds to 2.5 and 24 times through the pump
Two replicates of each
5/17/2019
17
5/17/2019
18
Very few differences noted during filtration for color and tannin‐no transient is obvious
No major differences observed between filtered and unfiltered wines studied
Cross flow filters seem to stabilize sensory characteristics
Pumps don’t seem to have much effect on sensory or chemical properties of wine
Chik Brenneman Paul Green Jennifer Heelan Ron Runnebaum Tarit Nimmanwudipong Sensory Panelists Rodger Pachelbel
Gallo Sonoma Silverado Vineyards
American Vineyard Foundation
Related Documents