MISSOURI’S 2019 HIGHWAY SAFETY PLAN (HSP)

Welcome message from author
This document is posted to help you gain knowledge. Please leave a comment to let me know what you think about it! Share it to your friends and learn new things together.
Transcript
MISSOURI’S
2019 HIGHWAY SAFETY PLAN
(HSP)

2
TABLE OF CONTENTS
USECTION PAGE #
INTRODUCTION & BACKGROUND .................................................................................1
CORE OUTCOME & BEHAVIOR MEASURES ....................................................................2
BLUEPRINT STRATEGIES FOCUSED FIVE .............................................................................................................. 4 SIX EMPHASIS AREAS .................................................................................................... 5 TARGETS BY REGION ..................................................................................................... 6 BLUEPRINT IMPLEMENTATION ..................................................................................7
PARTNERSHIPS ............................................................................................................8
OVERALL PROBLEM IDENTIFICATION PROBLEM IDENTIFICATION ............................................................................................. 9 URBAN VERSUS RURAL CRASH EXPERIENCE ....................................................................... 11 FATALITY & SERIOUS INJURY STATE MAP .......................................................................... 12 URBAN/URBANIZED STATE MAP ..................................................................................... 13
DATA COLLECTION AND SOURCES FARS ......................................................................................................................... 14 STARS ....................................................................................................................... 14 VMT .......................................................................................................................... 14 ENGINEERING DATA ...................................................................................................... 14 OBSERVATIONAL OCCUPANT PROTECTION SURVEYS ........................................................... 15 COURT DATA ............................................................................................................... 15 DEPARTMENT OF REVENUE ............................................................................................ 15 BIENNIAL SURVEY OF STATE AUTOMATED TRAFFIC ENFORCEMENT SYSTEMS .......................... 15
SAFETY PLAN INTEGRATION .........................................................................................15
CORE OUTCOME MEASURES TRAFFIC FATALITIES ....................................................................................................... 16 SERIOUS TRAFFIC INJURIES ............................................................................................. 17 FATALITIES/VMT ......................................................................................................... 18 FATALITIES/VMT RURAL & URBAN ................................................................................. 19 UNRESTRAINED PASSENGER VEHICLE FATALITIES................................................................ 21 ALCOHOL-IMPAIRED DRIVING FATALITIES ......................................................................... 22 SPEEDING RELATED FATALITIES ....................................................................................... 23 MOTORCYCLE FATALITIES ............................................................................................... 24 UNHELMETED MOTORCYCLIST FATALITIES ........................................................................ 25 DRIVERS AGE 20 OR YOUNGER INVOLVED IN FATAL CRASHES .............................................. 26 PEDESTRIAN FATALITIES ................................................................................................. 27 BICYCLIST FATALITIES .................................................................................................... 28 OBSERVED BELT USAGE ................................................................................................. 29
PROJECT SELECTION .....................................................................................................30
BEST PRACTICES COUNTERMEASURES ..........................................................................30

3
PLANNING PROGRAMMING & IMPLEMENTATION ........................................................30
PLANNING, PROGRAMMING AND IMPLEMENTATION .......................................................... 30 GRANT APPLICATION PROCESS ........................................................................................ 31 INTERNAL GRANTS MANAGEMENT SYSTEM....................................................................... 31 GRANT SELECTION PROCESS ........................................................................................... 31 RISK ASSESSMENT......................................................................................................... 32 INFORMATION & DATA SOURCES CONSULTED ................................................................... 33 SUB-RECIPIENT COMPLIANCE REQUIREMENTS ................................................................... 34 LOCAL ORDINANCES AND POLICIES ............................................................................36
TRAFFIC SAFETY ENFORCEMENT PROGRAM ..................................................................38 PROBLEM IDENTIFICATION PROCESS ................................................................................ 39 IMPLEMENTATION PLAN ................................................................................................ 39 MOBILIZATIONS ............................................................................................................ 39 SOBRIETY CHECKPOINTS ................................................................................................ 40 COMMUNICATION COMPONENT ..................................................................................... 41 CONTINUOUS FOLLOW-UP AND ADJUSTMENT ................................................................... 41 PERFORMANCE MEASURES ............................................................................................ 41
PERFORMANCE PLAN PROGRAM AREAS .......................................................................42
PLANNING AND ADMINISTRATION ...............................................................................42 COMMUNICATIONS (MEDIA) .......................................................................................... 43 SPEED MANAGEMENT ................................................................................................... 45 IMPAIRED DRIVER (DRUG AND ALCOHOL) ......................................................................... 46 OCCUPANT PROTECTION (ADULT AND CHILD PASSENGER SAFETY) ........................................ 47 DISTRACTED DRIVERS .................................................................................................... 49 YOUNG DRIVERS ........................................................................................................... 50 OLDER DRIVERS............................................................................................................ 52 COMMERCIAL MOTOR VEHICLES ..................................................................................... 54 MOTORCYCLE SAFETY .................................................................................................... 55 SCHOOL BUS SAFETY ..................................................................................................... 57 NON-MOTORIZED (PEDESTRIANS AND BICYCLISTS) ............................................................ 58 ROADWAY SAFETY AND TRAFFIC ENGINEERING .................................................................. 60
TRAFFIC RECORDS……………………………………………………………………………………………………. 61
TRAINING/MISCELLANEOUS/MULTI-PROGRAM…………………………………………………………….. 62
FY2019 PROJECT LISTING ..............................................................................................APPENDIX A
FY2019 CORE OUTCOME MEASURES ..............................................……………………………. APPENDIX B
FY2019 EQUIPMENT LIST .............................................................................................APPENDIX C
SUPPORTING DATA
FATALITIES BY CITY ........................................................................................................ APPENDIX D FATALITIES BY COUNTY .................................................................................................. APPENDIX E FATALITIES BY UNINCORPORATED COUNTY ........................................................................ APPENDIX F SERIOUS INJURIES BY CITY .............................................................................................. APPENDIX G SERIOUS INJURIES BY COUNTY ......................................................................................... APPENDIX H SERIOUS INJURIES BY UNINCORPORATED COUNTY ............................................................... APPENDIX I
1
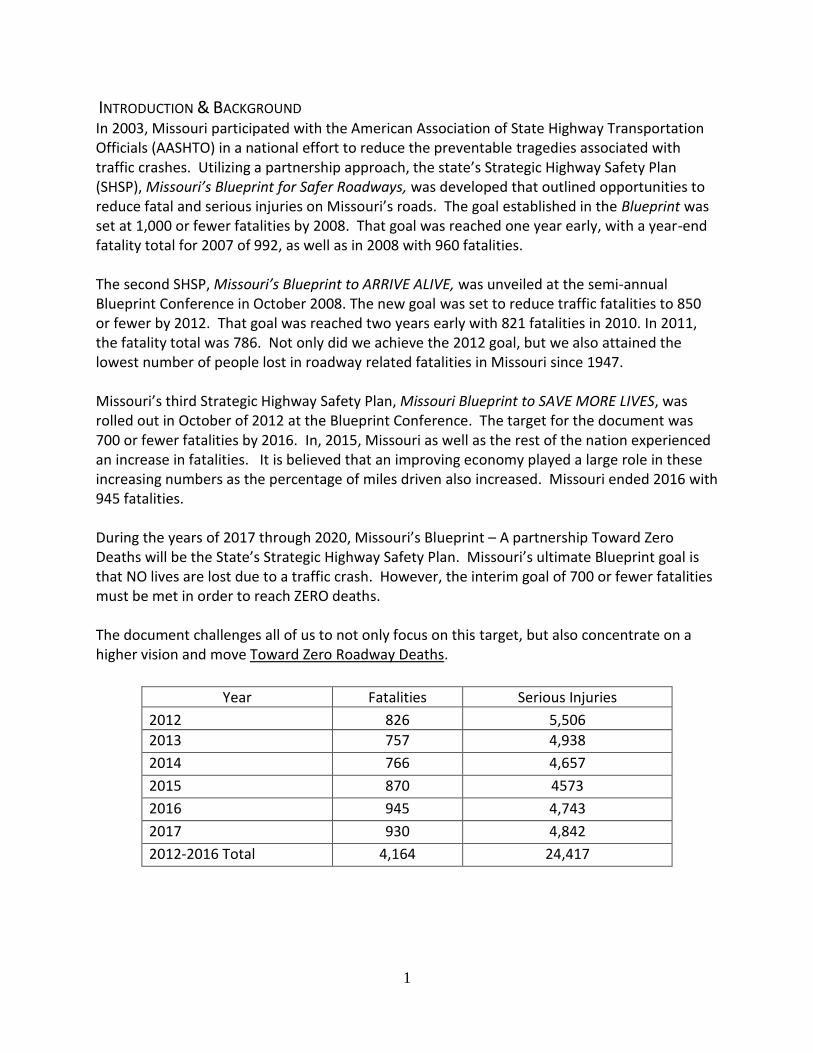
INTRODUCTION & BACKGROUND In 2003, Missouri participated with the American Association of State Highway Transportation Officials (AASHTO) in a national effort to reduce the preventable tragedies associated with traffic crashes. Utilizing a partnership approach, the state’s Strategic Highway Safety Plan (SHSP), Missouri’s Blueprint for Safer Roadways, was developed that outlined opportunities to reduce fatal and serious injuries on Missouri’s roads. The goal established in the Blueprint was set at 1,000 or fewer fatalities by 2008. That goal was reached one year early, with a year-end fatality total for 2007 of 992, as well as in 2008 with 960 fatalities.
The second SHSP, Missouri’s Blueprint to ARRIVE ALIVE, was unveiled at the semi-annual Blueprint Conference in October 2008. The new goal was set to reduce traffic fatalities to 850 or fewer by 2012. That goal was reached two years early with 821 fatalities in 2010. In 2011, the fatality total was 786. Not only did we achieve the 2012 goal, but we also attained the lowest number of people lost in roadway related fatalities in Missouri since 1947.
Missouri’s third Strategic Highway Safety Plan, Missouri Blueprint to SAVE MORE LIVES, was rolled out in October of 2012 at the Blueprint Conference. The target for the document was 700 or fewer fatalities by 2016. In, 2015, Missouri as well as the rest of the nation experienced an increase in fatalities. It is believed that an improving economy played a large role in these increasing numbers as the percentage of miles driven also increased. Missouri ended 2016 with 945 fatalities.
During the years of 2017 through 2020, Missouri’s Blueprint – A partnership Toward Zero Deaths will be the State’s Strategic Highway Safety Plan. Missouri’s ultimate Blueprint goal is that NO lives are lost due to a traffic crash. However, the interim goal of 700 or fewer fatalities must be met in order to reach ZERO deaths.
The document challenges all of us to not only focus on this target, but also concentrate on a higher vision and move UToward Zero Roadway Deaths U.
Year Fatalities Serious Injuries
2012 826 5,506
2013 757 4,938
2014 766 4,657
2015 870 4573
2016 945 4,743
2017 930 4,842
2012-2016 Total 4,164 24,417
2
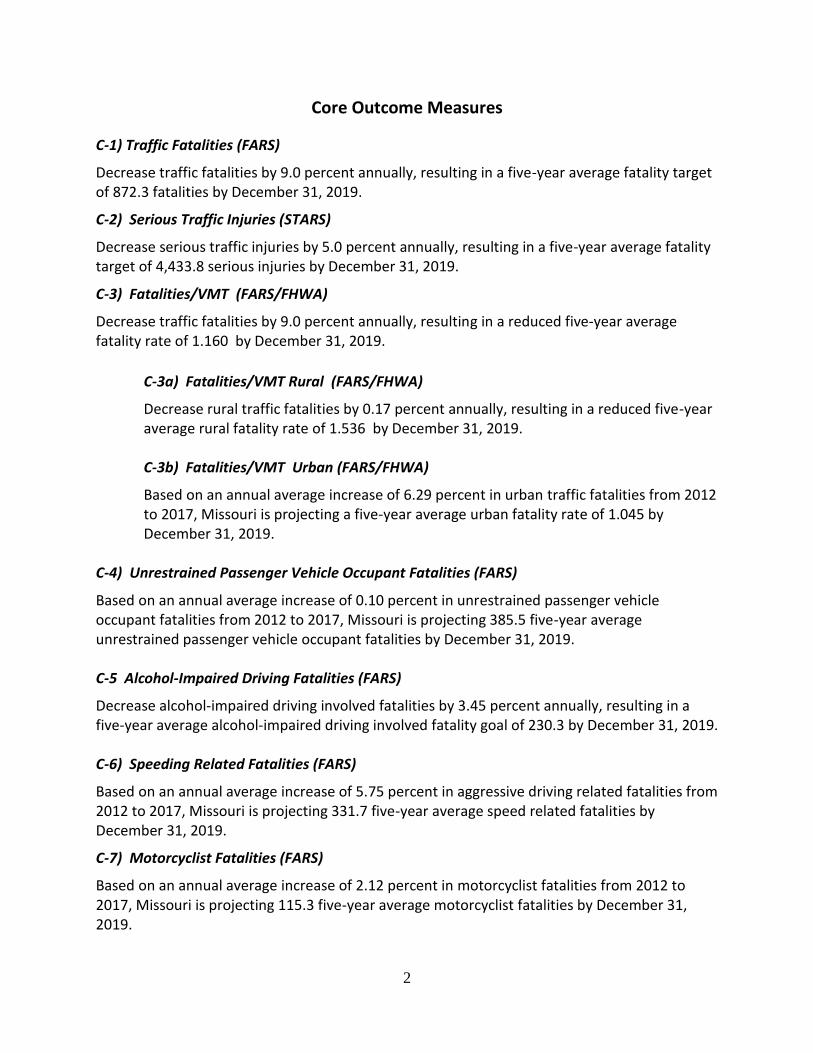
Core Outcome Measures
C-1) Traffic Fatalities (FARS)
Decrease traffic fatalities by 9.0 percent annually, resulting in a five-year average fatality target of 872.3 fatalities by December 31, 2019.
C-2) Serious Traffic Injuries (STARS)
Decrease serious traffic injuries by 5.0 percent annually, resulting in a five-year average fatality target of 4,433.8 serious injuries by December 31, 2019.
C-3) Fatalities/VMT (FARS/FHWA)
Decrease traffic fatalities by 9.0 percent annually, resulting in a reduced five-year average fatality rate of 1.160 by December 31, 2019.
C-3a) Fatalities/VMT Rural (FARS/FHWA)
Decrease rural traffic fatalities by 0.17 percent annually, resulting in a reduced five-year average rural fatality rate of 1.536 by December 31, 2019.
C-3b) Fatalities/VMT Urban (FARS/FHWA)
Based on an annual average increase of 6.29 percent in urban traffic fatalities from 2012 to 2017, Missouri is projecting a five-year average urban fatality rate of 1.045 by December 31, 2019.
C-4) Unrestrained Passenger Vehicle Occupant Fatalities (FARS)
Based on an annual average increase of 0.10 percent in unrestrained passenger vehicle occupant fatalities from 2012 to 2017, Missouri is projecting 385.5 five-year average unrestrained passenger vehicle occupant fatalities by December 31, 2019.
C-5 Alcohol-Impaired Driving Fatalities (FARS)
Decrease alcohol-impaired driving involved fatalities by 3.45 percent annually, resulting in a five-year average alcohol-impaired driving involved fatality goal of 230.3 by December 31, 2019.
C-6) Speeding Related Fatalities (FARS)
Based on an annual average increase of 5.75 percent in aggressive driving related fatalities from 2012 to 2017, Missouri is projecting 331.7 five-year average speed related fatalities by December 31, 2019.
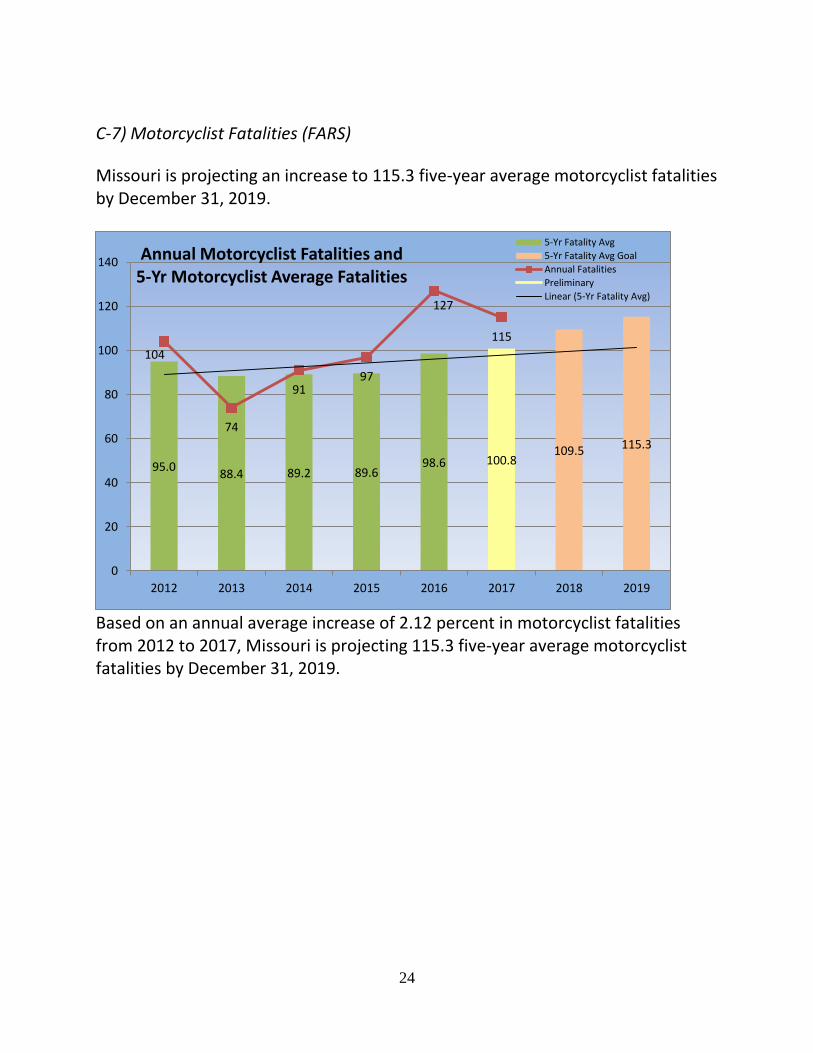
C-7) Motorcyclist Fatalities (FARS)
Based on an annual average increase of 2.12 percent in motorcyclist fatalities from 2012 to 2017, Missouri is projecting 115.3 five-year average motorcyclist fatalities by December 31, 2019.
3
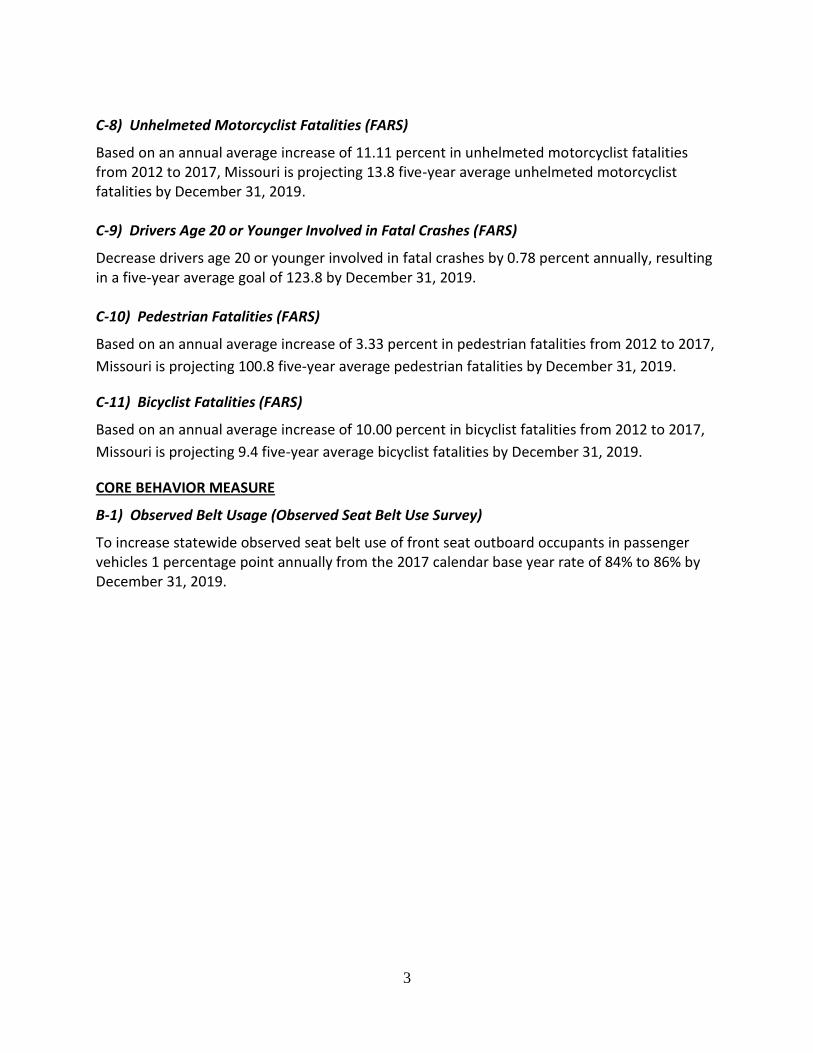
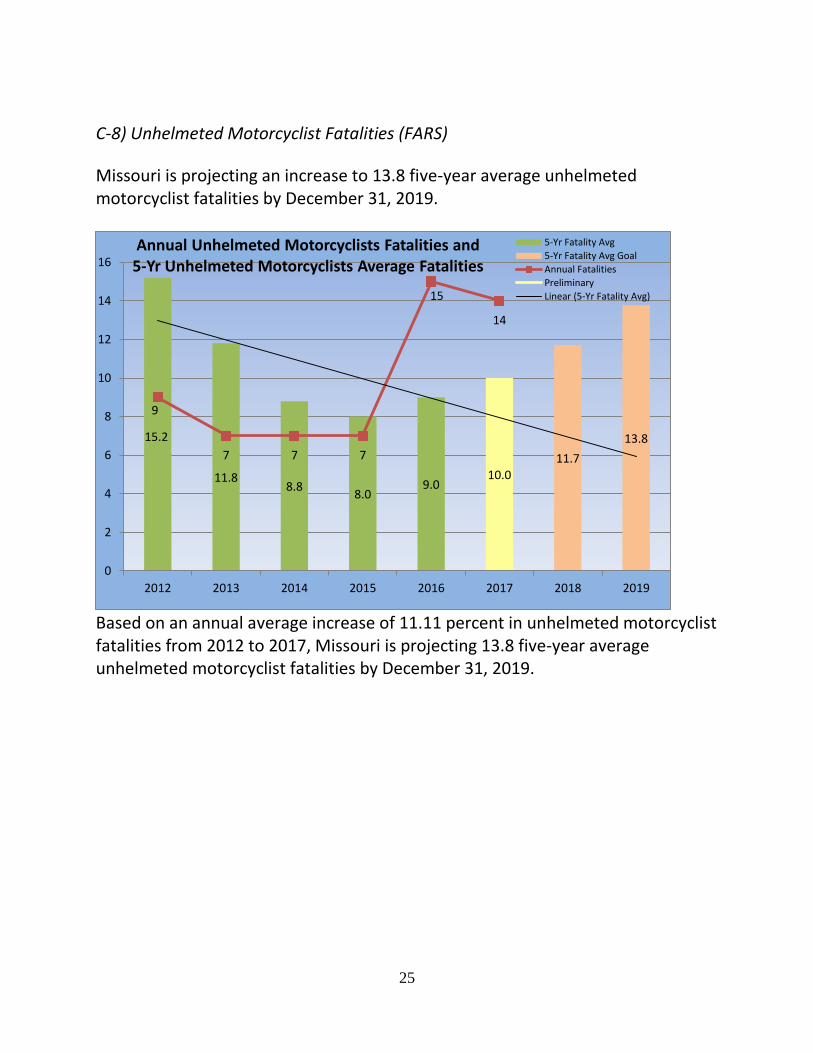
C-8) Unhelmeted Motorcyclist Fatalities (FARS)
Based on an annual average increase of 11.11 percent in unhelmeted motorcyclist fatalities from 2012 to 2017, Missouri is projecting 13.8 five-year average unhelmeted motorcyclist fatalities by December 31, 2019. C-9) Drivers Age 20 or Younger Involved in Fatal Crashes (FARS)
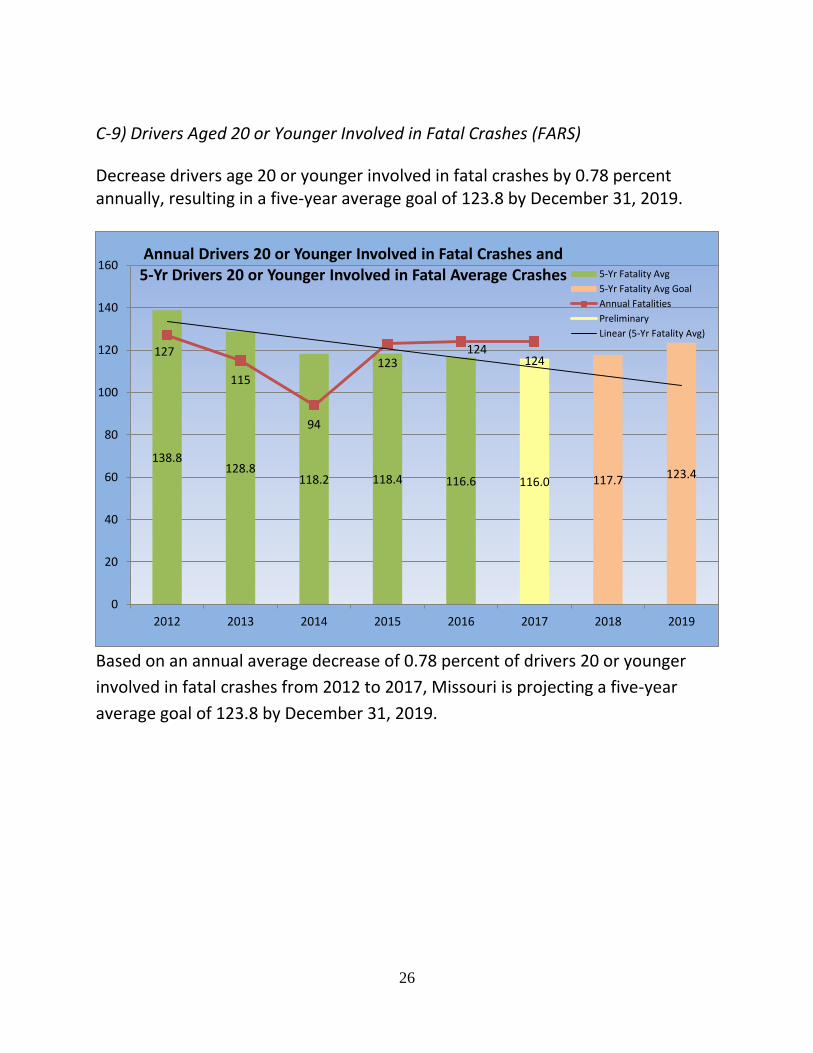
Decrease drivers age 20 or younger involved in fatal crashes by 0.78 percent annually, resulting in a five-year average goal of 123.8 by December 31, 2019. C-10) Pedestrian Fatalities (FARS)
Based on an annual average increase of 3.33 percent in pedestrian fatalities from 2012 to 2017,
Missouri is projecting 100.8 five-year average pedestrian fatalities by December 31, 2019.
C-11) Bicyclist Fatalities (FARS)
Based on an annual average increase of 10.00 percent in bicyclist fatalities from 2012 to 2017,
Missouri is projecting 9.4 five-year average bicyclist fatalities by December 31, 2019.
UCORE BEHAVIOR MEASURE
B-1) Observed Belt Usage (Observed Seat Belt Use Survey)
To increase statewide observed seat belt use of front seat outboard occupants in passenger vehicles 1 percentage point annually from the 2017 calendar base year rate of 84% to 86% by December 31, 2019.

4
Blueprint Strategies
UThe Focused FIVE
Historically, the Blueprint has identified a few strategies having the greatest potential to
save lives and reduce serious injuries. These strategies were called the Essential
Eight in 2004, Targeted Ten in 2008 the, Necessary Nine in 2012 and now the Focused Five.
Aggressive implementation of the Focused Five represents the greatest opportunity to
save lives.
Change the Traffic Safety Culture
Increase safety belt/safety restraint use - Everyone, Every Trip, Every Time, Day and
Night
Educate roadway users on their roles and responsibilities
Expand outreach efforts to new traffic safety partners
Educate on the dangers of aggressive, distracted and substance-impaired driving
Create safe and efficient clearance of roadway impacts
Highway Safety Legislation
Pass a primary safety belt law
Pass a cell phone ban law for all drivers
Maintain and enhance existing traffic safety laws
Increase transportation funding
Increase Enforcement Efforts
Focus on high-crash corridors and work zones
Expand efforts to stop aggressive driving
Increase sobriety checkpoints/saturation patrols
Expand multi-jurisdictional task forces
Implement Engineering Solutions
Install shoulders with rumble stripes
Improve curve safety
Increase use of innovative intersection designs
Enhance roadway visibility
Enhance Pedestrian Safety
Install/improve signage, pavement markings and signals
Educate pedestrians on safe habits (pedestrian to roadway interactions, distractions and
substance impairment)

5
Six Emphasis Areas This Blueprint is comprised of six emphasis areas and 27 focus areas. Strategies have been identified that provide the opportunity to reduce fatalities and serious injuries resulting from roadway crashes. Emphasis & focus areas include: 1. Serious Crash Types
Lane Departure
Run-Off-Road - Not in a Curve
Run-Off-Road - In a Curve
Collision with Trees and/or Utility Poles
Head-On
Intersections
Non-Signalized
Signalized
2. High-Risk Driving & Unrestrained Aggressive Driving Unrestrained Drivers and Occupants
Substance-Impaired Driving
Unlicensed/Improperly Licensed Driving
Young Driver (15 - 20 years of age)
Distracted/Inattentive Driving
Drowsy Driving
3. Special Vehicles Commercial Motor Vehicles (CMV’s)
All-Terrain Vehicles (ATV’s)/Utility Vehicles School Buses
4. Vulnerable Roadway Users Older Driver (Age 65 or Older)
Motorcyclists
Pedestrians
Bicyclists
5. Special Roadway Environments Nighttime Driving
Work Zone
Highway / Rail Crossing
Traffic Incident Management Area
6
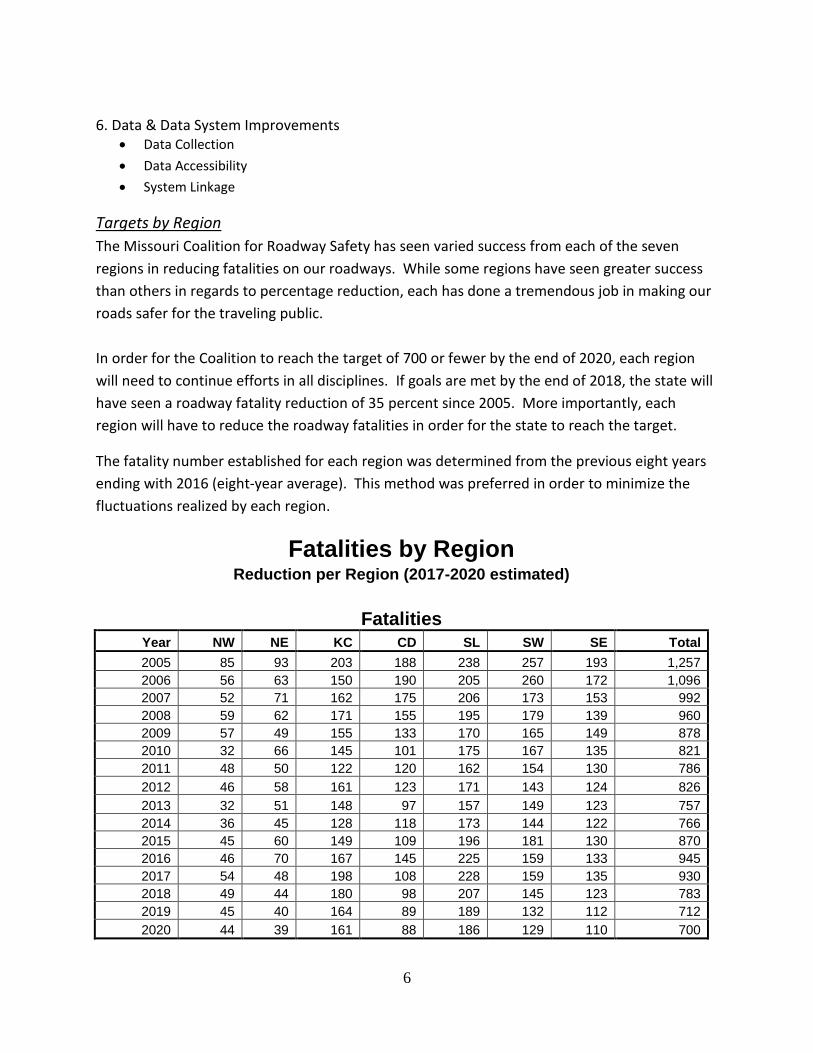
6. Data & Data System Improvements
Data Collection
Data Accessibility
System Linkage
Targets by Region
The Missouri Coalition for Roadway Safety has seen varied success from each of the seven
regions in reducing fatalities on our roadways. While some regions have seen greater success
than others in regards to percentage reduction, each has done a tremendous job in making our
roads safer for the traveling public.
In order for the Coalition to reach the target of 700 or fewer by the end of 2020, each region
will need to continue efforts in all disciplines. If goals are met by the end of 2018, the state will
have seen a roadway fatality reduction of 35 percent since 2005. More importantly, each
region will have to reduce the roadway fatalities in order for the state to reach the target.
The fatality number established for each region was determined from the previous eight years
ending with 2016 (eight-year average). This method was preferred in order to minimize the
fluctuations realized by each region.
Fatalities by Region Reduction per Region (2017-2020 estimated)
Fatalities Year NW NE KC CD SL SW SE Total
2005 85 93 203 188 238 257 193 1,257
2006 56 63 150 190 205 260 172 1,096
2007 52 71 162 175 206 173 153 992
2008 59 62 171 155 195 179 139 960
2009 57 49 155 133 170 165 149 878
2010 32 66 145 101 175 167 135 821
2011 48 50 122 120 162 154 130 786
2012 46 58 161 123 171 143 124 826
2013 32 51 148 97 157 149 123 757
2014 36 45 128 118 173 144 122 766
2015 45 60 149 109 196 181 130 870
2016 46 70 167 145 225 159 133 945
2017 54 48 198 108 228 159 135 930
2018 49 44 180 98 207 145 123 783
2019 45 40 164 89 189 132 112 712
2020 44 39 161 88 186 129 110 700
7
Blueprint Implementation The Blueprint is a collective effort of the Missouri Coalition for Roadway Safety (MCRS) and safety professionals throughout the state. The MCRS leads the charge to implement the Blueprint and encourage safety partners to focus their activities and programs in support of the “Focused Five” and subsequent emphasis areas, focus areas, and strategies. The state is divided into seven regional coalitions that develop annual safety plans. The coalition’s meet on a regular basis to discuss their concerns, review how their countermeasures are working, and consider ways to improve their efforts. Approximately $2 million of state road funds is dedicated to this effort. The Blueprint is an overarching strategic highway safety plan for the State of Missouri while the state’s Highway Safety Plan serves as one of the implementation components in support of the Blueprint efforts.
The Blueprint serves as a strategic plan for the State’s Highway Safety Plan
The “Focused Five”, 6 Emphasis Areas and 27 Focus Areas provide direction
for the HSP
The Blueprint determines our interim fatality reduction target
8
Partnerships No highway safety office can successfully function without communication, cooperation and coordination with our safety partners. This partnership approach allows us to expand our resources, generate diverse ideas, and incorporate new concepts and projects into our Highway Safety Plan. A sampling of the myriad of our safety partners includes:
In addition to these highway safety partners, each Blueprint regional coalition has an extensive base of local partners.
American Automobile Association MO Department of Revenue
American Association of Retired Persons MO Division of Behavioral Health
Blueprint Regional Coalitions MO Division of Alcohol and Tobacco
Cape Girardeau Safe Communities Program MO Head Injury Advisory Council
City/County Engineers MO Injury and Violence Prevention Advisory Committee County Health Departments
East-West Gateway Coordinating Council MO Trucking Association
Emergency Nurses Association MO Office of Prosecution Services
Federal Highway Administration MO Police Chiefs Association
Federal Motor Carrier Safety Administration MO Safety Center
Institutions of Higher Education MO Sheriffs Association
Law Enforcement Traffic Safety Advisory Council MO State Highway Patrol
Law Enforcement Training Academies MO Youth/Adult Alliance
Local Technical Assistance Program Mothers Against Drunk Driving
Manufacturers Alliance Child Passenger Safety Motorcycle Safety Task Force
Mercy Hospital National Highway Traffic Safety - Region 7
Metropolitan Planning Organizations Office of State Courts Administrator
Mid-American Regional Council Operation Impact
MO Association of Insurance Agents Operation Lifesaver
MO Automobile Dealers Association Partners in Prevention
MO Coalition for Roadway Safety Regional Planning Commissions
MO Department of Health & Senior Services Safe Kids Coalitions
MO Department of Labor and Industrial Relations State Farm Insurance
MO Department of Mental Health Think First Missouri
MO Department of Public Safety Traffic Safety Alliance of the Ozarks
Trailnet

9
Overall Problem Identification Problem Identification Problem identification involves the study of the relationship between collisions and the characteristics of people using the roadways, types and numbers of vehicles on the roads, miles traveled, and roadway engineering.
Most motor vehicle crashes have multiple causes. Experts and studies have identified three categories of factors that contribute to crashes – human, roadway environment, and vehicle factors. Human factors involve the driver's actions (speeding and violating traffic laws, etc.) or condition (effects of alcohol or drugs, inattention, decision errors, age, etc.). Roadway environment factors include the design of the roadway, roadside hazards, and roadway conditions. Vehicle factors include any failures in the vehicle or its design. Human factors are generally seen as contributing most often to crashes at 93 percent, followed by roadway environment at 33 percent, and finally the vehicle at 13 percent (US General Accounting Office, GAO-03-436, Research Continues on a Variety of Factors that Contribute to Motor Vehicle Crashes, March 2003).
In March 2016, an attitudinal survey was conducted on 2,502 adult Missouri drivers to capture their current attitudes and awareness of specific items concerning highway safety such as seat belt usage, speeding issues, cell phone use while driving and alcohol impaired driving.
Since this plan is directed toward modifying behavior so that safety will be the accepted norm, it stands to reason that we must identify and categorize those individuals who are making unsafe decisions and/or who are causing traffic crashes. It will be obvious to the reader that this document references targeted audiences or populations. The term “target audience” infers a population group that is overrepresented in a particular type of crash (e.g., drinking drivers) or is underrepresented in using safety devices (e.g., un-helmeted motorcyclists or unrestrained occupants). This terminology is in no way meant to profile certain populations by age, gender, race, or nationality. Rather, this is an accepted term to identify specific population groups that must be reached with our messages and our enforcement efforts if we are to reduce traffic crashes, prevent injuries and save lives.
Research has shown that the number of crashes at a particular site can vary widely from year to year, even if there are no changes in traffic or in the layout of the road. Since a single year's data is subject to considerable statistical variation; three years is generally regarded as a practical minimum period for which a fairly reliable annual average rate can be calculated. The FY 2019 Highway Safety Plan references crash statistics for 2012 through 2016.
In the 5-year period 2012-2016, a total of 4,164 people died on Missouri’s roadways while another 24,417 suffered serious injuries. A fatality is recorded when a victim dies within 30 days of the crash date from injuries sustained in the crash. A serious injury is recorded when any injury other than a fatality which results in one or more of the following:
10
Severe laceration resulting in exposure of underlying tissues/muscle/organs or resultingin significant loss of blood
Broken or distorted extremity (arm or leg)
Crush injuries
Suspected skull, chest or abdominal injury other than bruises or minor lacerations
Significant burns (second and third degree burns over 10% or more of the body)
Unconsciousness when taken from the crash scene
Paralysis
While we recognize that many crashes result simply in property damage, only fatal and serious injury crashes have been targeted because they are more costly in human suffering, social and economic terms.
Although overall fatalities and the death rate reflect a positive reduction since 2005, it should not be a cause for complacency. A substantial number of people continue to be killed and seriously injured on Missouri roadways and most of these traffic crashes are preventable. In 2012-2016, of the 720,913 traffic crashes, 3,819 resulted in fatalities and 19,606 resulted in serious injuries. These fatal and serious injury crashes resulted in 4,164 deaths and 24,417 serious injuries.
A substantial number of persons killed or injured in Missouri's 2012-2016 traffic crashes were drivers and passengers of motorized vehicles. Of the fatalities, 78.2% were drivers and 21.8% were passengers; of those seriously injured, 73% were drivers and 27% were passengers.
Between 2005 and 2014, Missouri’s annual traffic fatalities decreased from 1,257 to 766; however, there were increases to 870 in 2015 and 945 in 2016. Preliminary state data shows a slight decrease to 930 fatalities in 2017. In the time period of 2005-2015, serious injuries fell from 8,624 to 4,573, and increased in 2016 to 4,743. Preliminary state data also shows an increase to 4,842 serious injuries in 2017.
Throughout the remainder of the document, the fatality reduction goals/projections are calculated in the following manner. An annual average increase/decrease was calculated using five years of actual crash data (2012-2017) and then applied to the 2018 and 2019 fatality projections. The baseline five-year rolling average was calculated using five years of actual crash data (2012-2017). The 2019 projection was based on the 2015-2019 five-year rolling average.
The 2019 overall fatality goal was calculated on an assumed 9% annual reduction in Missouri’s fatalities resulting in a five-year average target of 872.3 fatalities by December 31, 2019. A 9% annual reduction in fatalities would allow Missouri to reach the 2020 Blueprint goal of 700 or fewer fatalities.
11
The 2019 serious injury goal was calculated on an assumed 5% annual reduction in Missouri’s serious injuries resulting in a five-year average target of 4,433.8 serious injuries by December 31, 2019.
A trend line based on the 2012-2016 five-year average was also applied to show the data trends for each category.
Fatality reduction goals were calculated for the following crash types:
Aggressive driving-related fatalities
Speed-related fatalities
Fatalities involving drivers with a .08 BAC or greater
Unrestrained passenger vehicle occupant fatalities
Drivers 15-20 Involved in Fatal Crashes
Fatalities involving drivers age 65 and older
Motorcyclist fatalities
Un-helmeted motorcyclist fatalities
Fatalities involving motorcycle operators who are not licensed or improperly licensed
Fatalities resulting from crashes involving school buses or school bus signals
Pedestrian fatalities
Bicyclist fatalities
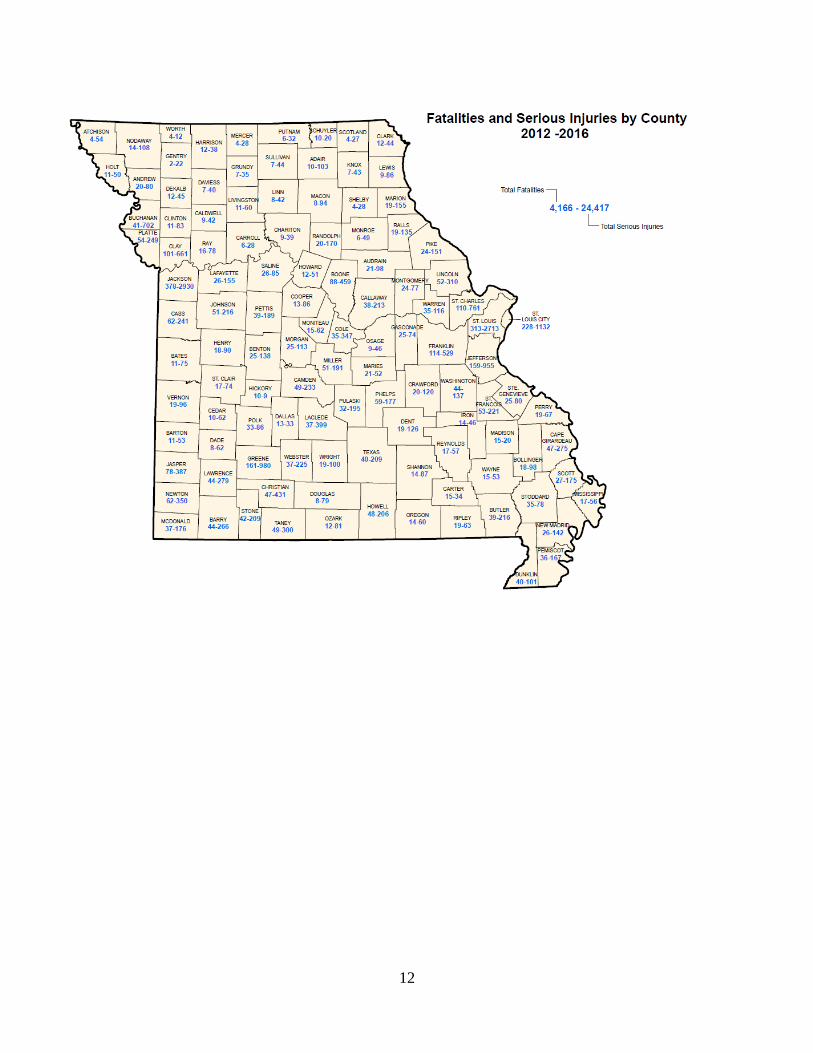
Urban versus Rural Crash Experience Traffic crashes are not evenly distributed on Missouri roadways. As expected, crashes occur in large numbers in the densely populated urban areas (population of 5,000 or more) of the state. Since such a large portion of Missouri’s overall population is in the rural areas (under 5,000 population or unincorporated area), the greater number of crashes occur in those areas. Of the 23,423 fatal and serious injury crashes in 2012-2016, 53% occurred in an urban community while 47% occurred in a rural area. The rural areas of the state take on even greater significance when examining only fatal traffic crashes. In 2012-2016 fatal traffic crashes, 43% occurred in an urban area of the state while 57% occurred in a rural area.
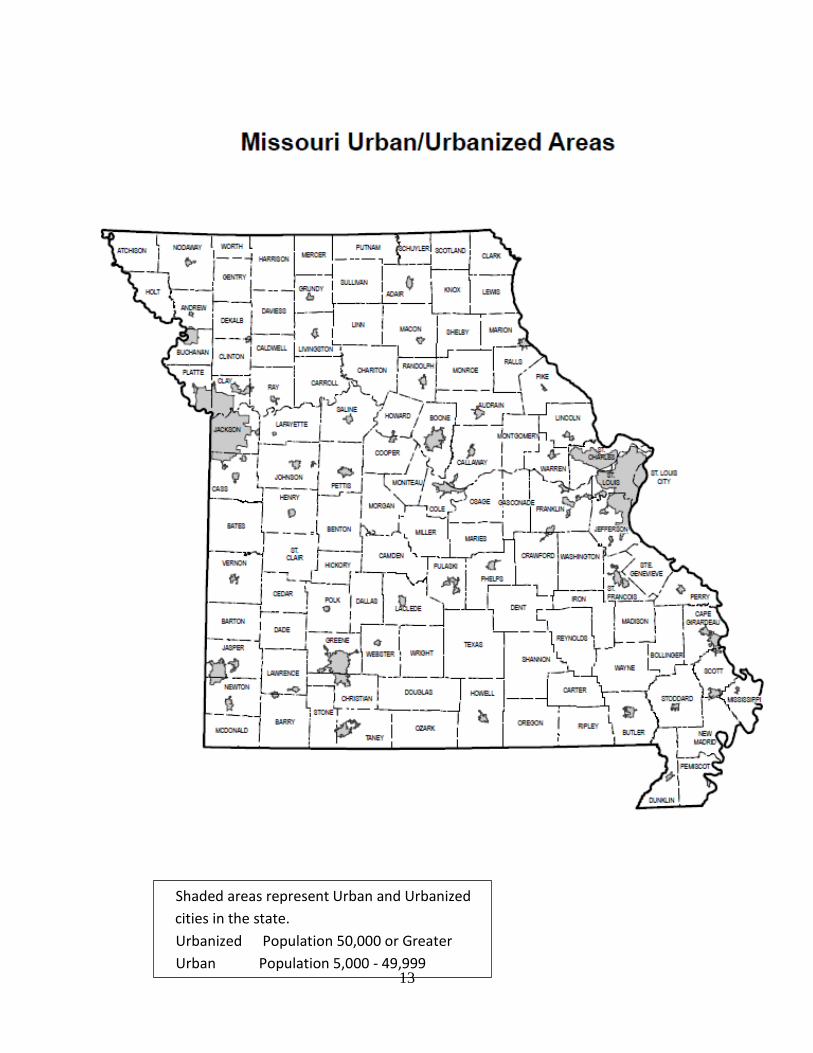
The following two maps depict the high fatality and serious injury locations and the urban (population of 5,000-49,999) and Urbanized (population of 50,000 or greater) for comparison to where crashes are occurring.
12
13
Shaded areas represent Urban and Urbanized
cities in the state.
Urbanized Population 50,000 or Greater
Urban Population 5,000 - 49,999

14
Data Collection and Sources Data is the cornerstone of this plan, and is essential for diagnosing crash problems and monitoring efforts to solve traffic safety problems. We must identify the demographics of the roadway users involved in crashes, what behaviors or actions led to their crashes, and the conditions under which the crashes occurred. Data collection and analysis is dynamic throughout the year.
When data is effectively used to identify repeating patterns in the dynamic interaction of people, pavement, vehicles, traffic, and other conditions, there is increased potential for successful mitigation. From this comes a reduction in the number and severity of crashes, ultimately resulting in fewer fatalities and serious injuries.
Problem identification, performance goals and strategies are derived by utilization of Fatality Analysis Reporting System (FARS), the Missouri Statewide Traffic Accident Records System (STARS), Vehicle Miles Traveled (VMT) and observational occupant protection surveys, among others listed below.
Fatality Analysis Reporting System (FARS) The State of Missouri utilizes the core performance measures outlined in ‘Traffic Safety Performance Measures for State and Federal Agencies” (DOT HS 811 025) as developed by NHTSA and GHSA. The FARS database provides ten of the twelve performance measures. These performance measures are not only used to address problem areas, but to gauge recent success or need for improvement at the statewide level.
Statewide Traffic Accident Records System (STARS) The source of statewide analytical data is the Missouri Statewide Traffic Accident Records System (STARS) managed by the Missouri State Highway Patrol. All Missouri law enforcement agencies are required by law (RSMO 43.250) to submit a Missouri Uniform Traffic Crash Report (MUCR) to STARS if a traffic crash involves a death, a personal injury, total property damage to an apparent extent of five hundred dollars or more to one person, or other written MUCR's as a result of an investigation. It should be noted that although reports that did not occur on public roadways are maintained in STARS, these crashes are not included in statistical analyses provided. Crashes involving less than five hundred dollars to one person may be included if they were reported to STARS.
Vehicle Miles Traveled (VMT) MoDOT maintains vehicle miles traveled charts, graphs and counts for all state maintained roadways in the state. This information serves the HSO in developing problem identification, identifying resources and allocating funding.
Engineering Data MoDOT connects the crash statistics from STARS to their Transportation Management System (TMS). Information relating to roadway features, such as speed limit, lane widths, presence of

15
guardrail, etc.; are stored in TMS. By joining these two data sources, MoDOT is able to perform a comprehensive safety review of the transportation system and strategically implement safety countermeasures.
Observational Occupant Protection Surveys The State of Missouri, with the assistance of the Missouri Safety Center, conducts an annual Statewide Seat Belt Observational Survey. The survey sites for the 2018 survey have been re-selected per rule 1340.12(a) Re-selection of observation sites.
The 2019 HSO funding will also include a statewide Teen Observational Survey conducted in areas where teen drivers are present such as school parking lots. The teen survey is conducted at 150 locations throughout Missouri.
Court Data Court data, gathered from the Office of State Courts Administrator includes DWI filings, diversions, dismissals and convictions. This information is available to the municipal and circuit courts and is used in support of the impaired driving problem identification regarding DWI convictions.
Department of Revenue Information gathered from the Department of Revenue (DOR) includes data elements important to the HSO Young Driver Program and Older Driver Program such as driver’s license by age and gender. This information helps the HSO to identify target age groups when evaluating program objectives.
Biennial Survey of State Automated Traffic Enforcement Systems Beginning with fiscal year 2018, the HSO is conducting a survey of all automated traffic enforcement systems used on any public road in the State. The survey follows the guidelines set forth in 23 CFR Part 1300.13.
Safety Plan Integration Missouri’s target of 700 or fewer fatalities by 2020 has been integrated into all key planning documents that include: State Highway Safety Strategic Plan, Missouri’s Blueprint: Partnership Toward Zero Deaths; the Commercial Vehicle Safety Plan (CVSP); and the Highway Safety Plan and Performance Plan (HSP). The HSP performance targets are identical to the Missouri’s Department of Transportation targets for common performance measures (fatality, fatality rate and serious injuries) reported in the Highway Safety Improvement Plan (HSIP) annual report as coordinated through the state SHSP.
Every effort will be made to establish evidence based strategies that will guide Missouri to meet this target.
16
Core Outcome Measures
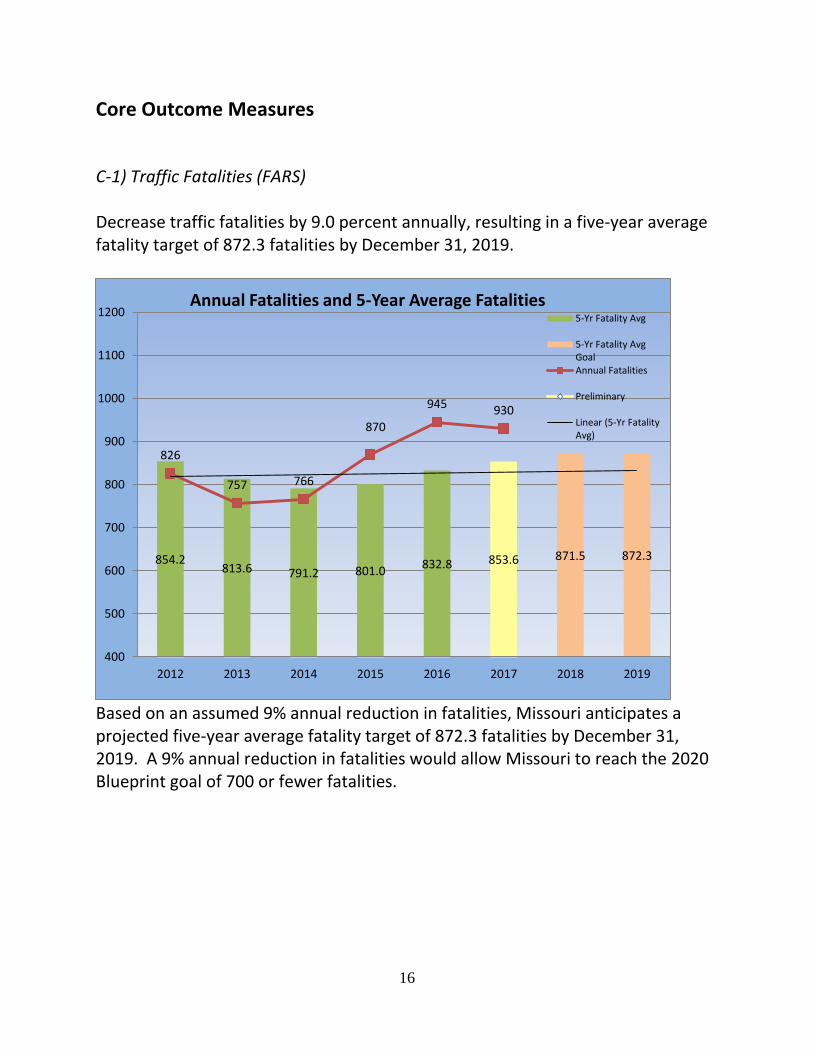
C-1) Traffic Fatalities (FARS) Decrease traffic fatalities by 9.0 percent annually, resulting in a five-year average fatality target of 872.3 fatalities by December 31, 2019.
Based on an assumed 9% annual reduction in fatalities, Missouri anticipates a projected five-year average fatality target of 872.3 fatalities by December 31, 2019. A 9% annual reduction in fatalities would allow Missouri to reach the 2020 Blueprint goal of 700 or fewer fatalities.
854.2 813.6 791.2 801.0
832.8 853.6 871.5 872.3
826
757 766
870
945 930
2012 2013 2014 2015 2016 2017 2018 2019
400
500
600
700
800
900
1000
1100
1200Annual Fatalities and 5-Year Average Fatalities
5-Yr Fatality Avg
5-Yr Fatality AvgGoalAnnual Fatalities
Preliminary
Linear (5-Yr FatalityAvg)

17
C-2) Serious Traffic Injuries (STARS) Decrease serious traffic injuries by 5.0 percent annually, resulting in a five-year average fatality target of 4,433.8 serious injuries by December 31, 2019.
Based on an assumed 5% annual reduction in serious injuries, Missouri anticipates a projected five-year average serious injury target of 4,433.8 by December 31, 2019.
6,143.4 5,744.6
5,368.0 5,063.4 4,883.4
4,683.4 4,551.9 4,433.8
5,506
4,938
4,657 4,573 4,743 4,506
2012 2013 2014 2015 2016 2017 2018 2019
2000
2500
3000
3500
4000
4500
5000
5500
6000
6500
7000Annual Serious Injuries and 5-Year Serious Injuries
5-Yr SI Avg
5-Yr SI Avg Goal
Annual SeriousInjuriesPreliminary
Linear (5-Yr SI Avg)

18
C-3) Fatalities / VMT (FARS/FHWA) Decrease traffic fatalities by 9.0 percent annually, resulting in a reduced five-year average fatality rate of 1.160 by December 31, 2019.
Based on an assumed 9% annual reduction in fatalities, Missouri anticipates a projected five-year average fatality rate target of 1.160 by December 31, 2019.
1.235 1.171 1.133 1.143 1.168 1.175 1.177 1.160
1.194 1.090 1.080
1.210 1.268
1.225
2012 2013 2014 2015 2016 2017 2018 2019
0
0.2
0.4
0.6
0.8
1
1.2
1.4
1.6Annual Fatality Rate and 5-Yr Average Fatality Rate 5-Yr Avg Fatality
Rate5-Yr Avg FatalityRate GoalAnnual Fatality Rate
Preliminary
Linear (5-Yr AvgFatality Rate)

19
C-3a) Fatalities/VMT Rural (FARS/FHWA)
Decrease rural traffic fatalities by 0.17 percent annually, resulting in a reduced five-year average rural fatality rate of 1.536 by December 31, 2019.
Based on an annual average decrease of 0.17 percent in rural traffic fatalities from 2012 to 2017, Missouri is projecting a five-year average rural fatality rate of 1.536 by December 31, 2019.
1.802 1.700
1.636 1.654 1.654 1.612 1.576 1.536
1.640 1.610 1.620
1.690 1.712
1.429
2012 2013 2014 2015 2016 2017 2018 2019
1
1.2
1.4
1.6
1.8
2
2.2Annual Rural Fatality Rate and 5-Year Average Rural
Fatality Rate 5-Yr Avg Rural Fatality Rate
5-Yr Avg Rural Fatality RateGoalAnnual Fatality Rate
Preliminary
Linear (5-Yr Avg Rural FatalityRate)

20
C-3b) Fatalities/VMT Urban (FARS/FHWA)
Missouri is projecting an increased five-year average urban fatality rate of 1.045 by December 31, 2019.
Based on an annual average increase of 6.29 percent in urban traffic fatalities from 2012 to 2017, Missouri is projecting a five-year average urban fatality rate of 1.045 by December 31, 2019.
0.822 0.788 0.770 0.782 0.822 0.862
0.943 1.045
0.870
0.730 0.700
0.880 0.929
1.069
2012 2013 2014 2015 2016 2017 2018 2019
0
0.2
0.4
0.6
0.8
1
1.2
1.4
Annual Urban Fatality Rate and 5-Year Average Urban Fatality Rate 5-Yr Avg Urban Fatality
Rate5-Yr Avg Urban FatalityRate GoalAnnual Fatality Rate
Preliminary
Linear (5-Yr Avg UrbanFatality Rate)

21
C-4) Unrestrained Passenger Vehicle Occupant Fatalities (FARS)
Missouri is projecting an increase to 385.8 five-year average unrestrained passenger vehicle occupant fatalities by December 31, 2019.
Based on an annual average increase of 0.10 percent in unrestrained passenger
vehicle occupant fatalities from 2012 to 2017, Missouri is projecting 385.5 five-
year average unrestrained passenger vehicle occupant fatalities by December 31,
2019.
410.0 378.0
357.0 351.6 354.2 354.6 368.9 385.8
394
325 312
356
384 396
2012 2013 2014 2015 2016 2017 2018 2019
0
50
100
150
200
250
300
350
400
450Annual Unrestrained Vehicle Occupant Fatalities and
5-Yr Unrestrained Vehicle Occupant Average Fatalities
5-yr Fatality Avg
5-yr Fatality Avg Goal
Annual Fatalities
Preliminary
Linear (5-yr Fatality Avg)
22
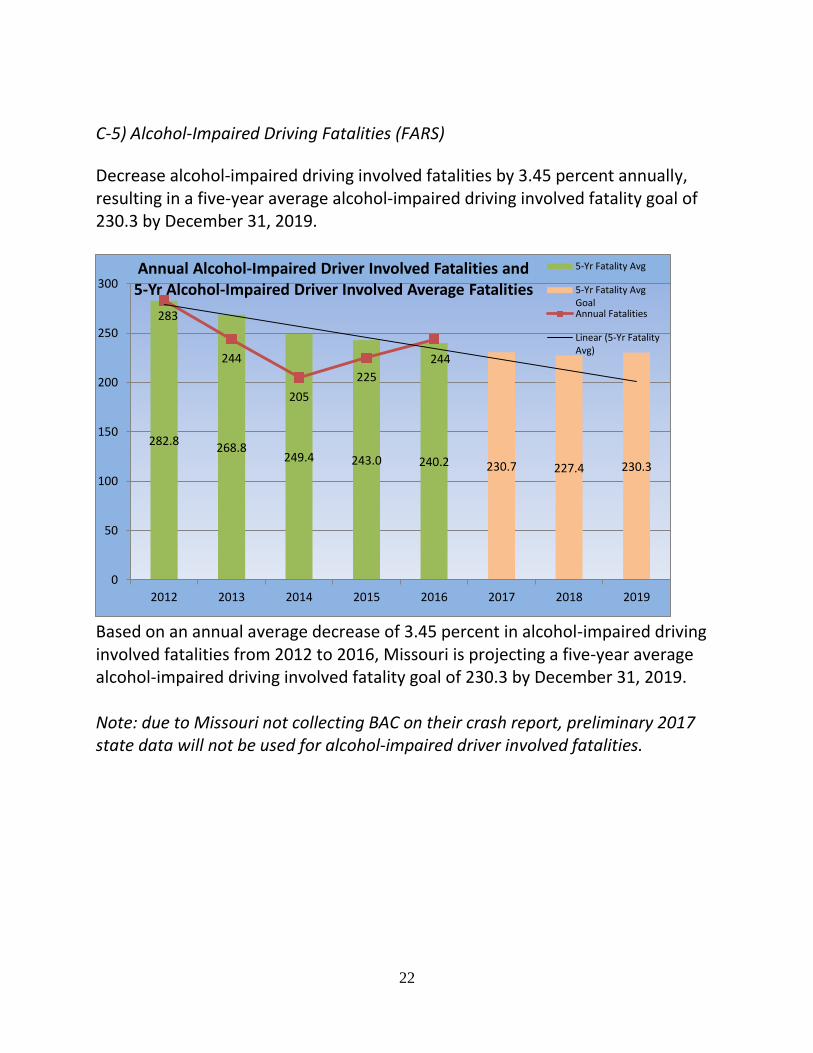
C-5) Alcohol-Impaired Driving Fatalities (FARS)
Decrease alcohol-impaired driving involved fatalities by 3.45 percent annually, resulting in a five-year average alcohol-impaired driving involved fatality goal of 230.3 by December 31, 2019.
Based on an annual average decrease of 3.45 percent in alcohol-impaired driving involved fatalities from 2012 to 2016, Missouri is projecting a five-year average alcohol-impaired driving involved fatality goal of 230.3 by December 31, 2019. Note: due to Missouri not collecting BAC on their crash report, preliminary 2017 state data will not be used for alcohol-impaired driver involved fatalities.
282.8 268.8
249.4 243.0 240.2 230.7 227.4 230.3
283
244
205
225
244
2012 2013 2014 2015 2016 2017 2018 2019
0
50
100
150
200
250
300Annual Alcohol-Impaired Driver Involved Fatalities and 5-Yr Alcohol-Impaired Driver Involved Average Fatalities
5-Yr Fatality Avg
5-Yr Fatality AvgGoalAnnual Fatalities
Linear (5-Yr FatalityAvg)

23
C-6) Speeding Related Fatalities (FARS)
Missouri is projecting an increase to 331.7 five-year average speed related fatalities by December 31, 2019.
Based on an annual average increase of 0.74 percent in speed related fatalities from 2012 to 2017, Missouri is projecting 331.7 five-year average speed related fatalities by December 31, 2019.
356.0 329.4
307.0 304.0 307.6 310.0 316.5 331.7
326 308
267
309
328 338
2012 2013 2014 2015 2016 2017 2018 2019
0
50
100
150
200
250
300
350
400 Annual Speed Related Fatalities and 5-Yr Speed Related Average Fatalities
5-Yr Fatality Avg
5-Yr Fatality Avg Goal
Annual Fatalities
Preliminary
Linear (5-Yr Fatality Avg)
24
C-7) Motorcyclist Fatalities (FARS)
Missouri is projecting an increase to 115.3 five-year average motorcyclist fatalities by December 31, 2019.
Based on an annual average increase of 2.12 percent in motorcyclist fatalities from 2012 to 2017, Missouri is projecting 115.3 five-year average motorcyclist fatalities by December 31, 2019.
95.0 88.4 89.2 89.6
98.6 100.8 109.5 115.3
104
74
91 97
127
115
2012 2013 2014 2015 2016 2017 2018 2019
0
20
40
60
80
100
120
140 Annual Motorcyclist Fatalities and 5-Yr Motorcyclist Average Fatalities
5-Yr Fatality Avg
5-Yr Fatality Avg Goal
Annual Fatalities
Preliminary
Linear (5-Yr Fatality Avg)
25
C-8) Unhelmeted Motorcyclist Fatalities (FARS)
Missouri is projecting an increase to 13.8 five-year average unhelmeted motorcyclist fatalities by December 31, 2019.
Based on an annual average increase of 11.11 percent in unhelmeted motorcyclist fatalities from 2012 to 2017, Missouri is projecting 13.8 five-year average unhelmeted motorcyclist fatalities by December 31, 2019.
15.2
11.8 8.8
8.0 9.0
10.0 11.7
13.8
9
7 7 7
15
14
2012 2013 2014 2015 2016 2017 2018 2019
0
2
4
6
8
10
12
14
16Annual Unhelmeted Motorcyclists Fatalities and
5-Yr Unhelmeted Motorcyclists Average Fatalities
5-Yr Fatality Avg
5-Yr Fatality Avg Goal
Annual Fatalities
Preliminary
Linear (5-Yr Fatality Avg)
26
C-9) Drivers Aged 20 or Younger Involved in Fatal Crashes (FARS)
Decrease drivers age 20 or younger involved in fatal crashes by 0.78 percent annually, resulting in a five-year average goal of 123.8 by December 31, 2019.
Based on an annual average decrease of 0.78 percent of drivers 20 or younger
involved in fatal crashes from 2012 to 2017, Missouri is projecting a five-year
average goal of 123.8 by December 31, 2019.
138.8 128.8
118.2 118.4 116.6 116.0 117.7 123.4
127
115
94
123 124
124
2012 2013 2014 2015 2016 2017 2018 2019
0
20
40
60
80
100
120
140
160Annual Drivers 20 or Younger Involved in Fatal Crashes and
5-Yr Drivers 20 or Younger Involved in Fatal Average Crashes 5-Yr Fatality Avg
5-Yr Fatality Avg Goal
Annual Fatalities
Preliminary
Linear (5-Yr Fatality Avg)

27
C-10) Pedestrian Fatalities (FARS)
Missouri is projecting an increase to 100.8 five-year average pedestrian fatalities by December 31, 2019.
Based on an annual average increase of 3.33 percent in pedestrian fatalities from
2012 to 2017, Missouri is projecting 100.8 five-year average pedestrian fatalities
by December 31, 2019.
69.0 71.0 70.4 80.2 84.4 87.2
92.9 100.8
84
73
65
104 96 98
2012 2013 2014 2015 2016 2017 2018 2019
0
20
40
60
80
100
120 Annual Pedestrian Fatalities and 5-Yr Pedestrian Average Fatalities
5-Yr Fatality Avg
5-Yr Fatality Avg Goal
Annual Fatalities
Preliminary
Linear (5-Yr Fatality Avg)

28
C-11) Bicyclist Fatalities (FARS)
Missouri is projecting an increase to 9.4 five-year average bicyclist fatalities by December 31, 2019.
Based on an annual average increase of 10.00 percent in bicyclist fatalities from
2012 to 2017, Missouri is projecting 9.4 five-year average bicyclist fatalities by
December 31, 2019.
3.8 4.0 4.6 5.0
6.4 7.0
8.2
9.4
6
4
5
9
8
9
2012 2013 2014 2015 2016 2017 2018 2019
0
1
2
3
4
5
6
7
8
9
10 Annual Bicyclist Fatalities and 5-Yr Bicyclist Average Fatalities
5-Yr Fatality Avg
5-Yr Fatality Avg Goal
Annual Fatalities
Preliminary
Linear (5-Yr Fatality Avg)

29
B-1) Observed Belt Usage (Observed Seat Belt Use Survey)
To increase statewide observed seat belt use of front seat outboard occupants in passenger vehicles 1 percentage point annually from the 2017 calendar base year rate of 84% to 86% by December 31, 2019.*
*At the time of the HSP submission, the 2018 survey was not complete. The usage rate was 87.1% in 2018.
79 80
79 80
81
84
2012 2013 2014 2015 2016 2017
76
77
78
79
80
81
82
83
84
85 Missouri Observed Occupant Restraint Usage Rates
30
Project Selection Best Practices Countermeasures The highway safety office makes every attempt to ensure that effective countermeasure efforts are incorporated into the strategies of the Plan by employing the following methods: 1. Utilizing proven countermeasures identified within the latest update of Countermeasures
That Work: A Highway Safety Countermeasure Guide for State Highway Safety Offices, US
DOT, NHTSA;
2. Utilizing countermeasures identified in NCHRP report 622 publication (Effectiveness of
Highway Safety Countermeasures)
3. Evaluating traffic crash data to determine crash types, target populations and geographic
locations in order to most effectively implement countermeasure efforts;
4. Participating in national law enforcement mobilizations that combine blanketed
enforcement and saturated media during established timeframes and in targeted traffic
corridors;
5. Participating in state, regional, and national training opportunities in order to gain insight
into proven programs that can be replicated in Missouri; and
6. Reviewing highway safety research studies from Transportation Research Board, NHTSA,
FHWA, FMCSA, Insurance Institute for Highway Safety, AAA Foundation, etc. to guide the
inclusion of various strategies in the Plan.
Planning, Programming and Implementation The state’s highway safety program, as explained earlier, is a federal grant program. The federal fiscal year runs from October 1 through September 30.
31
Grant Application Process
The Highway Safety Office hosts grant application workshops each year for potential applicants. These workshops are held in five strategic regional locations (Cape Girardeau, Chesterfield, Jefferson City, Springfield, and Lee’s Summit) so it is more convenient for potential applicants to attend. They are usually scheduled during January. Workshop participants are provided a packet explaining the highway safety grant program, the types of projects eligible for award, and an overview of statewide statistical traffic crash data. Potential applicants are given instruction on how to retrieve traffic crash data for analysis through the Missouri State Highway Patrol’s web site. The purpose of the highway safety program and the statewide goal are discussed to help the potential applicants understand how their efforts are imperative in order to impact the fatality reduction goal. Program areas are identified and the Highway Safety Grant Management System (GMS) and on-line reporting systems are reviewed. These seminars are used as an opportunity to share any new contract conditions, application process changes, or legislative changes that may impact the grant programs. The grant application deadline for the 2019 fiscal year was March 1, 2018.
Internal Grants Management System In late 2001, the Highway Safety Office began work with the Regional Justice Information Service (REJIS) to develop the first-of-its-kind on-line grants management system. The system allows applicants to electronically submit applications. This information feeds into a system that builds databases for managing the highway safety grants (budgets, grantee lists, inventory, vouchering, reporting data, disbursement reports, etc.). The system went live for the 2003 grant application cycle. Since that time, the Highway Safety Office has continued to work with REJIS to refine the system in order to make it more user friendly for the applicants and subrecipients, in addition to being more functional and robust for the Highway Safety Office. An extensive rewrite took place to coincide with the 2010 grant cycle. The system was refined so that the processes of application submission, contract development, enforcement reporting, and vouchering are now entirely web-based. The areas of Motor Carrier Safety Assistance Program and Regional Blueprint have also been added to the system. Additional reporting components continue to be developed. The Highway Safety Office will continue to maintain and improve the GMS and is currently working toward an entirely paperless grant process.
Grant Selection Process The Highway Safety program staff reviews the applications relative to their specific areas of expertise. During this preliminary review, they assess the applications to determine their relevancy toward meeting the highway safety goals. Applicants are contacted if clarification is needed. In essence, a case is prepared to present to management and the remaining program staff members to support whether the application should be funded in full, in part, or denied.

32
Fatal and serious injury crash rankings are performed for all cities, counties, and the unincorporated areas in the state. These rankings are conducted for the problem areas of alcohol, speed, young drinking drivers, distracted, unbelted, under 21 years of age and older drivers. These rankings are also used in determining the overall severity of the problem for each respective location. Fatal and serious injury county, city, and unincorporated county rank orders are located in the Crashes by City, County & Unincorporated County section of this report. Ranking by problem area can be found on the Missouri State Highway Patrol’s on-line State Traffic Accident Records System located at https://www.mshp.dps.missouri.gov/MSHPWeb/SAC/stars_index.html. Law enforcement applications are assessed to determine their rankings by the type of project they are choosing to conduct. While the highest-ranking locals are given priority because of the potential impact of their project, other considerations are taken into account. For instance, a lower-ranking city may be given a project because the county in which they reside ranks high or they may fall within a dangerous corridor. Some communities are given a project in order to participate in the national mobilizations while others are given consideration because the Highway Safety Office has determined a need exists to garner traffic safety minded agencies within a particular geographic location. An additional consideration may be their participation in multi-jurisdictional law enforcement task forces.
Risk Assessment An internal team of highway safety program staff review all grant applications which includes conducting a risk assessment. Several days are set aside to review the applications and hear both supporting arguments and issues of concern. The reviewers take many factors into consideration when assessing these applications:
Does the project fall within the national priority program areas (alcohol and other drug
countermeasures; police traffic services; occupant protection; traffic records; emergency
medical services; speed; motorcycle, pedestrian, or bicycle safety)?
Does the project address the key emphasis areas identified within the Blueprint and does it
have the ability to impact statewide traffic crash fatalities and serious injuries?
Does the problem identification sufficiently document problem locations, crash statistics,
targeted populations, demonstrated need, and the impact this project would have on traffic
safety problems in their community?
Have “best practices” countermeasures been proposed in order to make a positive impact
on the identified problem?
Will this project provide continuity of effort in a particular geographic region (such as multi-
jurisdiction enforcement) or in a particular program area (occupant protection)?
Will the activity serve as a “foundational project” that satisfies criteria for additional federal
funding (e.g., safety belt observational survey)?
33
Does the project alleviate, eliminate or correct a problem that was identified in a federally
conducted assessment of a highway safety priority program area?
Will the project satisfy or help satisfy federal goals for regional highway safety issues?
Are innovative countermeasures proposed and, if so, is there an effective evaluation
component included?
Are any local in-kind resources proposed to match the federal grant efforts?
Does the applicant propose developing partnerships (e.g., working with service
organizations, health agencies, and/or insurance companies; conducting multi-jurisdiction
enforcement efforts) in order to expand their resources and enhance their outcomes?
Is the local government or administration supportive of this proposed activity?
If equipment is requested, will the equipment support a project or enforcement activity;
does the agency have the ability to provide a local match for part of the equipment
purchase?
Is there sufficient funding in the budget to support all or part of this application?
Has the applicants risk of noncompliance with Federal statutes, regulations, and the terms
and conditions of the subaward been considered for such factors as:
o The applicants prior experience with the same or similar sub awards;
o The results of previous audits including whether or not the applicant receives a
Single Audit in accordance with Subpart F-Audit Requirements of this part, and
the extent to which the same or similar subaward has been audited as a major
program;
o Whether the applicant has new personnel or new or substantially changed
systems; and
o The extent and results of federal awarding agency monitoring
Information and Data Sources Consulted The following information and data sources were consulted during the grant application review process:
Grants Management System (GMS) - provided financial history and past performance
information
STARS & FARS - Provide the crash history, state ranking, crash time frames and crash locations.
Transportation Management System (TMS) - connects MoDOT crash statistics to STARS.
The applications are discussed at length using a risk assessment checklist to ensure consistency and to determine whether the agency should be funded, the level of funding, which grant funding source should support the project, and whether the activity is a state or local benefit (40 percent of funds must be expended toward local benefit). Each applicant funding amount is determined by reviewing at least two prior years’ awarded funding amounts and spending history; the agencies risk for potential fraud, waste and abuse; and the agencies willingness to comply with the contract conditions regarding timely vouchering. A key reference document is

34
Countermeasures that Work: A Highway Safety Countermeasure Guide for State Highway Safety Offices to assure we support research-based strategies. Other considerations for research-based strategies are Transportation Research Board research and reports, other DOT funded research and university-based research. When equipment is required, the applicant is requested to provide a local match. If the local match is unavailable, those applications are reviewed on a case-by-case basis to determine whether this agency can provide full support. During the meeting, this information is continually updated into the Highway Safety Office’s grant management system so that real-time information is immediately available. By the end of the meeting, there is a complete listing of the approved projects that will best support the mission and work toward reaching the Blueprint’s target of 700 or fewer fatalities by 2020.
Subrecipient Compliance Requirements Any agency receiving a Highway Safety grant must comply with the following statutes or rules. The following are included in the contract signed by the subrecipient:
Nondiscrimination — CFR Chapter 50 prohibits discrimination on the basis of race, color,
religion, sex or national origin including DBE and Segregated Facilities.
Hatch Act – Pursuant to United States Code Sections 1501-1508, employees who are paid in
whole or in part with federal funds are prohibited from participating in certain partisan political
activities including, but not limited to, being candidates for elective office.
Federal Funding Accountability and Transparency Act: Subrecipients must disclose detailed
information about their operations including the name and location of the entity, amount of
award, transaction type, unique identifier, names and the total compensation of the five most
highly compensated officers of the entity if certain parameters are met. The state then
compiles this information for all grantees and facilitates the disclosure of this information to
the federal government and the public.
Buy America Act – The state will comply with the provisions of the Buy America Act (49 U.S.C.
5323 (j), which contains the following requirements:
Only steel, iron and manufactured products produced in the United States may be purchased
with federal funds unless the Secretary of Transportation determines that such domestic
purchases would be inconsistent with the public interest, that such materials are not
reasonably available and of a satisfactory quality, or that inclusion of domestic materials will
increase the cost of the overall project contract by more than 25 percent. Clear justification for
35
the purchase of non-domestic items must be in the form of a waiver request submitted to and
approved by the Secretary of Transportation.
All items purchased must be compliant with the National Highway Traffic Safety Administration
(NHTSA) interpretation of the Buy America Act including, but not limited to:
1. Items valued over $5,000 per unit must be manufactured or assembled in the United States
of America , or as allowed by a current Buy America Act waiver issued by the NHTSA;
2. All vehicles must be manufactured or assembled in the United States of America regardless
of cost .
1Twww.nhtsa.gov/staticfiles/administration/programs-grants/Buy-America-Act-revised-
11202015.pdf1T
The Drug-Free Workplace Act of 1988 – The state will provide a drug-free workplace according
to 41 U.S.C. 8103 by notifying employees that the unlawful manufacture, distribution,
dispensing, possession or use of a controlled substance is prohibited in the grantee’s
workplace. The State will also establish a drug-free awareness program; notify employees of
the requirements of the workplace and conviction of such offense and the actions to be taken.
Certification Regarding Federal Lobbying and Restriction on State Lobbying – Certifies no
federal appropriated funds have been paid or will be paid to any person for influencing or
attempting to influence an officer or employee of any agency, a member of Congress, an officer
or employee of Congress, or an employee of a member of Congress in connection with the
awarding of any federal contract. None of the funds under the programs will be used for any
activity specifically designed to urge or influence a state or local legislator to favor or oppose
the adoption of any specific legislative proposal pending before any state or local legislative
body.
Certification Regarding Debarment and Suspension and Certification Regarding Debarment,
Suspension, Ineligibility and Voluntary Exclusion-Lower Tier Covered Transactions – Certifying
that the agency and its principals are presently not debarred, suspended, proposed for
debarment, declared ineligible or voluntarily excluded from participation in the transaction by
any federal department or agency.
Any law enforcement agency receiving a Highway Safety grant must also comply with the following statutes or rules. The following are included in the contract signed by the grantee :
Peace Officer Standards and Training Certification (P.O.S.T.) — Pursuant to RSMo 590.100-
590.180 all peace officers in the State of Missouri are required to be certified by the
Department of Public Safety.

36
Statewide Traffic Analysis Reporting (STARS) – Pursuant to RSMo 43.250, law enforcement agencies must file accident reports with the Missouri State Highway Patrol. Uniform Crime Reporting — Pursuant to RSMo 43.505, all law enforcement agencies shall submit crime incident reports to the Department of Public Safety on the forms or in the format prescribed by DPS, as shall any other crime incident information that may be required by DPS. Racial Profiling — Pursuant to RSMo 590.650, each law enforcement agency shall compile the data described in Subsection 2 of Section 590.650 for the calendar year into a report to the Attorney General and submit the report to the AG no later than March first of the following calendar year. Prohibition on Using Grant Funds to Check for Helmet Usage - The State and each subrecipient will not use 23 U.S.C. Chapter 4 grant funds for programs to check helmet usage or to create checkpoints that specifically target motorcycles. Policy on Seat Belt Use – In accordance with Executive Order 13043, Increasing Seat Belt Use in the United States, dated April 16, 1997, the Grantee is encouraged to adopt and enforce on-the-job seat belt use policies and programs for its employees when operating company-owned, rented, or personally-owned vehicles. Policy on Banning Text Messaging While Driving – In accordance with Executive Order 13513, Federal Leadership On Reducing Text Messaging While Driving, and DOT Order 3902.10, Text Messaging While Driving, States are encouraged to adopt and enforce workplace safety policies to decrease crashes caused by distracted driving, including policies to ban text messaging while driving company-owned or –rented vehicles, Government-owned, leased or rented vehicles, or privately-owned when on official Government business or when preforming any work on or behalf of the Government.
Local Ordinances and Policies
Agencies are encouraged to adopt the following local ordinances and policies, if possible:
Model Traffic Ordinance—Chapter 300—Rules governing traffic administration and regulation
Child Restraints—RSMo 307.179—Passenger restraint system required for children birth
through age seven years (Primary Offense)
Seat Belts—RSMo 307.178—Seat belts required for passenger cars
Open Container—A model ordinance prohibiting the possession of an open container of
alcoholic beverages in a motor vehicle.
Law enforcement vehicular pursuit training Title 23, USC, Chapter 4 402a(j) - A state shall
actively encourage all relevant law enforcement agencies in such state to follow the
guidelines established for vehicular pursuits issued by the International Association of

37
Chiefs of Police that are in effect on the date of enactment of this subsection or as revised
and in effect after such date as determined by the secretary.
38
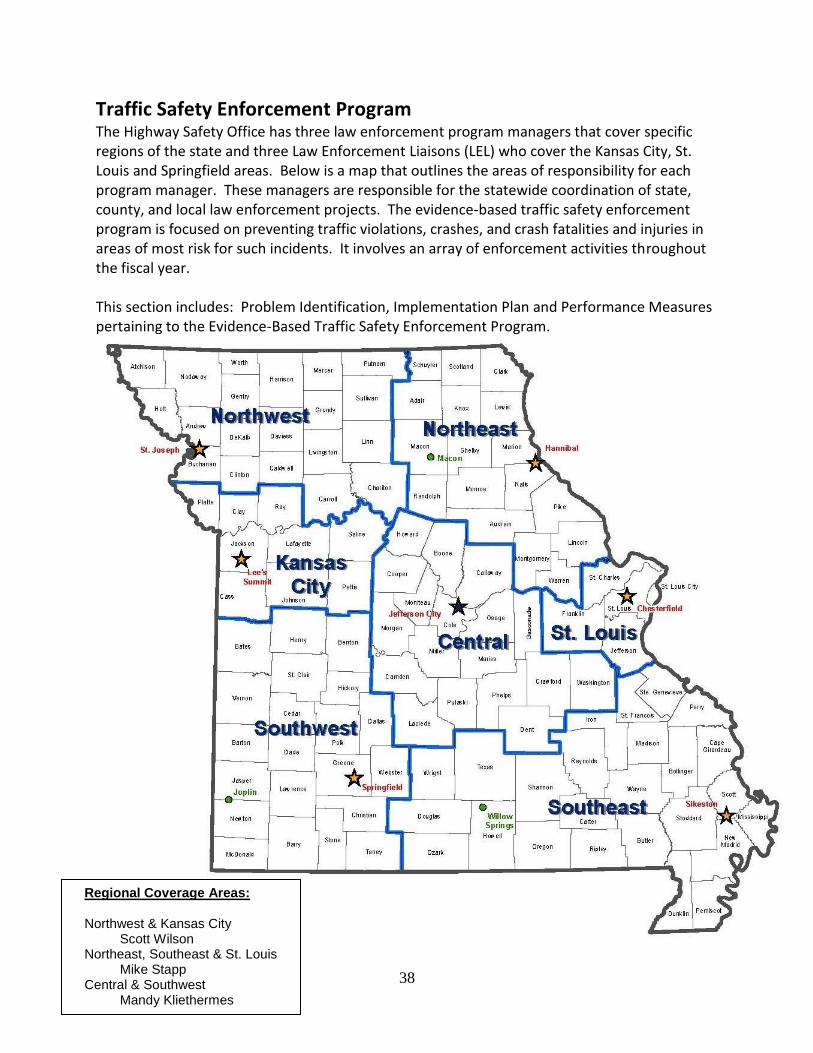
Traffic Safety Enforcement Program The Highway Safety Office has three law enforcement program managers that cover specific regions of the state and three Law Enforcement Liaisons (LEL) who cover the Kansas City, St. Louis and Springfield areas. Below is a map that outlines the areas of responsibility for each program manager. These managers are responsible for the statewide coordination of state, county, and local law enforcement projects. The evidence-based traffic safety enforcement program is focused on preventing traffic violations, crashes, and crash fatalities and injuries in areas of most risk for such incidents. It involves an array of enforcement activities throughout the fiscal year. This section includes: Problem Identification, Implementation Plan and Performance Measures pertaining to the Evidence-Based Traffic Safety Enforcement Program.
Regional Coverage Areas: Northwest & Kansas City Scott Wilson Northeast, Southeast & St. Louis Mike Stapp Central & Southwest Mandy Kliethermes

39
Problem Identification Process
Fatal and serious injury crash rankings are performed for all cities, counties, and the unincorporated areas in the state. These ranking are conducted for the problem areas of alcohol, speed, young drinking drivers, distracted, unbelted, under 21 years of age and older drivers. These rankings are also used in determining the overall severity of the problem for each respective location. Fatal and serious injury by county, city, and unincorporated county rank orders are located in the Crashes by City, County & Unincorporated County section of this report. Ranking by problem area can be found on the Missouri State Highway Patrol’s on-line State Traffic Accident System located at 1Thttps://www.mshp.dps.missouri.gov/MSHPWeb/SAC/stars_index.html 1T
Implementation Plan Grant Application Selection Grant application workshops are held for potential applicants in five locations around the state. The purpose of the highway safety program and statewide goal are discussed at each workshop to help grantees understand how their efforts are imperative in order to impact the fatality and serious injury problem on Missouri highways. Law Enforcement (LE) program management staff participates in each workshop and offer assistance to agencies interested in submitting a grant. Once applicants submit their applications into the Highway Safety Office Grant Management System, law enforcement program management staff reviews each application for their fatality / serious injury rankings. During this review, LE program managers assess the applications to determine their relevancy toward meeting the highway safety goals. The LE program management team reviews their respective applications where the LE staff share supporting arguments and issues of concern recommending either to fully fund, partially fund or deny the LE applications. The reviewers take the same factors into consideration as where described in the Project Selection section of this document. Once LE grant award decisions are made that best support the mission and work toward reaching the Blueprint’s target of 700 or fewer fatalities by 2020, grant award meetings are held in the fall at five locations around the State. LE program managers provide a copy of the award, review subrecipient compliance requirements, address any questions and concerns, and network with any new and continuing grantees.
Mobilizations The Law Enforcement Traffic Safety Advisory Council identifies quarterly impaired driving and occupant protection mobilization dates for each fiscal year. The LE program management staff aggressively seek participation in these mobilizations, as well as, the NHTSA required Drive Sober or Get Pulled Over and the Click It or Ticket mobilizations. Agencies are also encouraged to participate in the Distracted Driving Month enforcement activities.
40
DWI/Traffic Units are a key enforcement technique used to team with a city or county law enforcement agency to financially support DWI/Traffic Units. The HSO currently funds 10 units (some agencies fund their own units). The mission of these units is to focus on impaired drivers/high risk drivers and to aggressively enforce DWI and hazardous moving violations. Below is a list of the full-time DWI/Traffic Units:
Joplin Police Department Greene County Sheriff’s Office Boone County Sheriff’s Office Columbia Police Department Jackson County Sheriff’s Office Jefferson County Sheriff’s Office Franklin County Sheriff’s Office St. Louis County Police Department Creve Coeur Police Department Platte County Sheriff’s Office
Law Enforcement Task Forces/Councils have also been formed in many multiple city/county LE agencies and meet on a regular basis to plan and coordinate key enforcement activities. Several agencies have a shortage of personnel to conduct sobriety checkpoints and other enforcement initiatives. The task force concept provides the opportunity to pool resources to conduct more manpower intensive activities such as sobriety checkpoints or corridor projects. It also provides a forum for the LE officers to network and share traffic issues or concerns. Below is a list of the multi-jurisdictional task forces operating in Missouri:
Southwest DWI Task Force (11 Agencies) Northwest DWI Task Force (7 Agencies) Jackson County Traffic Safety Task Force (9 Agencies) Cass County STEP DWI Task Force (4 Agencies) Clay/Platte County DWI Task Force (14 Agencies) St. Louis Regional Traffic Safety Council (50 Agencies) St. Charles County DWI Task Force (7 Agencies) Central Ozarks Regional DWI Task Force (19 Agencies) Southeast Missouri DWI Task Force (13 Agencies) Law Enforcement Traffic Safety Advisory Council
Sobriety Checkpoints In 2009 an effort was made to increase the number of sobriety checkpoints held each year. Since that time approximately 500 checkpoints are held each year. In 2017, the Missouri legislature drafted and approved a bill which only allows the HSO to fund one dollar toward sobriety checkpoints. It is the hope of the HSO that this legislation will be reversed in the 2018 legislative session. However, until that time, law enforcement agencies are encouraged to continue conducting sobriety checkpoints with internal funding.*
*At the time of the HSP submission, legislation was not complete. However, the 2018 legislative session did not restore checkpoints.

41
Communication Component There is a communication plan developed with each mobilization. These plans vary depending on the available funding and involve press releases, paid media, social media, and earned media. Sample pre- and post- press releases are sent to LE departments choosing to participate in various law enforcement initiatives/mobilizations. In the case of sobriety checkpoints, these releases are required and help make the general deterrent strategy more effective.
Continuous Follow-Up and Adjustment Program management staff reviews the results of various law enforcement initiatives/ mobilizations. State, local and county LE agencies are encouraged to review their results and area crash data on a regular basis. Based upon these reviews, adjustments are made to operational plans to improve the activity’s effectiveness.
Performance Measures To monitor law enforcement participation in the NHTSA and LETSAC mobilizations, the Traffic and Highway Safety Division has three performance measures in their division tracker. These measures identify the number of participating agencies, number of hours worked, number of sobriety checkpoints, and the type and number of citation and warning tickets. There are a number of measures listed throughout the HSP designed to track the progress of our law enforcement activities. The most important outcome involves a reduction in the number of fatalities and serious injuries occurring by crash type. The following is a list of other measures.
Number of speeding citations issued during grant-funded enforcementactivities and mobilizations
Number of impaired driving arrests made during grant-fundedenforcement activities and mobilizations.
Number of safety belt citations issued during grant-funded enforcementactivities and mobilizations
42
Performance Plan Program Areas
In the following section, each program area contains specific counter measure strategies used
to complete the program and achieve specific performance targets. Each program area
contains a description of the problem identification, prior year performance, allocation of
funding, other sources used to achieve the goals, core performance measures, other
performance goals and each project selected for the program area showing the proven
countermeasure strategies. The information provided is accurate as of June 1, 2018.
Planning and Administration
Problem Identification
Not Applicable

Public Information and Education
43
Communications (Media)
Problem Identification From 2005-2017, due to the combined efforts of highway safety advocates in the MCRS, 4,455 lives have been saved on MO roadways, a decrease of 26 percent. The coalition credits a combination of law enforcement, educational efforts, emergency medical services, engineering enhancements and public policy as the successful formula for saving lives. However, the historic four “E’s” of safety must be expanded to include Evaluation and Everyone. Measuring success by Evaluation of performance measures holds each of us accountable for its success. In turn, addressing the need to change traffic safety culture challenges each person to make personal responsibility for their behavior as a roadway user and includes EVERYONE.
While our roads are safer than they have been in many years, there are still too many crashes and senseless deaths happening every year. We are committed to further reducing the number of traffic crashes in Missouri, so we must work even harder to reach those remaining people who haven’t gotten the message that:
Seat belts save lives;
Drinking and driving are a deadly mix;
Distracted drivers are dangerous drivers; and
Parents and caregivers must secure children in size-and age-appropriate car seats thatare properly installed.
This is accomplished by developing highly visible, catchy campaigns that are coupled with strong enforcement efforts. We rely on our traffic safety partners to be active participants in these campaigns. Some of the most effective campaigns have been the national law enforcement mobilization efforts such as “Click It or Ticket” and “Drive Sober or Get Pulled Over.” People heard about the mobilizations in the media, and drivers were aware that the risk of apprehension was high. These campaigns have proven their ability to not only heighten awareness, but also to ultimately make positive behavioral changes.
In order to continue to raise awareness and change driving attitudes and behaviors, the safe driving messages need to be perpetuated through traditional media vehicles (TV, radio, print, outdoor, digital) as well as through social media throughout the year. Social media has become a key part of the highway safety campaigns, increasing awareness and conversation about safe driving, complementing PSA distributions and helping to spread campaign messages virally. Social media efforts will continue through mainstream platforms such as Facebook and Twitter, Instagram and Vine. Dynamic Message Boards (DMS) statewide help promote campaign awareness by alerting the traveling public to enforcement efforts.

Public Information and Education
44
Other Funding Sources, Documents and Data to Achieve Goals The Public Information Subcommittee of the Missouri Coalition for Roadway Safety (MCRS) has been instrumental in increasing public education and information on traffic safety issues. The subcommittee develops an annual statewide media plan; has identified ARRIVE ALIVE as the overarching message for the coalition’s public information activities; and manages the saveMOlives.com website to grab people’s attention and convey safety information in the best way possible. The site features eye-catching graphics, intriguing videos, news and information, driving tips and advice on how to Arrive Alive at your destination.
Other Performance Measure Goals 1. Promote Missouri’s traffic safety issues to improve understanding and increase
compliance with state traffic laws, thereby reducing fatalities and serious injuries.

Speed Management
45
Speed Management
Problem Identification Aggressive driving can be any one of us, when we make the choice to drive over the speed limit; change lanes several times in a short distance and/or follow too closely. Aggressive driving is a costly decision, often made in an instant, but can have lifelong consequences. According to the National Highway Traffic Safety Administration, aggressive driving is when an individual commits a combination of moving traffic offenses so as to endanger other persons or property. During the last five years, the combination of aggressive driving behaviors contributed to 53 percent of fatalities and 46 percent of serious injuries in Missouri. Speed-related conditions, including exceeding the speed limit and too fast for conditions, accounted for the most fatalities of all aggressive driving behaviors. Nearly 37 percent of all Missouri fatalities over the last five years were speed-related.
Other Funding Sources, Documents and Data to Achieve Goals The Missouri Coalition for Roadway Safety will continue to be instrumental in helping to reduce the number of fatalities and serious injuries by providing funding support for aggressive driving projects.
Other Performance Measure Goals/Projections 1. Based on an annual average increase of 2.53 percent in aggressive driving related
fatalities from 2012 to 2017, Missouri is projecting 482.3 five-year average aggressive driving related fatalities by December 31, 2019.
Impaired Driving
46
Impaired Driving (Drug and Alcohol) Problem Identification Substance-impaired drivers contributed to 25.6 percent of Missouri’s traffic crash fatalities during the past five years. Alcohol remains the primary contributor to substance-impaired driving crashes; however, the number of persons under the influence of prescription medications and/or illicit drugs continues to increase. Male drivers were more likely than females to be involved in substance-impaired driving crashes. During the past five years, males were responsible for 82.4 percent of substance-impaired driving fatalities. Ten percent of the children less than 15 years of age who were killed in motor vehicle crashes over the last five years, were riding with a substance-impaired driver.
Other Funding Sources, Documents and Data to Achieve Goals The Missouri Coalition for Roadway Safety will continue to be instrumental in helping to reduce the number of fatalities and serious injuries by providing funding support for alcohol-impaired driving projects. The Statewide Substance Impaired Driving Strategic plan was approved by the Statewide Substance Impaired Driving Subcommittee in June of 2017 and continues to play a vital role in prioritizing the projects of the impaired driving program.
Other Performance Measure Goals/Projections 1. Decrease alcohol-impaired driving involved serious injuries by 7.51 percent annually,
resulting in a five-year average alcohol-impaired driving involved fatality goal of 505.1 by December 31, 2019.
Occupant Protection
47
Occupant Protection (Adult and Child Passenger)
Problem Identification During 2012-2016, 64.3 percent of drivers and occupants killed in crashes in Missouri were unrestrained. The number of unrestrained teens killed in Missouri crashes during the last five years is even higher – 74.7 percent. When analyzing only the pickup truck drivers and occupants, 77.8 percent of those killed during the last five years were unrestrained. Missouri’s observed safety belt use rate of 84 percent in 2017 is well below the national average of 90 percent. Missouri conducts a statewide observational safety belt survey annually, a teen safety belt survey biennially, and a child passenger and commercial motor vehicle safety belt use survey alternately when funds are available.
The child safety seat and commercial motor vehicle driver safety belt use surveys are conducted periodically. Teen safety belt use is of particular concern. This group’s safety belt use was 11 percent lower than the 2016 overall use rate. Properly wearing a safety belt or using a child restraint is the single most effective way to prevent death and reduce injuries in a crash. According to the National Highway Traffic Safety Administration, safety restraint systems, when utilized correctly, reduce the risk of fatal injuries to front-seat passenger vehicle occupants by 45 percent and reduce the risk of moderate-to-critical injuries by 50 percent. For occupants of light trucks, using safety belts lower the risk of fatal injuries by 60 percent and moderate-to-critical injuries by 65 percent.
Other Funding Sources, Documents and Data to Achieve Goals The Missouri Coalition for Roadway Safety will continue to be instrumental in helping to reduce the number of fatalities and serious injuries by providing funding support for unrestrained occupant projects. Input from the 2014 assessment was used to develop the Occupant Protection Strategic Plan. Missouri conducted a NHTSA-facilitated Occupant Protection Program Assessment February 13-17, 2017. Input from the 2017 assessment was used to update the Occupant Protection Strategic Plan. Mike Stapp has been designated as the occupant protection coordinator and plays a vital part on the Occupant Protection Subcommittee which helps guide the program in meeting its yearly goals.
Occupant Protection
48
Other Performance Measure Goals/Projections 1. Increase statewide observed seat belt use of front seat outboard occupants in
passenger vehicles 1 percentage point annually from the 2017 calendar base year rateof 84% to 86% by December 31, 2019.

Distracted Drivers
49
Distracted Driving
Problem Identification Distracted driving is a diversion of the driver’s attention from activities critical to safe driving. There is a growing body of evidence which suggests driver distractions, both inside and outside of the vehicle, are becoming increasingly large contributors to traffic crashes. While many drivers drive distracted, it is difficult for law enforcement to determine after a crash. Without specifically checking cell phone records (which requires a warrant), a crash is often attributed to other circumstances. A 2011 study (Crashes Involving Cell Phones) by the National Safety Council found that cell phone usage may be underreported by as much as 50 percent. It is estimated that drivers engage in a secondary task between one-quarter and one-half of the time they drive. According to a recent Naturalistic Driving study by Virginia Tech Transportation Institute, a risk for being involved in a critical incident is 23 times greater if the driver texts while driving. During the last five years (2012-2016), 10 percent of Missouri fatal crashes involved a distracted driver. Twenty-five percent of the distracted drivers involved in fatal crashes in the last five years were between 15 and 24 years of age.
Prior Year Performance Distracted driving projects funded by the Highway Safety Office include all behaviors that take a drivers attention away from the driving task, including but not limited to, cell phones, GPS, eating, passengers and driving while drowsy. There were 97 distracted driving fatalities in 2016, with a 2012-2016 moving average of 83.8; thereby meeting the 2014-2018 moving average goal of 86.8 by 2017. The Highway Safety office will continue to encourage law enforcement to conduct high visibility enforcement looking for distracted drivers through the HMV grants. Teen and adult education will also continue in the area using school presentations and media campaigns.
Other Funding Sources, Documents and Data to Achieve Goals The Missouri Coalition for Roadway Safety will continue to be instrumental in helping to reduce the number of fatalities and serious injuries by providing funding support for distracted driving projects.
Other Performance Measure Goals/Projections 1. Decrease distracted driving involved fatalities by 1.41 percent annually, resulting in a
five-year average distracted driving involved fatality goal of 86.5 by December 31, 2019. 2. Decrease distracted driving involved serious injuries by 4.56 percent annually, resulting
in a five-year average distracted driving involved serious injury goal of 605.4 by December 31, 2019.
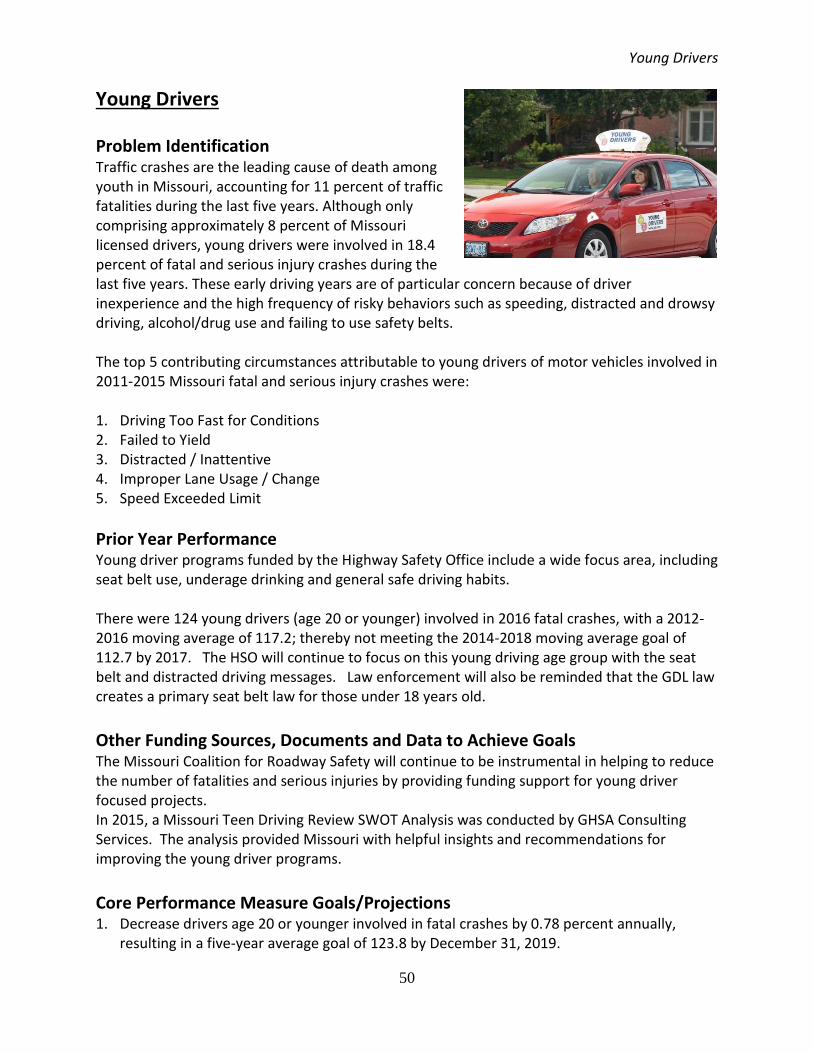
Young Drivers
50
Young Drivers
Problem Identification Traffic crashes are the leading cause of death among youth in Missouri, accounting for 11 percent of traffic fatalities during the last five years. Although only comprising approximately 8 percent of Missouri licensed drivers, young drivers were involved in 18.4 percent of fatal and serious injury crashes during the last five years. These early driving years are of particular concern because of driver inexperience and the high frequency of risky behaviors such as speeding, distracted and drowsy driving, alcohol/drug use and failing to use safety belts.
The top 5 contributing circumstances attributable to young drivers of motor vehicles involved in 2011-2015 Missouri fatal and serious injury crashes were:
1. Driving Too Fast for Conditions2. Failed to Yield3. Distracted / Inattentive4. Improper Lane Usage / Change5. Speed Exceeded Limit
Prior Year Performance
Young driver programs funded by the Highway Safety Office include a wide focus area, including seat belt use, underage drinking and general safe driving habits.
There were 124 young drivers (age 20 or younger) involved in 2016 fatal crashes, with a 2012-2016 moving average of 117.2; thereby not meeting the 2014-2018 moving average goal of 112.7 by 2017. The HSO will continue to focus on this young driving age group with the seat belt and distracted driving messages. Law enforcement will also be reminded that the GDL law creates a primary seat belt law for those under 18 years old.
Other Funding Sources, Documents and Data to Achieve Goals
The Missouri Coalition for Roadway Safety will continue to be instrumental in helping to reduce the number of fatalities and serious injuries by providing funding support for young driver focused projects. In 2015, a Missouri Teen Driving Review SWOT Analysis was conducted by GHSA Consulting Services. The analysis provided Missouri with helpful insights and recommendations for improving the young driver programs.
Core Performance Measure Goals/Projections
1. Decrease drivers age 20 or younger involved in fatal crashes by 0.78 percent annually,resulting in a five-year average goal of 123.8 by December 31, 2019.
Young Drivers
51
Other Performance Measure Goals/Projections 1. Decrease drivers age 20 or younger involved in serious injury crashes by 3.71 percent
annually, resulting in a five-year average goal of 757.8 by December 31, 2019.

Older Drivers
52
OLDER DRIVERS 65 YEARS OF AGE AND OVER Continuing to drive safely and enjoying alternative transportation means enhanced mobility and independence for older adults in Missouri. These factors heavily influence the quality of life for older adults and their friends and families. Statewide data reveals that the number of Missourians age 65 or over is projected to grow exponentially during the next 13 years, bringing the total number of older adults to an estimated 1.4 million (source: Missouri Office of Administration). This represents an 87 percent increase in older adults since the year 2000. This is not surprising given that across the nation 10,000 people will turn 65 every day through 2030. Statewide, adults 65 and over will make up more than 21 percent of the population by 2030. Many Missouri counties can expect 1 in 4 of their residents to be 65 or over at that time. Missourians are living longer and desire to remain active in the community, which means there is a need to maintain independence and mobility; however, medical conditions that may impair driving ability become more likely in older age. Whether older adults have the capacity to meet their transportation needs is often measured by how many hold a valid driver license. In 2018, 882,634 people age 65 or older held a Missouri driver license. They accounted for 19 percent of the 4,480,170 persons licensed in the state (source: Missouri Department of Revenue). During the years of 2012 – 2016, 836 drivers over 65 years old were involved in fatal car crashes. Additionally, as people age, fitness-to-drive (the ability to drive safely) can be compromised by changes in vision, movement, thinking and memory, or even use of certain medications. These risks increase in advanced older age, as does the risk of injury when a crash does occur. Our society is highly mobile. In some areas of the state, driving may be one of the few means of transportation, and the car remains important to many older Missourians. Although cars today are safer, new technology takes time to be incorporated into the overall vehicle fleet.
Prior Year Performance The older driver programs conducted through Highway Safety funding have involved training for drivers, caregivers, family members and medical staff; development and research on screening/assessment tools; and public education of resources available. Focus has also been placed on establishing the correlation between performance of the Traffic Sign Naming Test and the on-road driver license testing. These research projects have proven to be beneficial to healthcare providers in assessing and advising neurologically-impaired drivers and their families about the option of returning safely to driving or adjusting to being a non-driver in the short- or long-term. In 2016, there were 209 fatalities involving an older driver, with a 2012-2016 moving average of 173.2; thereby meeting the 2014-2018 moving average goal of 189.1 by 2017. In 2016, there

Older Drivers
53
were 744 serious injuries involving an older driver, with a 2012-2016 moving average of 741.6; thereby not meeting the 2014-2018 moving average goal of 726 by 2017. Missouri plans to continue to reach the older driver population with outreach from Safe Communities programs conducting Fitness to Drive and the research and training conducted to the older drivers and families to assess driving ability and encourage driving retirement when needed.
Other Funding Sources, Documents and Data to Achieve Goals The Missouri Coalition for Roadway Safety will continue to be instrumental in helping to reduce the number of fatalities and serious injuries by providing funding support for aggressive driving projects.
Other Performance Measure Goals/Projections 1. Based on an annual average increase of 5.63 percent in older driver involved fatalities
from 2012 to 2017, Missouri is projecting 196.9 five-year average older driver involved fatalities by December 31, 2019.
2. Decrease older driver involved serious injuries by 0.94 percent annually, resulting in a five-year average older driver involved serious injury goal of 734.5 by December 31, 2019.

Commercial Motor Vehicles
54
Commercial Motor Vehicles
Problem Identification Commercial motor vehicles make up approximately 20 percent of all traffic on Missouri interstates. Between 2012 and 2016, CMVs were involved in 8.8 percent of all traffic crashes, 13.6 percent of fatal traffic crashes, and 7.8 percent of serious injury crashes in Missouri. It’s a common misconception that the CMV driver is usually responsible for the crash. During the last five years, when analyzing the known CMV drivers involved in fatal and serious injury crashes, 56.7 percent had no contributing circumstance to the crashes.
The Motor Carrier Safety Assistance Program (MCSAP) is a federal grant program that provides financial assistance to states to reduce the number and severity of crashes and hazardous materials incidents involving commercial motor vehicles. The goal of the MCSAP is to reduce CMV involved crashes, fatalities, and injuries through consistent, uniform and effective CMV safety programs. Investing grant monies in appropriate safety programs will increase the likelihood that safety defects, driver deficiencies, and unsafe motor carrier practices will be detected and corrected before they become contributing factors to crashes. The Traffic and Highway Safety Division administers MCSAP, but the MCSAP program operates under a separate federal grant. Goals, benchmarks and strategies are outlined within the Commercial Vehicle Safety Plan (CVSP), which is submitted to the Federal Motor Carrier Safety Administration.
Goals, benchmarks and strategies are outlined within the Commercial Vehicle Safety Plan (CVSP), which is submitted to the Federal Motor Carrier Safety Administration.

Motorcycle Crashes
55
Motorcycle Safety
Problem Identification A motorcycle is inherently more difficult to operate than a passenger vehicle, requiring more physical skill and offering riders almost no protection in a crash. Between 2012 and 2016 in Missouri, motorcycle operators were involved in 481 fatalities. Of those 481 fatalities, 448 were the motorcycle drivers and/or riders. Motorcycles currently represent 2 percent of the registered vehicles in Missouri but were involved in 12.1 percent of all fatal traffic crashes during the last five years (2012-2016).
An area of particular concern is the number of unlicensed and improperly licensed motorcycle operators involved in crashes. Between 2012 and 2016, 39.7 percent of the motorcycle involved fatalities involved an unlicensed or improperly licensed motorcycle operator.
Prior Year Performance Projects funded by the Highway Safety Office in the motorcycle safety program area focus on driver awareness and motorcyclist safety. There were 127 motorcyclist fatalities in 2016, with a 2012-2016 moving average of 98.6; thereby meeting the 2014-2018 moving average goal of 106.4 by 2017. There were 15 unhelmeted fatalities in 2016, with a 2012-2016 moving average of 9.0; thereby not meeting the 2014-2018 moving average goal of 8.9 by 2017. The 2016 goal for unhelmeted fatalities used in the 2016 Annual Report included non-DOT compliant helmeted motorcyclists. The Highway Safety Office will continue its efforts to encourage drivers to always be aware of their surroundings and Watch for Motorcycles. Funding will also be used for media efforts for both motorcyclists and vehicle drivers.
Other Funding Sources, Documents and Data to Achieve Goals The Missouri Coalition for Roadway Safety will continue to be instrumental in helping to reduce the number of fatalities and serious injuries by providing funding support for motorcycle safety projects.
Core Performance Measure Goals/Projections
1. Based on an annual average increase of 2.12 percent in motorcyclist fatalities from 2012to 2017, Missouri is projecting 115.3 five-year average motorcyclist fatalities byDecember 31, 2019.
2. Based on an annual average increase of 11.11 percent in unhelmeted motorcyclistfatalities from 2012 to 2017, Missouri is projecting 13.8 five-year average unhelmetedmotorcyclist fatalities by December 31, 2019.

Motorcycle Crashes
56
Other Performance Measure Goals/Projections 1. Based on an annual average increase of 6.09 percent in serious injuries involving
unlicensed/improperly licensed motorcycle operators from 2012 to 2017, Missouri is projecting 45.5 five-year average serious injuries involving unlicensed/improperly licensed motorcycle operators by December 31, 2019.

School Buses
57
School Bus Safety Problem Identification According to the U.S. Department of Transportation, school buses are the safest mode of transportation for getting children back and forth to school. They are designed to be safer than passenger vehicles. However, there are still school bus related fatalities and serious injuries that occur. From 2012 through 2016, there were 12 fatalities and 87 serious injuries involving school buses. Of those 99 fatalities and serious injuries, 31 were occupants of school buses; four were pedestrians, one was a bicyclist, and 63 were drivers and occupants of other vehicles.
Prior Year Performance There was 1 fatality involving school buses in 2016, with a 2012-2016 moving average of 0.2;
thereby meeting the 2014-2018 moving average goal of 10.6 by 2017.
Other Funding Sources, Documents and Data to Achieve Goals The Missouri Coalition for Roadway Safety will continue to be instrumental in helping to reduce the number of fatalities and serious injuries by providing funding support for school bus projects.
Other Performance Measure Goals/Projections 1. Based on an annual average increase of 13.33 percent in school bus/school bus signal
involved fatalities from 2012 to 2017, Missouri is projecting 2.4 five-year average school bus/school bus signal involved fatalities by December 31, 2019.
2. Decrease school bus/school bus signal involved serious injuries by 4.0 percent annually, resulting in a five-year average school bus/school bus signal involved serious injury goal of 14.7 by December 31, 2019.
Education Countermeasures The Highway Safety office continues membership of the Statewide School Bus Task Force. The Task Force is responsible for developing strategies for improving school bus safety, analyzing current state and federal laws and programs, reviewing the issue of seat belts in school buses, recommending legislation and recommending best practices or policies to be implemented by state or local governments to enhance school bus safety.
Non-Motorized
58
Non-Motorized (Pedestrians and Bicyclists)
Pedestrians Problem Identification Walking is an essential transportation mode for many Missourians. For transit or motor vehicle users, every trip begins and ends as a pedestrian. Public health, economic, and environmental factors are elevating the importance of this mode. Many Missourians do not have access to a personal vehicle, are not physically capable of driving, simply decide not to drive, or delay licensure. Across Missouri, communities are responding with changes to land-use development practices and complete streets policies. Many of the urban areas like St. Louis, Kansas City, Springfield and Columbia have robust pedestrian networks. Motor vehicle crashes involving pedestrians do not occur in extremely large numbers, but when a pedestrian is involved in a traffic crash, the potential for injury or death is much greater. From 2012 through 2016, pedestrian involved crashes comprised less than 1 percent of all crashes, but accounted for 10.4 percent of all fatalities and 5.2 percent of all serious injuries in Missouri. Pedestrian age and vehicle speed are the two most significant factors determining the outcome of a crash. This is especially true for children and older pedestrians. Research shows that pedestrians hit by a vehicle traveling 20 mph have a 5 percent chance of death, whereas those struck at 40 mph have an 85 percent chance of death. Pedestrian trips are a larger percentage of all trips in the urbanized areas of the state. Of the 2012-2016 Missouri pedestrian fatalities, 75.8 percent occurred in urban areas and 24.2 percent occurred in rural areas. The Vision Zero approach to traffic safety, which began in Sweden and has now been adopted in Missouri, views traffic deaths and serious injuries as preventable not inevitable. When evaluating pedestrian crashes in Missouri, it is important to know how a pedestrian is defined. The general perception of a pedestrian is an individual who has chosen walking as their preferred mode of transportation. For the purposes of traffic safety, the definition is broader and includes anyone on foot or using a wheelchair. For example, a person who intentionally exits a vehicle and then is struck by another vehicle is considered a pedestrian.
Non-Motorized
59
Core Performance Measure Goals/Projections
1. Based on an annual average increase of 3.33 percent in pedestrian fatalities from 2012
to 2017, Missouri is projecting 100.8 five-year average pedestrian fatalities by December
31, 2019.
Bicyclists Problem Identification Bicycling is an essential transportation mode for many Missourians. Public health, economic, and environmental factors are elevating the importance of this mode. Across Missouri, communities are responding with changes to land-use development practice and complete streets policies. Many of the urban areas like St. Louis, Kansas City, Springfield and Columbia have robust bicycling networks. While bicycling is a safe and healthy mode of travel, potential crashes with motorized vehicles make these road users vulnerable to serious injury or death if struck. Between 2012 and 2016, cyclists made up .08 percent (32 of 4,164) of the total statewide fatalities. Between 2012 and 2016, only one of the 25 Missouri bicycle fatalities was female. The Vision Zero movement in some cities has led to grassroots change in how roadway deaths are viewed crashes involving pedestrians and bicyclists are preventable.
Other Funding Sources, Documents and Data to Achieve Goals The Missouri Coalition for Roadway Safety will continue to be instrumental in helping to reduce the number of fatalities and serious injuries by providing funding support for bicycle safety projects.
Core Performance Measure Goals/Projections
1. Based on an annual average increase of 10.00 percent in bicyclist fatalities from 2012 to
2017, Missouri is projecting 9.4 five-year average bicyclist fatalities by December 31,
2019.

Engineering Services
60
Roadway Safety/Traffic Engineering
Problem Identification Engineering is a vital component of a comprehensive approach to improve highway safety. The techniques and strategies engineers use to design and improve roads can have a direct impact on the safety of motorists. Engineering countermeasures to improve safety can be implemented during the design of a roadway or in modifications after a road has already been built. During design, engineers strive to create a roadway environment that mitigates traffic crashes from the start. This can be achieved in various aspects of design: lane widths, the use of shoulders, curve design, signing, striping, rumble strips, etc. However, some roads were designed long before today’s safety countermeasures were discovered. As a result, many roads will often be retrofitted to include safety enhancements such as rumble strips, brighter signs and pavement marking, and intersection improvements. One of the most successful examples of this in Missouri is the addition of paved shoulders and rumble stripes on most of Missouri’s most heavily traveled roads. Over 10,000 miles of rumble stripes have been installed. This combination of paved shoulders and rumble stripes has proven very beneficial in reducing crashes in which a vehicle leaves its lane or the roadway, one of Missouri’s most common severe crash types. Roundabouts and J-Turn intersections are successful examples of how intersections can be improved to eliminate or greatly reduce right angle crashes, another common severe crash type in Missouri.
Other Funding Sources, Documents and Data to Achieve Goals The Missouri Coalition for Roadway Safety will continue to be instrumental in helping to reduce the number of fatalities and serious injuries by providing funding support, engineering projects and conferences for the engineering community.

Traffic Records
61
Traffic Records
Problem Identification
Traffic Records Coordinating Committee (TRCC) The TRCC plays a role in the creation, approval and evaluation of the data improvement projects. The TRCC consists in developing initial project proposals as well as discusses the proposals openly in the TRCC monthly meetings. The TRCC through the discussion of proposed projects, prioritize the projects and determine the funding sources, and also works with the custodial agencies to develop and maintain the data quality reporting function.
The Missouri Traffic Records System works towards a formal data quality program with performance indicators for each of the six core system areas. Projects are selected based on recommendations from the most current assessments and their ability to meet six characteristics: timeliness, accuracy, integration, uniformity, accessibility and completeness.
These projects are evaluated on an annual basis to ensure they are in compliance with project milestones and their ability to improve the state’s traffic records data systems.
Other Performance Measure Goals 1. To assure there is a robust traffic data system available to assist all data users in
development of appropriate traffic safety countermeasures.2. To move forward in upgrading and integrating the data systems used to collect crash
data in the State.
3. To provide adequate training on an annual basis that will support and enhance the ability
of state and local agencies in developing accident countermeasures.

Training, Miscellaneous and Multi-Program
62
Training, Miscellaneous and Multi-Program Projects
Problem Identification While most of the Highway Safety projects fall under obvious program areas, a select few projects are outside the scope of the typical areas. However, these projects are extremely important in keeping people safe on Missouri roadways. Those projects are described in this section.
The Highway Safety Office sponsors training for law enforcement officers, first responders, and other safety advocates on a wide variety of program areas. One area of funding is the prosecutorial services that are necessary to prosecute impaired drivers. Without these services, many impaired drivers would be free to drive impaired.
Another area is railroad crossings; these are often forgotten when thinking of roadway safety. Missouri houses the second and third largest hubs for rail traffic in the nation. While this is a benefit to the state, many drivers feel railroad crossings are a burden to obey. One HSO project focuses on these crossings by assisting law enforcement agencies in enforcing the crossing guard laws of the state. Too many people ignore the crossing guard signs and lose their lives in the process.
Prior Year Performance These projects have been funded for multiple years and have shown an increasing benefit to Missouri.
In 2016, fatalities at highway rail crossings remained virtually the same as 2015 and much higher than 2014, while the number of injuries did the same, however both remain too high.
Two fatalities occurred in 2013 and 2014 each, but seven occurred in 2015 and 2016. Injuries went the opposite direction with 31 and 38 occurring in 2013 and 2014 respectively and 19 and 17 in 2015 and 2016 respectively.
Six people were killed and nine were injured while walking on or along the railroad tracks in 2016, which is a significant decrease from the previous two years, and these numbers have remained constant over the past several years.
Other Funding Sources, Documents and Data to Achieve Goals The Missouri Coalition for Roadway Safety will continue to be instrumental in helping to reduce the number of fatalities and serious injuries by providing funding support for aggressive driving projects.
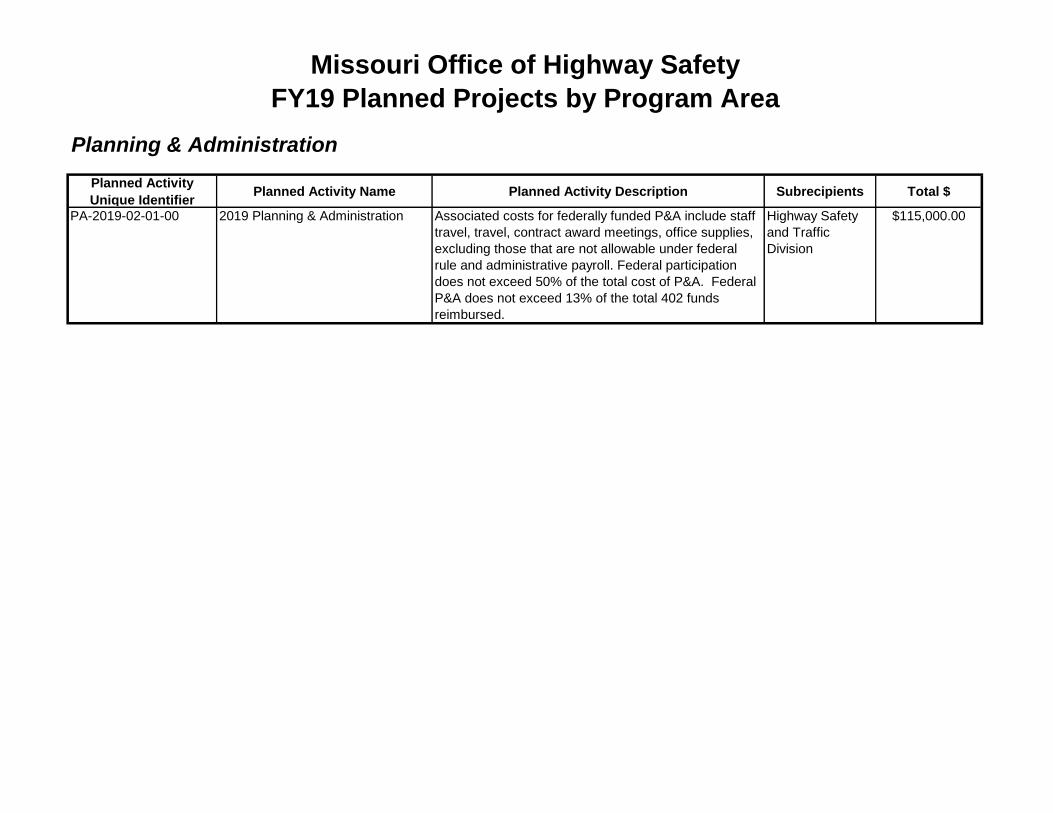
Planning & Administration
Planned Activity
Unique IdentifierPlanned Activity Name Planned Activity Description Subrecipients Total $
PA-2019-02-01-00 2019 Planning & Administration Associated costs for federally funded P&A include staff
travel, travel, contract award meetings, office supplies,
excluding those that are not allowable under federal
rule and administrative payroll. Federal participation
does not exceed 50% of the total cost of P&A. Federal
P&A does not exceed 13% of the total 402 funds
reimbursed.
Highway Safety
and Traffic
Division
$115,000.00
Missouri Office of Highway Safety
FY19 Planned Projects by Program Area
vanlot1
Typewritten Text
Appendix A
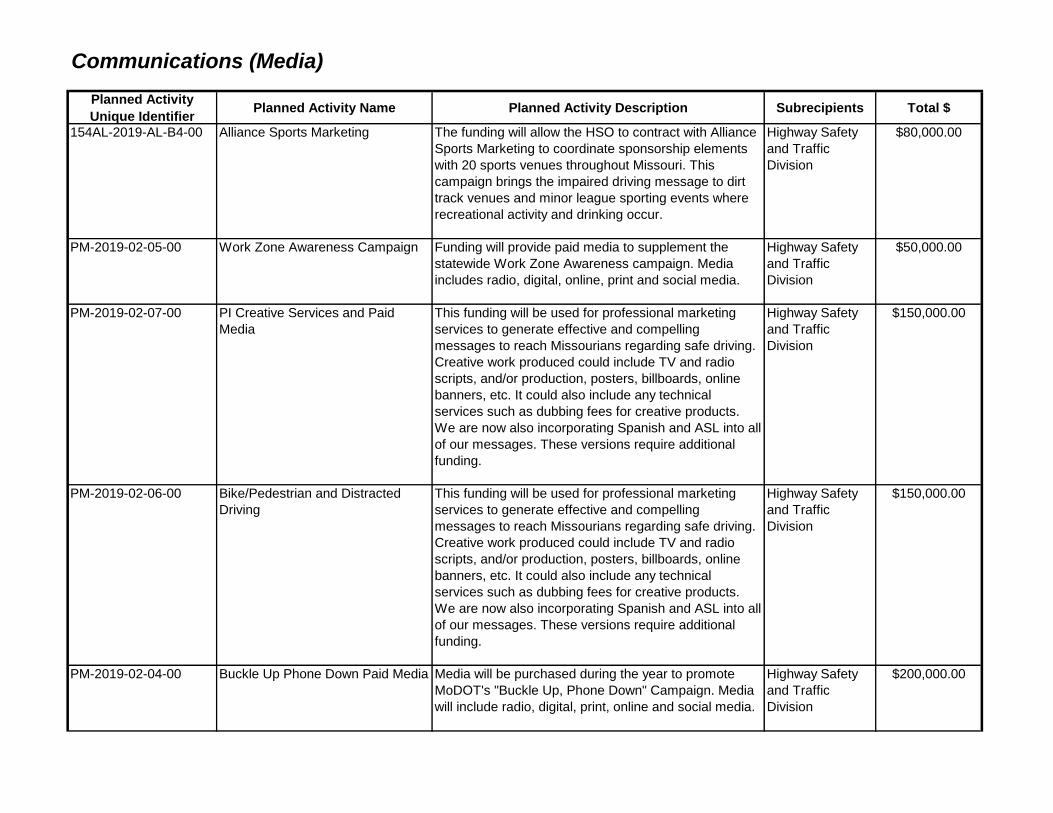
Communications (Media)
Planned Activity
Unique IdentifierPlanned Activity Name Planned Activity Description Subrecipients Total $
154AL-2019-AL-B4-00 Alliance Sports Marketing The funding will allow the HSO to contract with Alliance
Sports Marketing to coordinate sponsorship elements
with 20 sports venues throughout Missouri. This
campaign brings the impaired driving message to dirt
track venues and minor league sporting events where
recreational activity and drinking occur.
Highway Safety
and Traffic
Division
$80,000.00
PM-2019-02-05-00 Work Zone Awareness Campaign Funding will provide paid media to supplement the
statewide Work Zone Awareness campaign. Media
includes radio, digital, online, print and social media.
Highway Safety
and Traffic
Division
$50,000.00
PM-2019-02-07-00 PI Creative Services and Paid
Media
This funding will be used for professional marketing
services to generate effective and compelling
messages to reach Missourians regarding safe driving.
Creative work produced could include TV and radio
scripts, and/or production, posters, billboards, online
banners, etc. It could also include any technical
services such as dubbing fees for creative products.
We are now also incorporating Spanish and ASL into all
of our messages. These versions require additional
funding.
Highway Safety
and Traffic
Division
$150,000.00
PM-2019-02-06-00 Bike/Pedestrian and Distracted
Driving
This funding will be used for professional marketing
services to generate effective and compelling
messages to reach Missourians regarding safe driving.
Creative work produced could include TV and radio
scripts, and/or production, posters, billboards, online
banners, etc. It could also include any technical
services such as dubbing fees for creative products.
We are now also incorporating Spanish and ASL into all
of our messages. These versions require additional
funding.
Highway Safety
and Traffic
Division
$150,000.00
PM-2019-02-04-00 Buckle Up Phone Down Paid Media Media will be purchased during the year to promote
MoDOT's "Buckle Up, Phone Down" Campaign. Media
will include radio, digital, print, online and social media.
Highway Safety
and Traffic
Division
$200,000.00
vanlot1
Typewritten Text
Appendix A

RH-2019-02-01-00 Missouri Operation Lifesaver Operation lifesaver will conduct safety presentations,
Positive Enforcement Efforts, Officer on the Train
programs, and Grade Crossing Collision Investigation
courses across Missouri. Funding will provide safety
materials and supplies, and expenses to conduct the
enforcement.
Missouri
Operation
Lifesaver
$15,000.00
PT-2019-02-69-00 Traffic Safety Informational Initiative The Olivette Police Department will conduct 4-5 traffic
safety informational events. The events will be
conducted in conjunction with other Olivette community
functions to help increase exposure to as many people
as possible. The City of Olivette holds many functions
throughout the year that are attended by not only
Olivette residents but, members of surrounding
communities.
Olivette Police
Dept.
$1,630.49
vanlot1
Typewritten Text
Appendix A

Speed Management
Planned Activity
Unique IdentifierPlanned Activity Name Planned Activity Description Subrecipients Total $
PT-2019-02-00-G0 402 HMV Enforcement This funding will be used to pay for officer overtime, full
time officer salary and fringe, and equipment which
includes radars/lidars, window tint meters, crash
reconstruction total stations, flares and flashlights.
Funding will also be utilized to provide training for law
enforcement in traffic safety countermeasures and
reconstruction.
Arnold Police
Dept., Ballwin
Police Dept.,
Belton Police
Dept., Blue
Springs Police
Dept., Bolivar
Police Dept.,
Boone County
Sheriff's Dept.,
Branson Police
Dept., Buchanan
County Sheriff's
Dept., Butler
County Sheriff's
Office, Callaway
County Sheriff's
Office, Calverton
Park Police Dept.,
Camden County
Sheriff's Office,
Camdenton
Police Dept.,
Cameron Police
Dept., Cape
Girardeau Police
Dept., Cass
County Sheriff's
Office,
Chesterfield
Police Dept.,
Chillicothe Police
Dept., Christian
$2,589,223.57
vanlot1
Typewritten Text
Appendix A
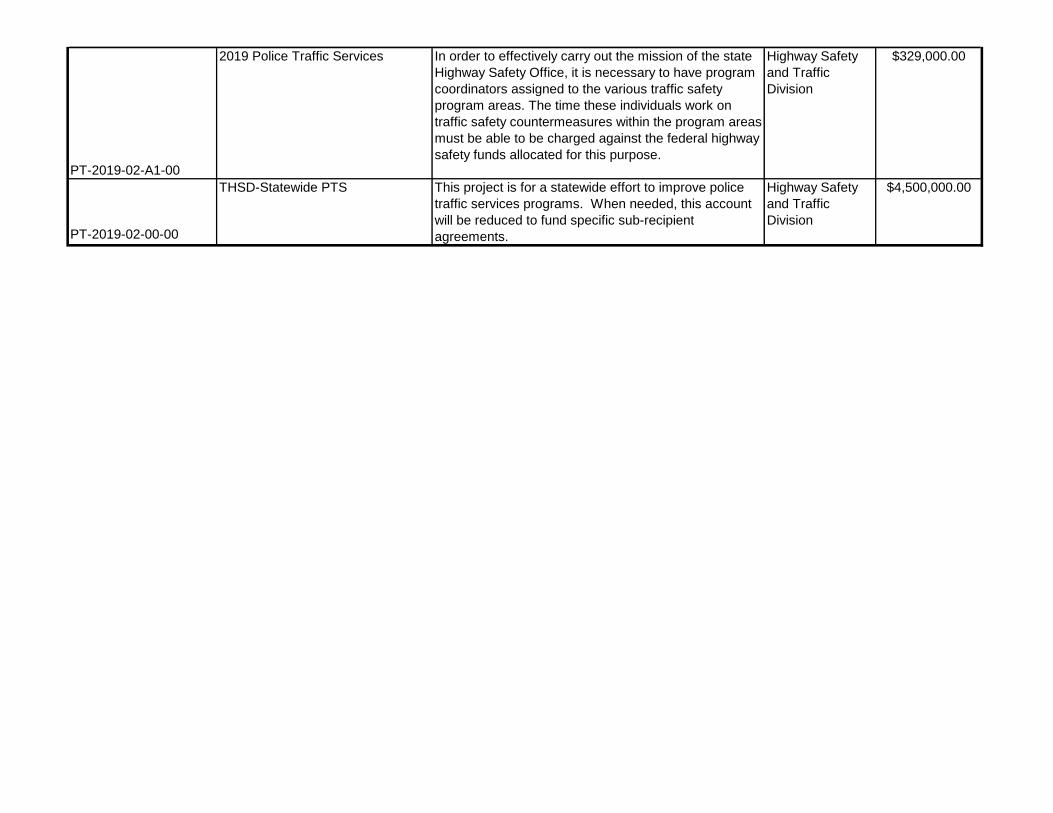
PT-2019-02-A1-00
2019 Police Traffic Services In order to effectively carry out the mission of the state
Highway Safety Office, it is necessary to have program
coordinators assigned to the various traffic safety
program areas. The time these individuals work on
traffic safety countermeasures within the program areas
must be able to be charged against the federal highway
safety funds allocated for this purpose.
Highway Safety
and Traffic
Division
$329,000.00
PT-2019-02-00-00
THSD-Statewide PTS This project is for a statewide effort to improve police
traffic services programs. When needed, this account
will be reduced to fund specific sub-recipient
agreements.
Highway Safety
and Traffic
Division
$4,500,000.00
vanlot1
Typewritten Text
Appendix A
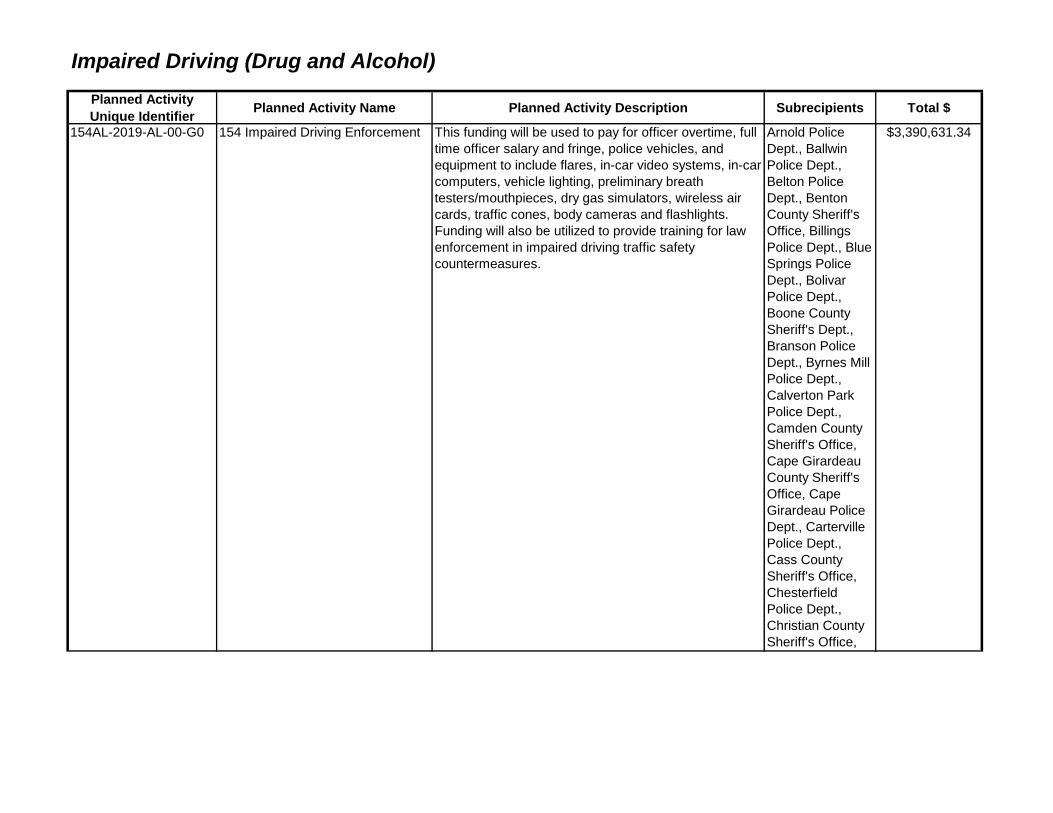
Impaired Driving (Drug and Alcohol)
Planned Activity
Unique IdentifierPlanned Activity Name Planned Activity Description Subrecipients Total $
154AL-2019-AL-00-G0 154 Impaired Driving Enforcement This funding will be used to pay for officer overtime, full
time officer salary and fringe, police vehicles, and
equipment to include flares, in-car video systems, in-car
computers, vehicle lighting, preliminary breath
testers/mouthpieces, dry gas simulators, wireless air
cards, traffic cones, body cameras and flashlights.
Funding will also be utilized to provide training for law
enforcement in impaired driving traffic safety
countermeasures.
Arnold Police
Dept., Ballwin
Police Dept.,
Belton Police
Dept., Benton
County Sheriff's
Office, Billings
Police Dept., Blue
Springs Police
Dept., Bolivar
Police Dept.,
Boone County
Sheriff's Dept.,
Branson Police
Dept., Byrnes Mill
Police Dept.,
Calverton Park
Police Dept.,
Camden County
Sheriff's Office,
Cape Girardeau
County Sheriff's
Office, Cape
Girardeau Police
Dept., Carterville
Police Dept.,
Cass County
Sheriff's Office,
Chesterfield
Police Dept.,
Christian County
Sheriff's Office,
Clark County
$3,390,631.34
vanlot1
Typewritten Text
Appendix A

M5HVE-2019-03-00-G0 405d Impaired Driving Enforcement This funding will be used to pay for officer overtime, full
time officer salary and fringe, police vehicles, and
equipment to include flares, in-car video systems, in-car
computers, vehicle lighting, preliminary breath
testers/mouthpieces, dry gas simulators, wireless air
cards, traffic cones, body cameras and flashlights.
Funding will also be utilized to provide training for law
enforcement in impaired driving traffic safety
countermeasures.
Boone County
Sheriff's Dept.,
Columbia Police
Dept., Greene
County Sheriff's
Office, Highway
Safety and Traffic
Division, Jackson
County Sheriff's
Office, Johnson
County Sheriff's
Dept., Joplin
Police Dept.,
Kearney Police
Dept., Lamar
Police Dept.,
Lee's Summit
Police Dept., MO
State Highway
Patrol, Pettis
County Sheriff's
Office, Platte
County Sheriff's
Office, Smithville
Police Dept.,
Union Police
Dept.,
Waynesville
Police Dept.,
Webb City Police
Dept., Wentzville
Police Dept.
$918,127.31
vanlot1
Typewritten Text
Appendix A

M5TR-2019-03-05-00 Safe Communities/TRACTION
youth impaired
TRACTION -Teens Taking Action to Prevent Traffic
Crashes is a peer-to-peer youth traffic safety
leadership training program. High school students and
advisors are invited to attend one of three training
programs as a school team. The training promotes
safe driving habits for youth and provides students and
their adult advisors with the motivation, information,
skills, and support necessary to develop a plan of
action that addresses impaired driving driving habits
through events and activities to be implemented within
their school and communities the following year. The
funding will provide staff training, supplies, conference
development and travel costs to conduct three
conferences and a one-day workshop.
Cape Girardeau
Safe
Communities
$97,829.65
M5OT-2019-03-05-00 In-house Impaired Driving Project This project will cover activities in the impaired driving
program area including: development and printing
costs; educational programs; travel expenses for
speaking engagements or conferences; supplies for
training programs or educational activities;
assessments; etc.
Highway Safety
and Traffic
Division
$20,000.00
154AL-2019-AL-B5-00 Impaired Driving Paid Media 154 The funding will provide paid media campaigns for
Drive Sober or Get Pulled Over, Youth Alcohol,
Quarterly Impaired Driving Campaigns, and various
other impaired driving efforts for, but not limited to
Super Bowl Sunday, Cinco De Mayo, statewide
festivals, etc. Includes Alcohol Impaired Driving Only.
Highway Safety
and Traffic
Division
$650,000.00
M5PEM-2019-03-01-00 Paid Media Impaired Driving 405D The funding will provide paid media campaigns for
Drive Sober or Get Pulled Over, Youth Alcohol,
Quarterly Impaired Driving Campaigns, and various
other impaired driving efforts for, but not limited to
Super Bowl Sunday, Cinco De Mayo, statewide
festivals, etc. Includes Drug and Alcohol Impaired
Driving messages.
Highway Safety
and Traffic
Division
$750,000.00
M5IDC-2019-03-02-00 2019 405d Mid Impaired Driving
Coord.
Funding will be allocated for coordination activities.
Costs will include salaries, fringe benefits and travel by
highway safety program staff.
Highway Safety
and Traffic
Division
$96,000.00
M5IDC-2019-03-01-00 2019 405d Youth Alcohol
Coordination
Funding will be allocated for coordination activities.
Costs will include salaries, fringe benefits and travel by
highway safety program staff.
Highway Safety
and Traffic
Division
$96,000.00
vanlot1
Typewritten Text
Appendix A
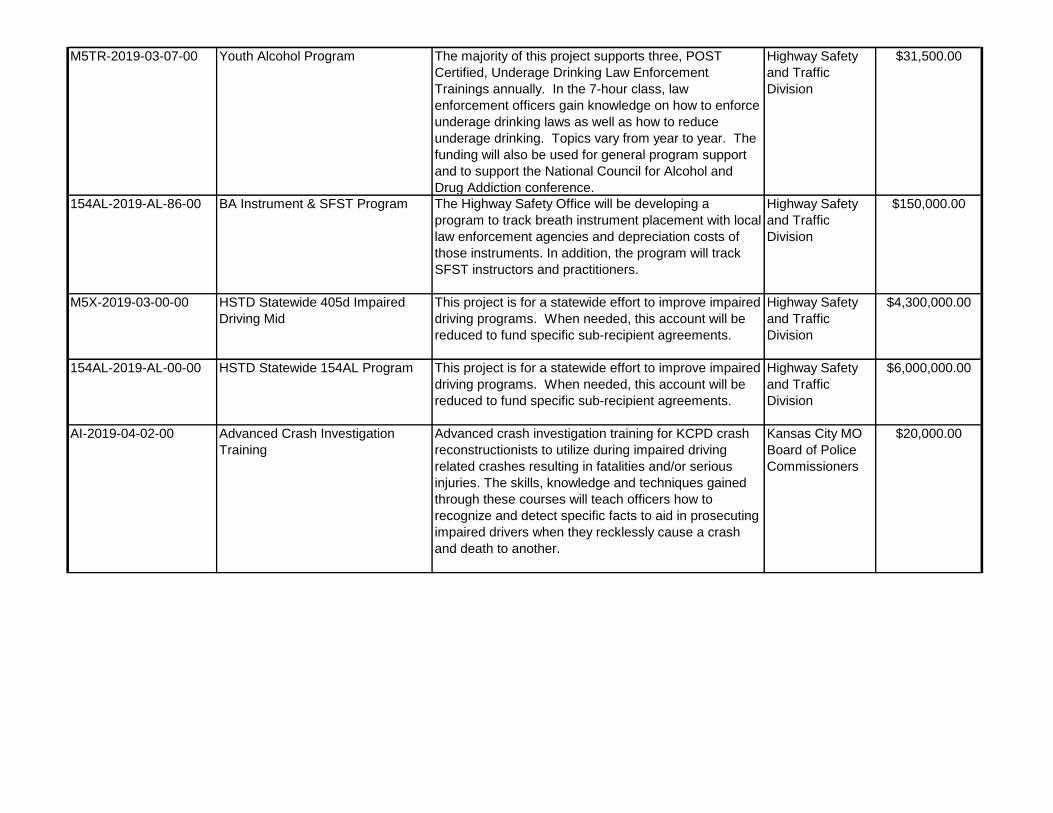
M5TR-2019-03-07-00 Youth Alcohol Program The majority of this project supports three, POST
Certified, Underage Drinking Law Enforcement
Trainings annually. In the 7-hour class, law
enforcement officers gain knowledge on how to enforce
underage drinking laws as well as how to reduce
underage drinking. Topics vary from year to year. The
funding will also be used for general program support
and to support the National Council for Alcohol and
Drug Addiction conference.
Highway Safety
and Traffic
Division
$31,500.00
154AL-2019-AL-86-00 BA Instrument & SFST Program The Highway Safety Office will be developing a
program to track breath instrument placement with local
law enforcement agencies and depreciation costs of
those instruments. In addition, the program will track
SFST instructors and practitioners.
Highway Safety
and Traffic
Division
$150,000.00
M5X-2019-03-00-00 HSTD Statewide 405d Impaired
Driving Mid
This project is for a statewide effort to improve impaired
driving programs. When needed, this account will be
reduced to fund specific sub-recipient agreements.
Highway Safety
and Traffic
Division
$4,300,000.00
154AL-2019-AL-00-00 HSTD Statewide 154AL Program This project is for a statewide effort to improve impaired
driving programs. When needed, this account will be
reduced to fund specific sub-recipient agreements.
Highway Safety
and Traffic
Division
$6,000,000.00
AI-2019-04-02-00 Advanced Crash Investigation
Training
Advanced crash investigation training for KCPD crash
reconstructionists to utilize during impaired driving
related crashes resulting in fatalities and/or serious
injuries. The skills, knowledge and techniques gained
through these courses will teach officers how to
recognize and detect specific facts to aid in prosecuting
impaired drivers when they recklessly cause a crash
and death to another.
Kansas City MO
Board of Police
Commissioners
$20,000.00
vanlot1
Typewritten Text
Appendix A
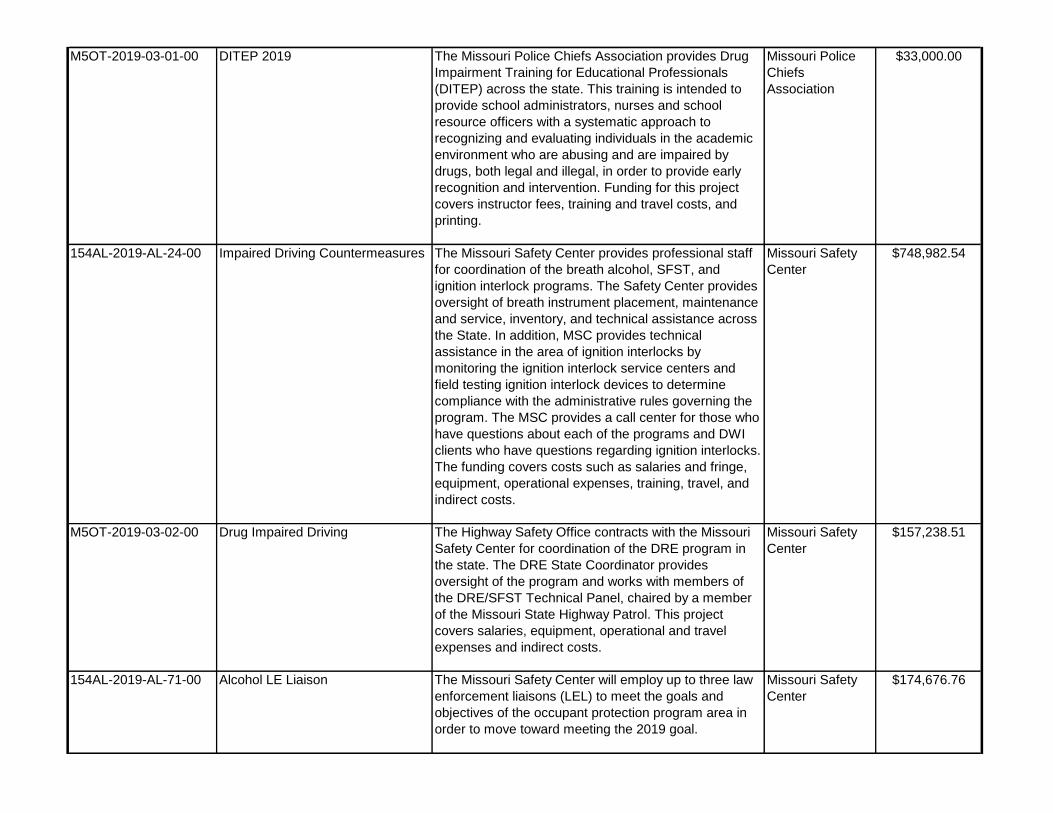
M5OT-2019-03-01-00 DITEP 2019 The Missouri Police Chiefs Association provides Drug
Impairment Training for Educational Professionals
(DITEP) across the state. This training is intended to
provide school administrators, nurses and school
resource officers with a systematic approach to
recognizing and evaluating individuals in the academic
environment who are abusing and are impaired by
drugs, both legal and illegal, in order to provide early
recognition and intervention. Funding for this project
covers instructor fees, training and travel costs, and
printing.
Missouri Police
Chiefs
Association
$33,000.00
154AL-2019-AL-24-00 Impaired Driving Countermeasures The Missouri Safety Center provides professional staff
for coordination of the breath alcohol, SFST, and
ignition interlock programs. The Safety Center provides
oversight of breath instrument placement, maintenance
and service, inventory, and technical assistance across
the State. In addition, MSC provides technical
assistance in the area of ignition interlocks by
monitoring the ignition interlock service centers and
field testing ignition interlock devices to determine
compliance with the administrative rules governing the
program. The MSC provides a call center for those who
have questions about each of the programs and DWI
clients who have questions regarding ignition interlocks.
The funding covers costs such as salaries and fringe,
equipment, operational expenses, training, travel, and
indirect costs.
Missouri Safety
Center
$748,982.54
M5OT-2019-03-02-00 Drug Impaired Driving The Highway Safety Office contracts with the Missouri
Safety Center for coordination of the DRE program in
the state. The DRE State Coordinator provides
oversight of the program and works with members of
the DRE/SFST Technical Panel, chaired by a member
of the Missouri State Highway Patrol. This project
covers salaries, equipment, operational and travel
expenses and indirect costs.
Missouri Safety
Center
$157,238.51
154AL-2019-AL-71-00 Alcohol LE Liaison The Missouri Safety Center will employ up to three law
enforcement liaisons (LEL) to meet the goals and
objectives of the occupant protection program area in
order to move toward meeting the 2019 goal.
Missouri Safety
Center
$174,676.76
vanlot1
Typewritten Text
vanlot1
Typewritten Text
Appendix A
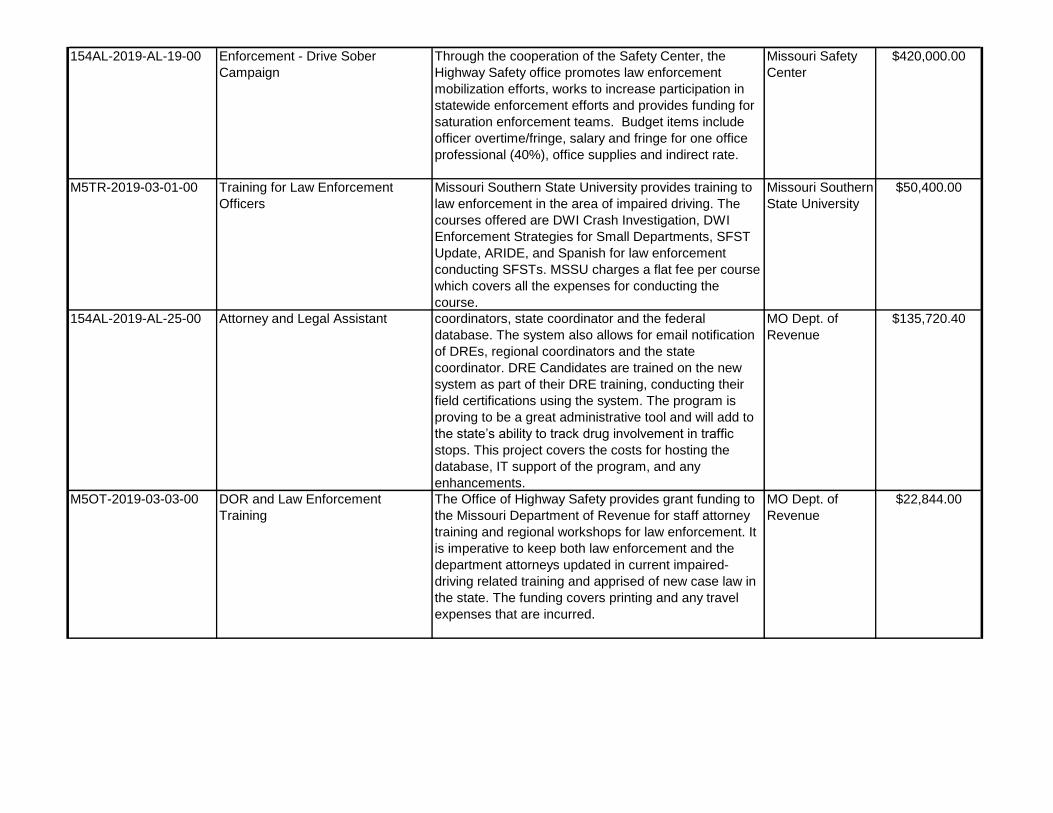
154AL-2019-AL-19-00 Enforcement - Drive Sober
Campaign
Through the cooperation of the Safety Center, the
Highway Safety office promotes law enforcement
mobilization efforts, works to increase participation in
statewide enforcement efforts and provides funding for
saturation enforcement teams. Budget items include
officer overtime/fringe, salary and fringe for one office
professional (40%), office supplies and indirect rate.
Missouri Safety
Center
$420,000.00
M5TR-2019-03-01-00 Training for Law Enforcement
Officers
Missouri Southern State University provides training to
law enforcement in the area of impaired driving. The
courses offered are DWI Crash Investigation, DWI
Enforcement Strategies for Small Departments, SFST
Update, ARIDE, and Spanish for law enforcement
conducting SFSTs. MSSU charges a flat fee per course
which covers all the expenses for conducting the
course.
Missouri Southern
State University
$50,400.00
154AL-2019-AL-25-00 Attorney and Legal Assistant coordinators, state coordinator and the federal
database. The system also allows for email notification
of DREs, regional coordinators and the state
coordinator. DRE Candidates are trained on the new
system as part of their DRE training, conducting their
field certifications using the system. The program is
proving to be a great administrative tool and will add to
the state’s ability to track drug involvement in traffic
stops. This project covers the costs for hosting the
database, IT support of the program, and any
enhancements.
MO Dept. of
Revenue
$135,720.40
M5OT-2019-03-03-00 DOR and Law Enforcement
Training
The Office of Highway Safety provides grant funding to
the Missouri Department of Revenue for staff attorney
training and regional workshops for law enforcement. It
is imperative to keep both law enforcement and the
department attorneys updated in current impaired-
driving related training and apprised of new case law in
the state. The funding covers printing and any travel
expenses that are incurred.
MO Dept. of
Revenue
$22,844.00
vanlot1
Typewritten Text
Appendix A
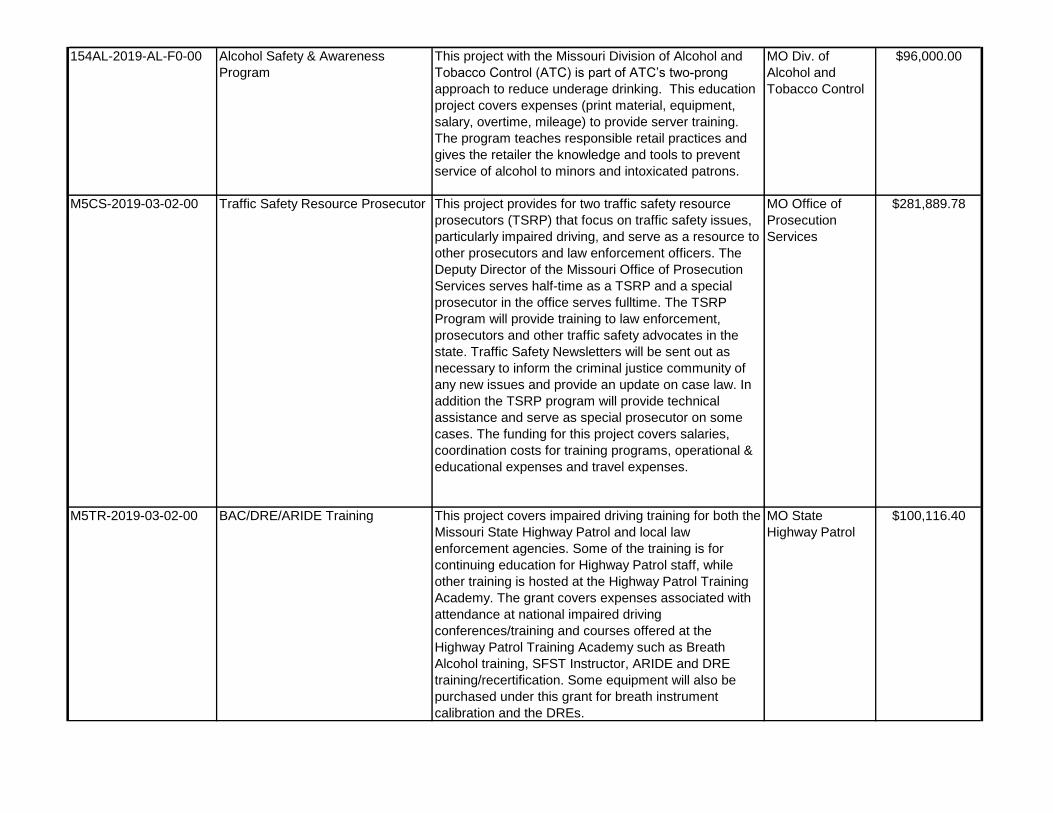
154AL-2019-AL-F0-00 Alcohol Safety & Awareness
Program
This project with the Missouri Division of Alcohol and
Tobacco Control (ATC) is part of ATC’s two-prong
approach to reduce underage drinking. This education
project covers expenses (print material, equipment,
salary, overtime, mileage) to provide server training.
The program teaches responsible retail practices and
gives the retailer the knowledge and tools to prevent
service of alcohol to minors and intoxicated patrons.
MO Div. of
Alcohol and
Tobacco Control
$96,000.00
M5CS-2019-03-02-00 Traffic Safety Resource Prosecutor This project provides for two traffic safety resource
prosecutors (TSRP) that focus on traffic safety issues,
particularly impaired driving, and serve as a resource to
other prosecutors and law enforcement officers. The
Deputy Director of the Missouri Office of Prosecution
Services serves half-time as a TSRP and a special
prosecutor in the office serves fulltime. The TSRP
Program will provide training to law enforcement,
prosecutors and other traffic safety advocates in the
state. Traffic Safety Newsletters will be sent out as
necessary to inform the criminal justice community of
any new issues and provide an update on case law. In
addition the TSRP program will provide technical
assistance and serve as special prosecutor on some
cases. The funding for this project covers salaries,
coordination costs for training programs, operational &
educational expenses and travel expenses.
MO Office of
Prosecution
Services
$281,889.78
M5TR-2019-03-02-00 BAC/DRE/ARIDE Training This project covers impaired driving training for both the
Missouri State Highway Patrol and local law
enforcement agencies. Some of the training is for
continuing education for Highway Patrol staff, while
other training is hosted at the Highway Patrol Training
Academy. The grant covers expenses associated with
attendance at national impaired driving
conferences/training and courses offered at the
Highway Patrol Training Academy such as Breath
Alcohol training, SFST Instructor, ARIDE and DRE
training/recertification. Some equipment will also be
purchased under this grant for breath instrument
calibration and the DREs.
MO State
Highway Patrol
$100,116.40
vanlot1
Typewritten Text
Appendix A
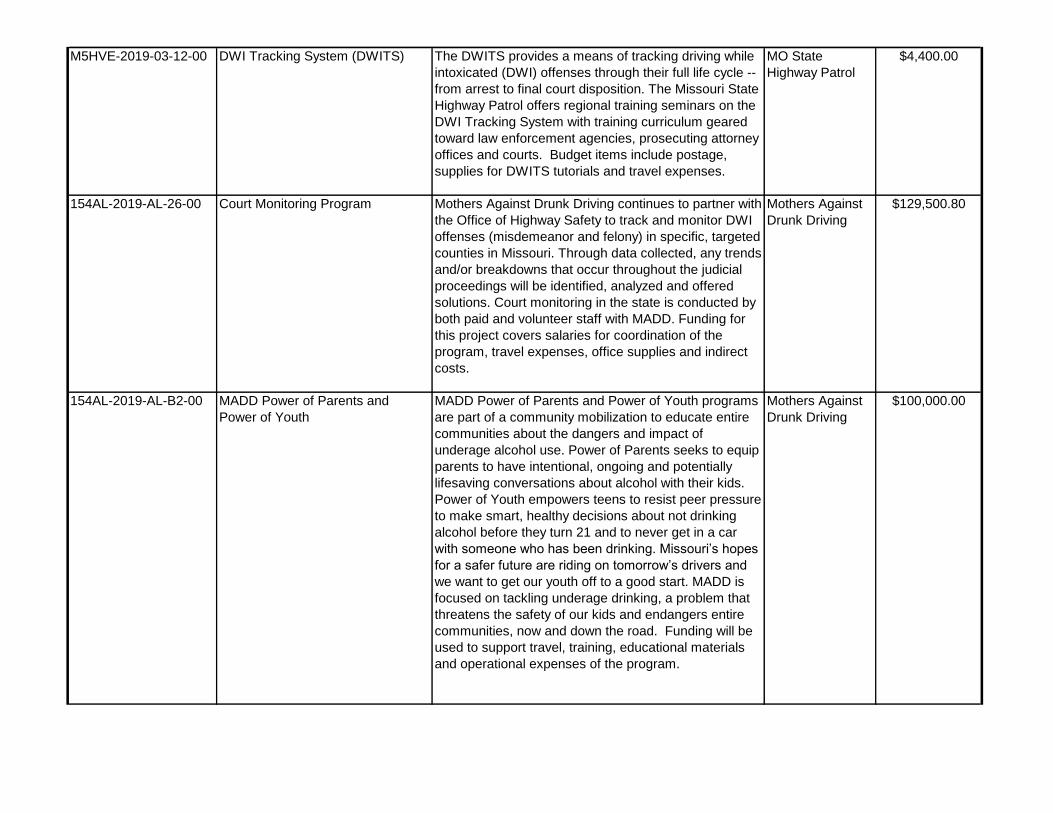
M5HVE-2019-03-12-00 DWI Tracking System (DWITS) The DWITS provides a means of tracking driving while
intoxicated (DWI) offenses through their full life cycle --
from arrest to final court disposition. The Missouri State
Highway Patrol offers regional training seminars on the
DWI Tracking System with training curriculum geared
toward law enforcement agencies, prosecuting attorney
offices and courts. Budget items include postage,
supplies for DWITS tutorials and travel expenses.
MO State
Highway Patrol
$4,400.00
154AL-2019-AL-26-00 Court Monitoring Program Mothers Against Drunk Driving continues to partner with
the Office of Highway Safety to track and monitor DWI
offenses (misdemeanor and felony) in specific, targeted
counties in Missouri. Through data collected, any trends
and/or breakdowns that occur throughout the judicial
proceedings will be identified, analyzed and offered
solutions. Court monitoring in the state is conducted by
both paid and volunteer staff with MADD. Funding for
this project covers salaries for coordination of the
program, travel expenses, office supplies and indirect
costs.
Mothers Against
Drunk Driving
$129,500.80
154AL-2019-AL-B2-00 MADD Power of Parents and
Power of Youth
MADD Power of Parents and Power of Youth programs
are part of a community mobilization to educate entire
communities about the dangers and impact of
underage alcohol use. Power of Parents seeks to equip
parents to have intentional, ongoing and potentially
lifesaving conversations about alcohol with their kids.
Power of Youth empowers teens to resist peer pressure
to make smart, healthy decisions about not drinking
alcohol before they turn 21 and to never get in a car
with someone who has been drinking. Missouri’s hopes
for a safer future are riding on tomorrow’s drivers and
we want to get our youth off to a good start. MADD is
focused on tackling underage drinking, a problem that
threatens the safety of our kids and endangers entire
communities, now and down the road. Funding will be
used to support travel, training, educational materials
and operational expenses of the program.
Mothers Against
Drunk Driving
$100,000.00
vanlot1
Typewritten Text
Appendix A
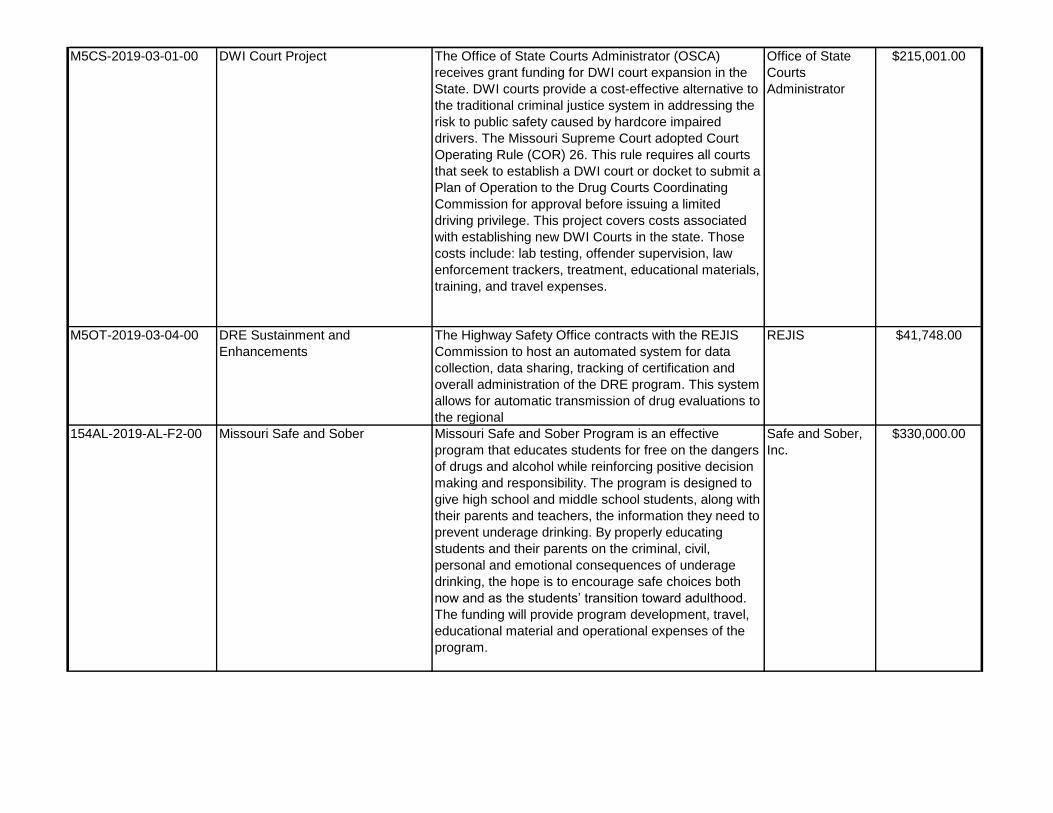
M5CS-2019-03-01-00 DWI Court Project The Office of State Courts Administrator (OSCA)
receives grant funding for DWI court expansion in the
State. DWI courts provide a cost-effective alternative to
the traditional criminal justice system in addressing the
risk to public safety caused by hardcore impaired
drivers. The Missouri Supreme Court adopted Court
Operating Rule (COR) 26. This rule requires all courts
that seek to establish a DWI court or docket to submit a
Plan of Operation to the Drug Courts Coordinating
Commission for approval before issuing a limited
driving privilege. This project covers costs associated
with establishing new DWI Courts in the state. Those
costs include: lab testing, offender supervision, law
enforcement trackers, treatment, educational materials,
training, and travel expenses.
Office of State
Courts
Administrator
$215,001.00
M5OT-2019-03-04-00 DRE Sustainment and
Enhancements
The Highway Safety Office contracts with the REJIS
Commission to host an automated system for data
collection, data sharing, tracking of certification and
overall administration of the DRE program. This system
allows for automatic transmission of drug evaluations to
the regional
REJIS $41,748.00
154AL-2019-AL-F2-00 Missouri Safe and Sober Missouri Safe and Sober Program is an effective
program that educates students for free on the dangers
of drugs and alcohol while reinforcing positive decision
making and responsibility. The program is designed to
give high school and middle school students, along with
their parents and teachers, the information they need to
prevent underage drinking. By properly educating
students and their parents on the criminal, civil,
personal and emotional consequences of underage
drinking, the hope is to encourage safe choices both
now and as the students’ transition toward adulthood.
The funding will provide program development, travel,
educational material and operational expenses of the
program.
Safe and Sober,
Inc.
$330,000.00
vanlot1
Typewritten Text
Appendix A
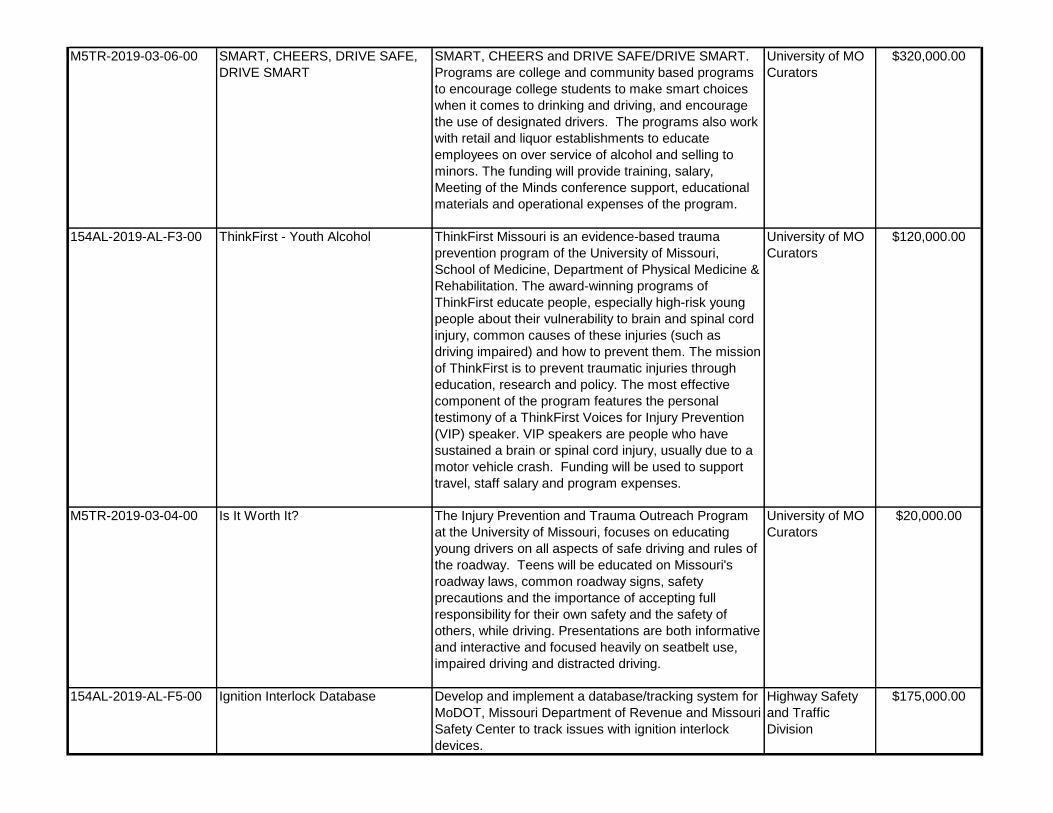
M5TR-2019-03-06-00 SMART, CHEERS, DRIVE SAFE,
DRIVE SMART
SMART, CHEERS and DRIVE SAFE/DRIVE SMART.
Programs are college and community based programs
to encourage college students to make smart choices
when it comes to drinking and driving, and encourage
the use of designated drivers. The programs also work
with retail and liquor establishments to educate
employees on over service of alcohol and selling to
minors. The funding will provide training, salary,
Meeting of the Minds conference support, educational
materials and operational expenses of the program.
University of MO
Curators
$320,000.00
154AL-2019-AL-F3-00 ThinkFirst - Youth Alcohol ThinkFirst Missouri is an evidence-based trauma
prevention program of the University of Missouri,
School of Medicine, Department of Physical Medicine &
Rehabilitation. The award-winning programs of
ThinkFirst educate people, especially high-risk young
people about their vulnerability to brain and spinal cord
injury, common causes of these injuries (such as
driving impaired) and how to prevent them. The mission
of ThinkFirst is to prevent traumatic injuries through
education, research and policy. The most effective
component of the program features the personal
testimony of a ThinkFirst Voices for Injury Prevention
(VIP) speaker. VIP speakers are people who have
sustained a brain or spinal cord injury, usually due to a
motor vehicle crash. Funding will be used to support
travel, staff salary and program expenses.
University of MO
Curators
$120,000.00
M5TR-2019-03-04-00 Is It Worth It? The Injury Prevention and Trauma Outreach Program
at the University of Missouri, focuses on educating
young drivers on all aspects of safe driving and rules of
the roadway. Teens will be educated on Missouri's
roadway laws, common roadway signs, safety
precautions and the importance of accepting full
responsibility for their own safety and the safety of
others, while driving. Presentations are both informative
and interactive and focused heavily on seatbelt use,
impaired driving and distracted driving.
University of MO
Curators
$20,000.00
154AL-2019-AL-F5-00 Ignition Interlock Database Develop and implement a database/tracking system for
MoDOT, Missouri Department of Revenue and Missouri
Safety Center to track issues with ignition interlock
devices.
Highway Safety
and Traffic
Division
$175,000.00
vanlot1
Typewritten Text
Appendix A
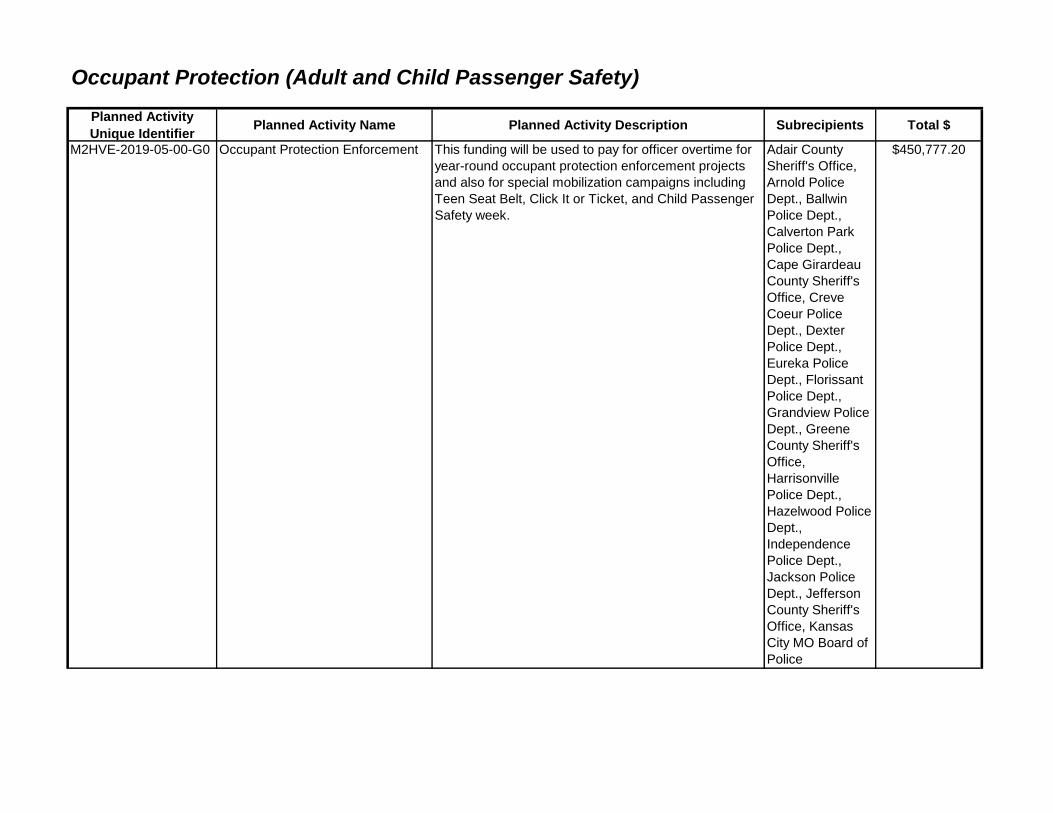
Occupant Protection (Adult and Child Passenger Safety)
Planned Activity
Unique IdentifierPlanned Activity Name Planned Activity Description Subrecipients Total $
M2HVE-2019-05-00-G0 Occupant Protection Enforcement This funding will be used to pay for officer overtime for
year-round occupant protection enforcement projects
and also for special mobilization campaigns including
Teen Seat Belt, Click It or Ticket, and Child Passenger
Safety week.
Adair County
Sheriff's Office,
Arnold Police
Dept., Ballwin
Police Dept.,
Calverton Park
Police Dept.,
Cape Girardeau
County Sheriff's
Office, Creve
Coeur Police
Dept., Dexter
Police Dept.,
Eureka Police
Dept., Florissant
Police Dept.,
Grandview Police
Dept., Greene
County Sheriff's
Office,
Harrisonville
Police Dept.,
Hazelwood Police
Dept.,
Independence
Police Dept.,
Jackson Police
Dept., Jefferson
County Sheriff's
Office, Kansas
City MO Board of
Police
Commissioners,
$450,777.20
vanlot1
Typewritten Text
Appendix A

CR-2019-05-02-00 402 Car Seat Distribution Child passenger safety programs are conducted
statewide focusing on age birth through age 14. Car
seats are distributed through Missouri’s network of
approximately 175 NHTSA registered Inspection
Stations and over 1,000 CPS Technicians to low
income individuals in need of a seat. This program will
help ensure that parents/caregivers properly install
safety seats for young children. Funding will be used
for the purchase of convertible and high back booster
child safety seats.
Highway Safety
and Traffic
Division
$50,000.00
M2CSS-2019-05-01-00 405 Car Seat Distribution Child passenger safety programs are conducted
statewide focusing on age birth through age 14. Car
seats are distributed through Missouri’s network of
approximately 175 NHTSA registered Inspection
Stations and over 1,000 CPS Technicians to low
income individuals in need of a seat. This program will
help ensure that parents/caregivers properly install
safety seats for young children. Funding will be used
for the purchase of convertible and high back booster
child safety seats.
Highway Safety
and Traffic
Division
$49,850.57
M2CPS-2019-05-01-00 CPS Program Training The HSO and Department of Health and Senior
Services are working together to provide support to
individuals who wish to become CPS Technicians.
Grant funding will be provided for training costs and
travel to attend the 3-day CPS Technician training
course. This program will help ensure that
parents/caregivers properly install safety seats for
young children.
Highway Safety
and Traffic
Division
$65,000.00
M2PE-2019-05-02-00 Click it or Ticket Paid Media In order to continue to raise awareness and change
driving attitudes and behaviors, the safe driving
messages need to be perpetuated through traditional
media vehicles (TV, radio, print, outdoor, digital) as well
as through social media throughout the year.
Highway Safety
and Traffic
Division
$200,000.00
CR-2019-05-01-00 CPS Program Activities
Administration
The funding for this project will support the HSO CPS
program, to include training expenses, LATCH
Manuals, and other supplies needed for CPS courses.
Highway Safety
and Traffic
Division
$10,000.00
M2CPS-2019-05-04-00 Child Passenger Safety Campaign Paid media will be used to target parents or care givers
about the importance of properly restraining children as
they travel on Missouri roadways.
Highway Safety
and Traffic
Division
$100,000.00
vanlot1
Typewritten Text
Appendix A
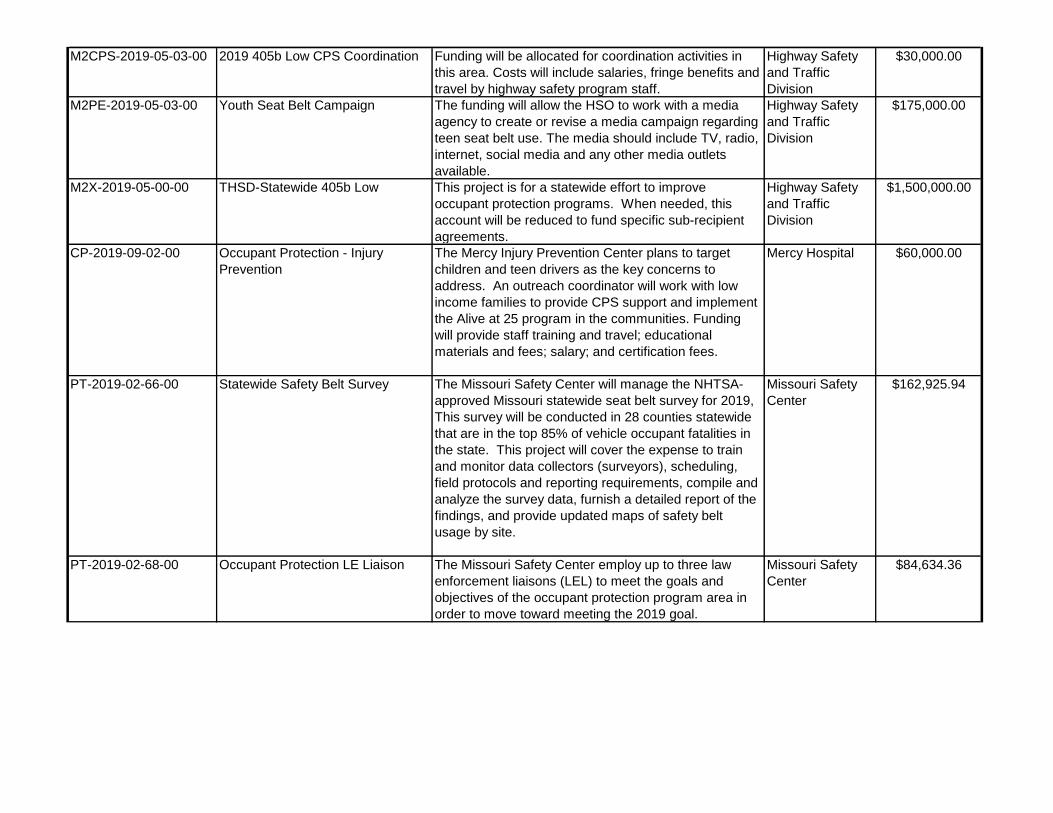
M2CPS-2019-05-03-00 2019 405b Low CPS Coordination Funding will be allocated for coordination activities in
this area. Costs will include salaries, fringe benefits and
travel by highway safety program staff.
Highway Safety
and Traffic
Division
$30,000.00
M2PE-2019-05-03-00 Youth Seat Belt Campaign The funding will allow the HSO to work with a media
agency to create or revise a media campaign regarding
teen seat belt use. The media should include TV, radio,
internet, social media and any other media outlets
available.
Highway Safety
and Traffic
Division
$175,000.00
M2X-2019-05-00-00 THSD-Statewide 405b Low This project is for a statewide effort to improve
occupant protection programs. When needed, this
account will be reduced to fund specific sub-recipient
agreements.
Highway Safety
and Traffic
Division
$1,500,000.00
CP-2019-09-02-00 Occupant Protection - Injury
Prevention
The Mercy Injury Prevention Center plans to target
children and teen drivers as the key concerns to
address. An outreach coordinator will work with low
income families to provide CPS support and implement
the Alive at 25 program in the communities. Funding
will provide staff training and travel; educational
materials and fees; salary; and certification fees.
Mercy Hospital $60,000.00
PT-2019-02-66-00 Statewide Safety Belt Survey The Missouri Safety Center will manage the NHTSA-
approved Missouri statewide seat belt survey for 2019,
This survey will be conducted in 28 counties statewide
that are in the top 85% of vehicle occupant fatalities in
the state. This project will cover the expense to train
and monitor data collectors (surveyors), scheduling,
field protocols and reporting requirements, compile and
analyze the survey data, furnish a detailed report of the
findings, and provide updated maps of safety belt
usage by site.
Missouri Safety
Center
$162,925.94
PT-2019-02-68-00 Occupant Protection LE Liaison The Missouri Safety Center employ up to three law
enforcement liaisons (LEL) to meet the goals and
objectives of the occupant protection program area in
order to move toward meeting the 2019 goal.
Missouri Safety
Center
$84,634.36
vanlot1
Typewritten Text
Appendix A

PT-2019-02-67-00 Occupant Protection Enforcement
Campaign
The Missouri Safety Center (MSC) will manage this
program by encouraging targeted law enforcement
agencies to participate in the State's national CIOT
occupant protection enforcement and special
mobilization efforts. This will be accomplished through
sub-award grants to law enforcement agencies, making
available overtime funds to increase occupant
protection enforcement during the May and June
national CIOT campaign, the teen seat belt campaign
and the CPS campaign. High Visibility Enforcement is a
proven effective strategy used to increase seat belt use.
Missouri Safety
Center
$273,409.80
M2CPS-2019-05-02-00 Child Passenger Safety The DHSS will provide financial support for identified
ambulance services to send personnel to the CPS
technician training by covering the CPS technician
training fee. Each ambulance service will agree to
become a fitting station for a period of three years after
receiving certification.
MO Dept. of
Health and Senior
Services
$23,375.00
SA-2019-09-00-G0 Safe Communities Programs Two safe communities programs throughout the state
focus efforts on seat belt education for all ages. These
programs meet the goals set by the HSO and help to
reduce unrestrained fatalities by focusing on low belt
use areas and groups. Funding for those programs will
support travel expenses, educational material, supplies
and salary.
St. Joseph Safety
& Health Council,
Safety Council of
Greater St. Louis
$80,000.00
vanlot1
Typewritten Text
Appendix A
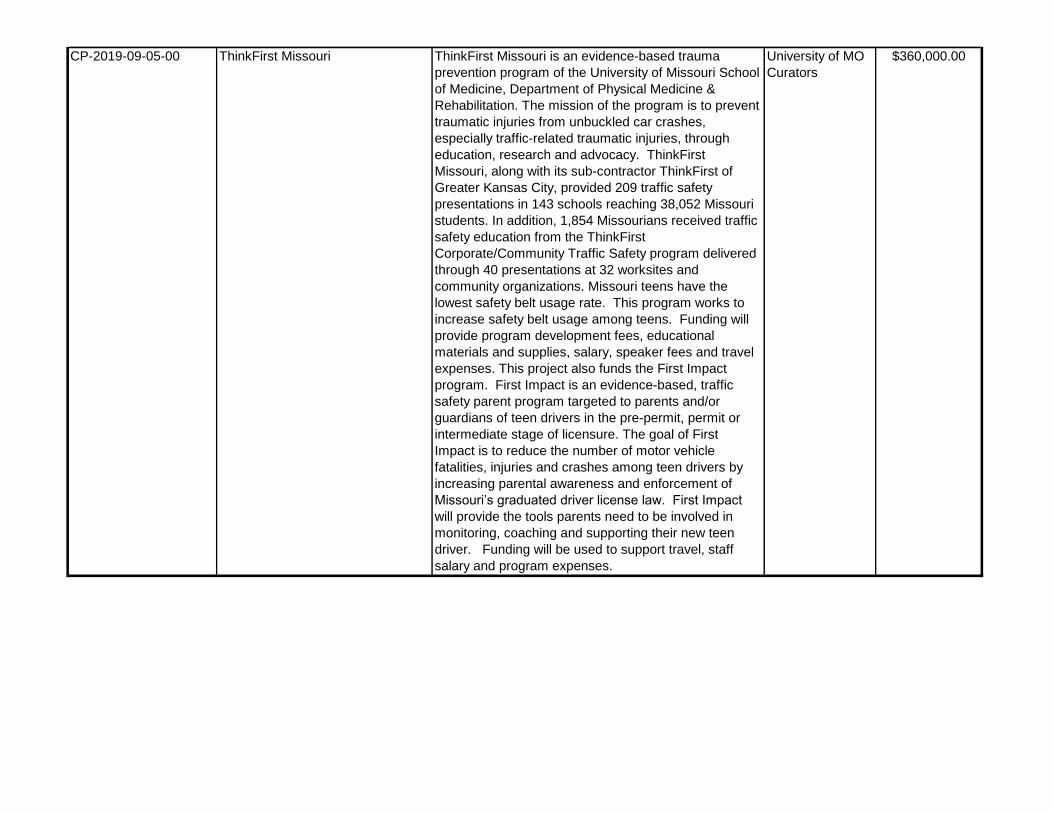
CP-2019-09-05-00 ThinkFirst Missouri ThinkFirst Missouri is an evidence-based trauma
prevention program of the University of Missouri School
of Medicine, Department of Physical Medicine &
Rehabilitation. The mission of the program is to prevent
traumatic injuries from unbuckled car crashes,
especially traffic-related traumatic injuries, through
education, research and advocacy. ThinkFirst
Missouri, along with its sub-contractor ThinkFirst of
Greater Kansas City, provided 209 traffic safety
presentations in 143 schools reaching 38,052 Missouri
students. In addition, 1,854 Missourians received traffic
safety education from the ThinkFirst
Corporate/Community Traffic Safety program delivered
through 40 presentations at 32 worksites and
community organizations. Missouri teens have the
lowest safety belt usage rate. This program works to
increase safety belt usage among teens. Funding will
provide program development fees, educational
materials and supplies, salary, speaker fees and travel
expenses. This project also funds the First Impact
program. First Impact is an evidence-based, traffic
safety parent program targeted to parents and/or
guardians of teen drivers in the pre-permit, permit or
intermediate stage of licensure. The goal of First
Impact is to reduce the number of motor vehicle
fatalities, injuries and crashes among teen drivers by
increasing parental awareness and enforcement of
Missouri’s graduated driver license law. First Impact
will provide the tools parents need to be involved in
monitoring, coaching and supporting their new teen
driver. Funding will be used to support travel, staff
salary and program expenses.
University of MO
Curators
$360,000.00
vanlot1
Typewritten Text
Appendix A

Distracted Driving
Planned Activity
Unique IdentifierPlanned Activity Name Planned Activity Description Subrecipients Total $
CP-2019-09-01-00 It Only Takes One/TRACTION
Awards
The It Only Takes One campaign is a statewide high
school competition that provides peer-to-peer education
on seat belt use, distracted driving and underage
drinking and driving and gives student groups the
opportunity to educate teens, parents and their
community about the dangers teens face while driving,
including distracted driving. The competition includes
educational campaigns, surprise safety belt surveys
and the creation of a public service announcement.
The funding will provide winning schools grant funding
to continue to educate the school on distracted driving
issues.
Highway Safety
and Traffic
Division
$9,500.00
vanlot1
Typewritten Text
Appendix A
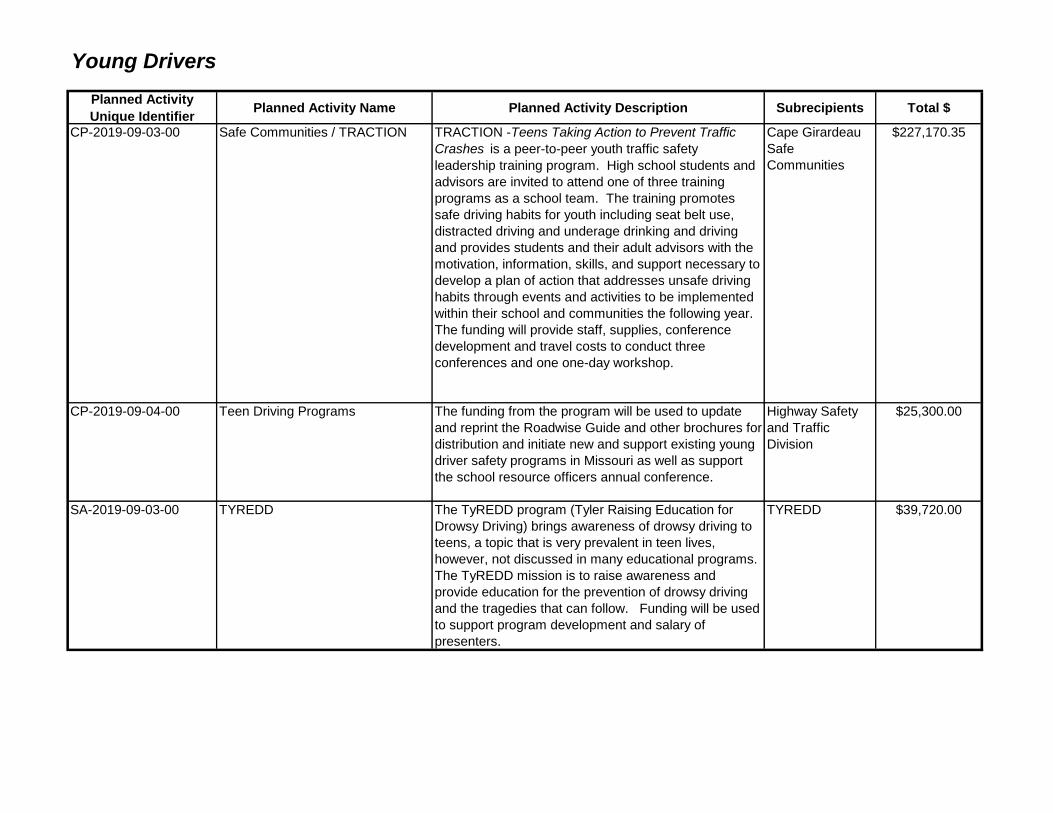
Young Drivers
Planned Activity
Unique IdentifierPlanned Activity Name Planned Activity Description Subrecipients Total $
CP-2019-09-03-00 Safe Communities / TRACTION TRACTION -Teens Taking Action to Prevent Traffic
Crashes is a peer-to-peer youth traffic safety
leadership training program. High school students and
advisors are invited to attend one of three training
programs as a school team. The training promotes
safe driving habits for youth including seat belt use,
distracted driving and underage drinking and driving
and provides students and their adult advisors with the
motivation, information, skills, and support necessary to
develop a plan of action that addresses unsafe driving
habits through events and activities to be implemented
within their school and communities the following year.
The funding will provide staff, supplies, conference
development and travel costs to conduct three
conferences and one one-day workshop.
Cape Girardeau
Safe
Communities
$227,170.35
CP-2019-09-04-00 Teen Driving Programs The funding from the program will be used to update
and reprint the Roadwise Guide and other brochures for
distribution and initiate new and support existing young
driver safety programs in Missouri as well as support
the school resource officers annual conference.
Highway Safety
and Traffic
Division
$25,300.00
SA-2019-09-03-00 TYREDD The TyREDD program (Tyler Raising Education for
Drowsy Driving) brings awareness of drowsy driving to
teens, a topic that is very prevalent in teen lives,
however, not discussed in many educational programs.
The TyREDD mission is to raise awareness and
provide education for the prevention of drowsy driving
and the tragedies that can follow. Funding will be used
to support program development and salary of
presenters.
TYREDD $39,720.00
vanlot1
Typewritten Text
Appendix A
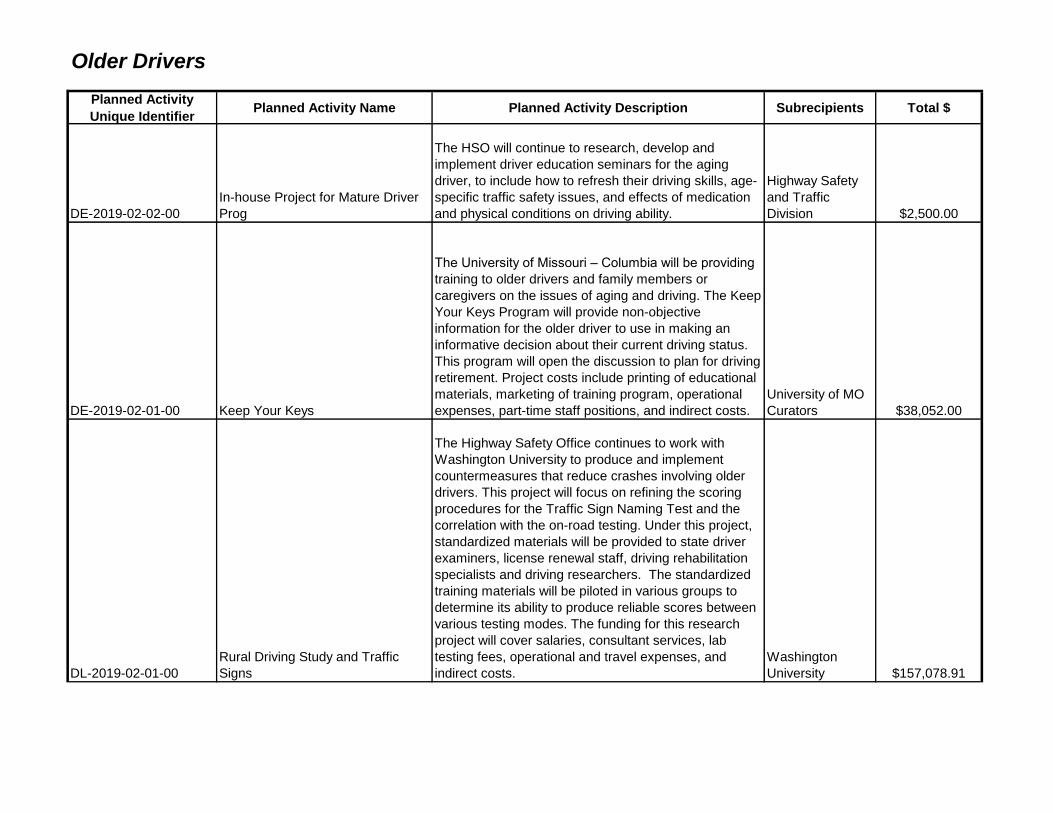
Older Drivers
Planned Activity
Unique IdentifierPlanned Activity Name Planned Activity Description Subrecipients Total $
DE-2019-02-02-00
In-house Project for Mature Driver
Prog
The HSO will continue to research, develop and
implement driver education seminars for the aging
driver, to include how to refresh their driving skills, age-
specific traffic safety issues, and effects of medication
and physical conditions on driving ability.
Highway Safety
and Traffic
Division $2,500.00
DE-2019-02-01-00 Keep Your Keys
The University of Missouri – Columbia will be providing
training to older drivers and family members or
caregivers on the issues of aging and driving. The Keep
Your Keys Program will provide non-objective
information for the older driver to use in making an
informative decision about their current driving status.
This program will open the discussion to plan for driving
retirement. Project costs include printing of educational
materials, marketing of training program, operational
expenses, part-time staff positions, and indirect costs.
University of MO
Curators $38,052.00
DL-2019-02-01-00
Rural Driving Study and Traffic
Signs
The Highway Safety Office continues to work with
Washington University to produce and implement
countermeasures that reduce crashes involving older
drivers. This project will focus on refining the scoring
procedures for the Traffic Sign Naming Test and the
correlation with the on-road testing. Under this project,
standardized materials will be provided to state driver
examiners, license renewal staff, driving rehabilitation
specialists and driving researchers. The standardized
training materials will be piloted in various groups to
determine its ability to produce reliable scores between
various testing modes. The funding for this research
project will cover salaries, consultant services, lab
testing fees, operational and travel expenses, and
indirect costs.
Washington
University $157,078.91
vanlot1
Typewritten Text
Appendix A
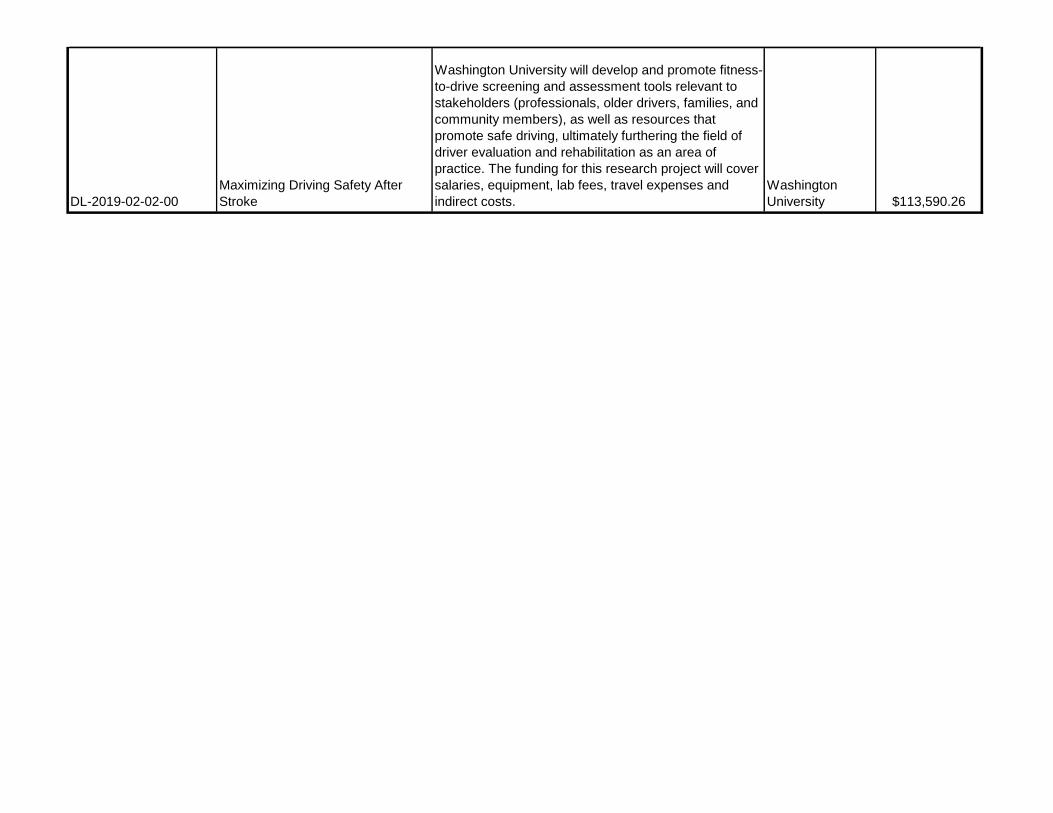
DL-2019-02-02-00
Maximizing Driving Safety After
Stroke
Washington University will develop and promote fitness-
to-drive screening and assessment tools relevant to
stakeholders (professionals, older drivers, families, and
community members), as well as resources that
promote safe driving, ultimately furthering the field of
driver evaluation and rehabilitation as an area of
practice. The funding for this research project will cover
salaries, equipment, lab fees, travel expenses and
indirect costs.
Washington
University $113,590.26
vanlot1
Typewritten Text
Appendix A
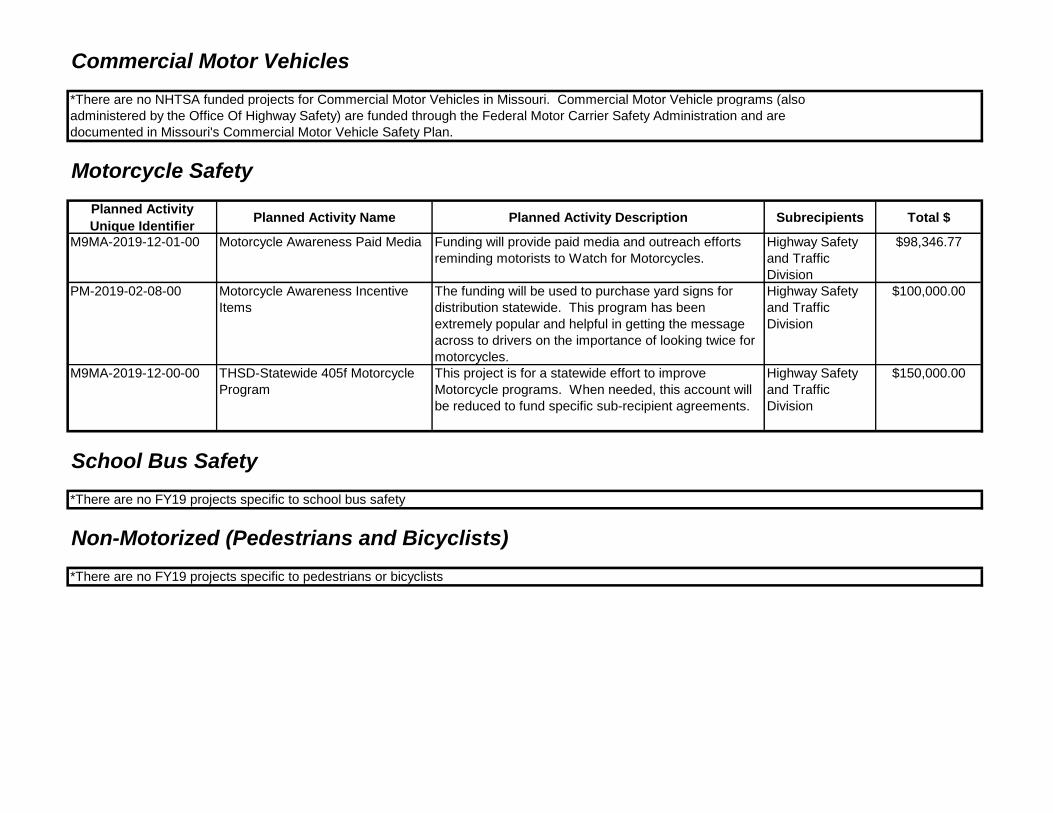
Commercial Motor Vehicles
*There are no NHTSA funded projects for Commercial Motor Vehicles in Missouri. Commercial Motor Vehicle programs (also
administered by the Office Of Highway Safety) are funded through the Federal Motor Carrier Safety Administration and are
documented in Missouri's Commercial Motor Vehicle Safety Plan.
Motorcycle Safety
Planned Activity
Unique IdentifierPlanned Activity Name Planned Activity Description Subrecipients Total $
M9MA-2019-12-01-00 Motorcycle Awareness Paid Media Funding will provide paid media and outreach efforts
reminding motorists to Watch for Motorcycles.
Highway Safety
and Traffic
Division
$98,346.77
PM-2019-02-08-00 Motorcycle Awareness Incentive
Items
The funding will be used to purchase yard signs for
distribution statewide. This program has been
extremely popular and helpful in getting the message
across to drivers on the importance of looking twice for
motorcycles.
Highway Safety
and Traffic
Division
$100,000.00
M9MA-2019-12-00-00 THSD-Statewide 405f Motorcycle
Program
This project is for a statewide effort to improve
Motorcycle programs. When needed, this account will
be reduced to fund specific sub-recipient agreements.
Highway Safety
and Traffic
Division
$150,000.00
School Bus Safety
*There are no FY19 projects specific to school bus safety
Non-Motorized (Pedestrians and Bicyclists)
*There are no FY19 projects specific to pedestrians or bicyclists
vanlot1
Typewritten Text
Appendix A
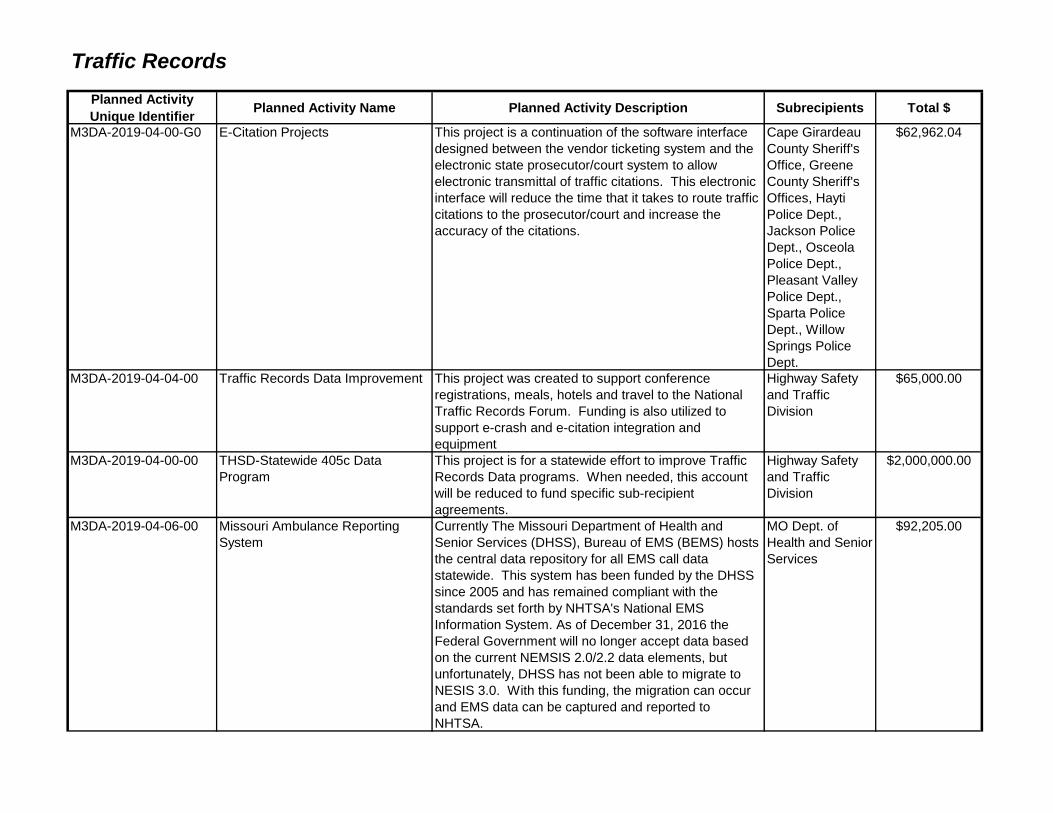
Traffic Records
Planned Activity
Unique IdentifierPlanned Activity Name Planned Activity Description Subrecipients Total $
M3DA-2019-04-00-G0 E-Citation Projects This project is a continuation of the software interface
designed between the vendor ticketing system and the
electronic state prosecutor/court system to allow
electronic transmittal of traffic citations. This electronic
interface will reduce the time that it takes to route traffic
citations to the prosecutor/court and increase the
accuracy of the citations.
Cape Girardeau
County Sheriff's
Office, Greene
County Sheriff's
Offices, Hayti
Police Dept.,
Jackson Police
Dept., Osceola
Police Dept.,
Pleasant Valley
Police Dept.,
Sparta Police
Dept., Willow
Springs Police
Dept.
$62,962.04
M3DA-2019-04-04-00 Traffic Records Data Improvement This project was created to support conference
registrations, meals, hotels and travel to the National
Traffic Records Forum. Funding is also utilized to
support e-crash and e-citation integration and
equipment
Highway Safety
and Traffic
Division
$65,000.00
M3DA-2019-04-00-00 THSD-Statewide 405c Data
Program
This project is for a statewide effort to improve Traffic
Records Data programs. When needed, this account
will be reduced to fund specific sub-recipient
agreements.
Highway Safety
and Traffic
Division
$2,000,000.00
M3DA-2019-04-06-00 Missouri Ambulance Reporting
System
Currently The Missouri Department of Health and
Senior Services (DHSS), Bureau of EMS (BEMS) hosts
the central data repository for all EMS call data
statewide. This system has been funded by the DHSS
since 2005 and has remained compliant with the
standards set forth by NHTSA's National EMS
Information System. As of December 31, 2016 the
Federal Government will no longer accept data based
on the current NEMSIS 2.0/2.2 data elements, but
unfortunately, DHSS has not been able to migrate to
NESIS 3.0. With this funding, the migration can occur
and EMS data can be captured and reported to
NHTSA.
MO Dept. of
Health and Senior
Services
$92,205.00
vanlot1
Typewritten Text
Appendix A

M3DA-2019-04-08-00 Statewide Traffic Accident Records
Sys.
The purpose of this grant proposal is to continue the
activities of the Statewide Traffic Accident Records
System (STARS) Information Maintenance Project.
This project will entail personnel from the Highway
Patrol, Patrol Records Division, processing and
encoding information from approximately 130,000 -
150,000 motor vehicle crash reports into the STARS.
The funding will cover personnel, supplies, consultant
services and travel to conferences.
MO State
Highway Patrol
$182,975.00
M3DA-2019-04-09-00 STARS and FARS Support Secure federal funding in order for MSHP to meet our
MOU obligation with MoDOT and cover the costs to
complete the transition of the STARS from COOL:Gen
technology to .NET as well as additional STARS
enhancements and knowledge transfer of consultants
to MSHP information technology personnel on .NET
technology.
MO State
Highway Patrol
$192,500.00
M3DA-2019-04-10-00 Predictive Analytical Crash Project The Missouri State Highway Patrol Statistical Analysis
Center (SAC) is developing a predictive model to
provide law enforcement officers with a crash forecast.
This forecast will assist officers in making smarter
patrol decisions in hopes of deterring bad driver
behavior and preventing traffic crashes. The SAC will
also provide other agencies with the forecast through
the use of a secure online portal, which will create the
Missouri Analytical Traffic Reporting Information
Exchange (MATRIX). The goal of the MATRIX is to
spur collaboration among all law enforcement agencies
in Missouri and to encourage them to submit their crash
reports electronically. If the SAC is able to receive
timely data from other agencies, then they will be able
to produce a more accurate crash forecast leading to
safer roads across Missouri. The funding will provide
consultant services and travel costs.
MO State
Highway Patrol
$26,540.00
vanlot1
Typewritten Text
Appendix A
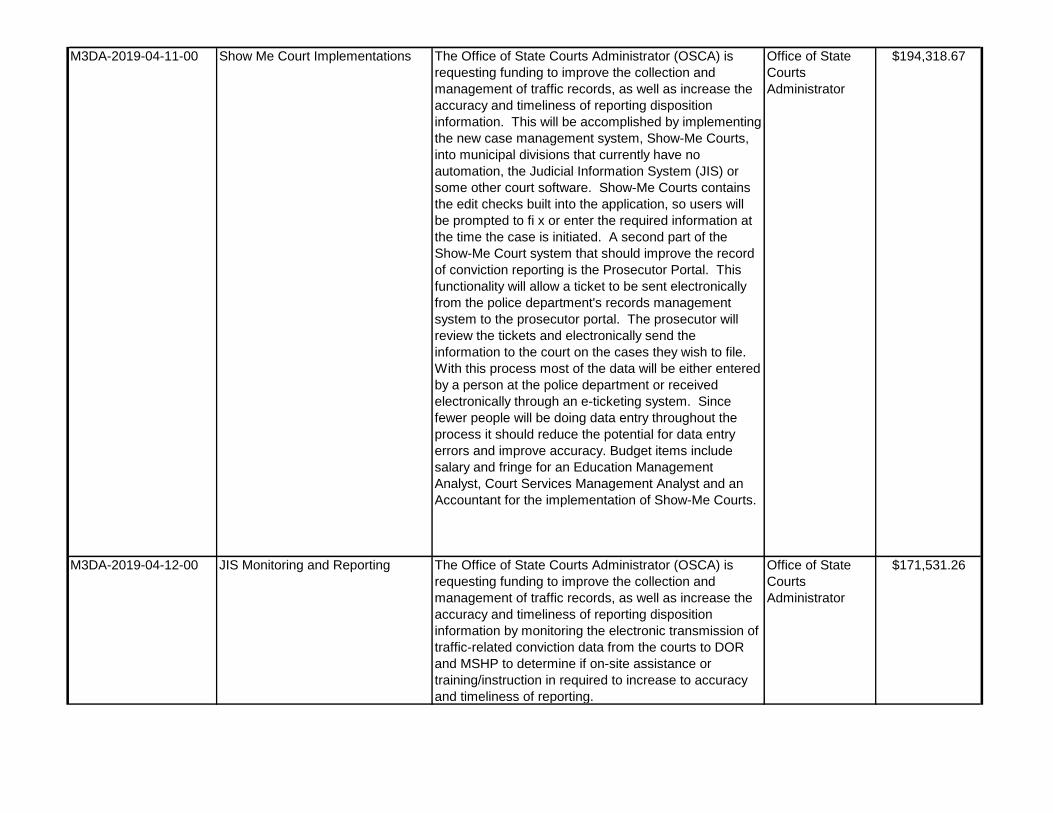
M3DA-2019-04-11-00 Show Me Court Implementations The Office of State Courts Administrator (OSCA) is
requesting funding to improve the collection and
management of traffic records, as well as increase the
accuracy and timeliness of reporting disposition
information. This will be accomplished by implementing
the new case management system, Show-Me Courts,
into municipal divisions that currently have no
automation, the Judicial Information System (JIS) or
some other court software. Show-Me Courts contains
the edit checks built into the application, so users will
be prompted to fi x or enter the required information at
the time the case is initiated. A second part of the
Show-Me Court system that should improve the record
of conviction reporting is the Prosecutor Portal. This
functionality will allow a ticket to be sent electronically
from the police department's records management
system to the prosecutor portal. The prosecutor will
review the tickets and electronically send the
information to the court on the cases they wish to file.
With this process most of the data will be either entered
by a person at the police department or received
electronically through an e-ticketing system. Since
fewer people will be doing data entry throughout the
process it should reduce the potential for data entry
errors and improve accuracy. Budget items include
salary and fringe for an Education Management
Analyst, Court Services Management Analyst and an
Accountant for the implementation of Show-Me Courts.
Office of State
Courts
Administrator
$194,318.67
M3DA-2019-04-12-00 JIS Monitoring and Reporting The Office of State Courts Administrator (OSCA) is
requesting funding to improve the collection and
management of traffic records, as well as increase the
accuracy and timeliness of reporting disposition
information by monitoring the electronic transmission of
traffic-related conviction data from the courts to DOR
and MSHP to determine if on-site assistance or
training/instruction in required to increase to accuracy
and timeliness of reporting.
Office of State
Courts
Administrator
$171,531.26
vanlot1
Typewritten Text
Appendix A
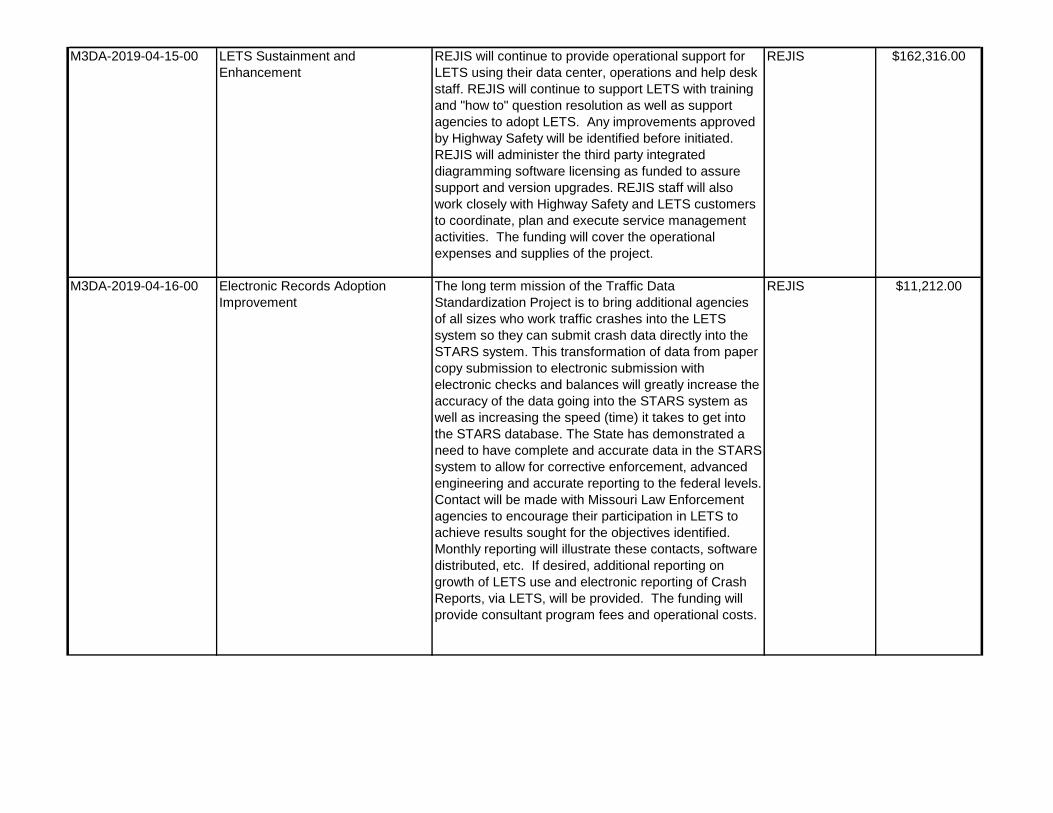
M3DA-2019-04-15-00 LETS Sustainment and
Enhancement
REJIS will continue to provide operational support for
LETS using their data center, operations and help desk
staff. REJIS will continue to support LETS with training
and "how to" question resolution as well as support
agencies to adopt LETS. Any improvements approved
by Highway Safety will be identified before initiated.
REJIS will administer the third party integrated
diagramming software licensing as funded to assure
support and version upgrades. REJIS staff will also
work closely with Highway Safety and LETS customers
to coordinate, plan and execute service management
activities. The funding will cover the operational
expenses and supplies of the project.
REJIS $162,316.00
M3DA-2019-04-16-00 Electronic Records Adoption
Improvement
The long term mission of the Traffic Data
Standardization Project is to bring additional agencies
of all sizes who work traffic crashes into the LETS
system so they can submit crash data directly into the
STARS system. This transformation of data from paper
copy submission to electronic submission with
electronic checks and balances will greatly increase the
accuracy of the data going into the STARS system as
well as increasing the speed (time) it takes to get into
the STARS database. The State has demonstrated a
need to have complete and accurate data in the STARS
system to allow for corrective enforcement, advanced
engineering and accurate reporting to the federal levels.
Contact will be made with Missouri Law Enforcement
agencies to encourage their participation in LETS to
achieve results sought for the objectives identified.
Monthly reporting will illustrate these contacts, software
distributed, etc. If desired, additional reporting on
growth of LETS use and electronic reporting of Crash
Reports, via LETS, will be provided. The funding will
provide consultant program fees and operational costs.
REJIS $11,212.00
vanlot1
Typewritten Text
Appendix A
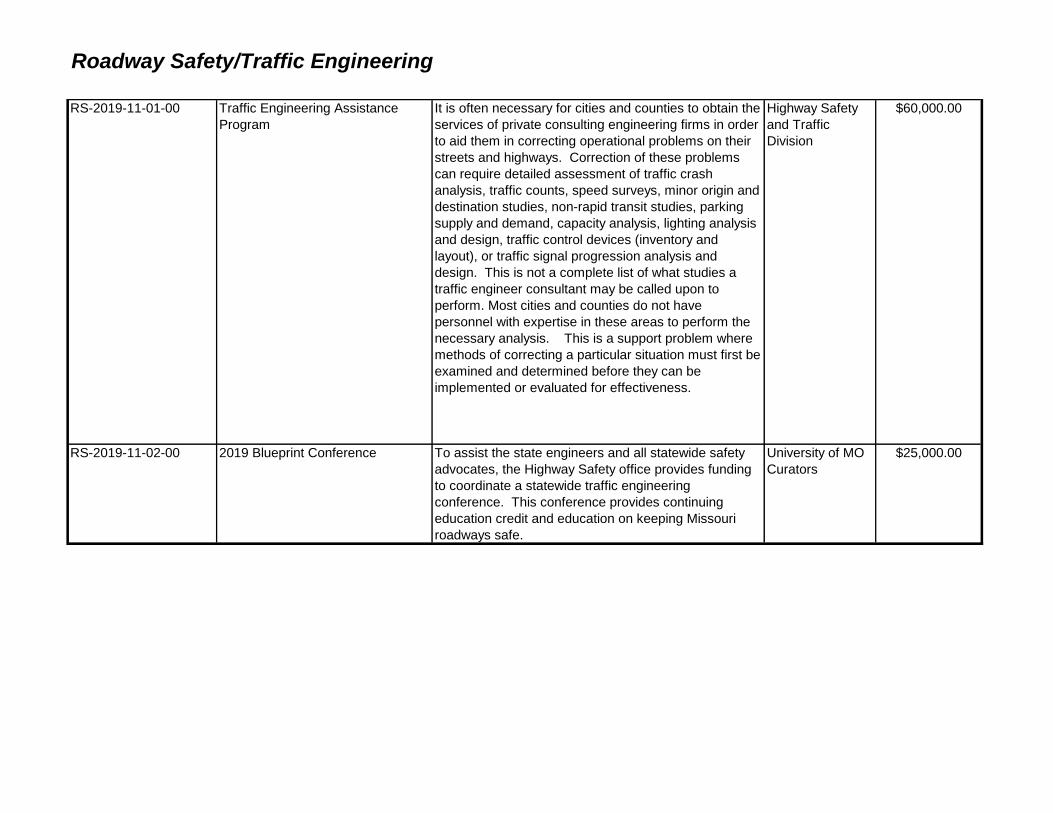
Roadway Safety/Traffic Engineering
RS-2019-11-01-00 Traffic Engineering Assistance
Program
It is often necessary for cities and counties to obtain the
services of private consulting engineering firms in order
to aid them in correcting operational problems on their
streets and highways. Correction of these problems
can require detailed assessment of traffic crash
analysis, traffic counts, speed surveys, minor origin and
destination studies, non-rapid transit studies, parking
supply and demand, capacity analysis, lighting analysis
and design, traffic control devices (inventory and
layout), or traffic signal progression analysis and
design. This is not a complete list of what studies a
traffic engineer consultant may be called upon to
perform. Most cities and counties do not have
personnel with expertise in these areas to perform the
necessary analysis. This is a support problem where
methods of correcting a particular situation must first be
examined and determined before they can be
implemented or evaluated for effectiveness.
Highway Safety
and Traffic
Division
$60,000.00
RS-2019-11-02-00 2019 Blueprint Conference To assist the state engineers and all statewide safety
advocates, the Highway Safety office provides funding
to coordinate a statewide traffic engineering
conference. This conference provides continuing
education credit and education on keeping Missouri
roadways safe.
University of MO
Curators
$25,000.00
vanlot1
Typewritten Text
Appendix A
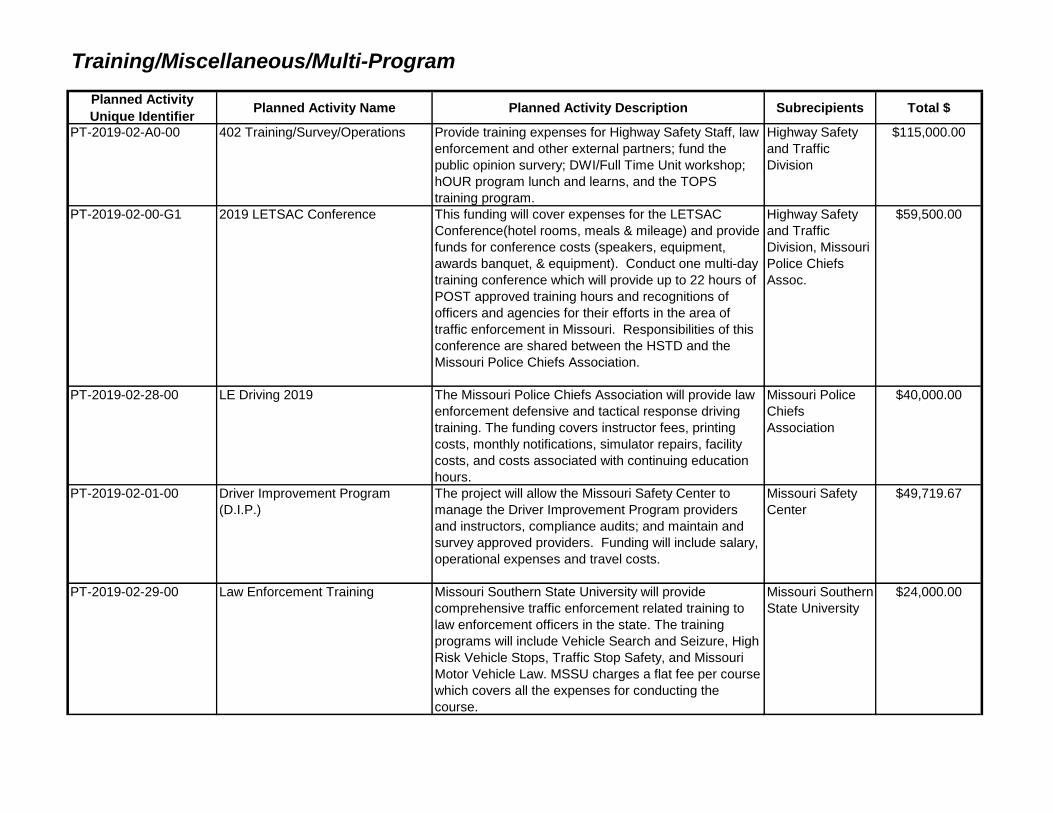
Training/Miscellaneous/Multi-Program
Planned Activity
Unique IdentifierPlanned Activity Name Planned Activity Description Subrecipients Total $
PT-2019-02-A0-00 402 Training/Survey/Operations Provide training expenses for Highway Safety Staff, law
enforcement and other external partners; fund the
public opinion survery; DWI/Full Time Unit workshop;
hOUR program lunch and learns, and the TOPS
training program.
Highway Safety
and Traffic
Division
$115,000.00
PT-2019-02-00-G1 2019 LETSAC Conference This funding will cover expenses for the LETSAC
Conference(hotel rooms, meals & mileage) and provide
funds for conference costs (speakers, equipment,
awards banquet, & equipment). Conduct one multi-day
training conference which will provide up to 22 hours of
POST approved training hours and recognitions of
officers and agencies for their efforts in the area of
traffic enforcement in Missouri. Responsibilities of this
conference are shared between the HSTD and the
Missouri Police Chiefs Association.
Highway Safety
and Traffic
Division, Missouri
Police Chiefs
Assoc.
$59,500.00
PT-2019-02-28-00 LE Driving 2019 The Missouri Police Chiefs Association will provide law
enforcement defensive and tactical response driving
training. The funding covers instructor fees, printing
costs, monthly notifications, simulator repairs, facility
costs, and costs associated with continuing education
hours.
Missouri Police
Chiefs
Association
$40,000.00
PT-2019-02-01-00 Driver Improvement Program
(D.I.P.)
The project will allow the Missouri Safety Center to
manage the Driver Improvement Program providers
and instructors, compliance audits; and maintain and
survey approved providers. Funding will include salary,
operational expenses and travel costs.
Missouri Safety
Center
$49,719.67
PT-2019-02-29-00 Law Enforcement Training Missouri Southern State University will provide
comprehensive traffic enforcement related training to
law enforcement officers in the state. The training
programs will include Vehicle Search and Seizure, High
Risk Vehicle Stops, Traffic Stop Safety, and Missouri
Motor Vehicle Law. MSSU charges a flat fee per course
which covers all the expenses for conducting the
course.
Missouri Southern
State University
$24,000.00
vanlot1
Typewritten Text
Appendix A
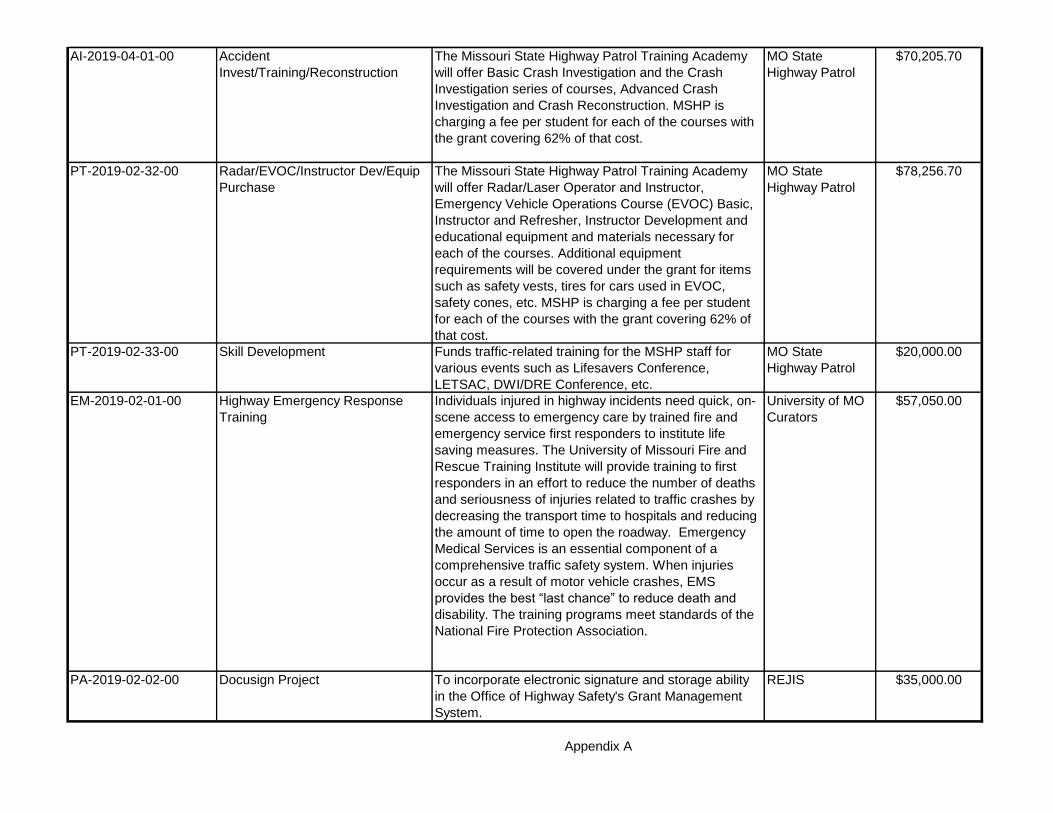
AI-2019-04-01-00 Accident
Invest/Training/Reconstruction
The Missouri State Highway Patrol Training Academy
will offer Basic Crash Investigation and the Crash
Investigation series of courses, Advanced Crash
Investigation and Crash Reconstruction. MSHP is
charging a fee per student for each of the courses with
the grant covering 62% of that cost.
MO State
Highway Patrol
$70,205.70
PT-2019-02-32-00 Radar/EVOC/Instructor Dev/Equip
Purchase
The Missouri State Highway Patrol Training Academy
will offer Radar/Laser Operator and Instructor,
Emergency Vehicle Operations Course (EVOC) Basic,
Instructor and Refresher, Instructor Development and
educational equipment and materials necessary for
each of the courses. Additional equipment
requirements will be covered under the grant for items
such as safety vests, tires for cars used in EVOC,
safety cones, etc. MSHP is charging a fee per student
for each of the courses with the grant covering 62% of
that cost.
MO State
Highway Patrol
$78,256.70
PT-2019-02-33-00 Skill Development Funds traffic-related training for the MSHP staff for
various events such as Lifesavers Conference,
LETSAC, DWI/DRE Conference, etc.
MO State
Highway Patrol
$20,000.00
EM-2019-02-01-00 Highway Emergency Response
Training
Individuals injured in highway incidents need quick, on-
scene access to emergency care by trained fire and
emergency service first responders to institute life
saving measures. The University of Missouri Fire and
Rescue Training Institute will provide training to first
responders in an effort to reduce the number of deaths
and seriousness of injuries related to traffic crashes by
decreasing the transport time to hospitals and reducing
the amount of time to open the roadway. Emergency
Medical Services is an essential component of a
comprehensive traffic safety system. When injuries
occur as a result of motor vehicle crashes, EMS
provides the best “last chance” to reduce death and
disability. The training programs meet standards of the
National Fire Protection Association.
University of MO
Curators
$57,050.00
PA-2019-02-02-00 Docusign Project To incorporate electronic signature and storage ability
in the Office of Highway Safety's Grant Management
System.
REJIS $35,000.00
Appendix A
vanlot1
Typewritten Text
vanlot1
Typewritten Text
vanlot1
Typewritten Text
vanlot1
Typewritten Text
vanlot1
Typewritten Text
vanlot1
Typewritten Text
vanlot1
Typewritten Text
vanlot1
Typewritten Text
vanlot1
Typewritten Text
vanlot1
Typewritten Text
vanlot1
Typewritten Text
vanlot1
Typewritten Text
vanlot1
Typewritten Text
vanlot1
Typewritten Text
vanlot1
Typewritten Text
vanlot1
Typewritten Text
vanlot1
Typewritten Text
vanlot1
Typewritten Text
vanlot1
Typewritten Text
vanlot1
Typewritten Text
vanlot1
Typewritten Text
vanlot1
Typewritten Text
vanlot1
Typewritten Text
vanlot1
Typewritten Text
vanlot1
Typewritten Text
vanlot1
Typewritten Text

Appendix B
FY 2019 CORE OUTCOME MEASURES
In addition to the Focus Areas, the HSP also focuses on 12 Core Outcome Measures. The National Highway Traffic Safety Administration (NHTSA) and the Governors Highway Safety Association (GHSA) have agreed on a minimum set of performance measures to be used by States and federal agencies in the development and implementation of behavioral highway safety plans and programs. An expert panel from NHTSA, State Highway Safety Offices, academic and research organizations, and other key groups assisted in developing the measures.*
The initial minimum set contains 12 measures: 11 core outcome measures and one core behavior measure. The measures cover the major areas common to State highway safety plans and use existing data systems. The following outlines the 12 performance measures which will be identified within their respective program areas.
*Traffic Safety Performance Measures for States and Federal Agencies DOT HS 811 025, August 2008.
Performance Measure Name
Target Period (Performance
Target)
Target Start Year
(Performance Target)
Target End Year
(Performance Target)
Target Value (Performance
Target)
C-1) Number of traffic fatalities (FARS) 5 year 2015 2019 872.3
C-2) Number of serious injuries in traffic crashes (State crash data files) 5 year 2015 2019 4,433.80 C-3) Fatalities/VMT (FARS,FHWA) 5 year 2015 2019 1.16
C-4) Number of unrestrained passenger vehicle occupant fatalities, all seat positions (FARS) 5 year 2015 2019 385.5 C-5) Number of fatalities in crashes involving a driver or motorcycle operator with a BAC of .08 and above (FARS) 5 year 2015 2019 230.3 C-6) Number of speeding-related fatalities (FARS) 5 year 2015 2019 331.7

Appendix B
C-7) Number of motorcyclist fatalities (FARS) 5 year 2015 2019 115.3
C-8) Number of unhelmeted motorcyclist fatalities (FARS) 5 year 2015 2019 13.8
C-9) Number of drivers age 20 or younger involved in fatal crashes (FARS) 5 year 2015 2019 123.8 C-10) Number of pedestrian fatalities (FARS) 5 year 2015 2019 100.8 C-11) Number of bicyclists fatalities (FARS) 5 year 2015 2019 9.4
B-1) Observed seat belt use for passenger vehicles, front seat outboard occupants (survey) 5 year 2015 2019 86

vanlot1
Typewritten Text
vanlot1
Typewritten Text
vanlot1
Typewritten Text
vanlot1
Typewritten Text
vanlot1
Typewritten Text
vanlot1
Typewritten Text
Appendix C

Ranking City Count Percent
1 KANSAS CITY 290 18.7%
2 ST. LOUIS 209 13.5%
3 SPRINGFIELD 85 5.5%
4 INDEPENDENCE 52 3.4%
5 COLUMBIA 35 2.3%
6 JOPLIN 26 1.7%
7 ST. CHARLES 21 1.4%
8 CAPE GIRARDEAU 19 1.2%
9 LEES SUMMIT 19 1.2%
10 ST. JOSEPH 19 1.2%
11 CHESTERFIELD 16 1.0%
12 HAZELWOOD 15 1.0%
13 BRIDGETON 14 0.9%
14 ROLLA 13 0.8%
15 BLUE SPRINGS 12 0.8%
16 O'FALLON 12 0.8%
17 ST. PETERS 12 0.8%
18 WENTZVILLE 12 0.8%
19 BERKELEY 11 0.7%
20 FLORISSANT 11 0.7%
21 MARYLAND HEIGHTS 11 0.7%
22 SUNSET HILLS 11 0.7%
23 BRANSON 10 0.6%
24 JEFFERSON CITY 10 0.6%
25 WILDWOOD 9 0.6%
26 FERGUSON 8 0.5%
27 GRANDVIEW 8 0.5%
28 OZARK 8 0.5%
29 SEDALIA 8 0.5%
30 SIKESTON 8 0.5%
31 SULLIVAN 8 0.5%
32 TOWN AND COUNTRY 8 0.5%
33 UNIVERSITY CITY 8 0.5%
34 ARNOLD 7 0.5%
35 BELTON 7 0.5%
36 FESTUS 7 0.5%
37 RIVERSIDE 7 0.5%
38 ST. CLAIR 7 0.5%
39 WRIGHT CITY 7 0.5%
40 BOLIVAR 6 0.4%
41 FARMINGTON 6 0.4%
42 FENTON 6 0.4%
2012-2016 MISSOURI FATAL TRAFFIC CRASHES
RANK ORDER CITY LIST
vanlot1
Typewritten Text
Appendix D

43 LAKE ST. LOUIS 6 0.4%
44 LIBERTY 6 0.4%
45 NEOSHO 6 0.4%
46 REPUBLIC 6 0.4%
47 WEST PLAINS 6 0.4%
48 BELLEFONTAINE NEIGHBORS 5 0.3%
49 DES PERES 5 0.3%
50 DEXTER 5 0.3%
51 DOOLITTLE 5 0.3%
52 EUREKA 5 0.3%
53 FULTON 5 0.3%
54 JACKSON 5 0.3%
55 KIRKSVILLE 5 0.3%
56 KIRKWOOD 5 0.3%
57 NEVADA 5 0.3%
58 NIXA 5 0.3%
59 OAK GROVE 5 0.3%
60 PACIFIC 5 0.3%
61 PERRYVILLE 5 0.3%
62 PINEVILLE 5 0.3%
63 POPLAR BLUFF 5 0.3%
64 RAYTOWN 5 0.3%
65 SCOTT CITY 5 0.3%
66 ST. JAMES 5 0.3%
67 ST. JOHN 5 0.3%
68 WARRENTON 5 0.3%
69 WELLSTON 5 0.3%
70 CAMDENTON 4 0.3%
71 CREVE COEUR 4 0.3%
72 KEARNEY 4 0.3%
73 LAKE OZARK 4 0.3%
74 MEXICO 4 0.3%
75 OSAGE BEACH 4 0.3%
76 STRAFFORD 4 0.3%
77 WASHINGTON 4 0.3%
78 WINFIELD 4 0.3%
79 ANDERSON 3 0.2%
80 DE SOTO 3 0.2%
81 DESLOGE 3 0.2%
82 DIGGINS 3 0.2%
83 GRAY SUMMIT 3 0.2%
84 HANNIBAL 3 0.2%
85 HARRISONVILLE 3 0.2%
86 HOLLISTER 3 0.2%
87 JANE 3 0.2%
88 LADUE 3 0.2%
89 LEBANON 3 0.2%
vanlot1
Typewritten Text
Appendix D

90 MANCHESTER 3 0.2%
91 MARIONVILLE 3 0.2%
92 MARSHALL 3 0.2%
93 MARSHFIELD 3 0.2%
94 MONETT 3 0.2%
95 MOSCOW MILLS 3 0.2%
96 NORTH KANSAS CITY 3 0.2%
97 REEDS SPRING 3 0.2%
98 TRENTON 3 0.2%
99 TROY 3 0.2%
100 VALLEY PARK 3 0.2%
101 WARRENSBURG 3 0.2%
102 ASHLAND 2 0.1%
103 BALLWIN 2 0.1%
104 BYRNES MILL 2 0.1%
105 CAMERON 2 0.1%
106 CARTHAGE 2 0.1%
107 CHILLICOTHE 2 0.1%
108 CLARK 2 0.1%
109 CRESTWOOD 2 0.1%
110 CRYSTAL CITY 2 0.1%
111 ELLISVILLE 2 0.1%
112 FAIR GROVE 2 0.1%
113 FORDLAND 2 0.1%
114 FRONTENAC 2 0.1%
115 GLADSTONE 2 0.1%
116 GRAIN VALLEY 2 0.1%
117 GRAVOIS MILLS 2 0.1%
118 HIGHLANDVILLE 2 0.1%
119 HOUSTON 2 0.1%
120 JENNINGS 2 0.1%
121 JONESBURG 2 0.1%
122 KINGDOM CITY 2 0.1%
123 LAKE LOTAWANA 2 0.1%
124 LAKE WINNEBAGO 2 0.1%
125 LINN CREEK 2 0.1%
126 MARYVILLE 2 0.1%
127 MOUNTAIN VIEW 2 0.1%
128 NOEL 2 0.1%
129 OLIVETTE 2 0.1%
130 PARK HILLS 2 0.1%
131 PINE LAWN 2 0.1%
132 PLATTE CITY 2 0.1%
133 PLEASANT HILL 2 0.1%
134 PORTAGEVILLE 2 0.1%
135 QUEEN CITY 2 0.1%
136 ROGERSVILLE 2 0.1%
vanlot1
Typewritten Text
Appendix D

137 SALEM 2 0.1%
138 SENECA 2 0.1%
139 SMITHVILLE 2 0.1%
140 ST. PAUL 2 0.1%
141 SUGAR CREEK 2 0.1%
142 UNION 2 0.1%
143 VAN BUREN 2 0.1%
144 VERONA 2 0.1%
145 WEBB CITY 2 0.1%
146 WILLARD 2 0.1%
147 AIRPORT DRIVE 1 0.1%
148 ALTON 1 0.1%
149 ARROW POINT 1 0.1%
150 AURORA 1 0.1%
151 AVILLA 1 0.1%
152 BAGNELL 1 0.1%
153 BELLE 1 0.1%
154 BEVERLY HILLS 1 0.1%
155 BLACK JACK 1 0.1%
156 BOONVILLE 1 0.1%
157 BOURBON 1 0.1%
158 BRANSON WEST 1 0.1%
159 BRENTWOOD 1 0.1%
160 BRONAUGH 1 0.1%
161 BUNKER 1 0.1%
162 BUTLER 1 0.1%
163 CABOOL 1 0.1%
164 CALIFORNIA 1 0.1%
165 CANTON 1 0.1%
166 CARL JUNCTION 1 0.1%
167 CARUTHERSVILLE 1 0.1%
168 CASSVILLE 1 0.1%
169 CLARKSVILLE 1 0.1%
170 CLAYCOMO 1 0.1%
171 CLINTON 1 0.1%
172 CONWAY 1 0.1%
173 COTTLEVILLE 1 0.1%
174 COUNTRY CLUB HILLS 1 0.1%
175 COUNTRY CLUB VILLAGE 1 0.1%
176 CRANE 1 0.1%
177 CUBA 1 0.1%
178 DIAMOND 1 0.1%
179 DONIPHAN 1 0.1%
180 EDMUNDSON 1 0.1%
181 ELLSINORE 1 0.1%
182 ELMO 1 0.1%
183 EVERTON 1 0.1%
vanlot1
Typewritten Text
Appendix D
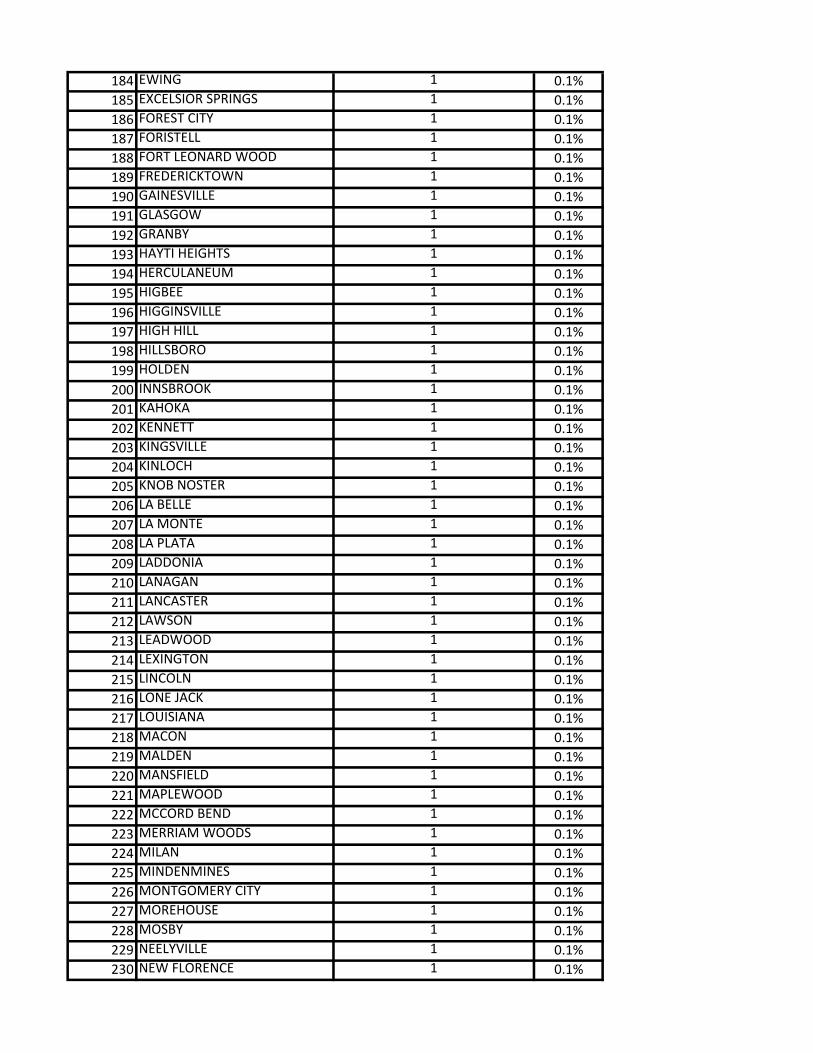
184 EWING 1 0.1%
185 EXCELSIOR SPRINGS 1 0.1%
186 FOREST CITY 1 0.1%
187 FORISTELL 1 0.1%
188 FORT LEONARD WOOD 1 0.1%
189 FREDERICKTOWN 1 0.1%
190 GAINESVILLE 1 0.1%
191 GLASGOW 1 0.1%
192 GRANBY 1 0.1%
193 HAYTI HEIGHTS 1 0.1%
194 HERCULANEUM 1 0.1%
195 HIGBEE 1 0.1%
196 HIGGINSVILLE 1 0.1%
197 HIGH HILL 1 0.1%
198 HILLSBORO 1 0.1%
199 HOLDEN 1 0.1%
200 INNSBROOK 1 0.1%
201 KAHOKA 1 0.1%
202 KENNETT 1 0.1%
203 KINGSVILLE 1 0.1%
204 KINLOCH 1 0.1%
205 KNOB NOSTER 1 0.1%
206 LA BELLE 1 0.1%
207 LA MONTE 1 0.1%
208 LA PLATA 1 0.1%
209 LADDONIA 1 0.1%
210 LANAGAN 1 0.1%
211 LANCASTER 1 0.1%
212 LAWSON 1 0.1%
213 LEADWOOD 1 0.1%
214 LEXINGTON 1 0.1%
215 LINCOLN 1 0.1%
216 LONE JACK 1 0.1%
217 LOUISIANA 1 0.1%
218 MACON 1 0.1%
219 MALDEN 1 0.1%
220 MANSFIELD 1 0.1%
221 MAPLEWOOD 1 0.1%
222 MCCORD BEND 1 0.1%
223 MERRIAM WOODS 1 0.1%
224 MILAN 1 0.1%
225 MINDENMINES 1 0.1%
226 MONTGOMERY CITY 1 0.1%
227 MOREHOUSE 1 0.1%
228 MOSBY 1 0.1%
229 NEELYVILLE 1 0.1%
230 NEW FLORENCE 1 0.1%
vanlot1
Typewritten Text
Appendix D

231 NEW HAVEN 1 0.1%
232 NEW MADRID 1 0.1%
233 NEWARK 1 0.1%
234 NORMANDY 1 0.1%
235 NORTHWOODS 1 0.1%
236 OAKLAND 1 0.1%
237 ODESSA 1 0.1%
238 OLD MONROE 1 0.1%
239 OVERLAND 1 0.1%
240 OWENSVILLE 1 0.1%
241 PAGEDALE 1 0.1%
242 PALMYRA 1 0.1%
243 PARKVILLE 1 0.1%
244 PEACH ORCHARD 1 0.1%
245 PECULIAR 1 0.1%
246 PEVELY 1 0.1%
247 PLATTSBURG 1 0.1%
248 PLEASANT HOPE 1 0.1%
249 PLEASANT VALLEY 1 0.1%
250 POTOSI 1 0.1%
251 PRATHERSVILLE 1 0.1%
252 PRESTON 1 0.1%
253 RANDOLPH 1 0.1%
254 RHINELAND 1 0.1%
255 RICHMOND 1 0.1%
256 RICHMOND HEIGHTS 1 0.1%
257 RIVER BEND 1 0.1%
258 RUSSELLVILLE 1 0.1%
259 SAVANNAH 1 0.1%
260 SENATH 1 0.1%
261 SEYMOUR 1 0.1%
262 SHREWSBURY 1 0.1%
263 SIBLEY 1 0.1%
264 SILVER CREEK 1 0.1%
265 SPARTA 1 0.1%
266 ST. ANN 1 0.1%
267 ST. ROBERT 1 0.1%
268 ST. THOMAS 1 0.1%
269 STEELVILLE 1 0.1%
270 STOVER 1 0.1%
271 TAOS 1 0.1%
272 THAYER 1 0.1%
273 UNIONVILLE 1 0.1%
274 UNITY VILLAGE 1 0.1%
275 URBANA 1 0.1%
276 VANDALIA 1 0.1%
277 VINITA PARK 1 0.1%
vanlot1
Typewritten Text
Appendix D

278 WARSAW 1 0.1%
279 WAYNESVILLE 1 0.1%
280 WEAUBLEAU 1 0.1%
281 WEST ALTON 1 0.1%
282 WHEATLAND 1 0.1%
283 WINONA 1 0.1%
284 WYATT 1 0.1%
TOTAL 1,551
Note: 2,268 fatal crashes occurred in Non-City or Unincorporated areas.
vanlot1
Typewritten Text
vanlot1
Typewritten Text
vanlot1
Typewritten Text
Appendix D
vanlot1
Typewritten Text
vanlot1
Typewritten Text
vanlot1
Typewritten Text
vanlot1
Typewritten Text
vanlot1
Typewritten Text
vanlot1
Typewritten Text
vanlot1
Typewritten Text
vanlot1
Typewritten Text
vanlot1
Typewritten Text
vanlot1
Typewritten Text

Ranking County Count Percent
1 JACKSON 355 9.3%
2 ST. LOUIS 292 7.6%
3 ST. LOUIS CITY 209 5.5%
4 GREENE 155 4.1%
5 JEFFERSON 146 3.8%
6 ST. CHARLES 104 2.7%
7 FRANKLIN 102 2.7%
8 CLAY 98 2.6%
9 BOONE 81 2.1%
10 JASPER 71 1.9%
11 NEWTON 57 1.5%
12 CASS 55 1.4%
13 PHELPS 52 1.4%
14 ST. FRANCOIS 52 1.4%
15 PLATTE 50 1.3%
16 LINCOLN 47 1.2%
17 CAPE GIRARDEAU 46 1.2%
18 TANEY 46 1.2%
19 CHRISTIAN 45 1.2%
20 JOHNSON 45 1.2%
21 CAMDEN 43 1.1%
22 HOWELL 42 1.1%
23 BARRY 40 1.0%
24 MILLER 39 1.0%
25 WASHINGTON 39 1.0%
26 LAWRENCE 38 1.0%
27 BUCHANAN 37 1.0%
28 BUTLER 36 0.9%
29 STONE 36 0.9%
30 MCDONALD 34 0.9%
31 PETTIS 34 0.9%
32 WARREN 34 0.9%
33 DUNKLIN 33 0.9%
34 LACLEDE 33 0.9%
35 CALLAWAY 32 0.8%
36 TEXAS 32 0.8%
37 COLE 31 0.8%
38 PEMISCOT 31 0.8%
39 PULASKI 31 0.8%
40 WEBSTER 31 0.8%
41 POLK 30 0.8%
42 STODDARD 27 0.7%
2012-2016 MISSOURI FATAL TRAFFIC CRASHES
RANK ORDER COUNTY LIST
vanlot1
Typewritten Text
Appendix E

43 NEW MADRID 26 0.7%
44 SCOTT 26 0.7%
45 LAFAYETTE 25 0.7%
46 BENTON 23 0.6%
47 GASCONADE 23 0.6%
48 SALINE 23 0.6%
49 STE. GENEVIEVE 23 0.6%
50 MONTGOMERY 22 0.6%
51 PIKE 22 0.6%
52 MORGAN 21 0.5%
53 ANDREW 20 0.5%
54 CRAWFORD 20 0.5%
55 AUDRAIN 19 0.5%
56 DENT 19 0.5%
57 MARIES 19 0.5%
58 RIPLEY 18 0.5%
59 BOLLINGER 17 0.4%
60 MARION 17 0.4%
61 PERRY 17 0.4%
62 WRIGHT 17 0.4%
63 RALLS 16 0.4%
64 RANDOLPH 16 0.4%
65 RAY 16 0.4%
66 VERNON 16 0.4%
67 MISSISSIPPI 15 0.4%
68 MONITEAU 15 0.4%
69 REYNOLDS 15 0.4%
70 ST. CLAIR 15 0.4%
71 WAYNE 15 0.4%
72 HENRY 14 0.4%
73 MADISON 14 0.4%
74 OREGON 14 0.4%
75 SHANNON 14 0.4%
76 CARTER 13 0.3%
77 COOPER 13 0.3%
78 IRON 13 0.3%
79 NODAWAY 13 0.3%
80 DALLAS 12 0.3%
81 HARRISON 12 0.3%
82 HOWARD 12 0.3%
83 OZARK 12 0.3%
84 BATES 11 0.3%
85 CLARK 11 0.3%
86 CLINTON 11 0.3%
87 ADAIR 10 0.3%
88 CEDAR 10 0.3%
89 DEKALB 10 0.3%
vanlot1
Typewritten Text
Appendix E
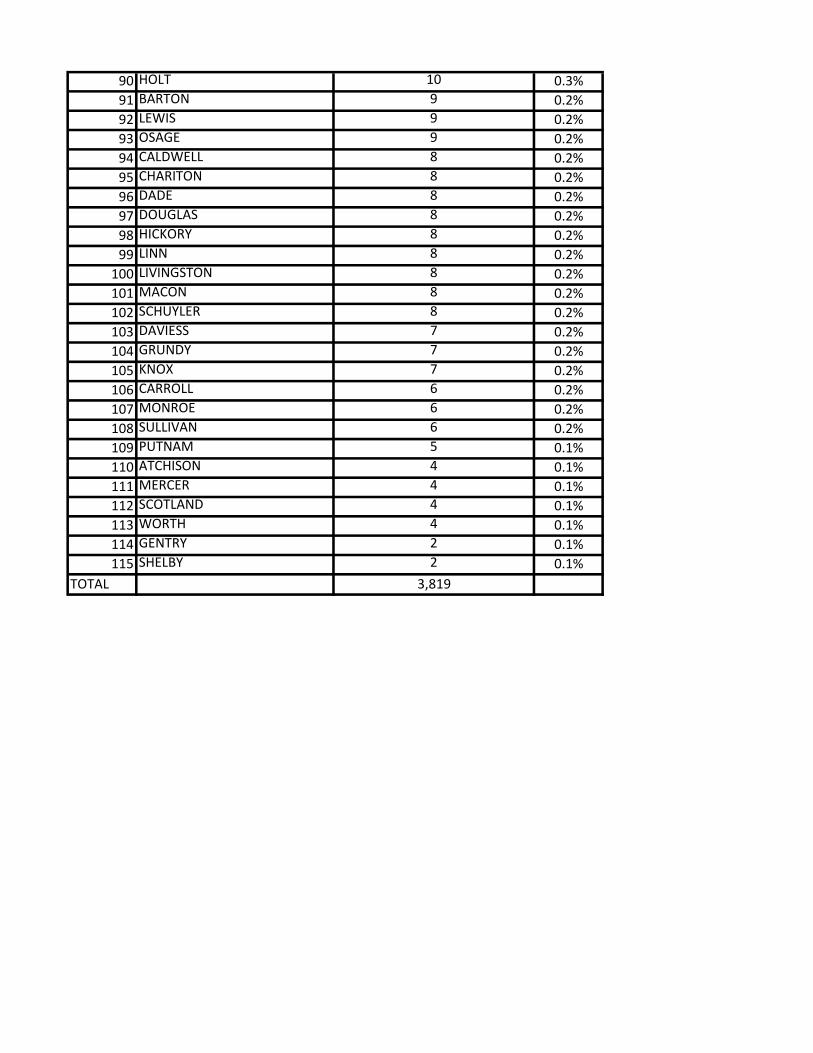
90 HOLT 10 0.3%
91 BARTON 9 0.2%
92 LEWIS 9 0.2%
93 OSAGE 9 0.2%
94 CALDWELL 8 0.2%
95 CHARITON 8 0.2%
96 DADE 8 0.2%
97 DOUGLAS 8 0.2%
98 HICKORY 8 0.2%
99 LINN 8 0.2%
100 LIVINGSTON 8 0.2%
101 MACON 8 0.2%
102 SCHUYLER 8 0.2%
103 DAVIESS 7 0.2%
104 GRUNDY 7 0.2%
105 KNOX 7 0.2%
106 CARROLL 6 0.2%
107 MONROE 6 0.2%
108 SULLIVAN 6 0.2%
109 PUTNAM 5 0.1%
110 ATCHISON 4 0.1%
111 MERCER 4 0.1%
112 SCOTLAND 4 0.1%
113 WORTH 4 0.1%
114 GENTRY 2 0.1%
115 SHELBY 2 0.1%
TOTAL 3,819
vanlot1
Typewritten Text
Appendix E
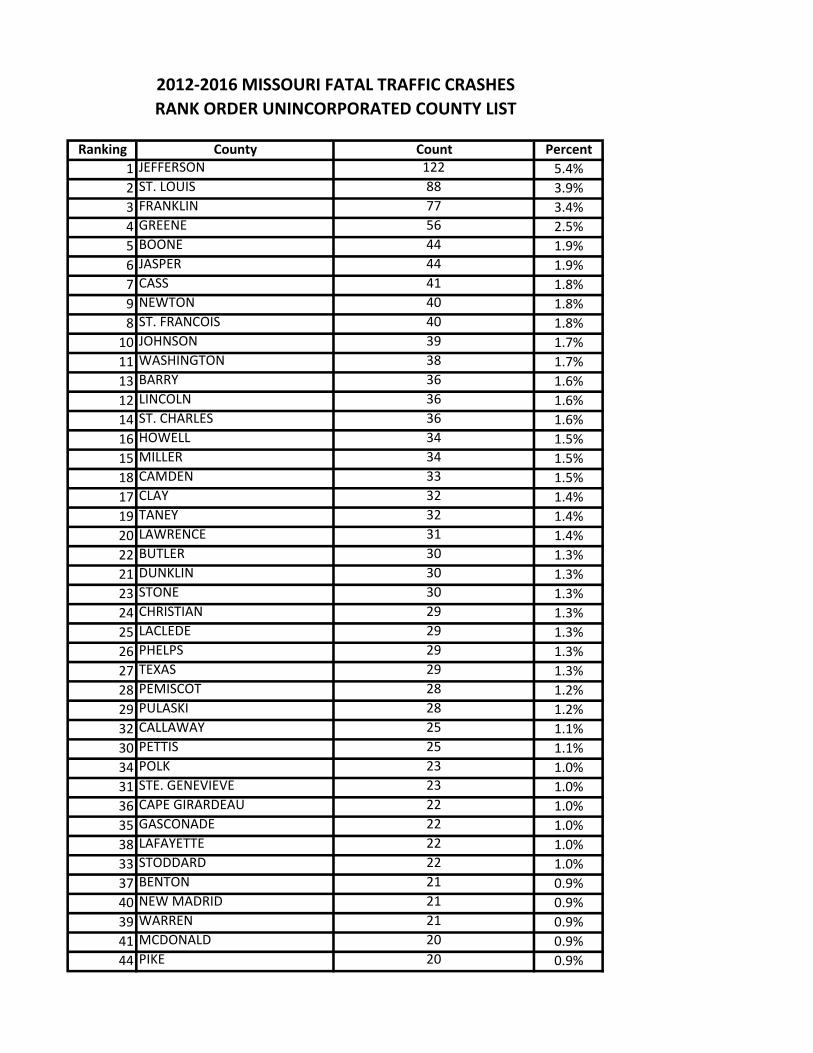
Ranking County Count Percent
1 JEFFERSON 122 5.4%
2 ST. LOUIS 88 3.9%
3 FRANKLIN 77 3.4%
4 GREENE 56 2.5%
5 BOONE 44 1.9%
6 JASPER 44 1.9%
7 CASS 41 1.8%
9 NEWTON 40 1.8%
8 ST. FRANCOIS 40 1.8%
10 JOHNSON 39 1.7%
11 WASHINGTON 38 1.7%
13 BARRY 36 1.6%
12 LINCOLN 36 1.6%
14 ST. CHARLES 36 1.6%
16 HOWELL 34 1.5%
15 MILLER 34 1.5%
18 CAMDEN 33 1.5%
17 CLAY 32 1.4%
19 TANEY 32 1.4%
20 LAWRENCE 31 1.4%
22 BUTLER 30 1.3%
21 DUNKLIN 30 1.3%
23 STONE 30 1.3%
24 CHRISTIAN 29 1.3%
25 LACLEDE 29 1.3%
26 PHELPS 29 1.3%
27 TEXAS 29 1.3%
28 PEMISCOT 28 1.2%
29 PULASKI 28 1.2%
32 CALLAWAY 25 1.1%
30 PETTIS 25 1.1%
34 POLK 23 1.0%
31 STE. GENEVIEVE 23 1.0%
36 CAPE GIRARDEAU 22 1.0%
35 GASCONADE 22 1.0%
38 LAFAYETTE 22 1.0%
33 STODDARD 22 1.0%
37 BENTON 21 0.9%
40 NEW MADRID 21 0.9%
39 WARREN 21 0.9%
41 MCDONALD 20 0.9%
44 PIKE 20 0.9%
2012-2016 MISSOURI FATAL TRAFFIC CRASHES
RANK ORDER UNINCORPORATED COUNTY LIST
vanlot1
Typewritten Text
Appendix F
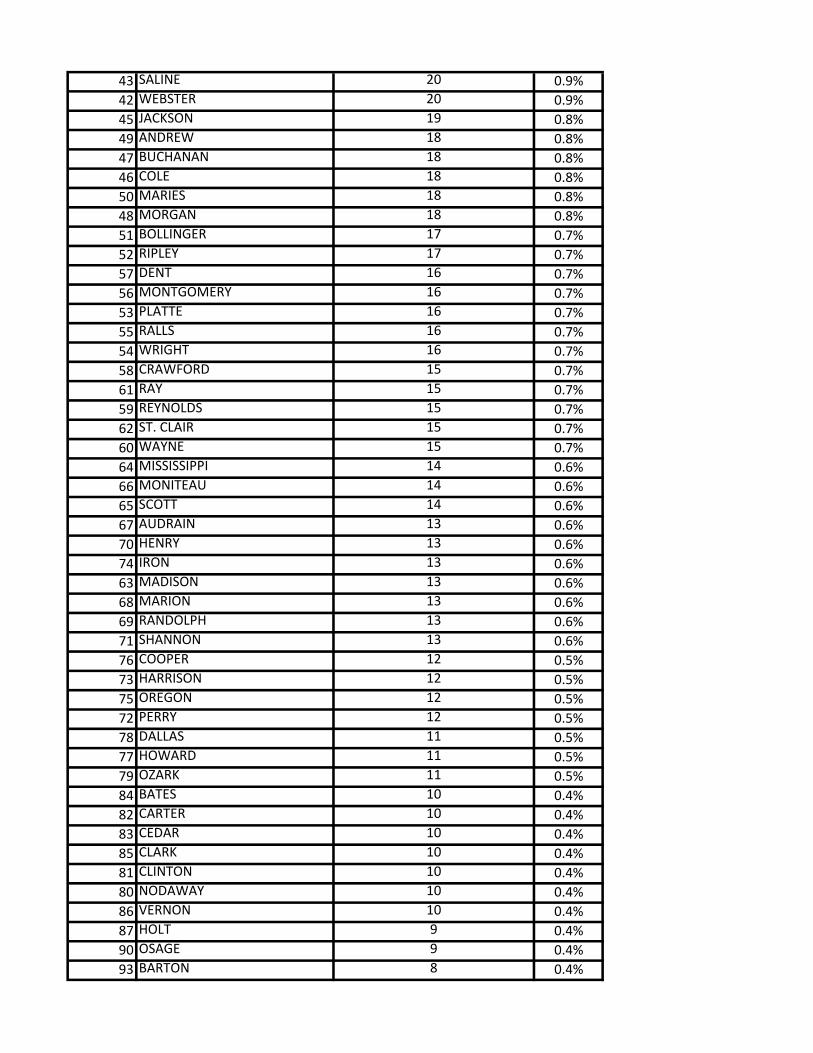
43 SALINE 20 0.9%
42 WEBSTER 20 0.9%
45 JACKSON 19 0.8%
49 ANDREW 18 0.8%
47 BUCHANAN 18 0.8%
46 COLE 18 0.8%
50 MARIES 18 0.8%
48 MORGAN 18 0.8%
51 BOLLINGER 17 0.7%
52 RIPLEY 17 0.7%
57 DENT 16 0.7%
56 MONTGOMERY 16 0.7%
53 PLATTE 16 0.7%
55 RALLS 16 0.7%
54 WRIGHT 16 0.7%
58 CRAWFORD 15 0.7%
61 RAY 15 0.7%
59 REYNOLDS 15 0.7%
62 ST. CLAIR 15 0.7%
60 WAYNE 15 0.7%
64 MISSISSIPPI 14 0.6%
66 MONITEAU 14 0.6%
65 SCOTT 14 0.6%
67 AUDRAIN 13 0.6%
70 HENRY 13 0.6%
74 IRON 13 0.6%
63 MADISON 13 0.6%
68 MARION 13 0.6%
69 RANDOLPH 13 0.6%
71 SHANNON 13 0.6%
76 COOPER 12 0.5%
73 HARRISON 12 0.5%
75 OREGON 12 0.5%
72 PERRY 12 0.5%
78 DALLAS 11 0.5%
77 HOWARD 11 0.5%
79 OZARK 11 0.5%
84 BATES 10 0.4%
82 CARTER 10 0.4%
83 CEDAR 10 0.4%
85 CLARK 10 0.4%
81 CLINTON 10 0.4%
80 NODAWAY 10 0.4%
86 VERNON 10 0.4%
87 HOLT 9 0.4%
90 OSAGE 9 0.4%
93 BARTON 8 0.4%
vanlot1
Typewritten Text
Appendix F

92 CALDWELL 8 0.4%
91 CHARITON 8 0.4%
96 DEKALB 8 0.4%
88 DOUGLAS 8 0.4%
89 LINN 8 0.4%
95 DADE 7 0.3%
98 DAVIESS 7 0.3%
100 CARROLL 6 0.3%
99 KNOX 6 0.3%
94 LEWIS 6 0.3%
97 LIVINGSTON 6 0.3%
102 MACON 6 0.3%
101 MONROE 6 0.3%
103 ADAIR 5 0.2%
106 HICKORY 5 0.2%
104 SCHUYLER 5 0.2%
105 SULLIVAN 5 0.2%
113 ATCHISON 4 0.2%
107 GRUNDY 4 0.2%
109 MERCER 4 0.2%
108 PUTNAM 4 0.2%
111 SCOTLAND 4 0.2%
112 WORTH 4 0.2%
110 GENTRY 2 0.1%
115 SHELBY 2 0.1%
TOTAL 2,268
vanlot1
Typewritten Text
Appendix F
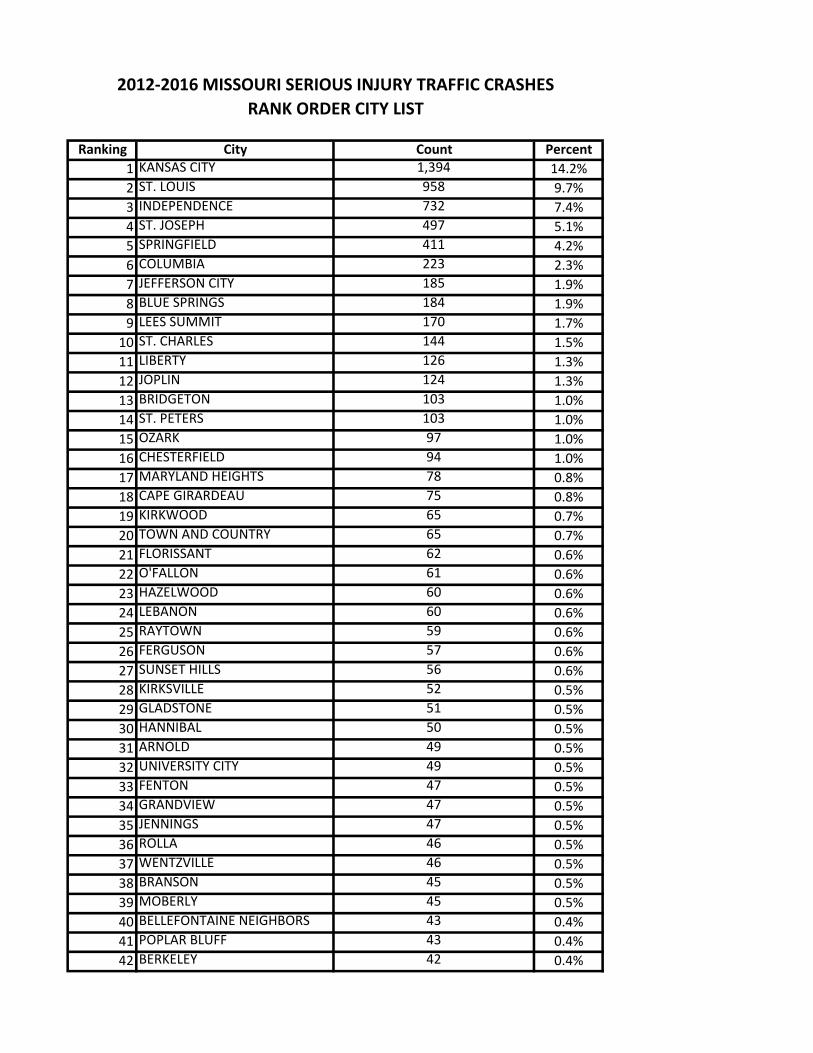
Ranking City Count Percent
1 KANSAS CITY 1,394 14.2%
2 ST. LOUIS 958 9.7%
3 INDEPENDENCE 732 7.4%
4 ST. JOSEPH 497 5.1%
5 SPRINGFIELD 411 4.2%
6 COLUMBIA 223 2.3%
7 JEFFERSON CITY 185 1.9%
8 BLUE SPRINGS 184 1.9%
9 LEES SUMMIT 170 1.7%
10 ST. CHARLES 144 1.5%
11 LIBERTY 126 1.3%
12 JOPLIN 124 1.3%
13 BRIDGETON 103 1.0%
14 ST. PETERS 103 1.0%
15 OZARK 97 1.0%
16 CHESTERFIELD 94 1.0%
17 MARYLAND HEIGHTS 78 0.8%
18 CAPE GIRARDEAU 75 0.8%
19 KIRKWOOD 65 0.7%
20 TOWN AND COUNTRY 65 0.7%
21 FLORISSANT 62 0.6%
22 O'FALLON 61 0.6%
23 HAZELWOOD 60 0.6%
24 LEBANON 60 0.6%
25 RAYTOWN 59 0.6%
26 FERGUSON 57 0.6%
27 SUNSET HILLS 56 0.6%
28 KIRKSVILLE 52 0.5%
29 GLADSTONE 51 0.5%
30 HANNIBAL 50 0.5%
31 ARNOLD 49 0.5%
32 UNIVERSITY CITY 49 0.5%
33 FENTON 47 0.5%
34 GRANDVIEW 47 0.5%
35 JENNINGS 47 0.5%
36 ROLLA 46 0.5%
37 WENTZVILLE 46 0.5%
38 BRANSON 45 0.5%
39 MOBERLY 45 0.5%
40 BELLEFONTAINE NEIGHBORS 43 0.4%
41 POPLAR BLUFF 43 0.4%
42 BERKELEY 42 0.4%
2012-2016 MISSOURI SERIOUS INJURY TRAFFIC CRASHES
RANK ORDER CITY LIST
vanlot1
Typewritten Text
vanlot1
Typewritten Text
vanlot1
Typewritten Text
Appendix G

43 CLAYTON 42 0.4%
44 CREVE COEUR 41 0.4%
45 SIKESTON 41 0.4%
46 OVERLAND 39 0.4%
47 SEDALIA 38 0.4%
48 WEBSTER GROVES 38 0.4%
49 BALLWIN 36 0.4%
50 NIXA 36 0.4%
51 FESTUS 35 0.4%
52 NORTH KANSAS CITY 35 0.4%
53 WILDWOOD 35 0.4%
54 BELTON 34 0.3%
55 RICHMOND HEIGHTS 34 0.3%
56 UNION 34 0.3%
57 NEOSHO 33 0.3%
58 FARMINGTON 32 0.3%
59 JACKSON 31 0.3%
60 ST. CLAIR 30 0.3%
61 EUREKA 29 0.3%
62 LAKE ST. LOUIS 29 0.3%
63 TROY 29 0.3%
64 MANCHESTER 28 0.3%
65 MAPLEWOOD 28 0.3%
66 EXCELSIOR SPRINGS 27 0.3%
67 OSAGE BEACH 27 0.3%
68 FULTON 26 0.3%
69 DES PERES 25 0.3%
70 LADUE 25 0.3%
71 CARTHAGE 24 0.2%
72 SMITHVILLE 23 0.2%
73 BOLIVAR 22 0.2%
74 KENNETT 22 0.2%
75 VALLEY PARK 22 0.2%
76 BRENTWOOD 21 0.2%
77 CLINTON 21 0.2%
78 MONETT 21 0.2%
79 AURORA 20 0.2%
80 GRAIN VALLEY 20 0.2%
81 GRAY SUMMIT 20 0.2%
82 NEVADA 20 0.2%
83 PLEASANT HILL 20 0.2%
84 ST. ANN 20 0.2%
85 MEXICO 19 0.2%
86 SALEM 19 0.2%
87 WARRENSBURG 19 0.2%
88 RAYMORE 18 0.2%
89 ST. JOHN 18 0.2%
vanlot1
Typewritten Text
Appendix G
vanlot1
Typewritten Text
vanlot1
Typewritten Text

90 WRIGHT CITY 18 0.2%
91 ELLISVILLE 17 0.2%
92 LAKE OZARK 17 0.2%
93 WARRENTON 17 0.2%
94 CLAYCOMO 16 0.2%
95 CRYSTAL CITY 16 0.2%
96 HARRISONVILLE 16 0.2%
97 REPUBLIC 16 0.2%
98 ST. ROBERT 16 0.2%
99 WEST ALTON 16 0.2%
100 BEL-RIDGE 15 0.2%
101 LAKE LOTAWANA 15 0.2%
102 PEVELY 15 0.2%
103 DELLWOOD 14 0.1%
104 OLIVETTE 14 0.1%
105 WEBB CITY 14 0.1%
106 RIVERSIDE 13 0.1%
107 ROGERSVILLE 13 0.1%
108 SEYMOUR 13 0.1%
109 SULLIVAN 13 0.1%
110 WEST PLAINS 13 0.1%
111 BRANSON WEST 12 0.1%
112 DONIPHAN 12 0.1%
113 ELDON 12 0.1%
114 CAMERON 11 0.1%
115 CHILLICOTHE 11 0.1%
116 DE SOTO 11 0.1%
117 FORSYTH 11 0.1%
118 HAYTI 11 0.1%
119 HERCULANEUM 11 0.1%
120 MACON 11 0.1%
121 MARSHALL 11 0.1%
122 MOLINE ACRES 11 0.1%
123 OAK GROVE 11 0.1%
124 PLATTE CITY 11 0.1%
125 RICHMOND 11 0.1%
126 WASHINGTON 11 0.1%
127 WELDON SPRING 11 0.1%
128 DESLOGE 10 0.1%
129 KEARNEY 10 0.1%
130 KINGDOM CITY 10 0.1%
131 MOSCOW MILLS 10 0.1%
132 MOUNTAIN VIEW 10 0.1%
133 PARK HILLS 10 0.1%
134 STRAFFORD 10 0.1%
135 DIGGINS 9 0.1%
136 GLENDALE 9 0.1%
vanlot1
Typewritten Text
Appendix G
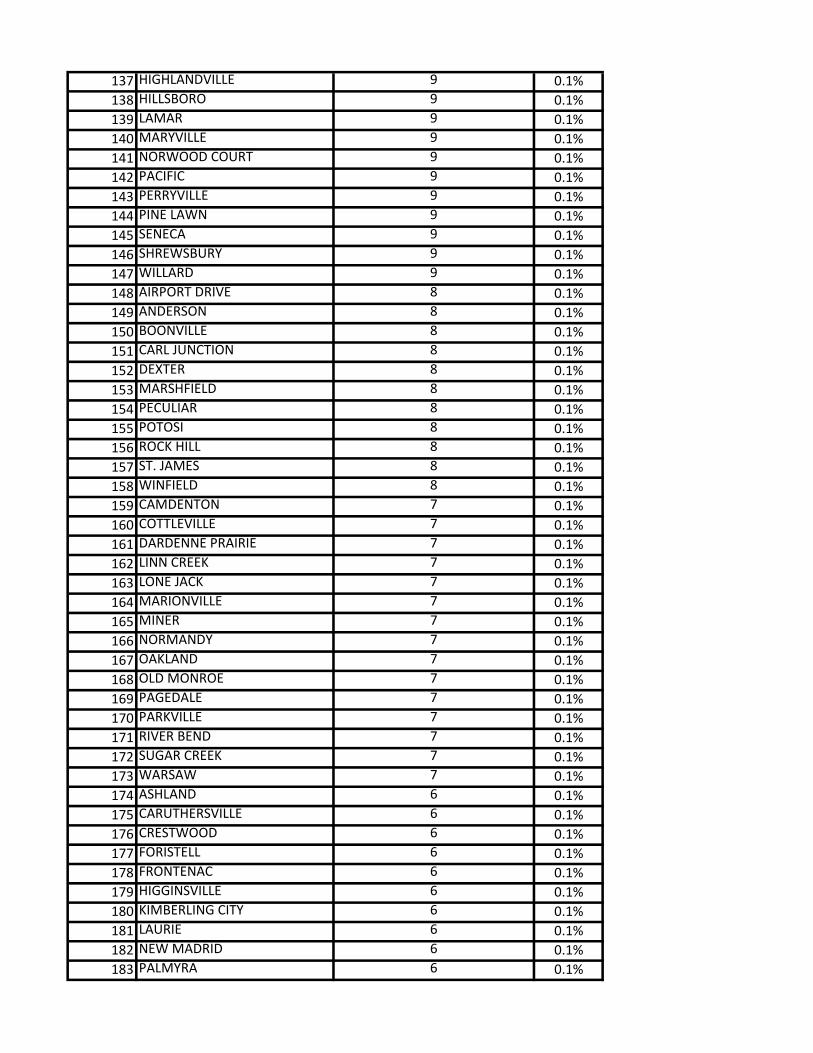
137 HIGHLANDVILLE 9 0.1%
138 HILLSBORO 9 0.1%
139 LAMAR 9 0.1%
140 MARYVILLE 9 0.1%
141 NORWOOD COURT 9 0.1%
142 PACIFIC 9 0.1%
143 PERRYVILLE 9 0.1%
144 PINE LAWN 9 0.1%
145 SENECA 9 0.1%
146 SHREWSBURY 9 0.1%
147 WILLARD 9 0.1%
148 AIRPORT DRIVE 8 0.1%
149 ANDERSON 8 0.1%
150 BOONVILLE 8 0.1%
151 CARL JUNCTION 8 0.1%
152 DEXTER 8 0.1%
153 MARSHFIELD 8 0.1%
154 PECULIAR 8 0.1%
155 POTOSI 8 0.1%
156 ROCK HILL 8 0.1%
157 ST. JAMES 8 0.1%
158 WINFIELD 8 0.1%
159 CAMDENTON 7 0.1%
160 COTTLEVILLE 7 0.1%
161 DARDENNE PRAIRIE 7 0.1%
162 LINN CREEK 7 0.1%
163 LONE JACK 7 0.1%
164 MARIONVILLE 7 0.1%
165 MINER 7 0.1%
166 NORMANDY 7 0.1%
167 OAKLAND 7 0.1%
168 OLD MONROE 7 0.1%
169 PAGEDALE 7 0.1%
170 PARKVILLE 7 0.1%
171 RIVER BEND 7 0.1%
172 SUGAR CREEK 7 0.1%
173 WARSAW 7 0.1%
174 ASHLAND 6 0.1%
175 CARUTHERSVILLE 6 0.1%
176 CRESTWOOD 6 0.1%
177 FORISTELL 6 0.1%
178 FRONTENAC 6 0.1%
179 HIGGINSVILLE 6 0.1%
180 KIMBERLING CITY 6 0.1%
181 LAURIE 6 0.1%
182 NEW MADRID 6 0.1%
183 PALMYRA 6 0.1%
vanlot1
Typewritten Text
vanlot1
Typewritten Text
vanlot1
Typewritten Text
vanlot1
Typewritten Text
vanlot1
Typewritten Text
vanlot1
Typewritten Text
vanlot1
Typewritten Text
vanlot1
Typewritten Text
vanlot1
Typewritten Text
Appendix G
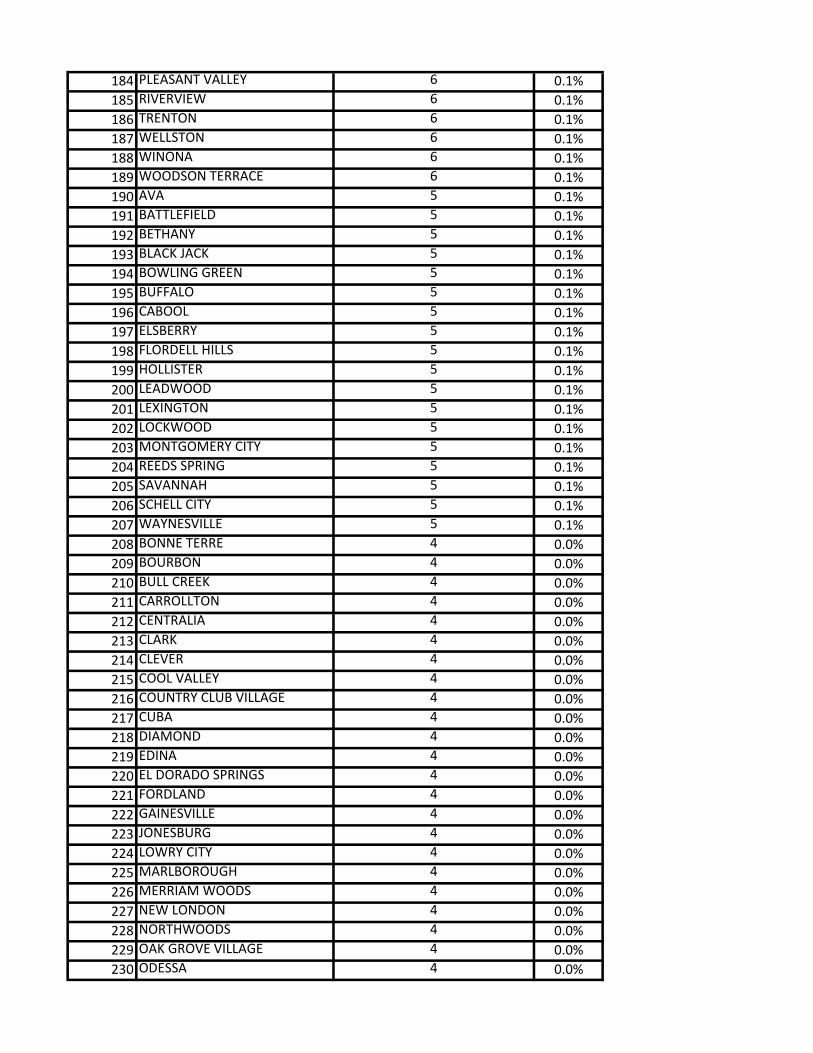
184 PLEASANT VALLEY 6 0.1%
185 RIVERVIEW 6 0.1%
186 TRENTON 6 0.1%
187 WELLSTON 6 0.1%
188 WINONA 6 0.1%
189 WOODSON TERRACE 6 0.1%
190 AVA 5 0.1%
191 BATTLEFIELD 5 0.1%
192 BETHANY 5 0.1%
193 BLACK JACK 5 0.1%
194 BOWLING GREEN 5 0.1%
195 BUFFALO 5 0.1%
196 CABOOL 5 0.1%
197 ELSBERRY 5 0.1%
198 FLORDELL HILLS 5 0.1%
199 HOLLISTER 5 0.1%
200 LEADWOOD 5 0.1%
201 LEXINGTON 5 0.1%
202 LOCKWOOD 5 0.1%
203 MONTGOMERY CITY 5 0.1%
204 REEDS SPRING 5 0.1%
205 SAVANNAH 5 0.1%
206 SCHELL CITY 5 0.1%
207 WAYNESVILLE 5 0.1%
208 BONNE TERRE 4 0.0%
209 BOURBON 4 0.0%
210 BULL CREEK 4 0.0%
211 CARROLLTON 4 0.0%
212 CENTRALIA 4 0.0%
213 CLARK 4 0.0%
214 CLEVER 4 0.0%
215 COOL VALLEY 4 0.0%
216 COUNTRY CLUB VILLAGE 4 0.0%
217 CUBA 4 0.0%
218 DIAMOND 4 0.0%
219 EDINA 4 0.0%
220 EL DORADO SPRINGS 4 0.0%
221 FORDLAND 4 0.0%
222 GAINESVILLE 4 0.0%
223 JONESBURG 4 0.0%
224 LOWRY CITY 4 0.0%
225 MARLBOROUGH 4 0.0%
226 MERRIAM WOODS 4 0.0%
227 NEW LONDON 4 0.0%
228 NORTHWOODS 4 0.0%
229 OAK GROVE VILLAGE 4 0.0%
230 ODESSA 4 0.0%
vanlot1
Typewritten Text
vanlot1
Typewritten Text
vanlot1
Typewritten Text
vanlot1
Typewritten Text
vanlot1
Typewritten Text
vanlot1
Typewritten Text
Appendix G

231 OWENSVILLE 4 0.0%
232 SCOTT CITY 4 0.0%
233 SPARTA 4 0.0%
234 STEELE 4 0.0%
235 TAOS 4 0.0%
236 WINDSOR PLACE 4 0.0%
237 BEL-NOR 3 0.0%
238 BERNIE 3 0.0%
239 BRECKENRIDGE HILLS 3 0.0%
240 BRUNSWICK 3 0.0%
241 CALIFORNIA 3 0.0%
242 CONWAY 3 0.0%
243 COUNTRY CLUB HILLS 3 0.0%
244 DUQUESNE 3 0.0%
245 ELLSINORE 3 0.0%
246 EMINENCE 3 0.0%
247 FREEMAN 3 0.0%
248 GALENA 3 0.0%
249 GARDEN CITY 3 0.0%
250 GORDONVILLE 3 0.0%
251 HERMANN 3 0.0%
252 HOUSTON 3 0.0%
253 IBERIA 3 0.0%
254 IRONTON 3 0.0%
255 LEADINGTON 3 0.0%
256 LOUISIANA 3 0.0%
257 MARBLE HILL 3 0.0%
258 MOUNT VERNON 3 0.0%
259 MOUNTAIN GROVE 3 0.0%
260 NEW HAVEN 3 0.0%
261 PIERCE CITY 3 0.0%
262 PINEVILLE 3 0.0%
263 PORTAGE DES SIOUX 3 0.0%
264 STE. GENEVIEVE 3 0.0%
265 TWIN OAKS 3 0.0%
266 WESTON 3 0.0%
267 WOOD HEIGHTS 3 0.0%
268 APPLETON CITY 2 0.0%
269 BELLE 2 0.0%
270 BILLINGS 2 0.0%
271 BROOKFIELD 2 0.0%
272 BURLINGTON JUNCTION 2 0.0%
273 BUTLER 2 0.0%
274 BYRNES MILL 2 0.0%
275 CARTERVILLE 2 0.0%
276 CASSVILLE 2 0.0%
277 CENTER 2 0.0%
vanlot1
Typewritten Text
Appendix G
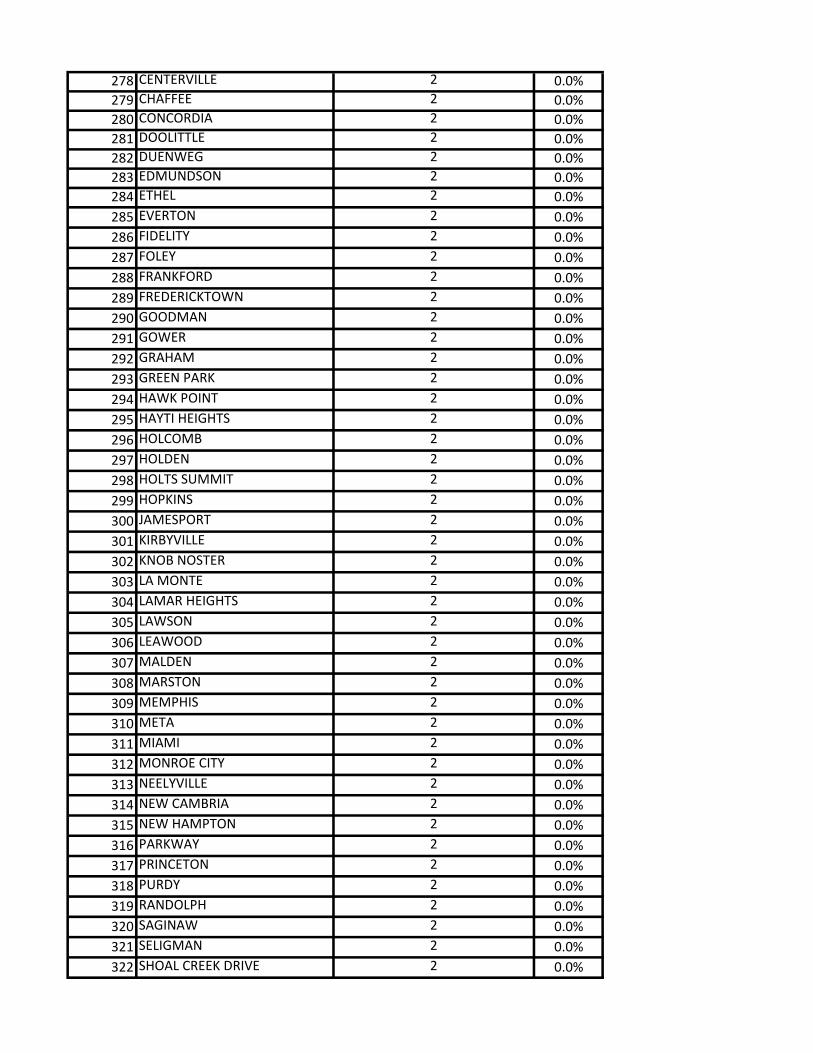
278 CENTERVILLE 2 0.0%
279 CHAFFEE 2 0.0%
280 CONCORDIA 2 0.0%
281 DOOLITTLE 2 0.0%
282 DUENWEG 2 0.0%
283 EDMUNDSON 2 0.0%
284 ETHEL 2 0.0%
285 EVERTON 2 0.0%
286 FIDELITY 2 0.0%
287 FOLEY 2 0.0%
288 FRANKFORD 2 0.0%
289 FREDERICKTOWN 2 0.0%
290 GOODMAN 2 0.0%
291 GOWER 2 0.0%
292 GRAHAM 2 0.0%
293 GREEN PARK 2 0.0%
294 HAWK POINT 2 0.0%
295 HAYTI HEIGHTS 2 0.0%
296 HOLCOMB 2 0.0%
297 HOLDEN 2 0.0%
298 HOLTS SUMMIT 2 0.0%
299 HOPKINS 2 0.0%
300 JAMESPORT 2 0.0%
301 KIRBYVILLE 2 0.0%
302 KNOB NOSTER 2 0.0%
303 LA MONTE 2 0.0%
304 LAMAR HEIGHTS 2 0.0%
305 LAWSON 2 0.0%
306 LEAWOOD 2 0.0%
307 MALDEN 2 0.0%
308 MARSTON 2 0.0%
309 MEMPHIS 2 0.0%
310 META 2 0.0%
311 MIAMI 2 0.0%
312 MONROE CITY 2 0.0%
313 NEELYVILLE 2 0.0%
314 NEW CAMBRIA 2 0.0%
315 NEW HAMPTON 2 0.0%
316 PARKWAY 2 0.0%
317 PRINCETON 2 0.0%
318 PURDY 2 0.0%
319 RANDOLPH 2 0.0%
320 SAGINAW 2 0.0%
321 SELIGMAN 2 0.0%
322 SHOAL CREEK DRIVE 2 0.0%
vanlot1
Typewritten Text
vanlot1
Typewritten Text
Appendix G

323 SOUTHWEST CITY 2 0.0%
324 SPICKARD 2 0.0%
325 ST. MARTINS 2 0.0%
326 ST. THOMAS 2 0.0%
327 STANBERRY 2 0.0%
328 STEELVILLE 2 0.0%
329 STOUTLAND 2 0.0%
330 STOVER 2 0.0%
331 SUNRISE BEACH 2 0.0%
332 THAYER 2 0.0%
333 TIPTON 2 0.0%
334 UNIONVILLE 2 0.0%
335 URBANA 2 0.0%
336 VERONA 2 0.0%
337 VERSAILLES 2 0.0%
338 ADRIAN 1 0.0%
339 ADVANCE 1 0.0%
340 AGENCY 1 0.0%
341 ALBANY 1 0.0%
342 ALTAMONT 1 0.0%
343 ALTENBURG 1 0.0%
344 ANNISTON 1 0.0%
345 ARCHIE 1 0.0%
346 ARROW POINT 1 0.0%
347 ASH GROVE 1 0.0%
348 AUXVASSE 1 0.0%
349 BAGNELL 1 0.0%
350 BAKERSFIELD 1 0.0%
351 BARING 1 0.0%
352 BARNETT 1 0.0%
353 BATES CITY 1 0.0%
354 BELL CITY 1 0.0%
355 BERTRAND 1 0.0%
356 BEVERLY HILLS 1 0.0%
357 BEVIER 1 0.0%
358 BIEHLE 1 0.0%
359 BIG LAKE 1 0.0%
360 BIRCH TREE 1 0.0%
361 BLOOMSDALE 1 0.0%
362 BOSWORTH 1 0.0%
363 BRAGG CITY 1 0.0%
364 BRASHEAR 1 0.0%
365 BRAYMER 1 0.0%
366 BRECKENRIDGE 1 0.0%
vanlot1
Typewritten Text
Appendix G

367 BRUMLEY 1 0.0%
368 BUNKER 1 0.0%
369 CAINSVILLE 1 0.0%
370 CHILHOWEE 1 0.0%
371 CHULA 1 0.0%
372 CLARENCE 1 0.0%
373 CLARKSVILLE 1 0.0%
374 CLEVELAND 1 0.0%
375 COLLINS 1 0.0%
376 CROSS TIMBERS 1 0.0%
377 CRYSTAL LAKES 1 0.0%
378 CURRYVILLE 1 0.0%
379 DEARBORN 1 0.0%
380 DELTA 1 0.0%
381 DIXON 1 0.0%
382 DOWNING 1 0.0%
383 DREXEL 1 0.0%
384 DUTCHTOWN 1 0.0%
385 EAGLEVILLE 1 0.0%
386 ELLINGTON 1 0.0%
387 EOLIA 1 0.0%
388 ESSEX 1 0.0%
389 EVERGREEN 1 0.0%
390 FARLEY 1 0.0%
391 FAYETTE 1 0.0%
392 FLINT HILL 1 0.0%
393 FREISTATT 1 0.0%
394 GALLATIN 1 0.0%
395 GLASGOW 1 0.0%
396 GRANT CITY 1 0.0%
397 GREENFIELD 1 0.0%
398 GREENWOOD 1 0.0%
399 HALLSVILLE 1 0.0%
400 HAMILTON 1 0.0%
401 HANLEY HILLS 1 0.0%
402 HARRISBURG 1 0.0%
403 HENRIETTA 1 0.0%
404 HERMITAGE 1 0.0%
405 HIGBEE 1 0.0%
406 HIGH HILL 1 0.0%
407 HUMANSVILLE 1 0.0%
408 HUNTSVILLE 1 0.0%
409 HURLEY 1 0.0%
410 INNSBROOK 1 0.0%
vanlot1
Typewritten Text
vanlot1
Typewritten Text
Appendix G

411 JANE 1 0.0%
412 JASPER 1 0.0%
413 JERICO SPRINGS 1 0.0%
414 JOSEPHVILLE 1 0.0%
415 KEYTESVILLE 1 0.0%
416 KNOX CITY 1 0.0%
417 KOSHKONONG 1 0.0%
418 LA BELLE 1 0.0%
419 LACLEDE 1 0.0%
420 LADDONIA 1 0.0%
421 LAKE LAFAYETTE 1 0.0%
422 LAKE TAPAWINGO 1 0.0%
423 LANCASTER 1 0.0%
424 LEASBURG 1 0.0%
425 LEVASY 1 0.0%
426 LICKING 1 0.0%
427 LINN 1 0.0%
428 LUDLOW 1 0.0%
429 LURAY 1 0.0%
430 MADISON 1 0.0%
431 MANSFIELD 1 0.0%
432 MARCELINE 1 0.0%
433 MILAN 1 0.0%
434 MOUND CITY 1 0.0%
435 NAPOLEON 1 0.0%
436 NAYLOR 1 0.0%
437 NEW FLORENCE 1 0.0%
438 NEWBURG 1 0.0%
439 NOEL 1 0.0%
440 NORWOOD 1 0.0%
441 OLEAN 1 0.0%
442 ORAN 1 0.0%
443 OREGON 1 0.0%
444 OSCEOLA 1 0.0%
445 PARIS 1 0.0%
446 PASCOLA 1 0.0%
447 PASSAIC 1 0.0%
448 PATTONSBURG 1 0.0%
449 PERRY 1 0.0%
450 PICKERING 1 0.0%
451 PILOT KNOB 1 0.0%
452 PLATO 1 0.0%
453 PLATTE WOODS 1 0.0%
454 POINT LOOKOUT 1 0.0%
vanlot1
Typewritten Text
vanlot1
Typewritten Text
Appendix G

455 POLO 1 0.0%
456 PORTAGEVILLE 1 0.0%
457 QULIN 1 0.0%
458 RAYMONDVILLE 1 0.0%
459 REDINGS MILL 1 0.0%
460 RENSSELAER 1 0.0%
461 RICHLAND 1 0.0%
462 RIDGELY 1 0.0%
463 RISCO 1 0.0%
464 ROCKAWAY BEACH 1 0.0%
465 ROCKVILLE 1 0.0%
466 ROSCOE 1 0.0%
467 RUSHVILLE 1 0.0%
468 RUSSELLVILLE 1 0.0%
469 SADDLEBROOKE 1 0.0%
470 SALISBURY 1 0.0%
471 SARCOXIE 1 0.0%
472 SHERIDAN 1 0.0%
473 SILVER CREEK 1 0.0%
474 SLATER 1 0.0%
475 SOUTH LINEVILLE 1 0.0%
476 ST. CLOUD 1 0.0%
477 ST. ELIZABETH 1 0.0%
478 ST. PAUL 1 0.0%
479 STOCKTON 1 0.0%
480 STOTTS CITY 1 0.0%
481 SUMMERSVILLE 1 0.0%
482 TARKIO 1 0.0%
483 THEODOSIA 1 0.0%
484 TRACY 1 0.0%
485 TRUESDALE 1 0.0%
486 UNITY VILLAGE 1 0.0%
487 UPLANDS PARK 1 0.0%
488 URICH 1 0.0%
489 UTICA 1 0.0%
490 VAN BUREN 1 0.0%
491 VILLAGE OF FOUR SEASONS 1 0.0%
492 VILLAGE OF LOCH LLOYD 1 0.0%
493 VINITA PARK 1 0.0%
494 VINITA TERRACE 1 0.0%
495 WAYLAND 1 0.0%
496 WEATHERBY LAKE 1 0.0%
497 WELLSVILLE 1 0.0%
498 WHITE OAK 1 0.0%
vanlot1
Typewritten Text
vanlot1
Typewritten Text
Appendix G
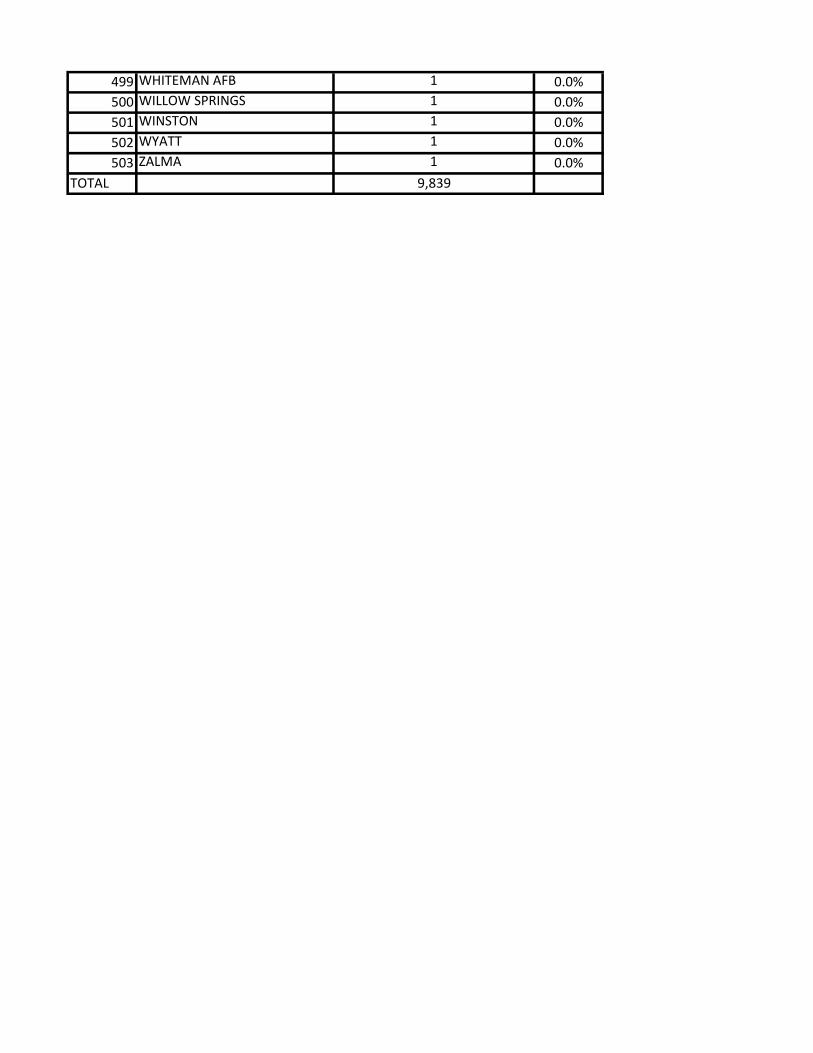
499 WHITEMAN AFB 1 0.0%
500 WILLOW SPRINGS 1 0.0%
501 WINSTON 1 0.0%
502 WYATT 1 0.0%
503 ZALMA 1 0.0%
TOTAL 9,839
vanlot1
Typewritten Text
vanlot1
Typewritten Text
vanlot1
Typewritten Text
vanlot1
Typewritten Text
vanlot1
Typewritten Text
Appendix G

Ranking County Count Percent
1 JACKSON 2,426 12.4%
2 ST. LOUIS 2,277 11.6%
3 ST. LOUIS CITY 958 4.9%
4 GREENE 780 4.0%
5 JEFFERSON 759 3.9%
6 ST. CHARLES 626 3.2%
7 CLAY 563 2.9%
8 BUCHANAN 555 2.8%
9 FRANKLIN 413 2.1%
10 BOONE 383 2.0%
11 CHRISTIAN 335 1.7%
12 JASPER 299 1.5%
13 LACLEDE 287 1.5%
14 COLE 270 1.4%
15 NEWTON 269 1.4%
16 TANEY 257 1.3%
17 LINCOLN 242 1.2%
18 CAPE GIRARDEAU 229 1.2%
19 PLATTE 211 1.1%
20 BARRY 206 1.1%
21 LAWRENCE 202 1.0%
22 CASS 198 1.0%
23 CAMDEN 180 0.9%
24 WEBSTER 179 0.9%
25 HOWELL 170 0.9%
26 CALLAWAY 169 0.9%
27 ST. FRANCOIS 165 0.8%
28 BUTLER 163 0.8%
29 JOHNSON 161 0.8%
30 STONE 160 0.8%
31 TEXAS 160 0.8%
32 PULASKI 156 0.8%
33 PETTIS 149 0.8%
34 PHELPS 144 0.7%
35 MILLER 140 0.7%
36 SCOTT 136 0.7%
37 MARION 133 0.7%
38 LAFAYETTE 130 0.7%
39 MCDONALD 128 0.7%
40 PEMISCOT 121 0.6%
41 RANDOLPH 120 0.6%
42 WASHINGTON 108 0.6%
2012-2016 MISSOURI SERIOUS INJURY TRAFFIC CRASHES
RANK ORDER COUNTY LIST
vanlot1
Typewritten Text
Appendix H
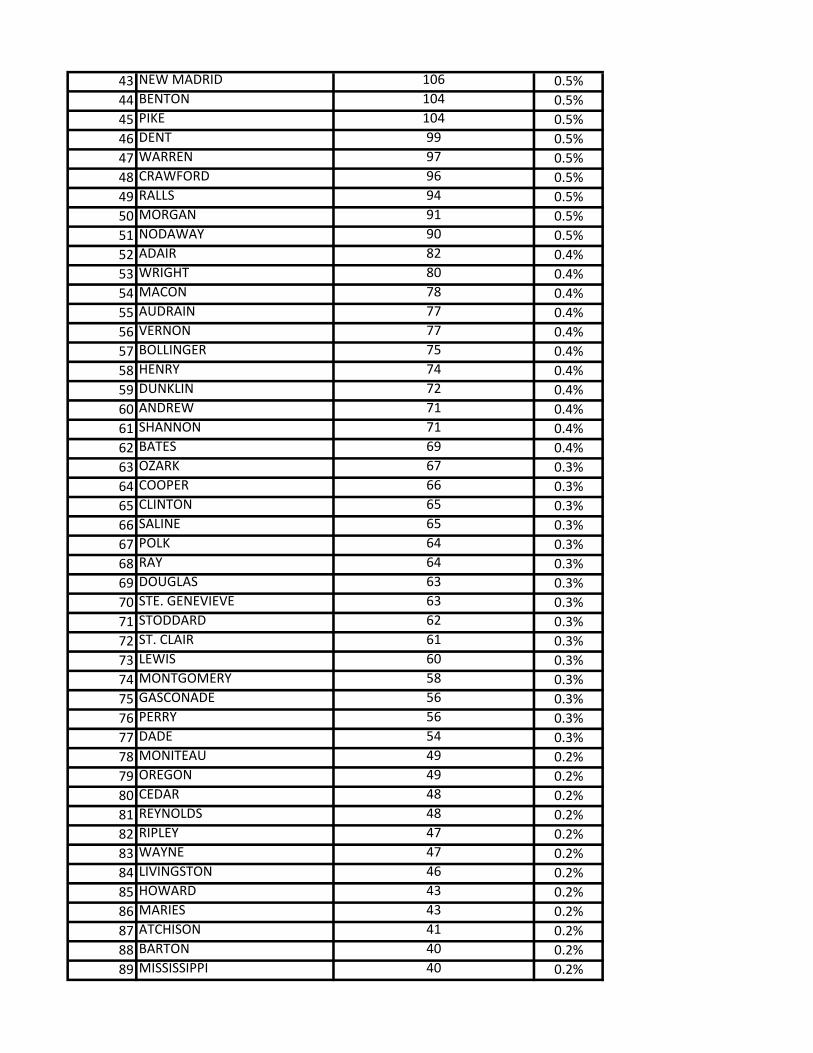
43 NEW MADRID 106 0.5%
44 BENTON 104 0.5%
45 PIKE 104 0.5%
46 DENT 99 0.5%
47 WARREN 97 0.5%
48 CRAWFORD 96 0.5%
49 RALLS 94 0.5%
50 MORGAN 91 0.5%
51 NODAWAY 90 0.5%
52 ADAIR 82 0.4%
53 WRIGHT 80 0.4%
54 MACON 78 0.4%
55 AUDRAIN 77 0.4%
56 VERNON 77 0.4%
57 BOLLINGER 75 0.4%
58 HENRY 74 0.4%
59 DUNKLIN 72 0.4%
60 ANDREW 71 0.4%
61 SHANNON 71 0.4%
62 BATES 69 0.4%
63 OZARK 67 0.3%
64 COOPER 66 0.3%
65 CLINTON 65 0.3%
66 SALINE 65 0.3%
67 POLK 64 0.3%
68 RAY 64 0.3%
69 DOUGLAS 63 0.3%
70 STE. GENEVIEVE 63 0.3%
71 STODDARD 62 0.3%
72 ST. CLAIR 61 0.3%
73 LEWIS 60 0.3%
74 MONTGOMERY 58 0.3%
75 GASCONADE 56 0.3%
76 PERRY 56 0.3%
77 DADE 54 0.3%
78 MONITEAU 49 0.2%
79 OREGON 49 0.2%
80 CEDAR 48 0.2%
81 REYNOLDS 48 0.2%
82 RIPLEY 47 0.2%
83 WAYNE 47 0.2%
84 LIVINGSTON 46 0.2%
85 HOWARD 43 0.2%
86 MARIES 43 0.2%
87 ATCHISON 41 0.2%
88 BARTON 40 0.2%
89 MISSISSIPPI 40 0.2%
vanlot1
Typewritten Text
Appendix H

90 HOLT 39 0.2%
91 IRON 39 0.2%
92 MONROE 36 0.2%
93 OSAGE 36 0.2%
94 CLARK 35 0.2%
95 DEKALB 35 0.2%
96 DAVIESS 34 0.2%
97 HARRISON 34 0.2%
98 KNOX 33 0.2%
99 CALDWELL 32 0.2%
100 SULLIVAN 32 0.2%
101 CHARITON 31 0.2%
102 LINN 31 0.2%
103 CARTER 29 0.1%
104 GRUNDY 28 0.1%
105 DALLAS 27 0.1%
106 CARROLL 26 0.1%
107 PUTNAM 26 0.1%
108 SHELBY 24 0.1%
109 GENTRY 22 0.1%
110 SCOTLAND 22 0.1%
111 MERCER 21 0.1%
112 MADISON 16 0.1%
113 SCHUYLER 15 0.1%
114 WORTH 8 0.0%
115 HICKORY 6 0.0%
TOTAL 19,606
vanlot1
Typewritten Text
Appendix H
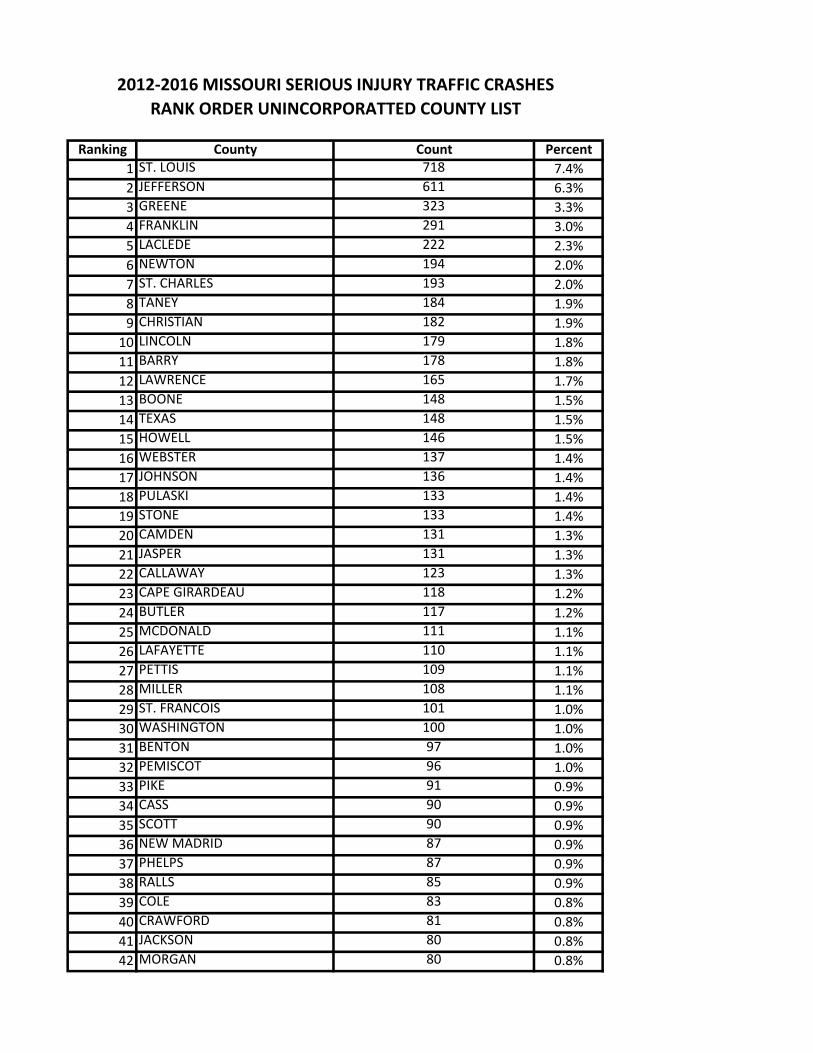
Ranking County Count Percent
1 ST. LOUIS 718 7.4%
2 JEFFERSON 611 6.3%
3 GREENE 323 3.3%
4 FRANKLIN 291 3.0%
5 LACLEDE 222 2.3%
6 NEWTON 194 2.0%
7 ST. CHARLES 193 2.0%
8 TANEY 184 1.9%
9 CHRISTIAN 182 1.9%
10 LINCOLN 179 1.8%
11 BARRY 178 1.8%
12 LAWRENCE 165 1.7%
13 BOONE 148 1.5%
14 TEXAS 148 1.5%
15 HOWELL 146 1.5%
16 WEBSTER 137 1.4%
17 JOHNSON 136 1.4%
18 PULASKI 133 1.4%
19 STONE 133 1.4%
20 CAMDEN 131 1.3%
21 JASPER 131 1.3%
22 CALLAWAY 123 1.3%
23 CAPE GIRARDEAU 118 1.2%
24 BUTLER 117 1.2%
25 MCDONALD 111 1.1%
26 LAFAYETTE 110 1.1%
27 PETTIS 109 1.1%
28 MILLER 108 1.1%
29 ST. FRANCOIS 101 1.0%
30 WASHINGTON 100 1.0%
31 BENTON 97 1.0%
32 PEMISCOT 96 1.0%
33 PIKE 91 0.9%
34 CASS 90 0.9%
35 SCOTT 90 0.9%
36 NEW MADRID 87 0.9%
37 PHELPS 87 0.9%
38 RALLS 85 0.9%
39 COLE 83 0.8%
40 CRAWFORD 81 0.8%
41 JACKSON 80 0.8%
42 MORGAN 80 0.8%
2012-2016 MISSOURI SERIOUS INJURY TRAFFIC CRASHES
RANK ORDER UNINCORPORATTED COUNTY LIST
vanlot1
Typewritten Text
Appendix I
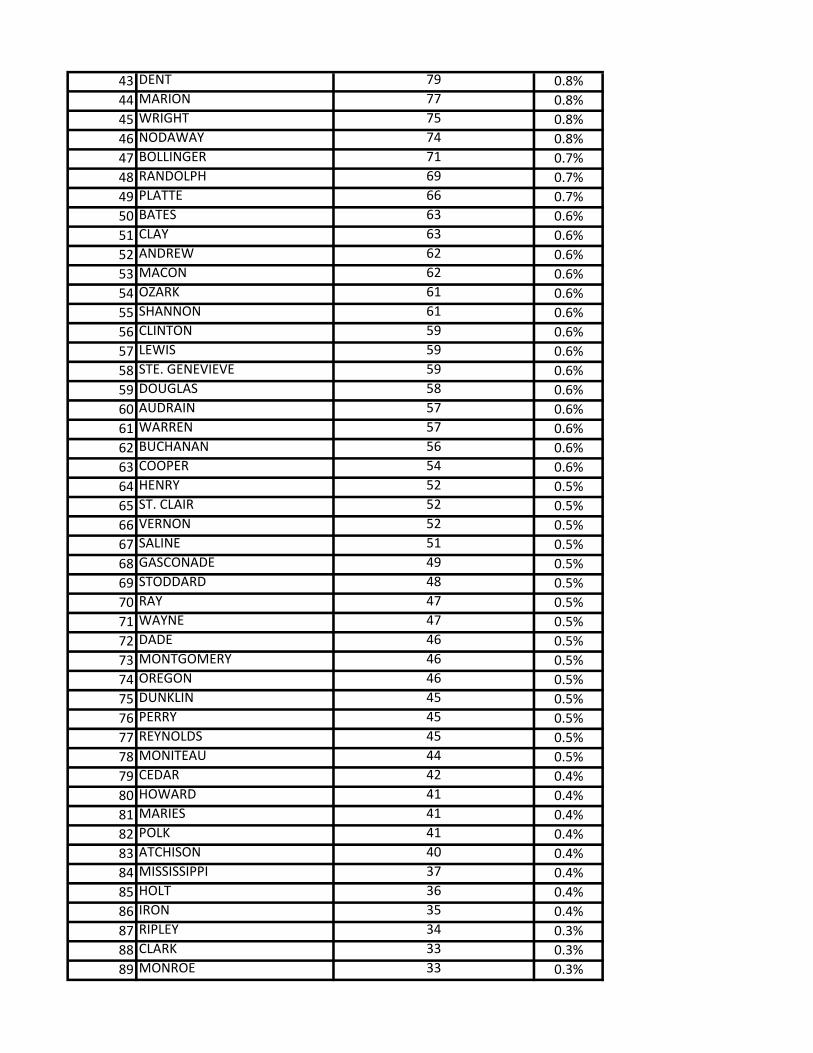
43 DENT 79 0.8%
44 MARION 77 0.8%
45 WRIGHT 75 0.8%
46 NODAWAY 74 0.8%
47 BOLLINGER 71 0.7%
48 RANDOLPH 69 0.7%
49 PLATTE 66 0.7%
50 BATES 63 0.6%
51 CLAY 63 0.6%
52 ANDREW 62 0.6%
53 MACON 62 0.6%
54 OZARK 61 0.6%
55 SHANNON 61 0.6%
56 CLINTON 59 0.6%
57 LEWIS 59 0.6%
58 STE. GENEVIEVE 59 0.6%
59 DOUGLAS 58 0.6%
60 AUDRAIN 57 0.6%
61 WARREN 57 0.6%
62 BUCHANAN 56 0.6%
63 COOPER 54 0.6%
64 HENRY 52 0.5%
65 ST. CLAIR 52 0.5%
66 VERNON 52 0.5%
67 SALINE 51 0.5%
68 GASCONADE 49 0.5%
69 STODDARD 48 0.5%
70 RAY 47 0.5%
71 WAYNE 47 0.5%
72 DADE 46 0.5%
73 MONTGOMERY 46 0.5%
74 OREGON 46 0.5%
75 DUNKLIN 45 0.5%
76 PERRY 45 0.5%
77 REYNOLDS 45 0.5%
78 MONITEAU 44 0.5%
79 CEDAR 42 0.4%
80 HOWARD 41 0.4%
81 MARIES 41 0.4%
82 POLK 41 0.4%
83 ATCHISON 40 0.4%
84 MISSISSIPPI 37 0.4%
85 HOLT 36 0.4%
86 IRON 35 0.4%
87 RIPLEY 34 0.3%
88 CLARK 33 0.3%
89 MONROE 33 0.3%
vanlot1
Typewritten Text
Appendix I
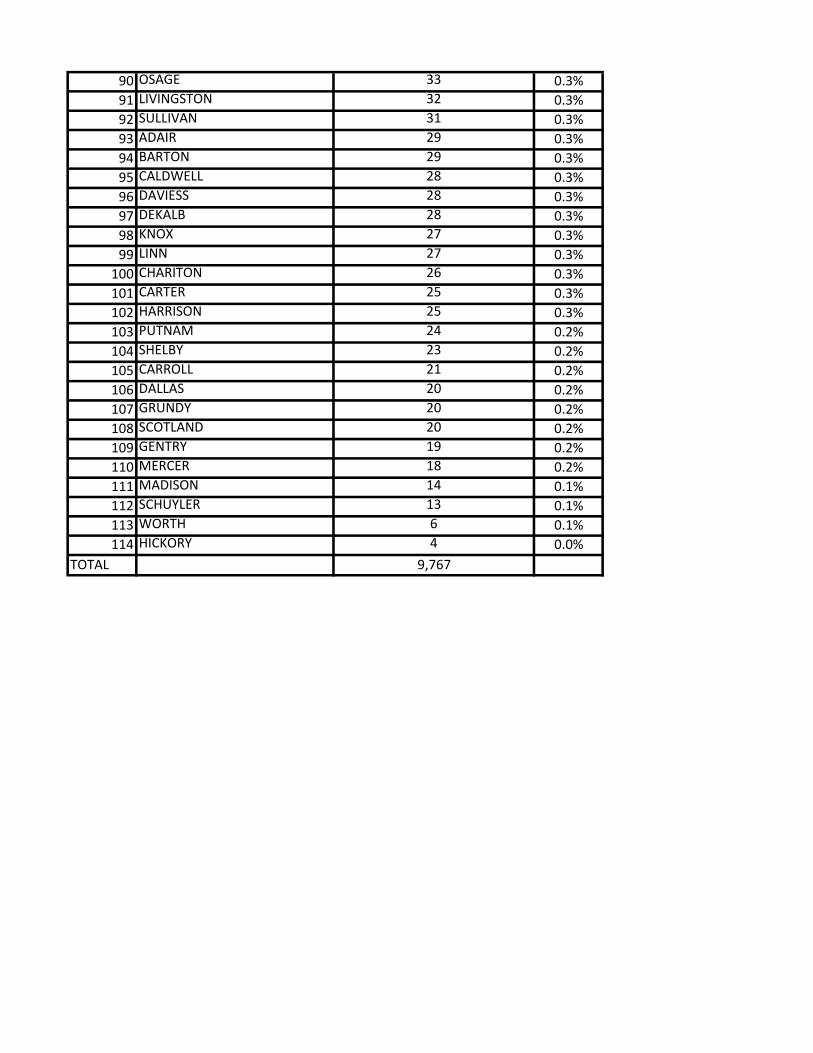
90 OSAGE 33 0.3%
91 LIVINGSTON 32 0.3%
92 SULLIVAN 31 0.3%
93 ADAIR 29 0.3%
94 BARTON 29 0.3%
95 CALDWELL 28 0.3%
96 DAVIESS 28 0.3%
97 DEKALB 28 0.3%
98 KNOX 27 0.3%
99 LINN 27 0.3%
100 CHARITON 26 0.3%
101 CARTER 25 0.3%
102 HARRISON 25 0.3%
103 PUTNAM 24 0.2%
104 SHELBY 23 0.2%
105 CARROLL 21 0.2%
106 DALLAS 20 0.2%
107 GRUNDY 20 0.2%
108 SCOTLAND 20 0.2%
109 GENTRY 19 0.2%
110 MERCER 18 0.2%
111 MADISON 14 0.1%
112 SCHUYLER 13 0.1%
113 WORTH 6 0.1%
114 HICKORY 4 0.0%
TOTAL 9,767
vanlot1
Typewritten Text
Appendix I
Related Documents