0 1,000 2,000 3,000 4,000 5,000 6,000 7,000 8,000 9,000 10,000 C alendarYear Deer Killed 3,629 3,491 3,675 3,698 4,350 4,740 5,641 6,389 6,180 6,334 6,664 8,453 8,061 8,913 NA 1990 1991 1992 1993 1994 1995 1996 1997 1998 1999 2000 2001 2002 2003 2004 0% 10% 20% 30% 40% 50% 60% 70% 80% 90% 100% Percent Passing $0 $650,000 $1,300,000 $1,950,000 $2,600,000 $3,250,000 $3,900,000 $4,550,000 $5,200,000 $5,850,000 $6,500,000 ProjectedCost toreachReallocationThresholds Threshold 70% 55% 60% 90% 75% 70% 75% 80% 80% State Av 75% 44% 60% 96% 75% 55% 65% 80% 89% RepairCost $782,650 $2,418,056 $198,774 $60,877 $1,543,654 $6,334,243 $538,332 $3,338,439 $0 PCC cracks/joints ACC trnsvrs/rndm cracks ACC lngtdnl cracks PCC surface cond. ACC surface cond. Culverts Drains Obstructed Ditches Erosion/Slides Highway Maintenance Performance Measurement Annual Report September 2004 20 25 30 35 40 45 50 55 60 65 70 75 2/14 N oon 2:00 P M 4:00 P M 6:00 P M 8:00 P M 10:00 P M Midnight 2:00 A M 4:00 A M 6:00 A M 8:00 A M 10:00 A M 2/15 N oon 2:00 P M 4:00 P M 6:00 P M 8:00 P M 10:00 P M Midnight 2:00 A M 4:00 A M 6:00 A M 8:00 A M 10:00 A M 2/16 N oon Time A verage M PH Shelby Atlantic W aukee AltoonaW B Altoona EB Ankeny Williamsburg LeClaire 45 50 55 60 65 70 75 80 85 90 95 100 Fiscal Years Index High District 87 78 75 79 Low District 75 69 71 70 State Average 80 74 73 75 FY01 FY02 FY03 FY04 0 45 90 135 180 225 270 315 360 405 450 D istrictA D istrictB D istrictC D istrictD DistrictE D istrictF $0 $9 $18 $27 $36 $45 $54 $63 $72 $81 $90 Paint& Bead C ostperM Y ellow av m cd W hite av m cd Cost/m ile

Highway Maintenance Performance Measurement Annual Report September 2004.
Dec 16, 2015
Welcome message from author
This document is posted to help you gain knowledge. Please leave a comment to let me know what you think about it! Share it to your friends and learn new things together.
Transcript

0
1,000
2,000
3,000
4,000
5,000
6,000
7,000
8,000
9,000
10,000
Calendar Year
Dee
r Kille
d on
Prim
ary
Hig
hway
s
Deer Killed 3,629 3,491 3,675 3,698 4,350 4,740 5,641 6,389 6,180 6,334 6,664 8,453 8,061 8,913 NA
1990 1991 1992 1993 1994 1995 1996 1997 1998 1999 2000 2001 2002 2003 2004
0%
10%
20%
30%
40%
50%
60%
70%
80%
90%
100%
Perce
nt Pa
ssing
$0
$650,000
$1,300,000
$1,950,000
$2,600,000
$3,250,000
$3,900,000
$4,550,000
$5,200,000
$5,850,000
$6,500,000
Proje
cted C
ost to
reac
h Rea
lloca
tion T
hres
holds
Threshold 70% 55% 60% 90% 75% 70% 75% 80% 80%
State Av 75% 44% 60% 96% 75% 55% 65% 80% 89%
Repair Cost $782,650 $2,418,056 $198,774 $60,877 $1,543,654 $6,334,243 $538,332 $3,338,439 $0
PCC cracks/joints
ACC trnsvrs/rndm
cracks
ACC lngtdnl cracks
PCC surface cond.
ACC surface cond.
Culverts DrainsObstructed
DitchesErosion/Slides
Highway Maintenance Performance MeasurementAnnual Report
September 2004
20
25
30
35
40
45
50
55
60
65
70
75
2/1
4 N
oo
n
2:0
0 P
M
4:0
0 P
M
6:0
0 P
M
8:0
0 P
M
10
:00
PM
Mid
nig
ht
2:0
0 A
M
4:0
0 A
M
6:0
0 A
M
8:0
0 A
M
10
:00
AM
2/1
5 N
oo
n
2:0
0 P
M
4:0
0 P
M
6:0
0 P
M
8:0
0 P
M
10
:00
PM
Mid
nig
ht
2:0
0 A
M
4:0
0 A
M
6:0
0 A
M
8:0
0 A
M
10
:00
AM
2/1
6 N
oo
n
Time
Ave
rag
e M
PH
Shelby Atlantic Waukee Altoona WB Altoona EB Ankeny Williamsburg LeClaire
45
50
55
60
65
70
75
80
85
90
95
100
Fiscal Years
Inde
x
High District 87 78 75 79
Low District 75 69 71 70
State Average 80 74 73 75
FY01 FY02 FY03 FY04
0
45
90
135
180
225
270
315
360
405
450
District A District B District C District D District E District F$0
$9
$18
$27
$36
$45
$54
$63
$72
$81
$90
Pai
nt &
Bea
d C
ost p
er M
ile
Yellow av mcd White av mcd Cost/mile
2
Annual Report Contents
Executive Summary pages 3 - 19
Performance Measurement Index Reallocation Thresholds, FY 04 State Average Performance & Repair Costs to
Bring All Districts up to the Reallocation Thresholds
Comparisons of Measures for Four Fiscal Years pages 20 - 57
Safety Motorist Services Preservation
Review of the Start of Calendar Year 2004 Paint Striping pages 59 - 65
Automated Performance Measures for Snow & Ice Results pages 66 - 76
Dead Deer Removal Report for Government Oversight Committee pages 77 - 82

3
Executive Summary Performance Measurement Index pages 4 - 15
1. Composite Index
2. Road Surface Index
3. Shoulder Index
4. Roadside/Drainage Index
5. Traffic Services Index
Reallocation Thresholds, FY 04 State Average Performance pages 16 - 19
& Repair Costs to Bring All Districts up to the Reallocation Thresholds1. Safety
2. Services
3. Preservation

4
Performance Measurement IndexThe Performance Measurement Index, formerly referred to as weighted scores, utilizes weighting factors
to produce yield a possible score of 100 for a composite score and for each of the four categories:
Road Surface, Shoulders, Roadside/Drainage and Traffic Services.
Safety elements assigned a weight of 5 for the percent passing include:
Pavement Potholes/Spalls & Ruts;
Shoulder Drop-off/Build-up;
Signs & Delineator/Hazard Markers Missing or Damaged;
Pavement Markings;
Guard Rail;
Trees in the Clear Zone or Interfering with Roadside Safety Features.
Motorist Services elements assigned a weight of 3 for the percent passing include:
Pavement Bumps & Depressions;
Signs & Delineator/Hazard Markers Height & Vertical;
Culvert & Station Markers Missing/Damaged Height/Vertical;
Noxious Weeds & Mowing;
Dead Animals or Litter Visible from the Roadway.
Preservation elements assigned a weight of 1 for the percent passing include:
Pavement Cracks/Joints & Surface Condition;
Culverts & Drains Damaged or Obstructed;
Obstructed Water Flow in Ditches & Erosion/Slides.

5
Performance Measurement Index Fiscal Year 2001 through 2004
Question: What are the statewide trends and variations for the
status of the system for the last four fiscal years?
Data:1. The Composite, Road Surface, Shoulder State Average Indices show a mild
trend downward from the FY 2001 baseline for FY 2002 - 2003 with a mild increase for FY 2004. There is moderate variation among the Districts.
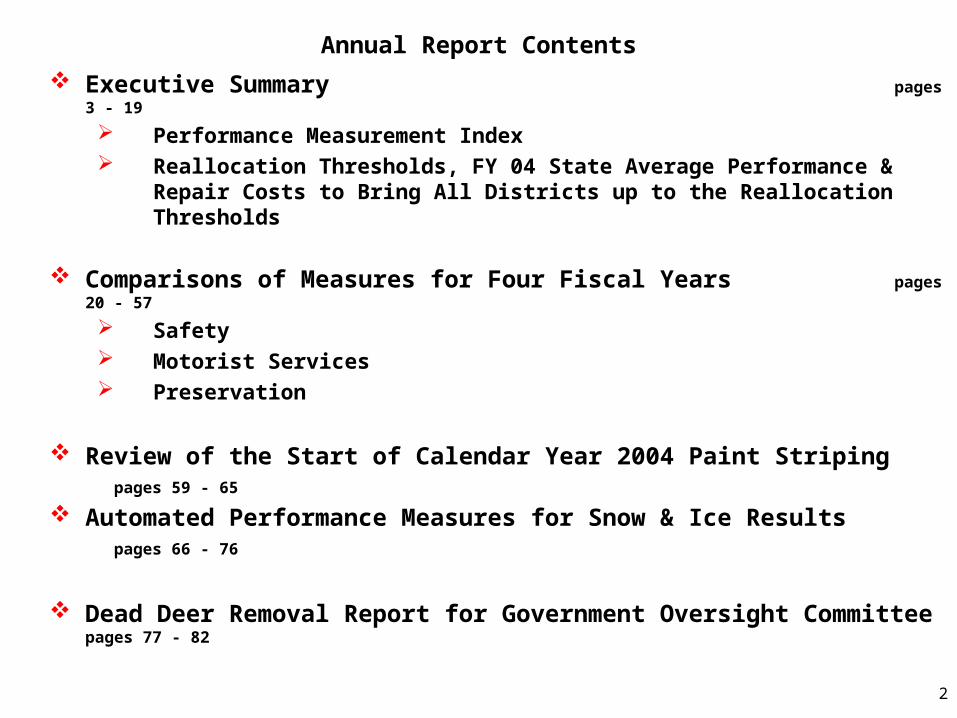
2. The Roadside State Average Index also shows a mild trend downward from the FY 2001 baseline for FY 2002 - 2003 with a mild increase for FY 2004. There is fairly substantial variation among the Districts, with a mean variation of 15 points for the four fiscal years.
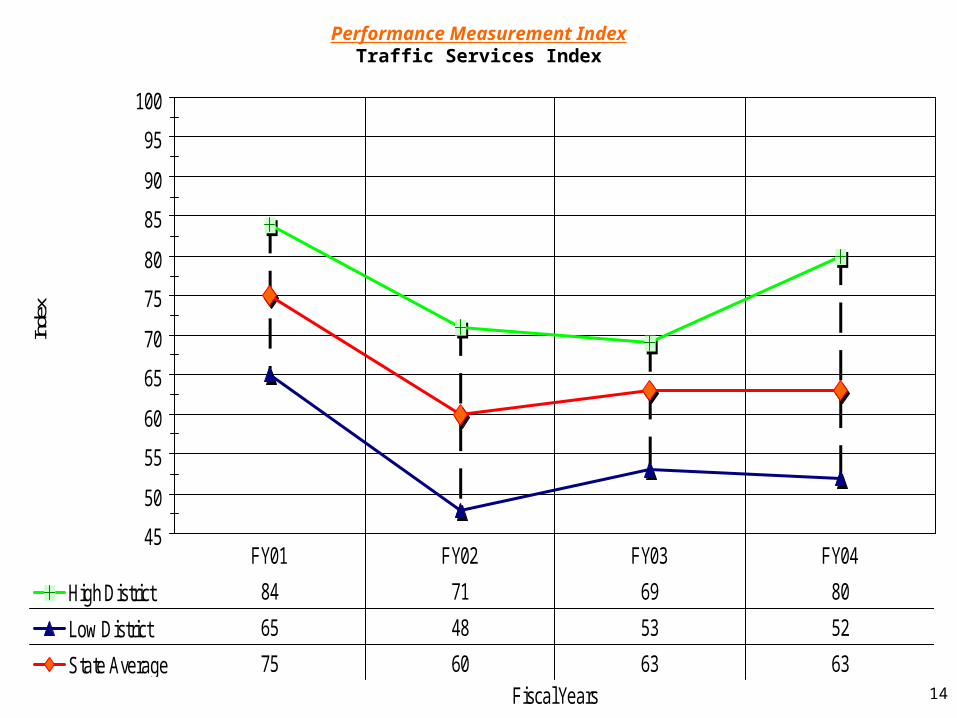
3. The Traffic Services State Average Index shows a drop of 19 points from the FY 2001 baseline to FY 2002 and then stabilizing for the last two fiscal years. The mean variation of 22 points among the Districts is substantial.

6
Performance Measurement IndexComposite Index
45
50
55
60
65
70
75
80
85
90
95
100
Fiscal Years
Inde
x
High District 87 78 75 79
Low District 75 69 71 70
State Average 80 74 73 75
FY01 FY02 FY03 FY04

7
Performance Measurement IndexComposite Index
45
50
55
60
65
70
75
80
85
90
95
100
Fiscal Years
Inde
x
District 1 81 71 71 79
District 2 87 80 75 71
District 3 75 69 71 70
District 4 75 70 72 73
District 5 82 78 73 77
District 6 81 75 73 76
FY01 FY02 FY03 FY04

8
Performance Measurement IndexRoad Surface Index
45
50
55
60
65
70
75
80
85
90
95
100
Fiscal Years
Inde
x
High District 92 89 86 88
Low District 82 75 74 79
State Average 86 83 83 84
FY01 FY02 FY03 FY04

9
Performance Measurement IndexRoad Surface Index
45
50
55
60
65
70
75
80
85
90
95
100
Fiscal Years
Inde
x
District 1 83 75 74 83
District 2 92 89 85 85
District 3 82 79 82 79
District 4 85 85 83 83
District 5 90 86 86 88
District 6 85 83 83 83
FY01 FY02 FY03 FY04

10
Performance Measurement IndexShoulder Index
45
50
55
60
65
70
75
80
85
90
95
100
Fiscal Years
Inde
x
High District 82 81 82 82
Low District 74 69 69 74
State Average 79 76 74 77
FY01 FY02 FY03 FY04

11
Performance Measurement IndexShoulder Index
45
50
55
60
65
70
75
80
85
90
95
100
Fiscal Years
Inde
x
District 1 80 69 70 76
District 2 82 81 82 82
District 3 74 76 75 77
District 4 75 76 74 76
District 5 79 79 69 74
District 6 81 80 80 82
FY01 FY02 FY03 FY04
12
Performance Measurement IndexRoadside/Drainage Index
45
50
55
60
65
70
75
80
85
90
95
100
Fiscal Years
Inde
x
High District 89 81 75 76
Low District 68 68 66 61
State Average 80 77 71 73
FY01 FY02 FY03 FY04

13
Performance Measurement IndexRoadside/Drainage Index
45
50
55
60
65
70
75
80
85
90
95
100
Fiscal Years
Inde
x
District 1 78 68 66 76
District 2 89 81 66 61
District 3 78 75 74 75
District 4 68 70 66 75
District 5 83 79 70 70
District 6 86 80 75 76
FY01 FY02 FY03 FY04
14
Performance Measurement IndexTraffic Services Index
45
50
55
60
65
70
75
80
85
90
95
100
Fiscal Years
Inde
x
High District 84 71 69 80
Low District 65 48 53 52
State Average 75 60 63 63
FY01 FY02 FY03 FY04

15
Performance Measurement IndexTraffic Services Index
45
50
55
60
65
70
75
80
85
90
95
100
Fiscal Years
Inde
x
District 1 84 71 69 80
District 2 83 70 63 53
District 3 65 49 53 52
District 4 70 48 63 60
District 5 77 67 64 71
District 6 72 59 57 61
FY01 FY02 FY03 FY04

16
Reallocation Thresholds, FY 2004 State Average Performance& Projected Repair Costs
Selected Performance Measurement Elements are Arranged by: Safety Motorist Services Preservation
Repair costs may be projected when the state average is above the Reallocation Threshold if some Districts are below the Threshold
Paths to Additional Information on DOTNET:1. Background on Reallocation Thresholds: DOTNET Highway Statewide Operations
Maintenance Performance Measurement Process What is a Reallocation Threshold
2. Reallocation Threshold Values: DOTNET Highway Statewide Operations Maintenance Performance Measurement Process Reallocation Threshold Values
3. Calculations for Projected Repair Costs: DOTNET Highway Statewide Operations Maintenance Performance Measurement Results Cost to Fix Data
Measured Elements that are not included in this report: Paved Shoulder: Potholes/Spalls, Faulting/Rolldown, Cracks/Joints, Bumps/Depressions, Surface Condition Unpaved Shoulder: Cross-slope, Surface Condition Cable Guardrail, Concrete Barrier Walls, Illumination
17
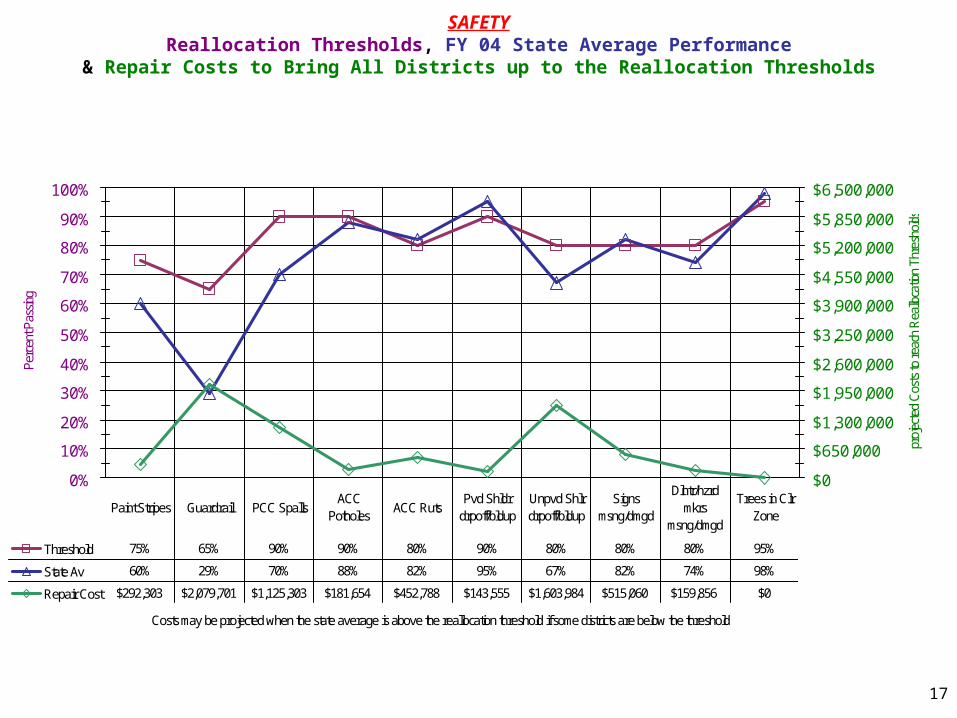
SAFETYReallocation Thresholds, FY 04 State Average Performance
& Repair Costs to Bring All Districts up to the Reallocation Thresholds
0%
10%
20%
30%
40%
50%
60%
70%
80%
90%
100%
Costs may be projected when the state average is above the reallocation threshold if some districts are below the threshold
Perc
ent P
assin
g
$0
$650,000
$1,300,000
$1,950,000
$2,600,000
$3,250,000
$3,900,000
$4,550,000
$5,200,000
$5,850,000
$6,500,000
proj
ecte
d C
osts
to re
ach
Rea
lloca
tion
Thre
shol
ds
Threshold 75% 65% 90% 90% 80% 90% 80% 80% 80% 95%
State Av 60% 29% 70% 88% 82% 95% 67% 82% 74% 98%
Repair Cost $292,303 $2,079,701 $1,125,303 $181,654 $452,788 $143,555 $1,603,984 $515,060 $159,856 $0
Paint Stripes Guardrail PCC SpallsACC
PotholesACC Ruts
Pvd Shldr drpoff/bldup
Unpvd Shlr drpoff/bldup
Signs msng/dmgd
Dlntr/hzrd mkrs
msng/dmgd
Trees in Clr Zone

18
MOTORIST SERVICES Reallocation Thresholds, FY 04 State Average Performance
& Repair Costs to Bring All Districts up to the Reallocation Thresholds
0%
10%
20%
30%
40%
50%
60%
70%
80%
90%
100%
Costs may be projected when the state average is above the reallocation threshold if some districts are below the threshold
Perce
nt Pa
ssing
$0
$650,000
$1,300,000
$1,950,000
$2,600,000
$3,250,000
$3,900,000
$4,550,000
$5,200,000
$5,850,000
$6,500,000
Proje
cted C
osts
to rea
ch R
ealloc
ation
Thres
holds
Threshold 90% 90% 90% 90% 65% 65% 65% 65% 70% 85% 65% 90%
State Av 97% 93% 97% 92% 49% 74% 59% 47% 54% 91% 45% 94%
Repair Cost $0 $22,157 $0 $91,422 $633,872 $670,151 $2,308 $943,713 $279,545 $633 $238,745 $0
PCC bmps/dprs
ns
ACC bmps/dprs
ns
PCC Faulting
ACC Rolldown
Sign ht/vrtcl
Dlnatrs/hzrd mrkrs ht/vtcl
Clvrt/statn mrkrs
mssng/dm
Clvrt/statn mrkrs ht/vtcl
Noxs weeds
Mowing LitterDead
Animals
19
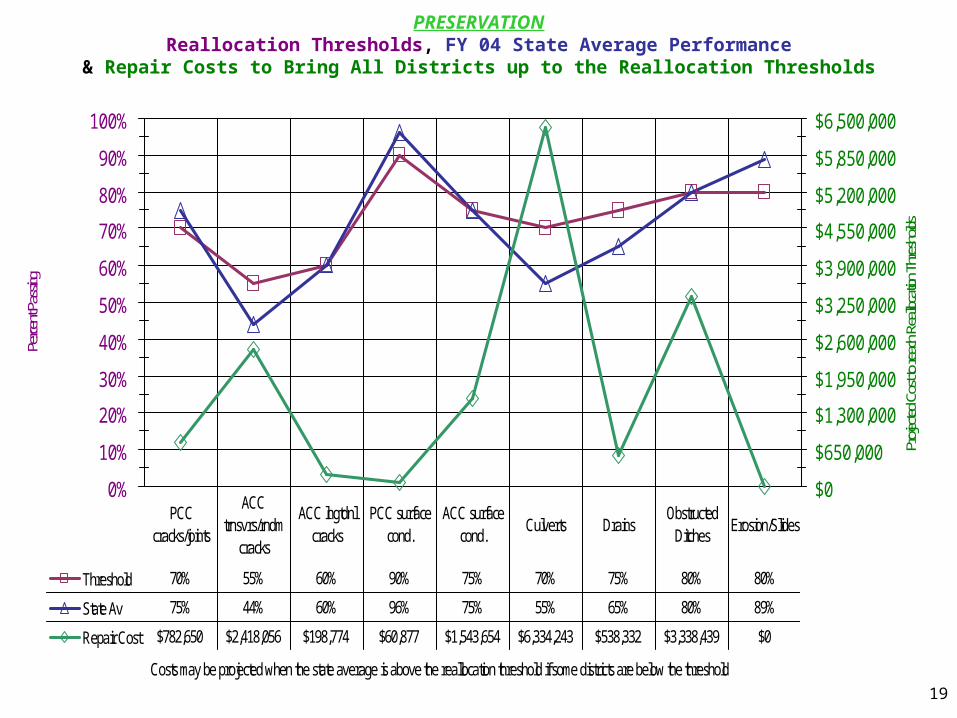
PRESERVATIONReallocation Thresholds, FY 04 State Average Performance
& Repair Costs to Bring All Districts up to the Reallocation Thresholds
0%
10%
20%
30%
40%
50%
60%
70%
80%
90%
100%
Costs may be projected when the state average is above the reallocation threshold if some districts are below the threshold
Perce
nt Pa
ssing
$0
$650,000
$1,300,000
$1,950,000
$2,600,000
$3,250,000
$3,900,000
$4,550,000
$5,200,000
$5,850,000
$6,500,000
Proje
cted C
ost to
reac
h Rea
llocati
on Th
resho
lds
Threshold 70% 55% 60% 90% 75% 70% 75% 80% 80%
State Av 75% 44% 60% 96% 75% 55% 65% 80% 89%
Repair Cost $782,650 $2,418,056 $198,774 $60,877 $1,543,654 $6,334,243 $538,332 $3,338,439 $0
PCC cracks/joints
ACC trnsvrs/rndm
cracks
ACC lngtdnl cracks
PCC surface cond.
ACC surface cond.
Culverts DrainsObstructed
DitchesErosion/Slides

20
Comparison of Measures for Four Fiscal Years Measurements of Percent Passing are shown for all of the Fiscal Years of the
program:
Fiscal Year Calendar Year Survey Cycles1. 2001 Summer 2000, Fall 2000, & Spring 20012. 2002 Summer 2001, Fall 2001, & Spring 20023. 2003 Summer 2002, Fall 2002, & Spring 20034. 2004 Summer 2003, Fall 2003, & Spring 2004
The same Elements from the previous section are arranged by Safety, Motorist Services & Preservation
Each graph shows for each Fiscal Year the State Average with the Scores for the Districts with the Highest Average & Lowest Average
Each graph indicates the Reallocation Threshold & Mean Sample Size for that Element per Fiscal Year
Paths to Additional Information on DOTNET: Element Definitions & Measurement Methodology: DOTNET Highway Statewide
Operations Maintenance Performance Measurement Process Printable Performance Measurement Manual
Data from individual Survey Cycles: DOTNET Highway Statewide Operations Maintenance Performance Measurement Results Tabulated & Graphed Data Percent Passing

21
Comparisons of Measures for Four Fiscal Years Safety pages 23
- 36
1. Pavement Markings2. Beam Guardrail 3. PCC Potholes/Spalls4. ACC Potholes5. ACC Wheel Ruts6. Paved Shoulder Drop-off or Build-up7. Unpaved Shoulder Drop-off or Build-up8. Signs Missing or Damaged9. Delineators & Hazard Markers Missing or Damaged10. Trees in Clear Zone or Interfering with Roadside Safety Features
Motorist Services pages 37 - 48
1. PCC Bumps or Depressions2. ACC Bumps or Depressions3. PCC Faulting4. ACC Rolldown5. Sign Height & Vertical6. Delineators & Hazard Markers Height & Vertical7. Culvert & Station Markers Missing or Damaged8. Culvert & Station Markers Height & Vertical9. Noxious Weeds10. Mowing11. Litter Visible from Roadway12. Dead Animals Visible from Roadway
22
Comparisons of Measures for Four Fiscal Years [continued]
Preservation pages 49 - 57
1. PCC Pavement Cracks & Joints
2. ACC Pavement Transverse & Random Cracks
3. ACC Pavement Longitudinal Cracks
4. PCC Surface Condition
5. ACC Surface Condition
6. Culverts Damaged or Obstructed
7. Drains Damaged or Obstructed
8. Obstructed Water Flow in Ditches
9. Slope Erosion & Slides

23
Comparisons of Measures for Four Fiscal Years
Questions:1. Are comparisons of amounts passing [counts, linear feet, square feet] better
indicators of condition for some performance measurement elements than the current standard measure of sample sites passed?
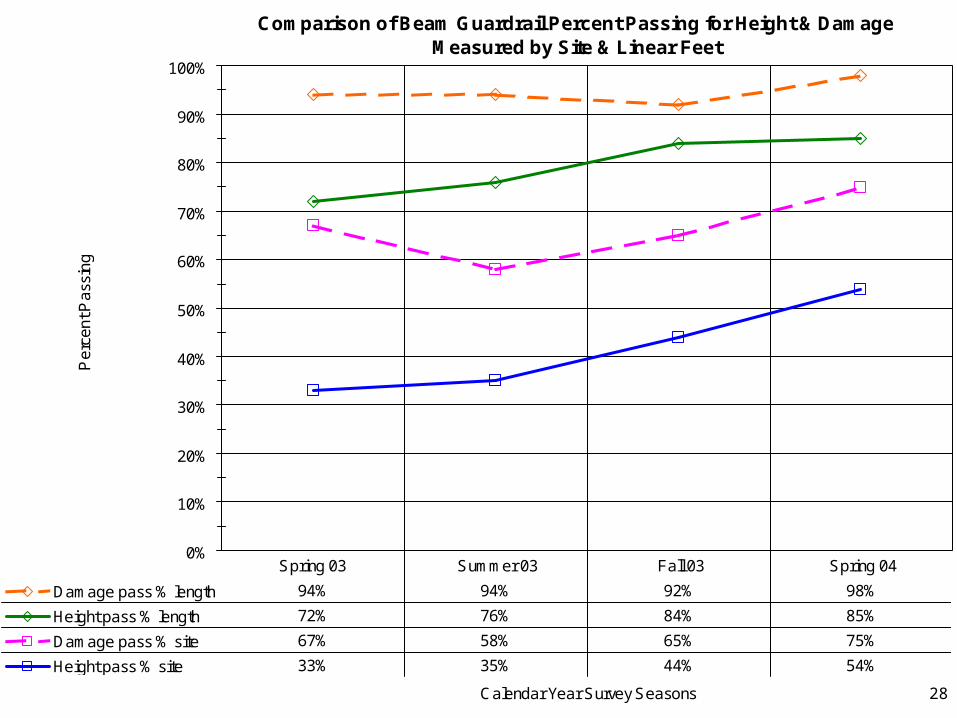
2. How much of guardrail defects are due to height?
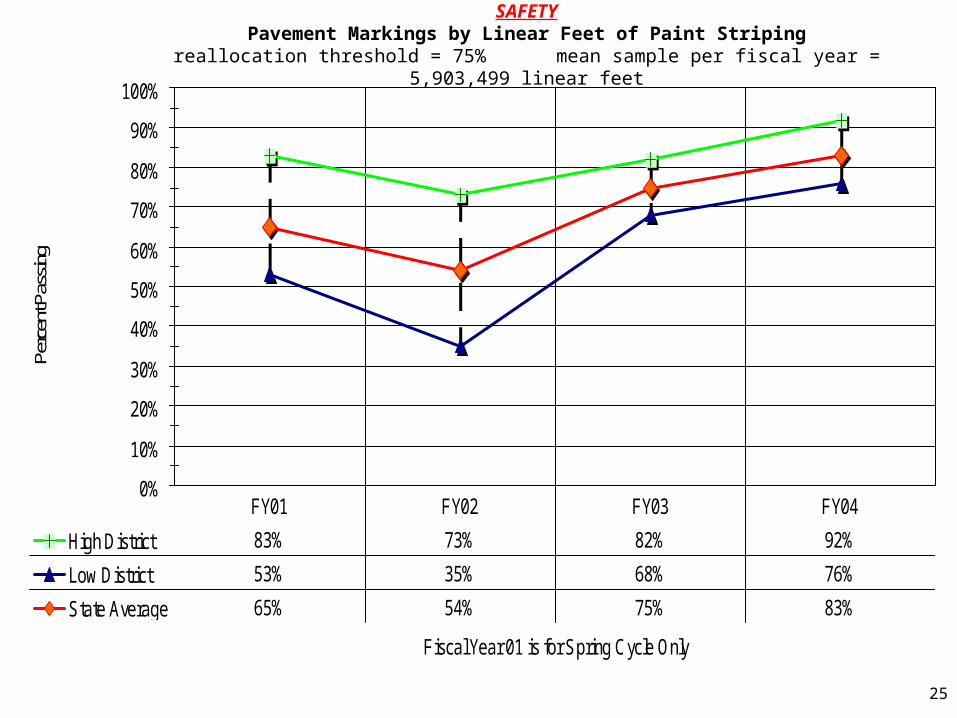
Discussion: In some District meetings in late 2003, there was discussion of whether some elements, such as pavement markings
and guardrail, would have their condition portrayed more accurately by the percentage of linear feet passing instead of the percentage of sample sites passing. In general, percentage of sites passing are used to describe system status and amounts passing are used to calculate projected repair costs.
Data:
1. The next four pages compare the two different approaches for pavement
markings and beam guardrail.
2. Whichever approach is used, height is the prevalent defect, based on the
last 4 survey cycles.

24
SAFETYPavement Markings by Sample Sites
reallocation threshold = 75% mean sample per fiscal year = 5,144 sites
0%
10%
20%
30%
40%
50%
60%
70%
80%
90%
100%
Fiscal Years
Perc
ent P
assin
g
High District 85% 44% 58% 75%
Low District 38% 13% 11% 32%
State Average 70% 31% 46% 60%
FY 01 FY 02 FY 03 FY 04
25
SAFETYPavement Markings by Linear Feet of Paint Striping
reallocation threshold = 75% mean sample per fiscal year = 5,903,499 linear feet
0%
10%
20%
30%
40%
50%
60%
70%
80%
90%
100%
Fiscal Year 01 is for Spring Cycle Only
Perc
ent P
assin
g
High District 83% 73% 82% 92%
Low District 53% 35% 68% 76%
State Average 65% 54% 75% 83%
FY01 FY02 FY03 FY04

26
SAFETYBeam Guardrail by Sample Sites
reallocation threshold = 65% mean sample per fiscal year = 294 sites
0%
10%
20%
30%
40%
50%
60%
70%
80%
90%
100%
Fiscal Years
Perc
ent P
assin
g
High District 69% 54% 58% 72%
Low District 28% 17% 12% 6%
State Average 46% 31% 26% 29%
FY01 FY02 FY03 FY04

27
SAFETYBeam Guardrail by Linear Feet of Guardrail
reallocation threshold = 65% mean sample per fiscal year = 63,867 linear feet
0%
10%
20%
30%
40%
50%
60%
70%
80%
90%
100%
Fiscal Year 01 is for Spring Cycle Only
Perc
ent P
assin
g
High District 98% 91% 94% 97%
Low District 52% 36% 57% 55%
State Average 73% 65% 71% 76%
FY01 FY02 FY03 FY04
28
Comparison of Beam Guardrail Percent Passing for Height & Damage Measured by Site & Linear Feet
0%
10%
20%
30%
40%
50%
60%
70%
80%
90%
100%
Calendar Year Survey Seasons
Pe
rce
nt P
ass
ing
Damage pass % length 94% 94% 92% 98%
Height pass % length 72% 76% 84% 85%
Damage pass % site 67% 58% 65% 75%
Height pass % site 33% 35% 44% 54%
Spring 03 Summer 03 Fall 03 Spring 04

29
SAFETYPCC Potholes/Spalls
reallocation threshold = 90% mean sample per fiscal year = 1,773
0%
10%
20%
30%
40%
50%
60%
70%
80%
90%
100%
Fiscal Years
Perc
ent P
assin
g
High District 94% 92% 86% 86%
Low District 48% 41% 51% 50%
State Average 75% 71% 68% 70%
FY01 FY02 FY03 FY04

30
SAFETYACC Potholes
reallocation threshold = 90% mean sample per fiscal year = 3,556
0%
10%
20%
30%
40%
50%
60%
70%
80%
90%
100%
Fiscal Years
Perc
ent P
assin
g
High District 97% 94% 95% 92%
Low District 88% 79% 80% 82%
State Average 93% 90% 87% 88%
FY01 FY02 FY03 FY04

31
SAFETYACC Wheel Ruts
reallocation threshold = 80% mean sample per fiscal year = 3,556
0%
10%
20%
30%
40%
50%
60%
70%
80%
90%
100%
Fiscal Years
Perc
ent P
assin
g
High District 87% 84% 85% 92%
Low District 76% 76% 65% 75%
State Average 84% 78% 80% 82%
FY01 FY02 FY03 FY04

32
SAFETYPaved Shoulder Drop-off/Build-up
reallocation threshold = 90% mean sample per fiscal year = 1,127
0%
10%
20%
30%
40%
50%
60%
70%
80%
90%
100%
Fiscal Years
Perc
ent P
assin
g
High District 100% 100% 99% 99%
Low District 96% 81% 85% 84%
State Average 98% 94% 95% 95%
FY01 FY02 FY03 FY04
33
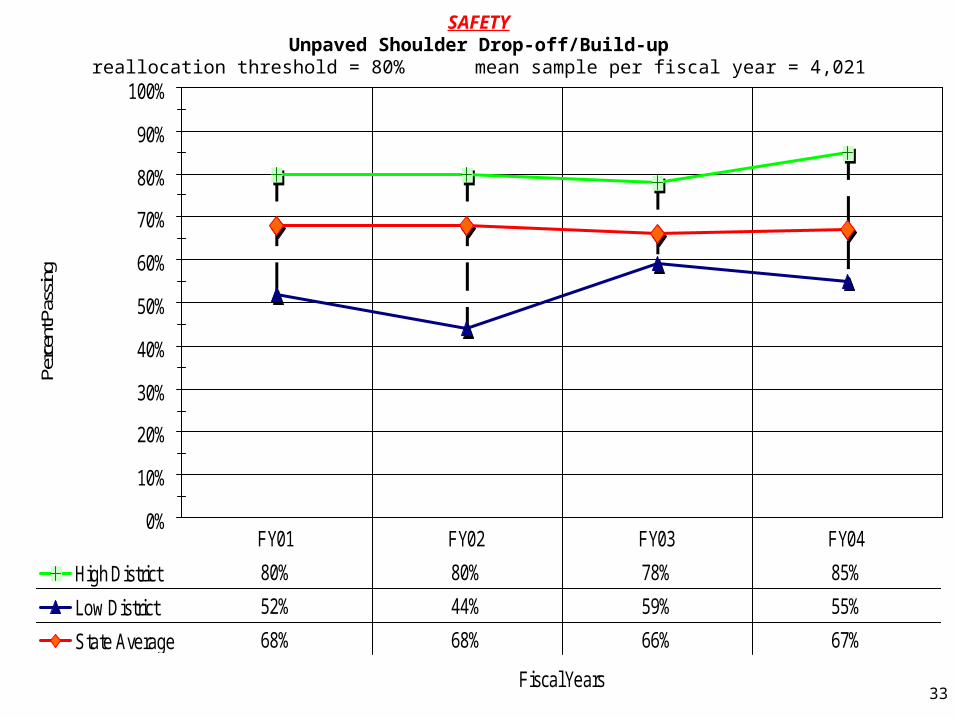
SAFETYUnpaved Shoulder Drop-off/Build-up
reallocation threshold = 80% mean sample per fiscal year = 4,021
0%
10%
20%
30%
40%
50%
60%
70%
80%
90%
100%
Fiscal Years
Perc
ent P
assin
g
High District 80% 80% 78% 85%
Low District 52% 44% 59% 55%
State Average 68% 68% 66% 67%
FY01 FY02 FY03 FY04

34
SAFETYSigns Missing or Damaged
reallocation threshold = 80% mean sample per fiscal year = 3,051
0%
10%
20%
30%
40%
50%
60%
70%
80%
90%
100%
Fiscal Years
Perc
ent P
assin
g
High District 79% 91% 90% 93%
Low District 52% 58% 62% 63%
State Average 67% 79% 81% 82%
FY01 FY02 FY03 FY04

35
SAFETYDelineators & Hazard Markers Missing or Damaged
reallocation threshold = 80% mean sample per fiscal year = 1,867
0%
10%
20%
30%
40%
50%
60%
70%
80%
90%
100%
Fiscal Years
Perc
ent P
assin
g
High District 85% 84% 84% 82%
Low District 45% 68% 63% 65%
State Average 64% 78% 71% 74%
FY01 FY02 FY03 FY04
36
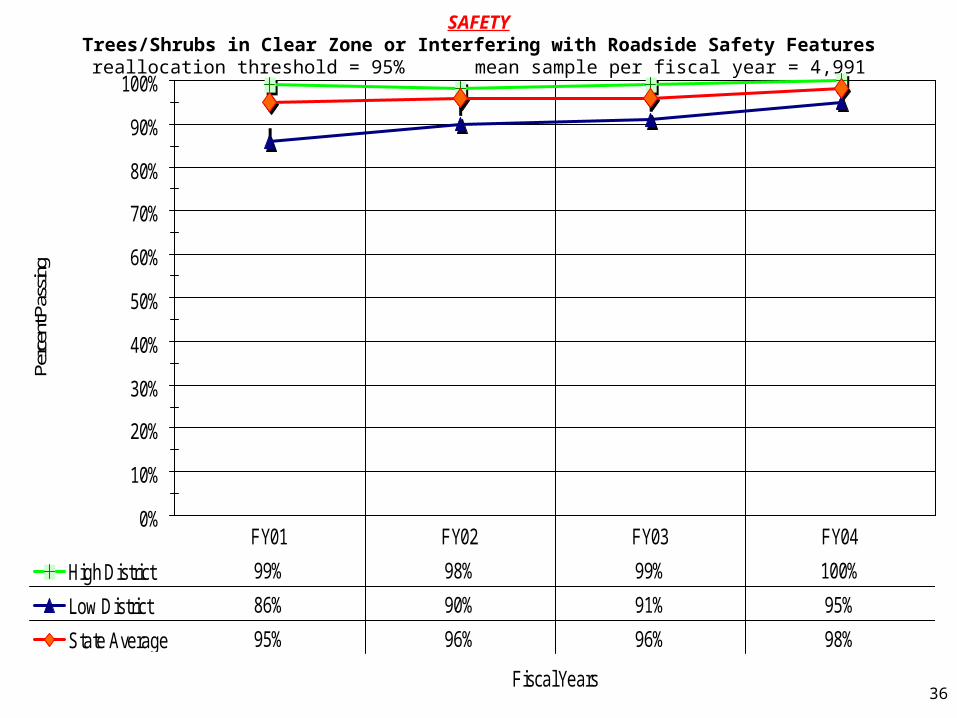
SAFETYTrees/Shrubs in Clear Zone or Interfering with Roadside Safety Features
reallocation threshold = 95% mean sample per fiscal year = 4,991
0%
10%
20%
30%
40%
50%
60%
70%
80%
90%
100%
Fiscal Years
Perc
ent P
assin
g
High District 99% 98% 99% 100%
Low District 86% 90% 91% 95%
State Average 95% 96% 96% 98%
FY01 FY02 FY03 FY04
37
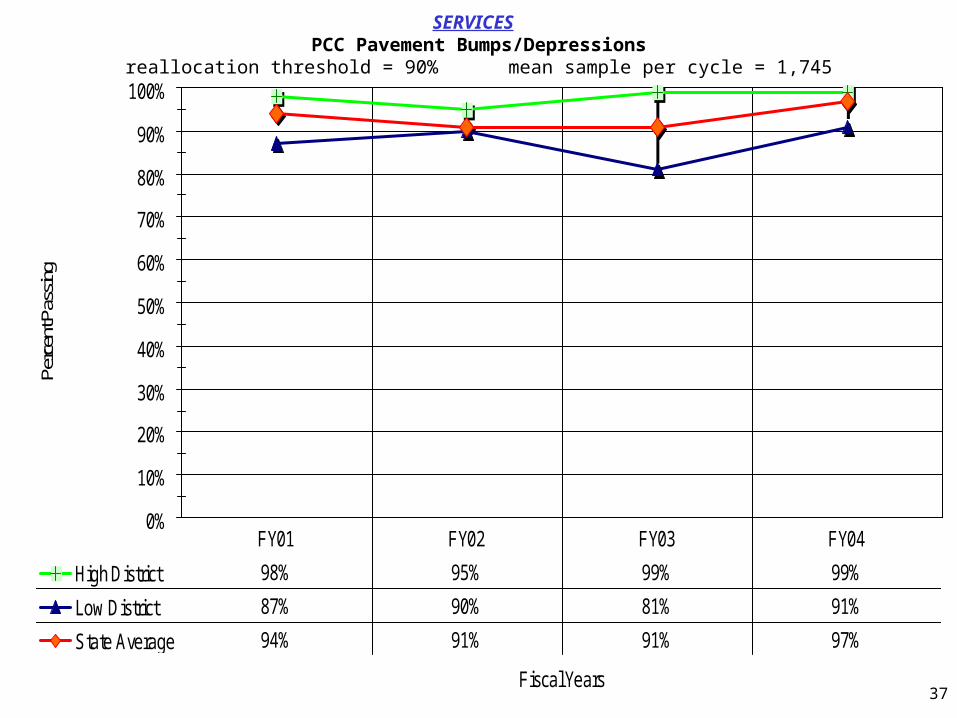
SERVICES PCC Pavement Bumps/Depressions
reallocation threshold = 90% mean sample per cycle = 1,745
0%
10%
20%
30%
40%
50%
60%
70%
80%
90%
100%
Fiscal Years
Perc
ent P
assin
g
High District 98% 95% 99% 99%
Low District 87% 90% 81% 91%
State Average 94% 91% 91% 97%
FY01 FY02 FY03 FY04
38
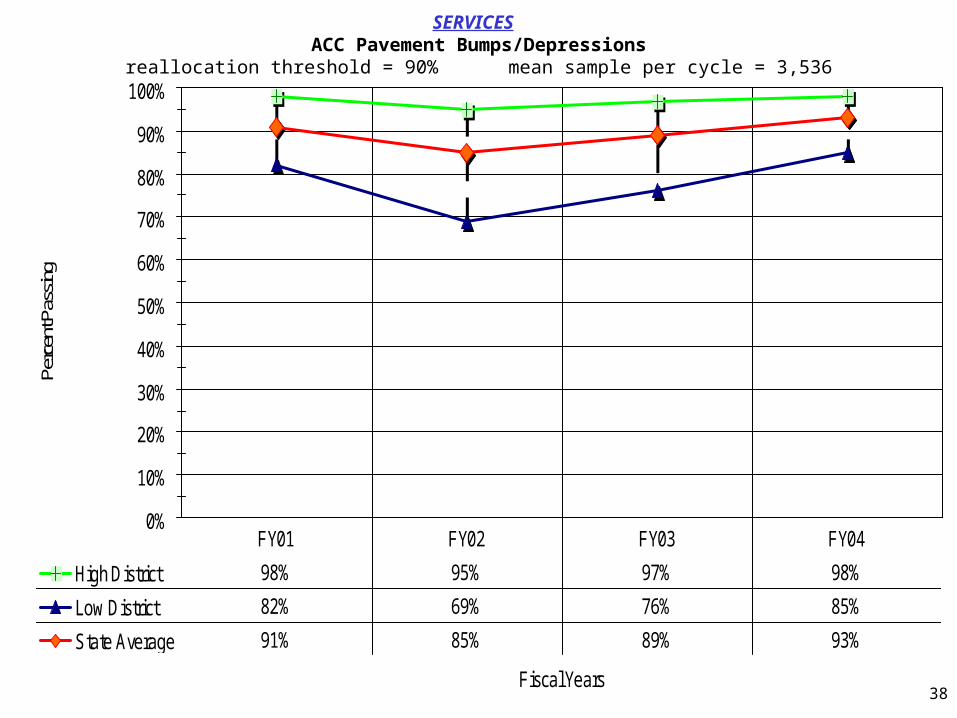
SERVICES ACC Pavement Bumps/Depressions
reallocation threshold = 90% mean sample per cycle = 3,536
0%
10%
20%
30%
40%
50%
60%
70%
80%
90%
100%
Fiscal Years
Perc
ent P
assin
g
High District 98% 95% 97% 98%
Low District 82% 69% 76% 85%
State Average 91% 85% 89% 93%
FY01 FY02 FY03 FY04

39
SERVICES PCC Faulting
reallocation threshold = 90% mean sample per cycle = 1,743
0%
10%
20%
30%
40%
50%
60%
70%
80%
90%
100%
Fiscal Years
Perc
ent P
assin
g
High District 100% 98% 100% 100%
Low District 88% 92% 94% 92%
State Average 96% 96% 98% 97%
FY01 FY02 FY03 FY04
40
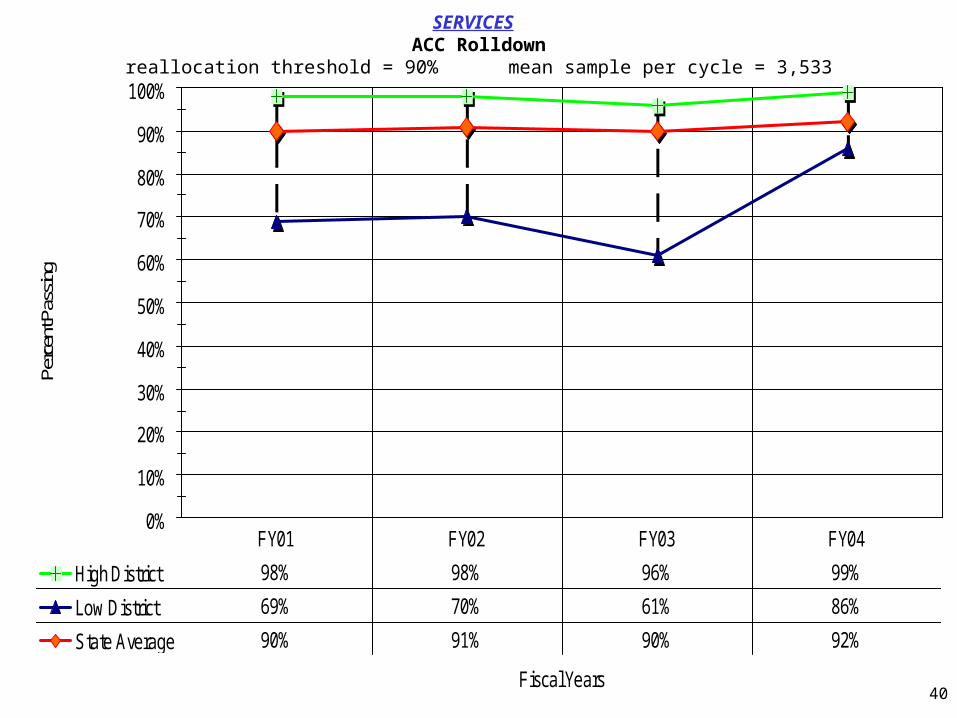
SERVICES ACC Rolldown
reallocation threshold = 90% mean sample per cycle = 3,533
0%
10%
20%
30%
40%
50%
60%
70%
80%
90%
100%
Fiscal Years
Perc
ent P
assin
g
High District 98% 98% 96% 99%
Low District 69% 70% 61% 86%
State Average 90% 91% 90% 92%
FY01 FY02 FY03 FY04

41
SERVICES Sign Height & Vertical
reallocation threshold = 65% mean sample per cycle = 3,051
0%
10%
20%
30%
40%
50%
60%
70%
80%
90%
100%
Fiscal Years
Perc
ent P
assin
g
High District 75% 69% 61% 64%
Low District 42% 38% 38% 43%
State Average 58% 54% 47% 49%
FY01 FY02 FY03 FY04

42
SERVICES Delineators & Hazard Markers Height & Vertical
reallocation threshold = 65% mean sample per cycle = 1,862
0%
10%
20%
30%
40%
50%
60%
70%
80%
90%
100%
Fiscal Years
Perc
ent P
assin
g
High District 80% 84% 84% 82%
Low District 26% 68% 63% 65%
State Average 56% 78% 71% 74%
FY01 FY02 FY03 FY04
43
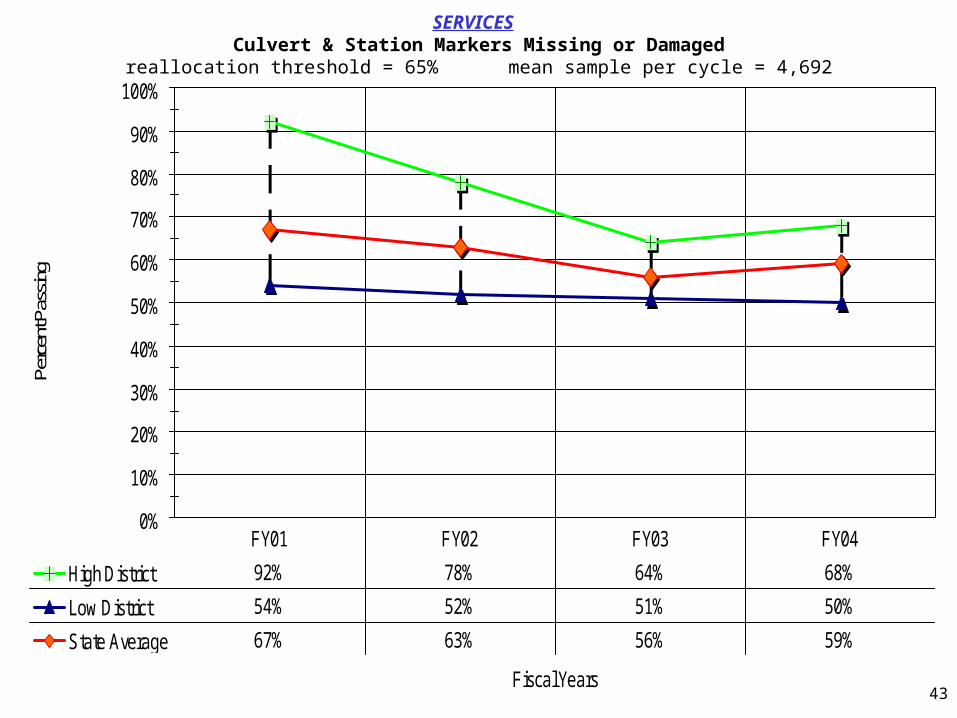
SERVICES Culvert & Station Markers Missing or Damaged
reallocation threshold = 65% mean sample per cycle = 4,692
0%
10%
20%
30%
40%
50%
60%
70%
80%
90%
100%
Fiscal Years
Perc
ent P
assin
g
High District 92% 78% 64% 68%
Low District 54% 52% 51% 50%
State Average 67% 63% 56% 59%
FY01 FY02 FY03 FY04
44
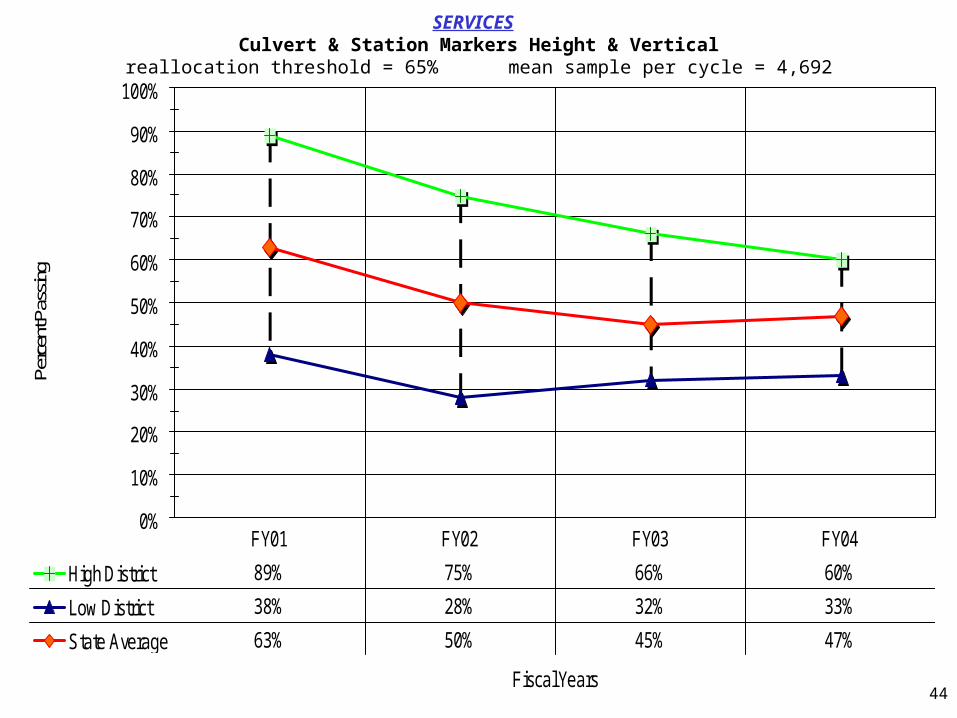
SERVICES Culvert & Station Markers Height & Vertical
reallocation threshold = 65% mean sample per cycle = 4,692
0%
10%
20%
30%
40%
50%
60%
70%
80%
90%
100%
Fiscal Years
Perc
ent P
assin
g
High District 89% 75% 66% 60%
Low District 38% 28% 32% 33%
State Average 63% 50% 45% 47%
FY01 FY02 FY03 FY04
45
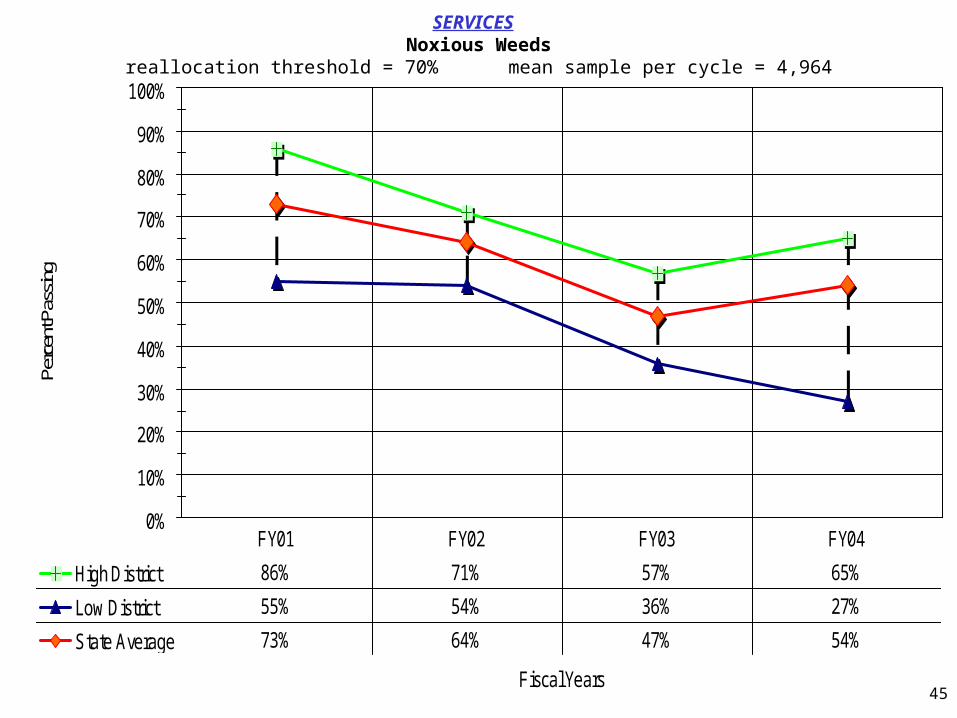
SERVICES Noxious Weeds
reallocation threshold = 70% mean sample per cycle = 4,964
0%
10%
20%
30%
40%
50%
60%
70%
80%
90%
100%
Fiscal Years
Perc
ent P
assin
g
High District 86% 71% 57% 65%
Low District 55% 54% 36% 27%
State Average 73% 64% 47% 54%
FY01 FY02 FY03 FY04

46
SERVICES Mowing
reallocation threshold = 85% mean sample per cycle = 4,872
0%
10%
20%
30%
40%
50%
60%
70%
80%
90%
100%
Fiscal Years
Perc
ent P
assin
g
High District 96% 95% 93% 98%
Low District 83% 77% 80% 84%
State Average 88% 85% 87% 91%
FY01 FY02 FY03 FY04

47
SERVICESDead Animals Visible from Roadway
reallocation threshold = 90% mean sample per cycle = 5,134
0%
10%
20%
30%
40%
50%
60%
70%
80%
90%
100%
Fiscal Years
Perc
ent P
assin
g
High District 99% 98% 98% 96%
Low District 86% 90% 93% 93%
State Average 95% 94% 95% 94%
FY01 FY02 FY03 FY04
48
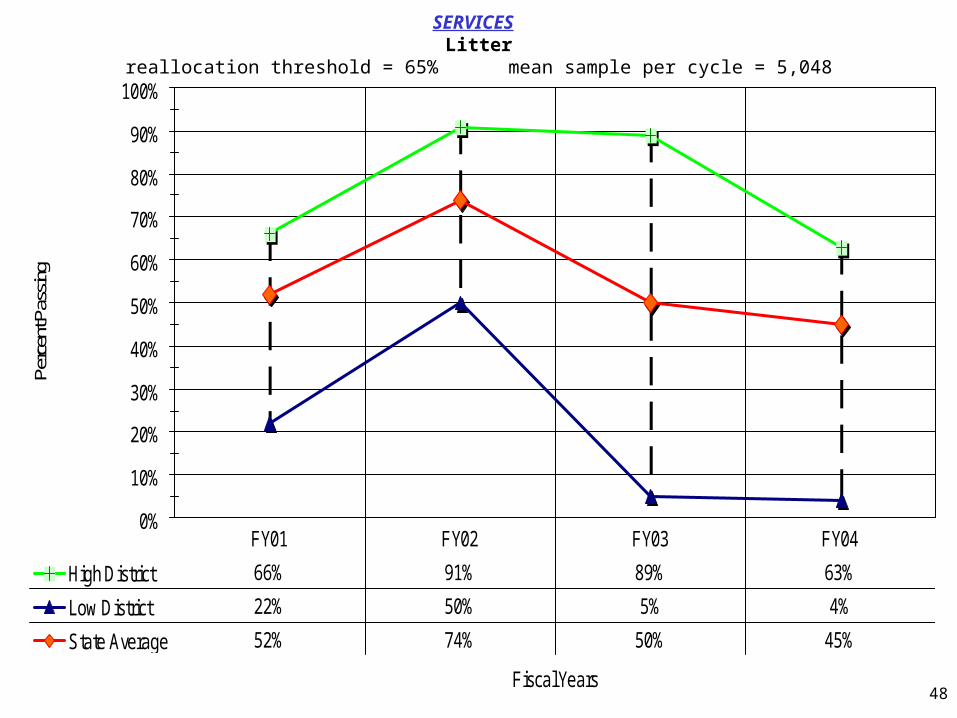
SERVICES Litter
reallocation threshold = 65% mean sample per cycle = 5,048
0%
10%
20%
30%
40%
50%
60%
70%
80%
90%
100%
Fiscal Years
Perc
ent P
assin
g
High District 66% 91% 89% 63%
Low District 22% 50% 5% 4%
State Average 52% 74% 50% 45%
FY01 FY02 FY03 FY04

49
PRESERVATIONPCC Pavement Cracks/Joints
reallocation threshold = 70% mean sample per cycle = 1,730
0%
10%
20%
30%
40%
50%
60%
70%
80%
90%
100%
Fiscal Years
Perc
ent P
assi
ng
High District 79% 90% 82% 89%
Low District 56% 46% 36% 49%
State Average 70% 74% 65% 75%
FY01 FY02 FY03 FY04

50
PRESERVATIONACC Pavement Transverse & Random Cracks
reallocation threshold = 55% mean sample per cycle = 3,528
0%
10%
20%
30%
40%
50%
60%
70%
80%
90%
100%
Fiscal Years
Perc
ent P
assi
ng
High District 58% 54% 64% 63%
Low District 37% 25% 18% 24%
State Average 47% 39% 39% 44%
FY01 FY02 FY03 FY04
51
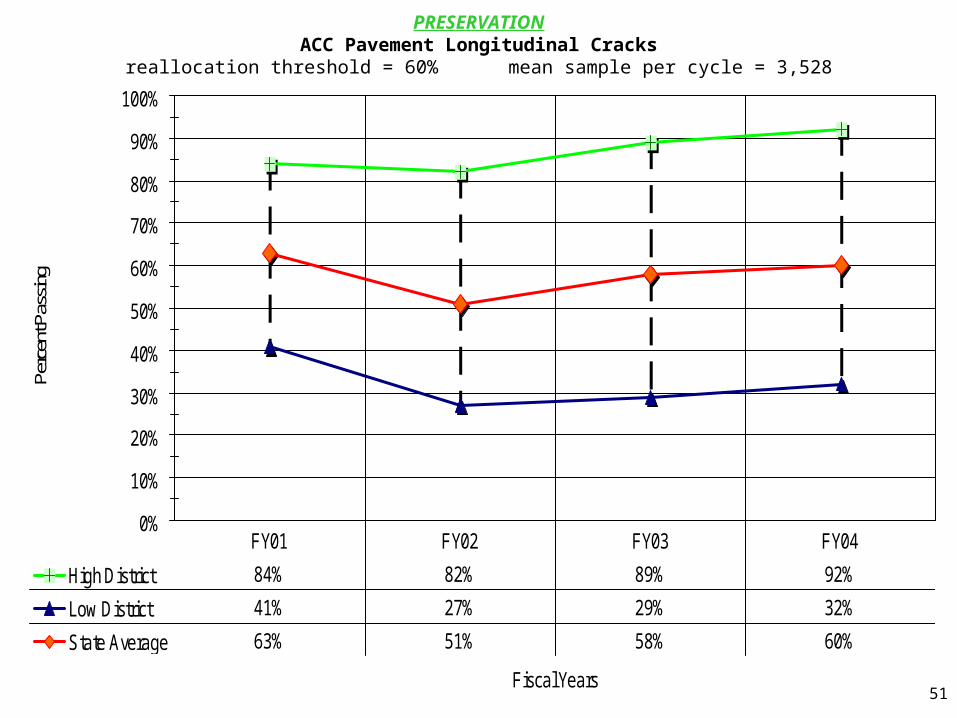
PRESERVATIONACC Pavement Longitudinal Cracks
reallocation threshold = 60% mean sample per cycle = 3,528
0%
10%
20%
30%
40%
50%
60%
70%
80%
90%
100%
Fiscal Years
Perc
ent P
assi
ng
High District 84% 82% 89% 92%
Low District 41% 27% 29% 32%
State Average 63% 51% 58% 60%
FY01 FY02 FY03 FY04
52
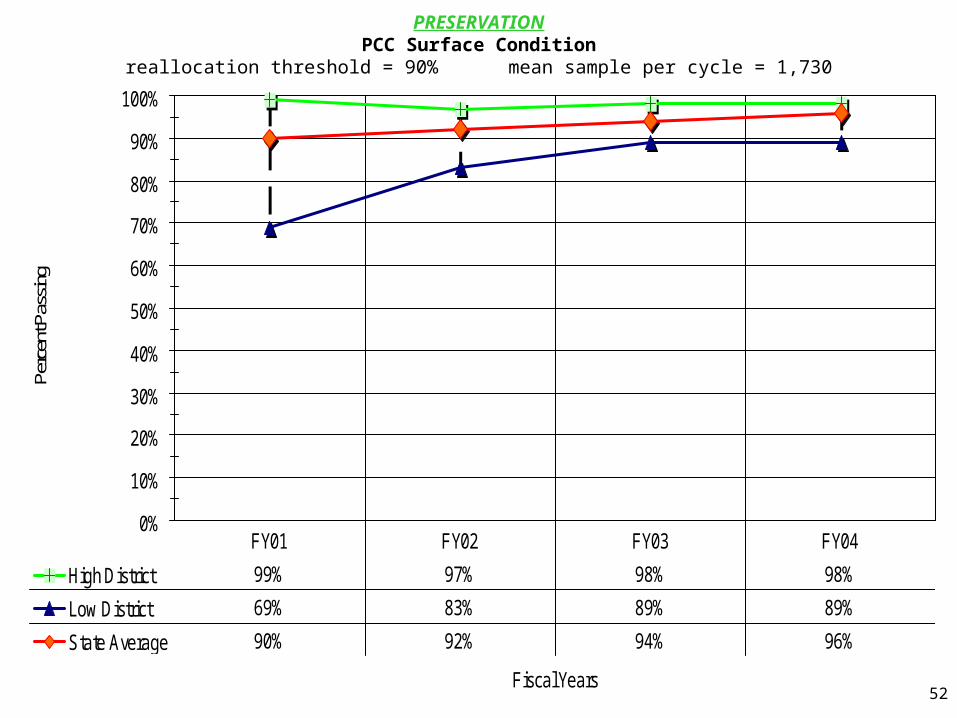
PRESERVATIONPCC Surface Condition
reallocation threshold = 90% mean sample per cycle = 1,730
0%
10%
20%
30%
40%
50%
60%
70%
80%
90%
100%
Fiscal Years
Perc
ent P
assi
ng
High District 99% 97% 98% 98%
Low District 69% 83% 89% 89%
State Average 90% 92% 94% 96%
FY01 FY02 FY03 FY04
53
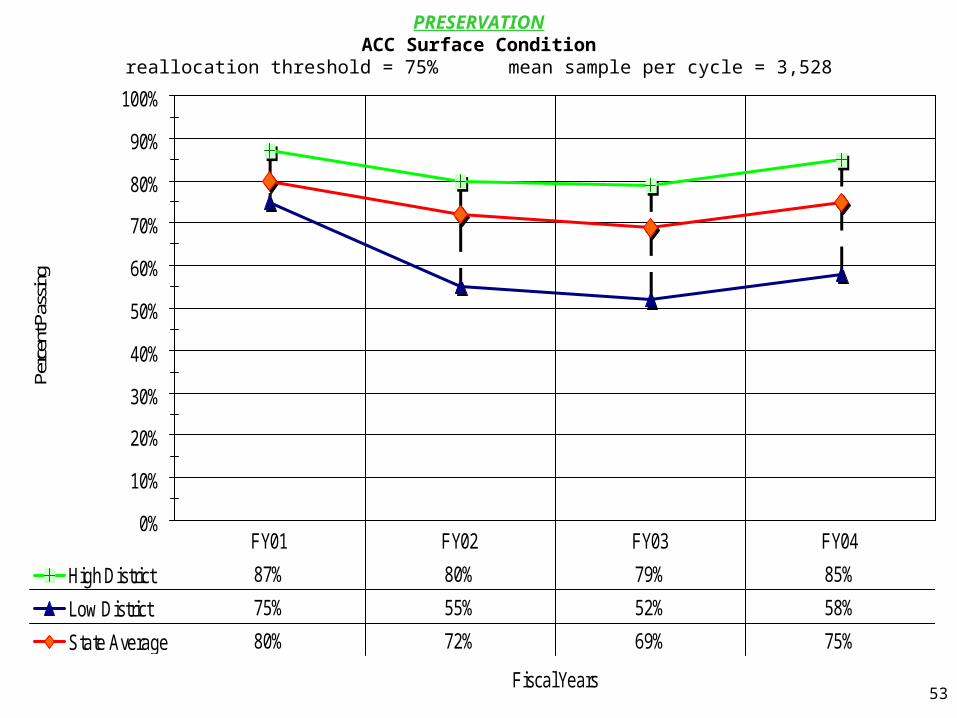
PRESERVATIONACC Surface Condition
reallocation threshold = 75% mean sample per cycle = 3,528
0%
10%
20%
30%
40%
50%
60%
70%
80%
90%
100%
Fiscal Years
Perc
ent P
assi
ng
High District 87% 80% 79% 85%
Low District 75% 55% 52% 58%
State Average 80% 72% 69% 75%
FY01 FY02 FY03 FY04
54
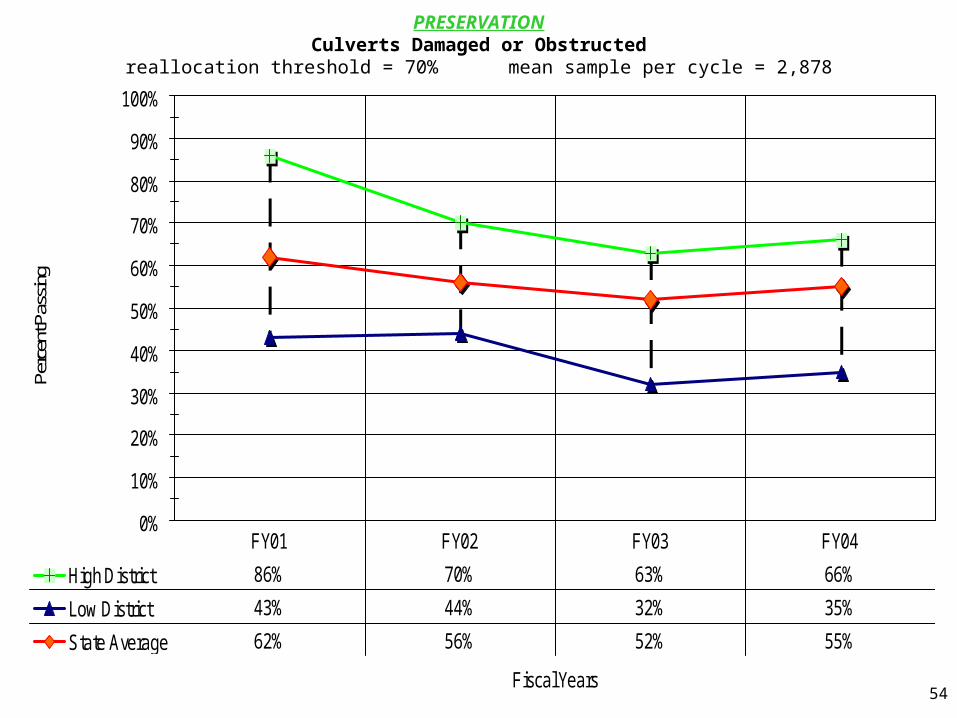
PRESERVATIONCulverts Damaged or Obstructed
reallocation threshold = 70% mean sample per cycle = 2,878
0%
10%
20%
30%
40%
50%
60%
70%
80%
90%
100%
Fiscal Years
Perc
ent P
assi
ng
High District 86% 70% 63% 66%
Low District 43% 44% 32% 35%
State Average 62% 56% 52% 55%
FY01 FY02 FY03 FY04

55
PRESERVATION Damaged or Obstructed Drains
reallocation threshold = 75% mean sample per cycle = 2,513
0%
10%
20%
30%
40%
50%
60%
70%
80%
90%
100%
Fiscal Years
Pe
rce
nt P
ass
ing
High District 92% 77% 76% 80%
Low District 64% 64% 59% 49%
State Average 76% 70% 69% 65%
FY01 FY02 FY03 FY04

56
PRESERVATIONObstructed Water Flow in Ditches
reallocation threshold = 80% mean sample per cycle = 4,942
0%
10%
20%
30%
40%
50%
60%
70%
80%
90%
100%
Fiscal Years
Perc
ent P
assi
ng
High District 83% 83% 90% 92%
Low District 71% 66% 44% 54%
State Average 79% 74% 72% 80%
FY01 FY02 FY03 FY04
57
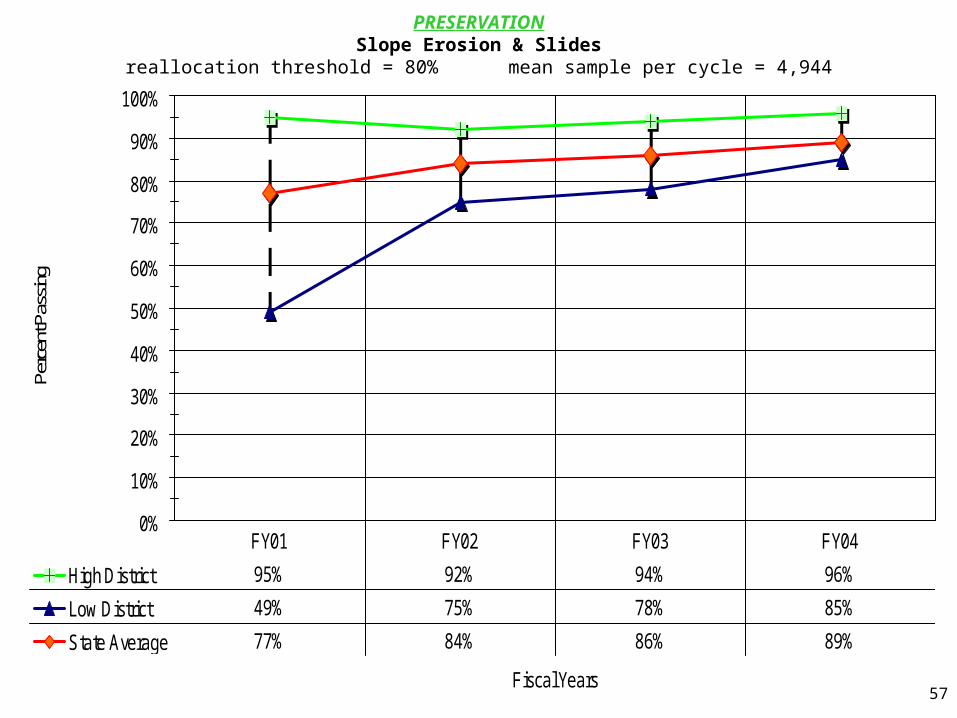
PRESERVATIONSlope Erosion & Slides
reallocation threshold = 80% mean sample per cycle = 4,944
0%
10%
20%
30%
40%
50%
60%
70%
80%
90%
100%
Fiscal Years
Perc
ent P
assi
ng
High District 95% 92% 94% 96%
Low District 49% 75% 78% 85%
State Average 77% 84% 86% 89%
FY01 FY02 FY03 FY04

58

59
Review of the Start of Calendar Year 2004 Paint Striping
Reflectivity & Line Miles Painted [May 7 – September 9] pages 60 - 61
Reflectivity & Material Costs [May 7 – August 12] pages 62 - 63
Reflectivity Before Spring Painting pages 64 - 65

60
Districts Ranked by Line Miles Painted Compared to Average Reflectivity May 7 to September 9, 2004
Question: Does a focus on high quality [retroreflectivity ratings] reduce quantity
[line miles painted]?
Possible Reason: One way to increase retroreflectivity is to reduce painting speed by 1 – 3 miles per hour.
Data: The preliminary data on the next page from the first 18 weeks of the 2004
paint season indicate that high quality and high quantity are compatible.
All Districts exceeded the expected new paint minimums of 200
Millicandella for yellow and 300 Millicandella for white. The yellow range
was 245 to 275. The white range was 330 to 425. In general, Districts with
higher quantity also had higher quality.
Discussion: Field staff have suggested other variables that might have more
influence on the quantity painted: Equipment problems Weather Travel time to paint locations Urban painting.

61
Districts Ranked by Line Miles Painted Compared to Average Reflectivity May 7 to September 9, 2004
expected new paint minimums: yellow = 200 mcd; white = 300 mcd
0
45
90
135
180
225
270
315
360
405
450
Districts Ranked by Miles Painted
Aver
age
Retro
refle
ctivi
ty in
mcd
0
180
360
540
720
900
1,080
1,260
1,440
1,620
1,800
Line
Mile
s Pa
inted
Yellow av mcd 275 254 263 264 255 245
White av mcd 425 379 369 330 362 NA
Miles Painted 1,620 1,606 1,411 1,359 1,316 1,256
District 1 District 4 District 6 District 5 District 2 Doistrict 3

62
Districts Ranked by Material Cost per Mile Compared to Average Reflectivity May 7 to August 12, 2004
Question: Does a focus on high quality [retroreflectivity ratings] increase material
cost [inventory expenditures per line mile for paint and beads]?
Possible Reason: One way to increase retroreflectivity is to increase paint and bead rates.
Data: The preliminary data on the next page from the first 14 weeks of the 2004 paint season indicate that we have insufficient data to directly link quality with material costs. All Districts exceeded the expected new paint minimum of 200 Millicandella for yellow. Only one District, with an average of 297, did not exceed the minimum 300 Millicandella for white. The yellow range was 249 to 275. Excluding the 297, the white range was 365 to 372.
The District with the lowest cost also had the lowest average yellow reflectivity and the District with the highest cost had the highest
average reflectivity for both yellow and white. However, the District with the lowest white reflectivity had a cost of $63.31, about midway
in the range from $45.94 to $83.38.
Discussion: Much of the data for this period was for yellow centerline and does not distinguish between continuous and skip lines. This analysis
assumes that the mix is about the same across the Districts.Due to savings in labor and equipment, lines with a material cost
of $83/mile would be more cost effective than lines at $46/mile if they last twice as long.

63
Districts Ranked by Material Cost per Mile Compared to Average Reflectivity May 7 to August 12, 2004
expected new paint minimums: yellow = 200 mcd; white = 300 mcd
0
45
90
135
180
225
270
315
360
405
450
Districts Ranked by Material Cost per Mile
Aver
age
Ret
rore
flect
ivity
in m
cd
$0
$9
$18
$27
$36
$45
$54
$63
$72
$81
$90
Pain
t & B
ead
Cos
t per
Mile
Yellow av mcd 249 256 262 254 263 275
White av mcd NA 367 297 365 366 372
Cost/mile $45.94 $48.24 $63.31 $73.42 $81.12 $83.38
District 3 District 2 District 5 District 4 District 6 District 1

64
Old Paint Reflectivity Reported in Spring 2004Measured Prior to the May 7 Start of 2004 Paint Season
Question: Do high reflectivity ratings for new pavement markings yield high
reflectivity ratings the following year?
Possible Reasons: 1. If paint thickness, bead size and placement, and pavement type and condition are major factors for
high reflectivity, initial readings could be an indicator of subsequent readings.
2. If time, traffic, weather, and snow and ice operations are major factors for high reflectivity, these variables could be important indicators of subsequent readings.
Data: Insufficient data currently.
Discussion: Reflectivity readings on the next page were taken before the 2004
paint season began. Currently, we do not enough data about
the readings for the same locations the previous year. We now
have substantial data on reflectivity for the paint applied this
season. We will collect data this fall and again in the spring to
determine if high ratings for new pavement markings yield high
reflectivity ratings the following year.

65
Old Paint Reflectivity Reported in Spring 2004expected repaint minimums: yellow = 100 mcd; white = 150 mcd
50
75
100
125
150
175
200
225
250
Road Type & Paint Color
Aver
age
Retro
refle
ctivit
y in
mcd
High District 130 198 177 226
Low District 85 121 121 170
Average 110 161 153 199
Primary Yellow Interstate Yellow Primary White Interstate White

66
Automated Performance Measures for Snow & Ice Results
Discussion page 67
Relative Locations of Automatic Traffic Recorders [ Speed] page 68
& Road Weather Information System [Road Surface]
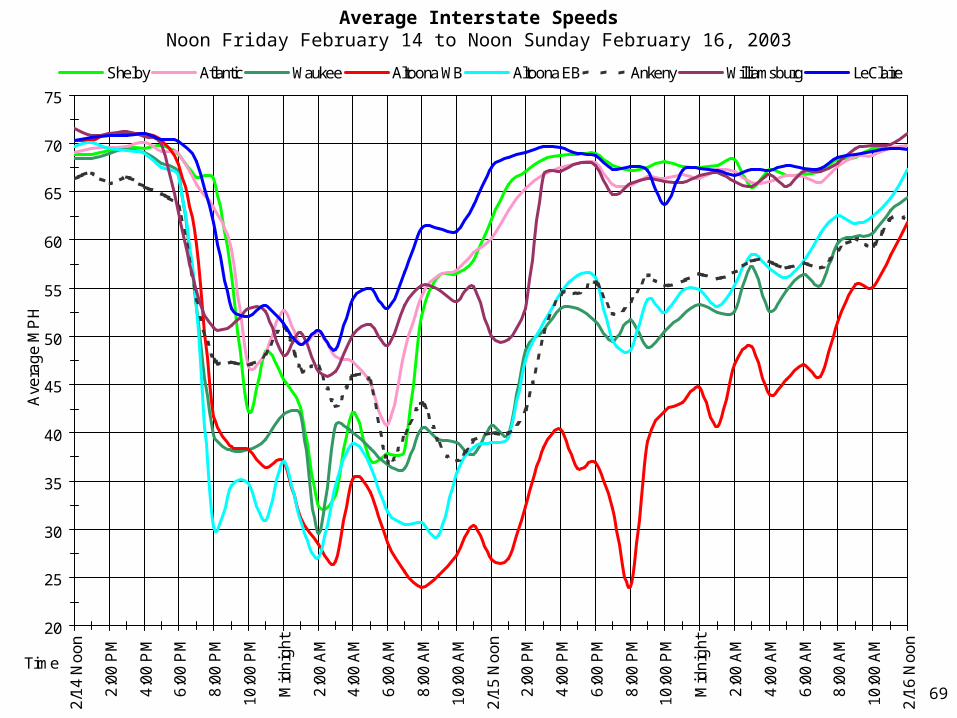
Average Interstate Speeds page 69
Noon Friday February 14 to Noon Sunday February 16, 2003
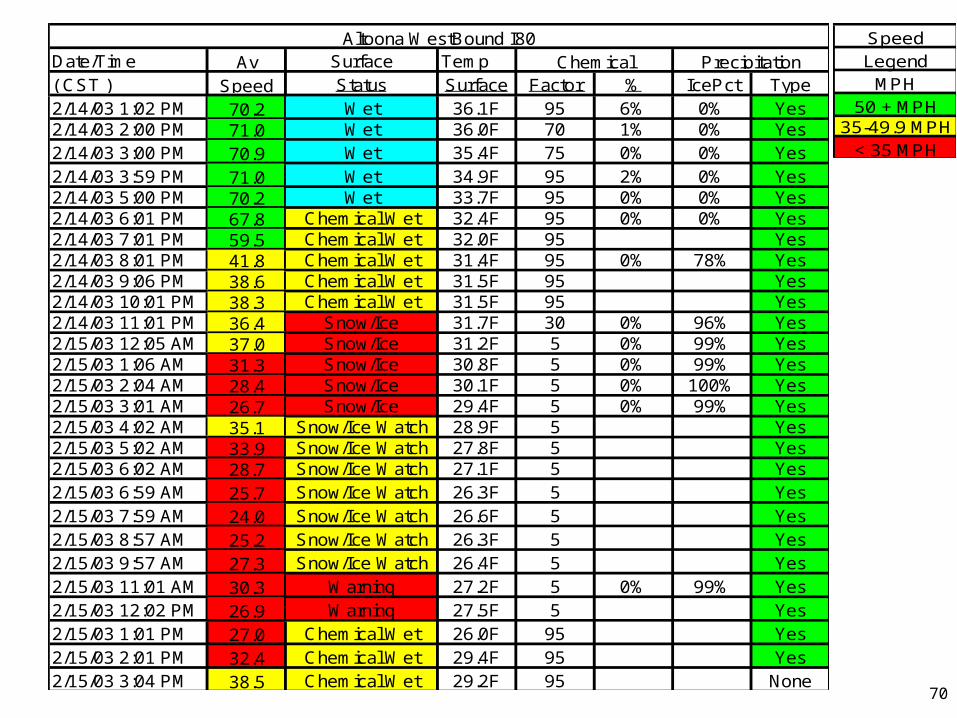
Comparison of Data for Average Speed & Road Surface pages 70 - 71
on I-80 Westbound between Mileposts 138 & 141
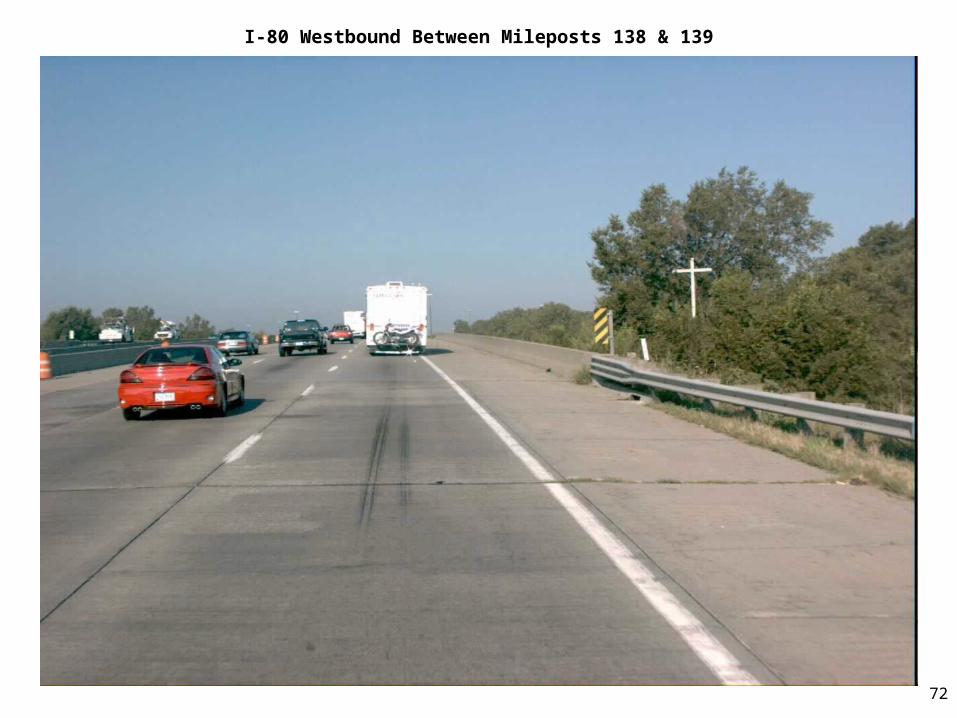
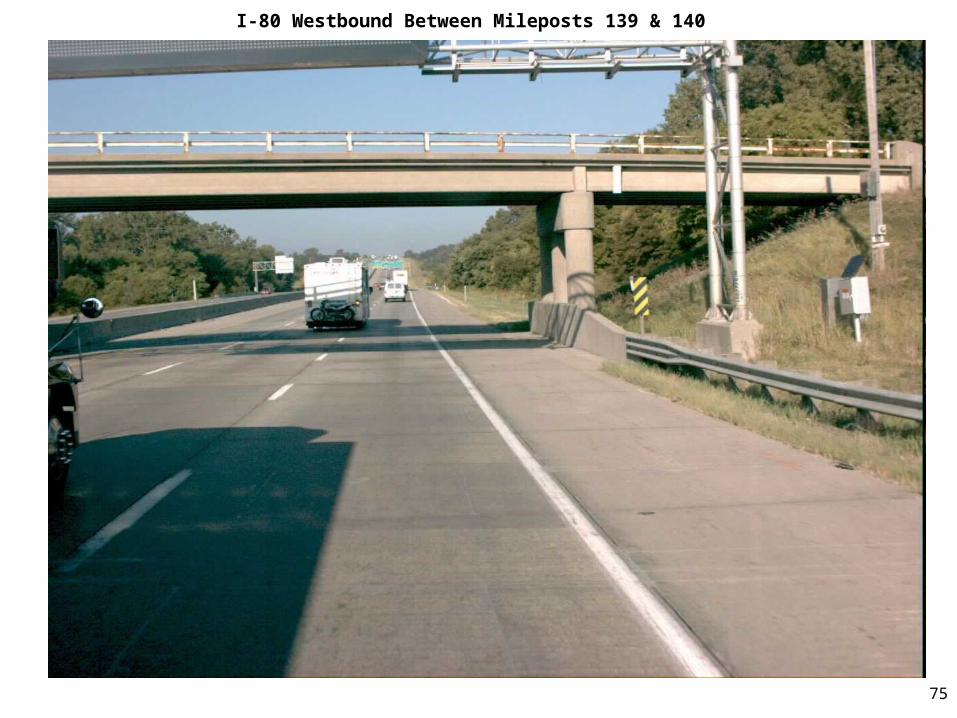
Videolog Pictures of I-80 Westbound between Mileposts 138 & 141 pages 72 - 76

67
Automated Performance Measures for Snow & Ice Results
Question: Could a comparison of existing data sources provide measures or indicators of the results of snow and ice operations with no
additional data collection costs?
Possible Data Sources:1. Speed data from Automatic Traffic Recorders [ATR]2. Road surface and weather data from the Road Weather Information
System [RWIS]3. Physical layout from videolog pictures
Data: Data from one large statewide storm indicate that drivers’ perceptions indicated by average speed are compatible
with road surface measurements. Videolog pictures of the site with the slowest recovery of average speed show physical features that might indicate contributing factors to the recovery time.
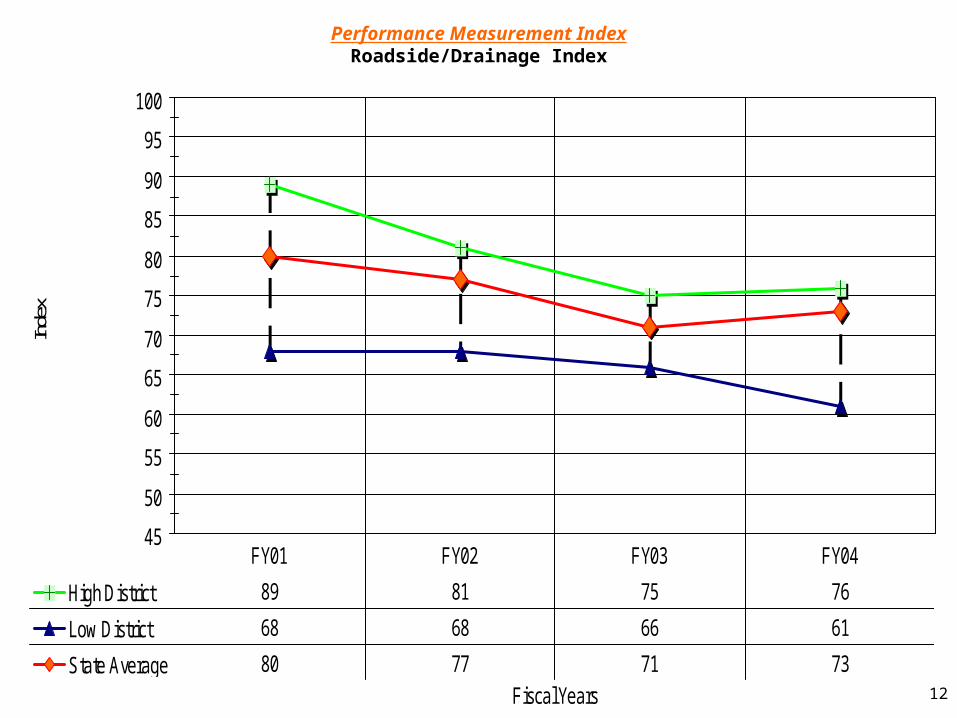
Discussion: The sites shown on “Average Interstate Speeds” are listed from west to east on I-80, with the exception of Ankeny on I- 35 a short distance north of the Altoona sites.
The speed recovery time for Altoona eastbound was noticeably faster than Altoona westbound. The pictures of Altoona westbound show the vegetation and embankments near the north edge of the roadway and the concrete barrier wall dividing the highway.

68
Automatic Traffic Recorder & Road Weather Information System Locations
road_centerline_2002_road_primary_2002
RWIS Locations
Speed Sensors
69
Average Interstate SpeedsNoon Friday February 14 to Noon Sunday February 16, 2003
20
25
30
35
40
45
50
55
60
65
70
752
/14
No
on
2:0
0 P
M
4:0
0 P
M
6:0
0 P
M
8:0
0 P
M
10
:00
PM
Mid
nig
ht
2:0
0 A
M
4:0
0 A
M
6:0
0 A
M
8:0
0 A
M
10
:00
AM
2/1
5 N
oo
n
2:0
0 P
M
4:0
0 P
M
6:0
0 P
M
8:0
0 P
M
10
:00
PM
Mid
nig
ht
2:0
0 A
M
4:0
0 A
M
6:0
0 A
M
8:0
0 A
M
10
:00
AM
2/1
6 N
oo
n
Time
Ave
rag
e M
PH
Shelby Atlantic Waukee Altoona WB Altoona EB Ankeny Williamsburg LeClaire
70
SpeedLegend
MPH50 + MPH
35-49.9 MPH< 35 MPH
Date/Time Av Surface Temp ( CST ) Speed Status Surface Factor % IcePct Type 2/14/03 1:02 PM 70.2 Wet 36.1F 95 6% 0% Yes2/14/03 2:00 PM 71.0 Wet 36.0F 70 1% 0% Yes2/14/03 3:00 PM 70.9 Wet 35.4F 75 0% 0% Yes2/14/03 3:59 PM 71.0 Wet 34.9F 95 2% 0% Yes2/14/03 5:00 PM 70.2 Wet 33.7F 95 0% 0% Yes2/14/03 6:01 PM 67.8 Chemical Wet 32.4F 95 0% 0% Yes2/14/03 7:01 PM 59.5 Chemical Wet 32.0F 95 Yes2/14/03 8:01 PM 41.8 Chemical Wet 31.4F 95 0% 78% Yes2/14/03 9:06 PM 38.6 Chemical Wet 31.5F 95 Yes2/14/03 10:01 PM 38.3 Chemical Wet 31.5F 95 Yes2/14/03 11:01 PM 36.4 Snow/Ice 31.7F 30 0% 96% Yes2/15/03 12:05 AM 37.0 Snow/Ice 31.2F 5 0% 99% Yes2/15/03 1:06 AM 31.3 Snow/Ice 30.8F 5 0% 99% Yes2/15/03 2:04 AM 28.4 Snow/Ice 30.1F 5 0% 100% Yes2/15/03 3:01 AM 26.7 Snow/Ice 29.4F 5 0% 99% Yes2/15/03 4:02 AM 35.1 Snow/Ice Watch 28.9F 5 Yes2/15/03 5:02 AM 33.9 Snow/Ice Watch 27.8F 5 Yes2/15/03 6:02 AM 28.7 Snow/Ice Watch 27.1F 5 Yes2/15/03 6:59 AM 25.7 Snow/Ice Watch 26.3F 5 Yes2/15/03 7:59 AM 24.0 Snow/Ice Watch 26.6F 5 Yes2/15/03 8:57 AM 25.2 Snow/Ice Watch 26.3F 5 Yes2/15/03 9:57 AM 27.3 Snow/Ice Watch 26.4F 5 Yes2/15/03 11:01 AM 30.3
Snow/Ice Warning 27.2F 5 0% 99% Yes
2/15/03 12:02 PM 26.9Snow/Ice Warning 27.5F 5 Yes
2/15/03 1:01 PM 27.0 Chemical Wet 26.0F 95 Yes2/15/03 2:01 PM 32.4 Chemical Wet 29.4F 95 Yes2/15/03 3:04 PM 38.5 Chemical Wet 29.2F 95 None
Altoona WestBound I80Chemical Precipitation

71
SpeedLegend
MPH50 + MPH
35-49.9 MPH< 35 MPH
Date/Time Av Surface Temp ( CST ) Speed Status Surface Factor % IcePct Type 2/15/03 4:01 PM 40.3 Chemical Wet 27.8F 95 None2/15/03 5:02 PM 36.3 Chemical Wet 25.7F 95 None2/15/03 6:02 PM 36.9 Chemical Wet 23.7F 95 None2/15/03 7:02 PM 32.3 Chemical Wet 22.6F 95 None2/15/03 8:01 PM 24.1 Chemical Wet 22.0F 95 None2/15/03 9:01 PM 39.1 Chemical Wet 20.7F 95 None2/15/03 10:01 PM 42.2 Chemical Wet 18.6F 95 None2/15/03 11:01 PM 43.2 Chemical Wet 16.3F 95 None2/15/03 11:59 PM 44.8 Chemical Wet 13.9F 95 None2/16/03 12:59 AM 40.6 Chemical Wet 12.6F 95 10% 83% None2/16/03 2:07 AM 47.1 Chemical Wet 11.8F 95 14% 80% None2/16/03 3:07 AM 48.9 Chemical Wet 10.5F 95 14% 80% None2/16/03 4:07 AM 44.0 Chemical Wet 9.5F 95 38% 48% None2/16/03 5:06 AM 45.6 Chemical Wet 9.0F 95 49% 32% None2/16/03 6:06 AM 47.1 Chemical Wet 8.1F 95 57% 22% None2/16/03 7:06 AM 45.9 Chemical Wet 7.5F 95 45% 42% None2/16/03 8:04 AM 51.4 Chemical Wet 9.2F 95 44% 39% None2/16/03 9:04 AM 55.4 Chemical Wet 15.5F 95 31% 41% None2/16/03 10:02 AM 55.1 Chemical Wet 22.0F 95 25% 22% None2/16/03 11:01 AM 58.4 Chemical Wet 28.0F 95 25% 0% None2/16/03 12:01 PM 61.8 Chemical Wet 32.3F 95 20% 0% None
Chemical PrecipitationAltoona WestBound I80
72
I-80 Westbound Between Mileposts 138 & 139

73
I-80 Westbound Between Mileposts 139 & 140

74
I-80 Westbound Between Mileposts 139 & 140
75
I-80 Westbound Between Mileposts 139 & 140

76
I-80 Eastbound Between Mileposts 139 & 140

77
Dead Deer Removal Report Graphsfor Government Oversight Committee
Deer Killed on Iowa Public Highways 1990 – 2003
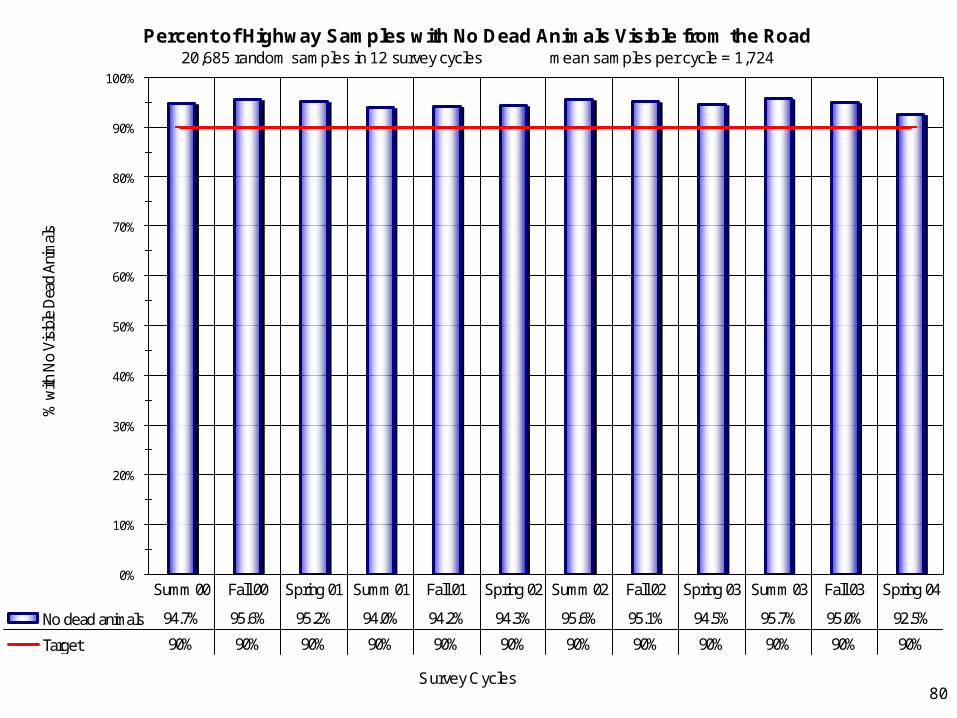
Percent of Highway Samples with No Dead Animals Visible from the Road
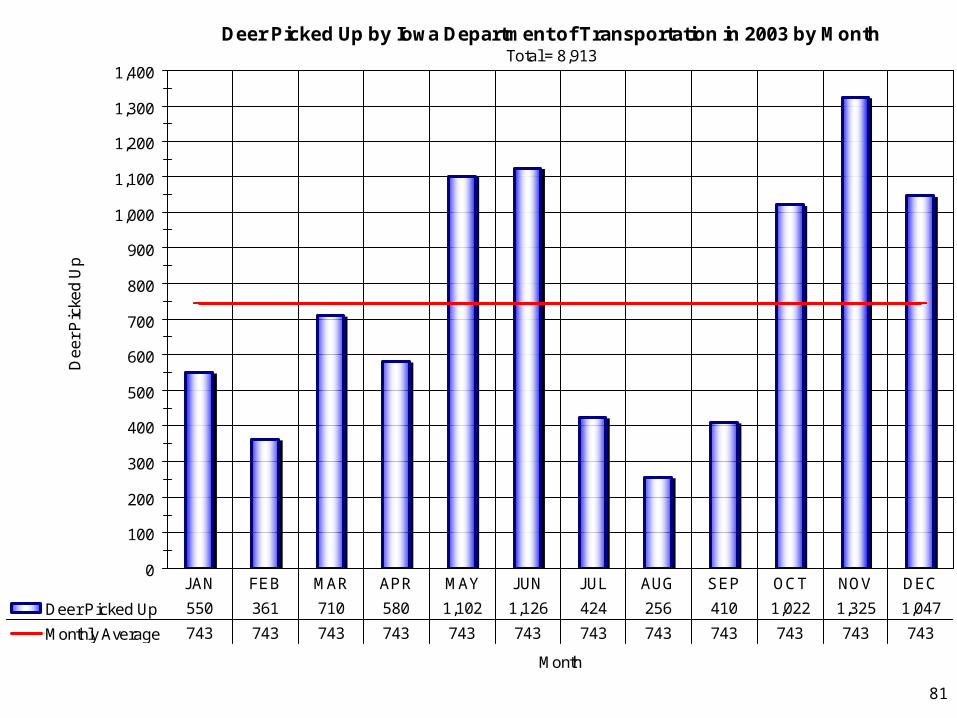
Deer Picked Up by Iowa DOT in 2003 by Month
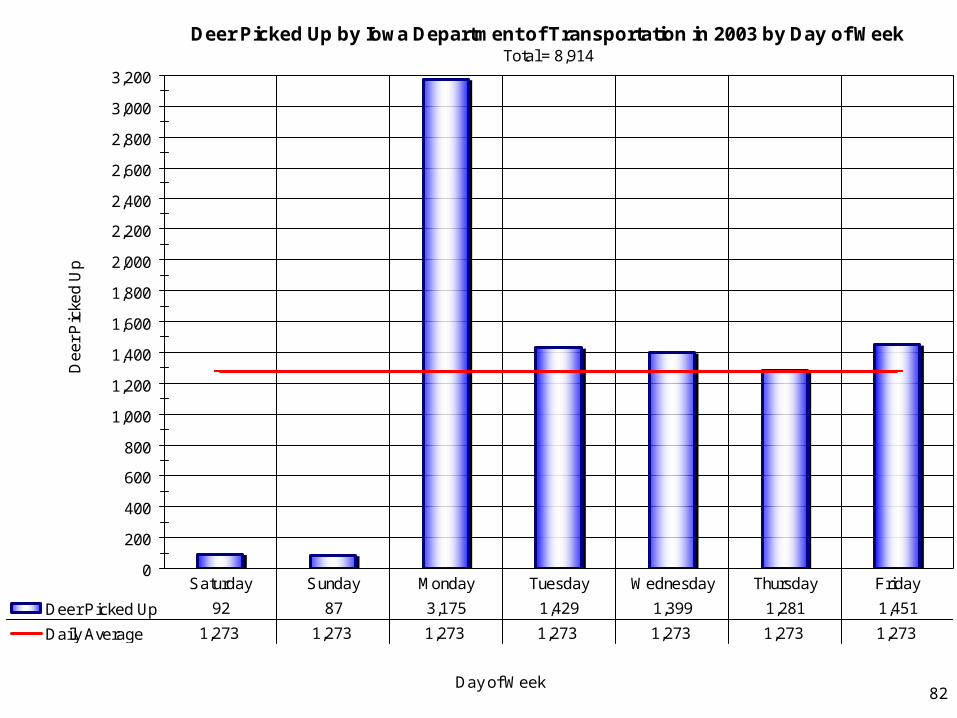
Deer Picked Up by Iowa DOT in 2003 by Day of Week

78
Dead Deer Removal Report Graphsfor the Government Oversight Committee of the Iowa General Assembly
July 22, 2004
At the request of the Government Oversight Committee, Will Zitterich presented this
information on July 22, 2004
Government Oversight Committee Members
Senator Mary Lundby, Chair Representative Dwayne Alons, Chair
Senator Bob Brunkhorst, Vice Chair Representative Scott Raecker, Vice Chair
Senator Tom Courtney, Ranking Member Representative Vicki Lensing, Ranking Member
Senator Robert Dvorsky Representative Clel Baudler
Senator Ron Wieck Representative Willard Jenkins
Representative Kent Kramer
Representative Jo Oldson
Representative Roger Thomas
Representative Roger Wendt

79
Deer Killed on Iowa Primary Highways
0
1,000
2,000
3,000
4,000
5,000
6,000
7,000
8,000
9,000
10,000
Calendar Year
Dee
r Kille
d on
Prim
ary
Hig
hway
s
Deer Killed 3,629 3,491 3,675 3,698 4,350 4,740 5,641 6,389 6,180 6,334 6,664 8,453 8,061 8,913 NA
1990 1991 1992 1993 1994 1995 1996 1997 1998 1999 2000 2001 2002 2003 2004
80
Percent of Highway Samples with No Dead Animals Visible from the Road20,685 random samples in 12 survey cycles mean samples per cycle = 1,724
0%
10%
20%
30%
40%
50%
60%
70%
80%
90%
100%
Survey Cycles
% w
ith N
o Vi
sibl
e D
ead
Anim
als
No dead animals 94.7% 95.6% 95.2% 94.0% 94.2% 94.3% 95.6% 95.1% 94.5% 95.7% 95.0% 92.5%
Target 90% 90% 90% 90% 90% 90% 90% 90% 90% 90% 90% 90%
Summ 00 Fall 00 Spring 01 Summ 01 Fall 01 Spring 02 Summ 02 Fall 02 Spring 03 Summ 03 Fall 03 Spring 04
81
Deer Picked Up by Iowa Department of Transportation in 2003 by MonthTotal = 8,913
0
100
200
300
400
500
600
700
800
900
1,000
1,100
1,200
1,300
1,400
Month
De
er
Pic
ked
Up
Deer Picked Up 550 361 710 580 1,102 1,126 424 256 410 1,022 1,325 1,047
Monthly Average 743 743 743 743 743 743 743 743 743 743 743 743
JAN FEB MAR APR MAY JUN JUL AUG SEP OCT NOV DEC
82
Deer Picked Up by Iowa Department of Transportation in 2003 by Day of WeekTotal = 8,914
0
200
400
600
800
1,000
1,200
1,400
1,600
1,800
2,000
2,200
2,400
2,600
2,800
3,000
3,200
Day of Week
De
er
Pic
ked
Up
Deer Picked Up 92 87 3,175 1,429 1,399 1,281 1,451
Daily Average 1,273 1,273 1,273 1,273 1,273 1,273 1,273
Saturday Sunday Monday Tuesday Wednesday Thursday Friday
Related Documents