FIRST QUARTER OF 2022 RESULTS (UNAUDITED) TICKERS: IDX : TLKM NYSE : TLK SHAREHOLDER COMPOSITION: Government of Indonesia : 52.1% Public : 47.9% CREDIT RATING: Moody’s : Baa1 (Stable) Fitch Ratings : BBB (Stable) Pefindo : idAAA (Stable) Investor Relations PT Telkom Indonesia (Persero) Tbk Telkom Landmark Tower, 39th Floor Jl. Gatot Subroto Kav. 52, Jakarta 12710 Phone : 62 21 5215109 Fax : 62 21 5220500 Email : [email protected] Website : www.telkom.co.id DISCLAIMER This document contains financial conditions and result of operation, and may also contain certain projections, plans, strategies, and objectives of the Company, which would be treated as forward-looking statements within the meaning of applicable law. Forward looking statements, by their nature, involve risk and uncertainty that could cause actual results and development to differ materially from those expressed or implied in these statements. Telkom Indonesia does not guarantee that any action, which may have a taken in reliance on this document, will bring specific results as expected. Highlights ◼ During the first quarter of 2022, PT Telkom Indonesia (Persero) Tbk (“Telkom or The Company”) recorded positive growth of 3.7% YoY in Revenue, with EBITDA and Net Income grew by 3.1% and 1.7% YoY, respectively. ◼ IndiHome continued to become our engine of growth as it posted Revenue of Rp6.9 trillion or grew by 7.9% YoY, supported by 8.7 million total subscribers and relatively stable ARPU during the period. ◼ Telkomsel’s Digital Business continued to grow healthily with 19.2% YoY growth in data traffic and its contribution reached 80% of total Telkomsel’s revenue. ◼ To further pursue the realization of 5 bold moves strategy, we continue organization transformation by aligning TelkomSigma to be Telkom’s direct subsidiary that focused on becoming B2B IT Service Leader Company. Furthermore, Telkom and Microsoft recently signed a strategic partnership agreement to enhance our digital platform domain which in turn will strengthen digital service areas. Financial Highlights Operational Highlights Key Indicators (Rp. Bn) YoY Subscribers (000) YoY 1Q22 1Q21 Growth (%).. 1Q22 1Q21 Growth (%) Revenues 35,208 33.945 3.7 Broadband Expenses 24,597 22,246 10.6 Fixed Broadband - IndiHome 8,737 8,149 7.2 Operating Profit 10,611 11,699 (9.3) Mobile Data User 119,771 114,831 4.3 EBITDA 19,388 18,809 3.1 Cellular EBITDA Margin (%) 55.1 55.4 (0.3) ppt Telkomsel Halo 7,378 6,589 12.0 Net Income 6,118 6,014 1.7 Telkomsel Prabayar 167,577 158,103 6.0 Net Income Margin (%) 17.4 17.7 (0.3) ppt Total 174,956 164,692 6.2

Welcome message from author
This document is posted to help you gain knowledge. Please leave a comment to let me know what you think about it! Share it to your friends and learn new things together.
Transcript

F I R S T Q U A R T E R O F 2 0 2 2 R E S U L T S ( U N A U D I T E D )
TICKERS:
IDX : TLKM
NYSE : TLK
SHAREHOLDER COMPOSITION:
Government of Indonesia : 52.1%
Public : 47.9%
CREDIT RATING:
Moody’s : Baa1 (Stable)
Fitch Ratings : BBB (Stable)
Pefindo : idAAA (Stable)
Investor Relations
PT Telkom Indonesia (Persero) Tbk
Telkom Landmark Tower, 39th Floor
Jl. Gatot Subroto Kav. 52, Jakarta 12710
Phone : 62 21 5215109
Fax : 62 21 5220500
Email : [email protected]
Website : www.telkom.co.id
DISCLAIMER
This document contains financial conditions and result of operation, and may also contain certain projections, plans,
strategies, and objectives of the Company, which would be treated as forward-looking statements within the meaning of
applicable law. Forward looking statements, by their nature, involve risk and uncertainty that could cause actual results
and development to differ materially from those expressed or implied in these statements. Telkom Indonesia does not
guarantee that any action, which may have a taken in reliance on this document, will bring specific results as expected.
Highlights
◼ During the first quarter of 2022, PT Telkom Indonesia (Persero) Tbk (“Telkom or The Company”) recorded positive growth of 3.7% YoY in Revenue, with EBITDA and Net Income grew by 3.1% and 1.7% YoY, respectively.
◼ IndiHome continued to become our engine of growth as it posted Revenue of Rp6.9 trillion or grew by 7.9% YoY, supported by 8.7 million total subscribers and relatively stable ARPU during the period.
◼ Telkomsel’s Digital Business continued to grow healthily with 19.2% YoY growth in data traffic and its contribution reached 80% of total Telkomsel’s revenue.
◼ To further pursue the realization of 5 bold moves strategy, we continue organization transformation by aligning TelkomSigma to be Telkom’s direct subsidiary that focused on becoming B2B IT Service Leader Company. Furthermore, Telkom and Microsoft recently signed a strategic partnership agreement to enhance our digital platform domain which in turn will strengthen digital service areas.
Financial Highlights
Operational Highlights
Key Indicators (Rp. Bn)
YoY Subscribers
(000)
YoY
1Q22 1Q21 Growth
(%).. 1Q22 1Q21
Growth (%)
Revenues 35,208 33.945 3.7 Broadband
Expenses 24,597 22,246 10.6 Fixed Broadband - IndiHome 8,737 8,149 7.2
Operating Profit 10,611 11,699 (9.3) Mobile Data User 119,771 114,831 4.3
EBITDA 19,388 18,809 3.1 Cellular
EBITDA Margin (%) 55.1 55.4 (0.3) ppt Telkomsel Halo 7,378 6,589 12.0
Net Income 6,118 6,014 1.7 Telkomsel Prabayar 167,577 158,103 6.0
Net Income Margin (%) 17.4 17.7 (0.3) ppt Total 174,956 164,692 6.2
2
FIRST QUARTER OF 2022 (UNAUDITED)
PT TELKOM INDONESIA (PERSERO) Tbk FIRST QUARTER OF 2022 (UNAUDITED)
The following analysis and discussion are based on our Indonesian GAAP financial statements for first quarter of 2022 and 2021. The reports have been submitted to Indonesia Financial Services Authority (OJK).
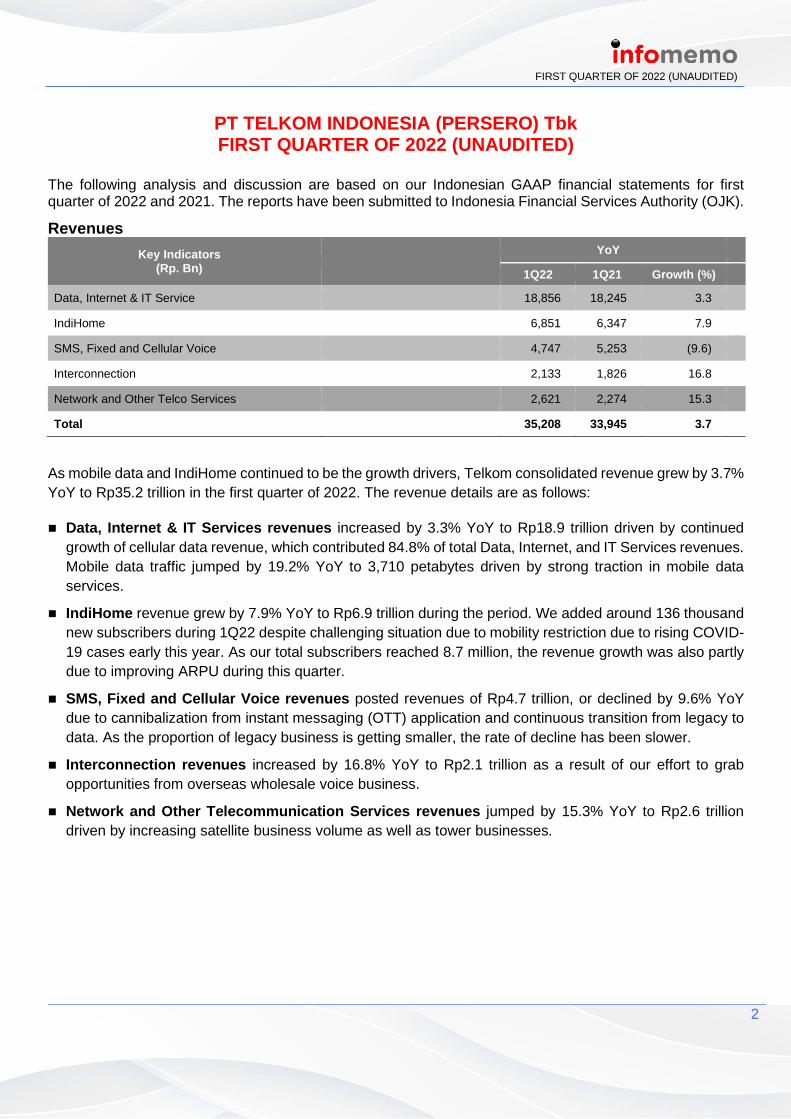
Revenues
Key Indicators (Rp. Bn)
YoY
1Q22 1Q21. Growth (%)…
Data, Internet & IT Service 18,856 18,245 3.3
IndiHome 6,851 6,347 7.9
SMS, Fixed and Cellular Voice 4,747 5,253 (9.6)
Interconnection 2,133 1,826 16.8
Network and Other Telco Services 2,621 2,274 15.3
Total 35,208 33,945 3.7
As mobile data and IndiHome continued to be the growth drivers, Telkom consolidated revenue grew by 3.7%
YoY to Rp35.2 trillion in the first quarter of 2022. The revenue details are as follows:
◼ Data, Internet & IT Services revenues increased by 3.3% YoY to Rp18.9 trillion driven by continued
growth of cellular data revenue, which contributed 84.8% of total Data, Internet, and IT Services revenues.
Mobile data traffic jumped by 19.2% YoY to 3,710 petabytes driven by strong traction in mobile data
services.
◼ IndiHome revenue grew by 7.9% YoY to Rp6.9 trillion during the period. We added around 136 thousand
new subscribers during 1Q22 despite challenging situation due to mobility restriction due to rising COVID-
19 cases early this year. As our total subscribers reached 8.7 million, the revenue growth was also partly
due to improving ARPU during this quarter.
◼ SMS, Fixed and Cellular Voice revenues posted revenues of Rp4.7 trillion, or declined by 9.6% YoY
due to cannibalization from instant messaging (OTT) application and continuous transition from legacy to
data. As the proportion of legacy business is getting smaller, the rate of decline has been slower.
◼ Interconnection revenues increased by 16.8% YoY to Rp2.1 trillion as a result of our effort to grab
opportunities from overseas wholesale voice business.
◼ Network and Other Telecommunication Services revenues jumped by 15.3% YoY to Rp2.6 trillion
driven by increasing satellite business volume as well as tower businesses.
3
FIRST QUARTER OF 2022 (UNAUDITED)
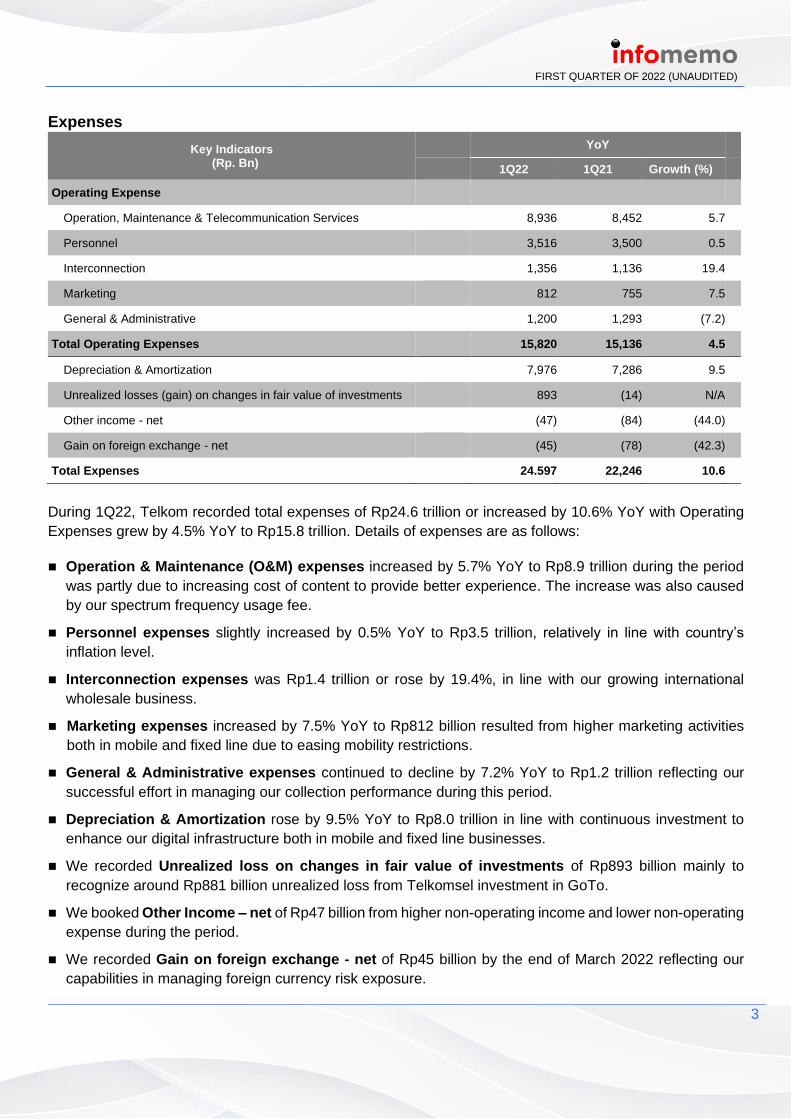
Expenses
Key Indicators (Rp. Bn)
YoY
1Q22 1Q21. Growth (%)…
Operating Expense
Operation, Maintenance & Telecommunication Services
8,936 8,452 5.7
Personnel
3,516 3,500 0.5
Interconnection
1,356 1,136 19.4
Marketing
812 755 7.5
General & Administrative
1,200 1,293 (7.2)
Total Operating Expenses
15,820 15,136 4.5
Depreciation & Amortization
7,976 7,286 9.5
Unrealized losses (gain) on changes in fair value of investments
893 (14) N/A
Other income - net
(47) (84) (44.0)
Gain on foreign exchange - net
(45) (78) (42.3)
Total Expenses
24.597 22,246 10.6
During 1Q22, Telkom recorded total expenses of Rp24.6 trillion or increased by 10.6% YoY with Operating
Expenses grew by 4.5% YoY to Rp15.8 trillion. Details of expenses are as follows:
◼ Operation & Maintenance (O&M) expenses increased by 5.7% YoY to Rp8.9 trillion during the period
was partly due to increasing cost of content to provide better experience. The increase was also caused
by our spectrum frequency usage fee.
◼ Personnel expenses slightly increased by 0.5% YoY to Rp3.5 trillion, relatively in line with country’s
inflation level.
◼ Interconnection expenses was Rp1.4 trillion or rose by 19.4%, in line with our growing international
wholesale business.
◼ Marketing expenses increased by 7.5% YoY to Rp812 billion resulted from higher marketing activities
both in mobile and fixed line due to easing mobility restrictions.
◼ General & Administrative expenses continued to decline by 7.2% YoY to Rp1.2 trillion reflecting our
successful effort in managing our collection performance during this period.
◼ Depreciation & Amortization rose by 9.5% YoY to Rp8.0 trillion in line with continuous investment to
enhance our digital infrastructure both in mobile and fixed line businesses.
◼ We recorded Unrealized loss on changes in fair value of investments of Rp893 billion mainly to
recognize around Rp881 billion unrealized loss from Telkomsel investment in GoTo.
◼ We booked Other Income – net of Rp47 billion from higher non-operating income and lower non-operating
expense during the period.
◼ We recorded Gain on foreign exchange - net of Rp45 billion by the end of March 2022 reflecting our
capabilities in managing foreign currency risk exposure.
4
FIRST QUARTER OF 2022 (UNAUDITED)
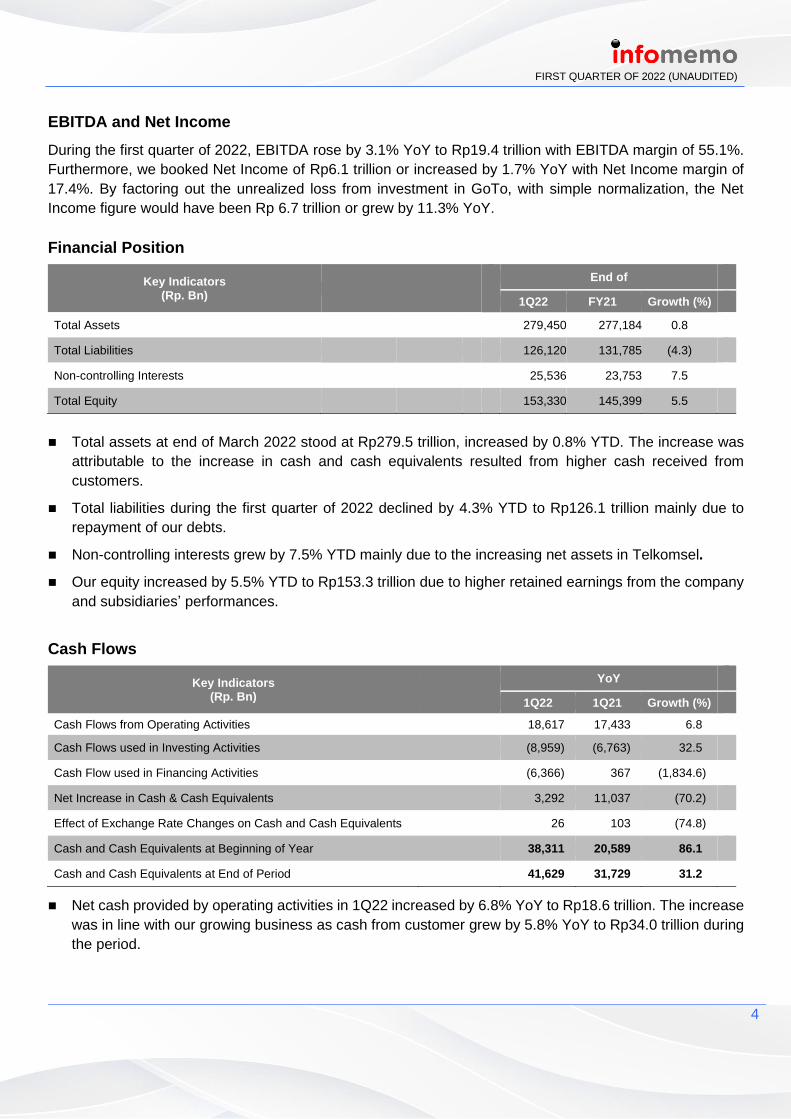
EBITDA and Net Income
During the first quarter of 2022, EBITDA rose by 3.1% YoY to Rp19.4 trillion with EBITDA margin of 55.1%.
Furthermore, we booked Net Income of Rp6.1 trillion or increased by 1.7% YoY with Net Income margin of
17.4%. By factoring out the unrealized loss from investment in GoTo, with simple normalization, the Net
Income figure would have been Rp 6.7 trillion or grew by 11.3% YoY.
Financial Position
Key Indicators (Rp. Bn)
End of
1Q22 FY21. Growth (%)
Total Assets 279,450 277,184 0.8
Total Liabilities 126,120 131,785 (4.3)
Non-controlling Interests 25,536 23,753 7.5
Total Equity 153,330 145,399 5.5
◼ Total assets at end of March 2022 stood at Rp279.5 trillion, increased by 0.8% YTD. The increase was
attributable to the increase in cash and cash equivalents resulted from higher cash received from
customers.
◼ Total liabilities during the first quarter of 2022 declined by 4.3% YTD to Rp126.1 trillion mainly due to
repayment of our debts.
◼ Non-controlling interests grew by 7.5% YTD mainly due to the increasing net assets in Telkomsel.
◼ Our equity increased by 5.5% YTD to Rp153.3 trillion due to higher retained earnings from the company
and subsidiaries’ performances.
Cash Flows
Key Indicators (Rp. Bn)
YoY
1Q22 1Q21. Growth (%)…
Cash Flows from Operating Activities 18,617 17,433 6.8
Cash Flows used in Investing Activities (8,959) (6,763) 32.5
Cash Flow used in Financing Activities (6,366) 367 (1,834.6)
Net Increase in Cash & Cash Equivalents 3,292 11,037 (70.2)
Effect of Exchange Rate Changes on Cash and Cash Equivalents 26 103 (74.8)
Cash and Cash Equivalents at Beginning of Year 38,311 20,589 86.1
Cash and Cash Equivalents at End of Period 41,629 31,729 31.2
◼ Net cash provided by operating activities in 1Q22 increased by 6.8% YoY to Rp18.6 trillion. The increase
was in line with our growing business as cash from customer grew by 5.8% YoY to Rp34.0 trillion during
the period.
5
FIRST QUARTER OF 2022 (UNAUDITED)
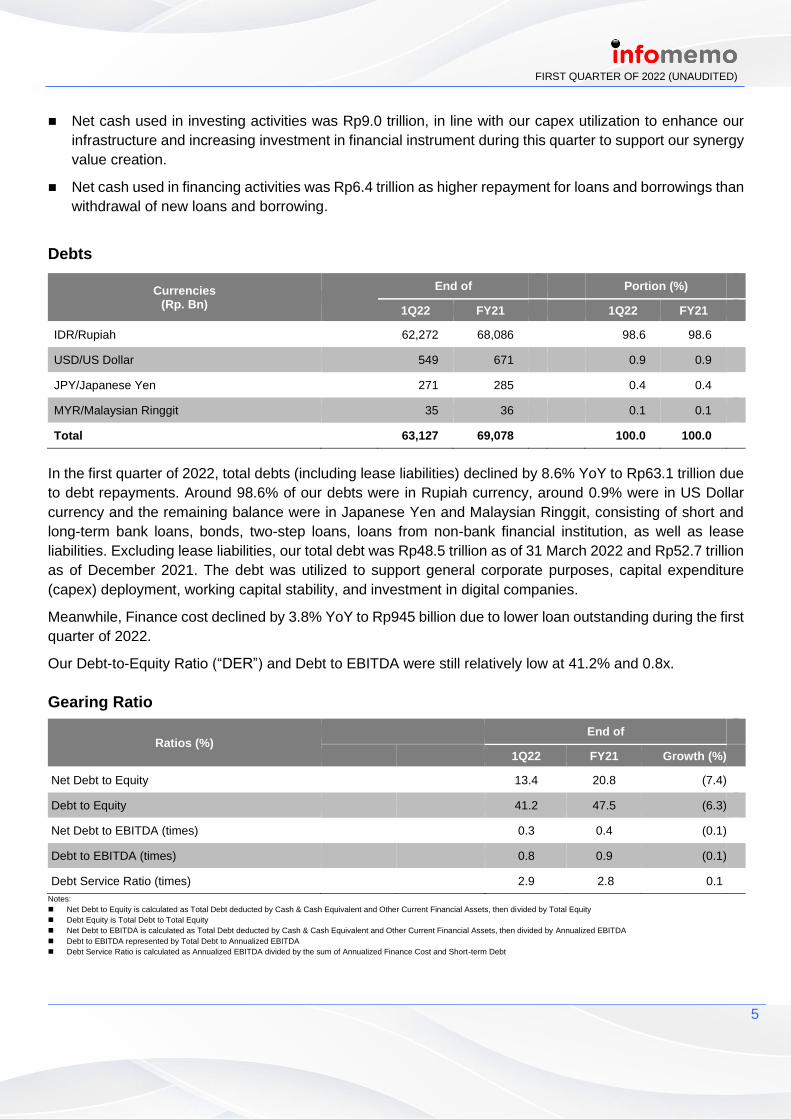
◼ Net cash used in investing activities was Rp9.0 trillion, in line with our capex utilization to enhance our
infrastructure and increasing investment in financial instrument during this quarter to support our synergy
value creation.
◼ Net cash used in financing activities was Rp6.4 trillion as higher repayment for loans and borrowings than
withdrawal of new loans and borrowing.
Debts
Currencies (Rp. Bn)
End of
Portion (%)
1Q22 FY21 1Q22 FY21
IDR/Rupiah 62,272 68,086 98.6 98.6
USD/US Dollar 549 671 0.9 0.9
JPY/Japanese Yen 271 285 0.4 0.4
MYR/Malaysian Ringgit 35 36 0.1 0.1
Total 63,127 69,078 100.0 100.0
In the first quarter of 2022, total debts (including lease liabilities) declined by 8.6% YoY to Rp63.1 trillion due
to debt repayments. Around 98.6% of our debts were in Rupiah currency, around 0.9% were in US Dollar
currency and the remaining balance were in Japanese Yen and Malaysian Ringgit, consisting of short and
long-term bank loans, bonds, two-step loans, loans from non-bank financial institution, as well as lease
liabilities. Excluding lease liabilities, our total debt was Rp48.5 trillion as of 31 March 2022 and Rp52.7 trillion
as of December 2021. The debt was utilized to support general corporate purposes, capital expenditure
(capex) deployment, working capital stability, and investment in digital companies.
Meanwhile, Finance cost declined by 3.8% YoY to Rp945 billion due to lower loan outstanding during the first
quarter of 2022.
Our Debt-to-Equity Ratio (“DER”) and Debt to EBITDA were still relatively low at 41.2% and 0.8x.
Gearing Ratio
Ratios (%) End of
1Q22 FY21 Growth (%)
Net Debt to Equity 13.4 20.8 (7.4)
Debt to Equity 41.2 47.5 (6.3)
Net Debt to EBITDA (times) 0.3 0.4 (0.1)
Debt to EBITDA (times) 0.8 0.9 (0.1)
Debt Service Ratio (times) 2.9 2.8 0.1
Notes:
◼ Net Debt to Equity is calculated as Total Debt deducted by Cash & Cash Equivalent and Other Current Financial Assets, then divided by Total Equity
◼ Debt Equity is Total Debt to Total Equity
◼ Net Debt to EBITDA is calculated as Total Debt deducted by Cash & Cash Equivalent and Other Current Financial Assets, then divided by Annualized EBITDA
◼ Debt to EBITDA represented by Total Debt to Annualized EBITDA
◼ Debt Service Ratio is calculated as Annualized EBITDA divided by the sum of Annualized Finance Cost and Short-term Debt

6
FIRST QUARTER OF 2022 (UNAUDITED)
Financial Ratios
Ratios (%) YoY
1Q22 1Q21 Growth (ppt)…
EBIT Margin 30.1 34.5 (4.3)
EBITDA Margin 55.1 55.4 (0.3)
Net Income Margin 17.4 17.7 (0.3)
Current Ratio 92.6 80.0 12.6
Total Liabilities to Equity 82.3 101.6 (19.3)
Return on Assets 11.2 13.0 (1.8)
Return on Equity 20.5 26.2 (5.7)
Return on Invested Capital 14.5 17.1 (2.6)
Notes:
◼ EBIT Margin is EBIT to Revenue
◼ EBITDA Margin is EBITDA to Revenue
◼ Net Income Margin is calculated as Profit Attributable to Owners of the Company divided by Revenue
◼ Current Ratio represented by Current Assets divided by Current Liabilities
◼ Total Liabilities to Equity is Total Liabilities to Total Equity
◼ Return on Assets represented by Total Profit divided by Total Assets
◼ Return on Equity represented by Total Profit divided by Total Equity
◼ Return on Invested Capital is calculated as Annualized Total Profit divided by sum of Total Debt and Total Equity
Capital Expenditure
In the first quarter 2022, Telkom spent Rp5.7 trillion in capital expenditure (capex) or represented 16.3% of
total revenue. Our capex was utilized to strengthen network and other supporting infrastructures as well as
to enhance capacity to provide better customer experience. In fixed line businesses, capex spent allocated
for fiber-based access and backbone infrastructures development, and for other projects such as towers and
Data Centers. Moreover, capex was absorbed for further improvement of 4G network quality and capacity,
commencement 5G roll out as well as enhancement of IT system in mobile business.
RESULTS BY SEGMENT
Mobile Segment
Telkomsel Financial Result
The telecommunications industry in early 2022 was still impacted by the COVID-19 and challenges from
overall lower purchasing power. Rapid spread of the Omicron variant and geopolitical situation of Russia and
Ukraine lead to the growing uncertainty exacerbating the already intense competition while the shift of Legacy
business towards Data service continually to accelerate. Nevertheless, ability to adapt to the new ways of life
with extensive vaccination program and easing of mobility restrictions as a positive signal of recovery and
healthier telecommunications industry.
Strategic actions on product, pricing, customer experience, cost optimization and digital initiatives was
implemented to ensure business continuity:
◼ Product simplification & pricing optimization to keep with market relevance while protecting relative
market position.
7
FIRST QUARTER OF 2022 (UNAUDITED)
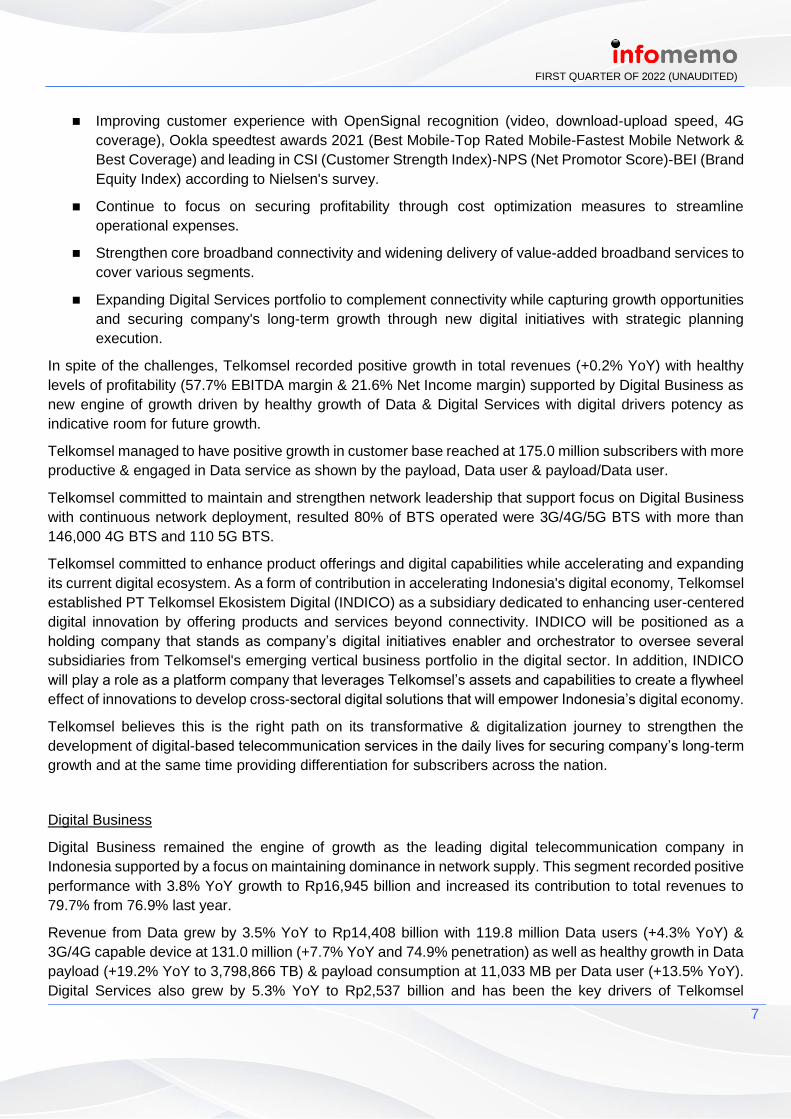
◼ Improving customer experience with OpenSignal recognition (video, download-upload speed, 4G
coverage), Ookla speedtest awards 2021 (Best Mobile-Top Rated Mobile-Fastest Mobile Network &
Best Coverage) and leading in CSI (Customer Strength Index)-NPS (Net Promotor Score)-BEI (Brand
Equity Index) according to Nielsen's survey.
◼ Continue to focus on securing profitability through cost optimization measures to streamline
operational expenses.
◼ Strengthen core broadband connectivity and widening delivery of value-added broadband services to
cover various segments.
◼ Expanding Digital Services portfolio to complement connectivity while capturing growth opportunities
and securing company's long-term growth through new digital initiatives with strategic planning
execution.
In spite of the challenges, Telkomsel recorded positive growth in total revenues (+0.2% YoY) with healthy
levels of profitability (57.7% EBITDA margin & 21.6% Net Income margin) supported by Digital Business as
new engine of growth driven by healthy growth of Data & Digital Services with digital drivers potency as
indicative room for future growth.
Telkomsel managed to have positive growth in customer base reached at 175.0 million subscribers with more
productive & engaged in Data service as shown by the payload, Data user & payload/Data user.
Telkomsel committed to maintain and strengthen network leadership that support focus on Digital Business
with continuous network deployment, resulted 80% of BTS operated were 3G/4G/5G BTS with more than
146,000 4G BTS and 110 5G BTS.
Telkomsel committed to enhance product offerings and digital capabilities while accelerating and expanding
its current digital ecosystem. As a form of contribution in accelerating Indonesia's digital economy, Telkomsel
established PT Telkomsel Ekosistem Digital (INDICO) as a subsidiary dedicated to enhancing user-centered
digital innovation by offering products and services beyond connectivity. INDICO will be positioned as a
holding company that stands as company’s digital initiatives enabler and orchestrator to oversee several
subsidiaries from Telkomsel's emerging vertical business portfolio in the digital sector. In addition, INDICO
will play a role as a platform company that leverages Telkomsel’s assets and capabilities to create a flywheel
effect of innovations to develop cross-sectoral digital solutions that will empower Indonesia’s digital economy.
Telkomsel believes this is the right path on its transformative & digitalization journey to strengthen the
development of digital-based telecommunication services in the daily lives for securing company’s long-term
growth and at the same time providing differentiation for subscribers across the nation.
Digital Business
Digital Business remained the engine of growth as the leading digital telecommunication company in
Indonesia supported by a focus on maintaining dominance in network supply. This segment recorded positive
performance with 3.8% YoY growth to Rp16,945 billion and increased its contribution to total revenues to
79.7% from 76.9% last year.
Revenue from Data grew by 3.5% YoY to Rp14,408 billion with 119.8 million Data users (+4.3% YoY) &
3G/4G capable device at 131.0 million (+7.7% YoY and 74.9% penetration) as well as healthy growth in Data
payload (+19.2% YoY to 3,798,866 TB) & payload consumption at 11,033 MB per Data user (+13.5% YoY).
Digital Services also grew by 5.3% YoY to Rp2,537 billion and has been the key drivers of Telkomsel

8
FIRST QUARTER OF 2022 (UNAUDITED)
transformation as a digital telco company with initiatives to optimize & accelerate its adoption through
products & services in this segment included Digital Lifestyle, Digital Advertising, Digital Enterprise Solution
& IoT business.
Legacy Business: Voice and SMS
Continued natural transition phase of Legacy toward Data & impact of OTT services cannibalization,
Telkomsel’s Legacy business was slowing down. Telkomsel initiatives to manage legacy and prolong the tail
with personalized marketing approach to offer better value package while addressing customers’ need with
consistent network quality and services.
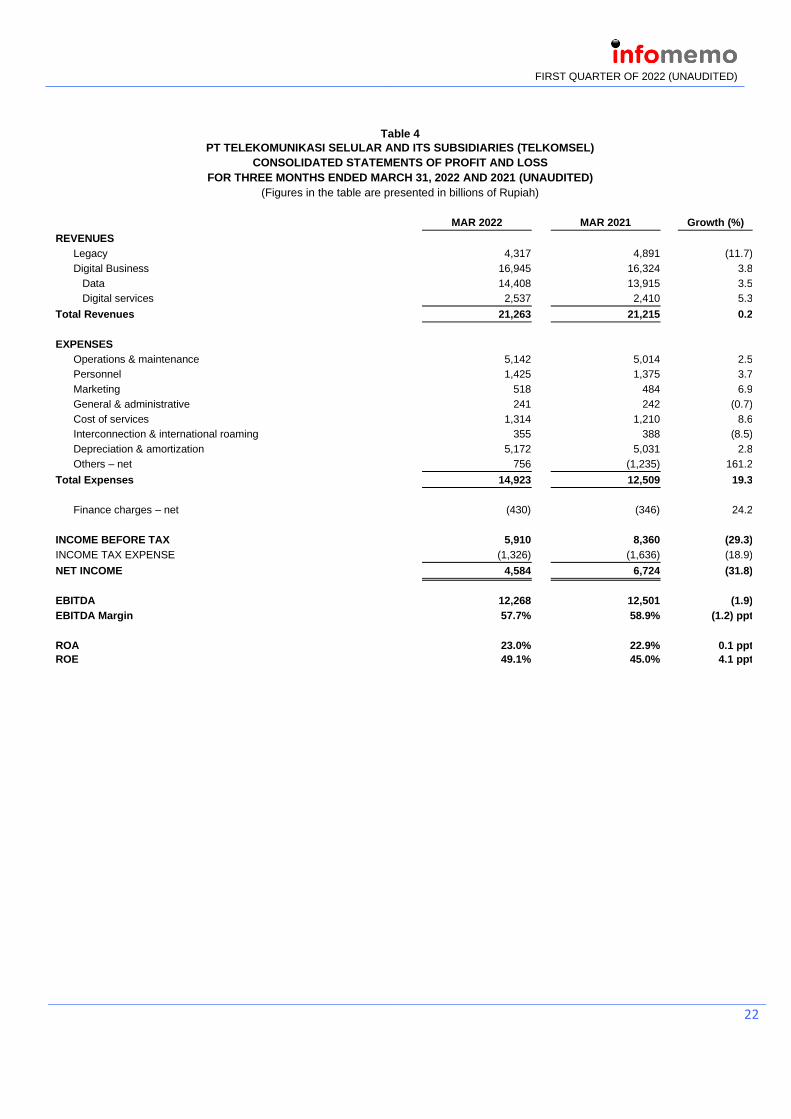
The following table summarizes Telkomsel’s financial results for the period ended 31 March 2022:
Consolidated Statements of Profit and Loss
Operating Expenses
◼ As of March 2022, total expenses including depreciation, amortization and others (net) increased by
19.3% YoY to Rp 14,923 billion. The growth itself mainly driven by Operational & Maintenance cost
as company’s initiative to strengthen 4G LTE services and maximize Broadband service quality while
having continuous network development to reach 247,930 total BTS (+5.9% YoY). Higher Cost of
Services in digital to improve contents and partnership align with uplift in Digital Services revenue and
commitment to expand Digital Services portfolio to complement connectivity while capturing growth
opportunities through new digital initiatives. Additionally, adjustment in fair valuation of investment in
GoTo is already included with mark to market position.
EBITDA and Net Income
◼ Strategic actions to face the challenges and to ensure business continuity with positive growth of total
revenues and initiatives to effectively manage operating expenses lead to healthy levels of profitability
with 57.7% EBITDA Margin and 21.6% Net Income Margin.
◼ We booked Net Income of Rp4,584 billion and Rp6,724 billion in the first quarter of 2022 and 2021,
respectively (-31.8% YoY) that included inorganic initiatives with one-off gain on sale and leaseback
Key Indicators (Rp. Bn)
YoY QoQ
1Q22 1Q21 Growth (%) 1Q22 4Q21 Growth (%)
Revenues 21,263 21,215 0.2 21,263 22,358 (4.9)
Legacy 4,317 4,891 (11.7) 4,317 4,634 (6.8)
Digital Business 16,945 16,324 3.8 16,945 17,723 (4.4)
Expenses incl. Depr. and others 14,923 12,509 19.3 14,923 13,121 13.7
EBITDA 12,268 12,501 (1.9) 12,268 12,116 1.3
EBITDA Margin (%) 57.7% 58.9% (1.2) ppt 57.7% 54.2% 3.5 ppt
Net Income 4,584 6,724 (31.8) 4,584 6,737 (32.0)
Net Income Margin (%) 21.6% 31.7% (10.1) ppt 21.6% 30.1% (8.6) ppt
Proportion of Digital Business (%) 79.7% 76.9% 2.7 ppt 79.7% 79.3% 0.4 ppt

9
FIRST QUARTER OF 2022 (UNAUDITED)
of towers in Q1-2021 and changes in fair value of investment in GoTo. For simple normalization on
both one-off gain, normalized Net Income in the first quarter of 2022 and 2021 reached at Rp5,271
billion and Rp5,532 billion, respectively (-4.7% YoY) with healthy levels of profitability were still
maintained to still have 24.8% Net Income Margin in the first quarter of 2022.
Consolidated Statements of Financial Position
Key Indicators (Rp Bn) Mar-22 Dec-21 Growth (%)
Current Assets 14,281 12,288 16.2
Non-Current Assets 86,994 89,014 (2.3)
Total Assets 101,274 101,302 0.0
Current Liabilities 34,300 31,654 8.4
Non-Current Liabilities 22,903 30,205 (24.2)
Total Equity 44,072 39,443 11.7
Total Liabilities & Equity 101,274 101,302 0.0
◼ Higher Current Assets mainly due to increase in cash and cash equivalents, while lower Non-Current
Assets due to decrease in long-term investment.
◼ Higher Current Liabilities mainly due to increase in current maturities of lease liabilities, while lower
Non-Current Liabilities due to decrease in lease liabilities.
◼ Higher total Equity mainly due to increase in retained earnings.
Consolidated Statements of Cash Flows
◼ Lower net cash generated from operations mainly due to decrease in total cash receipts from
operating activities with higher cash inflow in 1Q21 as a result of tower sale and leaseback
transactions.
◼ Higher cash flows used in investing activities due to lower base in 1Q21 as impact of proceeds from
tower sale and leaseback transactions.
◼ Higher cash flows for financing activities mainly due to payments of short-term loans on the back of
cash inflow from tower sale and leaseback transactions.
Key Indicators (Rp Bn) 1Q22 1Q21 Growth (%)
Cash Flows from Operating Activities 12,437 12,939 (3.9)
Cash Flows for Investing Activities (2,731) (871) 213.5
Cash Flows for Financing Activities (6,865) (4,958) 38.5
Net Increase in Cash & Cash Equivalents 2,841 7,110 (60.0)
Cash and Cash Equivalents at Beginning of Period 2,766 9,154 (69.8)
Cash and Cash Equivalents at End of Period 5,607 16,264 (65.5)

10
FIRST QUARTER OF 2022 (UNAUDITED)
Debt Profile
As of 31 March 2022, no outstanding loans from utilization of revolving credit facilities. As of 31 March 2022,
Telkomsel Debt to Equity Ratio (DER) was 0% (exclude lease liabilities).
Telkomsel has to maintain several financial covenants related to its loans/debts. As of 31 March 2022, the
covenants were as follows:
Notes: Debts in covenants exclude lease liabilities.
Mobile Digital Services
With the rapidly evolving customer needs and the transformation taking place in the society, Telkomsel
committed to enhance product offerings and digital capabilities to go beyond connectivity while accelerating
and expanding its current digital ecosystem, thus continue to focus on customer needs and long-term growth
supported by network quality.
◼ Enrich digital lifestyle related to video and games content including build up the positioning of
MAXstream in the video streaming industry with around 8 million monthly active users through
expanding partnership with major content partners and our own MAXstream originals. Our footprint in
mobile gaming industry also expanded by providing a complete solution, cultivating gamers
community and step into game publishing under Dunia Games brand with more than 18 million
monthly active users.
◼ Augmented the functionalities of by.U, a fully digital prepaid product offering integrated services based
on fully customizable digital applications with positive growth of customer to reach 4.1 million
customers.
◼ Developing Telkomsel Orbit, a home wireless internet service as an effort to leverage strong network
capacity.
◼ Rehaul MyTelkomsel app & Telkomsel.com to improve their value proposition & to better support other
corporate wide programs with around 30 million monthly active users of MyTelkomsel app.
Following Telkomsel’s investment in Gojek (a regional on-demand multi-services platform and digital payment
technology company) in November 2020 and May 2021, the two companies have strengthening strategic
partnership initiatives to provide users with new benefits and also helped to accelerate the digitization of
micro, small and medium enterprises (MSMEs). These initiatives include:
◼ Collaboration on initiatives to increase number of Telkomsel users within Gojek ecosystem.
◼ Easy onboarding for Gojek’s MSME partners to become Telkomsel reseller partners.
◼ Convenient access to Telkomsel’s outlets and resellers via GoShop.
◼ Improving customer experience in carrying out Gojek services with Number Masking feature from
Telkomsel’s Enterprise solutions
Covenants to be Maintained Required Actual
EBITDA to Debt Service ≥ 1.25 2.23
Total Debt to Tangible Net Worth ≤ 2.00 -

11
FIRST QUARTER OF 2022 (UNAUDITED)
Gojek-Tokopedia merger (GoTo) have reinforced Telkomsel’s investment case in Gojek since it creates the
first Super-App in Indonesia & becoming a complete digital solution with synergy values. Telkomsel also
provides more solution to Gojek drivers and merchants to improve engagement and use of Telkomsel
services.
As a subsidiary of Telkomsel engaged in venture capital, Telkomsel Mitra Inovasi (TMI) continues to commit
in accelerating the development of domestic and global startups through funding support and empowerment
by prioritizing synergy values that focus on stronger and more beneficial long-term partnerships and business
development. As Telkomsel's digital initiative, TMI also consistent in empowering digital-preneurs especially
startups that have the potential to develop in Indonesia through investment and collaboration actions by
optimizing the ecosystem, assets and competencies owned by Telkomsel. Through TMI, Telkomsel has
invested and support Indonesian startups, such as Kredivo, PrivyID, Qlue, Halodoc, Tanihub, Tada, SiCepat
and Inspigo.
As the leading digital telecommunications company in Indonesia, Telkomsel strengthening the digital
ecosystem by establishing PT Telkomsel Ekosistem Digital (INDICO) which become the leading platform that
optimize Telkomsel’s assets and capabilities to create a flywheel effect from innovations that will accelerate
Indonesia’s digital economy. It is also a manifestation of its determination in expanding the company's digital
business portfolio and as a company's proof to build an inclusive and sustainable digital ecosystem by
implementing Telkomsel's digital trifecta; Digital Connectivity, Digital Platform, and Digital Services. As a
subsidiary of Telkomsel, INDICO will be positioned as a holding company that stands as company’s digital
initiatives enabler & orchestrator to oversee several subsidiaries from Telkomsel's emerging vertical business
portfolio in the digital sector by optimizing the synergy of the superior asset ecosystem owned by Telkomsel.
Encouraging its development in the first wave, INDICO will focus on three digital industry sectors, namely
edu-tech, health-tech, and gaming.
In February 2022, PT Telkomsel Ekosistem Digital (INDICO) completed the transfer of Kuncie and Fita to
become part of the company's vertical business entity. Kuncie (managed by PT Kuncie Pintar Nusantara)
which operates in edu-tech sector, and Fita (managed by PT Fita Sehat Nusantara) which operates in health-
tech sector, were previously part of the digital service innovation of the business unit at Telkomsel. The
transfer of the Kuncie and Fita will also enable INDICO to accelerate the business of the two corporate
startups and various other digital vertical business sectors in the future. Now, Kuncie and Fita can manage
their business more independently as vertical business entities under the INDICO. Following these activities,
INDICO synergizes with GoTo through its subsidiary PT Aplikasi Multimedia Anak Bangsa (AMAB) to develop
the gaming business for the Southeast Asian market by forming a joint venture (JV) PT Games Karya
Nusantara, under company brand "Majamojo". Majamojo will look to form partnerships with game developers
and publishers, while leveraging Telkomsel and GoTo’s strengths, including their digital capabilities,
technology assets, and wide-reaching ecosystems. Majamojo enriches Telkomsel's vertical business line
Digital Ecosystem along with Kuncie and Fita while still encouraging the utilization of the synergy value of
various assets and capabilities in Telkomsel's digital business pillars (digital connectivity, digital platform and
digital services).
In March 2022, PT Telkomsel Ekosistem Digital officially introduced its logo and brand name INDICO. As a
subsidiary of Telkomsel and a holding company for the vertical digital business, INDICO is committed to
accelerating more opportunities and possibilities to innovate by leveraging the latest digital technology to
empower Indonesia's digital ecosystem and industry. The introduction of INDICO is part of the spirit of PT
Telkomsel Ekosistem Digital as the company aims to drive more innovative digital services. INDICO will also
12
FIRST QUARTER OF 2022 (UNAUDITED)
accelerate the presence of true digital talents who focus on collaborations with cross-sectoral start-ups in the
country, investors, and stakeholders in the digital industry for a more significant impact in strengthening the
national digital economy. Furthermore, INDICO had an opportunity to introduce the company and its potential
to the global audience by hosting a talk show with the theme "Unlocking Indonesia's Digital Potential" at Expo
2020 Dubai through the participation of TelkomGroup as one of the companies trusted by the Indonesian
Ministry of SOEs to represent the Indonesian delegation at the event. At the event, INDICO showed various
potentials and advantages of its three digital business entities: Fita, Kuncie, and Majamojo, to the international
tech and startup community and the global community. This initiative is a form of INDICO's commitment to
make Indonesia a digital powerhouse in Southeast Asia by opening up wider collaboration and investment
opportunities that can strengthen the national digital ecosystem.
Telkomsel has officially launched 5G service in May 2021, becoming the first cellular operator to offer 5G in
Indonesia with its first phase of commercialization available at selected points across 9 cities (Jakarta,
Surabaya, Makassar, Denpasar, Batam, Medan, Solo, Balikpapan and Bandung). As part of strategy in 5G
deployment through demand-based approach for B2C and B2B:
◼ Telkomsel has formed a partnership with Schneider Electric Manufacturing in Batam to accelerate its
digital transformation and smart factories for industry 4.0.
◼ Telkomsel collaborates with a world-class reliable connectivity company, Peplink to strengthen
Telkomsel IoT Smart Connectivity service ecosystem. This collaboration also opens wider
opportunities for Telkomsel to present SD-WAN with the first 5G network support for the corporate
segment in Indonesia.
◼ Telkomsel 5G services also available in universities (Telkom University and Bandung Institute of
Technology) to support research development for innovation including in IoT based healthcare
technology, preventive & post-disaster network recovery and autonomous robot.
◼ In line with initiatives to strengthen inclusive and sustainable national digital ecosystem in eastern
Indonesia and coincide with the momentum of the 20th National Games (PON) in Papua in October
2021, Telkomsel presents 5G technology through the showcase in Telkomsel 5G Experience Center
with 5G virtual reality (VR) live, 5G VR based drones and 5G VR tourism.
◼ Telkomsel supports the launch of the Indonesia Digital Industry Center 4.0 (PIDI 4.0), by presenting
the 5G Experience Center which is also prepared to demonstrate Indonesia's digital technology
capabilities to the G20 Sherpa delegation in December 2021.
◼ Telkom, Telkomsel and PT Jababeka Infrastruktur successfully signed MoU collaboration to realize
digitalization in the Jababeka area (Cikarang) through 5G technology implementation and to support
for building 5G infrastructure towards the Jababeka Digitalized Township Ecosystem.
◼ Telkomsel collaborates with PT Angkasa Pura II to expand and strengthen 5G network and services
in the Soekarno-Hatta International Airport area with 5G Fixed Wireless Access, 5G Experience
Corner and 5G Solution services to support the operations of Angkasa Pura II.
◼ Telkom, Telkomsel and PT Freeport Indonesia collaborate to deploy 5G Smart Mining in the Freeport
Mining area through deployment of 5G Private Network Infrastructure to provide smart mining use
cases such as 5G Remote Controlled Vehicle and 5G FWA for Office.
Telkomsel will maximize the use of 5G that can transform lives and implement the advantages of the 5G
network to further encourage the growth of digital connectivity, digital platforms and digital services in
Indonesia as well as the development of future technology solutions such as artificial intelligence, cloud
computing and the Internet of Things with investment already included to its roadmap plan and will be
executed in stages based on several considerations including maturity of the ecosystem.

13
FIRST QUARTER OF 2022 (UNAUDITED)
Customer Base
As of March 2022, Telkomsel managed to have 175.0 million subscribers with positive trends of user
engagement in Data user, payload and payload per Data user that align with corporate strategy in supporting
healthy growth and maintaining leadership in industry.
Network Deployment
Continuous network development to support our focus on Digital Business with 4G and 5G BTS deployment
to reach 146,164 and 118 units, respectively in March 2022. As we have covered most of the population by
4G LTE network throughout the nation, the deployment will also be prioritizing quality and capacity. The
network rolls out brought total BTS on air to 247,930 units at the end of March 2022, or increased by 5.9%
YoY, of which 197,721 units were 3G/4G/5G BTS.
IT Development
We continue to enhance and strengthen our IT platform in order to improve our customer analytics’ capability
to be able to digitalize and provide more personalized products to our customers. Moreover, we also elevate
and expand our digital capabilities for the distinctive digital experience of customer.
The following table shows key operational performance as of 31 March 2022:
Fixed Line Services
Fixed Broadband IndiHome
IndiHome recorded Rp6.9 trillion in revenue or grew by 7.9% YoY, where its contribution to TelkomGroup
revenue increased to 19.5% in 1Q22 from 18.7% in the same period last year. EBITDA margin of IndiHome
expanded to around 50% in 1Q22, as a result of higher economic of scale and better operating leverage.
We added around 136 thousand new customers during 1Q22, brought total subscribers to reach 8.7 million
by the end of March 2022 or increased by 7.2% YoY. Around 58% of total customers were on Dual Play
Package while the remaining 42% were on Triple Play. IndiHome plays important role in building digital
society as its services cover 498 (97%) cities/districts throughout Indonesia. IndiHome ARPU in 1Q22 was
Rp268 thousand.
Key Indicators YoY QoQ
1Q22 1Q21 Growth (%) 1Q22 4Q21 Growth (%)
Customer Base (000) 174,956 164,692 6.2 174,956 175,977 (0.6)
ARPU (000) 41 43 (5.9) 41 43 (6.4)
BTS on Air (units) 247,930 234,165 5.9 247,930 251,116 (1.3)
Total Employees (*including subs & associated co) 5,474 5,352 2.3 5,474 5,535 (1.1)
MoU (in billion minutes) 25.5 33.1 (22.8) 25.5 28.3 (9.8)
SMS (in billion units) 3.8 6.6 (42.8) 3.8 5.9 (36.3)
Data Payload (TB) 3,798,866 3,188,180 19.2 3,798,866 3,789,223 0.3

14
FIRST QUARTER OF 2022 (UNAUDITED)
Aiming at higher ARPU, we encourage new and existing customers to subscribe on Triple Play, higher speed,
or purchase various add-ons such as various mini packs and additional hybrid boxes. Increasing ARPU was
largely driven by revenue from add-ons that grew by 15.6% YoY and contributed to around 15.9% of IndiHome
revenue, higher than previous year which contributed 15.0% of total IndiHome revenue.
Around 95.0% of the IndiHome revenue was generated from residential customers (Consumer Segment, with
around 94.7% contribution to the segment's revenue), while the remaining 5.0% was from business clients
(Enterprise Segment).
Enterprise & Wholesale and International Business (WIB)
Performance
During the first quarter 2022, Enterprise segment increased by 1.9% YoY in revenue to Rp4.2 trillion with
B2B IT Services and Enterprise Digital Solutions are the biggest contributors. Meanwhile, WIB segment
posted Rp3.9 trillion in revenue or increased by 16.0% YoY mainly due to growing tower business and
international wholesale voice.
Tower
Mitratel manages 28.577 towers with 1.51x tenancy ratio. Mitratel enjoys site diversification as around 58%
of Mitratel’s towers are located in ex-Java, while the remaining 42% are located in Java. We are of the view
that tower business still has the opportunity to grow, driven by 5G technology that has been rolled-out in
Indonesia.
Mitratel has recorded stand-alone Revenue of Rp1.87 trillion or grew by 21.5% YoY driven by tower leasing
revenue. EBITDA and Net Income grew by 28.8% and 33.9% YoY, respectively. Furthermore, both EBITDA

15
FIRST QUARTER OF 2022 (UNAUDITED)
Margin and Net Income Margin were also expanding to 77.1% and 24.6%, increased by 4.4 ppt and 2.3 ppt,
in line with management’s commitment to maximizing shareholder value.
Align with financial performance, collocation number and number of tenants grew by 14.8% and 21.5% YoY
respectively during this year.
Data Center
Data Center and Cloud remained as one of the areas that become our focus as the demand is growing
significantly with the rising activities in digital business players. The presence of robust data center and cloud
infrastructure is key to enable us in developing various digital solutions to enhance customers’ experience.
We have 27 data center facilities (22 domestic and 5 overseas including our Tier 3 and 4 data centers in
Singapore).
As Data Center business potentially provides higher valuation than Telecommunication business, we are of
the view that unlocking our Data Center business will also provide higher value to TelkomGroup. In order to
unlock its value, we are currently in the process of consolidating our Data Center business under one entity
within TelkomGroup where Sigma Tata Sadaya (STS) is the subsidiary to become a Data Center Company
or known as Telkom DC Co. Telkom DC is aspired to be a New DC Company from the TelkomGroup that
can provide the best value for stakeholders, as well as to realize Telkom's vision to become the most
preferred digital telco to empower the society. The consolidation idea will be completed in stages, starting
with the consolidation of Hyperscale Data Center & other domestic data centers and continuing with the
consolidation of regional data centers. We expect that the process will be taken place in 2-3 years ahead.
Building partnerships with technology leaders like Microsoft is one of Telkom’s strategic initiatives to
strengthen the company’s portfolio, accelerate the transformation process, and improve the digital
capabilities. The initiative to establish strategic partnerships with several global tech companies is expected
to have a positive impact on Telkom’s business development, especially in the digital platform and digital
services domain.
Telkom and Microsoft have signed a strategic partnership agreement to accelerate Indonesia’s national
digitalization, strengthen the country’s intelligent infrastructure, and enable the internal digital transformation
of Telkom to become the first-choice digital telco.
All of our data centers are integrated to the Telkom network, so that our customers can experience our best
digital connectivity and digital platform services.
16
FIRST QUARTER OF 2022 (UNAUDITED)
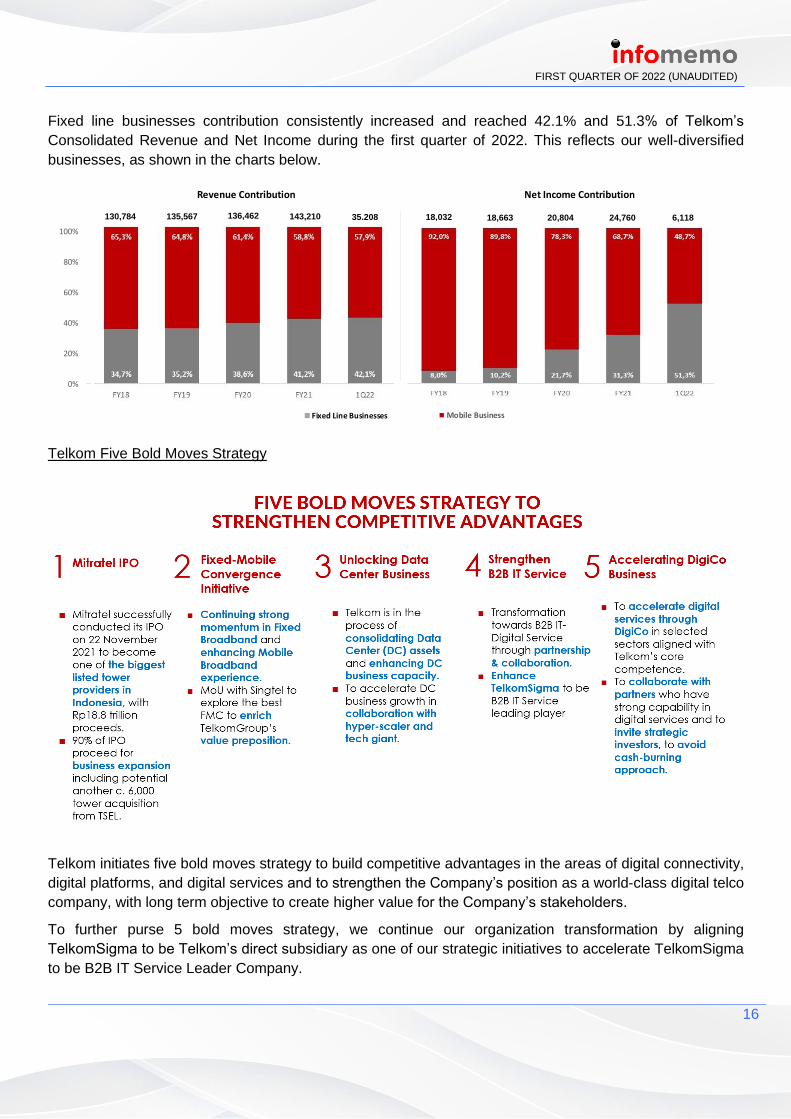
Fixed line businesses contribution consistently increased and reached 42.1% and 51.3% of Telkom’s
Consolidated Revenue and Net Income during the first quarter of 2022. This reflects our well-diversified
businesses, as shown in the charts below.
Telkom Five Bold Moves Strategy
Telkom initiates five bold moves strategy to build competitive advantages in the areas of digital connectivity,
digital platforms, and digital services and to strengthen the Company’s position as a world-class digital telco
company, with long term objective to create higher value for the Company’s stakeholders.
To further purse 5 bold moves strategy, we continue our organization transformation by aligning
TelkomSigma to be Telkom’s direct subsidiary as one of our strategic initiatives to accelerate TelkomSigma
to be B2B IT Service Leader Company.
-
Revenue Contribution Net Income Contribution
0%
20%
40%
60%
80%
100%
FY17 FY18 FY19 FY20 FY21
Fixed Line Businesses
135,567 130,784 128,256
41.2%
58.8%
38.6%
61.4%64.8%
34.7%
65.3%70.2%
FY17 FY18 FY19 FY20 FY21
Mobile Business
136,462 143,210
29.8% 35.2%
22,145 18,032 18,663 20,804 24,760
89.2% 92.0% 89.8% 78.3% 68.7%
31.3%21.7%10.2%8.0%10.8%
35.208 143,210 136,462 135,567 130,784 18,032 18,663 20,804 24,760 6,118
17
FIRST QUARTER OF 2022 (UNAUDITED)
Telkom’s ESG Initiatives
As a leading telco in Indonesia, Telkom is committed to connecting people and making it easier for our
customers to connect, creating jobs and opportunities for the community, while also continuing to innovate
to enable competition in the digital era. We are continuously reviewing our sustainability strategy in managing
risks and taking advantage of current opportunities, as well as planning the sustainability target, we want to
achieve in the future. Our sustainability strategy focuses on five pillars, namely Ethics, Human Capital,
Environment, Society, and Performance Growth.
Telkom emphasizes a culture of sustainability that emphasizes attention to environmental, social, and
governance (ESG) aspects in each of its business policies. In addition, Telkom seeks to build a culture that
encourages responsible thinking and behavior through programs carried out with the community as well as
within the company
Product and Marketing Activities
Fixed Line
◼ IndiHome Paket Pelajar, Pengajar dan Jurnalis
As a form of support for learning and journalism activities, IndiHome offers packages supported by fast
internet connections, various interactive TV services and IndiHome Study application to facilitate the
activities of teachers, lecturers, students, and journalists throughout Indonesia.
◼ IndiHome Paket Gamer
As a form to facilitate gaming activities, IndiHome introduces packages with super-fast internet networks
and some attractive in-game benefits from Game Publisher. IndiHome is also committed to the
development of e-sports in the country by actively held several games tournament. Besides that,
IndiHome launched an e-sport academy with the concept of athlete enablement, namely Limitless Esport
Academy (LEAD), to empower and train the player to become a professional player (pro-player) with an
athlete mentality.
◼ Paket IndiHome PDD
The packages offered with discounted prices to customers who want to pay in advance for 6 to 12 months
subscriptions. The packages include 113 basic channels, access to HBO GO and USeeTV, and up to
100 minutes free local and interlocal call.
ADDITIONAL INFORMATION
Awards and Recognition
As a reflection of our business excellence, innovative products and services, reliable network infrastructure,
widest coverage areas, excellent customer service, strategy execution and strong management operation,
we received awards and accolades for various categories from leading institutions at both national and
international levels. The awards and accolades we received during 1Q22 among others:
◼ Best Project Partner in Kampus Merdeka Training Program in Anugerah Diktiristek 2021 Award from
Ministry of Education and Culture.
18
FIRST QUARTER OF 2022 (UNAUDITED)
◼ The Best Public Relation in Company Management on Developing Telecommunication Infrastucture
(Category: Information, Technology and Communication) from Warta Ekonomi
◼ 1st Most Valuable Brand in The 9th Brand Finance Indonesia Top 100 Most Valuable Brands from
Brand Finance & Investor Daily
◼ Digital Initiative and Mobile App of the Year from Charlton Media Group
◼ Corporate Communication of the Year, 1st Community Involvement and Development in Education,
1st Creating Shared Value, 1st Small and Medium Enterprise Development, and 1ST TJSL Officer of
the Year from Ministry of State-Owned Enterprises.
◼ Asia-Pacific Stevie Awards 2022 Winner, 20 Awards (14 Gold, 3 Silver, and 3 Bronze) in many
Innovation Categories for Enterprise segment
◼ Gold Winner in Social Media and Bronze in Website nomination from PR Indonesia
◼ Top CSR Award 2022 # Star 5 and Top Leader on CSR Commitment 2022 from Top Brand
◼ Indonesia Millenial Women Brand Choice Awards 2022: Increase Creativity, Thinking Innovatively for
Telkomsel in Cellular Telecommunication Provider category from HerStory - Warta Ekonomi.
◼ WOW Brand 2022 for Telkomsel (Gold Champion in Cellular Operator category) and Telkomsel Orbit
(Above The Line category) from MarkPlus, Inc.
◼ PR Indonesia Awards (PRIA) 2022 for Telkomsel with PopCorn Magazine - December 2021 edition
(Gold Winner in E-Magazine category) from PR Indonesia.
◼ Brand Choice Award 2022 for Telkomsel with Kartu Perdana by.U from Infobrand and TRAS N CO
Indonesia.
19
FIRST QUARTER OF 2022 (UNAUDITED)
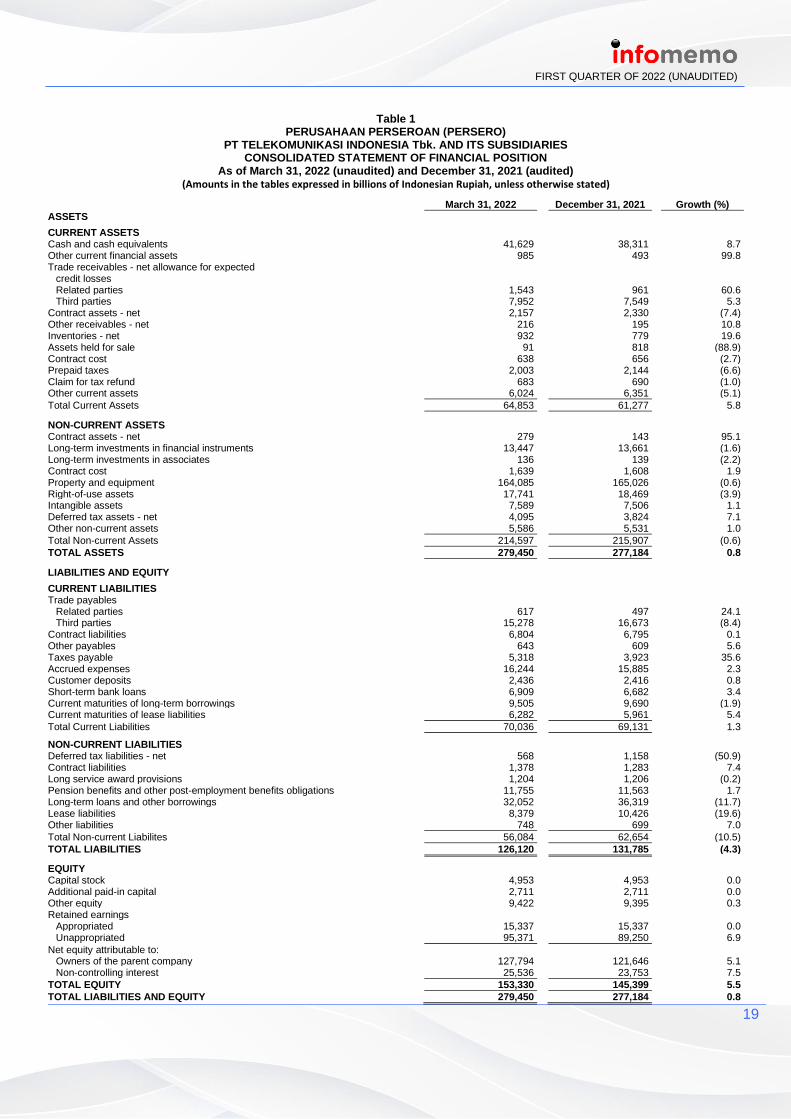
Table 1 PERUSAHAAN PERSEROAN (PERSERO)
PT TELEKOMUNIKASI INDONESIA Tbk. AND ITS SUBSIDIARIES CONSOLIDATED STATEMENT OF FINANCIAL POSITION
As of March 31, 2022 (unaudited) and December 31, 2021 (audited) (Amounts in the tables expressed in billions of Indonesian Rupiah, unless otherwise stated)
March 31, 2022 December 31, 2021 Growth (%)
ASSETS
CURRENT ASSETS Cash and cash equivalents 41,629 38,311 8.7 Other current financial assets 985 493 99.8 Trade receivables - net allowance for expected
credit losses Related parties 1,543 961 60.6 Third parties 7,952 7,549 5.3
Contract assets - net 2,157 2,330 (7.4) Other receivables - net 216 195 10.8 Inventories - net 932 779 19.6 Assets held for sale 91 818 (88.9) Contract cost 638 656 (2.7) Prepaid taxes 2,003 2,144 (6.6) Claim for tax refund 683 690 (1.0) Other current assets 6,024 6,351 (5.1)
Total Current Assets 64,853 61,277 5.8
NON-CURRENT ASSETS Contract assets - net 279 143 95.1 Long-term investments in financial instruments 13,447 13,661 (1.6) Long-term investments in associates 136 139 (2.2) Contract cost 1,639 1,608 1.9 Property and equipment 164,085 165,026 (0.6) Right-of-use assets 17,741 18,469 (3.9) Intangible assets 7,589 7,506 1.1 Deferred tax assets - net 4,095 3,824 7.1 Other non-current assets 5,586 5,531 1.0
Total Non-current Assets 214,597 215,907 (0.6)
TOTAL ASSETS 279,450 277,184 0.8
LIABILITIES AND EQUITY
CURRENT LIABILITIES Trade payables
Related parties 617 497 24.1 Third parties 15,278 16,673 (8.4)
Contract liabilities 6,804 6,795 0.1 Other payables 643 609 5.6 Taxes payable 5,318 3,923 35.6 Accrued expenses 16,244 15,885 2.3 Customer deposits 2,436 2,416 0.8 Short-term bank loans 6,909 6,682 3.4 Current maturities of long-term borrowings 9,505 9,690 (1.9) Current maturities of lease liabilities 6,282 5,961 5.4
Total Current Liabilities 70,036 69,131 1.3
NON-CURRENT LIABILITIES Deferred tax liabilities - net 568 1,158 (50.9) Contract liabilities 1,378 1,283 7.4 Long service award provisions 1,204 1,206 (0.2) Pension benefits and other post-employment benefits obligations 11,755 11,563 1.7 Long-term loans and other borrowings 32,052 36,319 (11.7) Lease liabilities 8,379 10,426 (19.6) Other liabilities 748 699 7.0
Total Non-current Liabilites 56,084 62,654 (10.5)
TOTAL LIABILITIES 126,120 131,785 (4.3)
EQUITY Capital stock 4,953 4,953 0.0 Additional paid-in capital 2,711 2,711 0.0 Other equity 9,422 9,395 0.3 Retained earnings
Appropriated 15,337 15,337 0.0 Unappropriated 95,371 89,250 6.9
Net equity attributable to: Owners of the parent company 127,794 121,646 5.1 Non-controlling interest 25,536 23,753 7.5
TOTAL EQUITY 153,330 145,399 5.5
TOTAL LIABILITIES AND EQUITY 279,450 277,184 0.8

20
FIRST QUARTER OF 2022 (UNAUDITED)
Table 2 PERUSAHAAN PERSEROAN (PERSERO)
PT TELEKOMUNIKASI INDONESIA Tbk. AND ITS SUBSIDIARIES CONSOLIDATED STATEMENT OF PROFIT OR LOSS AND COMPREHENSIVE INCOME
For the Three Months Period Ended March 31, 2022 and 2021 (unaudited) (Amounts in the tables expressed in billions of Indonesian Rupiah, unless otherwise stated)
2022 2021 Growth (%)
REVENUES 35,208 33,945 3.7 COST AND EXPENSES Operation, maintenance, and telecommunication service expenses (8,936) (8,452) 5.7 Depreciation and amortization expenses (7,976) (7,286) 9.5 Personnel expenses (3,516) (3,500) 0.5 Interconnection expenses (1,356) (1,136) 19.4 General and administrative expenses (1,200) (1,293) (7.2) Marketing expenses (812) (755) 7.5 Unrealized gain (losses) on changes in fair value of investments (893) 14 N/A Other income - net 47 84 (44.0) Gain on foreign exchange - net 45 78 (42.3)
OPERATING PROFIT 10,611 11,699 (9.3)
Finance income 200 153 30.7 Finance cost (945) (982) (3.8) Share of loss of associated companies - net (4) (54) (92.6)
PROFIT BEFORE INCOME TAX 9,862 10,816 (8.8)
INCOME TAX (EXPENSE) BENEFIT
Current (2,832) (2,243) 26.3 Deferred 826 (186) (544.1)
(2,006) (2,429) (17.4)
PROFIT FOR THE YEAR 7,856 8,387 (6.3)
OTHER COMPREHENSIVE INCOME (LOSS) Other comprehensive income (loss) to be reclassified to profit
or loss in subsequent periods: Foreign currency translation 27 93 (71.0) Share of other comprehensive income of
long-term investment in associates 1 - 100.0 Other comprehensive income (loss) not to be reclassified to profit
or loss in subsequent periods: Defined benefit actuarial gain (loss) - net 2 (1) 300.0
Other comprehensive income - net 30 92 (67.4)
TOTAL COMPREHENSIVE INCOME FOR THE YEAR 7,886 8,479 (7.0)
Profit for the year attributable to:
Owners of the parent company 6,118 6,014 1.7 Non-controlling interests 1,738 2,373 (26.8)
7,856 8,387 (6.3)
Total comprehensive income for the year attributable to: Owners of the parent company 6,148 6,106 0.7 Non-controlling interests 1,738 2,373 (26.8)
7,886 8,479 (7.0)
BASIC EARNING PER SHARE (in full amount) Net income per share 61.76 60.71 1.7 Net income per ADS (100 Series B shares per ADS) 6,175.92 6,070.93 1.7
21
FIRST QUARTER OF 2022 (UNAUDITED)
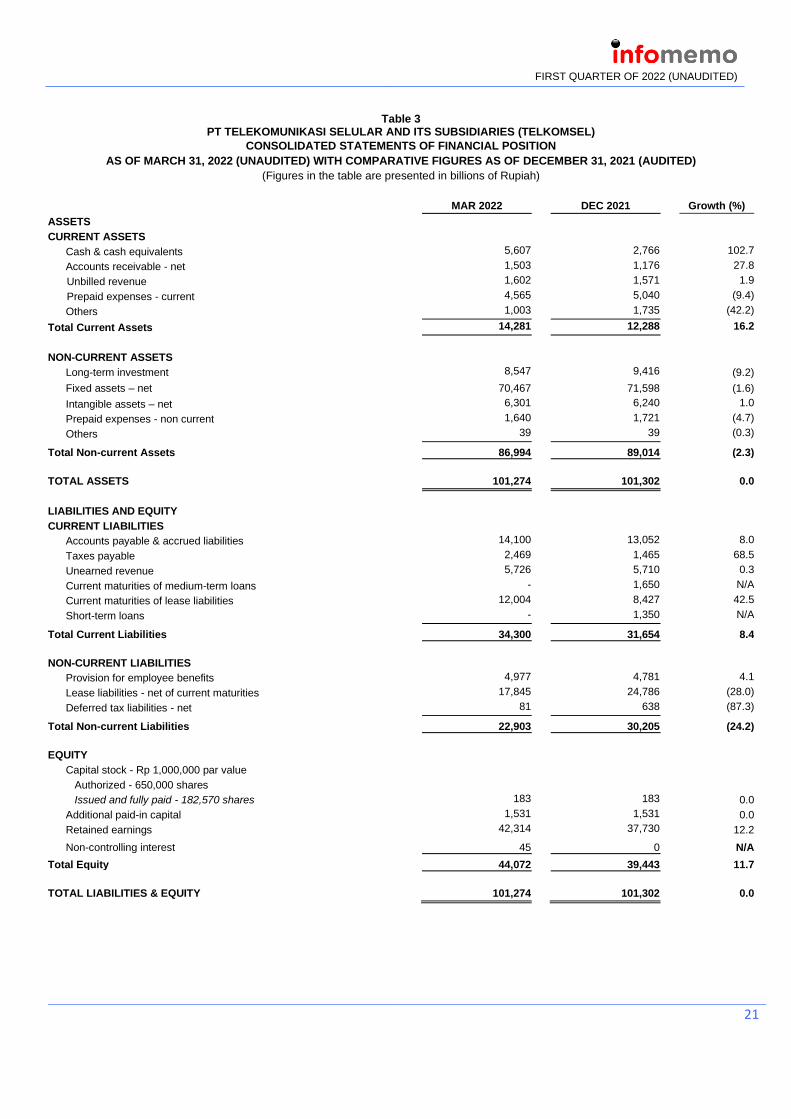
Table 3 PT TELEKOMUNIKASI SELULAR AND ITS SUBSIDIARIES (TELKOMSEL)
CONSOLIDATED STATEMENTS OF FINANCIAL POSITION
AS OF MARCH 31, 2022 (UNAUDITED) WITH COMPARATIVE FIGURES AS OF DECEMBER 31, 2021 (AUDITED)
(Figures in the table are presented in billions of Rupiah)
MAR 2022 DEC 2021 Growth (%)
ASSETS
CURRENT ASSETS
Cash & cash equivalents 5,607 2,766 102.7
Accounts receivable - net 1,503 1,176 27.8
Unbilled revenue 1,602 1,571 1.9
Prepaid expenses - current 4,565 5,040 (9.4)
Others 1,003 1,735 (42.2)
Total Current Assets 14,281 12,288 16.2
NON-CURRENT ASSETS
Long-term investment 8,547 9,416 (9.2)
Fixed assets – net 70,467 71,598 (1.6)
Intangible assets – net 6,301 6,240 1.0
Prepaid expenses - non current 1,640 1,721 (4.7)
Others 39 39 (0.3)
Total Non-current Assets 86,994 89,014 (2.3)
TOTAL ASSETS 101,274 101,302 0.0
LIABILITIES AND EQUITY
CURRENT LIABILITIES
Accounts payable & accrued liabilities 14,100 13,052 8.0
Taxes payable 2,469 1,465 68.5
Unearned revenue 5,726 5,710 0.3
Current maturities of medium-term loans - 1,650 N/A
Current maturities of lease liabilities 12,004 8,427 42.5
Short-term loans - 1,350 N/A
Total Current Liabilities 34,300 31,654 8.4
NON-CURRENT LIABILITIES
Provision for employee benefits 4,977 4,781 4.1
Lease liabilities - net of current maturities 17,845 24,786 (28.0)
Deferred tax liabilities - net 81 638 (87.3)
Total Non-current Liabilities 22,903 30,205 (24.2)
EQUITY
Capital stock - Rp 1,000,000 par value
Authorized - 650,000 shares
Issued and fully paid - 182,570 shares 183 183 0.0
Additional paid-in capital 1,531 1,531 0.0
Retained earnings 42,314 37,730 12.2
Non-controlling interest 45 0 N/A
Total Equity 44,072 39,443 11.7
TOTAL LIABILITIES & EQUITY 101,274 101,302 0.0
22
FIRST QUARTER OF 2022 (UNAUDITED)
Table 4 PT TELEKOMUNIKASI SELULAR AND ITS SUBSIDIARIES (TELKOMSEL)
CONSOLIDATED STATEMENTS OF PROFIT AND LOSS
FOR THREE MONTHS ENDED MARCH 31, 2022 AND 2021 (UNAUDITED)
(Figures in the table are presented in billions of Rupiah)
MAR 2022 MAR 2021 Growth (%)
REVENUES
Legacy 4,317 4,891 (11.7)
Digital Business 16,945 16,324 3.8
Data 14,408 13,915 3.5
Digital services 2,537 2,410 5.3
Total Revenues 21,263 21,215 0.2
EXPENSES
Operations & maintenance 5,142 5,014 2.5
Personnel 1,425 1,375 3.7
Marketing 518 484 6.9
General & administrative 241 242 (0.7)
Cost of services 1,314 1,210 8.6
Interconnection & international roaming 355 388 (8.5)
Depreciation & amortization 5,172 5,031 2.8
Others – net 756 (1,235) 161.2
Total Expenses 14,923 12,509 19.3
Finance charges – net (430) (346) 24.2
INCOME BEFORE TAX 5,910 8,360 (29.3)
INCOME TAX EXPENSE (1,326) (1,636) (18.9)
NET INCOME 4,584 6,724 (31.8)
EBITDA 12,268 12,501 (1.9)
EBITDA Margin 57.7% 58.9% (1.2) ppt
ROA 23.0% 22.9% 0.1 ppt
ROE 49.1% 45.0% 4.1 ppt
Related Documents