Higher Education and the Future of Hawaii Presented to the The Senate Education Committee, and The House Higher Education Committee Honolulu, Hawaii March 12, 2007 National Center for Higher Education Management Systems National Center for Higher Education Management Systems 3035 Center Green Drive, Suite 150 Boulder, Colorado 80301-2251

Welcome message from author
This document is posted to help you gain knowledge. Please leave a comment to let me know what you think about it! Share it to your friends and learn new things together.
Transcript
Higher Education and the Future of Hawaii
Presented to the
The Senate Education Committee, andThe House Higher Education Committee
Honolulu, Hawaii
March 12, 2007
National Center for Higher Education Management SystemsNational Center for Higher Education Management Systems3035 Center Green Drive, Suite 150 Boulder, Colorado 80301-2251
2
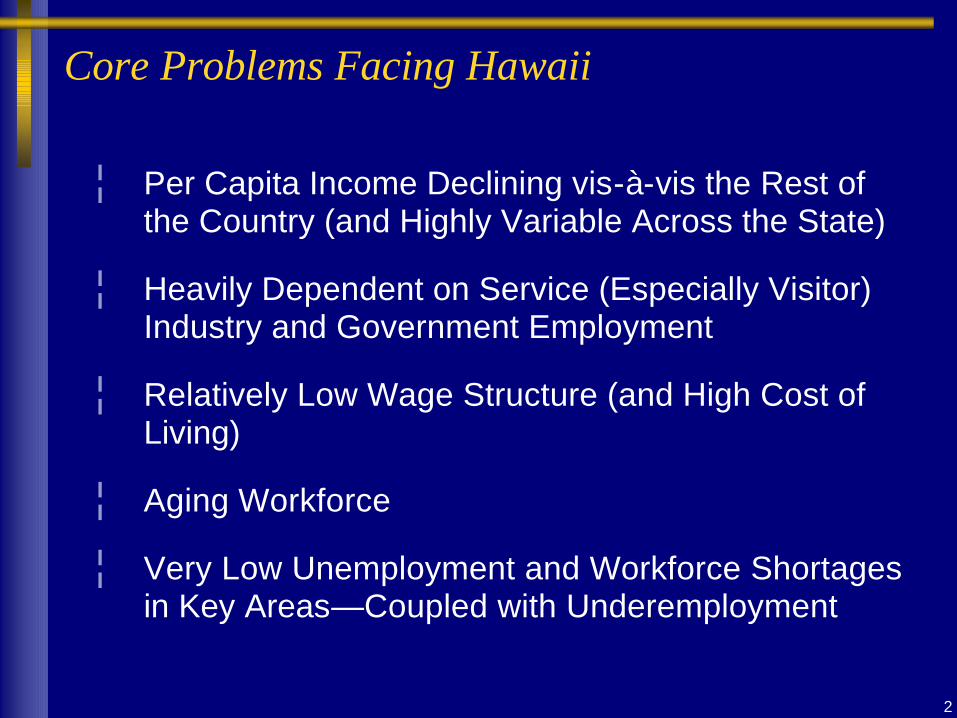
Core Problems Facing Hawaii
¦ Per Capita Income Declining vis-à-vis the Rest of the Country (and Highly Variable Across the State)
¦ Heavily Dependent on Service (Especially Visitor) Industry and Government Employment
¦ Relatively Low Wage Structure (and High Cost of Living)
¦ Aging Workforce
¦ Very Low Unemployment and Workforce Shortages in Key Areas—Coupled with Underemployment
3
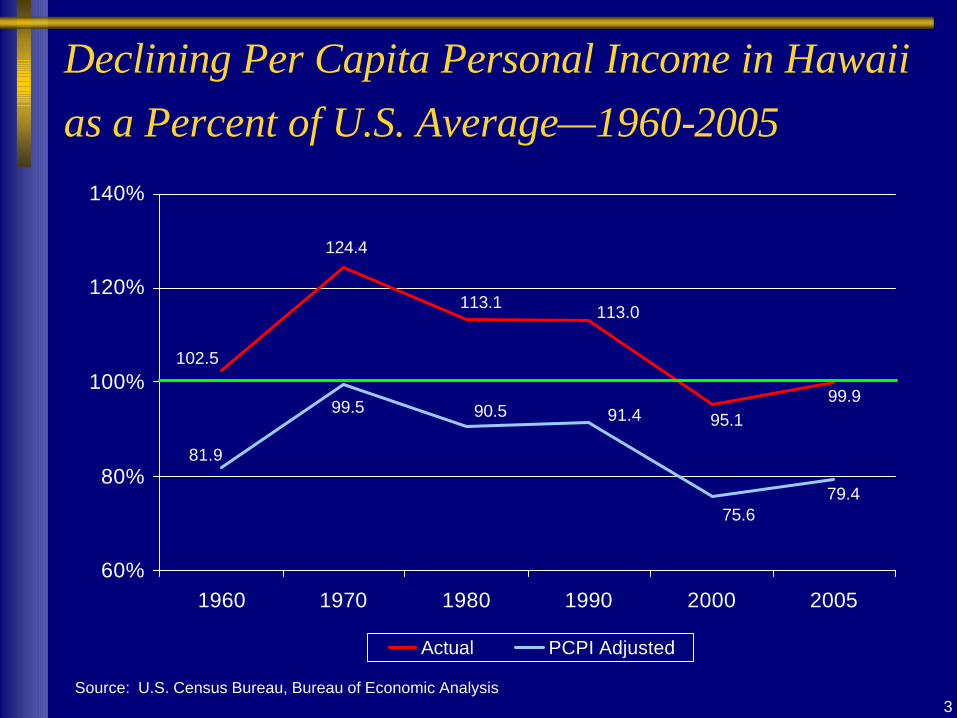
Declining Per Capita Personal Income in Hawaii as a Percent of U.S. Average—1960-2005
99.995.1
102.5
113.0113.1
124.4
79.4
81.9
75.6
91.490.599.5
60%
80%
100%
120%
140%
1960 1970 1980 1990 2000 2005
Actual PCPI Adjusted
Source: U.S. Census Bureau, Bureau of Economic Analysis

4
Per Capita Personal Income, 1999
Hawaii = $21,525Source: U.S. Census Bureau, 2000 Census
$26,473 to $38,483$21,759 to $26,473$16,483 to $21,759$13,756 to $16,483$8,704 to $13,756
Not Determined
5
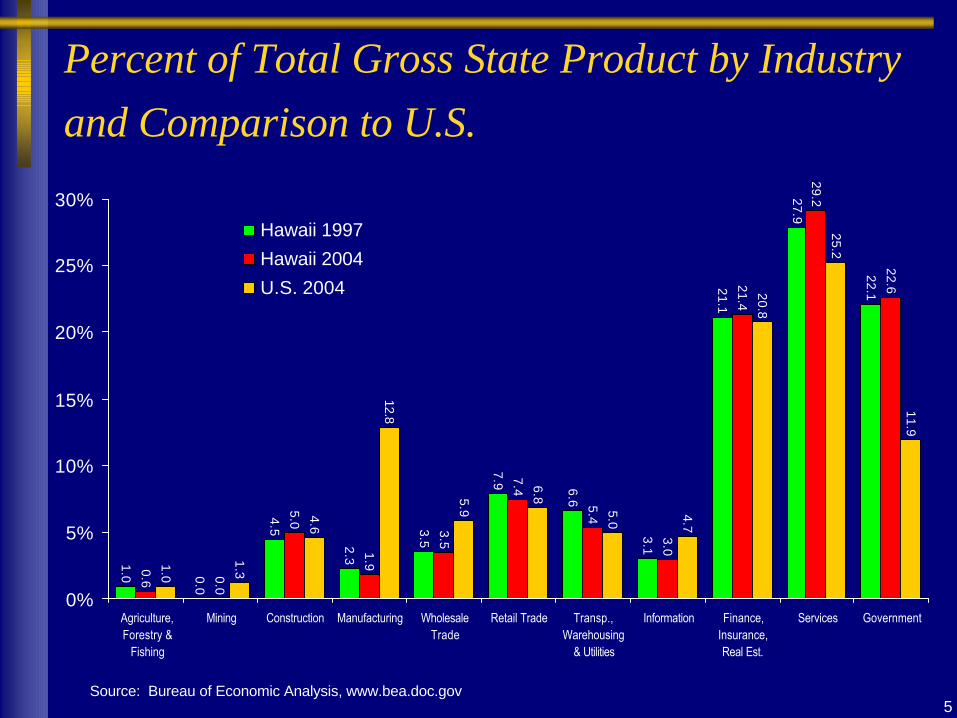
Percent of Total Gross State Product by Industry and Comparison to U.S.
22.1
27.9
21.1
3.1
6.6
7.9
3.52.3
4.5
0.0
1.0
22.6
29.2
21.4
3.0
5.4
7.4
3.5
1.9
5.0
0.0
0.6
11.9
25.2
20.8
4.7
5.0
6.85.9
12.8
4.6
1.31.0
0%
5%
10%
15%
20%
25%
30%
Agriculture,Forestry &
Fishing
Mining Construction Manufacturing WholesaleTrade
Retail Trade Transp.,Warehousing
& Utilities
Information Finance,Insurance,Real Est.
Services Government
Hawaii 1997
Hawaii 2004
U.S. 2004
Source: Bureau of Economic Analysis, www.bea.doc.gov
6
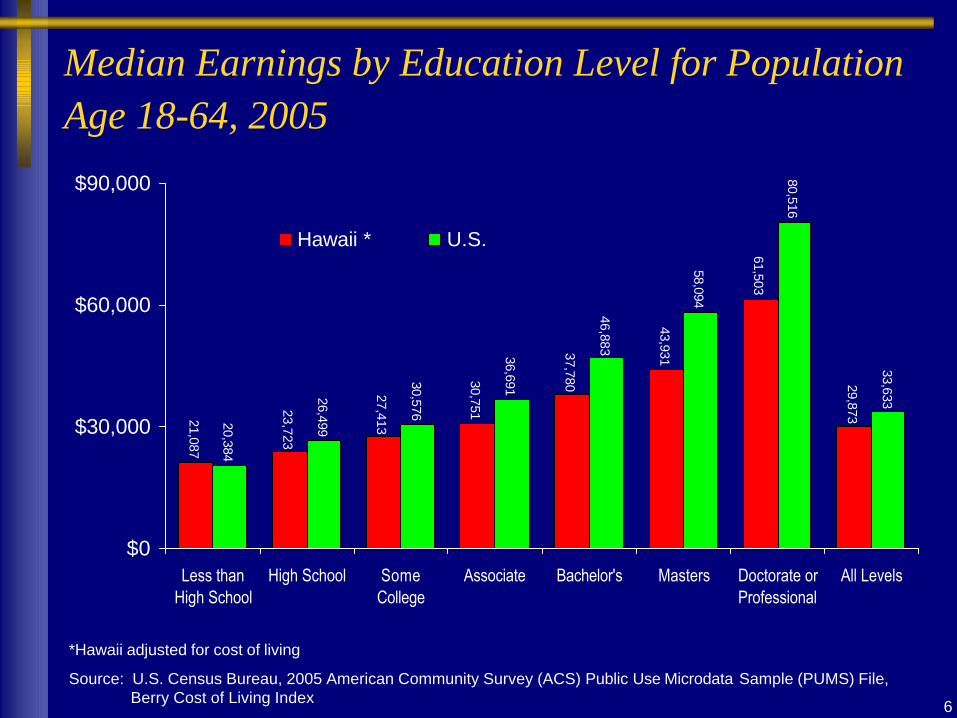
Median Earnings by Education Level for Population Age 18-64, 2005
21,087
23,723
27,413
30,751
37,780
43,931
61,503
29,87320,384
26,499
30,576
36,691
46,883
58,094
80,516
33,633
$0
$30,000
$60,000
$90,000
Less thanHigh School
High School SomeCollege
Associate Bachelor's Masters Doctorate orProfessional
All Levels
Hawaii * U.S.
*Hawaii adjusted for cost of living
Source: U.S. Census Bureau, 2005 American Community Survey (ACS) Public Use Microdata Sample (PUMS) File, Berry Cost of Living Index
7
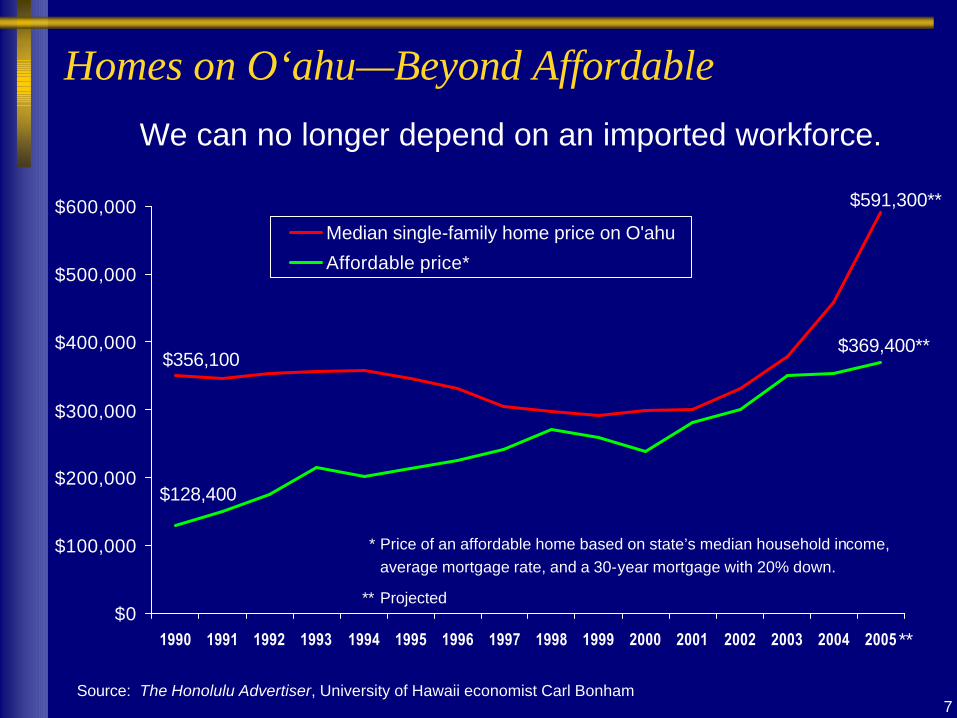
Homes on O‘ahu—Beyond Affordable
Source: The Honolulu Advertiser, University of Hawaii economist Carl Bonham
We can no longer depend on an imported workforce.
$0
$100,000
$200,000
$300,000
$400,000
$500,000
$600,000
1990 1991 1992 1993 1994 1995 1996 1997 1998 1999 2000 2001 2002 2003 2004 2005
Median single-family home price on O'ahu
Affordable price*
* Price of an affordable home based on state’s median household income, average mortgage rate, and a 30-year mortgage with 20% down.
** Projected
$356,100
$128,400
$591,300**
$369,400**
**
8
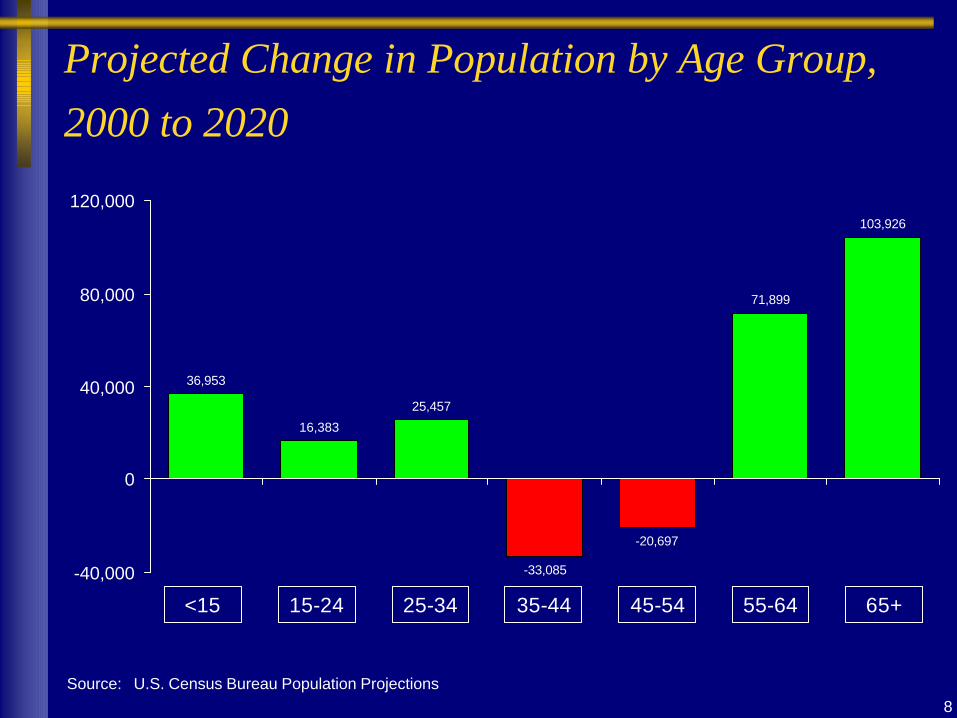
Projected Change in Population by Age Group, 2000 to 2020
Source: U.S. Census Bureau Population Projections
36,953
16,383
25,457
-33,085
-20,697
71,899
103,926
-40,000
0
40,000
80,000
120,000
<15 15-24 25-34 35-44 45-54 55-64 65+
9
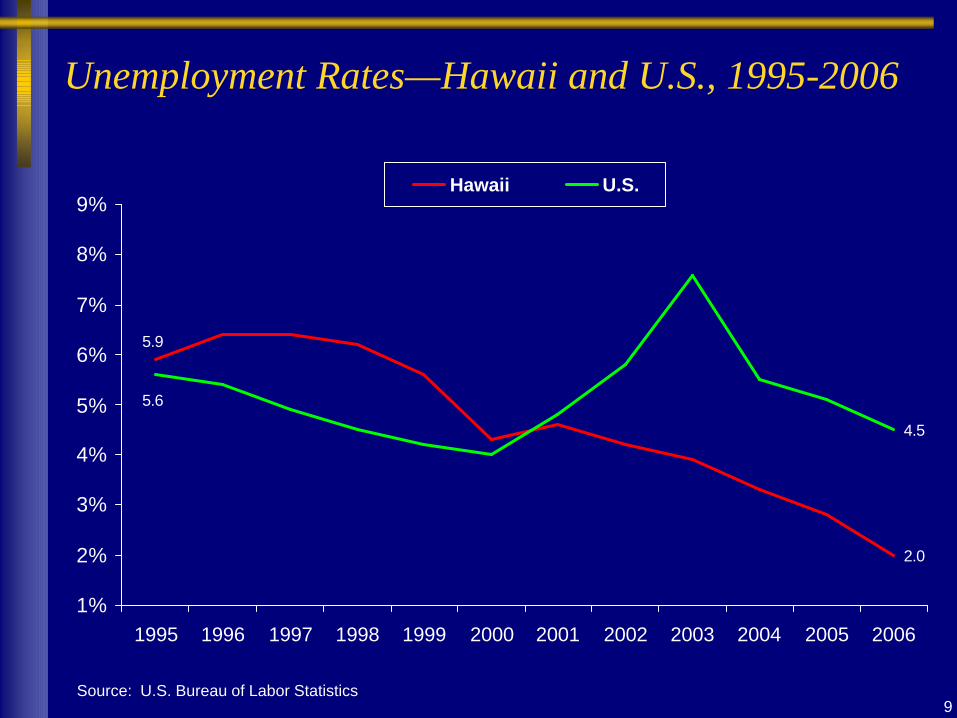
Unemployment Rates—Hawaii and U.S., 1995-2006
Source: U.S. Bureau of Labor Statistics
2.0
5.9
4.5
5.6
1%
2%
3%
4%
5%
6%
7%
8%
9%
1995 1996 1997 1998 1999 2000 2001 2002 2003 2004 2005 2006
Hawaii U.S.
10
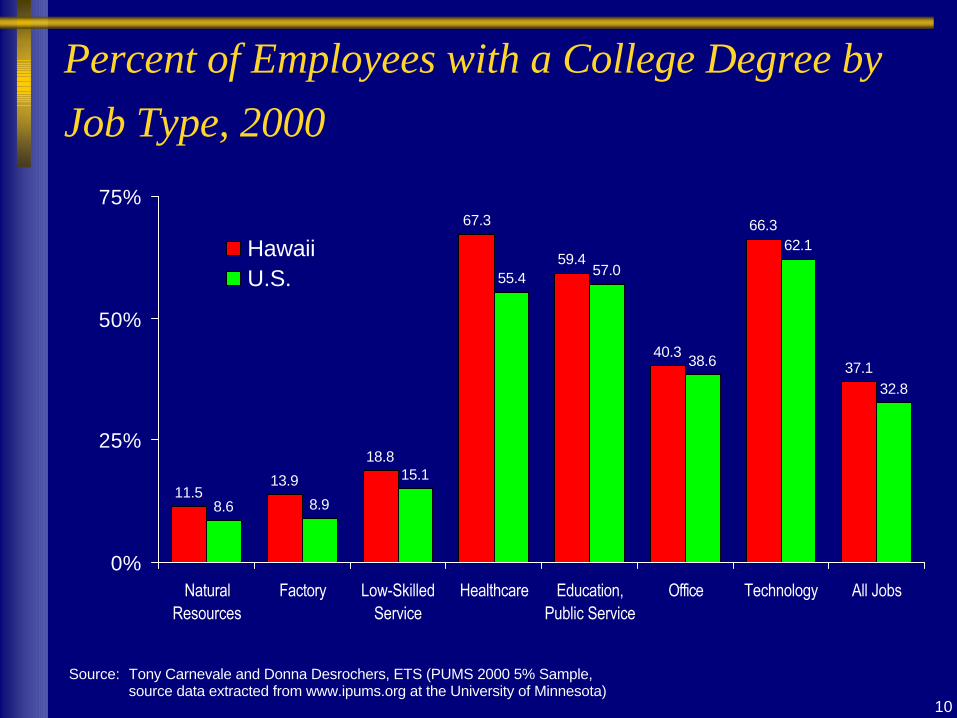
Percent of Employees with a College Degree by Job Type, 2000
37.1
66.3
40.3
59.4
67.3
18.8
13.911.5
32.8
62.1
38.6
57.055.4
15.1
8.98.6
0%
25%
50%
75%
NaturalResources
Factory Low-SkilledService
Healthcare Education,Public Service
Office Technology All Jobs
HawaiiU.S.
Source: Tony Carnevale and Donna Desrochers, ETS (PUMS 2000 5% Sample, source data extracted from www.ipums.org at the University of Minnesota)
11
Economic Future of Hawaii
¦ Increasing the Number of High-Wage Jobs—Expanding and Diversifying the Economy
¦ Creating a Skilled Workforce that Can Be Employed in Such Jobs
Interviews with Private and Public Sector Leaders Throughout the State Revealed a Common Belief that the Economic Future of Hawaii Depends on:

12
Some Key Facts About the State’s Workforce
¦ Generally High Educational Attainment—But Losing Ground
¦ Aging
¦ Workforce Participation Is About Average in Spite of Very Low Unemployment Rates—and Varies by:> Region of State> Education Attainment Levels
¦ Reliant on In-Migration to Fill Positions in Key Areas and Exporting in Other Key Fields
¦ Fewer High School Graduates than Open Positions
13
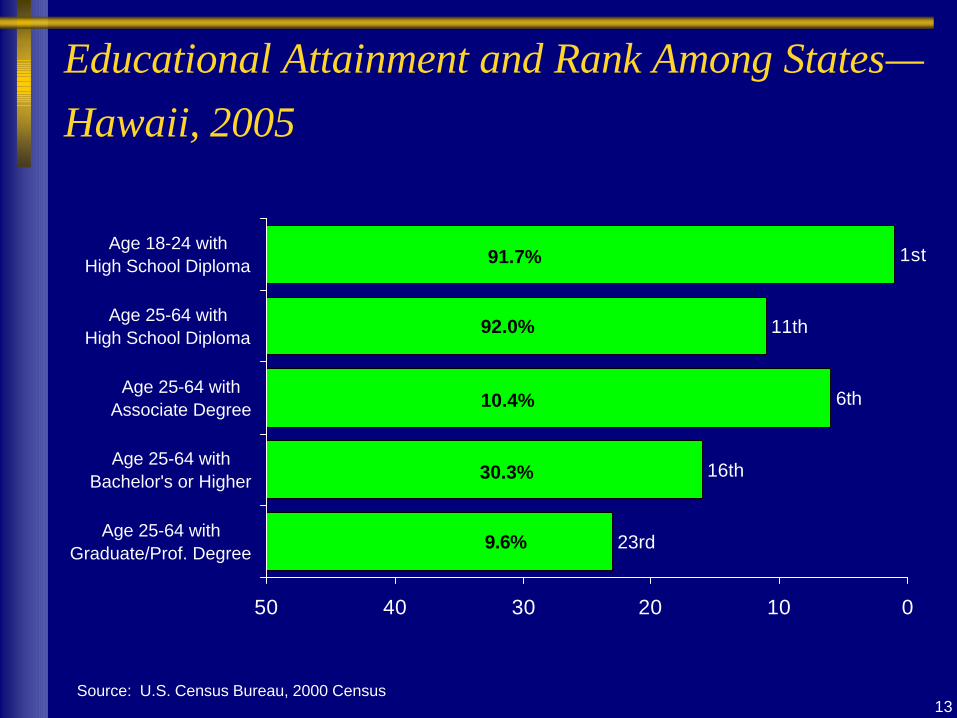
Educational Attainment and Rank Among States—Hawaii, 2005
23rd
16th
6th
11th
1st
01020304050
Age 25-64 withGraduate/Prof. Degree
Age 25-64 withBachelor's or Higher
Age 25-64 withAssociate Degree
Age 25-64 withHigh School Diploma
Age 18-24 withHigh School Diploma
Source: U.S. Census Bureau, 2000 Census
91.7%
9.6%
92.0%
10.4%
30.3%
14
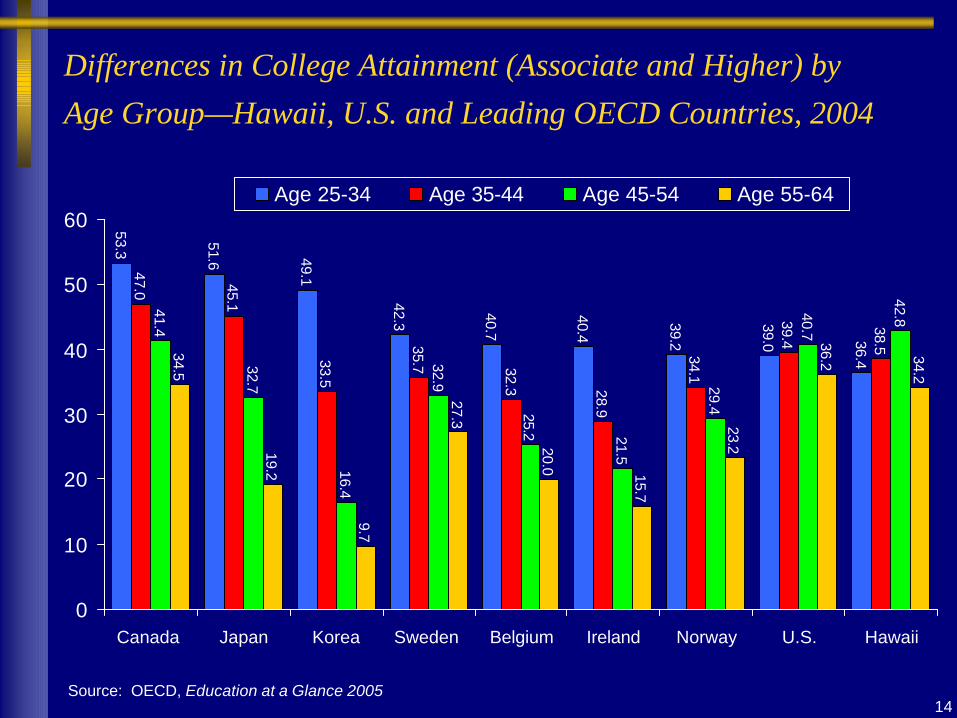
Differences in College Attainment (Associate and Higher) by Age Group—Hawaii, U.S. and Leading OECD Countries, 2004
53.3 51.6 49.1
42.3
40.7
40.4
39.2
39.0 36.4
47.0 45.1
33.5
35.7 32.3 28.9
34.1
39.4
38.5
41.4
32.7
16.4
32.9
25.2 21.5
29.4
40.7
42.8
34.5
19.2
9.7
27.3
20.0 15.7
23.2
36.2 34.2
0
10
20
30
40
50
60
Canada Japan Korea Sweden Belgium Ireland Norway U.S. Hawaii
Age 25-34 Age 35-44 Age 45-54 Age 55-64
Source: OECD, Education at a Glance 2005
15
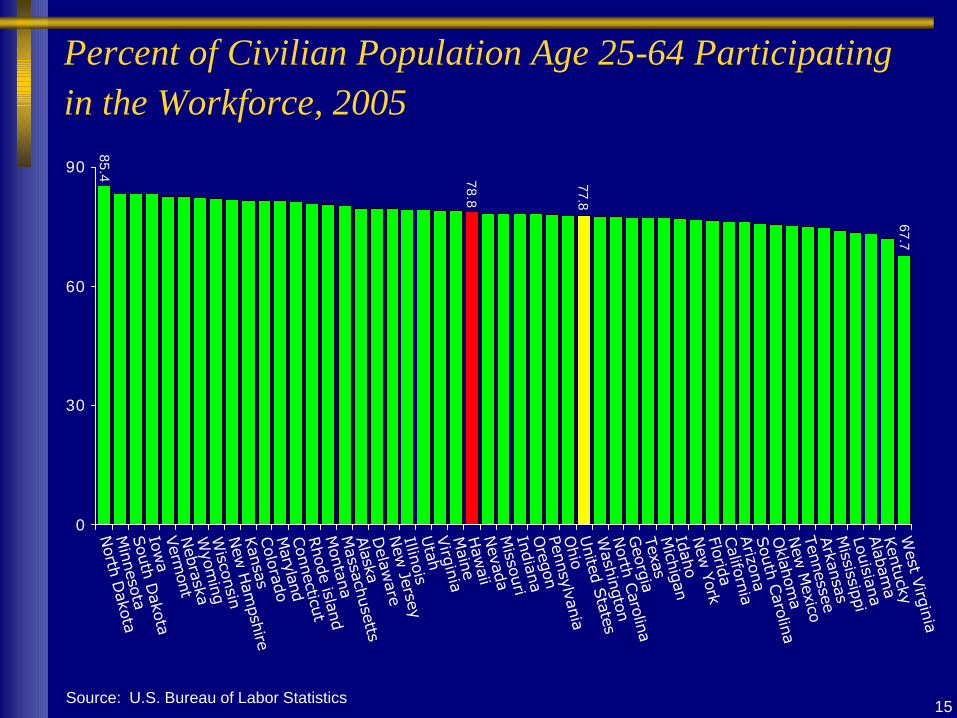
Percent of Civilian Population Age 25-64 Participating in the Workforce, 2005
78.8
77.8
67.7
85.4
0
30
60
90
North D
akotaM
innesotaSouth D
akotaIow
aVerm
ontNebraska
Wyom
ingW
isconsinNew
Ham
pshireKansas
Colorado
Maryland
Connecticut
Rhode island
Montana
Massachusetts
Alaska
Delaw
areN
ew Jersey
IllinoisUtah
Virgin
iaM
aineH
awaii
Nevada
Missouri
Indian
aO
regonPennsylvaniaO
hioUnited S
tatesW
ashingtonNorth C
arolinaG
eorgiaTexasM
ichiganIdahoNew
YorkFloridaCalifornia
Arizona
South C
arolinaO
klahoma
New
Mexico
TennesseeArkansas
Mississippi
LouisianaAlabam
aKentucky
West V
irginia
Source: U.S. Bureau of Labor Statistics
16
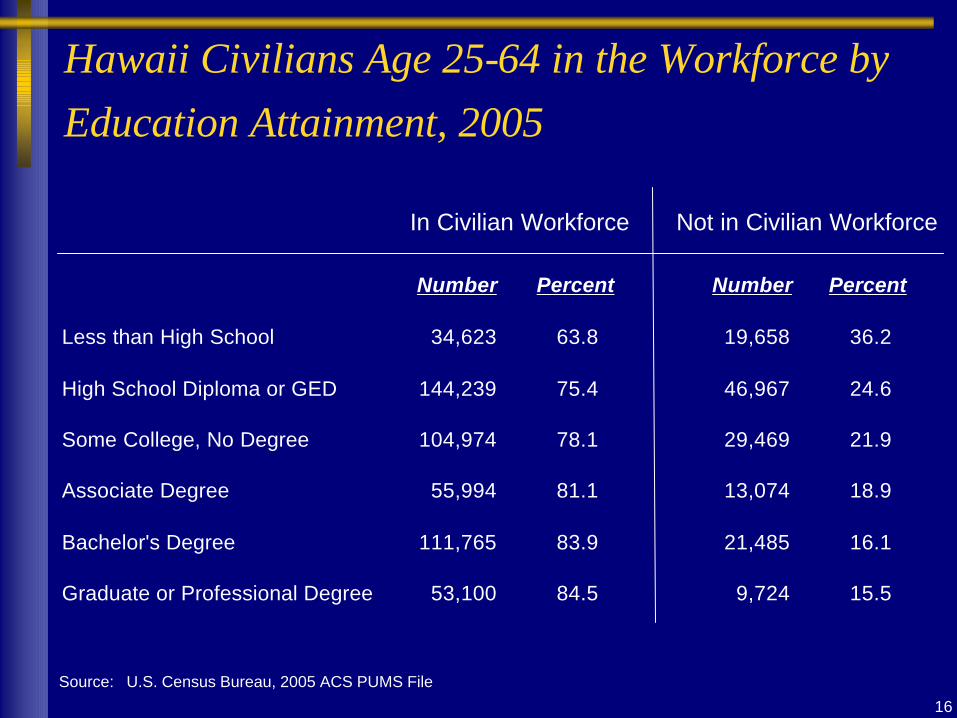
Hawaii Civilians Age 25-64 in the Workforce by Education Attainment, 2005
Source: U.S. Census Bureau, 2005 ACS PUMS File
Less than High School
High School Diploma or GED
Some College, No Degree
Associate Degree
Bachelor's Degree
Graduate or Professional Degree
In Civilian Workforce Not in Civilian Workforce
Number Percent Number Percent
34,623 63.8 19,658 36.2
144,239 75.4 46,967 24.6
104,974 78.1 29,469 21.9
55,994 81.1 13,074 18.9
111,765 83.9 21,485 16.1
53,100 84.5 9,724 15.5
17
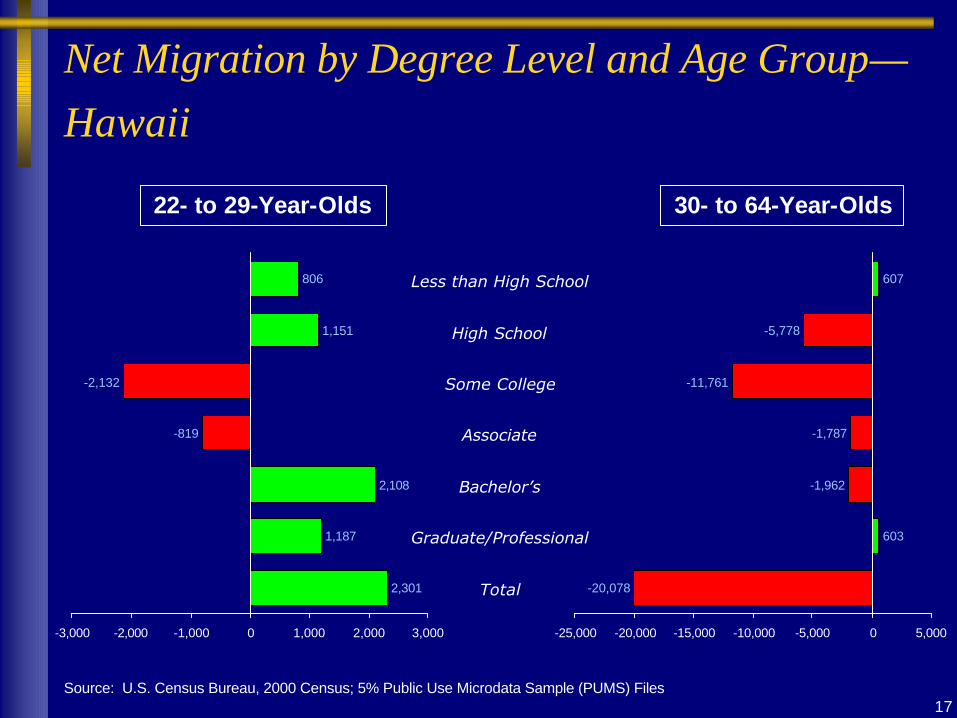
Net Migration by Degree Level and Age Group—Hawaii
Source: U.S. Census Bureau, 2000 Census; 5% Public Use Microdata Sample (PUMS) Files
22- to 29-Year-Olds 30- to 64-Year-Olds
2,301
1,187
2,108
-819
-2,132
1,151
806
-3,000 -2,000 -1,000 0 1,000 2,000 3,000
-20,078
603
-1,962
-1,787
-11,761
-5,778
607
-25,000 -20,000 -15,000 -10,000 -5,000 0 5,000
Less than High School
High School
Some College
Associate
Bachelor’s
Graduate/Professional
Total
18
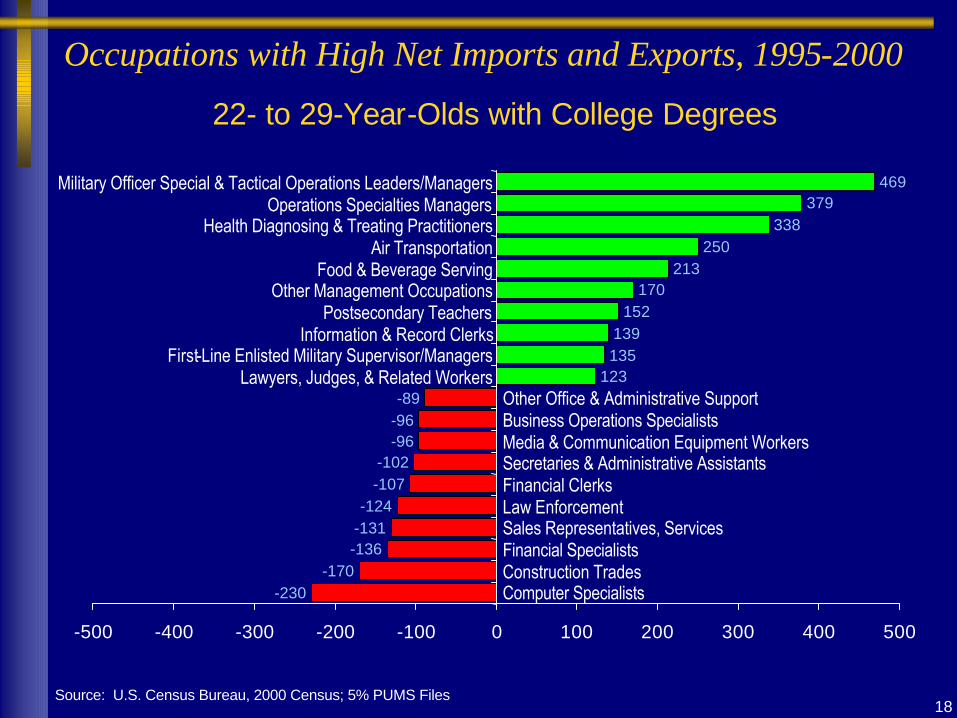
Occupations with High Net Imports and Exports, 1995-2000
Source: U.S. Census Bureau, 2000 Census; 5% PUMS Files
22- to 29-Year-Olds with College Degrees
-230-170
-136-131
-107-102
-96-96-89
123135139
152170
213250
338379
469
-124
-500 -400 -300 -200 -100 0 100 200 300 400 500
Computer SpecialistsConstruction TradesFinancial SpecialistsSales Representatives, ServicesLaw EnforcementFinancial ClerksSecretaries & Administrative AssistantsMedia & Communication Equipment WorkersBusiness Operations SpecialistsOther Office & Administrative Support
Lawyers, Judges, & Related WorkersFirst-Line Enlisted Military Supervisor/Managers
Information & Record ClerksPostsecondary Teachers
Other Management OccupationsFood & Beverage Serving
Air TransportationHealth Diagnosing & Treating Practitioners
Operations Specialties ManagersMilitary Officer Special & Tactical Operations Leaders/Managers
19
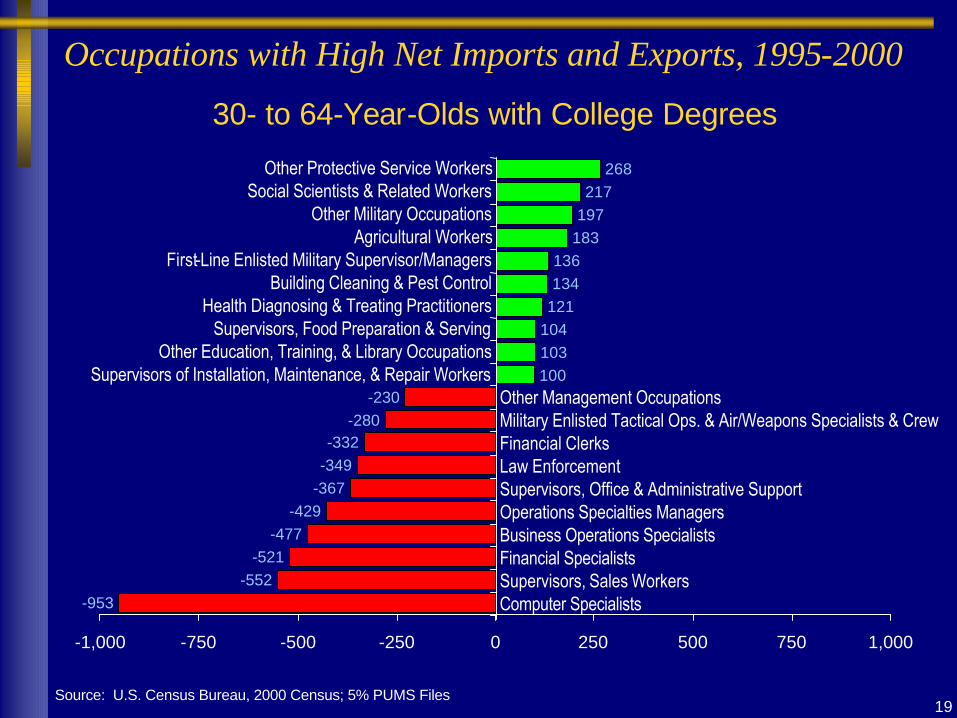
Occupations with High Net Imports and Exports, 1995-2000
30- to 64-Year-Olds with College Degrees
Source: U.S. Census Bureau, 2000 Census; 5% PUMS Files
-953-552
-521-477
-367-349-332
-280-230
100103104121134136
183197217
268
-429
-1,000 -750 -500 -250 0 250 500 750 1,000
Computer SpecialistsSupervisors, Sales WorkersFinancial SpecialistsBusiness Operations SpecialistsOperations Specialties ManagersSupervisors, Office & Administrative SupportLaw EnforcementFinancial ClerksMilitary Enlisted Tactical Ops. & Air/Weapons Specialists & CrewOther Management Occupations
Supervisors of Installation, Maintenance, & Repair WorkersOther Education, Training, & Library Occupations
Supervisors, Food Preparation & ServingHealth Diagnosing & Treating Practitioners
Building Cleaning & Pest ControlFirst-Line Enlisted Military Supervisor/Managers
Agricultural WorkersOther Military Occupations
Social Scientists & Related WorkersOther Protective Service Workers
20
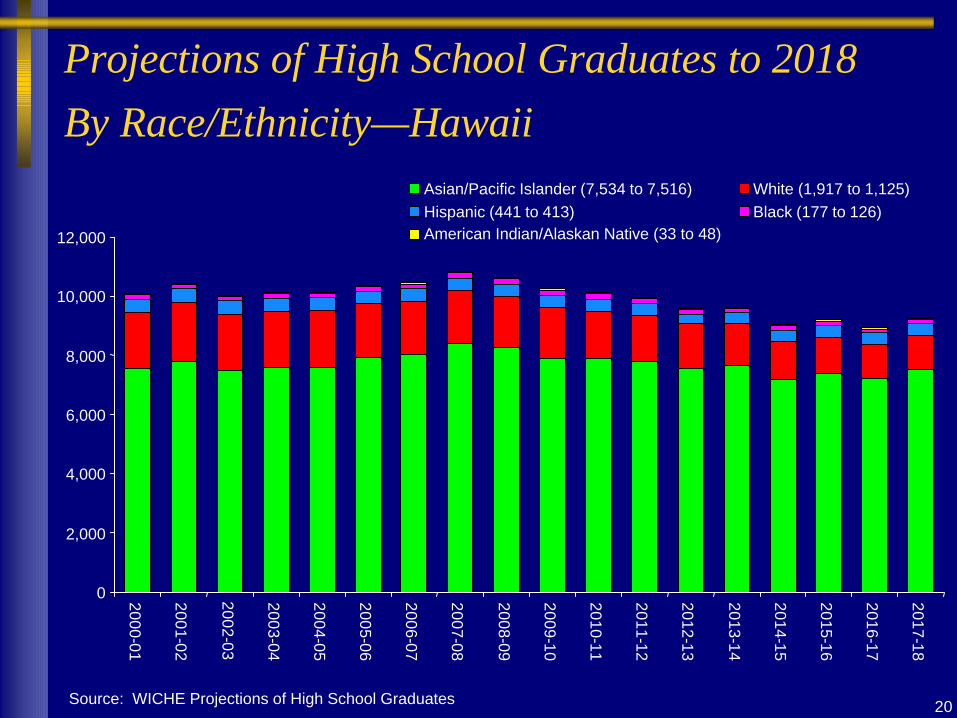
Projections of High School Graduates to 2018 By Race/Ethnicity—Hawaii
Source: WICHE Projections of High School Graduates
0
2,000
4,000
6,000
8,000
10,000
12,000
2000-01
2001-02
2002-03
2003-04
2004-05
2005-06
2006-07
2007-08
2008-09
2009-10
2010-11
2011-12
2012-13
2013-14
2014-15
2015-16
2016-17
2017-18
Asian/Pacific Islander (7,534 to 7,516) White (1,917 to 1,125)Hispanic (441 to 413) Black (177 to 126)American Indian/Alaskan Native (33 to 48)
21
Summary—The Good News
¦ Relatively Well Educated Workforce in Full Range of Current Employment—Underemployment??
¦ Relative High Salaries at All Levels of Education (but not When Adjusted for Cost of Living)
¦ There Are Jobs (of Some Sort) for Those Seeking Employment
¦ Many States Have Worse Problems than Hawaii
22
Summary—The Bad News
¦ Losing Ground RAPIDLY in Education Attainment
¦ Not Producing Enough Graduates to Replenish Retiring Workforce
¦ Hawaii Compares Unfavorably to Global Competitors
23
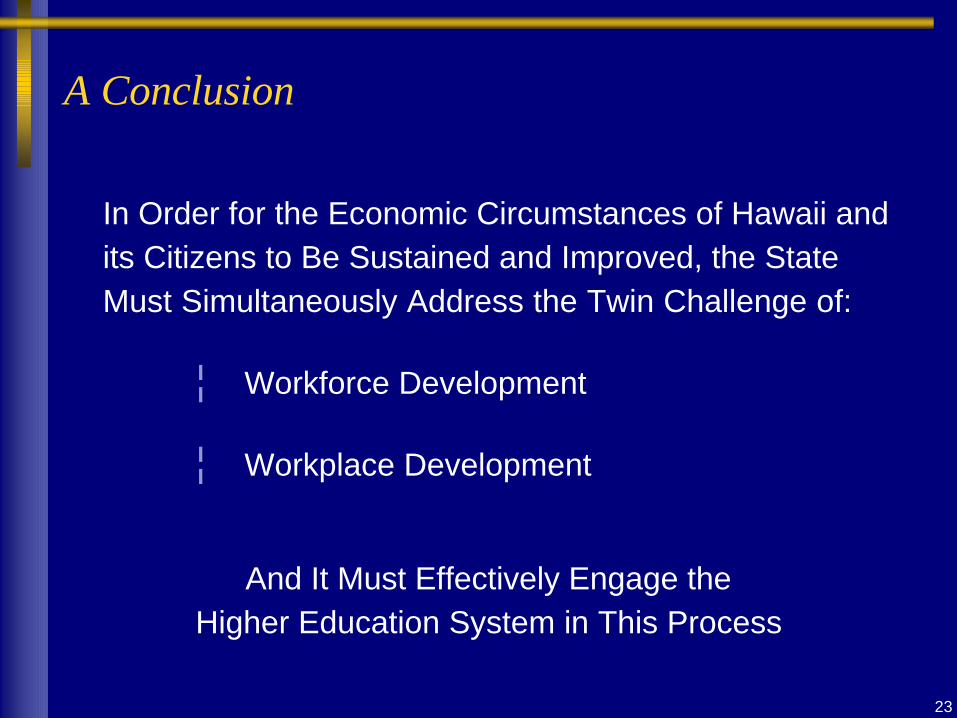
A Conclusion
¦ Workforce Development
¦ Workplace Development
In Order for the Economic Circumstances of Hawaii and its Citizens to Be Sustained and Improved, the State Must Simultaneously Address the Twin Challenge of:
And It Must Effectively Engage the Higher Education System in This Process
24
Workforce Development—The Education Pipeline
25
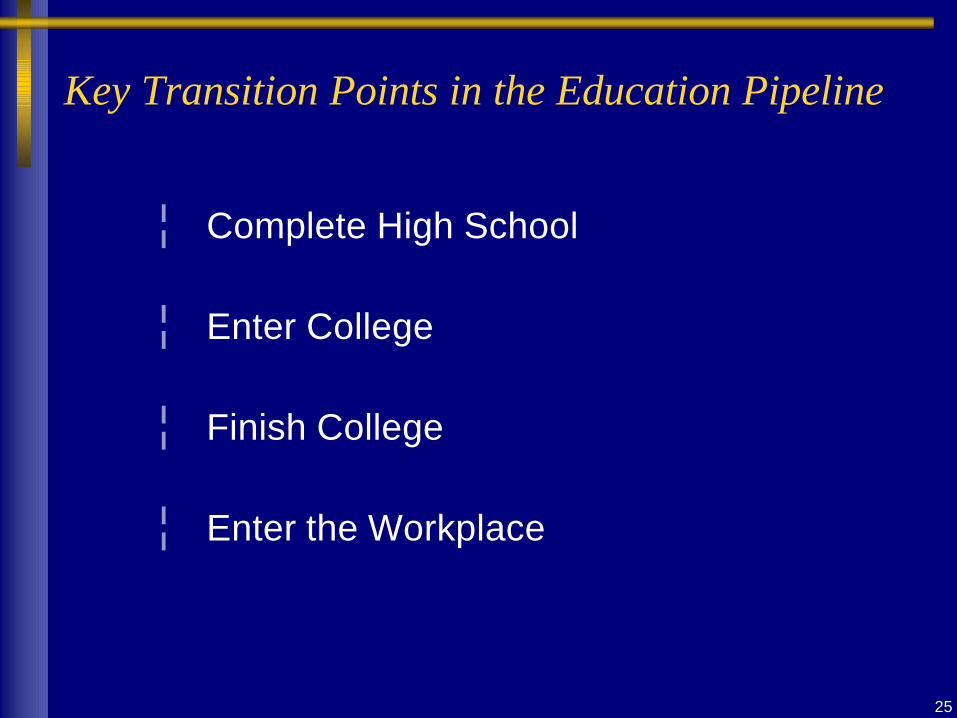
Key Transition Points in the Education Pipeline
¦ Complete High School
¦ Enter College
¦ Finish College
¦ Enter the Workplace
26
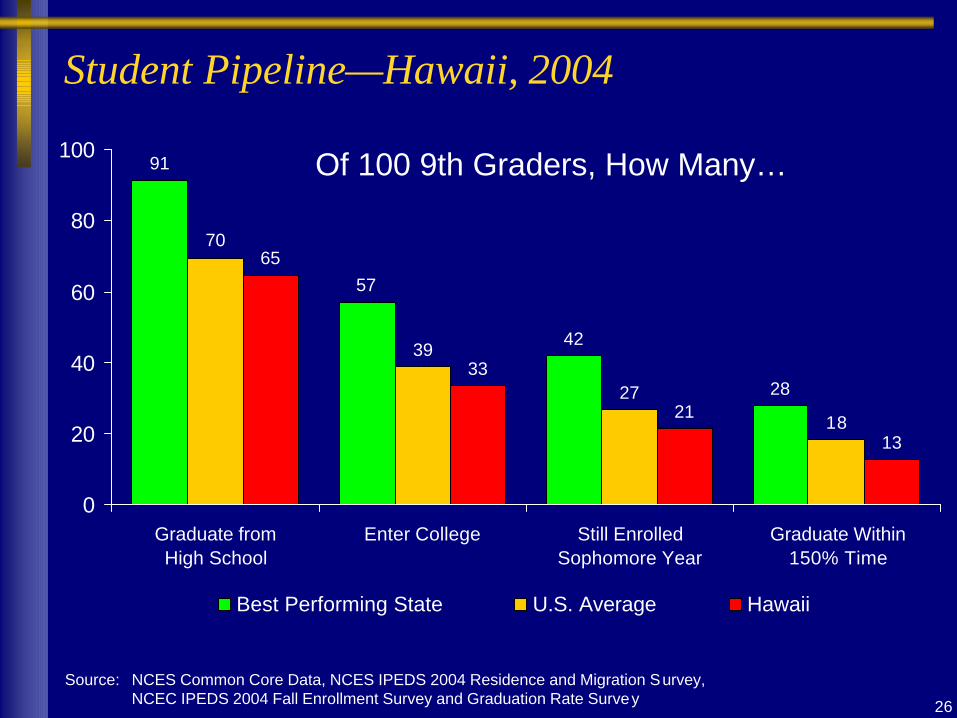
Student Pipeline—Hawaii, 2004
91
57
42
28
70
39
27
18
65
33
21
13
0
20
40
60
80
100
Graduate fromHigh School
Enter College Still EnrolledSophomore Year
Graduate Within150% Time
Best Performing State U.S. Average Hawaii
Of 100 9th Graders, How Many…
Source: NCES Common Core Data, NCES IPEDS 2004 Residence and Migration Survey, NCEC IPEDS 2004 Fall Enrollment Survey and Graduation Rate Survey

27
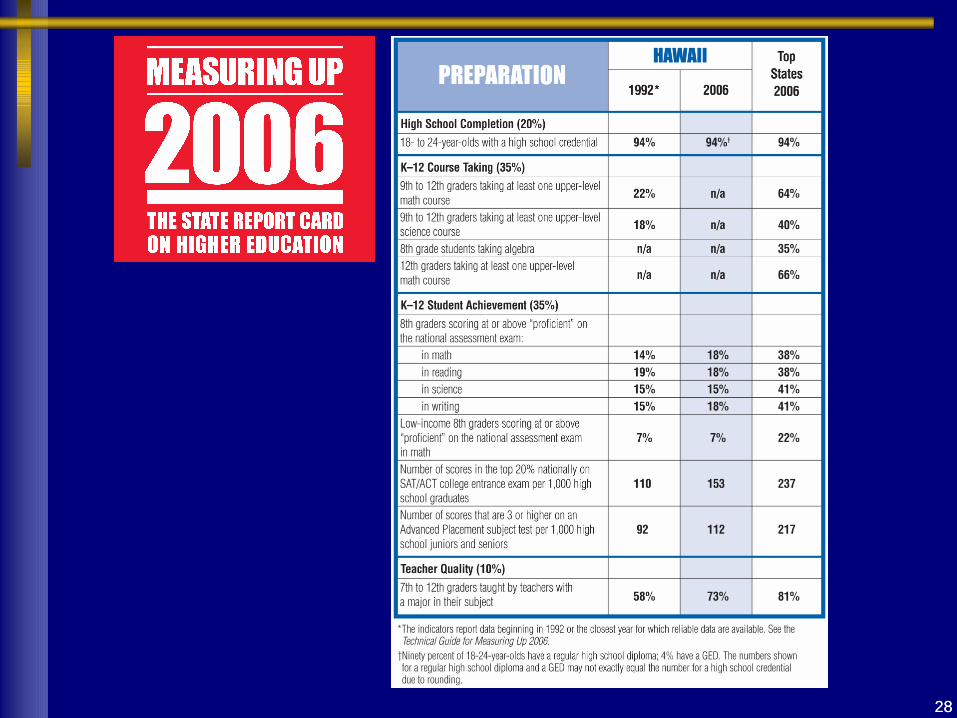
High School Graduation Rates—Public High School Graduates as a Percent of 9th Graders Four Years Earlier, 2004
64.9
69.7
50.7
91.3
0
20
40
60
80
100
New
JerseyUtah
North D
akotaIow
aN
ebraskaM
innesotaVerm
ontSouth D
akotaIdahoM
ontanaPennsylvaniaW
isconsinM
aineM
issouriKansas
Ohio
Connecticut
New
Ham
pshireIllinoisArkansas
Wyom
ingM
assachusettsO
klahoma
Maryland
Colorado
Virgin
iaW
est Virginia
Oregon
Rhode Island
California
Washington
IndianaUnited S
tatesM
ichiganLouisianaTexasD
elaware
Haw
aiiKentucky
Arizona
North C
arolinaTennesseeAlaska
New
YorkNew
Mexico
Alabam
aM
ississippiFloridaG
eorgiaSouth C
arolinaNevada
Source: Tom Mortenson, Postsecondary Opportunity (rev. 071106)
2828
29
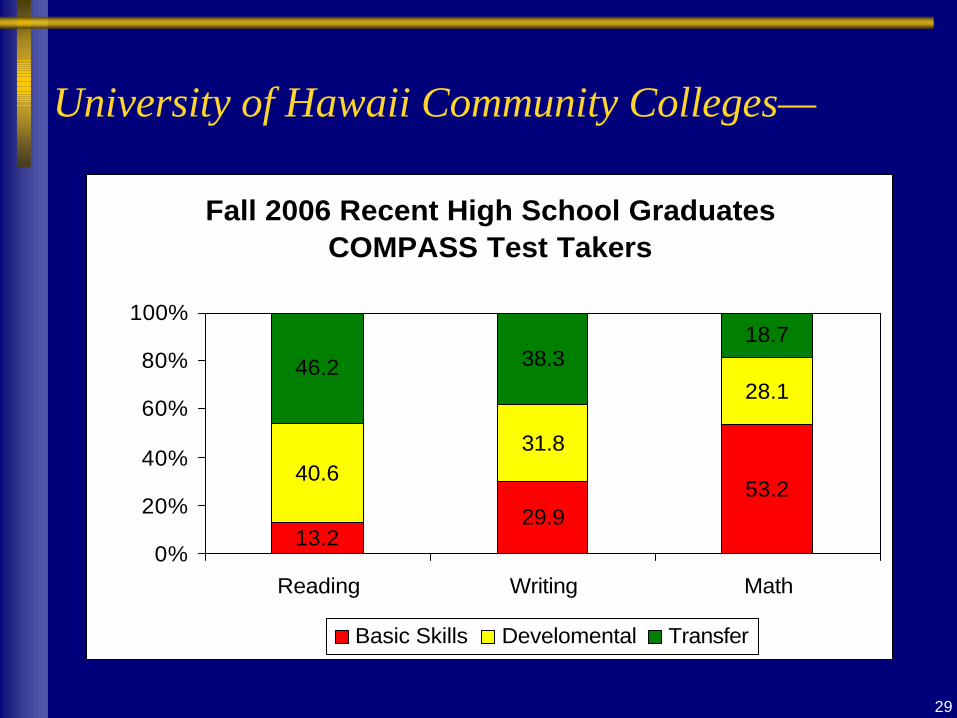
Fall 2006 Recent High School Graduates COMPASS Test Takers
13.229.9
53.240.6
31.8
28.146.2 38.3
18.7
0%
20%
40%
60%
80%
100%
Reading Writing Math
Basic Skills Develomental Transfer
University of Hawaii Community Colleges—
30
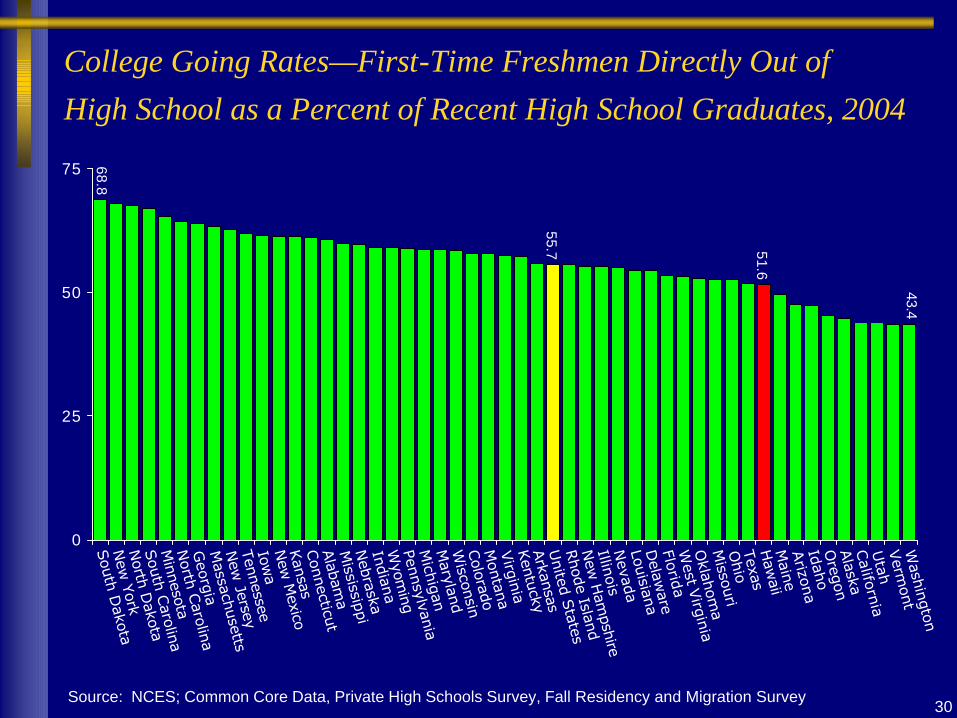
College Going Rates—First-Time Freshmen Directly Out of High School as a Percent of Recent High School Graduates, 2004
55.7 51.6
43.4
68.8
0
25
50
75
South D
akotaNew
YorkNorth D
akotaSouth C
arolinaM
innesotaN
orth Carolina
Georgia
Massachusetts
New
JerseyTennesseeIow
aNew
Mexico
Kansas
Connecticut
Alabam
aM
ississippiNebraska
IndianaW
yoming
PennsylvaniaM
ichiganM
arylandW
isconsinColorado
Montana
Virginia
Kentucky
Arkansas
United S
tatesRhode Island
New
Ham
pshireIllinoisN
evadaLouisianaD
elaware
FloridaW
est Virginia
Oklahom
aM
issouriO
hioTexasHaw
aiiM
aineArizona
IdahoO
regonAlaska
Californ
iaUtah
Verm
ontW
ashington
Source: NCES; Common Core Data, Private High Schools Survey, Fall Residency and Migration Survey
31
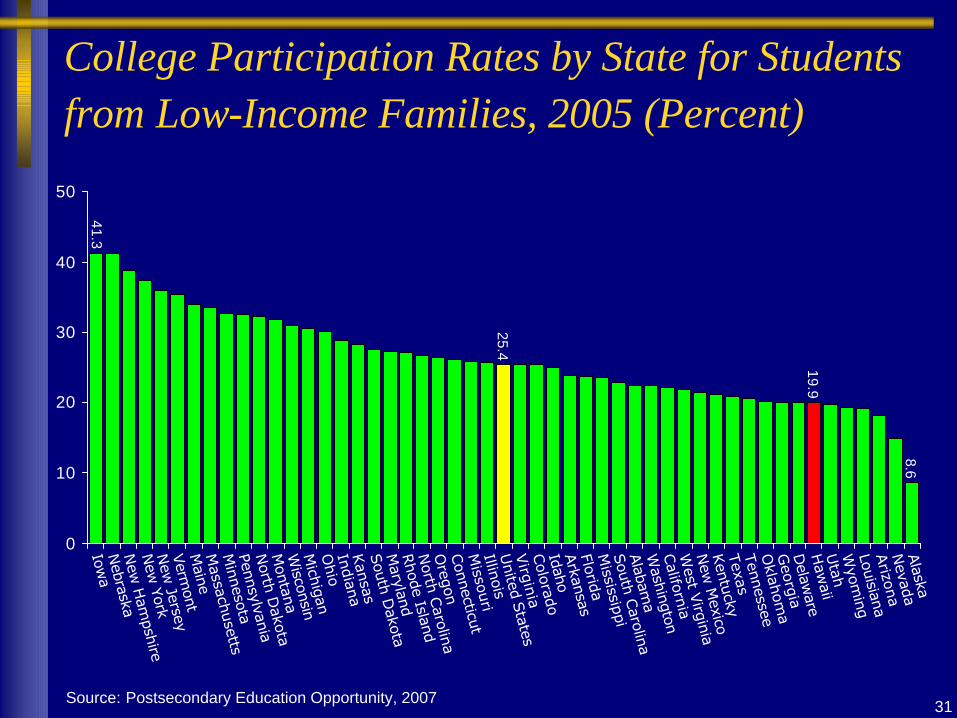
College Participation Rates by State for Students from Low-Income Families, 2005 (Percent)
19.9
25.4
41.3
8.6
0
10
20
30
40
50
Iowa
Nebraska
New
Ham
pshireNew
YorkNew
JerseyVerm
ontM
aineM
assachusettsM
innesotaPennsylvaniaN
orth Dakota
Montana
Wisconsin
Michigan
Ohio
IndianaKansas
South D
akotaM
arylandRhode Island
North C
arolinaO
regonConnecticut
Missouri
IllinoisUnited S
tatesVirgin
iaColorado
IdahoArkansas
FloridaM
ississippiSouth C
arolinaAlabam
aW
ashingtonCalifornia
West V
irginiaNew
Mexico
Kentucky
TexasTennesseeO
klahoma
Georgia
Delaw
areH
awaii
Utah
Wyom
ingLouisianaArizona
Nevada
Alaska
Source: Postsecondary Education Opportunity, 2007

32
Percent of First-Time Freshmen Who Attend College Within Their Reported State of Residence, Fall 2002
84.7
69.6
46.8
94.0
0
25
50
75
100
Mississippi
Utah
Californ
iaN
orth Carolina
TexasLouisianaArizona
Michigan
Alabam
aFloridaO
klahoma
South C
arolinaIow
aKentucky
IndianaArkansas
Kansas
Georgia
Ohio
PennsylvaniaW
isconsinUnited S
tatesM
issouriNebraska
West V
irginiaColorado
TennesseeNew
YorkM
innesotaO
regonNevada
IllinoisNew
Mexico
Washington
Virgin
iaIdahoSouth D
akotaM
ontanaD
elaware
Massachusetts
North D
akotaW
yoming
Haw
aiiM
arylandRhode Island
Maine
New
JerseyConnecticut
Alaska
New
Ham
pshireVerm
ont
Source: NCES, IPEDS Fall 2002 Residency and Migration File
33
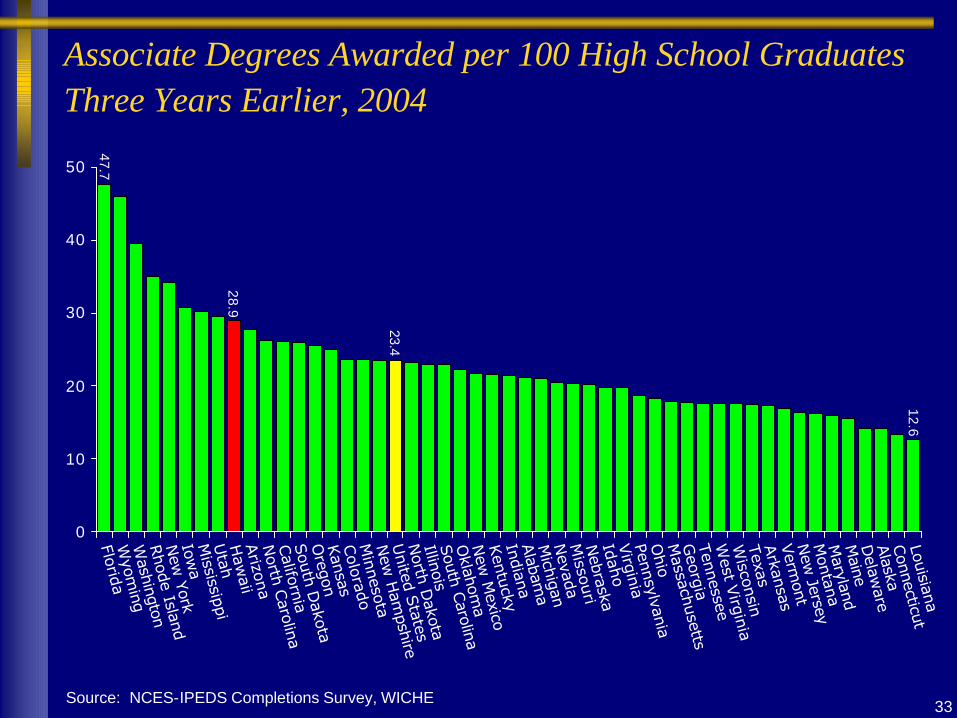
Associate Degrees Awarded per 100 High School Graduates Three Years Earlier, 2004
28.9
23.4
12.6
47.7
0
10
20
30
40
50
FloridaW
yoming
Washington
Rhode Island
New
YorkIow
aM
ississippiUtah
Haw
aiiArizona
North C
arolinaCalifornia
South D
akotaO
regonKansas
Colorado
Minnesota
New
Ham
pshireUnited S
tatesNorth D
akotaIllinoisSouth C
arolinaO
klahoma
New
Mexico
Kentucky
IndianaAlabam
aM
ichiganNevada
Missouri
Nebraska
IdahoVirginia
PennsylvaniaO
hioM
assachusettsG
eorgiaTennesseeW
est Virginia
Wisconsin
TexasArkansas
Verm
ontNew
JerseyM
ontanaM
arylandM
aineD
elaware
Alaska
Connecticut
Louisiana
Source: NCES-IPEDS Completions Survey, WICHE
34
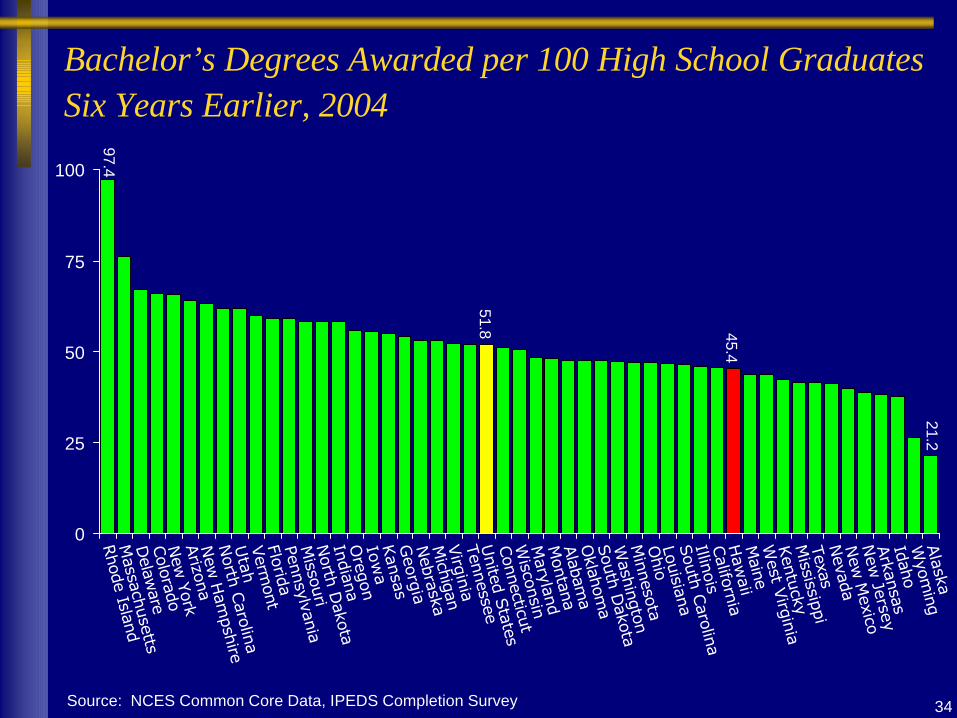
Bachelor’s Degrees Awarded per 100 High School Graduates Six Years Earlier, 2004
45.4
51.8
97.4
21.2
0
25
50
75
100
Rhode Island
Massachusetts
Delaw
areColorado
New
YorkArizona
New
Ham
pshireNorth C
arolinaU
tahVerm
ontFloridaPennsylvaniaM
issouriNorth D
akotaIndianaO
regonIow
aKansas
Georgia
Nebraska
Michigan
Virginia
TennesseeUnited S
tatesConnecticut
Wisconsin
Maryland
Montana
Alabam
aO
klahoma
South D
akotaW
ashingtonM
innesotaO
hioLouisianaSouth C
arolinaIllinoisCalifornia
Haw
aiiM
aineW
est Virginia
Kentucky
Mississippi
TexasNevada
New
Mexico
New
JerseyArkansas
IdahoW
yoming
Alaska
Source: NCES Common Core Data, IPEDS Completion Survey
35
Workplace Development—What Can Be Expected of the Higher Education System?
¦ R&D that Leads to Expanded High-Wage Employment> At the University
> In Spin-Off Companies
¦ Entrepreneurial Training—and the Modeling of Entrepreneurial Behaviors
¦ Rapid Response Training for Employers Seeking to Fill Living-Wage Jobs
36
The Bottom Line
¦ Enhance the State’s Stock of Human Capital
> Improved Competencies of High School Graduates
> Increased Skills of Adults with Less than a High School Education
> Improve Participation and Graduation Rates of College Students
(continued)
37
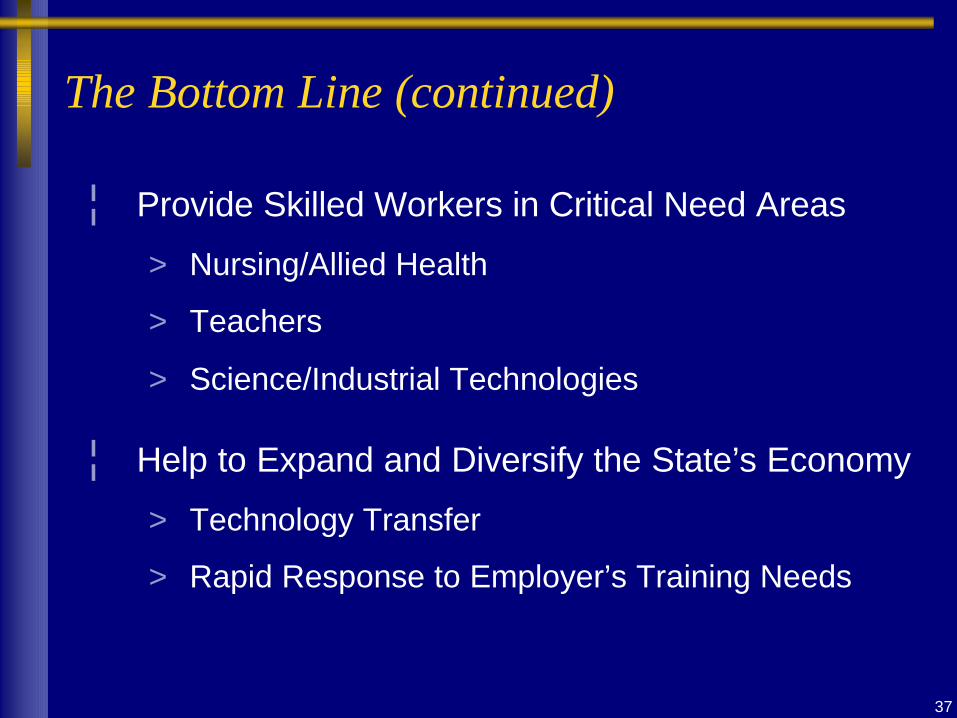
The Bottom Line (continued)
¦ Provide Skilled Workers in Critical Need Areas
> Nursing/Allied Health
> Teachers
> Science/Industrial Technologies
¦ Help to Expand and Diversify the State’s Economy
> Technology Transfer
> Rapid Response to Employer’s Training Needs
38
Address These Issues
as Appropriate in
All Parts of the State
39
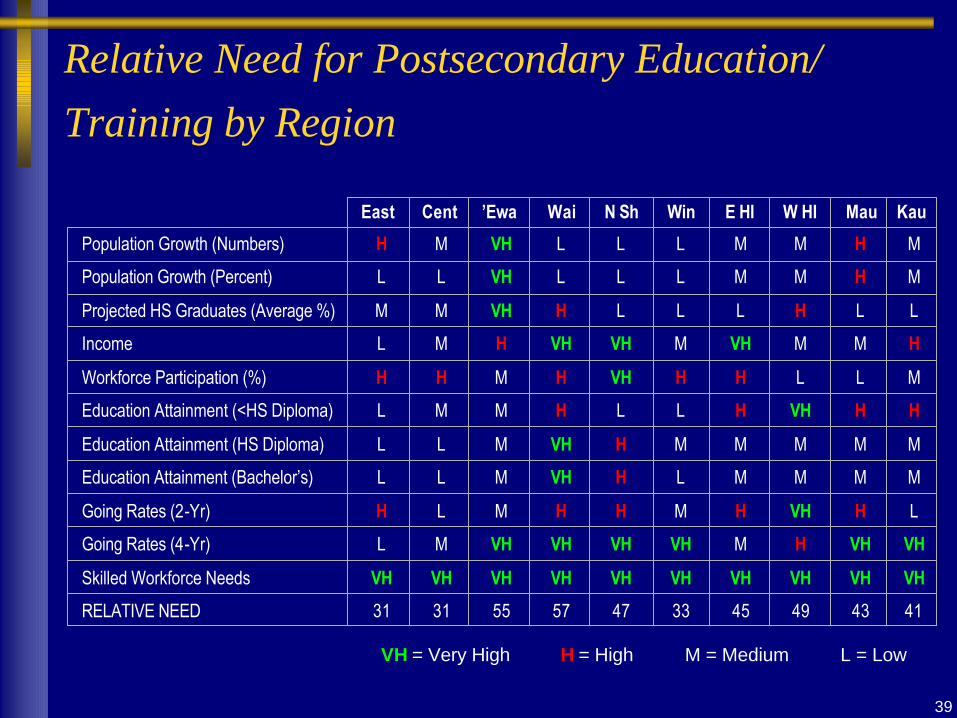
Relative Need for Postsecondary Education/Training by Region
VH = Very High H = High M = Medium L = Low
Population Growth (Numbers) H M VH L L L M M H M
Population Growth (Percent) L L VH L L L M M H M
Projected HS Graduates (Average %) M M VH H L L L H L L
Income L M H VH VH M VH M M H
Workforce Participation (%) H H M H VH H H L L M
Education Attainment (<HS Diploma) L M M H L L H VH H H
Education Attainment (HS Diploma) L L M VH H M M M M M
Education Attainment (Bachelor’s) L L M VH H L M M M M
Going Rates (2-Yr) H L M H H M H VH H L
Going Rates (4-Yr) L M VH VH VH VH M H VH VH
Skilled Workforce Needs VH VH VH VH VH VH VH VH VH VH
RELATIVE NEED 31 31 55 57 47 33 45 49 43 41
East Cent ’Ewa Wai N Sh Win E HI W HI Mau Kau

40
Key Short-Term Initiatives
¦ Better Align K-12 Learning Outcomes and Assessment with Higher Education Expectations—Ensure Students Leave High School Prepared for Further Education and for Work
¦ Significantly Increase Numbers of Adults Acquiring Workplace Literacy Skills
¦ Provide Higher Education Access in Areas of Greatest Need
> Waianae
> ’Ewa
¦ Improve Student Retention
(continued)
41
Key Short-Term Initiatives (continued)
¦ Expand Degree Production in Key Areas
> Nursing/Health Sciences
> Teacher Education
> Computer Science (Oriented to Engineering Applications)
> Science/Industrial Technologies
¦ Create and Sustain a Rapid Response Capability
¦ Enhance Educational Programs and Support Systems for Entrepreneurs
¦ Promote Technology Transfer
42
The Policy Environment
¦ Formally Adopt a Set of Goals that Is Agreed to by Executive and Legislative Branches and UHS—a Compact
¦ Develop an Agreed-Upon Set of Accountability Measures by Which Progress Toward Goal Achievement Can Be Monitored
Create a Policy Environment that Encourages Pursuit of These
Initiatives—Realizing that the Policy Environment You Have
Yields the Results You’re Getting.
(continued)
43
The Policy Environment (continued)
¦ Create New Funding Relationship Between the State and UHS
> Eliminate Line Items (focus on What to do, not How to do)
> Calibrate Funding Against External Benchmarks
> Align Investment Funds Explicitly with Items Identified in the “Compact”
¦ Conduct a More Detailed “Policy Audit” to Identify Policies/Procedures that Create Barriers to Pursuit of the Agreed-Upon Public Agenda
44
An Action Agenda
¦ Join with Legislature and UHS in Developing and Ratifying a Compact and Associated Accountability Measures
¦ Promulgate the List of Priorities to All Appropriate Executive Branch Agencies—Use the Bully Pulpit
¦ Support K-20 Initiatives Focused on Alignment
¦ Establish a Policy Leadership Focus for Adult/Workplace LiteracyEducation
¦ Submit a Higher Education Budget Aligned with Priorities
Accomplishment of the Objectives Identified Will Require Action on the Part of All Parties.
(continued)
Executive Branch

45
An Action Agenda (continued)
¦ Join with Executive Branch and UHS in Developing and Ratifying a Compact and Associated Accountability Measures
¦ Develop a New Approach to Allocation of Resources to UHS> Allocation Based on Core Funding and Investment in
Priorities> Autonomy with Accountability
¦ Establish Expectations Concerning Delivery of:> Long-Range Financing Plan for Higher Education> A Policy Audit
(continued)
Legislative Branch
46
An Action Agenda (continued)
¦ Join with Executive and Legislative Branches in Developing and Ratifying a Compact and Associated Accountability Measures
¦ Pursue the Priority Items Identified
¦ Take the Leadership in Proposing a Long-Range Financing Plan for Higher Education for Submission to Executive and Legislative Branches
¦ Take the Leadership in Conducting a Policy Audit
(continued)
UHS
47
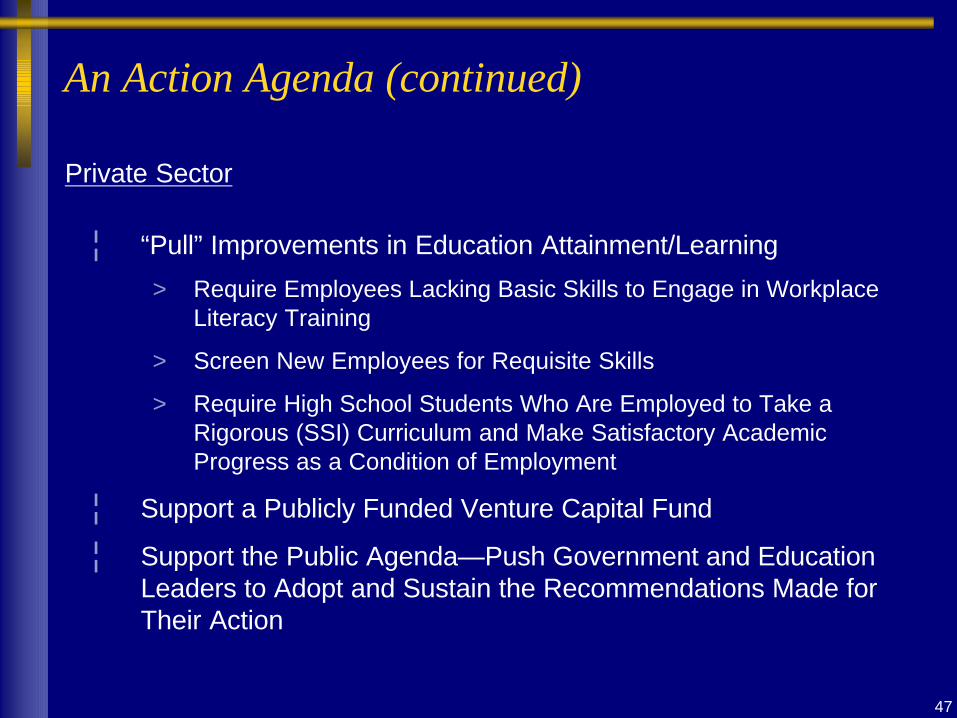
An Action Agenda (continued)
¦ “Pull” Improvements in Education Attainment/Learning
> Require Employees Lacking Basic Skills to Engage in Workplace Literacy Training
> Screen New Employees for Requisite Skills
> Require High School Students Who Are Employed to Take a Rigorous (SSI) Curriculum and Make Satisfactory Academic Progress as a Condition of Employment
¦ Support a Publicly Funded Venture Capital Fund
¦ Support the Public Agenda—Push Government and Education Leaders to Adopt and Sustain the Recommendations Made for Their Action
Private Sector
48
NATIONAL CONFERENCE OF
STATE LEGISLATURES
A Framework for Higher Education Reform
Recommendations of the NCSL Blue Ribbon Commission on Higher Education
49
Legislator Roles and Responsibilities
¦ Budgets and Appropriations
¦ Goals and Expectations for Higher Education
¦ Higher Education as a Legislative Priority
¦ Legislative Leadership
50
Recommendations
¦ Define Clear State Goals—A Public Agenda for Higher Education
¦ Identify Your State Strengths and Weaknesses
¦ Know Your Demographic Trends for Next 10-30 Years
¦ Identify a Place to Sustain the Public Agenda
¦ Hold Institutions Accountable
(continued)
51
Recommendations (continued)
¦ Rethink Funding> Link Appropriations, Tuition and Financial Aid Policy> Be Results/Performance Oriented in Funding> Focus on Productivity
¦ Recommit to Affordability> Help Reduce Borrowing and Debt> Rethink Student Aid
¦ Recommit to Access
¦ Recommit to Success(continued)
52
Recommendations (continued)
¦ Don’t Forget About Adult Learners
¦ Embrace Innovation
¦ Transform the 12th Grade
¦ Build Partnerships with K-12
¦ Build Partnerships with Business
Related Documents


