Higher Defluxing Temperature and Low Standoff Component Cleaning - A Connection? Jigar Patel and Umut Tosun ZESTRON Americas Manassas, VA Originally published in the proceedings of IPC Apex Expo, San Diego, CA, January 29 – 31 2019. Abstract OEMs and CMs designing and building electronic assemblies for high reliability applications are typically faced with a decision to clean or not to clean the assembly. If ionic residues remain on the substrate surface, potential failure mechanisms, including dendritic growth by electrochemical migration reaction and leakage current, may result. These failures have been well documented. If a decision to clean substrates is made, there are numerous cleaning process options available. For defluxing applications, the most common systems are spray-in-air, employing either batch or inline cleaning equipment and an engineered aqueous based cleaning agent. Regardless of the type of cleaning process adopted, effective cleaning of post solder residue requires chemical, thermal and mechanical energies. The chemical energy is derived from the engineered cleaning agent; the thermal energy from the increased temperature of the cleaning agent, and the mechanical energy from the pump system employed within the cleaning equipment. The pump system, which includes spray pressure, spray bar configuration and nozzle selection, is optimized for the specific process to create an efficient cleaning system. As board density has increased and component standoff heights have decreased, cleaning processes are steadily challenged. Over time, cleaning agent formulations have advanced to match new solder paste developments, spray system configurations have improved, and wash temperatures (thermal energy) have been limited to a maximum of 160ºF. In most cases, this is due to thermal limitations of the materials used to build the polymer-based cleaning equipment. Building equipment out of stainless steel is an option, but one that may be cost prohibitive. Given the maximum allowable wash temperature, difficult cleaning applications are met by increasing the wash exposure time; including reducing the conveyor speed of inline cleaners or extending wash time in batch cleaners. Although this yields effective cleaning results, process productivity may be compromised. However, high temperature resistant polymer materials, capable of withstanding a 180°F wash temperature, are now available and can be used in cleaning equipment builds. For this study, the authors explored the potential for increasing cleaning process efficiency as a result of an increase in thermal energy due to the use of higher wash temperature. The cleaning equipment selected was an inline cleaner built with high temperature resistant polymer material. For the analysis, standard substrates were used. These were populated with numerous low standoff chip cap components and soldered with both no-clean tin-lead and lead-free solder pastes. Two aqueous based cleaning agents were selected, and multiple wash temperatures and wash exposure times were evaluated. Cleanliness assessments were made through visual analysis of under-component inspection, as well as localized extraction and Ion Chromatography in accordance with current IPC standards. Keywords Aqueous based cleaning process, PCB defluxing, wash system cleaning parameters, thermal energy, chemical energy, mechanical energy. Introduction For many OEMs and CMs defluxing electronic assemblies that are designed for high reliability applications is not uncommon regardless of the solder paste used. Once the decision is made to implement a cleaning process, there are numerous other decisions that need to be made. For example, the type of cleaning system (spray-in-air, ultrasonic, or vapor degreasing) and the cleaning media selection (solvent, aqueous, or semi-aqueous) to name a few. The electronic assembly design variations, average throughput, and production cycle will guide many of the decisions for the required manufacturing process.

Welcome message from author
This document is posted to help you gain knowledge. Please leave a comment to let me know what you think about it! Share it to your friends and learn new things together.
Transcript

Higher Defluxing Temperature and Low Standoff Component Cleaning -
A Connection?
Jigar Patel and Umut Tosun
ZESTRON Americas
Manassas, VA
Originally published in the proceedings of IPC Apex Expo, San Diego, CA, January 29 – 31 2019.
Abstract
OEMs and CMs designing and building electronic assemblies for high reliability applications are typically faced with a
decision to clean or not to clean the assembly. If ionic residues remain on the substrate surface, potential failure mechanisms,
including dendritic growth by electrochemical migration reaction and leakage current, may result. These failures have been
well documented.
If a decision to clean substrates is made, there are numerous cleaning process options available. For defluxing applications,
the most common systems are spray-in-air, employing either batch or inline cleaning equipment and an engineered aqueous
based cleaning agent.
Regardless of the type of cleaning process adopted, effective cleaning of post solder residue requires chemical, thermal and
mechanical energies. The chemical energy is derived from the engineered cleaning agent; the thermal energy from the
increased temperature of the cleaning agent, and the mechanical energy from the pump system employed within the cleaning
equipment. The pump system, which includes spray pressure, spray bar configuration and nozzle selection, is optimized for
the specific process to create an efficient cleaning system.
As board density has increased and component standoff heights have decreased, cleaning processes are steadily challenged.
Over time, cleaning agent formulations have advanced to match new solder paste developments, spray system configurations
have improved, and wash temperatures (thermal energy) have been limited to a maximum of 160ºF. In most cases, this is due
to thermal limitations of the materials used to build the polymer-based cleaning equipment. Building equipment out of
stainless steel is an option, but one that may be cost prohibitive.
Given the maximum allowable wash temperature, difficult cleaning applications are met by increasing the wash exposure
time; including reducing the conveyor speed of inline cleaners or extending wash time in batch cleaners. Although this yields
effective cleaning results, process productivity may be compromised.
However, high temperature resistant polymer materials, capable of withstanding a 180°F wash temperature, are now available
and can be used in cleaning equipment builds. For this study, the authors explored the potential for increasing cleaning
process efficiency as a result of an increase in thermal energy due to the use of higher wash temperature. The cleaning
equipment selected was an inline cleaner built with high temperature resistant polymer material.
For the analysis, standard substrates were used. These were populated with numerous low standoff chip cap components and
soldered with both no-clean tin-lead and lead-free solder pastes. Two aqueous based cleaning agents were selected, and
multiple wash temperatures and wash exposure times were evaluated.
Cleanliness assessments were made through visual analysis of under-component inspection, as well as localized extraction
and Ion Chromatography in accordance with current IPC standards.
Keywords
Aqueous based cleaning process, PCB defluxing, wash system cleaning parameters, thermal energy, chemical energy,
mechanical energy.
Introduction
For many OEMs and CMs defluxing electronic assemblies that are designed for high reliability applications is not uncommon
regardless of the solder paste used. Once the decision is made to implement a cleaning process, there are numerous other
decisions that need to be made. For example, the type of cleaning system (spray-in-air, ultrasonic, or vapor degreasing) and
the cleaning media selection (solvent, aqueous, or semi-aqueous) to name a few. The electronic assembly design variations,
average throughput, and production cycle will guide many of the decisions for the required manufacturing process.

The effectiveness of any cleaning process requires a balance of the three energy sources; mechanical, chemical, and thermal.
Mechanical energy is defined by the ability of the cleaning equipment to effectively impinge the cleaning solution onto the
surface of the substrate and underneath the components. Chemical energy is the ability of the cleaning agent to solubilize the
residue so that they can be rinsed away, and thermal energy, or the temperature of the cleaning agent required to effectively
soften the residue.
One widely used cleaning process in the electronics industry is the spray-in-air system. The spray-in-air system is available
as either a batch cleaner or as conveyorized inline equipment, and offers the ability to optimize mechanical, chemical and
thermal energy requirements for an effective cleaning process. With either machine type, the cleaning agent is pumped
through a series of spray nozzles creating the impingement force or the mechanical energy required to effectively disperse the
cleaning agent onto the electronic assembly.
Chemical energy is derived from the cleaning agent. By design, the cleaning agents used have a significantly lower surface
tension as compared with water. Combined with the mechanical energy of the system, the cleaning agent is able to penetrate
underneath low standoff components. Provided that the selected cleaning agent is matched to the residues, it is then able to
solubilize and remove the residues during the wash and rinse cycles [1].
For spray-in-air systems, cleaning agents are diluted with DI-water to a working concentration typically varying from 5% to
20%. Thermal energy is derived from the temperature of the diluted wash solution used within the wash process. The selected
temperature of the wash solution is limited by the materials used to construct the cleaning equipment. In general, spray-in-air
cleaning systems are constructed using either polypropylene (PP) plastics or stainless steel (SS). For inline cleaning
equipment, PP is generally used as it is significantly less expensive and therefore market competitive. For batch equipment,
both SS and PP options are available. The generally accepted industry temperature limitations for PP and SS equipment are
160°F and 180°F respectively. Regardless of the machine type selected, in practice the specified wash temperatures will
range between 130°F to 155°F.
Under-component cleanliness has become the standard when evaluating the effectiveness of any cleaning process. There have
been numerous cleaning studies published on cleaning effectiveness demonstrating the relationship between wash solution
temperature, concentration, and wash exposure time regardless of the machine type used. In general, wash exposure time and
wash solution temperature have been proven to be the most critical factors that affect PCB cleanliness results [2].
Today, new plastic material options are available including PP that can withstand working temperatures up to 180°F. Given
this option, the authors wanted to investigate and compare the potential cleanliness benefit of operating a spray-in-air inline
cleaning system at a process operating temperature of 180°F to the current industry standards. The authors were investigating
whether by operating the cleaning process at 180°F wash temperature it could reduce the wash time and meet or exceed
cleanliness levels achieved at the reduced wash temperatures. If this proves to be the case, cleaning process efficiency and
productivity can be improved without additional capital expenditure, and this can be a significant benefit to the electronics
manufacturer.
As the wash temperature increases so does the evaporative loss. As a result, additional cleaning agent solution is required
within the wash tank in order to maintain the desired wash solution concentration level. Potentially, this increases the cost of
the cleaning process. Vapor recovery devices are available that can be installed within the exhaust system that will reduce the
evaporative losses and thereby offset the increased cleaning agent use. In general, this is not cost effective for batch systems,
but it can be for inline cleaning systems. The cost benefit of increased wash solution temperature versus vapor recovery was
not considered within the scope of this study.
For this study, standard substrates and inline cleaners were used. These were populated with numerous low standoff chip cap
components and soldered with both no-clean tin-lead and lead-free solder pastes. Two aqueous based cleaning agents were
selected, multiple wash temperatures and wash exposure times were evaluated.
Cleanliness assessments were made through visual analysis of under-component inspection, as well as localized extraction
and Ion Chromatography in accordance with current IPC standards. Cleanliness results were analyzed using Main Effects
plots and Factor Analysis of Mixed Data (FAMD).
It is important to note that this study was conducted as a comparative analysis to understand the impact of the two selected
variables (wash temperature and conveyor speed) on test vehicle cleanliness assessment. All other cleaning process
parameters were maintained constant and no attempt was made to optimize the cleaning process.
Methodology
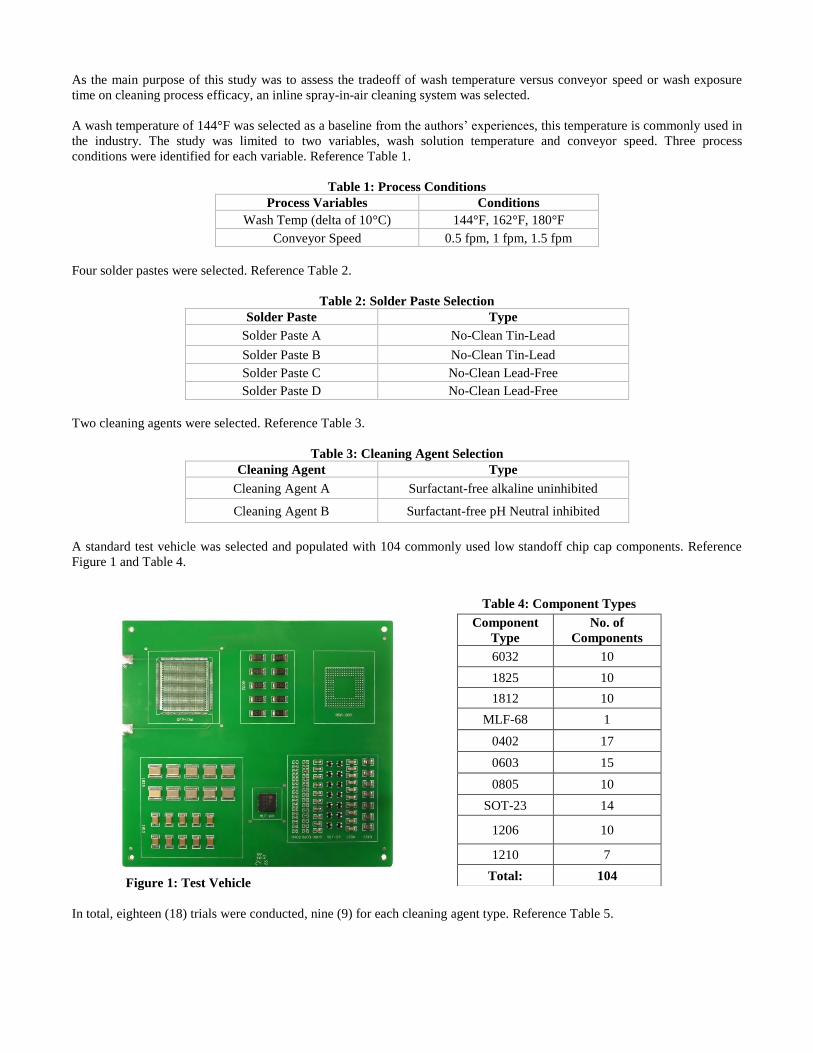
As the main purpose of this study was to assess the tradeoff of wash temperature versus conveyor speed or wash exposure
time on cleaning process efficacy, an inline spray-in-air cleaning system was selected.
A wash temperature of 144°F was selected as a baseline from the authors’ experiences, this temperature is commonly used in
the industry. The study was limited to two variables, wash solution temperature and conveyor speed. Three process
conditions were identified for each variable. Reference Table 1.
Table 1: Process Conditions
Process Variables Conditions
Wash Temp (delta of 10°C) 144°F, 162°F, 180°F
Conveyor Speed 0.5 fpm, 1 fpm, 1.5 fpm
Four solder pastes were selected. Reference Table 2.
Table 2: Solder Paste Selection
Solder Paste Type
Solder Paste A No-Clean Tin-Lead
Solder Paste B No-Clean Tin-Lead
Solder Paste C No-Clean Lead-Free
Solder Paste D No-Clean Lead-Free
Two cleaning agents were selected. Reference Table 3.
Table 3: Cleaning Agent Selection
Cleaning Agent Type
Cleaning Agent A Surfactant-free alkaline uninhibited
Cleaning Agent B Surfactant-free pH Neutral inhibited
A standard test vehicle was selected and populated with 104 commonly used low standoff chip cap components. Reference
Figure 1 and Table 4.
Figure 1: Test Vehicle
In total, eighteen (18) trials were conducted, nine (9) for each cleaning agent type. Reference Table 5.
Table 4: Component Types
Component
Type
No. of
Components
6032 10
1825 10
1812 10
MLF-68 1
0402 17
0603 15
0805 10
SOT-23 14
1206 10
1210 7
Total: 104

Table 5
Trial No: Cleaning Agent Wash Temp
(°F)
Conveyor Speed
(fpm)
1 A 144 0.5
2 A 144 1
3 A 144 1.5
4 A 162 0.5
5 A 162 1
6 A 162 1.5
7 A 180 0.5
8 A 180 1
9 A 180 1.5
10 B 144 0.5
11 B 144 1
12 B 144 1.5
13 B 162 0.5
14 B 162 1
15 B 162 1.5
16 B 180 0.5
17 B 180 1
18 B 180 1.5
For each trial, four (4) test vehicles were prepared, one for each paste type. In total, 72 test vehicles were required. Each was
reflowed, cleaned and inspected for cleanliness on both surfaces as well as underneath the component.
Standard Tin-Lead and Lead-Free reflow profiles were used. Reference Figures 2 and 3.
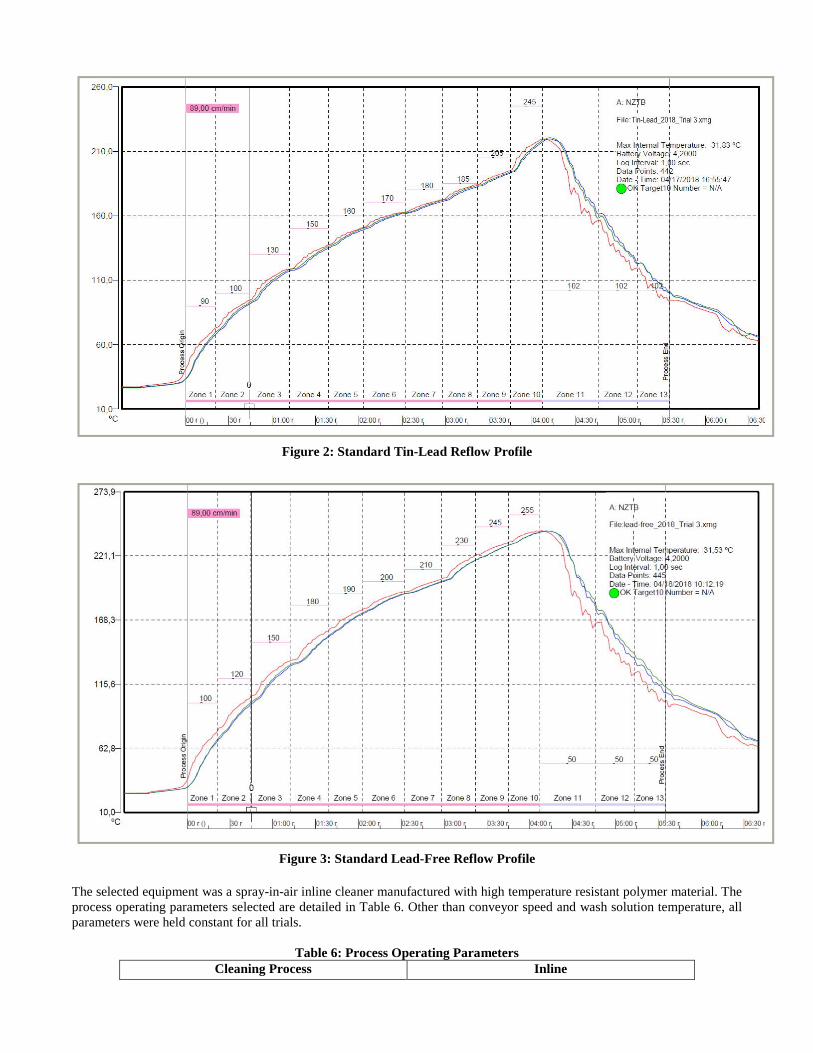
Figure 2: Standard Tin-Lead Reflow Profile
Figure 3: Standard Lead-Free Reflow Profile
The selected equipment was a spray-in-air inline cleaner manufactured with high temperature resistant polymer material. The
process operating parameters selected are detailed in Table 6. Other than conveyor speed and wash solution temperature, all
parameters were held constant for all trials.
Table 6: Process Operating Parameters
Cleaning Process Inline

Equipment Inline Spray-in-air
Concentration 15%
Conveyor Speed 1.5 fpm, 1 fpm, 0.5 fpm
Pre-Wash Pressure (Top/Bottom) 50 PSI / 30 PSI
Wash Pressure (Top/Bottom) 80 PSI / 60 PSI
Wash solution Temperature 144°F, 162°F, 180°F
Chemical Isolation Pressure (Top/Bottom) 25 PSI / 25 PSI
Rinse
Rinsing Agent DI-water
Rinse Pressure (Top/Bottom) 80 PSI / 60 PSI
Rinsing Temperature 150°F
Final Rinse Pressure (Top/Bottom) 30 PSI / 30 PSI
Final Rinse Temperature Room Temperature
Drying
Drying Method Hot Circulated Air
Drying Temperature (D1) 180°F
Drying Temperature (D2) 210°F
Drying Temperature (D3) 210°F
Results
Once cleaned, all boards were inspected for surface cleanliness. Other than the MLF/BTC components, surfaces around all
other components were found to be fully cleaned for all trials. Reference Figures 4 and 5 for representative pictures of
component surface cleanliness.
Figure 4: Component 0603 – Before Cleaning Figure 5: Component 0603 – After Cleaning
The MLF/BTC component surface was found to be fully cleaned, regardless of solder paste used, in eight of the eighteen
trials. For the other trials, partial residues were visible around the surface of the MLF/BTC component. Reference Table 7:
Table 7: MLF/BTC Surface Fully Cleaned Trial Numbers
Trial No # Cleaning
Agent
Wash Temp
(°F)
Conveyor Speed
(fpm)
3 A 144 0.5
5 A 162 1
6 A 162 0.5
7 A 180 0.5
8 A 180 1
9 A 180 1.5
15 B 162 0.5
18 B 180 0.5
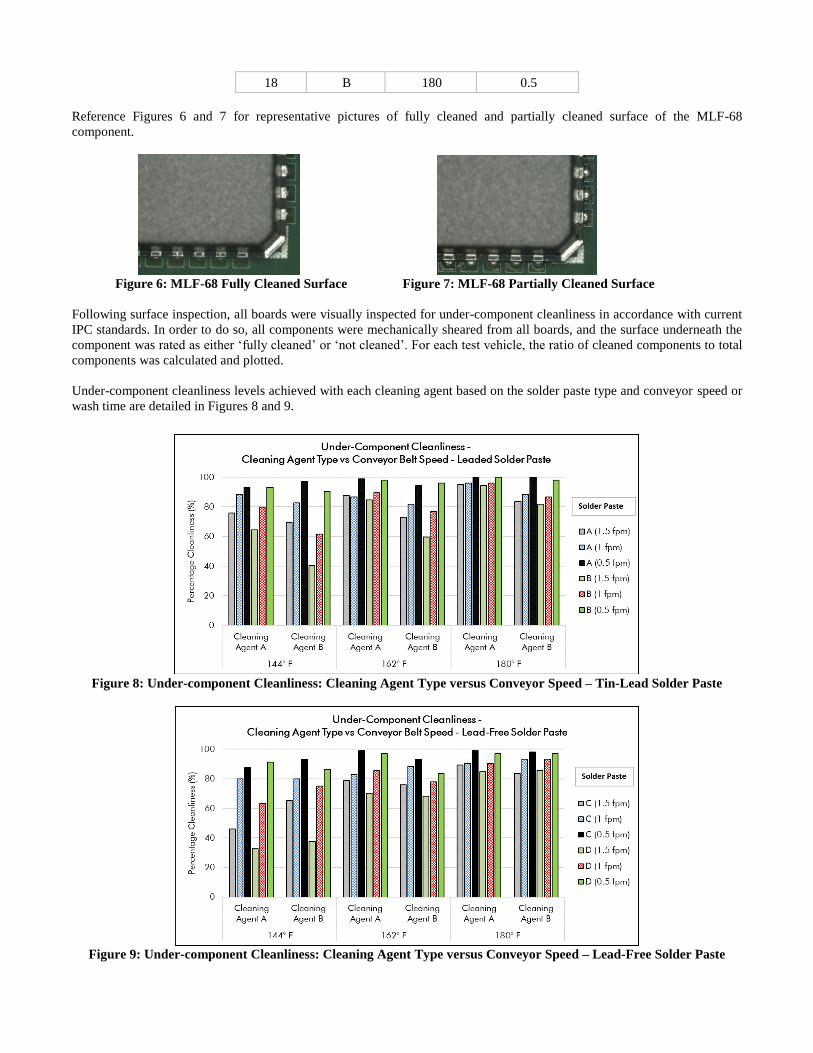
Reference Figures 6 and 7 for representative pictures of fully cleaned and partially cleaned surface of the MLF-68
component.
Figure 6: MLF-68 Fully Cleaned Surface Figure 7: MLF-68 Partially Cleaned Surface
Following surface inspection, all boards were visually inspected for under-component cleanliness in accordance with current
IPC standards. In order to do so, all components were mechanically sheared from all boards, and the surface underneath the
component was rated as either ‘fully cleaned’ or ‘not cleaned’. For each test vehicle, the ratio of cleaned components to total
components was calculated and plotted.
Under-component cleanliness levels achieved with each cleaning agent based on the solder paste type and conveyor speed or
wash time are detailed in Figures 8 and 9.
Figure 8: Under-component Cleanliness: Cleaning Agent Type versus Conveyor Speed – Tin-Lead Solder Paste
Figure 9: Under-component Cleanliness: Cleaning Agent Type versus Conveyor Speed – Lead-Free Solder Paste

The impact of conveyor speed and wash temperature on under-component cleanliness results for all solder pastes are detailed
in Figures 10 and 11 respectively.
Figure 10: Under-component Cleanliness: Solder Paste Type versus Conveyor Speed
Figure 11: Under-component Cleanliness: Solder Paste Type versus Wash Temperature
Reference Figures 12 and 13 for representative pictures of fully cleaned and partially cleaned under-component surface.
Figure 12: Component 1825 – Fully Cleaned Figure 13: Component 1825 – Partially Cleaned

Main Effects graph was developed to examine the relationship between all variables considered for under-component
cleanliness level achieved. Reference Figure 14.
Figure 14: Under-component Cleanliness versus Process Variables
Additionally, individual graphs were developed examining the relationship between each solder paste type and conveyor
speed and wash temperature. Reference Figures 15 – 18.
Figure 15: Under-component Cleanliness Level: Solder Paste A – Conveyor Speed versus Wash Temp
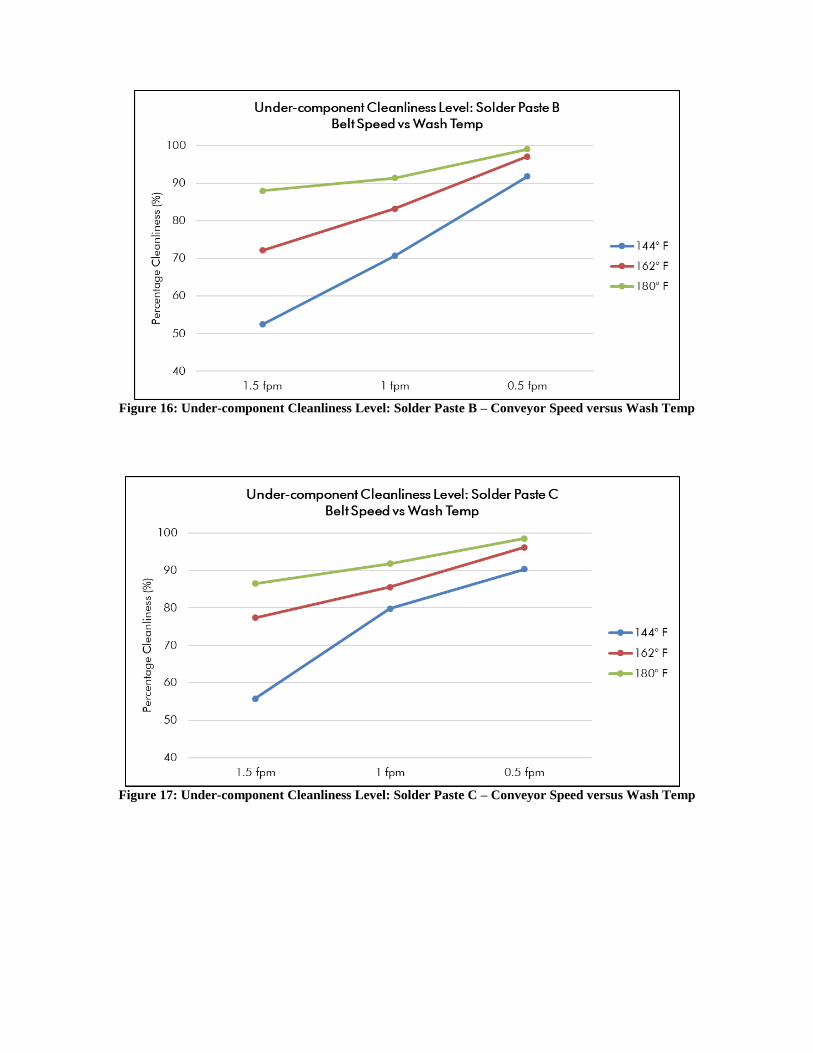
Figure 16: Under-component Cleanliness Level: Solder Paste B – Conveyor Speed versus Wash Temp
Figure 17: Under-component Cleanliness Level: Solder Paste C – Conveyor Speed versus Wash Temp

Figure 18: Under-component Cleanliness Level: Solder Paste D – Conveyor Speed versus Wash Temp
Finally, a summary graph was developed detailing the average cleanliness level achieved for all solder pastes versus
conveyor speed and wash temperature. Reference Figure 19.
Figure 19: Under-component Cleanliness Average of all Trials
Additionally, the interaction between all variables was analyzed using Factor Analysis of Mixed Data (FAMD). This tool is
useful when analyzing a data set containing both quantitative and qualitative variables. It makes it possible to analyze the
similarity between individuals by considering mixed types of variables. Additionally, one can explore the association
between all variables, both quantitative and qualitative [3].
For this analysis, cleaning agents and solder pastes were treated as qualitative variables, while conveyor speed and wash
temperature were treated as quantitative variables. The Quantitative Plot shows the relationship between conveyor speed and
wash temperature on the cleanliness level achieved of each component type. Reference Figure 20.

Figure 20: Quantitative Plot
The angle formed between any pair of arrows corresponds to the level of association. Angles between 0 and 90 degrees
correspond to positive association, and angles greater than 90° and up to 180° correspond to negative associations. Closeness
to 0° indicates high level of positive association, closeness to 90° indicates no association, and closeness to 180° indicates
high level of negative association. The axes (Dim1 and Dim2) have no physical meaning and are merely an analytical means
of summarizing all the data and variables. The length of each arrow corresponds to the significance of the variable.
Observations from the FAMD Quantitative Analysis:
• It can be seen that the conveyor speed is in the opposite direction of 1812, 6032, 1210, 1825, and MLF-68
components indicating that increasing the conveyor speed is associated with lower cleanliness for these component
types. Conveyor speed has more significant impact on cleanliness for these component types.
• Conveyor speed forms an approximate 90° angle with SOT-23, 0805, 0603, 1206, and 0402 components indicating
that conveyor speed has less impact on cleanliness for these component types.
• Wash temperature can be seen making a 30-45° with most of the component types indicating a soft positive
association. Wash temperature has less impact on under-component cleanliness compared to conveyor speed.
• The length of each arrow corresponds to the significance of the variable, which indicates changing conveyor speed
yields to a greater difference in results compared to changing wash temperature.
The Qualitative Plots show the relationship between the Solder Pastes and Cleaning Agents on the average cleanliness level
achieved for each substrate within the 72 trials. Reference Figures 21 and 22.

Figure 21: Qualitative Plot (Solder Paste)
Observations from the FAMD Qualitative Analysis (Solder Paste):
• The center of the ellipses corresponds to the average cleanliness level achieved for each solder paste and the area of
the ellipses corresponds to variability. This plot shows the distribution of all boards on the same axes without the
quantitative variables. Instead, the boards are color coded based on the solder paste used.
• It can be seen that most boards fall within the same region near the origin and in quadrants I, II, and IV. This
indicates that the cleaning results for most boards are similar and that there are only a few boards (i.e. 40, 38, 4, etc.)
that have results that are extremely dissimilar to the others.
• It can be seen that the center point of Solder Paste B ellipse is closest to the origin signifying there is little difference
in the cleaning results from the average board due to that solder paste. Additionally, Solder Paste A ellipse is the
smallest showing the least variability in cleaning results while Solder Paste D ellipse is the largest showing the most
variability in the cleaning results.
Figure 22: Qualitative Plot (Cleaning Agent)
Observations from the FAMD Qualitative Analysis (Cleaning Agent):
• In this analysis this plot shows the distribution of all boards on the same axes without the quantitative variables.
Instead, the boards are color coded based on chemistry used.
• The ellipses are the same size indicating that both chemistries show similarly sized amounts of variability.
Finally, localized Ion Chromatography (IC) as well as localized extraction electrical test(s) were conducted on four (4) select
components for each solder paste prior to cleaning. The components selected were 1812, MLF-68, 0805 and 1210.
The localized IC was conducted using the localized extraction method [4]. All IC analysis and localized extraction tests were
conducted at the company technical center. The company standards for passing IC results are based on an average used by
certified industry labs. The standards used, and the IC data is detailed in the appendix.
As part of the localized extraction analysis, an electrical test was conducted whereby a leakage current event can be identified
based on a Class 2 – 3 setting established by the manufacturer of this specific equipment. In brief, using a sacrificial Y-
pattern electrode immersed in the collected extraction solution, a 10 Volt bias (+/-0.1V) is applied to the electrode and an
internal timer is started to measure the time it takes to achieve a leakage event. The system is measuring the leakage current
across the electrode generated by the extraction solution plus the residues extracted from the board surface. A threshold of
250 μA has been set to identify when a current leakage event has occurred. If 250μA is achieved in less than 120 seconds,
this correlates to a corrosive surface and is identified as “dirty”. In theory, the more corrosive / conductive the residue, the
faster it will take to achieve this event. The less corrosive or conductive the residue, the longer it will take to achieve. Thus,
timing events that take longer than 120 seconds have correlated to cleaner less corrosive residues and are identified as “clean”
[4].
For each solder paste and for all components tested, IC and localized extraction electrical test yielded passing results.
Reference Tables 8 - 11. As this was the case, the authors chose not to conduct IC on the cleaned boards.
Conclusions
Surface Inspection:
• For all trials, board surface was found to be clean except minor residues around MLF/BTC components on a few
boards.
• Overall, Cleaning Agent A (77.78%) provided better cleaning results as compared to Cleaning Agent B (33.33%).
Under-Component Inspection – Impact of Solder Paste:
• Under-component cleanliness results achieved were similar for both lead-free (85.65%) and tin-lead pastes
(81.70%).
• Overall, both Cleaning Agent A (85.76%) and Cleaning Agent B (81.60%) provided similar results for under-
component cleanliness.
Under-Component Inspection – Impact of Conveyor Speed:
• Cleaning results improved significantly at lower conveyor speed (0.5 fpm) compared to faster conveyor speed (1.5
fpm) i.e. 95.11% versus 72%.
Under-Component Inspection – Impact of Wash Temperature:
• Cleaning results improved significantly at higher wash temperature (180°F) compared to lower wash temperature
(144°F) i.e. 92.59% versus 73.96%.
Under-Component Inspection – Impact of Conveyor Speed and Wash Temperature:
• The same under-component cleanliness results can be achieved with a combination of high wash temperature
(180°F) and faster conveyor speed (1.2 fpm) compared to low wash temperature (144°F) and slower conveyor speed
(0.5 fpm).
Localized Extraction and Ion Chromatography Results:
• Localized extraction and ion chromatography tests were conducted on un-clean boards for each type of solder paste
to verify if these methods can be used for data analysis. We had passing results for all un-clean boards, so this
method was not used for data analysis.
FAMD analysis indicates that conveyor speed (exposure time in the wash section) has a significant impact on under-
component cleanliness and wash temperature has a soft positive association. FAMD analysis also verified that cleaning
results for most boards are similar regardless of solder paste and cleaning agent type which proves consistency of data.
Overall Conclusions
The results of the study confirmed that wash exposure time is the most critical factor impacting under-component cleanliness.
As referenced in Figure 19, as wash solution temperature increases from 144°F to 180°F, regardless of conveyor speed,
under-component cleanliness effectiveness increased. More importantly, at 180°F wash temperature as the inline conveyor
speed increases from 0.5 fpm to 1.5 fpm, a 300% productivity improvement, under-component cleaning effectiveness was
reduced from 99% to only 88%. Therefore, depending on the cleanliness requirement for the electronic assembly, a
significant productivity increase is possible utilizing the same cleaning process footprint with an increase in wash solution
temperature.
References
[1] Tosun, U., and Patel, J., “Evaluating Rinsing Effectiveness in Spray-In-Air Cleaners”, Proceedings of SMTA
International, September 2016.
[2] Tosun, U., and Vargas, A., “Cleaning Process Efficiency and the Influence of Static and Dynamic Cleaning Rates”,
Proceedings of SMTA International, September 2014.
[3] STHDA: FAMD – Factor Analysis of Mixed Data in R: Essentials
[4] Shoda, S., and Munson, T., “Cleanliness Assessment Correlation to Electronics Hardware Reliability”, IPC APEX 2007.

Appendix:
Table 8: Ion Chromatography and Localized Extraction Electrical Test Results – Solder Paste A
Acceptance
Criteria 1812 MLF-68 0805 1210
AN
ION
S
Fluoride (F-) 3 0.0000 0.0000 0.0000 0.0000
Acetate (C2H3O-2) 3 ND ND ND ND
Formate (CHO-2) 3 ND 0.4120 0.7940 0.4060
Chloride (Cl-) 3 0.0000 0.0000 0.0000 0.0000
Nitrite (NO2-) 3 0.0160 ND 0.0040 0.0100
Bromide (Br-) 6 0.0000 0.0000 0.0000 0.0000
Nitrate (NO3-) 3 2.0320 0.0000 0.2080 1.6240
Phosphate (PO42-) 3 ND ND ND ND
Sulfate (SO42-) 3 0.5940 0.0000 1.1580 0.4920
WOA (Weak Organic Acid) 25 2.6620 ND ND ND
CA
TIO
NS
Lithium (Li+) 3 0.0020 0.0000 0.0000 0.0020
Sodium (Na+) 3 0.0000 0.0000 0.0000 0.0080
Ammonium (NH4+) 3 0.0000 0.0000 0.0000 0.0000
Potassium (K+) 3 0.8580 0.0000 0.0000 0.7440
Magnesium (Mg2+) n/a 0.0000 0.0000 0.2120 0.0360
Calcium (Ca2+) n/a 0.0000 0.0000 2.3420 0.6760
Localized Ion
Chromatography Results Pass Pass Pass Pass
Localized Extraction
Electrical Test Results
<250µA for 120s
or more Clean Clean Clean Clean
Table 9: Ion Chromatography and Localized Extraction Electrical Test Results – Solder Paste B
Acceptance
Criteria 1812 MLF-68 0805 1210
AN
ION
S
Fluoride (F-) 3 0.0000 0.0000 0.0000 0.0000
Acetate (C2H3O-2) 3 ND ND ND ND
Formate (CHO-2) 3 0.6180 0.7560 0.8700 0.7280
Chloride (Cl-) 3 0.0600 0.0000 0.7920 0.8080
Nitrite (NO2-) 3 ND ND 0.0280 0.0220
Bromide (Br-) 6 0.5020 3.5640 0.1100 0.4060
Nitrate (NO3-) 3 0.1340 0.0000 0.4260 0.3520
Phosphate (PO42-) 3 ND ND ND ND
Sulfate (SO42-) 3 2.1340 0.7280 0.1420 0.0000
WOA (Weak Organic Acid) 25 ND 23.2920 ND ND
C A T I O N S
Lithium (Li+) 3 0.0020 0.0020 0.0020 0.0020

Sodium (Na+) 3 0.0000 0.0000 0.2400 0.0000
Ammonium (NH4+) 3 0.0000 0.0000 0.0000 0.1000
Potassium (K+) 3 0.0000 0.0000 0.3660 0.0000
Magnesium (Mg2+) n/a 0.0900 0.0000 0.1320 0.2220
Calcium (Ca2+) n/a 0.5600 2.4480 0.0000 0.0480
Localized Ion
Chromatography Results Pass Pass Pass Pass
Localized Extraction
Electrical Test Results
<250µA for 120s
or more Clean Clean Clean Clean
Table 10: Ion Chromatography and Localized Extraction Electrical Test Results – Solder Paste C
Acceptance
Criteria 1812 MLF-68 0805 1210
AN
ION
S
Fluoride (F-) 3 0.0000 0.0000 0.0000 0.0000
Acetate (C2H3O-2) 3 ND ND ND ND
Formate (CHO-2) 3 0.5160 0.5100 0.6480 0.6980
Chloride (Cl-) 3 0.1520 0.0000 0.4580 0.0000
Nitrite (NO2-) 3 ND 0.0300 ND 0.0320
Bromide (Br-) 6 0.2360 0.0000 0.1980 0.1620
Nitrate (NO3-) 3 0.4760 0.7000 0.4420 0.3060
Phosphate (PO42-) 3 ND ND ND ND
Sulfate (SO42-) 3 1.5620 0.2580 2.3280 0.6100
WOA (Weak Organic Acid) 25 ND ND ND ND
CA
TIO
NS
Lithium (Li+) 3 0.0040 0.0000 0.0040 0.0000
Sodium (Na+) 3 0.0000 0.0000 0.0000 0.0000
Ammonium (NH4+) 3 0.0080 0.0180 0.0000 0.0000
Potassium (K+) 3 0.0000 0.0220 0.2220 0.0000
Magnesium (Mg2+) n/a 0.1220 0.2220 0.2820 0.1700
Calcium (Ca2+) n/a 1.2580 0.0000 0.9140 1.6300
Localized Ion
Chromatography Results Pass Pass Pass Pass
Localized Extraction
Electrical Test Results
<250µA for 120s
or more Clean Clean Clean Clean
Table 11: Ion Chromatography and Localized Extraction Electrical Test Results – Solder Paste D
Acceptance
Criteria 1812 MLF-68 0805 1210
AN
ION
S
Fluoride (F-) 3 0.0000 0.0000 0.0000 0.0000
Acetate (C2H3O-2) 3 ND ND ND ND
Formate (CHO-2) 3 0.6220 0.5100 0.8140 0.8860
Chloride (Cl-) 3 0.2100 0.0000 0.0000 0.0260
Nitrite (NO2-) 3 0.0240 0.0340 0.0000 0.0400
Bromide (Br-) 6 0.0000 0.0000 0.0560 0.0960
Nitrate (NO3-) 3 0.5180 0.3880 1.0040 0.3160
Phosphate (PO42-) 3 ND ND ND ND
Sulfate (SO42-) 3 1.1180 0.0000 0.1340 1.2840
WOA (Weak Organic Acid) 25 ND ND ND ND
CA
T
ION S Lithium (Li+) 3 0.0020 0.0000 0.0020 0.0020
Sodium (Na+) 3 0.0000 0.0000 0.0000 0.0000

Ammonium (NH4+) 3 0.1240 0.0000 0.2660 0.1660
Potassium (K+) 3 0.0000 0.0000 0.3140 0.0000
Magnesium (Mg2+) n/a 0.1200 0.2360 0.0780 0.2020
Calcium (Ca2+) n/a 1.6200 0.0000 0.0000 0.6580
Localized Ion
Chromatography Results Pass Pass Pass Pass
Localized Extraction
Electrical Test Results
<250µA for 120s
or more Clean Clean Clean Clean
Related Documents