Office of Research and Development Full Name of Lab, Center, Office, Division or Staff goes here. <Go to View, Master, Title Master to change> Photo image area measures 2” H x 6.93” W and can be masked by a collage strip of one, tw o or three images. The photo image area is located 3.19” from left and 3.81” from top of page. Each image used in collage should be reduced or cropped to a maximum of 2” high, stroked w ith a 1.5 pt w hite frame and positioned edge-to-edge w ith accompanying images. October 26, 2017 Joshua A. Harrill, Ph.D. High Throughput Transcriptomics (HTTr) Concentration- Response Screening in MCF7 Cells

Welcome message from author
This document is posted to help you gain knowledge. Please leave a comment to let me know what you think about it! Share it to your friends and learn new things together.
Transcript

Office of Research and DevelopmentFull Name of Lab, Center, Office, Division or Staff goes here. <Go to View, Master, Title Master to change>
Photo image area measures 2” H x 6.93” W and can be masked by a collage strip of one, tw o or three images.
The photo image area is located 3.19” from left and 3.81” from top of page.
Each image used in collage should be reduced or cropped to a maximum of 2” high, stroked w ith a 1.5 pt w hite frame and positioned edge-to-edge w ith accompanying images.
October 26, 2017
Joshua A. Harrill, Ph.D.
High Throughput Transcriptomics (HTTr) Concentration-Response Screening in MCF7 Cells

Office of Research and DevelopmentFull Name ofLab, Center, Office, Division or Staff goes here. <Go to View, Master, Slide Master to change> 2
Conflict of Interest Statement
• No conflict of interest declared.
• Disclaimers:
• The views expressed in this presentation are those of the author and do not necessarily reflect the view or policies of the USEPA.
• This presentation does not necessarily reflect USEPA policy. Mention of trade names or commercial products does not constitute an endorsement or recommendation for use by USEPA.
• Data in this presentation is the result of preliminary analyses.

Outline
• Background & Objectives
• HTTr Pilot Experiment• Optimization Steps• Attenuation• Experimental Layout
• Results• Assay Performance Metrics• Concentration-Response Modeling
• Current Activities & Future Directions

Background
• ToxCast assays cover about 320 genes.
• Pathway coverage is higher but still leaves large gaps
• Recent technological advances in transcriptomics are very promising for rapid and cost-effective whole transcriptome screening.
• Increase biological coverage by using high throughput transcriptomics (HTTr) as broad-based Tier 0 bioactivity screen.

BioSpyder TempO-Seq
• Targeted RNA-Seq technology
• Whole transcriptome assay provides output on > 20,000 transcripts.
• Requires very low input (< 10 pg total RNA).
• Performed on “standard” PCR and Next Gen Sequencers.
• Compatible with purified RNA or cell lysates.
www.biospyder.com www.illumina.com

Objectives
• Optimize culture and assay conditions for HTTr screening in MCF7 cells using the TempO-Seq human whole transcriptome assay.
• Perform a pilot experiment with a limited number of chemicals (n=44) in order to:
1) Evaluate TempO-Seq assay performance.2) Determine the ability of the TempO-Seq assay to detect known
biological signatures following chemical perbations3) Guide experimental design of larger screening studies.

HTTr Pilot: Experimental Design
Parameter Multiplier NotesCell Type(s) 1 MCF7
Culture Condition 2 DMEM + 10% HI-FBSPRF-DMEM + 10% CS-HI-FBS
Chemicals 44 see subsequent slidesTime Points: 3 6, 12, 24 hours
Assay Formats: 3TempO-Seq
HCI-ApoptosisHCI-Cytotoxicity
Concentrations: 8 3.5 log10 units; ½ log10 spacing
Biological Replicates: 4 3 TempO-Seq; 1 Reserve
a Dulbecoo’s Modified Eagle’s Media (MediaTech 10-013) + Heat-Inactivated FBS (Sigma-Aldrich F4135)B Phenol Red Free Dulbecco’s Modified Eagle’s Media (MediaTech17-205) + Charcoal-Stripped Heat-Inactivated FBS (Sigma-Aldrich 6765)
a MCF7 cells cultured in DMEM + 10% HI-FBS was selected as the test system to facilitate comparability to the Broad Institute Connectivity Map (CMAP) database (http://portals.broadinstitute.org/cmap/).

HTTr Pilot: Workflow
Cell Expansion
Generate Cryopreserved
Cell StocksCell Plating
BioTek MultiFlo FX
Cell Dosing
LabCyte Echo® 550 Liquid Handler
Generating Cell Lysates
Cell Labeling
TempO-Seq WT
High Content Imaging
Thermo CellomicsArrayScan® VTI HCS
Reader
Track 1: Targeted RNA-Seq
Track 2: Cytotoxicity / Apoptosis

Assay Optimization
• MCF7 Cell Culture• Authentication• Expansion Protocol• Media Formulation• Seeding Density
• TempO-Seq Assay• Lysis Conditions• Attenuation of Highly Expressed Genes
• Chemical Treatments• Concentration Range• Plate Map Design• Exposure Duration

MCF7 Expansion Protocol
Stage Culture Vessel Average Cell Yield a
Number of Treatment Wells b
Number of Test Plates c
Initial Seeding NA 1.28x10⁷ 182 0.47
P (34) T25 2.43x10⁷ 346 0.90
P (45) T75 5.86x10⁷ 837 2.18
P(56) T225 1.47x10⁸ 2100 5.47a Median values from c2017-08-14, c2017-08-15, c2017-08-19, c2017-08-20b Assumes 384 well plate, 10,000 cells / well.c For experimental needs > 5 plates / experiment, expand multiple cryopreserved MCF7 cell aliquots in parallel. Pool at each passaging stage.
T225
P5
Perform Experiment
Test Plate(s)
P4 P6P3 (from Cryo)
0 2 4
Seed MC P
6
MC
8
PAction:
Day In Vitro (DIV):
T25 T75
MC = Media ChangeP = Passage
Vessel:MC
10 12
P
• MCF7 Cells authenticated by STR Profiling and karyotyping prior to use in screening studies.

24 HR
PRF-DMEM + 10% CS-HI-FBSDMEM + 10% HI-FBS
48 HR
Media Effects on MCF7 Growth
Qualitative Observations
• More cell attachment and cell spreadingwith PRF-DMEM + 10% CS-HI-FBS.
• Greater increase in cell confluency overtime in PRF-DMEM + 10% CS-HI-FBS.
• More proliferation over time in DMEM +10% HI-FBS.
• DMEM + 10% HI-FBS contains phenol red and an unknown compliment of serum factors which may stimulate ER activation.• Phenol red-free media with charcoal-stripped FBS reduces endogenous estrogen receptor activation.

Attenuation• A method used with BioSpyder TempO-Seq assay to prevent
highly expressed genes from occupying a disproportionate amount of available read space and increase the ability to quantify low abundance transcripts.
• Attenuation is accomplished by adding “cold probes” which compete with matching DOs for hybridization sites on target RNAs.
• The attenuation probe will bind to the same site as the detector oligos, thus decreasing the amount of the target RNA species available for PCR amplification.
• For attenuation, the end user must define:• The set of genes to be attenuated, and…• What degree of attenuation is appropriate
• Question(s):• Is additional attenuation needed in the MCF7 cell model?• If so, how is the attenuation set defined?

Results• Read count distributions similar across samples.• Broad range of read counts within each sample (0 - ~32K).• Within each sample, ~50-60% of DOs with non-zero read counts.• Between 186 - 322 DOs account for 50% of the available read
space (varies with sample).
A
B
Distribution of Read Counts
Table 1. Number of DOs Accounting for 50% of Total Read Space, Per Sample Basis
Media Type
TreatmentType
Treatment Time, h
Sample Time,
h
Replicate Number
1 2 3DMEM -- -- 30 242 246 186DMEM -- -- 36 273 220 208DMEM -- -- 48 238 249 239
PRF.DMEM -- -- 30 276 288 289PRF.DMEM -- -- 36 268 248 244PRF.DMEM -- -- 48 240 240 262
DMEM DMSO 24 30 308 259 269DMEM TSA, 1 µM 24 30 231 248 253
PRF.DMEM DMSO 24 30 307 303 322PRF.DMEM TSA, 1 µM 24 30 273 278 303
DMEM DMSO 30 36 242 233 249DMEM TSA, 1 µM 30 36 192 222 208
PRF.DMEM DMSO 30 36 245 242 232PRF.DMEM TSA, 1 µM 30 36 220 273 263
Range of DO Counts: 186 - 322
Tim
e Co
urse
C.Re
sp.1
C.Re
sp.2

Using a Gate of 50 % of the total read space (*):• Commonality Score = 14: ~ 30% of the DOs are identified as “highly-expressed” in all 14 test conditions (red).• Commonality Score = 1: ~12.5% are identified as “highly-expressed” in only 1 test condition (blue).• Commonality Score = 2 – 13: Varying number of DOs (< 10%) identified as “highly-expressed” in 2 to 13 test conditions.• Variance: Tended to increase in DOs with lower commonality scores.
Conclusions:• At Gate = 50 %, DOs with Commonality Scores of 14 are consistently identified as “highly-expressed” across all test
conditions and have relatively lower variance and higher read counts across all test conditions.• N = 156 DOs identified as candidates for attenuation.
Evaluating Commonality of Highly Expressed Genes Across Test Conditions
*
Gate = 50 %
Total # of DOs

Candidate “Highly Expressed Genes” for Attenuation
• Rank ordered on x-axis by average read count across all test conditions.• Green line Raw read count = 100.• The most highly expressed genes in the attenuation set are “housekeeping” genes.
N = 156

Chemical Name MIE Family Chemical Name MIE FamilyFlutamide
ANTIANDROGEN
Rotenone MITOCHONDRIA(COMPLEX I)Nilutamide Fenpyroximate (Z,E)
Cyproterone acetate Trifloxystrobin MITOCHONDRIA (COMPLEX II)Vinclozolin Pyraclostrobin
4-HydroxytamoxifenANTIESTROGEN
PFOS
PPARClomiphene citrate (1:1) PFOAFulvestrant Troglitazone
Atrazine cAMP INDUCERS / PDE INHIBITORS
FarglitazarCyanazine Lactofen PPO INHIBITOR / PPARSimazineCladribine CYTOTOXICANTS Fomesafen PPO INHIBITORCycloheximide Butafenacil
Bisphenol A
ESTROGENSManeb
SH REACTIVEBisphenol B Thiram4-Nonylphenol, branched Ziram
4-Cumylphenol Imazalil
STEROIDOGENESISClofibrate FIBRATES ProchlorazFenofibrate CyproconazoleLovastatin
HMGCRPropiconazole
Simvastatin Tetrac THRBifenthrin
NA+ CHANNEL3,5,3'-Triiodothyronine
CypermethrinReserpine
VMATAmiodarone hydrochloride
HTTr Pilot: Chemical Test Set
• Chemical set covers broad range of mechanistic diversity with redundancy within mechanistic class.

100 µM
C lad r ib
ine
P y rac lo
s trob in
F u lve s tra
n t
C y c loh e x im
ide
T r iflo
x y s trob in
R o ten o n e
C y p roc o n a zo le
T h iramZ ira
m
C lof ib
rate
F e n p y rox im
a te (Z
,E)
B u tafe
n a c il
C y p e rme th
r in
B ifen th
r in
C y a n a z ine
L a c tofe
n
F e n o fibra
te
Ma n e b
P rop ic
o n a zo le
4 -No n y lp
h e n o l, b ra
n c h e d
R e s e rpin
e
S imv a s ta
t in
L o v a s tat in
A mio
d a ron e h
y d roc h lo
r ide
P roc h lo
raz
F a rglit
a z a r
T e trac
C lom
iph e n e c
itra te
(1:1
)
4 -Hy d ro
x y tam
o x ifen
B isp h e n o l B
T rog lit
a z o n e
C y p rote
ron e a
c e tate
4 -Cu m
y lph e n o l
F luta
mid
e
N iluta
mid
e
3 ,5,3
'-Tr ii
o d o thy ro
n ine
B isp h e n o l A
Ima z a lil
P F OA
V inc lo
zo lin
P F OS
S ima z in
e
A traz in
e
F o me s a fe
n
-6
-4
-2
0
2
4
6
C y to to x ic ity -R e la te d A s s a y sJ u d s o n e t a l. ( 2 0 1 6 )
* *D a ta fr o m IN V IT R O D B _ V 2 _ S U M M A R Y * *
log
10
(AC
50
), µ
M
m o d l_ g a _ M a tr ix _ 1 5 1 0 2 0
m o d l_ la _ M a tr ix _ 1 5 1 0 2 0
Dose Range Selection
• Upper bound in testing range set at 100 µM based on upper limit of cytotoxicity range for most chemicals.• Final dose range: 0.03, 0.1, 0.3, 1, 3, 10, 30, 100 µM

• 44 chemicals in 8-point concentration-response all on one plate• Non-treated (n=3) and DMSO (n=3) control wells.• Three “CMAP” Reference Compounds, single point, in triplicate • First column reserved for addition of RNA QC samples by NCCT (pre-shipment)
and BioSpyder (post-shipment).
Dosing Plate Layout
1 2 3 4 5 6 7 8 9 10 11 12 13 14 15 16 17 18 19 20 21 22 23 241 A Ionomycin (30 µM) 100 100 100 100 100 100 100 100 100 100 100 100 100 100 100 100 100 100 100 100 100 100 non-treated2 B Ionomycin (30 µM) 30 30 30 30 30 30 30 30 30 30 30 30 30 30 30 30 30 30 30 30 30 30 non-treated3 C Ionomycin (30 µM) 10 10 10 10 10 10 10 10 10 10 10 10 10 10 10 10 10 10 10 10 10 10 non-treated4 D Staurosporine (1 µM) 3 3 3 3 3 3 3 3 3 3 3 3 3 3 3 3 3 3 3 3 3 3 DMSO5 E Staurosporine (1 µM) 1 1 1 1 1 1 1 1 1 1 1 1 1 1 1 1 1 1 1 1 1 1 DMSO6 F Staurosporine (1 µM) 0.3 0.3 0.3 0.3 0.3 0.3 0.3 0.3 0.3 0.3 0.3 0.3 0.3 0.3 0.3 0.3 0.3 0.3 0.3 0.3 0.3 0.3 DMSO7 G Saccharin (100 µM) 0.1 0.1 0.1 0.1 0.1 0.1 0.1 0.1 0.1 0.1 0.1 0.1 0.1 0.1 0.1 0.1 0.1 0.1 0.1 0.1 0.1 0.1 DMSO [No Label]8 H Saccharin (100 µM) 0.03 0.03 0.03 0.03 0.03 0.03 0.03 0.03 0.03 0.03 0.03 0.03 0.03 0.03 0.03 0.03 0.03 0.03 0.03 0.03 0.03 0.03 Trichostatin (1 µM)9 I Saccharin (100 µM) 100 100 100 100 100 100 100 100 100 100 100 100 100 100 100 100 100 100 100 100 100 100 Trichostatin (1 µM)10 J Sorbitol (100 µM) 30 30 30 30 30 30 30 30 30 30 30 30 30 30 30 30 30 30 30 30 30 30 Trichostatin (1 µM)11 K Sorbitol (100 µM) 10 10 10 10 10 10 10 10 10 10 10 10 10 10 10 10 10 10 10 10 10 10 Genistein (10 µM)12 L Sorbitol (100 µM) 3 3 3 3 3 3 3 3 3 3 3 3 3 3 3 3 3 3 3 3 3 3 Genistein (10 µM)13 M Ionomycin (30 µM) [No Label] 1 1 1 1 1 1 1 1 1 1 1 1 1 1 1 1 1 1 1 1 1 1 Genistein (10 µM)14 N Staurosporine (1 µM) [No Label] 0.3 0.3 0.3 0.3 0.3 0.3 0.3 0.3 0.3 0.3 0.3 0.3 0.3 0.3 0.3 0.3 0.3 0.3 0.3 0.3 0.3 0.3 Sirolimus (0.1 µM)15 O Saccharin (100 µM) [No Label] 0.1 0.1 0.1 0.1 0.1 0.1 0.1 0.1 0.1 0.1 0.1 0.1 0.1 0.1 0.1 0.1 0.1 0.1 0.1 0.1 0.1 0.1 Sirolimus (0.1 µM)16 P Sorbitol (100 µM) [No Label] 0.03 0.03 0.03 0.03 0.03 0.03 0.03 0.03 0.03 0.03 0.03 0.03 0.03 0.03 0.03 0.03 0.03 0.03 0.03 0.03 0.03 0.03 Sirolimus (0.1 µM)
DOSING PLATE MAP
Test Chemicals
Untreated
DMSO (vehicle control)
CMAP Reference
HCI No Label Controls
HCI Pos. & Neg. Controls

Dose Randomization using Echo 550
LabCyte Echo® 550 Liquid Handler
Acoustic dispensing technology:• Uses soundwaves to precisely transfer small quantities of liquid (nL) from source plate to test plate.• Allows for randomization of test wellsmitigate potential edge effects without “losing real estate.”
Source Plate
Test Plate

UHRR (Us)UHRR (Us)HBRR (Us)HBRR (Us)
Bulk Lysate (DMSO)Bulk Lysate (DMSO)
Bulk Lysate (TSA)Bulk Lysate (TSA)Lysis Buffer (Us)Lysis Buffer (Us)
UHRR (Them)UHRR (Them)HBRR (Them)HBRR (Them)
Lysis Buffer (Them)Lysis Buffer (Them)
Evaluate technical reproducibility.Shipping control
Evaluate technicalreproducibility for
cell lysates
No Template Control
HTTr
Cytotoxicity ORApoptosis
HCI Labeling
Echo Dispensing
• RNA QC samples allow tracking ofprotocol reproducibility and assayperformance across experimentalreplicates.
• The randomization scheme is unique foreach plate
UHRR = Universal Human Reference RNAHBRR = Human Brain Reference RNA

21
21
Sample LevelProbe LevelGene Level
Fastq sequence alignment; Sum read counts
Filter for cytotoxicity or minimum mapped read
depth
Y NExclude sample
Re-sequence ?
Subset data by chemical x media x time
(+ matching DMSO)
Filter probes using a median raw read count > 5
YNExclude Probe
DESeq2• Normalize to constant 3M
Read Depth• Apply shrinkage estimations
FC Estimates
(with SD/SE & p-value)
Gene Level
Summary
MIE/MOA Identification
Gene Level
Summary
Pathway Enrichment
Benchmark Dose Modeling
DRAFT Data Analysis Pipeline
PRELIMINARY: Workflow for the Data Analysis Pipeline in an active area of research and may change in the future.

Assay Performance Metrics
• Total Mapped Reads vs. Percent Mapped Reads
• Correlation and Variation in Technical Replicates [within plate]
• Correlation and Variation in Biological Replicates [across plates]
• Detection of Biological Signal• Transcriptional Biomarkers• Connectivity Mapping

Total Mapped Reads vs. Percent Mapped Reads [All Plates]
• Average total mapped reads of test samples ~ 3.0x10⁶
• Average mapped read count per gene ~150
• Percent mapped reads > 75%
• Lysis Buffer blanks have low total reads, but not zero.
• Purified RNAs clustered at upper left.
• Comet tail ?
• Off-set cluster ?

Total Mapped Reads vs. Percent Mapped Reads [By Plates]
• Comet tail Due to one “poor performing” plate• Offset cluster Low read count samples across many plates (red circles) Candidates for resequencing.

Correlation Among Technical Replicates
• Correlation among technical replicates is high (> 0.85 %).

Coefficient of Variation (CV) Among Technical Replicates
• Coefficient of variation in gene expression values is low (median ~30 %).
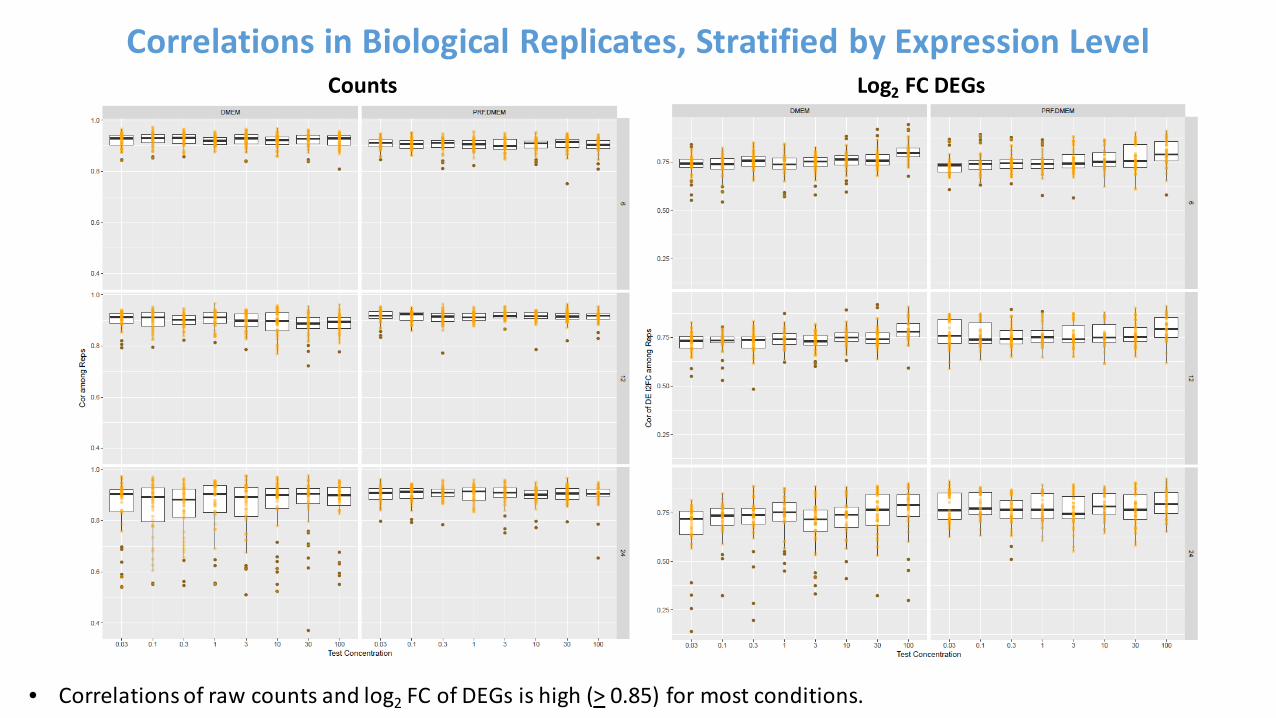
Correlations in Biological Replicates, Stratified by Expression LevelCounts Log2 FC DEGs
• Correlations of raw counts and log2 FC of DEGs is high (> 0.85) for most conditions.

Coefficient of Variation (CV) Stratified by Expression Level
• CVs decrease as a function of mean expression level.

• Biomarker signature determinedby treating MCF7 cells with variousERα agonists and antagonists.
• Can we use this to detectbiologically meaningful signal inthe BioSpyder data?
EGR3 3.16MYBL1 1.9SGK1 1.81RET 1.7JAK2 1.67CXCL12 1.62NMRK1 1.62AREG 1.6SGK3 1.6PLAUR 1.58PTGES 1.48SMOX 1.47CD44 1.46FHL2 1.46RAPGEFL1 1.46ABHD2 1.45SVIL 1.44CCND1 1.42FOXC1 1.42PDZK1 1.42TFAP2C 1.42WWC1 1.42PGR 1.38PRSS23 1.37OLFM1 1.36MICAL2 1.35SLC7A5 1.35CA12 1.33RCL1 1.29MYB 1.27SIAH2 1.25RBBP8 1.24ALAD -1.26RHBDF1 -1.27PIK3R3 -1.29KYNU -1.31DYRK2 -1.35ID3 -1.42CLMN -1.45PLEKHF2 -1.45SSBP2 -1.46EFNA1 -1.48TFAP2A -1.48TFPI -1.49EPHA4 -1.52CCNG2 -1.77
•
Ryan et al. (2016)
DRAFT WORK PRODUCT – DO NOT DISTRIBUTE
ERα Biomarker Signature

Chemical MOA
1 Fulvestrant Antiestrogen(SERD)
2 4-Hydroxytamoxifen Antiestrogen
(SERM)3 ClomipheneCitrate
4 Bisphenol A
Estrogenic5 Bisphenol B
6 4-Nonylphenol,branched
7 4-Cumylphenol
1 2 3 4 5 6 7 1 2 3 4 5 6 7 1 2 3 4 5 6 7
0.03
0.1
0.3
1
3
10
30
100
1 2 3 4 5 6 7 1 2 3 4 5 6 7 1 2 3 4 5 6 7
0.03
0.1
0.3
1
3
10
30
100
DMEM.06 DMEM.12 DMEM.24
PRF.DMEM.06 PRF.DMEM.12 PRF.DMEM.24
+ Corr
- Corr
Correlation with ERα Transcriptional Biomarker

Correlation with ERα Transcriptional Biomarker - AntagonistsAgonists Antagonists
• The ability to detect ERa antagonists (particularly SERMs) was decreased by use of charcoal stripped serum.

Connectivity Mapping
• Differential gene expression observed with reference chemicals.
• Putative targets identified using Connectivity Mapping
• Large degree of promiscuity of predicted targets observed.
• Currently evaluating additional methods for MIE prediction

Benchmark Dose Modeling
Parameter Criteria a
Pre-filter: ANOVA (praw < 0.05 & |FC| > 2)
Models Hill, Exponential 2, poly2, power, linear
BMR Factor: 1.349 (10 %)
Best Model Selection: Lowest AIC
Hill Model Flagging b: ‘k’ < 1/3 Lowest Positive DoseRetain Flagged Models
Pathway Analysis:Genes with BMD <= Highest Dose > 3
> 5% Gene Set CoverageFisher’s Exact Two Tailed < 0.05
Gene Set Collections c:MSigDB_C2MSigDB_HReactome
a Exploratory analysis – modeling criteria not finalized
b Flagged Hill Models were retained to illustrate a specific point regarding concentration range selection
c Gene Set Collections:• MSigDB_C2: Curated gene sets from online pathway databases, publications and knowledge of domain experts (n = 4738).• MSigDB_H: Coherently expressed signatures derived by aggregating many MSigDB gene sets to represent well-defined biological states
or processes (n = 50).• Reactome: Open-source, curated and peer reviewed pathway database with hierarchical pathway relationships in specific domains of
biology. (n = 1764). Some pathways included in MSigDB_C2.

MYBL1_22509BMD = 7.769E-14 µM
Fulvestrant
Clomiphene Citrate MYBL1_22509BMD = 0.016 µM
• A high occurrence of flagged Hill fits with unreasonably low BMDs may indicate the concentration range was not low enough.• Flagged BMDs were observed with low frequency in this dataset.• The identify of genes with flagged hill models was inconsistent across chemicals. Not driven by DMSO controls.
Benchmark Dose Modeling Results* *

Benchmark Dose Modeling Results
• Wide range of chemical potencies at the probe level.• The distribution of probe level BMDs vary from chemical to chemical.• No apparent relationship between potency and number of probes affected (?).
Bisphenol A Bisphenol B* *

Chemical Name MSigDB_C2 MSigDB_H ReactomeZiram 1268 26 3144-Hydroxytamoxifen 1068 14 331Cycloheximide 570 24 1264-Nonylphenol, branched 533 7 127Amiodarone hydrochloride 524 12 136Reserpine 523 11 80Maneb 248 3 75Rotenone 215 5 22Thiram 204 5 644-Cumylphenol 198 4 27Bisphenol B 185 2 31Fenpyroximate (Z,E) 183 5 14Cyproterone acetate 166 5 4Prochloraz 113 2 10Clomiphene Citrate 68 3 0Nilutamide 56 0 29Trifloxystrobin 47 1 2Cladribine 47 0 71Bisphenol A 45 1 5Imazalil 41 0 4Pyraclostrobin 37 0 1Farglitazar 22 1 0
Chemical Name MSigDB_C2 MSigDB_H ReactomePropiconazole 20 1 23,5,3'-Triiodothyronine 18 0 1Fenofibrate 17 0 1Cyanazine 16 0 1Flutamide 10 0 1Fulvestrant 9 1 0Cypermethrin 7 0 1Lovastatin 6 0 0Simvastatin 5 0 0Butafenacil 3 0 0Vinclozolin 2 0 0Tetrac 2 0 1Lactofen 2 0 0Cyproconazole 0 0 0Clofibrate 0 0 0PFOS 0 0 0Simazine 0 0 0Fomesafen 0 0 0Troglitazone 0 0 0PFOA 0 0 0Atrazine 0 0 0Bifenthrin 0 0 0
Pathway EnrichmentNumbers of Pathways Enriched
• Heterogeneity in the amount and type of pathways enriched.• Changing filtering stringency and BMD modeling strategy affects these results.

Pathway Potencies
Ziram
Cycloheximide
• Broad range of pathway level potency estimates and number of pathways affected across chemicals.
MSigDB_C2
Thiram

ER Agonist ER Antagonist
4-Cumylphenol
4-Nonylphenol, branched
Bisphenol A
Bisphenol B
Fulvestrant
Clomiphene Citrate (1:1)
4-Hydroxytamoxifen
Pathway Potencies
MSigDB_C2 MSigDB_C2
• Heterogeneity in pathway levels potency estimates and number of pathways affected within chemical class.

• Reactome (v60) Pathway Hierarchy
Network Mapping

p-value
• Reactome (v60) Pathway Hierarchy Overlaid with enrichment scores based on probes with acceptable BMD model fit• Highlights different areas of biology affected by a chemical
Network Mapping [Clomiphene Citrate]

p-value
4-Nonylphenol Amiodarine Hydrochloride Clomiphene Citrate
Cycloheximide Rotenone Ziram
Chromosome maintenance
M-phaseG0 and early G1
G2/M Checkpoints
Diversity in Response of Cell Cycle Networks

p-value
4-Nonylphenol Amiodarine Hydrochloride Clomiphene Citrate
Cycloheximide Rotenone Ziram
Signaling by RhoGTPases
MAPK1/MAPK3 Signaling
Signaling by ERBB2
RAF/MAPK Cascade
Diversity in Response of Signal Transduction Networks
Current Activities & Future Directions
• Fall 2017:• Refining data analysis pipeline and BMD modeling approach.• Exploring methods for MIE prediction & characterization of biological
responses.• Prepping initial publication.• Conducting concentration-response screening of 2,200 chemicals in
MCF7 cell model (8 conc., 6 HR exposure).
• Beyond 2017:• Tox21 reference chemical partner project• Screening in additional cell lines.• Coupling with image-based phenotypic screening assay.

Acknowledgements
• NCCT• Clinton Willis• Danielle Suarez• Chad Deisenroth
• Imran Shah• Woody Setzer• Derek Haggard• Matt Martin• Richard Judson• Rusty Thomas
• BioSpyder• Joel McComb• Jo Yeakley• Jason Downing• Milos Babic• Kyle LeBlanc• Harper Van Steenhouse

Questions ?
Related Documents