ORIGINAL RESEARCH published: 13 January 2021 doi: 10.3389/fphys.2020.588313 Edited by: Carlo C. Lazado, Norwegian Institute of Food, Fisheries and Aquaculture Research (Nofima), Norway Reviewed by: Cristian Gallardo-Escárate, University of Concepción, Chile Jorge Galindo-Villegas, Nord University, Norway *Correspondence: Heather Ikert [email protected] Specialty section: This article was submitted to Aquatic Physiology, a section of the journal Frontiers in Physiology Received: 28 July 2020 Accepted: 21 December 2020 Published: 13 January 2021 Citation: Ikert H, Lynch MDJ, Doxey AC, Giesy JP, Servos MR, Katzenback BA and Craig PM (2021) High Throughput Sequencing of MicroRNA in Rainbow Trout Plasma, Mucus, and Surrounding Water Following Acute Stress. Front. Physiol. 11:588313. doi: 10.3389/fphys.2020.588313 High Throughput Sequencing of MicroRNA in Rainbow Trout Plasma, Mucus, and Surrounding Water Following Acute Stress Heather Ikert 1 * , Michael D. J. Lynch 1 , Andrew C. Doxey 1 , John P. Giesy 2,3 , Mark R. Servos 1 , Barbara A. Katzenback 1 and Paul M. Craig 1 1 Department of Biology, University of Waterloo, Waterloo, ON, Canada, 2 Department of Veterinary Biomedical Sciences, Toxicology Centre, University of Saskatchewan, Saskatoon, SK, Canada, 3 Department of Environmental Science, Baylor University, Waco, TX, United States Circulating plasma microRNAs (miRNAs) are well established as biomarkers of several diseases in humans and have recently been used as indicators of environmental exposures in fish. However, the role of plasma miRNAs in regulating acute stress responses in fish is largely unknown. Tissue and plasma miRNAs have recently been associated with excreted miRNAs; however, external miRNAs have never been measured in fish. The objective of this study was to identify the altered plasma miRNAs in response to acute stress in rainbow trout (Oncorhynchus mykiss), as well as altered miRNAs in fish epidermal mucus and the surrounding ambient water. Small RNA was extracted and sequenced from plasma, mucus, and water collected from rainbow trout pre- and 1 h-post a 3-min air stressor. Following small RNA-Seq and pathway analysis, we identified differentially expressed plasma miRNAs that targeted biosynthetic, degradation, and metabolic pathways. We successfully isolated miRNA from trout mucus and the surrounding water and detected differences in miRNA expression 1-h post air stress. The expressed miRNA profiles in mucus and water were different from the altered plasma miRNA profile, which indicated that the plasma miRNA response was not associated with or immediately reflected in external samples, which was further validated through qPCR. This research expands understanding of the role of plasma miRNA in the acute stress response of fish and is the first report of successful isolation and profiling of miRNA from fish mucus or samples of ambient water. Measurements of miRNA from plasma, mucus, or water can be further studied and have potential to be applied as non-lethal indicators of acute stress in fish. Keywords: microRNA, high throughput sequencing, acute stress, non-lethal, blood plasma, mucus, water, Oncorhynchus mykiss INTRODUCTION Fish experience acute stress when they are exposed to air. This causes a cholinergic response within seconds to minutes and an adrenergic response within minutes to hours (Wendelaar Bonga, 1997; Tort, 2013; Balasch and Tort, 2019; Cadonic et al., 2020). Molecular regulation of this stress response is well studied in fish, however, the role of miRNA in this response is a nascent field Frontiers in Physiology | www.frontiersin.org 1 January 2021 | Volume 11 | Article 588313

Welcome message from author
This document is posted to help you gain knowledge. Please leave a comment to let me know what you think about it! Share it to your friends and learn new things together.
Transcript
fphys-11-588313 January 4, 2021 Time: 15:59 # 1
ORIGINAL RESEARCHpublished: 13 January 2021
doi: 10.3389/fphys.2020.588313
Edited by:Carlo C. Lazado,
Norwegian Institute of Food, Fisheriesand Aquaculture Research (Nofima),
Norway
Reviewed by:Cristian Gallardo-Escárate,
University of Concepción, ChileJorge Galindo-Villegas,
Nord University, Norway
*Correspondence:Heather Ikert
Specialty section:This article was submitted to
Aquatic Physiology,a section of the journalFrontiers in Physiology
Received: 28 July 2020Accepted: 21 December 2020
Published: 13 January 2021
Citation:Ikert H, Lynch MDJ, Doxey AC,
Giesy JP, Servos MR, Katzenback BAand Craig PM (2021) High
Throughput Sequencing of MicroRNAin Rainbow Trout Plasma, Mucus,and Surrounding Water Following
Acute Stress.Front. Physiol. 11:588313.
doi: 10.3389/fphys.2020.588313
High Throughput Sequencing ofMicroRNA in Rainbow Trout Plasma,Mucus, and Surrounding WaterFollowing Acute StressHeather Ikert1* , Michael D. J. Lynch1, Andrew C. Doxey1, John P. Giesy2,3,Mark R. Servos1, Barbara A. Katzenback1 and Paul M. Craig1
1 Department of Biology, University of Waterloo, Waterloo, ON, Canada, 2 Department of Veterinary Biomedical Sciences,Toxicology Centre, University of Saskatchewan, Saskatoon, SK, Canada, 3 Department of Environmental Science, BaylorUniversity, Waco, TX, United States
Circulating plasma microRNAs (miRNAs) are well established as biomarkers of severaldiseases in humans and have recently been used as indicators of environmentalexposures in fish. However, the role of plasma miRNAs in regulating acute stressresponses in fish is largely unknown. Tissue and plasma miRNAs have recentlybeen associated with excreted miRNAs; however, external miRNAs have never beenmeasured in fish. The objective of this study was to identify the altered plasmamiRNAs in response to acute stress in rainbow trout (Oncorhynchus mykiss), as wellas altered miRNAs in fish epidermal mucus and the surrounding ambient water. SmallRNA was extracted and sequenced from plasma, mucus, and water collected fromrainbow trout pre- and 1 h-post a 3-min air stressor. Following small RNA-Seq andpathway analysis, we identified differentially expressed plasma miRNAs that targetedbiosynthetic, degradation, and metabolic pathways. We successfully isolated miRNAfrom trout mucus and the surrounding water and detected differences in miRNAexpression 1-h post air stress. The expressed miRNA profiles in mucus and waterwere different from the altered plasma miRNA profile, which indicated that the plasmamiRNA response was not associated with or immediately reflected in external samples,which was further validated through qPCR. This research expands understanding ofthe role of plasma miRNA in the acute stress response of fish and is the first reportof successful isolation and profiling of miRNA from fish mucus or samples of ambientwater. Measurements of miRNA from plasma, mucus, or water can be further studiedand have potential to be applied as non-lethal indicators of acute stress in fish.
Keywords: microRNA, high throughput sequencing, acute stress, non-lethal, blood plasma, mucus, water,Oncorhynchus mykiss
INTRODUCTION
Fish experience acute stress when they are exposed to air. This causes a cholinergic responsewithin seconds to minutes and an adrenergic response within minutes to hours (Wendelaar Bonga,1997; Tort, 2013; Balasch and Tort, 2019; Cadonic et al., 2020). Molecular regulation of this stressresponse is well studied in fish, however, the role of miRNA in this response is a nascent field
Frontiers in Physiology | www.frontiersin.org 1 January 2021 | Volume 11 | Article 588313

fphys-11-588313 January 4, 2021 Time: 15:59 # 2
Ikert et al. Stress Alters Non-lethally Sampled MicroRNA
of study. MicroRNAs are short, 22-nucleotide long, non-codingRNA that decrease stability and translation of mRNA (Lee et al.,1993; Ruvkun et al., 1993; Bartel et al., 2003). MicroRNAsregulate the response of fish in a tissue-specific manner to avariety of stressors, such as hypoxia in tilapia (Qiang et al.,2020), contaminant exposure in carp (Liu et al., 2020a,b),and overcrowding in rainbow trout (Gonçalves et al., 2020).Additionally, miRNAs are measurable in blood plasma of fish andspecific miRNAs are differentially expressed following exposureof rainbow trout to air (Cadonic et al., 2020). However, theentire plasma miRNA response to acute stress has not yet beencharacterized. It is also unknown how changes in profiles ofmiRNAs in blood plasma of fishes target known genes andmolecular pathways of the acute stress response.
Non-lethal sampling of plasma from fish can conservativelyoccur up to a maximum of 1 mL per kg of body mass (CanadianCouncil on Animal Care, 2005; Hawkins et al., 2011). Therefore,non-lethal measurements of miRNA in blood plasma of largefishes can be made. However, when measuring miRNA fromsmaller or endangered species, an alternative method would bemore appropriate. Epidermal mucus of fishes has been used asa sampling location for indicators of acute stress. These includecortisol, stress-related proteins, enzymes, glucose, and lactatelevels (Easy and Ross, 2010; Guardiola et al., 2016; Fernández-Alacid et al., 2019). Furthermore, miRNAs are known to beexcreted from tissue and fluids in exosomes (Valadi et al., 2007;Skog et al., 2008; Zernecke et al., 2009; Kosaka et al., 2010; Zhanget al., 2010), associated with proteins (Wang et al., 2010; Arroyoet al., 2011; Turchinovich et al., 2011; Vickers et al., 2011), or bypassively leaking from a site of injury (Chen et al., 2008; Mitchellet al., 2008). Therefore, in order to provide a representation of thestress status of smaller fishes, mucus is a potential matrix for non-lethal sampling of miRNA. However, miRNAs have never beenmeasured in mucus of fishes and if present, it is unknown whetherpatterns of relative concentrations of miRNAs change followingacute stress, as it does in blood plasma.
Collection of mucus requires fish to be handled and animalguidelines recommend minimizing the removal of epidermalmucus (Canadian Council on Animal Care, 2005). Therefore,to measure changes in miRNA both non-lethally and non-invasively, one of the study objectives was to determine if miRNAcan also be measured from ambient water samples. Nucleic acids,in the form of environmental DNA (eDNA), can be measuredfrom water samples and that DNA originates from epithelia,blood, urine, feces, and gametes of fishes, which are all locationsthat contain miRNA (Höss et al., 1992; Valiere and Taberlet,2000; Ficetola et al., 2008; Jerde et al., 2011). In humans, profilesof relative concentrations of miRNA in tissues are reflected inexcreted fluids (Cui and Cui, 2020; Park et al., 2020). Therefore,profiles of miRNA present in water external to fishes might berelated to miRNA profiles in blood. If this supposition is correct,there might be no need to capture fish or collect samples of bloodor mucus to assess status and trends in the physiological stateof stress. A concern when measuring RNA in the environmentis its instability, as mRNA have an average half-life of 5 min(Moran et al., 2013). However, miRNAs have a half-life of5 days and are protected by exosomes or associated proteins
(Gantier et al., 2011). Therefore, there is potential for miRNA tobe measured in water and their abundance to be altered followingstress, however, this has not yet been measured.
The objective of this study was to determine how miRNAprofiles of rainbow trout are altered in non-lethal samples inresponse to acute stress. First, it was hypothesized that thepattern of relative concentrations of miRNAs in plasma ofrainbow trout would be altered following acute stress and thisresponse would be linked to known molecular responses to stress.Second, it was hypothesized that rainbow trout miRNAs wouldbe present and measurable in epidermal mucus and water andmiRNA abundances would be altered following acute stress.Third, it was hypothesized that there would be differentiallyexpressed miRNAs in common in plasma, mucus, and water,which would provide evidence that external profiles of miRNAare representative of internal changes in miRNA. To test thesehypotheses, samples of blood plasma, epidermal mucus, andwater were collected from rainbow trout (Oncorhynchus mykiss)prior to and following exposure to 3 min of air. RNA wasextracted and differentially expressed miRNAs identified in allthree matrices, by use of high throughput sequencing, followedby pathway analysis of altered plasma miRNA targets, and qPCRvalidation. MicroRNA was further developed as a non-lethalmeasure of stress in fishes and the foundation was laid forfurther development of mucus and water miRNA as non-lethalmeasures of fish stress.
MATERIALS AND METHODS
Animals and Experimental DesignRainbow trout (Oncorhynchus mykiss) were procured fromSilver Creek Aquaculture (Erin, ON, Canada) or donated bythe Ontario Ministry of Natural Resources and Forestry. Allexperimental procedures were approved and conducted per theUniversity of Waterloo and the Canadian Council of AnimalCare guidelines (Animal Utilization Project Protocol #40315).Fish were housed in the University of Waterloo Aquatic Facility(Waterloo, ON, Canada), with a 12 h:12 h light-dark cycle, andfed daily with EWOS Vita (Floating Complete Fish Food forSalmonids) to satiety. Water was maintained at 13.5± 0.7◦C, pH8.85, ∼2000 µS, in well-aerated water. Fish were maintained at adensity of four fish per 200 L tank. Experimental fish had a meanlength of 30.5 ± 3.9 cm and a mass of 322 ± 138 g. Water flowwas maintained at 3.6 ± 0.1 L/min. Flow through loading of thetanks was 0.350± 0.057 kg/L/min.
Control samples of plasma and epidermal mucus werecollected from two rainbow trout and then water samples werecollected from a tank containing two remaining fish (controlsamples). The remaining two rainbow trout were held out ofwater for 3 min. One hour following the 3-min in air, waterwas collected from the tank containing the stressed fish (1 hpost-stress water sample). Immediately following collection ofwater, blood plasma and epidermal mucus were obtained (1 hpost-stress mucus and blood samples). To ensure that both theadrenergic and cholinergic stress responses had occurred or wereoccurring, samples were collected 1-h post stress. Also, due to the
Frontiers in Physiology | www.frontiersin.org 2 January 2021 | Volume 11 | Article 588313

fphys-11-588313 January 4, 2021 Time: 15:59 # 3
Ikert et al. Stress Alters Non-lethally Sampled MicroRNA
water flow maintained in the tanks, an entire tank turnover wascompleted after 1 h. Three experimental replicates of the air stressexperiment were performed (Figure 1).
For collection of blood and mucus, fish were euthanized in abuffered MS-222 solution (0.5 g/L MS-222 in 1 g/L NaHCO3).Mucus was collected by scraping epidermal mucus from the leftside of rainbow trout, being cautious not to introduce any foreignDNA or RNA. This was accomplished by using a new pair ofgloves cleaned with 70% ethanol, using one hand to secure thetrout by holding by the mouth and gill operculum, and using theother hand to scrape the mucus into a 2 mL cryotube. Mucus wasplaced on dry ice and stored at −80◦C until analysis. Blood wascollected by caudal puncture using a 23 G needle fitted onto a1 mL syringe and pre-coated with 0.5 M EDTA. One mL of bloodwas added to a 2 mL microcentrifuge tube containing 10 µL of 0.5M EDTA to prevent coagulation. Blood was stored on ice untilcentrifugation at 1,300 × g for 10 min at 4◦C to collect plasma.Plasma was aliquoted into 200 µL and stored at−80◦C until RNAextraction. Only samples with no visible lysis were used for RNAextraction and sequencing.
Water was collected in 1 L amber bottles sterilized with 10%bleach for 20 min, rinsed three times with ultrapure water, andautoclaved. Care was taken to collect water from the tank withoutintroducing DNA or RNA. For example, the net used to captureand move fish during the 3 min air stress was placed intothe water before control water samples were collected so thatthere would be no new nucleic acids introduced from the net.Samples of water were stored at 4◦C until filtered within 3 h ofcollection. Samples were filtered onto 0.45 µm cellulose nitratefilters (Thermo ScientificTM 1450045) in a sterilized laminar flowhood using a peristaltic pump. Filters were placed in 5 mL tubeson dry ice and stored at−80◦C.
Stress AssessmentTo validate that rainbow trout experienced a physiologicalresponse to the acute stress treatment, cortisol, lactate, andglucose in plasma were measured. To measure plasma cortisol,plasma samples were thawed on ice, diluted by a factor of ten,and cortisol was quantified using the Cortisol Saliva ELISAkit (TECO, Switzerland). To measure plasma lactate, plasma
was thawed on ice, samples and standards were deproteinizedby adding 200 µL ice cold 6% perchloric acid, incubating onice for 5 min, and centrifuging for 2 min at 18,000 × g at4◦C. The supernatant was brought to a pH between 6.5 and8.0 using potassium hydroxide and centrifuged at 18,000 × gfor 15 min at 4◦C. The supernatant was added to the 96 wellplate in triplicate and the reaction cocktail (320 mM glycine,320 mM hydrazine monohydrate, 2.4 mM NAD+, 2 U/mLLDH) was added to a 96 well plate. A kinetic assay at 340 nmwas run and lactate quantified (Bergmeyer, 1974). To measureplasma glucose, plasma was brought to room temperature,4 µL was placed on a cleaned glass slide and an Accu-ChekAviva Nano glucose monitor was used per the manufacturer’sdirections. Duplicate measurements were conducted on eachsample. Data were tested for normality and equal variance. One-tailed t-tests were conducted on this data comparing controland stressed plasma samples. These data were tested with 95%confidence (n = 3).
MicroRNA Extraction and SequencingMicroRNAs were extracted from blood plasma by use of theNorgen Plasma/Serum RNA Purification Mini Kit (CAT 55000).Directions from the manufacturer were followed with a fewmodifications. Aliquots of plasma were thawed on ice andcentrifuged for 2 min at 400 × g and 200 µL of clearedsupernatant was extracted. During elution, 25 µL of SolutionA was applied to the column and the eluate was transferred tothe column again for maximum recovery of RNA. Followingthis, the extracted RNA was further processed using the NorgenRNA Clean-Up and Concentration Micro-Elute Kit (CAT 61000).With this kit, 75 µL RNase free water was added to the 25 µLof extracted RNA to bring the starting volume to 100 µL.Samples were vortexed for 10 s and spun at 14,000 × g,where no specified directions were given. Two separate elutionswere performed using 15 µL of eluate. This ensured maximumrecovery. RNA quantification occurred using the SoftMaxSpectraDrop microplate.
MicroRNAs in mucus were extracted using the QiagenmiRNeasy Serum/Plasma Advanced Kit (CAT 217204). Themanufacturer’s directions were followed and 200 µL of mucus
FIGURE 1 | Experimental design. This experiment was performed in triplicate. Plasma and mucus from one pre-stress fish and one post-stress fish were sequencedfrom each experimental replicate. One pre-stress water sample and one post-stress water sample were sequenced from each experimental replicate. Theexperimental order of sample collection was organized so that the same density of fish was present in the tank when the water collections occurred.
Frontiers in Physiology | www.frontiersin.org 3 January 2021 | Volume 11 | Article 588313

fphys-11-588313 January 4, 2021 Time: 15:59 # 4
Ikert et al. Stress Alters Non-lethally Sampled MicroRNA
was used for the extraction. For any non-specified centrifugespeed, 12,000 × g was used. RNA quantification was performedby Norgen Biotek using the RiboGreenTM RNA Assay on afluorescent microplate reader.
Environmental miRNAs were extracted from water by useof the Norgen Water RNA/DNA Purification Kit (CAT 26480).The manufacturer’s directions were followed with the followingexceptions. Beads were transferred to the 5 mL tube where filtershad been stored, and 1 mL lysis buffer E was added. Tubes werevortexed for 5 min on a flatbed vortex mixer at maximum speed.The initial 1 min spin at 20,000 × g was replaced with a 7 minspin at 3000 × g (maximum allowable speed for 5 mL tubes incentrifuge). Due to this modification, visual separation of lysateand filter was ensured before removing the supernatant for use inthe remainder of the protocol. The optional DNase I treatmentwas applied (Norgen RNase-Free DNase I Kit – CAT 25710) toremove potential DNA contamination prior to sequencing. Anoptional addition of 50 µL elution solution to maximize yieldwas performed. RNA quantification was performed by NorgenBiotek using the RiboGreenTM RNA Assay on a fluorescentmicroplate reader.
Library prep and sequencing were performed by NorgenBiotek (Thorold, ON, Canada) using the Norgen Biotek SmallRNA Library Prep Kit (CAT 63600). Samples (n = 3 for plasma,mucus, and water at both control and 1 h post-stress = total 18samples) were sequenced using the Illumina NextSeq500 witha minimum 10 million read depth. The NextSeq 500/550 HighOutput Kit v2 (51 cycles using a 75-Cycle Kit) (Illumina, CATFC-404-2005) was used as the sequencing reagent.
Bioinformatic AnalysisBioinformatic analysis was accomplished using the miARma-Seq analysis workflow (version 1.7.2; Andrés-León et al., 2016;Andrés-León and Rojas, 2019). However, adapter removal,quality filtering, and differential expression analysis wereperformed independently of the miARma-Seq tool. Adapterremoval and quality filtering, performed by cutadapt (version2.10; used under python3.8), was conducted separately from themiARma-Seq tool due to the incompatibility of the version ofcutadapt present in the miARma-Seq pipeline with the two-color chemistry of the Illumina NextSeq (Martin, 2011). Thedifferential expression analysis was performed independentlyfrom the miARma-Seq tool because two methods of differentialexpression analysis, DESeq2 and edgeR, were used. edgeR isincluded within the miARma-Seq tool but not DESeq2, whichwas therefore performed independently. Similarly, additionalanalysis options were needed in edgeR than those includedwithin the miARma-Seq tool, so this analysis was also performedseparately. The overall bioinformatic analysis followed themiARma-Seq tool workflow but only sequence quality checks,alignment, annotation, and read counting were performed usingthe miARma-Seq tool directly.
Quality Control of Raw ReadsIn order to ensure that there were no issues with the raw fastqsequencing reads, quality control was performed using FastQC
(version 0.11.9, Andrews, 2019). Metrics that were required topass in this step for the reads to be included in downstreamanalysis were “per base sequence quality,” “per tile sequencequality,” “per sequence quality scores,” “per base N content,”and “sequence length distribution.” FastQC metrics that wereexpected to fail for raw reads or for RNA-Seq were “perbase sequence content,” “per sequence GC content,” “sequenceduplication levels,” “overrepresented sequences,” and “adaptercontent.” Highly abundant sequences in RNA-Seq caused thepercentage of each base to deviate from the expected 25%frequency (Sheng et al., 2017). The per sequence GC contentwas narrower due to overexpression of certain sequences, acharacteristic of RNA-Seq. More than one peak in GC contentwas observed as there are different types, and therefore lengths,of small RNA (Sheng et al., 2017). The miARma-Seq tool onlyannotates miRNAs therefore other small RNA were excludedfrom our analysis (Sheng et al., 2017). The level of duplicationof sequences and overrepresented sequences metric failed asexpected due to the large sequence overrepresentation andfew unique sequences present in RNA-Seq reads. Refer to theSupplementary Methods for the configuration file used to runthis analysis (precutadapt_fastqc_configfile.ini).
Adapter Removal and Quality Filtering of Raw ReadsAdapter removal and filtering was performed usingcutadapt (version 2.10; used under python3.8; Martin,2011). The adapter was removed and any bases less thana quality score of 28 (high quality) were trimmed (refer tomay7_cutadapt2.10adapter_removal_and_trimming.sh in theSupplementary Methods). Next, sequencing files were furtherfiltered to remove any sequences shorter than 18 bases orlonger than 35 bases, as they are not considered useful inmiRNA analysis (Andrés-León and Rojas, 2019; refer tomay7_cutadapt2.10sizetrim.sh in the Supplementary Methods).
Quality Control of Trimmed ReadsFastQC analysis was performed again on the trimmed reads toensure that only sequences with quality scores greater than 28,with lengths between 18 and 35 bases, and with no adapters werepresent. The configuration file is available in the SupplementaryMethods (postcutadapt_fastqc_configfile.ini).
Alignment, Annotation, and Read CountingThe de novo approach of the miARma-Seq pipeline was usedsince no rainbow trout miRNAs are present in the mirbase.orgdatabase. Reads were aligned to the rainbow trout genome,annotated using Salmo salar miRNA (closest salmonid relativein mirbase.org), due to the conservation in miRNA sequenceidentity between fish species (Salem et al., 2010), and counted.Viral miRNAs were excluded from differential expression analysisthough they can share a seed sequence with eukaryotic miRNAs,as there is not full sequence similarity (Kincaid et al., 2012; Guoand Steitz, 2014; Mishra et al., 2020). Therefore, they would notbe annotated and counted. Alignment was performed withinmiARma-Seq using bowtie1 (version 1.1.1) and annotation andread counting using mirDeep2 (2.0.1.2) (Langmead et al., 2009;
Frontiers in Physiology | www.frontiersin.org 4 January 2021 | Volume 11 | Article 588313

fphys-11-588313 January 4, 2021 Time: 15:59 # 5
Ikert et al. Stress Alters Non-lethally Sampled MicroRNA
Friedländer et al., 2012). Workflow and parameters areoutlined in the miARma-Seq configuration file (SupplementaryMethods – miARmaseq_denovo_ssa_configfile.ini).
For alignment and annotation, a bowtie1 indexwas created from the rainbow trout genome(GCF_002163495.1_Omyk_1.0_genomic.fna; downloadedApril 9, 2019). The bowtie index is available at https://doi.org/10.6084/m9.figshare.12459905.v2 (Ikert, 2020a).Additional bowtie parameters were added to allow for onlyone mismatch (default is two) and to only report the bestalignment, according to recommendations by Tam et al. (2015).The miARma-Seq script defaults were used for all remainingmiRDeep2 tools (for description of arguments)1. Also, it iscrucial to note that miRDeep2 will count reads that originatefrom different precursors twice. miARma-Seq corrects for this byaveraging the number of counts of mature miRNA from differentprecursors so that all the tags (miRNAs) are unique in the readcount file. This allows for more accurate differential expressionanalysis. Quality control of the alignment, annotation, and readcounting was performed by referring to the stats and log files,ensuring that no errors were present, and that the percentage ofreads aligned versus unaligned were reasonable.
Differential Expression of MicroRNAIn order to identify miRNAs that were differentially expressed,the read count file from miARma-Seq was analyzed by usingboth edgeR and DESeq2 (Robinson and Smyth, 2007, 2008;Robinson and Oshlack, 2010; Robinson et al., 2010; McCarthyet al., 2012; Chen et al., 2014; Love et al., 2014; Zhou et al., 2014;Lun et al., 2016). These are tools recommended and validatedfor differential expression analysis for studies with a sample sizeof three and are able to detect effect sizes of a log-fold changegreater than two (2.0) (Schurch et al., 2016). Since they both havewell-developed models for analyzing RNA-Seq files and to avoidmissing true positives, which is a concern in multiple comparisontesting, both tools were used to create a list of differentiallyexpressed miRNA for each matrix (Yendrek et al., 2012). Itwas expected that each tool would produce unique resultsbecause each conduct their analysis differently. edgeR normalizessequencing reads by using the TMM (trimmed mean of m-values)method and filters using a nominal, user-defined CPM (counts-per-million) (Robinson and Oshlack, 2010). DESeq2 normalizessequencing reads using a median of ratios method and filtersby determining the optimal CPM threshold from several testedthreshold values (Anders and Huber, 2010; Love et al., 2014).Scripts used for each of these tools and versions of packages foreach are found in the Supplementary Methods (script_deseq2.Rand script_edgeR.R).
For edgeR analysis, the read count file was split by sampletype so that library normalization would not be affected by typesof matrices. Samples were normalized by treatment groups andinternally calculated lowly expressed genes were filtered. MDSplots were used to ensure that samples separated by treatment.Exact edgeR tests were conducted for mucus and plasma because
1https://github.com/rajewsky-lab/mirdeep2
they have two treatment groups (control vs. stressed) and samplesare not paired since they were collected from separate fish ineach treatment (Figure 1). For water, since the control andstressed samples were collected from the same tank of water,samples were paired. Therefore, data for water were analyzed byuse of a generalized linear model using the fish number as theblocking factor. All results were exported after being sorted byfalse discovery rate (FDR) to identify significantly differentiallyexpressed miRNA.
For analysis using DESeq2, the read count file was split bysample type so that library normalization would not be affectedby types of samples. Following this, the DESeq2 data set wascreated from the matrix of read counts. This step filters andnormalizes the read counts. For plasma and mucus, the designwas solely based on the treatment (control vs. stressed), but dueto the paired nature of the water samples, the fish number wasadded in as the blocking factor. These DESeq2 datasets were usedto conduct differential expression analysis. Results were obtainedand ordered via adjusted p-value (equivalent to false discoveryrate) and exported to identify significant results.
Statistical significance for differentially expressed miRNA wasdefined as miRNA with p values ≤ 0.05, adjusted p valuesor false discovery rates (FDR) <0.1, and log fold changesgreater than 2 and less than −2. These cutoffs were chosenbased on acceptable thresholds for RNA-Seq data and by theamount of false positives we allowed to ensure reliable datawhile minimizing false negative results (Renthal et al., 2018).The data produced in this study have been deposited inNCBI’s Gene Expression Omnibus and are accessible throughGEO Series accession number GSE151138 (Edgar et al., 2002;Barrett et al., 2013).
Target Prediction and Pathway Analysis ofDifferentially Expressed Plasma MicroRNAThe differentially expressed miRNAs in plasma samples wereused to predict 3′UTR targets in silico for Salmo salar(the closest related species present in KEGG and DAVIDdatabases) using the miRanda command line tool (Enrightet al., 2003; Berthelot et al., 2014; Lien et al., 2016). miRandauses sequence alignment based on complementarity and RNAstability of the binding (Zuker and Stiegler, 1981; McCaskill,1990; Hofacker et al., 1994; Enright et al., 2003). Eachknown, significantly differentially expressed miRNA sequencein plasma was input into the miRanda tool and comparedagainst a curated list of Salmo salar 3′ untranslated regions(UTRs) (Lynch, 2020)2. Since predicted miRNAs were notvalidated, novel differentially expressed miRNAs were omittedto improve reliability of the in silico predictions. Only mRNAwith a complementarity score greater than 140 and an energyscore (1 G) less than −20 were used for pathway analysis(Kostyniuk et al., 2019; Cadonic et al., 2020). The script canbe accessed in the Supplementary Methods (one-miRNA-all-3UTR.miranda_analysis.sh).
2https://doi.org/10.6084/m9.figshare.12461969.v1
Frontiers in Physiology | www.frontiersin.org 5 January 2021 | Volume 11 | Article 588313

fphys-11-588313 January 4, 2021 Time: 15:59 # 6
Ikert et al. Stress Alters Non-lethally Sampled MicroRNA
All mRNA targets identified using miRanda were combinedinto a common list and converted to UniProt IDs3. This list wassubmitted to KEGG Search & Color pathway (specifying Salmosalar and UniProt IDs; Kanehisa and Goto, 2000; Kanehisa, 2019;Kanehisa et al., 2019). These results were analyzed for knownresponses to acute stress and to curate a list of percentages ofproteins targeted in pathways to identify enriched pathways. Thecombined Salmo salar UniProt ID list was also uploaded to theDAVID Functional Annotation tool (Huang et al., 2009a,b)4.The recommended options for functional clustering and mediumstringency, as well as a cutoff of an enrichment score of −1.3or less (equivalent to p ≤ 0.05) were used (Huang et al., 2007).This analysis was only performed using altered plasma miRNA,as the biological role of mucus and water miRNA is unknownand pathway analysis of targets would be speculative.
Validation of Differentially ExpressedMicroRNA Using RT-qPCRThe known, differentially expressed microRNA in water samplesidentified using RNA-Seq and subsequent analysis were validatedby measuring expression via RT-qPCR. RNA from separate,non-sequenced plasma, mucus, and water samples was extractedusing the RNA extraction techniques previously mentioned withthe exception of the addition of 3.5 µL of 1.6 × 10⁸ copiesof RNA spike-in (cel-miR-39, Qiagen) following the lysis step.MicroRNA was quantified using the Qubit microRNA Assay kit(Thermo Fisher Scientific). To synthesize cDNA, two methodswere used, converting a common volume of extracted miRNAto cDNA (common volume cDNA) and converting a commonamount of miRNA to cDNA (common amount cDNA) to assessdifferent methods of gene expression normalization (endogenouscontrol U6, cel-39 spike-in RNA, or total amount of small RNA).For common volume cDNA, 12 µL extracted plasma RNA,5 µL extracted mucus RNA, and 12 µL extracted water RNAwere added to their respective reactions (HiSpec buffer; QiagenmiScript II RT kit). For common amount cDNA, 3 ng plasmamiRNA and 140 ng mucus miRNA were added to their respectivereactions (HiSpec buffer; Qiagen miScript II RT kit). No commonamount cDNA was made for water samples. The qPCR reactionsconsisted of 5 µL 2× Bio-Rad SsoAdvanced SYBR, 1 µL of 5 µM
3https://www.uniprot.org/uploadlists/4https://david.ncifcrf.gov/
forward primer (see Table 1), 1 µL of 5 µM Qiagen UniversalReverse Primer, 2 µL RNase-free water, and 1 µL 1:10 dilutedcDNA performed in triplicate. The qPCR protocol consisted ofa one-time polymerase activation step at 95◦C for 30 s, followedby denaturing at 95◦C for 10 s, annealing and extension at 60◦Cfor 20 s, and a plate read, which was repeated for a total of 40cycles. Each qPCR run also included a melt curve analysis whichwas performed by increasing the temperature from 65 to 95◦Cevery 5 s in 0.5◦C increments with a plate read at each increment.Non-template controls were used to ensure no contaminationor primer-dimerization occurred. Expression was calculated byusing the relative quantity (as calculated by the Bio-Rad Maestrosoftware) and then, as appropriate, normalized to one of thefollowing: amount of miRNA input (only possible for commonvolume cDNA), synthetic cel-39 spike-in, and/or the relativequantity of endogenous control U6. Statistical analysis includedtesting for normality and equal variances and performing a one-tailed t-test (p < 0.05, n = 3). For miR-26a-5p, no statisticalanalysis was performed as it was a presence/absence test. Pearsoncorrelation coefficients were calculated to compare RNA-Seqand qPCR results. These values were calculated between thenormalized read counts from the tool (DESeq2, edgeR) thatidentified the miRNA as differentially expressed and the RT-qPCR expression values.
RESULTS
Validation of Stress ResponseTo demonstrate that 3 min out of water in ambient air caused aphysiological response in rainbow trout, plasma cortisol, lactate,and glucose in blood plasma were measured. One-hour postair exposure, a statistically significant 5-fold increase in plasmacortisol, a significant 7-fold increase in plasma lactate, and asignificant 3-fold increase in plasma glucose were measured (one-tailed t-test, n = 3, p < 0.05; Figure 2). Data were normallydistributed and had equal variance.
Sequencing Metadata and in silicoValidationEighteen samples were sequenced, which includes six samples ofplasma, six samples of mucus, and six samples of water (n = 3for each treatment). Water had less total RNA than did plasma
TABLE 1 | Primers used to measure microRNA expression via RT-qPCR.
Name Sample Accession Sequence (5′ to 3′)
ssa-miR-16b-5p Plasma MIMAT0032408 TAGCAGCACGTAAATATTGGTG
ssa-miR-30b-5p Water, Mucus MIMAT0032604 TGTAAACATCCCCGACTGGAAGCT
ssa-miR-26a-5p Water MIMAT0032563 TTCAAGTAATCCAGGATAGGCT
U6 – Forward Plasma, Mucus XR_005037161.1 CTCGCTTCGGCAGCACATA
U6 – Reverse AGGAACGCTTCACGAATTTGC
Ce_miR-39_1 miScript Primer Assay MIMAT0000010 n/a
Qiagen Universal Reverse Primer GAATCGAGCACCAGTTACGC
The sample within which the targets were measured are indicated by the sample column. Where applicable, the miRbase.org or NCBI accession number is included. ThemiRNA sequences were all used as forward primers, with the Qiagen Universal Reverse primer as the reverse primer.
Frontiers in Physiology | www.frontiersin.org 6 January 2021 | Volume 11 | Article 588313

fphys-11-588313 January 4, 2021 Time: 15:59 # 7
Ikert et al. Stress Alters Non-lethally Sampled MicroRNA
FIGURE 2 | Plasma cortisol, lactate, and glucose increased following acute stress. Mean ± SEM of plasma cortisol (A), lactate (B), and glucose (C) before (control)and 1 h after a 3-min air exposure stressor (1 h post-stress) in rainbow trout. Asterisks indicate a significant difference in the measure (n = 3; one-tailed t-test).A single asterisk indicates p ≤ 0.05, double asterisks indicate p ≤ 0.01, and four asterisks indicate p ≤ 0.0001.
or mucus. However, there was no significant difference (two-wayANOVA; nsample = 6, ntreatment = 3; p < 0.05; Figure 3A) betweensamples from control or stressed individuals. Sequencing depthof the samples was between 12 and 30 million reads and didnot differ based on sample type or treatment (two-way ANOVA;nsample = 6, ntreatment = 3; p < 0.05; Figure 3B). Detailed RNAconcentrations and read counts for each sample are availablein the Supplementary Results (RNA concentrations and Readcounts tabs). Heat maps for each sample type and analysisare provided (Heat maps_edgeR and Heat maps_DESeq2 tabs).Quality analysis was performed on raw and processed samplesand the sequences passed all requirements for use in this analysis.Complete FastQC reports can be accessed in the SupplementaryQuality Control File.
All sample types were mapped to the rainbow trout genome,with some variation in the amount mapped by sample type(Figure 3C). Overall, there were between 94 and 182 uniqueknown miRNAs annotated in each sample (SupplementaryResults – Number of microRNA tab). The miRNAs had amedian read length of 23 nucleotides (Figure 3D). The logfile from the alignment, annotation, and read counting throughmiARma-Seq indicated that all steps occurred without any errors.Complete stats and log files from the alignment, annotation,and read counting using miARma-Seq (which uses bowtie1 andmiRDeep2) are available in the Supplementary Results (Stats fileand Log file tabs).
Identification of Differentially ExpressedMicroRNA Using High ThroughputSequencingHigh throughput sequencing and bioinformatic analysis wereused to identify altered miRNA in rainbow trout plasma, mucus,and water in which the fish were held, following acute stress. Thestatistical tools used, edgeR and DESeq2, identified differentially
expressed miRNA and though there were some shared results,most differentially expressed miRNAs identified by each toolare unique to that tool. The read sequences for all known andnovel miRNAs identified in this study are deposited in figshare(Ikert, 2020b)5.
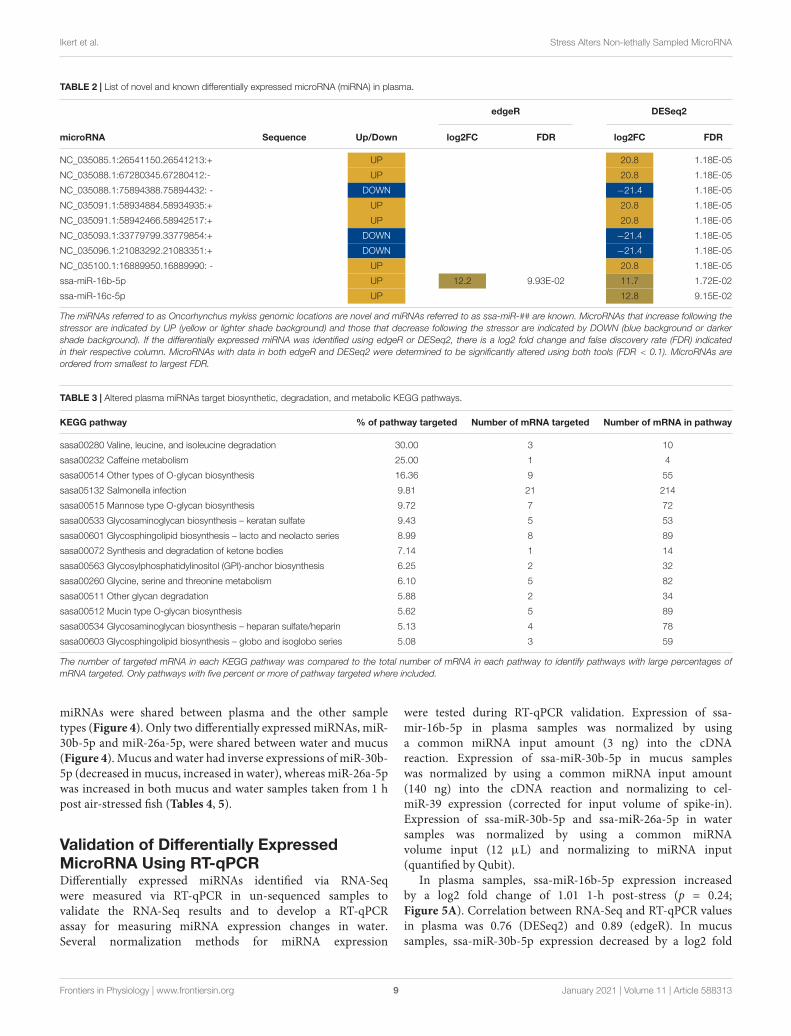
Differentially Expressed Plasma MicroRNA andin silico Target PredictionTen miRNAs were significantly altered in plasma following airexposure (Table 2). Plasma miRNAs increased with a log 2-foldchange between 11 and 21 and miRNAs decreased with a log 2-fold change of−21. Both edgeR and DESeq2 identified miR-16b-5p as significantly altered with an increase of approximately 12-fold following acute stress.
Two known miRNAs, ssa-16b-5p and ssa-16c-5p, wereupregulated with an approximate log 2-fold change of 12following stress (Table 2). These two known miRNAs wereused to predict mRNA targets in silico. The miRanda algorithmpredicted that miR-16b-5p targeted 2517 mRNA and miR-16c-5p targeted 3171 mRNA. These results were combined for geneenrichment (DAVID) and pathway analysis (KEGG) as bothmiRNAs were increased so the targeted mRNA would all bepredicted to decrease. DAVID functional enrichment analysisindicated a statistically significant decrease in transmembraneproteins and their activity (Supplementary Results – DAVIDresults tab). Biosynthetic, degradation, and metabolic KEGGpathways were predicted to be targeted by altered plasmamiRNAs (Table 3). Thirteen mRNA in the adrenergic signalingin cardiomyocytes KEGG pathway were targeted. Specifically,the beta-2-adrenergic receptor, which binds adrenaline andnoradrenaline, was predicted to be downregulated via miR-16b-5p and miR-16c-5p. Complete results from miRanda targetprediction, KEGG pathway analysis, and DAVID functional
5https://doi.org/10.6084/m9.figshare.12974792.v1
Frontiers in Physiology | www.frontiersin.org 7 January 2021 | Volume 11 | Article 588313

fphys-11-588313 January 4, 2021 Time: 15:59 # 8
Ikert et al. Stress Alters Non-lethally Sampled MicroRNA
FIGURE 3 | Sequencing metadata. Mean ± SEM of (A) extracted RNA concentrations (ng/µL) and (B) number of sequencing reads from plasma, mucus, and watersamples. Extracted RNA concentrations did not differ between treatments within each sample, but did differ as a function of sample type, with water beingsignificantly less than those of plasma and mucus. Number of reads did not differ among treatments or sample type. Significant differences among samplesindicated by an asterisk (two-way ANOVA, nsample = 6, ntreatment = 3, p ≤ 0.05). Box plot (C) of the percentage of sequencing reads mapped to the rainbow troutgenome by miRDeep2. Minimum, first quartile, median, third quartile, and maximum are indicated by the horizontal lines (when reading from bottom to top). Outliersare indicated by a filled square. Histogram (D) of the number of sequencing reads at each read length between 18 and 35 nucleotides.
enrichment analysis can be found in the SupplementaryResults (miRanda results 16b-5p, miRanda results 16c-5p,miRanda combined UniProt, KEGG results, KEGG percentagesof pathways tabs).
Differentially Expressed MicroRNA in MucusAbundances of sixteen miRNAs were significantly altered inmucus following the stress caused by being out of water(Table 4). Seven known miRNAs were altered following stress(Table 4). Differentially expressed mucus miRNAs increased witha magnitude between a log2 fold change of 8 and 30 and decreasedwith a magnitude between a log2 fold change of−9 and−28. OnemiRNA, miR-26a5p, was identified by both edgeR and DESeq2 toincrease by a log2 fold change of 15.
Differentially Expressed MicroRNA in WaterAbundances of seventy miRNAs were significantly altered inwater following stress (Tables 5, 6). Twelve known miRNAs wereupregulated following stress (Table 5). Differentially expressedmiRNAs in water increased between a log2 fold change between7 and 20 and decreased with a log2 fold change between −3 and−30. Six miRNAs, five known and one novel, were identified byboth edgeR and DESeq2 to be differentially expressed.
Comparison of Known Differentially ExpressedMicroRNA in All Sample TypesDifferentially expressed miRNAs were compared across sampletypes (plasma, mucus, water) to understand whether alteredmiRNA profiles are conserved between sample types. No altered
Frontiers in Physiology | www.frontiersin.org 8 January 2021 | Volume 11 | Article 588313
fphys-11-588313 January 4, 2021 Time: 15:59 # 9
Ikert et al. Stress Alters Non-lethally Sampled MicroRNA
TABLE 2 | List of novel and known differentially expressed microRNA (miRNA) in plasma.
edgeR DESeq2
microRNA Sequence Up/Down log2FC FDR log2FC FDR
NC_035085.1:26541150.26541213:+ UP 20.8 1.18E-05
NC_035088.1:67280345.67280412:- UP 20.8 1.18E-05
NC_035088.1:75894388.75894432: - DOWN −21.4 1.18E-05
NC_035091.1:58934884.58934935:+ UP 20.8 1.18E-05
NC_035091.1:58942466.58942517:+ UP 20.8 1.18E-05
NC_035093.1:33779799.33779854:+ DOWN −21.4 1.18E-05
NC_035096.1:21083292.21083351:+ DOWN −21.4 1.18E-05
NC_035100.1:16889950.16889990: - UP 20.8 1.18E-05
ssa-miR-16b-5p UP 12.2 9.93E-02 11.7 1.72E-02
ssa-miR-16c-5p UP 12.8 9.15E-02
The miRNAs referred to as Oncorhynchus mykiss genomic locations are novel and miRNAs referred to as ssa-miR-## are known. MicroRNAs that increase following thestressor are indicated by UP (yellow or lighter shade background) and those that decrease following the stressor are indicated by DOWN (blue background or darkershade background). If the differentially expressed miRNA was identified using edgeR or DESeq2, there is a log2 fold change and false discovery rate (FDR) indicatedin their respective column. MicroRNAs with data in both edgeR and DESeq2 were determined to be significantly altered using both tools (FDR < 0.1). MicroRNAs areordered from smallest to largest FDR.
TABLE 3 | Altered plasma miRNAs target biosynthetic, degradation, and metabolic KEGG pathways.
KEGG pathway % of pathway targeted Number of mRNA targeted Number of mRNA in pathway
sasa00280 Valine, leucine, and isoleucine degradation 30.00 3 10
sasa00232 Caffeine metabolism 25.00 1 4
sasa00514 Other types of O-glycan biosynthesis 16.36 9 55
sasa05132 Salmonella infection 9.81 21 214
sasa00515 Mannose type O-glycan biosynthesis 9.72 7 72
sasa00533 Glycosaminoglycan biosynthesis – keratan sulfate 9.43 5 53
sasa00601 Glycosphingolipid biosynthesis – lacto and neolacto series 8.99 8 89
sasa00072 Synthesis and degradation of ketone bodies 7.14 1 14
sasa00563 Glycosylphosphatidylinositol (GPI)-anchor biosynthesis 6.25 2 32
sasa00260 Glycine, serine and threonine metabolism 6.10 5 82
sasa00511 Other glycan degradation 5.88 2 34
sasa00512 Mucin type O-glycan biosynthesis 5.62 5 89
sasa00534 Glycosaminoglycan biosynthesis – heparan sulfate/heparin 5.13 4 78
sasa00603 Glycosphingolipid biosynthesis – globo and isoglobo series 5.08 3 59
The number of targeted mRNA in each KEGG pathway was compared to the total number of mRNA in each pathway to identify pathways with large percentages ofmRNA targeted. Only pathways with five percent or more of pathway targeted where included.
miRNAs were shared between plasma and the other sampletypes (Figure 4). Only two differentially expressed miRNAs, miR-30b-5p and miR-26a-5p, were shared between water and mucus(Figure 4). Mucus and water had inverse expressions of miR-30b-5p (decreased in mucus, increased in water), whereas miR-26a-5pwas increased in both mucus and water samples taken from 1 hpost air-stressed fish (Tables 4, 5).
Validation of Differentially ExpressedMicroRNA Using RT-qPCRDifferentially expressed miRNAs identified via RNA-Seqwere measured via RT-qPCR in un-sequenced samples tovalidate the RNA-Seq results and to develop a RT-qPCRassay for measuring miRNA expression changes in water.Several normalization methods for miRNA expression
were tested during RT-qPCR validation. Expression of ssa-mir-16b-5p in plasma samples was normalized by usinga common miRNA input amount (3 ng) into the cDNAreaction. Expression of ssa-miR-30b-5p in mucus sampleswas normalized by using a common miRNA input amount(140 ng) into the cDNA reaction and normalizing to cel-miR-39 expression (corrected for input volume of spike-in).Expression of ssa-miR-30b-5p and ssa-miR-26a-5p in watersamples was normalized by using a common miRNAvolume input (12 µL) and normalizing to miRNA input(quantified by Qubit).
In plasma samples, ssa-miR-16b-5p expression increasedby a log2 fold change of 1.01 1-h post-stress (p = 0.24;Figure 5A). Correlation between RNA-Seq and RT-qPCR valuesin plasma was 0.76 (DESeq2) and 0.89 (edgeR). In mucussamples, ssa-miR-30b-5p expression decreased by a log2 fold
Frontiers in Physiology | www.frontiersin.org 9 January 2021 | Volume 11 | Article 588313

fphys-11-588313 January 4, 2021 Time: 15:59 # 10
Ikert et al. Stress Alters Non-lethally Sampled MicroRNA
TABLE 4 | List of novel and known differentially expressed microRNA (miRNA) in mucus.
edgeR DESeq2
microRNA Sequence Up/Down log2FC FDR log2FC FDR
NC_035085.1:61423757.61423832:- UP 29.8 3.73E-14
ssa-miR-30b-5p DOWN −27.7 7.88E-13
NC_035101.1:13572153.13572243: - DOWN −22.7 3.94E-07
NC_035092.1:51254681.51254742:+ DOWN −22.2 6.41E-07
NC_035097.1:4654575.4654638:+ DOWN −21.9 8.55E-07
NC_035083.1:7009417.7009490:+ UP 21.6 1.02E-06
NC_035078.1:25630487.25630534: - UP 21.4 1.23E-06
ssa-miR-26a-5p UP 15.2 6.38E-03 14.4 2.40E-05
ssa-let-7b-5p DOWN −11.6 2.03E-02
ssa-miR-125a-5p DOWN −11.4 2.06E-02
ssa-miR-24a-3p UP 10.4 5.42E-02
ssa-miR-142a-5p DOWN −10 7.52E-02
NC_035083.1:76251544.76251598: - DOWN −9.6 7.81E-02
NC_035094.1:43812635.43812699: - UP 8.3 8.09E-02
NC_035097.1:4654529.4654594:+ DOWN −9.2 9.91E-02
ssa-miR-26d-5p DOWN −9.6 7.76E-02
The miRNAs referred to as Oncorhynchus mykiss genomic locations are novel and miRNAs referred to as ssa-miR-## are known. MicroRNAs that increase following thestressor are indicated by UP (yellow or lighter shade background) and those that decrease following the stressor are indicated by DOWN (blue background or darkershade background). If the differentially expressed miRNA was identified using edgeR or DESeq2, there is a log2 fold change and false discovery rate (FDR) indicatedin their respective column. MicroRNAs with data in both edgeR and DESeq2 were determined to be significantly altered using both tools (FDR < 0.1). MicroRNAs areordered from smallest to largest FDR.
TABLE 5 | List of known differentially expressed microRNA (miRNA) in water.
edgeR DESeq2
microRNA Up/Down log2FC FDR log2FC FDR
ssa-miR-30b-5p UP 14.5 2.75E-05 11.54 2.36E-03
ssa-miR-26a-5p UP 12.62 9.07E-03
ssa-miR-128-4-5p UP 13.29 4.83E-05 10.34 9.93E-03
ssa-miR-125b-5p UP 10.15 1.12E-02
ssa-miR-27c-3p UP 13.1 4.83E-05 10.14 1.12E-02
ssa-miR-27c-5p UP 13.1 4.83E-05 10.14 1.12E-02
ssa-miR-16a-5p UP 9.4 2.33E-02
ssa-miR-128-2-5p UP 8.83 3.71E-02
ssa-miR-128-3-5p UP 8.83 3.71E-02
ssa-miR-26b-5p DOWN −5.69 1.47E-07 −5.77 8.51E-02
ssa-let-7d-3p UP 8.71 4.46E-03
ssa-miR-29a-5p UP 7.41 4.17E-02
MicroRNAs that increase following the stressor are indicated by UP (yellow or lighter shade background) and those that decrease following the stressor are indicated byDOWN (blue background or darker shade background). If the differentially expressed miRNA was identified using edgeR or DESeq2, there is a log2 fold change and falsediscovery rate (FDR) indicated in their respective column. MicroRNAs with data in both edgeR and DESeq2 were determined to be significantly altered using both tools.MicroRNAs are ordered from smallest to largest FDR.
change of −1.40 1-h post stress (p = 0.054; Figure 5B).Correlation between RNA-Seq and RT-qPCR values in mucus was−0.17 (DESeq2). In water samples, ssa-miR-30b-5p expressionincreased by a log2 fold change of 2.05 (p = 0.0061) 1-hpost-stress (Figure 5C). In addition, ssa-miR-26a-5p was onlymeasured in the stressed samples (present) and was absent inthe control samples (Figure 5D). Correlation between RNA-Seq and RT-qPCR values in water was 0.93 (DESeq2) and 0.94(edgeR) for miR-30b and 0.98 (DESeq2) for miR-26a. Relative
expression and calculations are found in the SupplementaryResults (qPCR_results tab).
DISCUSSION
The objective of this study was to understand how microRNAs ofrainbow trout are altered in plasma, mucus, and water in responseto acute stress. The changes in plasma miRNA expression 1-h
Frontiers in Physiology | www.frontiersin.org 10 January 2021 | Volume 11 | Article 588313

fphys-11-588313 January 4, 2021 Time: 15:59 # 11
Ikert et al. Stress Alters Non-lethally Sampled MicroRNA
TABLE 6 | List of novel differentially expressed microRNA (miRNA) in water.
edgeR DESeq2
microRNA Up/Down log2FC FDR log2FC FDR
NC_035091.1:38285981.38286031:- DOWN −30.00 4.48E-15
NW_018553268.1:46749.46815: - DOWN −30.00 4.48E-15
NW_018553268.1:50634.50700: - DOWN −30.00 4.48E-15
NC_035103.1:8461012.8461090: - DOWN −29.53 1.03E-14
NC_035088.1:59475872.59475914: - DOWN −17.86 4.69E-07
NW_018586303.1:4270.4365: - UP 20.25 8.26E-07
NC_035077.1:28628390.28628451:+ UP 15.46 1.37E-05
NC_035077.1:28628392.28628451:+ DOWN −17.71 1.37E-05
NC_035078.1:58142056.58142117:+ UP 15.46 1.37E-05
NC_035078.1:58142058.58142117:+ DOWN −17.71 1.37E-05
NC_035087.1:193452.193514:+ DOWN −16.4 5.81E-05
NC_035078.1:79936510.79936599:+ DOWN −13.04 2.64E-03
NC_035093.1:40341222.40341275:+ DOWN −10.61 2.33E-02
NC_035105.1:28003733.28003771:+ DOWN −10.53 2.33E-02
NC_035093.1:20336754.20336817: - DOWN −9.83 4.38E-02
NC_035081.1:25546959.25547017: - UP 11.3 6.95E-05 8.31 6.90E-02
NC_035093.1:20338603.20338666: - DOWN −8.91 9.65E-02
NC_035091.1:24851800.24851884:+ DOWN −8.82 9.88E-02
NC_035077.1:6400391.6400472: - DOWN −3.66 3.50E-04
NC_035085.1:41468002.41468063:+ UP 6.99 7.08E-02
NC_035086.1:39319785.39319840: - UP 8.03 1.62E-02
NC_035088.1:63936169.63936225: - UP 7.69 2.65E-02
NC_035097.1:19576344.19576407:+ UP 7.37 4.17E-02
NC_035098.1:18940944.18941013:+ DOWN −3.25 2.99E-03
NC_035100.1:18059421.18059494:+ DOWN −3.42 8.85E-04
MicroRNAs that increase following the stressor are indicated by UP (yellow or lighter shade background) and those that decrease following the stressor are indicated byDOWN (blue or darker shade background). If the differentially expressed miRNA was identified using edgeR or DESeq2, there is a log2 fold change and false discoveryrate (FDR) indicated in their respective column. MicroRNAs with data in both edgeR and DESeq2 were determined to be significantly altered using both tools. MicroRNAsare ordered from smallest to largest FDR.
post stressor were determined. MicroRNAs were isolated fromepidermal mucus and surrounding water. Alterations in relativeamounts of miRNAs were observed in both mucus and waterfollowing acute stress. One-hour after acute stress there were onlytwo significantly altered miRNAs that were identified in bothmucus and adjacent water.
Role of Plasma MicroRNA inPhysiological Responses to StressFollowing acute stress, seven miRNAs in plasma wereupregulated, and three miRNAs were downregulated. Thisis the first identification of all miRNAs in blood plasma followingacute stress of a teleost. The current study was restrictedto examining the profile of miRNAs in plasma at a singletime. Additional studies are required to further describe thedynamics or responses of miRNAs to stressor time points within1 h, when cortisol is increasing, and after 1 h, as the stressresponse is decreasing.
The altered profile of miRNAs in plasma was used to performpathway analyses in silico to identify putative targets of miRNA.That analysis identified targeted pathways of biosynthesis,degradation, and metabolism. None of the targets are associated
with well-known molecular stress response signaling, such as theglucocorticoid receptor (Ducouret et al., 1995). However, miR-16b-5p and miR-16c-5p were predicted to cause a decrease inthirteen targets of the adrenergic signaling in cardiomyocytes,including receptors for adrenaline and noradrenaline, thecatecholamines that increase within seconds to minutes of theacute stress response, which would be predicted to be less activeat 1-h post stress (Randall and Ferry, 1992; Wendelaar Bonga,1997; Tort, 2013). These results are in silico predictions andthe ability of miR-16b-5p and miR-16c-5p to target the mRNAwould need to be validated by use of 3′UTR luciferase assays(Zeng and Cullen, 2003). Predictions made in silico duringthe current study are useful in developing future hypothesesto further understanding of how acute responses to stress areregulated in fishes.
Benefits and Limitations of EachNon-lethal Sampling LocationMicroRNAs in plasma, mucus, and water can all be collectednon-lethally, but each sample type has benefits and limitations.These are discussed here in order to provide applications andadvise areas of future study of altered miRNAs in each of these
Frontiers in Physiology | www.frontiersin.org 11 January 2021 | Volume 11 | Article 588313

fphys-11-588313 January 4, 2021 Time: 15:59 # 12
Ikert et al. Stress Alters Non-lethally Sampled MicroRNA
FIGURE 4 | A Venn diagram of all differentially expressed microRNA in each sample type. Differentially expressed miRNAs (p ≤ 0.05, FDR < 0.1, log foldchange < |2|) shared between each sample type are indicated by the overlap of the circle and by the number of miRNAs that are shared. Altered miRNA profileswere mostly unique to matrix type.
FIGURE 5 | RT-qPCR expression of differentially expressed miRNAs. Mean expression ± SEM of (A) ssa-miR-16b-5p in plasma, (B) ssa-miR-30b-5p in mucus, (C)ssa-miR-30b-5p in water, and (D) ssa-miR-26a-5p in water. Significant different between treatments indicated by asterisks (one-tailed t-test, n = 3, p < 0.05).
sample types. For both plasma and mucus, miRNA can beassociated with specific fish being sampled. However, fish mustbe caught and handled, which is invasive and time consumingand can confound the acute stress response (Brydges et al., 2009).Measurements of miRNA in plasma have the benefit of beingassociated with internal tissue responses as biomarkers of disease
states (Cui and Cui, 2020). However, non-lethal sampling ofblood from fish for identification and quantification of miRNAconservatively requires a minimum fish mass of 500 g. Thisis due to the most conservative, non-lethal blood samplingguideline to take no more than 1 mL blood per 1 kg of totalfish mass and the requirement of 0.5 mL of blood to collect the
Frontiers in Physiology | www.frontiersin.org 12 January 2021 | Volume 11 | Article 588313
fphys-11-588313 January 4, 2021 Time: 15:59 # 13
Ikert et al. Stress Alters Non-lethally Sampled MicroRNA
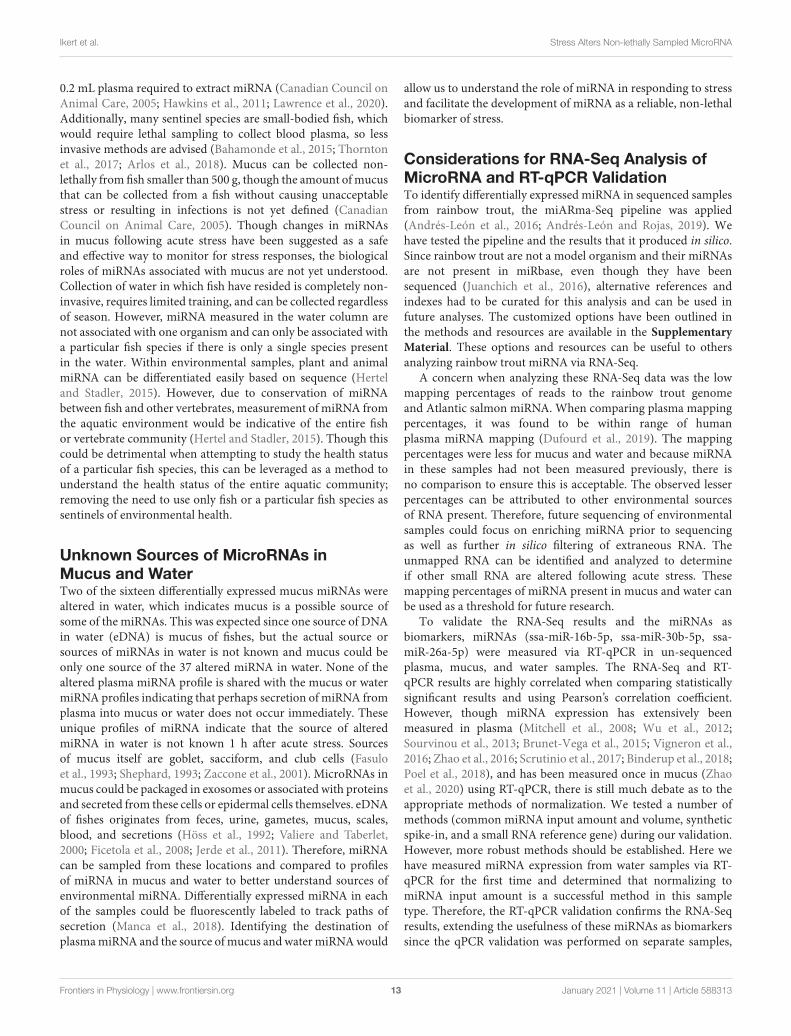
0.2 mL plasma required to extract miRNA (Canadian Council onAnimal Care, 2005; Hawkins et al., 2011; Lawrence et al., 2020).Additionally, many sentinel species are small-bodied fish, whichwould require lethal sampling to collect blood plasma, so lessinvasive methods are advised (Bahamonde et al., 2015; Thorntonet al., 2017; Arlos et al., 2018). Mucus can be collected non-lethally from fish smaller than 500 g, though the amount of mucusthat can be collected from a fish without causing unacceptablestress or resulting in infections is not yet defined (CanadianCouncil on Animal Care, 2005). Though changes in miRNAsin mucus following acute stress have been suggested as a safeand effective way to monitor for stress responses, the biologicalroles of miRNAs associated with mucus are not yet understood.Collection of water in which fish have resided is completely non-invasive, requires limited training, and can be collected regardlessof season. However, miRNA measured in the water column arenot associated with one organism and can only be associated witha particular fish species if there is only a single species presentin the water. Within environmental samples, plant and animalmiRNA can be differentiated easily based on sequence (Herteland Stadler, 2015). However, due to conservation of miRNAbetween fish and other vertebrates, measurement of miRNA fromthe aquatic environment would be indicative of the entire fishor vertebrate community (Hertel and Stadler, 2015). Though thiscould be detrimental when attempting to study the health statusof a particular fish species, this can be leveraged as a method tounderstand the health status of the entire aquatic community;removing the need to use only fish or a particular fish species assentinels of environmental health.
Unknown Sources of MicroRNAs inMucus and WaterTwo of the sixteen differentially expressed mucus miRNAs werealtered in water, which indicates mucus is a possible source ofsome of the miRNAs. This was expected since one source of DNAin water (eDNA) is mucus of fishes, but the actual source orsources of miRNAs in water is not known and mucus could beonly one source of the 37 altered miRNA in water. None of thealtered plasma miRNA profile is shared with the mucus or watermiRNA profiles indicating that perhaps secretion of miRNA fromplasma into mucus or water does not occur immediately. Theseunique profiles of miRNA indicate that the source of alteredmiRNA in water is not known 1 h after acute stress. Sourcesof mucus itself are goblet, sacciform, and club cells (Fasuloet al., 1993; Shephard, 1993; Zaccone et al., 2001). MicroRNAs inmucus could be packaged in exosomes or associated with proteinsand secreted from these cells or epidermal cells themselves. eDNAof fishes originates from feces, urine, gametes, mucus, scales,blood, and secretions (Höss et al., 1992; Valiere and Taberlet,2000; Ficetola et al., 2008; Jerde et al., 2011). Therefore, miRNAcan be sampled from these locations and compared to profilesof miRNA in mucus and water to better understand sources ofenvironmental miRNA. Differentially expressed miRNA in eachof the samples could be fluorescently labeled to track paths ofsecretion (Manca et al., 2018). Identifying the destination ofplasma miRNA and the source of mucus and water miRNA would
allow us to understand the role of miRNA in responding to stressand facilitate the development of miRNA as a reliable, non-lethalbiomarker of stress.
Considerations for RNA-Seq Analysis ofMicroRNA and RT-qPCR ValidationTo identify differentially expressed miRNA in sequenced samplesfrom rainbow trout, the miARma-Seq pipeline was applied(Andrés-León et al., 2016; Andrés-León and Rojas, 2019). Wehave tested the pipeline and the results that it produced in silico.Since rainbow trout are not a model organism and their miRNAsare not present in miRbase, even though they have beensequenced (Juanchich et al., 2016), alternative references andindexes had to be curated for this analysis and can be used infuture analyses. The customized options have been outlined inthe methods and resources are available in the SupplementaryMaterial. These options and resources can be useful to othersanalyzing rainbow trout miRNA via RNA-Seq.
A concern when analyzing these RNA-Seq data was the lowmapping percentages of reads to the rainbow trout genomeand Atlantic salmon miRNA. When comparing plasma mappingpercentages, it was found to be within range of humanplasma miRNA mapping (Dufourd et al., 2019). The mappingpercentages were less for mucus and water and because miRNAin these samples had not been measured previously, there isno comparison to ensure this is acceptable. The observed lesserpercentages can be attributed to other environmental sourcesof RNA present. Therefore, future sequencing of environmentalsamples could focus on enriching miRNA prior to sequencingas well as further in silico filtering of extraneous RNA. Theunmapped RNA can be identified and analyzed to determineif other small RNA are altered following acute stress. Thesemapping percentages of miRNA present in mucus and water canbe used as a threshold for future research.
To validate the RNA-Seq results and the miRNAs asbiomarkers, miRNAs (ssa-miR-16b-5p, ssa-miR-30b-5p, ssa-miR-26a-5p) were measured via RT-qPCR in un-sequencedplasma, mucus, and water samples. The RNA-Seq and RT-qPCR results are highly correlated when comparing statisticallysignificant results and using Pearson’s correlation coefficient.However, though miRNA expression has extensively beenmeasured in plasma (Mitchell et al., 2008; Wu et al., 2012;Sourvinou et al., 2013; Brunet-Vega et al., 2015; Vigneron et al.,2016; Zhao et al., 2016; Scrutinio et al., 2017; Binderup et al., 2018;Poel et al., 2018), and has been measured once in mucus (Zhaoet al., 2020) using RT-qPCR, there is still much debate as to theappropriate methods of normalization. We tested a number ofmethods (common miRNA input amount and volume, syntheticspike-in, and a small RNA reference gene) during our validation.However, more robust methods should be established. Here wehave measured miRNA expression from water samples via RT-qPCR for the first time and determined that normalizing tomiRNA input amount is a successful method in this sampletype. Therefore, the RT-qPCR validation confirms the RNA-Seqresults, extending the usefulness of these miRNAs as biomarkerssince the qPCR validation was performed on separate samples,
Frontiers in Physiology | www.frontiersin.org 13 January 2021 | Volume 11 | Article 588313
fphys-11-588313 January 4, 2021 Time: 15:59 # 14
Ikert et al. Stress Alters Non-lethally Sampled MicroRNA
and highlighting the potential to develop more robustmethods of measuring miRNA expression in plasma, mucus,and water samples.
Future Development of MicroRNA asNon-lethal Indicators of StressSince changes in expression patterns of miRNA in blood, mucus,and water following acute stress in rainbow trout were observed,this work can be expanded by measuring changes in miRNA inresponse to other stressors and in other aquatic organisms totest the conservation of the miRNA response. Due to the abilityto non-lethally measure miRNA and the potential functionalrelationships to internal mRNA changes, blood, mucus, and/orwater miRNA could be developed as biomarkers of stress in fishand the aquatic environment. The benefit to developing miRNAas indicators of fish stress is that in tissues, specific miRNAs arealtered in response to specific stressors (ex., Gonçalves et al.,2020; Liu et al., 2020a,b; Qiang et al., 2020). Therefore, if thisis true in non-lethal samples, non-lethally collected miRNA canprovide not only an early indicator of fish stress but also providean indicator of what type of fish stress (ex., temp, metals) isbeing experienced, allowing for earlier, targeted remediation tobe implemented. Due to the current collection and analysis ofDNA in the water being termed environmental DNA (eDNA),we propose that measurements of miRNA in water be termedenvironmental miRNA (e-microRNA or e-miRNA). E-miRNAcan currently be extracted from the same water samples or filterused in eDNA collection and can potentially be developed as amethod of simultaneously measuring fish stress as well as fishspecies present.
DATA AVAILABILITY STATEMENT
The datasets presented in this study can be found in onlinerepositories. The names of the repository/repositories andaccession number(s) can be found below: the NCBI GeneExpression Omnibus (GSE151138).
ETHICS STATEMENT
The animal study was reviewed and approved by the Animal CareCommittee – University of Waterloo.
AUTHOR CONTRIBUTIONS
HI conducted the experimental design, collected and analyzeddata, and wrote the manuscript. ML assisted in bioinformaticdata analysis and edited the manuscript. MS, AD, and JGacquired grant funding. BK acquired funding and edited themanuscript. PC acquired funding, assisted in experimental designand manuscript writing, and edited the manuscript. All authorscontributed to the article and approved the submitted version.
FUNDING
This research was funded through the Global Water FuturesGrant #419205. HI is supported by an NSERC PGS-D.
ACKNOWLEDGMENTS
The authors thank Nathan Bennoit, Ivan Cadonic, HumingGuo, Dilpreet Matharu, Nicolas Mourad, Tina Papazotos,and Karyn Robichaud for their help conducting the rainbowtrout air exposures.
SUPPLEMENTARY MATERIAL
The Supplementary Material for this article can be foundonline at: https://www.frontiersin.org/articles/10.3389/fphys.2020.588313/full#supplementary-material
REFERENCESAnders, S., and Huber, W. (2010). Differential expression analysis for
sequence count data. Genome Biol. 11:R106. doi: 10.1186/gb-2010-11-10-r106
Andrés-León, E., Núñez-Torres, R., and Rojas, A. M. (2016). miARma-Seq: acomprehensive tool for miRNA, mRNA and circRNA analysis. Sci. Rep. 6:25749.doi: 10.1038/srep25749
Andrés-León, E., and Rojas, A. M. (2019). miARma-Seq, a comprehensive pipelinefor the simultaneous study and integration of miRNA and mRNA expressiondata. Methods 152, 31–40. doi: 10.1016/j.ymeth.2018.09.002
Andrews, S. (2019). Babraham Bioinformatics - FastQC A Quality Controltool for High Throughput Sequence Data. Available online at: https://www.bioinformatics.babraham.ac.uk/projects/fastqc/ (accessed June 5, 2020).
Arlos, M. J., Parker, W. J., Bicudo, J. R., Law, P., Hicks, K. A., Fuzzen, M. L. M.,et al. (2018). Modeling the exposure of wild fish to endocrine active chemicals:potential linkages of total estrogenicity to field-observed intersex. Water Res.139, 187–197. doi: 10.1016/j.watres.2018.04.005
Arroyo, J. D., Chevillet, J. R., Kroh, E. M., Ruf, I. K., Pritchard, C. C., Gibson,D. F., et al. (2011). Argonaute2 complexes carry a population of circulating
microRNAs independent of vesicles in human plasma. Proc. Natl. Acad. Sci.U.S.A. 108, 5003–5008. doi: 10.1073/pnas.1019055108
Bahamonde, P. A., Fuzzen, M. L., Bennett, C. J., Tetreault, G. R., McMaster, M. E.,Servos, M. R., et al. (2015). Whole organism responses and intersex severityin rainbow darter (Etheostoma caeruleum) following exposures to municipalwastewater in the Grand River basin, ON, Canada. Part A. Aquat. Toxicol. 159,290–301. doi: 10.1016/j.aquatox.2014.11.023
Balasch, J. C., and Tort, L. (2019). Netting the stress responses in fish. Front.Endocrinol. 10:62. doi: 10.3389/fendo.2019.00062
Barrett, T., Wilhite, S. E., Ledoux, P., Evangelista, C., Kim, I. F., Tomashevsky,M., et al. (2013). NCBI GEO: archive for functional genomics data sets–update.Nucleic Acids Res. 41, D991–D995. doi: 10.1093/nar/gks1193
Bartel, D. P., Burge, C. B., Yekta, S., Glasner, M. E., and Lim, L. P. (2003). VertebrateMicroRNA genes. Science 299:1540. doi: 10.1126/science.1080372
Bergmeyer, H. U. (1974). Methods of Enzymatic Analysis. New York, NY: AcademicPress.
Berthelot, C., Brunet, F., Chalopin, D., Juanchich, A., Bernard, M., Noël, B., et al.(2014). The rainbow trout genome provides novel insights into evolution afterwhole-genome duplication in vertebrates. Nat. Commun. 5:3657. doi: 10.1038/ncomms4657
Frontiers in Physiology | www.frontiersin.org 14 January 2021 | Volume 11 | Article 588313

fphys-11-588313 January 4, 2021 Time: 15:59 # 15
Ikert et al. Stress Alters Non-lethally Sampled MicroRNA
Binderup, H. G., Madsen, J. S., Heegaard, N. H. H., Houlind, K., Andersen, R. F.,and Brasen, C. L. (2018). Quantification of microRNA levels in plasma – impactof preanalytical and analytical conditions. PLoS One 13:e0201069. doi: 10.1371/journal.pone.0201069
Brunet-Vega, A., Pericay, C., Quílez, M. E., Ramírez-Lázaro, M. J., Calvet, X., andLario, S. (2015). Variability in microRNA recovery from plasma: comparison offive commercial kits. Anal. Biochem. 488, 28–35. doi: 10.1016/j.ab.2015.07.018
Brydges, N. M., Boulcott, P., Ellis, T., and Braithwaite, V. A. (2009). Quantifyingstress responses induced by different handling methods in three species of fish.Appl. Anim. Behav. Sci. 116, 295–301. doi: 10.1016/j.applanim.2008.09.003
Cadonic, I., Ikert, H., and Craig, P. M. (2020). Acute air exposure modulates themicroRNA abundance in stress responsive tissues and circulating extracellularvesicles in rainbow trout (Oncorhynchus mykiss). Comp. Biochem. Physiol. PartD Genomics Proteomics. 34:100661. doi: 10.1016/j.cbd.2020.100661
Canadian Council on Animal Care (2005). Guidelines on the Care and Use of Fishin Research, Teaching and Testing. Ottawa: Canadian Council on Animal Care.
Chen, X., Ba, Y., Ma, L., Cai, X., Yin, Y., Wang, K., et al. (2008). Characterizationof microRNAs in serum: a novel class of biomarkers for diagnosis of cancer andother diseases. Cell Res. 18, 997–1006. doi: 10.1038/cr.2008.282
Chen, Y., Lun, A. T. L., and Smyth, G. K. (2014). “Differential expression analysisof complex RNA-seq experiments using edgeR,” in Statistical Analysis of NextGeneration Sequencing Data Frontiers in Probability and the Statistical Sciences,eds S. Datta and D. Nettleton (Cham: Springer), 51–74. doi: 10.1007/978-3-319-07212-8_3
Cui, C., and Cui, Q. (2020). The relationship of human tissue microRNAs withthose from body fluids. Sci. Rep. 10:5644. doi: 10.1038/s41598-020-62534-6
Ducouret, B., Tujague, M., Ashraf, J., Mouchel, N., Servel, N., Valotaire, Y., et al.(1995). Cloning of a teleost fish glucocorticoid receptor shows that it containsa deoxyribonucleic acid-binding domain different from that of mammals.Endocrinology 136, 3774–3783. doi: 10.1210/endo.136.9.7649084
Dufourd, T., Robil, N., Mallet, D., Carcenac, C., Boulet, S., Brishoual, S.,et al. (2019). Plasma or serum? A qualitative study on rodents and humansusing high-throughput microRNA sequencing for circulating biomarkers. Biol.Methods Protoc. 4:bz006. doi: 10.1093/biomethods/bpz006
Easy, R. H., and Ross, N. W. (2010). Changes in atlantic salmon salmo salar mucuscomponents following short- and long-term handling stress. J. Fish Biol. 77,1616–1631. doi: 10.1111/j.1095-8649.2010.02796.x
Edgar, R., Domrachev, M., and Lash, A. E. (2002). Gene expression omnibus: NCBIgene expression and hybridization array data repository. Nucleic Acids Res. 30,207–210. doi: 10.1093/nar/30.1.207
Enright, A. J., John, B., Gaul, U., Tuschl, T., Sander, C., and Marks, D. S. (2003).MicroRNA targets in Drosophila. Genome Biol. 5:R1. doi: 10.1186/gb-2003-5-1-r1
Fasulo, S., Tagliafierro, G., Contini, A., Ainis, L., Ricca, M. B., Yanaihara, N., et al.(1993). Ectopic expression of bioactive peptides and serotonin in the sacciformgland cells of teleost skin. Arch. Histol. Cytol. 56, 117–125. doi: 10.1679/aohc.56.117
Fernández-Alacid, L., Sanahuja, I., Ordóñez-Grande, B., Sánchez-Nuño, S.,Herrera, M., and Ibarz, A. (2019). Skin mucus metabolites and cortisolin meagre fed acute stress-attenuating diets: correlations between plasmaand mucus. Aquaculture 499, 185–194. doi: 10.1016/j.aquaculture.2018.09.039
Ficetola, G. F., Miaud, C., Pompanon, F., and Taberlet, P. (2008). Species detectionusing environmental DNA from water samples. Biol. Lett. 4, 423–425. doi:10.1098/rsbl.2008.0118
Friedländer, M. R., Mackowiak, S. D., Li, N., Chen, W., and Rajewsky, N. (2012).miRDeep2 accurately identifies known and hundreds of novel microRNA genesin seven animal clades. Nucleic Acids Res. 40, 37–52. doi: 10.1093/nar/gkr688
Gantier, M. P., McCoy, C. E., Rusinova, I., Saulep, D., Wang, D., Xu, D., et al.(2011). Analysis of microRNA turnover in mammalian cells following Dicer1ablation. Nucleic Acids Res. 39, 5692–5703. doi: 10.1093/nar/gkr148
Gonçalves, A. T., Valenzuela-Muñoz, V., and Gallardo-Escárate, C. (2020). BrainmicroRNAs in rainbow trout are modulated by functional additives and fishdensity. Aquaculture 519:734754. doi: 10.1016/j.aquaculture.2019.734754
Guardiola, F. A., Cuesta, A., and Esteban, M. Á (2016). Using skin mucus toevaluate stress in gilthead seabream (Sparus aurata L.). Fish Shellfish Immunol.59, 323–330. doi: 10.1016/j.fsi.2016.11.005
Guo, Y. E., and Steitz, J. A. (2014). Virus meets host MicroRNA: the destroyer,the booster, the hijacker. Mol. Cell. Biol. 34, 3780–3787. doi: 10.1128/MCB.00871-14
Hawkins, P., Dennison, N., Goodman, G., Hetherington, S., Llywelyn-Jones, S.,Ryder, K., et al. (2011). Guidance on the severity classification of scientificprocedures involving fish: report of a working group appointed by thenorwegian consensus-platform for the replacement, reduction and refinementof animal experiments (Norecopa). Lab. Anim. 45, 219–224. doi: 10.1258/la.2011.010181
Hertel, J., and Stadler, P. F. (2015). The expansion of animal MicroRNA familiesrevisited. Life 5, 905–920. doi: 10.3390/life5010905
Hofacker, I. L., Fontana, W., Stadler, P. F., Bonhoeffer, L. S., Tacker, M., andSchuster, P. (1994). Fast folding and comparison of RNA secondary structures.Monatsh. Chem. 125, 167–188. doi: 10.1007/BF00818163
Höss, M., Kohn, M., Pääbo, S., Knauer, F., and Schröder, W. (1992). Excrementanalysis by PCR. Nature 359, 199–199. doi: 10.1038/359199a0
Huang, D., Sherman, B. T., Tan, Q., Collins, J. R., Alvord, W. G., Roayaei, J.,et al. (2007). The DAVID gene functional classification tool: a novel biologicalmodule-centric algorithm to functionally analyze large gene lists. Genome Biol.8:R183. doi: 10.1186/gb-2007-8-9-r183
Huang, D. W., Sherman, B. T., and Lempicki, R. A. (2009a). Bioinformaticsenrichment tools: paths toward the comprehensive functional analysis of largegene lists. Nucleic Acids Res. 37, 1–13. doi: 10.1093/nar/gkn923
Huang, D. W., Sherman, B. T., and Lempicki, R. A. (2009b). Systematic andintegrative analysis of large gene lists using DAVID bioinformatics resources.Nat. Protoc. 4, 44–57. doi: 10.1038/nprot.2008.211
Ikert, H. (2020a). Oncorhynchus Mykiss Bowtie1 Index. doi: 10.6084/m9.figshare.12459905.v2
Ikert, H. (2020b). Supplemental Alignment Files (for manuscript - High ThroughputSequencing of microRNA in Rainbow Trout Plasma, Mucus, and SurroundingWater Following Acute Stress). doi: 10.6084/m9.figshare.12974792.v1
Jerde, C. L., Mahon, A. R., Chadderton, W. L., and Lodge, D. M. (2011). “Sight-unseen” detection of rare aquatic species using environmental DNA. Conserv.Lett. 4, 150–157. doi: 10.1111/j.1755-263X.2010.00158.x
Juanchich, A., Bardou, P., Rué, O., Gabillard, J.-C., Gaspin, C., Bobe, J., et al. (2016).Characterization of an extensive rainbow trout miRNA transcriptome bynext generation sequencing. BMC Genomics 17:164. doi: 10.1186/s12864-016-2505-9
Kanehisa, M. (2019). Toward understanding the origin and evolution of cellularorganisms. Protein Sci. 28, 1947–1951. doi: 10.1002/pro.3715
Kanehisa, M., and Goto, S. (2000). KEGG: kyoto encyclopedia of genes andgenomes. Nucleic Acids Res. 28, 27–30.
Kanehisa, M., Sato, Y., Furumichi, M., Morishima, K., and Tanabe, M. (2019). Newapproach for understanding genome variations in KEGG. Nucleic Acids Res. 47,D590–D595. doi: 10.1093/nar/gky962
Kincaid, R. P., Burke, J. M., and Sullivan, C. S. (2012). RNA virus microRNAthat mimics a B-cell oncomiR. Proc. Natl. Acad. Sci. U.S.A. 109, 3077–3082.doi: 10.1073/pnas.1116107109
Kosaka, N., Iguchi, H., Yoshioka, Y., Takeshita, F., Matsuki, Y., and Ochiya, T.(2010). Secretory mechanisms and intercellular transfer of MicroRNAs in livingcells. J. Biol. Chem. 285, 17442–17452. doi: 10.1074/jbc.M110.107821
Kostyniuk, D. J., Zhang, D., Martyniuk, C. J., Gilmour, K. M., and Mennigen,J. A. (2019). Social status regulates the hepatic miRNAome in rainbow trout:implications for posttranscriptional regulation of metabolic pathways. PLoSOne 14:e0217978. doi: 10.1371/journal.pone.0217978
Langmead, B., Trapnell, C., Pop, M., and Salzberg, S. L. (2009). Ultrafast andmemory-efficient alignment of short DNA sequences to the human genome.Genome Biol. 10:R25. doi: 10.1186/gb-2009-10-3-r25
Lawrence, M. J., Raby, G. D., Teffer, A. K., Jeffries, K. M., Danylchuk, A. J., Eliason,E. J., et al. (2020). Best practices for non-lethal blood sampling of fish via thecaudal vasculature. J. Fish Biol. 97, 4–15. doi: 10.1111/jfb.14339
Lee, R. C., Feinbaum, R. L., and Ambros, V. (1993). The C. elegans heterochronicgene lin-4 encodes small RNAs with antisense complementarity to lin-14. Cell75, 843–854. doi: 10.1016/0092-8674(93)90529-y
Lien, S., Koop, B. F., Sandve, S. R., Miller, J. R., Kent, M. P., Nome, T., et al. (2016).The Atlantic salmon genome provides insights into rediploidization. Nature533, 200–205. doi: 10.1038/nature17164
Frontiers in Physiology | www.frontiersin.org 15 January 2021 | Volume 11 | Article 588313

fphys-11-588313 January 4, 2021 Time: 15:59 # 16
Ikert et al. Stress Alters Non-lethally Sampled MicroRNA
Liu, Q., Wang, W., Zhang, Y., Cui, Y., Xu, S., and Li, S. (2020a). BisphenolA regulates cytochrome P450 1B1 through miR-27b-3p and induces carplymphocyte oxidative stress leading to apoptosis. Fish Shellfish Immunol. 102,489–498. doi: 10.1016/j.fsi.2020.05.009
Liu, Q., Yang, J., Gong, Y., Cai, J., Zheng, Y., Zhang, Y., et al. (2020b). MicroRNAprofiling identifies biomarkers in head kidneys of common carp exposed tocadmium. Chemosphere 247:125901. doi: 10.1016/j.chemosphere.2020.125901
Love, M. I., Huber, W., and Anders, S. (2014). Moderated estimation of foldchange and dispersion for RNA-seq data with DESeq2. Genome Biol. 15:550.doi: 10.1186/s13059-014-0550-8
Lun, A. T. L., Chen, Y., and Smyth, G. K. (2016). It’s DE-licious: a recipe fordifferential expression analyses of RNA-seq experiments using quasi-likelihoodmethods in edgeR. Methods Mol. Biol. 1418, 391–416. doi: 10.1007/978-1-4939-3578-9_19
Lynch, M. D. J. (2020). Atlantic Salmon (Salmo Salar) 3’UTRs (UntranslatedRegions). doi: 10.6084/m9.figshare.12461969.v1
Manca, S., Upadhyaya, B., Mutai, E., Desaulniers, A. T., Cederberg, R. A., White,B. R., et al. (2018). Milk exosomes are bioavailable and distinct microRNAcargos have unique tissue distribution patterns. Sci. Rep. 8:11321. doi: 10.1038/s41598-018-29780-1
Martin, M. (2011). Cutadapt removes adapter sequences from high-throughputsequencing reads. EMBnet. J. 17, 10–12. doi: 10.14806/ej.17.1.200
McCarthy, D. J., Chen, Y., and Smyth, G. K. (2012). Differential expression analysisof multifactor RNA-Seq experiments with respect to biological variation.Nucleic Acids Res. 40, 4288–4297. doi: 10.1093/nar/gks042
McCaskill, J. S. (1990). The equilibrium partition function and base pair bindingprobabilities for RNA secondary structure. Biopolymers 29, 1105–1119. doi:10.1002/bip.360290621
Mishra, R., Kumar, A., Ingle, H., and Kumar, H. (2020). The interplay betweenviral-derived miRNAs and host immunity during infection. Front. Immunol.10:3079. doi: 10.3389/fimmu.2019.03079
Mitchell, P. S., Parkin, R. K., Kroh, E. M., Fritz, B. R., Wyman, S. K., Pogosova-Agadjanyan, E. L., et al. (2008). Circulating microRNAs as stable blood-basedmarkers for cancer detection. Proc. Natl. Acad. Sci. U.S.A. 105, 10513–10518.doi: 10.1073/pnas.0804549105
Moran, M. A., Satinsky, B., Gifford, S. M., Luo, H., Rivers, A., Chan, L.-K., et al.(2013). Sizing up metatranscriptomics. ISME J. 7, 237–243. doi: 10.1038/ismej.2012.94
Park, S., Lee, K., Park, I. B., Kim, N. H., Cho, S., Rhee, W. J., et al. (2020). Theprofiles of microRNAs from urinary extracellular vesicles (EVs) prepared byvarious isolation methods and their correlation with serum EV microRNAs.Diabetes Res. Clin. Pract. 160:108010. doi: 10.1016/j.diabres.2020.108010
Poel, D., Buffart, T. E., Oosterling-Jansen, J., Verheul, H. M., and Voortman, J.(2018). Evaluation of several methodological challenges in circulating miRNAqPCR studies in patients with head and neck cancer. Exp. Mol. Med. 50:e454.doi: 10.1038/emm.2017.288
Qiang, J., Zhu, X.-W., He, J., Tao, Y.-F., Bao, J.-W., Zhu, J.-H., et al. (2020). miR-34a Regulates the activity of HIF-1a and P53 signaling pathways by promotingGLUT1 in genetically improved farmed tilapia (GIFT, Oreochromis niloticus)under hypoxia stress. Front. Physiol. 11:670. doi: 10.3389/fphys.2020.00670
Randall, D. J., and Ferry, S. F. (1992). “4 Catecholamines,” in The CardiovascularSystem Fish Physiology, eds W. S. Hoar, D. J. Randall, and A. P. Farrell(Cambridge, MA: Academic Press), 255–300. doi: 10.1016/S1546-5098(08)60011-4
Renthal, W., Boxer, L. D., Hrvatin, S., Li, E., Silberfeld, A., Nagy, M. A., et al. (2018).Characterization of human mosaic Rett syndrome brain tissue by single-nucleusRNA sequencing. Nat. Neurosci. 21, 1670–1679. doi: 10.1038/s41593-018-0270-6
Robinson, M. D., McCarthy, D. J., and Smyth, G. K. (2010). edgeR: a bioconductorpackage for differential expression analysis of digital gene expression data.Bioinformatics 26, 139–140. doi: 10.1093/bioinformatics/btp616
Robinson, M. D., and Oshlack, A. (2010). A scaling normalization method fordifferential expression analysis of RNA-seq data. Genome Biol. 11, R25. doi:10.1186/gb-2010-11-3-r25
Robinson, M. D., and Smyth, G. K. (2007). Moderated statistical tests for assessingdifferences in tag abundance. Bioinformatics 23, 2881–2887. doi: 10.1093/bioinformatics/btm453
Robinson, M. D., and Smyth, G. K. (2008). Small-sample estimation of negativebinomial dispersion, with applications to SAGE data. Biostat. Oxf. Engl. 9,321–332. doi: 10.1093/biostatistics/kxm030
Ruvkun, G., Ha, I., and Wightman, B. (1993). Posttranscriptional regulation ofthe heterochronic gene lin-14 by lin-4 mediates temporal pattern formation inC. Elegans. Cell 75, 855–862. doi: 10.1016/0092-8674(93)90530-4
Salem, M., Xiao, C., Womack, J., Rexroad, C. E., and Yao, J. (2010). A MicroRNArepertoire for functional genome research in rainbow trout (Oncorhynchusmykiss). Mar. Biotechnol. 12, 410–429. doi: 10.1007/s10126-009-9232-z
Schurch, N. J., Schofield, P., Gierliñski, M., Cole, C., Sherstnev, A., Singh, V., et al.(2016). How many biological replicates are needed in an RNA-seq experimentand which differential expression tool should you use? RNA 22, 839–851. doi:10.1261/rna.053959.115
Scrutinio, D., Conserva, F., Passantino, A., Iacoviello, M., Lagioia, R., andGesualdo, L. (2017). Circulating microRNA-150-5p as a novel biomarkerfor advanced heart failure: a genome-wide prospective study. J. Heart LungTransplant. 36, 616–624. doi: 10.1016/j.healun.2017.02.008
Sheng, Q., Vickers, K., Zhao, S., Wang, J., Samuels, D. C., Koues, O., et al. (2017).Multi-perspective quality control of Illumina RNA sequencing data analysis.Brief. Funct. Genomics 16, 194–204. doi: 10.1093/bfgp/elw035
Shephard, K. L. (1993). Mucus on the epidermis of fish and its influence ondrug delivery. Adv. Drug Deliv. Rev. 11, 403–417. doi: 10.1016/0169-409X(93)90018-Y
Skog, J., Würdinger, T., van Rijn, S., Meijer, D. H., Gainche, L., Curry, W. T.,et al. (2008). Glioblastoma microvesicles transport RNA and proteins thatpromote tumour growth and provide diagnostic biomarkers. Nat. Cell Biol. 10,1470–1476. doi: 10.1038/ncb1800
Sourvinou, I. S., Markou, A., and Lianidou, E. S. (2013). Quantification ofcirculating miRNAs in plasma: effect of preanalytical and analytical parameterson their isolation and stability. J. Mol. Diagn. 15, 827–834. doi: 10.1016/j.jmoldx.2013.07.005
Tam, S., Tsao, M.-S., and McPherson, J. D. (2015). Optimization of miRNA-seq datapreprocessing. Brief. Bioinform. 16, 950–963. doi: 10.1093/bib/bbv019
Thornton, L. M., LeSueur, M. C., Yost, A. T., Stephens, D. A., Oris, J. T., and SellinJeffries, M. K. (2017). Characterization of basic immune function parameters inthe fathead minnow (Pimephales promelas), a common model in environmentaltoxicity testing. Fish Shellfish Immunol. 61, 163–172. doi: 10.1016/j.fsi.2016.12.033
Tort, L. (2013). “Stress responses in rainbow trout,” in Trout: From Physiologyto Conservation Animal Science, Issues and Professions, S. Polakoff and T. W.Moon. (Hauppauge, NJ: Nova Science Publishers), 93–112.
Turchinovich, A., Weiz, L., Langheinz, A., and Burwinkel, B. (2011).Characterization of extracellular circulating microRNA. Nucleic Acids Res. 39,7223–7233. doi: 10.1093/nar/gkr254
Valadi, H., Ekström, K., Bossios, A., Sjöstrand, M., Lee, J. J., and Lötvall, J. O. (2007).Exosome-mediated transfer of mRNAs and microRNAs is a novel mechanism ofgenetic exchange between cells. Nat. Cell Biol. 9, 654–659. doi: 10.1038/ncb1596
Valiere, N., and Taberlet, P. (2000). Urine collected in the field as a source ofDNA for species and individual identification. Mol. Ecol. 9, 2150–2152. doi:10.1046/j.1365-294X.2000.11142.x
Vickers, K. C., Palmisano, B. T., Shoucri, B. M., Shamburek, R. D., and Remaley,A. T. (2011). MicroRNAs are transported in plasma and delivered to recipientcells by high-density lipoproteins. Nat. Cell Biol. 13, 423–433. doi: 10.1038/ncb2210
Vigneron, N., Meryet-Figuière, M., Guttin, A., Issartel, J.-P., Lambert, B., Briand,M., et al. (2016). Towards a new standardized method for circulating miRNAsprofiling in clinical studies: interest of the exogenous normalization to improvemiRNA signature accuracy. Mol. Oncol. 10, 981–992. doi: 10.1016/j.molonc.2016.03.005
Wang, K., Zhang, S., Weber, J., Baxter, D., and Galas, D. J. (2010). Export ofmicroRNAs and microRNA-protective protein by mammalian cells. NucleicAcids Res. 38, 7248–7259. doi: 10.1093/nar/gkq601
Wendelaar Bonga, S. E. (1997). The stress response in fish. Physiol. Rev. 77,591–625. doi: 10.1152/physrev.1997.77.3.591
Wu, L., Zhou, H., Lin, H., Qi, J., Zhu, C., Gao, Z., et al. (2012). CirculatingmicroRNAs are elevated in plasma from severe preeclamptic pregnancies.Reproduction 143, 389–397. doi: 10.1530/REP-11-0304
Frontiers in Physiology | www.frontiersin.org 16 January 2021 | Volume 11 | Article 588313

fphys-11-588313 January 4, 2021 Time: 15:59 # 17
Ikert et al. Stress Alters Non-lethally Sampled MicroRNA
Yendrek, C. R., Ainsworth, E. A., and Thimmapuram, J. (2012). The benchscientist’s guide to statistical analysis of RNA-Seq data. BMC Res. Notes 5:506.doi: 10.1186/1756-0500-5-506
Zaccone, G., Kapoor, B. G., Fasulo, S., and Ainis, L. (2001). “Structural,histochemical and functional aspects of the epidermis of fishes. Adv. Mar. Biol.40, 253–348. doi: 10.1016/S0065-2881(01)40004-6
Zeng, Y., and Cullen, B. R. (2003). Sequence requirements for micro RNA process-ing and function in human cells. RNA 9, 112–123. doi: 10.1261/rna.2780503
Zernecke, A., Bidzhekov, K., Noels, H., Shagdarsuren, E., Gan, L., Denecke, B.,et al. (2009). Delivery of MicroRNA-126 by apoptotic bodies induces CXCL12-dependent vascular protection. Sci. Signal. 2:ra81. doi: 10.1126/scisignal.2000610
Zhang, Y., Liu, D., Chen, X., Li, J., Li, L., Bian, Z., et al. (2010). Secreted monocyticmiR-150 enhances targeted endothelial cell migration. Mol. Cell 39, 133–144.doi: 10.1016/j.molcel.2010.06.010
Zhao, N., Zhang, B., Xu, Z., Jia, L., Li, M., He, X., et al. (2020). Detectingcynoglossus semilaevis infected with Vibrio harveyi using micro RNAs frommucous exosomes. Mol. Immunol. 128, 268–276. doi: 10.1016/j.molimm.2020.11.004
Zhao, Q., Deng, S., Wang, G., Liu, C., Meng, L., Qiao, S., et al.(2016). A direct quantification method for measuring plasma
MicroRNAs identified potential biomarkers for detecting metastaticbreast cancer. Oncotarget 7, 21865–21874. doi: 10.18632/oncotarget.7990
Zhou, X., Lindsay, H., and Robinson, M. D. (2014). Robustly detecting differentialexpression in RNA sequencing data using observation weights. Nucleic AcidsRes. 42:e91. doi: 10.1093/nar/gku310
Zuker, M., and Stiegler, P. (1981). Optimal computer folding of large RNAsequences using thermodynamics and auxiliary information. Nucleic Acids Res.9, 133–148. doi: 10.1093/nar/9.1.133
Conflict of Interest: The authors declare that the research was conducted in theabsence of any commercial or financial relationships that could be construed as apotential conflict of interest.
Copyright © 2021 Ikert, Lynch, Doxey, Giesy, Servos, Katzenback and Craig. Thisis an open-access article distributed under the terms of the Creative CommonsAttribution License (CC BY). The use, distribution or reproduction in other forumsis permitted, provided the original author(s) and the copyright owner(s) are creditedand that the original publication in this journal is cited, in accordance with acceptedacademic practice. No use, distribution or reproduction is permitted which does notcomply with these terms.
Frontiers in Physiology | www.frontiersin.org 17 January 2021 | Volume 11 | Article 588313
Related Documents