High-Throughput Detection of Induced Mutations and Natural Variation Using KeyPoint TM Technology Diana Rigola*, Jan van Oeveren, Antoine Janssen, Anita Bonne ´ , Harrie Schneiders, Hein J. A. van der Poel, Nathalie J. van Orsouw, Rene ´ C. J. Hogers, Michiel T. J. de Both, Michiel J. T. van Eijk Keygene NV, Wageningen, The Netherlands Abstract Reverse genetics approaches rely on the detection of sequence alterations in target genes to identify allelic variants among mutant or natural populations. Current (pre-) screening methods such as TILLING and EcoTILLING are based on the detection of single base mismatches in heteroduplexes using endonucleases such as CEL 1. However, there are drawbacks in the use of endonucleases due to their relatively poor cleavage efficiency and exonuclease activity. Moreover, pre- screening methods do not reveal information about the nature of sequence changes and their possible impact on gene function. We present KeyPoint TM technology, a high-throughput mutation/polymorphism discovery technique based on massive parallel sequencing of target genes amplified from mutant or natural populations. KeyPoint combines multi- dimensional pooling of large numbers of individual DNA samples and the use of sample identification tags (‘‘sample barcoding’’) with next-generation sequencing technology. We show the power of KeyPoint by identifying two mutants in the tomato eIF4E gene based on screening more than 3000 M2 families in a single GS FLX sequencing run, and discovery of six haplotypes of tomato eIF4E gene by re-sequencing three amplicons in a subset of 92 tomato lines from the EU-SOL core collection. We propose KeyPoint technology as a broadly applicable amplicon sequencing approach to screen mutant populations or germplasm collections for identification of (novel) allelic variation in a high-throughput fashion. Citation: Rigola D, van Oeveren J, Janssen A, Bonne ´ A, Schneiders H, et al. (2009) High-Throughput Detection of Induced Mutations and Natural Variation Using KeyPoint TM Technology. PLoS ONE 4(3): e4761. doi:10.1371/journal.pone.0004761 Editor: Alfredo Herrera-Estrella, Cinvestav, Mexico Received December 1, 2008; Accepted January 21, 2009; Published March 13, 2009 Copyright: ß 2009 Rigola et al. This is an open-access article distributed under the terms of the Creative Commons Attribution License, which permits unrestricted use, distribution, and reproduction in any medium, provided the original author and source are credited. Funding: Keygene N.V. funded the research and had role in study design, data collection and analysis, decision to publish and preparation of the manuscript. Competing Interests: Paid employement: all authors and co-authors are employees of Keygene N.V. The KeyPoint technology is covered by patent applications owned by Keygene N.V. Application for trademark registration for KeyPoint has been filed by Keygene N.V. * E-mail: [email protected] Introduction Rapid, high-throughput mutation and single nucleotide poly- morphism discovery technologies are fundamental to identify allelic variants in large populations. Such analyses are very useful for functional genetics, clinical diagnostics, forensic medicine, population genetics, molecular epidemiology, plant and animal breeding. Mutations are the basis of genetic variation and mutant populations are indispensable genetic resources in all organisms. This variation can be either naturally occurring or, in plants, animals and lower organisms, induced by chemical or physical treatments. Mutation induction, for example, has played an important role in the genetic improvement of crop species that are of economic importance [1]. Although sequencing is considered the ‘‘golden standard’’ for DNA-based mutation detection because it reveals the exact location and the type of mutations, direct gene sequencing methods have rarely been used to screen large (mutant) populations because of cost limitations. Instead, in the past a number of prescreening methods have been developed and applied in order to scan amplicons in large (mutant) populations for the presence of sequence polymorphisms, prior to confirmation by Sanger sequencing. For example, the characteristic DNA properties of melting temperature and single strand conformation have been used in techniques such as Denaturing High Performance Liquid Chromatograpy (DHPLC), Denaturing Gradient Gel Electrophoresis (DGGE), Temperature Gradient Gel Electrophoresis (TGGE), Single Strand Conformational Polymorphism analysis (SSCP) [reviewed in 2], and High Resolution DNA Melting (HRM) [3]. In addition, other procedures have been developed including the Protein Truncation Test [4], enzymatic or chemical cleavage methods [reviewed in 5], the Restriction Site Mutation (RSM) method [6] and s-RT-MELT technology [7]. The Targeting Induced Local Lesions In Genomes (TILLING) technique makes use of chemical mutagenesis to induce mutations throughout an entire genome and applies an enzyme-mediated detection method (e.g. based on CEL I nuclease) combined with DHPLC or gel electrophoresis detection [8,9,10]. A variation of the TILLING method, known as EcoTILLING [11], aims at the detection of natural (allelic) variation in the germplasm. TILLING has been successfully applied to organisms such as zebrafish [12], C. elegans [13], and plants including Arabidopsis [14], rice [15], soybean [16] wheat [17] and maize [18]. However, limitations of an endonuclease such as CEL I are its relatively poor cleavage efficiency and 59-39 exonuclease activity. This diminishes signal/ noise levels and prevents performing pooled sample analysis with more than eight [19] samples per pool. Moreover, TILLING, like other pre-screening methods does not reveal information about the nature of sequence changes and their possible impact on gene function. Consequently, there is a need for robust and low cost amplicon sequencing methods applicable to large populations. PLoS ONE | www.plosone.org 1 March 2009 | Volume 4 | Issue 3 | e4761

Welcome message from author
This document is posted to help you gain knowledge. Please leave a comment to let me know what you think about it! Share it to your friends and learn new things together.
Transcript

High-Throughput Detection of Induced Mutations andNatural Variation Using KeyPointTM TechnologyDiana Rigola*, Jan van Oeveren, Antoine Janssen, Anita Bonne, Harrie Schneiders, Hein J. A. van der
Poel, Nathalie J. van Orsouw, Rene C. J. Hogers, Michiel T. J. de Both, Michiel J. T. van Eijk
Keygene NV, Wageningen, The Netherlands
Abstract
Reverse genetics approaches rely on the detection of sequence alterations in target genes to identify allelic variants amongmutant or natural populations. Current (pre-) screening methods such as TILLING and EcoTILLING are based on thedetection of single base mismatches in heteroduplexes using endonucleases such as CEL 1. However, there are drawbacksin the use of endonucleases due to their relatively poor cleavage efficiency and exonuclease activity. Moreover, pre-screening methods do not reveal information about the nature of sequence changes and their possible impact on genefunction. We present KeyPointTM technology, a high-throughput mutation/polymorphism discovery technique based onmassive parallel sequencing of target genes amplified from mutant or natural populations. KeyPoint combines multi-dimensional pooling of large numbers of individual DNA samples and the use of sample identification tags (‘‘samplebarcoding’’) with next-generation sequencing technology. We show the power of KeyPoint by identifying two mutants inthe tomato eIF4E gene based on screening more than 3000 M2 families in a single GS FLX sequencing run, and discovery ofsix haplotypes of tomato eIF4E gene by re-sequencing three amplicons in a subset of 92 tomato lines from the EU-SOL corecollection. We propose KeyPoint technology as a broadly applicable amplicon sequencing approach to screen mutantpopulations or germplasm collections for identification of (novel) allelic variation in a high-throughput fashion.
Citation: Rigola D, van Oeveren J, Janssen A, Bonne A, Schneiders H, et al. (2009) High-Throughput Detection of Induced Mutations and Natural Variation UsingKeyPointTM Technology. PLoS ONE 4(3): e4761. doi:10.1371/journal.pone.0004761
Editor: Alfredo Herrera-Estrella, Cinvestav, Mexico
Received December 1, 2008; Accepted January 21, 2009; Published March 13, 2009
Copyright: � 2009 Rigola et al. This is an open-access article distributed under the terms of the Creative Commons Attribution License, which permitsunrestricted use, distribution, and reproduction in any medium, provided the original author and source are credited.
Funding: Keygene N.V. funded the research and had role in study design, data collection and analysis, decision to publish and preparation of the manuscript.
Competing Interests: Paid employement: all authors and co-authors are employees of Keygene N.V. The KeyPoint technology is covered by patent applicationsowned by Keygene N.V. Application for trademark registration for KeyPoint has been filed by Keygene N.V.
* E-mail: [email protected]
Introduction
Rapid, high-throughput mutation and single nucleotide poly-
morphism discovery technologies are fundamental to identify
allelic variants in large populations. Such analyses are very useful
for functional genetics, clinical diagnostics, forensic medicine,
population genetics, molecular epidemiology, plant and animal
breeding. Mutations are the basis of genetic variation and mutant
populations are indispensable genetic resources in all organisms.
This variation can be either naturally occurring or, in plants,
animals and lower organisms, induced by chemical or physical
treatments. Mutation induction, for example, has played an
important role in the genetic improvement of crop species that are
of economic importance [1].
Although sequencing is considered the ‘‘golden standard’’ for
DNA-based mutation detection because it reveals the exact
location and the type of mutations, direct gene sequencing
methods have rarely been used to screen large (mutant)
populations because of cost limitations. Instead, in the past a
number of prescreening methods have been developed and
applied in order to scan amplicons in large (mutant) populations
for the presence of sequence polymorphisms, prior to confirmation
by Sanger sequencing. For example, the characteristic DNA
properties of melting temperature and single strand conformation
have been used in techniques such as Denaturing High
Performance Liquid Chromatograpy (DHPLC), Denaturing
Gradient Gel Electrophoresis (DGGE), Temperature Gradient
Gel Electrophoresis (TGGE), Single Strand Conformational
Polymorphism analysis (SSCP) [reviewed in 2], and High
Resolution DNA Melting (HRM) [3]. In addition, other
procedures have been developed including the Protein Truncation
Test [4], enzymatic or chemical cleavage methods [reviewed in 5],
the Restriction Site Mutation (RSM) method [6] and s-RT-MELT
technology [7].
The Targeting Induced Local Lesions In Genomes (TILLING)
technique makes use of chemical mutagenesis to induce mutations
throughout an entire genome and applies an enzyme-mediated
detection method (e.g. based on CEL I nuclease) combined with
DHPLC or gel electrophoresis detection [8,9,10]. A variation of
the TILLING method, known as EcoTILLING [11], aims at the
detection of natural (allelic) variation in the germplasm. TILLING
has been successfully applied to organisms such as zebrafish [12],
C. elegans [13], and plants including Arabidopsis [14], rice [15],
soybean [16] wheat [17] and maize [18]. However, limitations of
an endonuclease such as CEL I are its relatively poor cleavage
efficiency and 59-39 exonuclease activity. This diminishes signal/
noise levels and prevents performing pooled sample analysis with
more than eight [19] samples per pool. Moreover, TILLING, like
other pre-screening methods does not reveal information about the
nature of sequence changes and their possible impact on gene
function. Consequently, there is a need for robust and low cost
amplicon sequencing methods applicable to large populations.
PLoS ONE | www.plosone.org 1 March 2009 | Volume 4 | Issue 3 | e4761

The recent introduction of instruments capable of producing
millions of DNA sequence reads in a single experiment opened the
possibility of developing a new high-throughput mutation
discovery technology based on massive parallel sequencing. Here
we describe the KeyPointTM technology, a novel mutation/
polymorphism screening technique using the Genome Sequencer
(GS) FLX platform (Roche Applied Science), which allows massive
parallel picoliter-scale amplification and pyrosequencing of
individual DNA molecules [20]. Using KeyPoint, genes of interest
are directly amplified by PCR and sequenced. To significantly
reduce sample preparation costs, KeyPoint applies a multidimen-
sional pooling strategy of amplification templates (DNA samples)
belonging to mutant or natural populations. Gene-specific PCR
primers carry sample identification tags specific for each
multidimensional pool in order to assign sequence reads to
individual mutant plants or to assign sequence haplotypes to
pooled or individual samples of a germplasm collection (Fig. 1).
Using custom developed bio-informatics tools the sequence reads
are clustered, aligned, and mined for mutations or single
nucleotide polymorphisms (SNPs). Statistical probability calcula-
tion methods are used to distinguish true mutations and
polymorphisms from amplification or sequencing errors. With
the KeyPoint technology we identify two EMS induced mutations
in exon 1 of the tomato (Solanum lycopersicum) eukaryotic translation
initiation factor 4E (SleIF4E) gene by screening 15,040 mutant
tomato plants (five segregating M2 plants of each of 3008 M2
families) in a single GS FLX run. In addition, power calculations
were performed to define the throughput of the KeyPoint
technology. Finally, KeyPoint revealed at least six naturally
occurring haplotypes defined by fifteen SNPs observed in three
amplicons of the SleIF4E gene in a subset of 92 lines of the EU-
SOL tomato germplasm core collection in just 1/4 GS FLX run.
We propose KeyPoint as a generic approach to screen for
induced and naturally occurring sequence variation in selected
target genes of mutant and/or germplasm populations.
Materials and Methods
Plant materialThe mutant library used was an isogenic library of inbred
tomato cultivar M82 derived from ethyl-methane sulfonate (EMS)
mutagenesis treatment. The original characteristics of the library
are described by Menda and co-workers [21] and stored in a
database on http://zamir.sgn.cornell.edu/mutants/index.html.
Seeds of each M2 family were stored at 10% relative humidity
at 7uC.
Leaf material was harvested from five individual greenhouse-
grown plants of each of 3008 M2 tomato mutant families. As any
mutation occurring in the library will segregate in a Mendelian
fashion in the M2 offspring, pooling of leaf material of five
individual plants reduces the likelihood of not sampling a mutation
as consequence of segregation to 0.1% (0.510 = 0.001).
The tomato natural population samples used consists of 92
tomato lines belonging to the core collection of EU-SOL and
professor D. Zamir (The Hebrew University of Jerusalem). A
description of these 92 lines is provided in figure S1. Character-
istics of the tomato core collection can be found on https://www.
eu-sol.wur.nl/.
DNA extraction, normalization and poolingGenomic DNA was isolated from five pooled leaves obtained
from five plants of each M2 family and from leaves of a single
plant of each tomato line of the EU-SOL core collection, using a
modified CTAB procedure [22]. DNA samples were quantified
using Quant-iTTM PicoGreenH dsDNA reagent (Invitrogen) on
the FLUOstar Omega (BMG LABTECH) using a standard
procedure. DNA samples were diluted to a concentration of
20 ng/nl and subsequently pooled.
For screening the mutant library, M2 DNAs were first subjected
to a four-fold pooling, resulting in 752 pooled samples contained in
eight 96-well microtiter plates. These 752 four-fold pooled M2
DNA samples were then subjected to a three-dimensional (3D)
pooling strategy, such that each sample was represented once in an
X, Y and Z-coordinate pool. X pools were assembled by pooling
all four-fold pooled M2 DNA samples per column of eight wells
(e.g. A1–H1) of the eight 96-well plates and Y pools were
assembled by pooling all M2 DNA samples per row of twelve wells
(e.g. A1–A12) of the eight 96-well plates. This resulted in 12 X and
8 Y pools which each represented maximum 256 (86864) and
384 (126864) M2 families, respectively. Z pools were assembled
by pooling all four-fold pooled DNA samples of an entire 96-well
Figure 1. KeyPoint flowchart.doi:10.1371/journal.pone.0004761.g001
KeyPoint Technology
PLoS ONE | www.plosone.org 2 March 2009 | Volume 4 | Issue 3 | e4761

pooled plate, resulting in eight Z pools each representing 384
(4696) M2 families. For screening 92 tomato core collection lines,
genomic DNA samples were subjected to a 2D pooling strategy
where X and Y pools were assembled by pooling all DNA samples
together per column of eight wells (e.g. A1–H1) or per row of
twelve wells (e.g. A1–A12). This resulted in 12 X and 8 Y pools
each representing a maximum of eight or twelve tomato lines,
respectively.
KeyPoint amplification targetsThe SleIF4E gene was chosen as a target sequence for KeyPoint
mutation and natural polymorphism detection. Several recessive
mutations in this gene are associated with broad resistance to
potyviruses in some plant species [23]. At the onset of our
research, only the cDNA sequence of SleIF4E was known
(Genbank AF259801). We employed a polymerase chain reaction
(PCR) approach to determine the genomic sequence of SleIF4E in
part (figure S3), but the genomic sequence has since been
deposited in public databases (EMBL CU856538).
Specific primers were designed for PCR amplification of
SleIF4E exon 1 (amplicon 1; 287 bp), exon 2, intron 2 and exon
3 (amplicon 2; 402 bp), and exon 4, intron 4 and exon 5 (amplicon
3; 200 bp). These primers contained the following target-specific
sequences (59-39): ATGGCAGCAGCTGAAATGG (amplicon 1
forward primer), CCCCAAAAATTTTCAACAGTG (amplicon 1
reverse primer), TGCTTACAATAATATCCATCAC (amplicon
2 forward primer), CCTGAGCTGTTTCATTTGC (amplicon 2
reverse primer), TTAGCATTGGTAAGCAATGG (amplicon 3
forward primer) and CTATACGGTGTAACGATTC (amplicon
3 reverse primer). Six nucleotide non-target sequences were added
at the 5 prime ends of these primers (figure S2). The sample
identification tags all differed by at least two nucleotides to exclude
the possibility that a single nucleotide substitution error could
cause incorrect assignment of the sequence reads to a sample pool
[24]. The use of sample identification tags saves sequence library
preparation costs and prevents relying on physical compartmen-
talization of multiple libraries constructed from different sample
pools during the sequencing process. Furthermore this approach
provides flexibility to process multiple (pooled) samples in one GS
FLX run.
KeyPoint template preparationSleIF4E amplicon 1 was chosen as a target for mutation
screening (MS) and SleIF4E amplicons 1, 2 and 3 for natural
variation screening (NVS). Fifty ml PCR reactions were performed
containing 80 ng DNA for each of the 28 3D tomato M2 family
pools and each of the 20 2D tomato line pools, 50 ng forward
tagged primer, 50 ng reverse tagged primer, 0.2 mM dNTP, 1 U
HerculaseH II Fusion DNA polymerase (Stratagene) and 1X
HerculaseH II reaction buffer. PCRs were performed with the
following thermal profile: 2 minutes at 95uC, followed by 35 cycles
of 30 sec 95uC, 30 sec 56uC and 30 sec 72uC, followed by cooling
down to 4uC. Equal amounts of PCR products of the 3D or 2D
pooled samples were combined and further treated as one GS
FLX fragment library sample.
GS FLX library preparation and titrationFive and 3.2 mg of the combined PCR fragments (i.e. pooled
and tagged PCR products), obtained from mutant- and natural
population pools respectively, and were used as input for GS FLX
library construction. The use of tagged and pooled PCR products,
however, necessitated some adaptations in the published GS
library construction protocol [20]. First, no shearing was carried
out and second, T4 DNA polymerase treatment, generally used to
generate fragment termini suitable for blunt-end ligation, was
omitted because PCR fragments were produced using a proof-
reading Taq polymerase yielding blunt ends. After library
construction, emulsion titration and bead enrichment were carried
out according to the standard GS FLX protocol (Roche Applied
Science).
GS FLX sequencingOne full picotiterplate (PTP) (70675 mm) with two regions was
used for sequencing the mutant population (EMS) library and 1/4
PTP was used for sequencing of the natural population (EU-SOL)
library. Sequencing was performed according to the manufactur-
er’s instructions (Roche Applied Science).
KeyPoint bio-informatics analysisThe mutation/SNP screening process consisted of six parts,
namely (1) GS FLX data processing, (2) KeyPoint pre-processing,
(3) polymorphism detection, (4) SNP mining, (5) SNP analysis and
(6) reporting (Fig. 2).
GS FLX data processing was performed using the Roche GS
FLX software (Release: 1.1.03.24). Base-called reads were
trimmed and filtered for quality and converted into FASTA
format. A total of 666,864 and 95,222 quality filtered reads
obtained from the MS and NVS libraries respectively were further
processed in the KeyPoint pre-processing step. During pre-
processing, the origin of the reads was identified based on the
target-specific primer sequences and the six base sample
identification tags. This step was implemented in a custom Perl
script that used the Semi Global Smith Waterman algorithm
within a TimeLogic DeCypher system (Active Motif, Inc.).
Furthermore, sample tag and primer sequences were trimmed,
and the pre-processed reads of each multidimensional pool were
saved separately to the database. In the polymorphism detection
step, each pool dataset was mapped against the reference sequence
using SSAHASNP [http://www.sanger.ac.uk/Software/analysis/
ssahaSNP/] with the -454 and the -NSQ parameters set to true.
Raw SSAHASNP output was parsed using a custom Perl script.
SNPs derived from the SSAHASNP output were divided in
‘‘forward’’ and ‘‘reverse’’ set depending on the orientation of the
read compared to the reference. Both sets were saved in a comma
separated format.
For the MS sequence data, the combined set of polymorphisms
observed for ‘‘forward’’ and ‘‘reverse’’ orientation reads was filtered
on G to A and C to T substitutions only, as these are the changes
expected from EMS-induced treatment. On the contrary, for the
NVS data analysis all polymorphisms were considered. Using MS-
Excel a matrix was built with polymorphism position on the
reference sequence as rows and pools as columns. Per position the
average polymorphism error rate was calculated by dividing the sum
of all polymorphisms over all pools by the total number of reads.
Next the probability of finding the observed number of polymor-
phisms (k) was calculated given an H0 of no underlying mutation for
each pool at each position. This was done by taking the Poisson
distribution with l = n.p, p being the estimated error rate and n being
the number of all reads detected per pool. P-values below a
significance value of 0.01 indicate pools with true mutants. A
combination of two significant 2D or 3 significant 3D coordinate
pools, one in each different coordinate, were considered as pointing
at (pooled) samples harboring true SNPs in the natural population
and true mutations in the mutant population, respectively.
Detection power / throughput estimationFor one region of the GS FLX run (1/2 picotiterplate) of the
mutant population, random subsets of sequence reads were
KeyPoint Technology
PLoS ONE | www.plosone.org 3 March 2009 | Volume 4 | Issue 3 | e4761

generated with a custom Perl script. Each of the reads was
randomly assigned a number between 1 and x for a subset of 1/x
of region 1 of the run. Only reads that were assigned a 1 are used
in the subset. With this method subsets with a fraction of 1/8, 1/4
and 1/2 of the region 1 MS dataset were generated. Probabilities
to detect SNPs in the full MS GS FLX run (1 PTP) and in these
subsets (1/2 PTP, 1/4 PTP, 1/8 PTP and 1/16 PTP) were
performed as described above, which served as basis for the
estimation of KeyPoint detection throughput levels per GS FLX
run.
SNP validationSNPs were confirmed by Sanger sequencing. Specifically, PCR
fragments obtained from the M2 families or the tomato lines
carrying mutations or polymorphisms were sequenced using the
BigDyeHTerminator v.3.1 kit on the 3730xl DNA analyzer
(Applied Biosystems) according to standard procedures.
Results
EMS mutation screening and validationA total of 15,000 M2 plants representing 3008 M2 families were
screened for EMS-induced mutations in exon 1 of the SleIF4E
gene based on amplification from 28 3D pools (12X, 8Y and 8Z).
A total of 667,864 high-quality sequence reads with an average
read length of 254 bases were obtained from a single GS FLX run.
In the pre-processing step (Fig. 2), sample identification tags could
be assigned with confidence to a total of 580,471 reads (87%,
Table 1). The remaining 13% of reads contained one or more
deviations in the sample identification tag sequences, contained
concatamers or were reads shorter than 100 bases, and were
excluded from further analysis. Successfully trimmed and tagged
reads were taken into the mutation/polymorphism mining step
starting with mapping them onto the reference sequence and
followed by generating pair-wise sequence alignments (Fig. 2).
Next, the numbers of CRT and GRA changes from the wild type
sequence were counted for each position per pool (Fig. 3) and the
probabilities that they represent true EMS mutations were
calculated taking into account their distribution across the 3D
sample pools. At significance threshold P,0.01, two mutations
were identified: a CRT mutation at position 170 and a GRA
mutation at position 221, which encode a proline to leucine (both
hydrophobic amino acids) and arginine (positively charged and
hydrophilic) to glutamine (hydrophilic) amino acids changes,
respectively (figure S3). These mutations were based on signifi-
cantly elevated numbers of non-wild type nucleotides at positions
170 and 221 in four (X12, Y7, Y8 and Z5) and three pools (X12,
Y3 and Z6), respectively (Fig. 3). A complete overview of the
Figure 2. Bioinformatics pipeline for high-throughput analysis of KeyPoint sequence runs.doi:10.1371/journal.pone.0004761.g002
KeyPoint Technology
PLoS ONE | www.plosone.org 4 March 2009 | Volume 4 | Issue 3 | e4761
statistical analysis is provided in figure S4. Sanger sequencing
confirmed the C170T mutation in one of the four M2 families
located at the plate position specified by the X12, Y7, Z5 3D pool
coordinates, and the G221A mutation in one of the four M2
families at the plate position defined by the X12, Y3 and Z6
coordinates (Fig. 4).
Natural polymorphism screening and validationA total of 92 tomato lines of the EU-SOL core collection were
screened for natural variation in exons 1–5 and introns 2 and 4,
based on PCR amplification of three amplicons of the SleIF4E
gene (Figure S3) from 20 (12X and 8Y) 2D pools using tagged
PCR primers. Amplicon sizes were as expected 287 bp, 402 bp
and 200 bp, respectively, excluding non-template tags. A total of
95,222 high-quality sequence reads with an average read length of
230 bases were obtained from a 1/4 region of a GS FLX PTP.
Sample identification tags could be assigned with confidence to a
subset of 80,634 of these reads (85%, Table 1) as described above
for the EMS mutation screening. This included 31,724 amplicon 1
reads, 11,495 amplicon 2 reads and 37,415 amplicon 3 reads
(Table 1). All nucleotide changes from the SleIF4E wild type
sequence were counted for each of 20 2D pools for all positions in
all three amplicons (figure S5). A subset of the data obtained from
amplicon 2 is shown in figure 5a, which includes all eight positions
(47, 171, 193, 203, 209, 245, 266 and 269) where SNPs were
found, and a number of non-polymorphic positions for compar-
ison purposes. As expected for a 2D pool design, statistically
significant probabilities for harboring true mutations (P,0.01)
were observed in at least 2 pools (one X and one Y) for each of
these eight SNPs (Fig. 5a). Similar analyses performed for
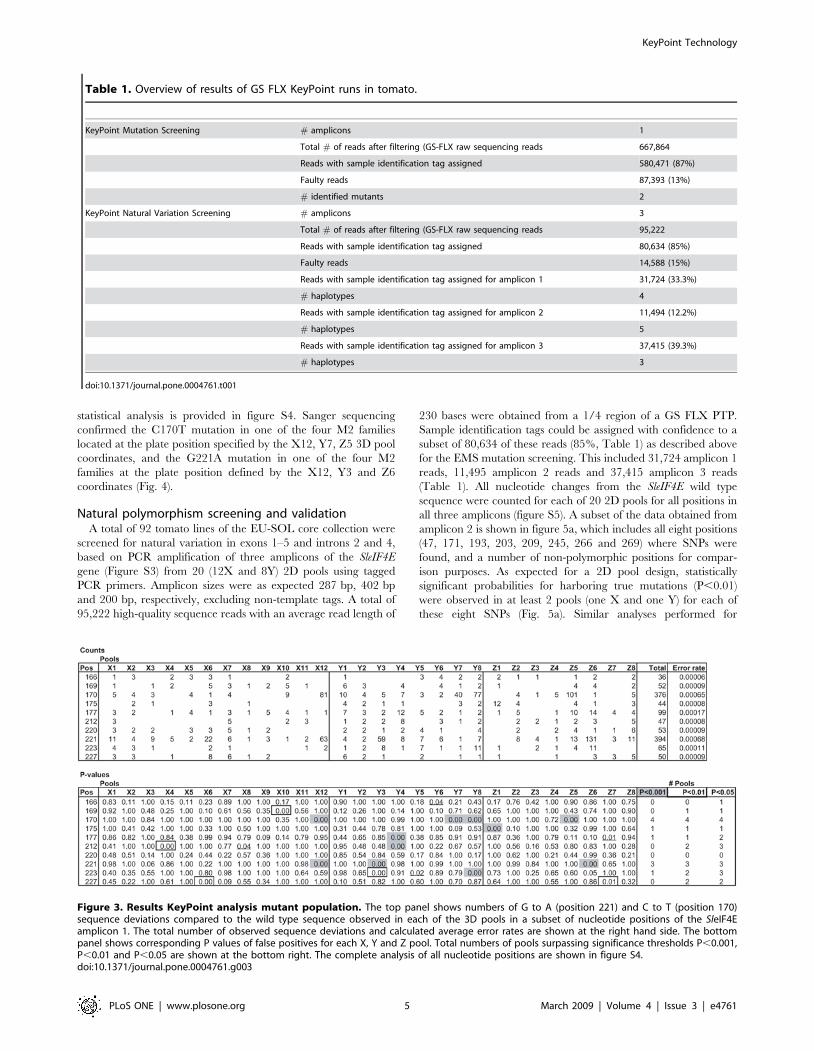
Figure 3. Results KeyPoint analysis mutant population. The top panel shows numbers of G to A (position 221) and C to T (position 170)sequence deviations compared to the wild type sequence observed in each of the 3D pools in a subset of nucleotide positions of the SleIF4Eamplicon 1. The total number of observed sequence deviations and calculated average error rates are shown at the right hand side. The bottompanel shows corresponding P values of false positives for each X, Y and Z pool. Total numbers of pools surpassing significance thresholds P,0.001,P,0.01 and P,0.05 are shown at the bottom right. The complete analysis of all nucleotide positions are shown in figure S4.doi:10.1371/journal.pone.0004761.g003
Table 1. Overview of results of GS FLX KeyPoint runs in tomato.
KeyPoint Mutation Screening # amplicons 1
Total # of reads after filtering (GS-FLX raw sequencing reads 667,864
Reads with sample identification tag assigned 580,471 (87%)
Faulty reads 87,393 (13%)
# identified mutants 2
KeyPoint Natural Variation Screening # amplicons 3
Total # of reads after filtering (GS-FLX raw sequencing reads 95,222
Reads with sample identification tag assigned 80,634 (85%)
Faulty reads 14,588 (15%)
Reads with sample identification tag assigned for amplicon 1 31,724 (33.3%)
# haplotypes 4
Reads with sample identification tag assigned for amplicon 2 11,494 (12.2%)
# haplotypes 5
Reads with sample identification tag assigned for amplicon 3 37,415 (39.3%)
# haplotypes 3
doi:10.1371/journal.pone.0004761.t001
KeyPoint Technology
PLoS ONE | www.plosone.org 5 March 2009 | Volume 4 | Issue 3 | e4761

amplicons 1 and 3 revealed four and three SNPs, respectively
(figure S5). All 15 SNPs observed in amplicons 1–3 together were
confirmed by Sanger sequencing of selected PCR products of
individual samples (data not shown).
The combinations of SNPs in amplicons 1, 2 and 3 defined four,
five and three sequence haplotypes, including the wild type
haplotype (Fig. 5b). Excluding the wild type haplotype, two
amplicon 1 haplotypes, two amplicon 2 haplotypes and one
amplicon 3 haplotype could be assigned to individual 2D pooled
samples (i.e. tomato lines) in the 96-well base plate, at positions B4
and F10 for amplicons 1 and 2, and position B4 for amplicon 3,
respectively (Fig. 5b). Taken together, the three amplicons
therefore defined at least six SleIF4E haplotypes in the collection
of 92 tomato lines: the wildtype haplotype ( = amplicon 1
haplotype 1 – amplicon 2 haplotype 1 – amplicon 3 haplotype
1; Figure 5b), and similarly for amplicons 1, 2 and 3 the haplotype
number combinations, 1-2-(1 or 3), 2-4-(1 or 3) (sample F10), 3-1-
(1 or 3), 3-5-(1 or 3) and 4-3-2 (sample B4) as shown in Figure 5b.
Detection power / throughput estimationThe total number of 580,471 trimmed and tagged sequences
reads of the EMS mutation screening of SleIF4E exon 1 was used
to determine the power of detection of the two identified mutations
at positions 170 and 221 in progressively smaller subsets of the
total dataset. For this, random subsets of the data were generated
representing 1/2, 1/4, 1/8 and 1/16 fractions of all reads (Fig. 6).
These subsets were subjected to statistical analysis and probability
calculations to identify mutations as described above for the whole
dataset. The results shown in Figure 6 indicate that both EMS
mutations can be found with the same statistical confidence levels
(P,0.001) in all positive pools with just a 1/4 fraction of all
sequence data. In the positive X and Z pools harboring mutations
C170T and G221A, this is even the case with a 1/8 fraction of the
data, but for the Y pools, significance levels drop to P,0.05, which
is below the cut-off level P,0.01 which we considered reliable to
detect true mutations.
Given the fact that we screened one amplicon in 3008 M2
families in one GS FLX run, the estimated throughput of
KeyPoint screening equals four amplicons screened in 3008 M2
families per GS FLX run, assuming that these amplicons are
represented in equal proportions, or four times as many M2
families for a single amplicon.
Discussion
We have applied KeyPoint technology to identify mutations in
the SleIF4E gene in an EMS population of 3008 M2 families and
SNPs in a selection of 92 tomato lines of the EU-SOL core
collection, taking advantage of the power of the GS FLX next
generation sequencing platform. The EMS mutation screening of
SleIF4E exon 1 involved only 28 PCRs with tagged primers on 3D
pooled samples, and led to the discovery of two transition
mutations which were confirmed by Sanger sequencing. Both
mutations are predicted to confer amino acid changes but their
impact on gene function is unknown.
During the development of the KeyPoint technology, we
noticed that the number of sequence changes compared to the
wild type sequence, which reflects the combined total of PCR- and
sequence errors and genuine EMS mutations, was highly variable
across all positions of the amplicon sequence. Moreover, these
numbers were also rather variable between ‘‘forward’’ and
‘‘reverse’’ orientation GS FLX reads of the amplicon (data not
shown). Based on this observation, which has been made previously
by others [25,26,27], we concluded that identification of EMS
mutations or SNPs could not be performed reliably based on the
total number of sequence deviations from the wild type sequence
alone, without considering their distribution across the individual
multidimensional pools. Consequently, a probability calculation
method based on Poisson statistics was established which takes this
distribution into account. Using this method, both EMS mutations
and fifteen SNPs identified in the natural population screening
were confirmed when a threshold significance level of P,0.01 was
applied.
Unexpectedly for a 3D pooling scheme, for the position C170T
EMS mutation in SleIF4E exon 1, four positive pools were
observed (X12, Y7, Y8 and Z5). This includes two Y-dimension
coordinates and specifies two unique plate addresses: X12, Y7, Z5
and X12, Y8, Z5. In fact the mutation was confirmed in one of
four M2 families of the first address, whereas the second one
pointed to an empty (adjacent) well, despite the fact that 77 CRT
changes were observed in Y8 compared to 40 in Y7 (Fig. 3). We
can only explain this observation by an experimental error made
either during (manual) assembly of the 3D pools or setting up the
PCRs. Despite this flaw, the C170T mutation was identified and
assigned to the correct position.
Based on analysis of progressively smaller subsets of the EMS
data, we estimated that KeyPoint technology enables screening of
four amplicons in 3000 M2 families per GS FLX run of
approximately 500,000 sequence reads. The maximum read
length of these amplicons is defined by the specifications of GS
FLX platform (approximately 240 bases). Hence, a total of
4630006240 bases equalling 2,88 Mb of amplicon sequence can
be screened in a single GS FLX run. Obviously, other
combinations of sample- and amplicon numbers within these
boundaries can be considered as well, with appropriate adaptation
of the pooling strategy. The throughput will increase with further
output improvements of the GS FLX platform. For example, the
recently released GS FLX Titanium platform yields around 1
million sequence reads of .400 bases, which increases the
throughput of KeyPoint screening to (the equivalent of) 466000
Figure 4. Sanger sequencing confirmation of EMS mutations atpositions 170 and 221 of amplicon 1 of the SleIF4E gene. A)CRT mutation at position 170. B) C at position 170 in wild typesequence. C) GRA mutation at position 221. D) G at position 221 inwild type sequence.doi:10.1371/journal.pone.0004761.g004
KeyPoint Technology
PLoS ONE | www.plosone.org 6 March 2009 | Volume 4 | Issue 3 | e4761

Figure 5. Results KeyPoint analysis tomato natural population EU-SOL core collection. A) Results KeyPoint analysis tomato naturalpopulation EU-SOL core collection. The top panel shows numbers of all sequence deviations compared to the wild type sequence observed in eachof the 2D pools at a selected subset of nucleotide positions of the SleIF4E amplicon 2. The total number of observed sequence deviations andcalculated average error rates are shown at the right hand side. The bottom panel shows the corresponding P values for each of the X and Y pools.Total numbers of pools surpassing significance thresholds P,0.001, P,0.01 and P,0.05 are shown at the bottom right. The complete analysis of allnucleotide positions of amplicons 1, 2 and 3 is shown in figure S5a, S5b and S5c, respectively. B) SNPs and haplotypes of the SleIF4E gene observed in92 lines of the EU-SOL tomato core collection. Haplotype 1 is wild type (WT) sequence. Alleles different from WT are shown in grey. Nucleotidepositions in amplicons 1, 2 and 3 are shown at the top. 96-well plate row (A–H) and column (1–12) positions containing samples carrying haplotypesare shown in the ‘‘origin’’ column.doi:10.1371/journal.pone.0004761.g005
Figure 6. P-values of detecting mutations C170T and G221A in progressively smaller subsets of the total of 580,471 sequence readsobtained from a single GS FLX run.doi:10.1371/journal.pone.0004761.g006
KeyPoint Technology
PLoS ONE | www.plosone.org 7 March 2009 | Volume 4 | Issue 3 | e4761

M2 plants6400 bases equating 9.6 Mb of screened amplicon
sequence per GS FLX Titanium run.
Based on these results, we conclude that KeyPoint screening
offers a sequence-based alternative to TILLING (and EcoTIL-
LING) screening which comes with certain advantages: 1) the
sequence context of mutations is determined which is important
when screening for knock-out mutations, especially given the fact
that only a minor fraction of EMS mutations is expected to confer
a stop codon or splice site errors [8]. 2) KeyPoint is robust and
does not rely on endonucleases with known robustness issues. 3)
KeyPoint does not rely on visual inspection or interpretation of
slab gel data aided by image analysis software, but is based on an
objective statistical analysis method which is easy to perform. 4)
The method is flexible with respect to changing numbers of
samples and amplicons. 5) Compared to unidirectional Sanger
sequencing, KeyPoint is based on highly redundant sequencing of
amplicons, which improves the accuracy when appropriate
analysis methods are applied; this in turn reduces the likelihood
of identifying false positives due to imperfections of Sanger
sequencing. 6) Costs are scalable as it is not mandatory required to
perform an entire GS FLX (Titanium) run, but picotiterplate
containing multiple compartments are available for use as well.
We also applied KeyPoint to investigate germplasm diversity in
a small subset of the tomato EU-SOL core collection as a pilot
project. A total of fifteen SNPs and at least six sequence haplotypes
were found based on joint analysis of three amplicons of the
SleIF4E gene and applying a 2D pooling scheme. The impact on
these haplotypes on gene function is unknown. As for the EMS
screening, this approach can be scaled up for analysis of larger
numbers of samples, with limited additional efforts and costs for
amplicon preparation. Although germplasm diversity can also be
revealed based on sequencing of a single pooled sample, an
advantage of using a 2D (or higher order) pooling scheme, is that a
subset of identified SNPs and haplotypes can be attributed to a
specific sample, or at least a subset of rows and columns / pool
coordinates, while sample preparation costs are only marginally
higher. This is not the case when all samples are pooled together.
In fact, for rare SNPs and haplotypes in the germplasm which are
often the most interesting to discover, there is a higher probability
to identify the associated sample than for more common
polymorphisms, as shown by our results. A second advantage of
using a multidimensional pooling strategy is that it provides a
built-in quality control capable of separating genuine polymor-
phisms from experimental (PCR and sequencing) errors, since true
mutations must be observed in at least two dimensions in case of a
2D design. Also this is not the case when all samples are pooled
together. These features of KeyPoint technology for screening
natural variation compare favourably to a number of alternative
(pre-screening) technologies, which may lack the power to detect
low frequency polymorphisms [6,7].
In conclusion, we present KeyPoint technology as a flexible,
high-throughput sequence-based polymorphism screening tech-
nology, applicable for detection of artificially induced and natural
polymorphisms in a wide variety of species.
Supporting Information
Figure S1 Tomato lines of the EU-SOL core collection used for
screening naturally occurring variants in the SleIF4E gene.
Found at: doi:10.1371/journal.pone.0004761.s001 (0.01 MB
PDF)
Figure S2 Sample identification tags.
Found at: doi:10.1371/journal.pone.0004761.s002 (0.00 MB PDF)
Figure S3 SleIF4E sequence, including positions of discovered
mutant and naturally occuring SNPs.
Found at: doi:10.1371/journal.pone.0004761.s003 (0.01 MB
PDF)
Figure S4 Results KeyPoint analysis mutant population.
Found at: doi:10.1371/journal.pone.0004761.s004 (0.02 MB
PDF)
Figure S5 Results KeyPoint analysis on natural populations.
Found at: doi:10.1371/journal.pone.0004761.s005 (0.03 MB
PDF)
Acknowledgments
We thank the Specialized Lab Unit of Keygene NV for excellent technical
assistance, Marga Beekhuizen for taking care of the tomato plants and
Marleen Zilstra for graphical assistance. We are grateful to Professor Dani
Zamir for construction of the EMS population and EU-SOL for access to
the core collection lines used in this study. The KeyPointTM technology is
covered by patent applications owned by Keygene NV. Application for
trademark registration for KeyPoint has been filed by Keygene NV. Other
(registered) trademarks are the property of the respective owners.
Author Contributions
Conceived and designed the experiments: DR NJvO RCJH MTJdB
MJTvE. Performed the experiments: DR AB HS HvdP. Contributed
reagents/materials/analysis tools: JvO AJ. Wrote the paper: DR MJTvE.
References
1. Ahloowalia BS, Maluszynsky M, Nichterlein K (2004) Global impact of
mutation-derived varieties. Euphytica 135: 187–204.2. Hestekin CN, Barron AE (2006) The potential of electrophoretic mobility shift
assays for clinical mutation detection. Electrophoresis 27: 3805–3815.
3. Montgomery J, Wittwer CT, Palais R, Zhou L (2007) Simultaneous mutationscanning and genotyping by high-resolution DNA melting analysis. Nat
Protocols 2: 59–66.4. Den Dunnen JT, van Ommen GJ (1999) The protein truncation test: A review.
Hum Mutation 14: 95–102.
5. Taylor GR (1999) Enzymatic and chemical cleavage methods. Electrophoresis20(6): 1125–1130.
6. Jenkins GJS (2004) The restriction site mutation (RSM) method: clinicalapplications. Mutagenesis 19: 3–11.
7. Li J, Berbeco R, Distel RJ, Janne PA, Wang L, et al. (2007) s-RT-MELT forrapid mutation scanning using enzymatic selection and real time DNA-melting:
new potential for multiplex genetic analysis. Nucleic Acids Res 35: e84.
8. McCallum CM, Comai L, Greene EA, Henikoff S (2000) Targeted screening forinduced mutations. Nat Biotechnol 18: 455–457.
9. Colbert T, Till BJ, Tompa R, Reynolds S, Steine MN, et al. (2001) High-throughput screening for induced point mutations. Plant Physiol 126: 480–484.
10. Gilchrist EJ, Haughn GW (2005) Tilling without a plough; a new method with
application for reverse genetics. Curr Opinion Plant Biol 8: 211–215.
11. Comai L, Young K, Till BJ, Reynolds SH, Greene EA, et al. (2004) Efficient
discovery of DNA polymorphism in natural populations by Ecotilling. Plant J 37:778–86.
12. Sood R, English MA, Jones M, Mullikin J, Wang DM, et al. (2006) Methods for
reverse genetic screening in zebrafish by resequencing and TILLING. Methods39(3): 220–227.
13. Gilchrist E, O’Neil N, Rose A, Zetka M, Haughn G (2006) TILLING is aneffective reverse genetics technique for Caenorhabditis elegans. BMC Genomics
7: 262.
14. Greene EA, Codomo CA, Taylor NE, Henikoff JG, Till BJ, et al. (2003)Spectrum of chemically induced mutations from a large-scale reverse-genetic
screen in Arabidopsis. Genetics 164: 731–740.15. Suzuki T, Eiguchi M, Kumamaru T, Satoh H, Matsusaka H, et al. (2008) MNU-
induced mutant pools and high performance TILLING enable finding of anygene mutation in rice. Mol Genet Genomics 279: 213–23.
16. Cooper JL, Till BJ, Laport RG, Darlow MC, Kleffner JM, et al. (2008)
TILLING to detect induced mutations in soybean. BMC Plant Biology 8: 9.17. Slade AJ, Fuerstenberg SI, Loeffler D, Steine MN, Facciotti D (2005) A reverse
genetic, non-transgenic approach to wheat crop improvement by TILLING. NatBiotechnology 23: 75–81.
18. Till BJ, Reynolds SH, Weil C, Springer N, Burtner C, et al. (2004) Discovery of
induced point mutations in maize genes by TILLING. BMC Plant Biology 4: 12.
KeyPoint Technology
PLoS ONE | www.plosone.org 8 March 2009 | Volume 4 | Issue 3 | e4761

19. Till B J, Zerr T, Comai L, Henikoff S (2006) A protocol for TILLING and
Ecotilling in plants and animals. Nature Protocols 1: 2465–2477.20. Margulies M, Egholm M, Altman WE, Attiya S, Bader JS, et al. (2005) Genome
sequencing in microfabricated high-density picolitre reactors. Nature 437:
376–380.21. Menda N, Semel Y, Peled D, Eshed Y, Zamir D (2004) In silico screening of a
saturated mutation library of tomato. Plant J 38: 861–872.22. Stuart CN, Via LE (1993) A rapid CTAB DNA isolation technique useful for
RAPD fingerprinting and other PCR applications. Biotechniques 14: 748–750.
23. Ruffel S, Gallois JL, Lesage ML, Caranta C (2005) The recessive potyvirusresistance gene pot-1 is the tomato orthologue of the pepper pvr2-eIF4E gene.
Mol Gen Genomics 274: 346–353.
24. van Orsouw NJ, Hogers RC, Janssen A, Yalcin F, Snoeijers S, et al. (2007)
Complexity Reduction of Polymorphic Sequences (CRoPSTM): A NovelApproach for Large-Scale Polymorphism Discovery in Complex Genomes.
PLoS One 2: e1172.
25. Huse SM, Huber JA, Morrison HG, Sogin ML, Welch DM (2007) Accuracy andquality of massively parallel DNA pyrosequencing. Genome Biology 8(7): R143.
26. Wang C, Mitsuya Y, Gharizadeh B, Ronaghi M, Shafer RW (2007)Characterization of mutation spectra with ultra-deep pyrosequencing: applica-
tion to HIV-1 drug resistance. Genome Res 17(8): 1195–201.
27. Hoffmann C, Minkah N, Leipzig J, Wang G, Arens MQ, et al. (2007) DNA barcoding and pyrosequencing to identify rare HIV drug resistance mutations.
Nucleic Acids Res 35(13): e91.
KeyPoint Technology
PLoS ONE | www.plosone.org 9 March 2009 | Volume 4 | Issue 3 | e4761
Related Documents