ARTICLE Received 27 May 2015 | Accepted 1 Oct 2015 | Published 2 Nov 2015 High-throughput 3D tracking of bacteria on a standard phase contrast microscope K.M. Taute 1 , S. Gude 1 , S.J. Tans 1 & T.S. Shimizu 1 Bacteria employ diverse motility patterns in traversing complex three-dimensional (3D) natural habitats. 2D microscopy misses crucial features of 3D behaviour, but the applicability of existing 3D tracking techniques is constrained by their performance or ease of use. Here we present a simple, broadly applicable, high-throughput 3D bacterial tracking method for use in standard phase contrast microscopy. Bacteria are localized at micron-scale resolution over a range of 350 300 200 mm by maximizing image cross-correlations between their observed diffraction patterns and a reference library. We demonstrate the applicability of our technique to a range of bacterial species and exploit its high throughput to expose hidden contributions of bacterial individuality to population-level variability in motile behaviour. The simplicity of this powerful new tool for bacterial motility research renders 3D tracking accessible to a wider community and paves the way for investigations of bacterial motility in complex 3D environments. DOI: 10.1038/ncomms9776 OPEN 1 FOMInstitute AMOLF, Science Park 104, 1098 XG Amsterdam, The Netherlands. Correspondence and requests for materials should be addressed to T.S.S. (email: [email protected]). NATURE COMMUNICATIONS | 6:8776 | DOI: 10.1038/ncomms9776 | www.nature.com/naturecommunications 1 & 2015 Macmillan Publishers Limited. All rights reserved.

Welcome message from author
This document is posted to help you gain knowledge. Please leave a comment to let me know what you think about it! Share it to your friends and learn new things together.
Transcript
ARTICLE
Received 27 May 2015 | Accepted 1 Oct 2015 | Published 2 Nov 2015
High-throughput 3D tracking of bacteriaon a standard phase contrast microscopeK.M. Taute1, S. Gude1, S.J. Tans1 & T.S. Shimizu1
Bacteria employ diverse motility patterns in traversing complex three-dimensional (3D)
natural habitats. 2D microscopy misses crucial features of 3D behaviour, but the applicability
of existing 3D tracking techniques is constrained by their performance or ease of use. Here
we present a simple, broadly applicable, high-throughput 3D bacterial tracking method for
use in standard phase contrast microscopy. Bacteria are localized at micron-scale resolution
over a range of 350� 300� 200mm by maximizing image cross-correlations between their
observed diffraction patterns and a reference library. We demonstrate the applicability of our
technique to a range of bacterial species and exploit its high throughput to expose hidden
contributions of bacterial individuality to population-level variability in motile behaviour. The
simplicity of this powerful new tool for bacterial motility research renders 3D tracking
accessible to a wider community and paves the way for investigations of bacterial motility in
complex 3D environments.
DOI: 10.1038/ncomms9776 OPEN
1 FOM Institute AMOLF, Science Park 104, 1098 XG Amsterdam, The Netherlands. Correspondence and requests for materials should be addressed to T.S.S.(email: [email protected]).
NATURE COMMUNICATIONS | 6:8776 | DOI: 10.1038/ncomms9776 | www.nature.com/naturecommunications 1
& 2015 Macmillan Publishers Limited. All rights reserved.
Natural habitats of swimming bacteria include complex3D environments such as oceans, soil and tissue.They navigate these terrains by 3D motility patterns
often characterized by stochastically alternating periods oflinear movement (‘runs’) and sudden reorientation (for example,‘tumbles’ for Escherichia coli, or ‘flicks’ and ‘reversals’ for Vibrioalginolyticus). These stochastic patterns are only apparentfrom individual trajectory data and are not accessible frompopulation-level measurements such as bacterial numberdensities. Bacterial trajectories can yield rich information, forinstance on the mechanism of chemotaxis1, the underlying signalprocessing2, interspecies differences in motility patterns3,4 andbehavioural individuality5,6, which may have important ecologicalramifications7.
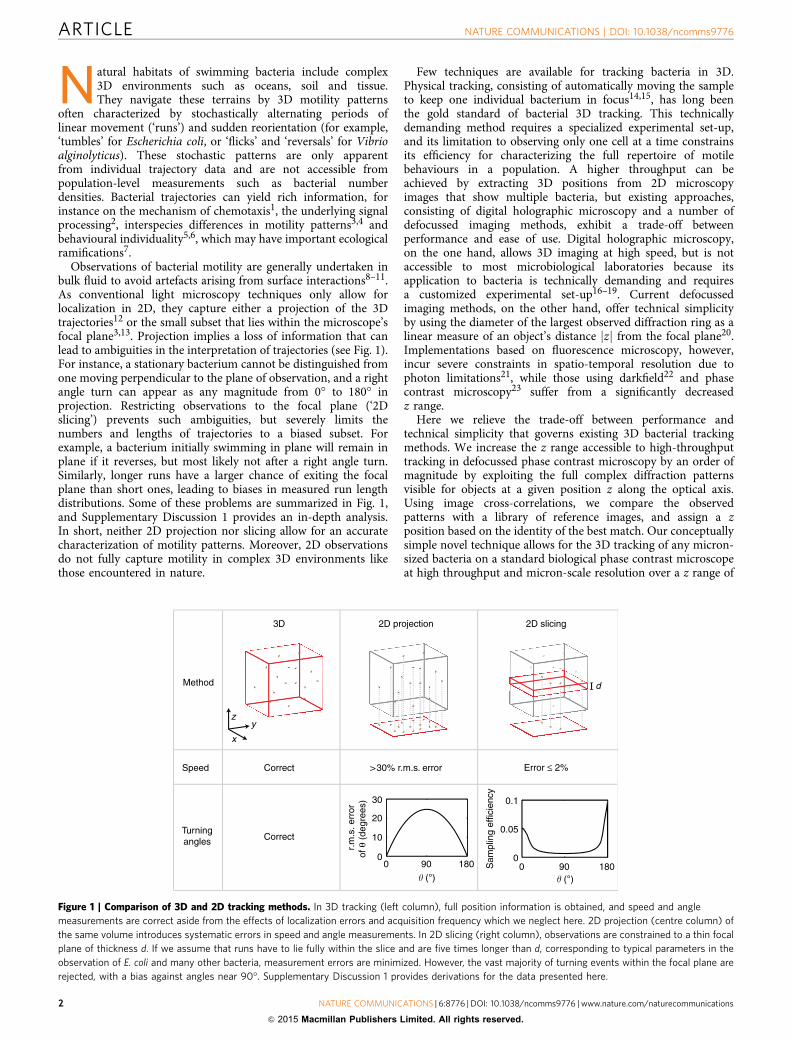
Observations of bacterial motility are generally undertaken inbulk fluid to avoid artefacts arising from surface interactions8–11.As conventional light microscopy techniques only allow forlocalization in 2D, they capture either a projection of the 3Dtrajectories12 or the small subset that lies within the microscope’sfocal plane3,13. Projection implies a loss of information that canlead to ambiguities in the interpretation of trajectories (see Fig. 1).For instance, a stationary bacterium cannot be distinguished fromone moving perpendicular to the plane of observation, and a rightangle turn can appear as any magnitude from 0� to 180� inprojection. Restricting observations to the focal plane (‘2Dslicing’) prevents such ambiguities, but severely limits thenumbers and lengths of trajectories to a biased subset. Forexample, a bacterium initially swimming in plane will remain inplane if it reverses, but most likely not after a right angle turn.Similarly, longer runs have a larger chance of exiting the focalplane than short ones, leading to biases in measured run lengthdistributions. Some of these problems are summarized in Fig. 1,and Supplementary Discussion 1 provides an in-depth analysis.In short, neither 2D projection nor slicing allow for an accuratecharacterization of motility patterns. Moreover, 2D observationsdo not fully capture motility in complex 3D environments likethose encountered in nature.
Few techniques are available for tracking bacteria in 3D.Physical tracking, consisting of automatically moving the sampleto keep one individual bacterium in focus14,15, has long beenthe gold standard of bacterial 3D tracking. This technicallydemanding method requires a specialized experimental set-up,and its limitation to observing only one cell at a time constrainsits efficiency for characterizing the full repertoire of motilebehaviours in a population. A higher throughput can beachieved by extracting 3D positions from 2D microscopyimages that show multiple bacteria, but existing approaches,consisting of digital holographic microscopy and a number ofdefocussed imaging methods, exhibit a trade-off betweenperformance and ease of use. Digital holographic microscopy,on the one hand, allows 3D imaging at high speed, but is notaccessible to most microbiological laboratories because itsapplication to bacteria is technically demanding and requiresa customized experimental set-up16–19. Current defocussedimaging methods, on the other hand, offer technical simplicityby using the diameter of the largest observed diffraction ring as alinear measure of an object’s distance zj j from the focal plane20.Implementations based on fluorescence microscopy, however,incur severe constraints in spatio-temporal resolution due tophoton limitations21, while those using darkfield22 and phasecontrast microscopy23 suffer from a significantly decreasedz range.
Here we relieve the trade-off between performance andtechnical simplicity that governs existing 3D bacterial trackingmethods. We increase the z range accessible to high-throughputtracking in defocussed phase contrast microscopy by an order ofmagnitude by exploiting the full complex diffraction patternsvisible for objects at a given position z along the optical axis.Using image cross-correlations, we compare the observedpatterns with a library of reference images, and assign a zposition based on the identity of the best match. Our conceptuallysimple novel technique allows for the 3D tracking of any micron-sized bacteria on a standard biological phase contrast microscopeat high throughput and micron-scale resolution over a z range of
0 90 1800
0.05
0.1
� (°)� (°)
Sam
plin
g ef
ficie
ncy
3D 2D projection 2D slicing
Speed Error ≤ 2%>30% r.m.s. error
Turningangles
0 90 1800
10
20
30
r.m
.s. e
rror
of θ
(de
gree
s)
Correct
Correct
Method
z
x
y
d
Figure 1 | Comparison of 3D and 2D tracking methods. In 3D tracking (left column), full position information is obtained, and speed and angle
measurements are correct aside from the effects of localization errors and acquisition frequency which we neglect here. 2D projection (centre column) of
the same volume introduces systematic errors in speed and angle measurements. In 2D slicing (right column), observations are constrained to a thin focal
plane of thickness d. If we assume that runs have to lie fully within the slice and are five times longer than d, corresponding to typical parameters in the
observation of E. coli and many other bacteria, measurement errors are minimized. However, the vast majority of turning events within the focal plane are
rejected, with a bias against angles near 90�. Supplementary Discussion 1 provides derivations for the data presented here.
ARTICLE NATURE COMMUNICATIONS | DOI: 10.1038/ncomms9776
2 NATURE COMMUNICATIONS | 6:8776 | DOI: 10.1038/ncomms9776 | www.nature.com/naturecommunications
& 2015 Macmillan Publishers Limited. All rights reserved.
200mm, and at a temporal rate that is limited only by the detectorreadout speed.
We demonstrate the power of our approach by harnessing itsthroughput, range and precision to reveal substantial and hithertounrecognized contributions of cell individuality to population-level variability in two canonical examples of bacterial motility:(i) the run-tumble behaviour of E. coli, and (ii) the run-reverse-flick behaviour of V. alginolyticus.
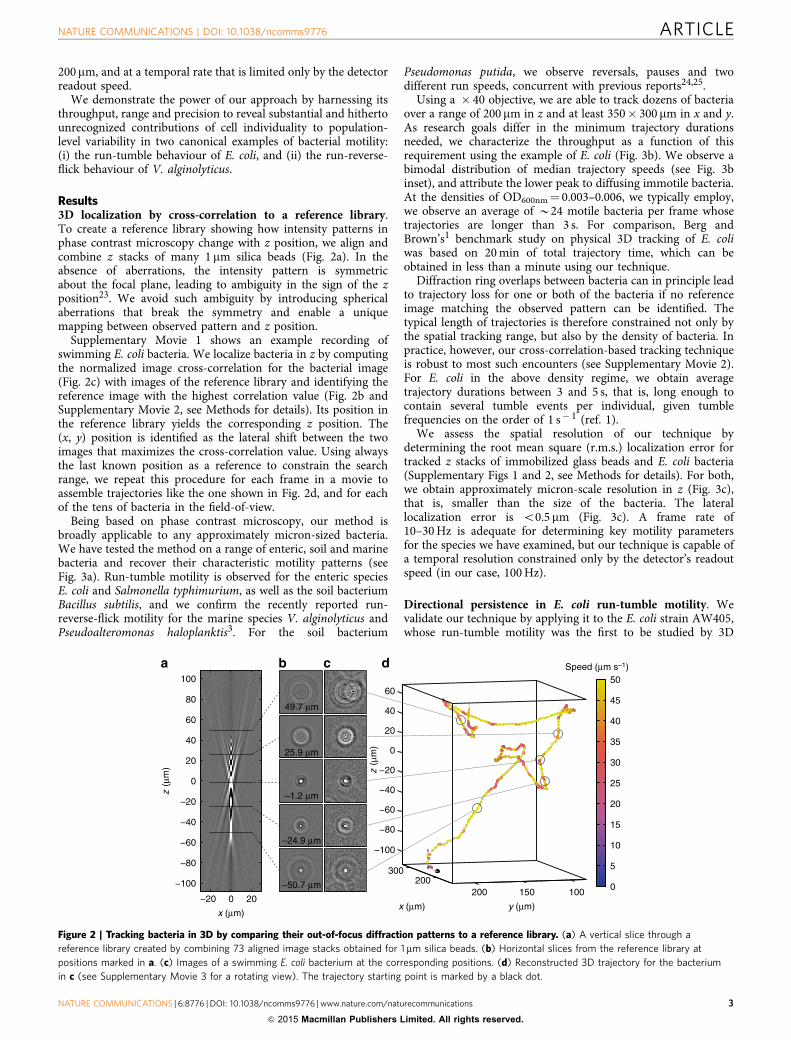
Results3D localization by cross-correlation to a reference library.To create a reference library showing how intensity patterns inphase contrast microscopy change with z position, we align andcombine z stacks of many 1 mm silica beads (Fig. 2a). In theabsence of aberrations, the intensity pattern is symmetricabout the focal plane, leading to ambiguity in the sign of the zposition23. We avoid such ambiguity by introducing sphericalaberrations that break the symmetry and enable a uniquemapping between observed pattern and z position.
Supplementary Movie 1 shows an example recording ofswimming E. coli bacteria. We localize bacteria in z by computingthe normalized image cross-correlation for the bacterial image(Fig. 2c) with images of the reference library and identifying thereference image with the highest correlation value (Fig. 2b andSupplementary Movie 2, see Methods for details). Its position inthe reference library yields the corresponding z position. The(x, y) position is identified as the lateral shift between the twoimages that maximizes the cross-correlation value. Using alwaysthe last known position as a reference to constrain the searchrange, we repeat this procedure for each frame in a movie toassemble trajectories like the one shown in Fig. 2d, and for eachof the tens of bacteria in the field-of-view.
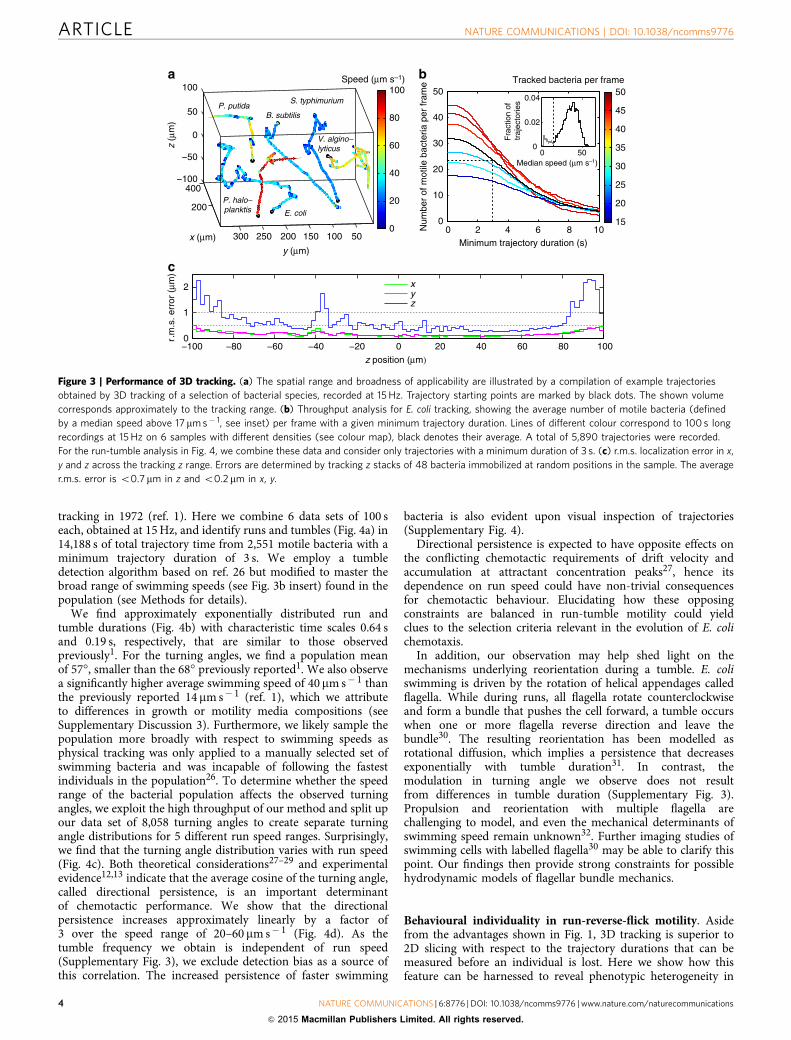
Being based on phase contrast microscopy, our method isbroadly applicable to any approximately micron-sized bacteria.We have tested the method on a range of enteric, soil and marinebacteria and recover their characteristic motility patterns (seeFig. 3a). Run-tumble motility is observed for the enteric speciesE. coli and Salmonella typhimurium, as well as the soil bacteriumBacillus subtilis, and we confirm the recently reported run-reverse-flick motility for the marine species V. alginolyticus andPseudoalteromonas haloplanktis3. For the soil bacterium
Pseudomonas putida, we observe reversals, pauses and twodifferent run speeds, concurrent with previous reports24,25.
Using a � 40 objective, we are able to track dozens of bacteriaover a range of 200 mm in z and at least 350� 300 mm in x and y.As research goals differ in the minimum trajectory durationsneeded, we characterize the throughput as a function of thisrequirement using the example of E. coli (Fig. 3b). We observe abimodal distribution of median trajectory speeds (see Fig. 3binset), and attribute the lower peak to diffusing immotile bacteria.At the densities of OD600nm¼ 0.003–0.006, we typically employ,we observe an average of B24 motile bacteria per frame whosetrajectories are longer than 3 s. For comparison, Berg andBrown’s1 benchmark study on physical 3D tracking of E. coliwas based on 20 min of total trajectory time, which can beobtained in less than a minute using our technique.
Diffraction ring overlaps between bacteria can in principle leadto trajectory loss for one or both of the bacteria if no referenceimage matching the observed pattern can be identified. Thetypical length of trajectories is therefore constrained not only bythe spatial tracking range, but also by the density of bacteria. Inpractice, however, our cross-correlation-based tracking techniqueis robust to most such encounters (see Supplementary Movie 2).For E. coli in the above density regime, we obtain averagetrajectory durations between 3 and 5 s, that is, long enough tocontain several tumble events per individual, given tumblefrequencies on the order of 1 s� 1 (ref. 1).
We assess the spatial resolution of our technique bydetermining the root mean square (r.m.s.) localization error fortracked z stacks of immobilized glass beads and E. coli bacteria(Supplementary Figs 1 and 2, see Methods for details). For both,we obtain approximately micron-scale resolution in z (Fig. 3c),that is, smaller than the size of the bacteria. The laterallocalization error is o0.5 mm (Fig. 3c). A frame rate of10–30 Hz is adequate for determining key motility parametersfor the species we have examined, but our technique is capable ofa temporal resolution constrained only by the detector’s readoutspeed (in our case, 100 Hz).
Directional persistence in E. coli run-tumble motility. Wevalidate our technique by applying it to the E. coli strain AW405,whose run-tumble motility was the first to be studied by 3D
200300
100150200
−100
−80
−60
−40
−20
0
20
40
60
Speed (μm s–1)
0
5
10
15
20
25
30
35
40
45
50
z (
μm) z (
μm)
x (μm)x (μm) y (μm)
−20 0 20
−100
−80
−60
−40
–20
0
20
40
60
80
100
49.7 μm
25.9 μm
–1.2 μm
–24.9 μm
–50.7 μm
a b c d
Figure 2 | Tracking bacteria in 3D by comparing their out-of-focus diffraction patterns to a reference library. (a) A vertical slice through a
reference library created by combining 73 aligned image stacks obtained for 1 mm silica beads. (b) Horizontal slices from the reference library at
positions marked in a. (c) Images of a swimming E. coli bacterium at the corresponding positions. (d) Reconstructed 3D trajectory for the bacterium
in c (see Supplementary Movie 3 for a rotating view). The trajectory starting point is marked by a black dot.
NATURE COMMUNICATIONS | DOI: 10.1038/ncomms9776 ARTICLE
NATURE COMMUNICATIONS | 6:8776 | DOI: 10.1038/ncomms9776 | www.nature.com/naturecommunications 3
& 2015 Macmillan Publishers Limited. All rights reserved.
tracking in 1972 (ref. 1). Here we combine 6 data sets of 100 seach, obtained at 15 Hz, and identify runs and tumbles (Fig. 4a) in14,188 s of total trajectory time from 2,551 motile bacteria with aminimum trajectory duration of 3 s. We employ a tumbledetection algorithm based on ref. 26 but modified to master thebroad range of swimming speeds (see Fig. 3b insert) found in thepopulation (see Methods for details).
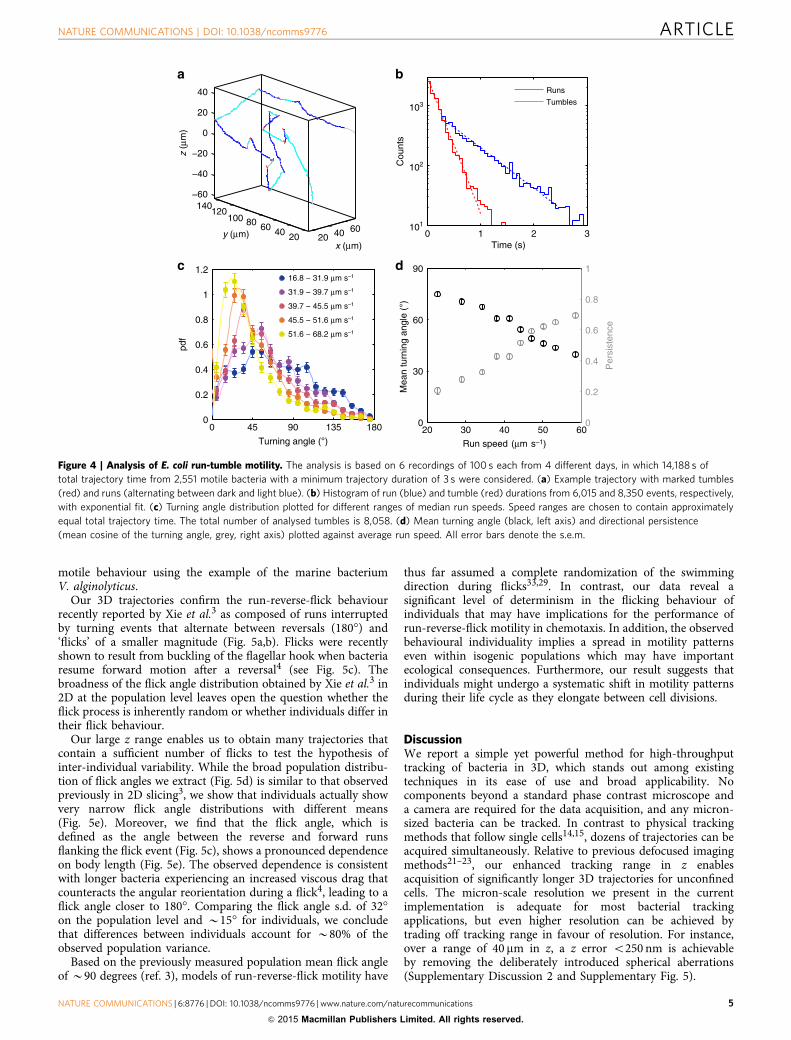
We find approximately exponentially distributed run andtumble durations (Fig. 4b) with characteristic time scales 0.64 sand 0.19 s, respectively, that are similar to those observedpreviously1. For the turning angles, we find a population meanof 57�, smaller than the 68� previously reported1. We also observea significantly higher average swimming speed of 40mm s� 1 thanthe previously reported 14mm s� 1 (ref. 1), which we attributeto differences in growth or motility media compositions (seeSupplementary Discussion 3). Furthermore, we likely sample thepopulation more broadly with respect to swimming speeds asphysical tracking was only applied to a manually selected set ofswimming bacteria and was incapable of following the fastestindividuals in the population26. To determine whether the speedrange of the bacterial population affects the observed turningangles, we exploit the high throughput of our method and split upour data set of 8,058 turning angles to create separate turningangle distributions for 5 different run speed ranges. Surprisingly,we find that the turning angle distribution varies with run speed(Fig. 4c). Both theoretical considerations27–29 and experimentalevidence12,13 indicate that the average cosine of the turning angle,called directional persistence, is an important determinantof chemotactic performance. We show that the directionalpersistence increases approximately linearly by a factor of3 over the speed range of 20–60 mm s� 1 (Fig. 4d). As thetumble frequency we obtain is independent of run speed(Supplementary Fig. 3), we exclude detection bias as a source ofthis correlation. The increased persistence of faster swimming
bacteria is also evident upon visual inspection of trajectories(Supplementary Fig. 4).
Directional persistence is expected to have opposite effects onthe conflicting chemotactic requirements of drift velocity andaccumulation at attractant concentration peaks27, hence itsdependence on run speed could have non-trivial consequencesfor chemotactic behaviour. Elucidating how these opposingconstraints are balanced in run-tumble motility could yieldclues to the selection criteria relevant in the evolution of E. colichemotaxis.
In addition, our observation may help shed light on themechanisms underlying reorientation during a tumble. E. coliswimming is driven by the rotation of helical appendages calledflagella. While during runs, all flagella rotate counterclockwiseand form a bundle that pushes the cell forward, a tumble occurswhen one or more flagella reverse direction and leave thebundle30. The resulting reorientation has been modelled asrotational diffusion, which implies a persistence that decreasesexponentially with tumble duration31. In contrast, themodulation in turning angle we observe does not resultfrom differences in tumble duration (Supplementary Fig. 3).Propulsion and reorientation with multiple flagella arechallenging to model, and even the mechanical determinants ofswimming speed remain unknown32. Further imaging studies ofswimming cells with labelled flagella30 may be able to clarify thispoint. Our findings then provide strong constraints for possiblehydrodynamic models of flagellar bundle mechanics.
Behavioural individuality in run-reverse-flick motility. Asidefrom the advantages shown in Fig. 1, 3D tracking is superior to2D slicing with respect to the trajectory durations that can bemeasured before an individual is lost. Here we show how thisfeature can be harnessed to reveal phenotypic heterogeneity in
0 2 4 6 8 100
10
20
30
40
50
Minimum trajectory duration (s)
Num
ber
of m
otile
bac
teria
per
fram
e Tracked bacteria per frame
15
20
25
30
35
40
45
50
0 500
0.02
0.04
Median speed (μm s–1)
Fra
ctio
n of
tr
ajec
torie
s
200
400
50100150200250300
−100
−50
0
50
100
V. algino−lyticus
S. typhimurium
E. coli
y (μm)
B. subtilis
P. halo−planktis
P. putida
x (μm)
z (μ
m)
Speed (μm s–1)
0
20
40
60
80
100
−100 −80 −60 −40 −20 0 20 40 60 80 1000
1
2
z position (μm)
r.m
.s. e
rror
(μm
)
xyz
a
c
b
Figure 3 | Performance of 3D tracking. (a) The spatial range and broadness of applicability are illustrated by a compilation of example trajectories
obtained by 3D tracking of a selection of bacterial species, recorded at 15 Hz. Trajectory starting points are marked by black dots. The shown volume
corresponds approximately to the tracking range. (b) Throughput analysis for E. coli tracking, showing the average number of motile bacteria (defined
by a median speed above 17 mm s� 1, see inset) per frame with a given minimum trajectory duration. Lines of different colour correspond to 100 s long
recordings at 15 Hz on 6 samples with different densities (see colour map), black denotes their average. A total of 5,890 trajectories were recorded.
For the run-tumble analysis in Fig. 4, we combine these data and consider only trajectories with a minimum duration of 3 s. (c) r.m.s. localization error in x,
y and z across the tracking z range. Errors are determined by tracking z stacks of 48 bacteria immobilized at random positions in the sample. The average
r.m.s. error is o0.7 mm in z and o0.2 mm in x, y.
ARTICLE NATURE COMMUNICATIONS | DOI: 10.1038/ncomms9776
4 NATURE COMMUNICATIONS | 6:8776 | DOI: 10.1038/ncomms9776 | www.nature.com/naturecommunications
& 2015 Macmillan Publishers Limited. All rights reserved.
motile behaviour using the example of the marine bacteriumV. alginolyticus.
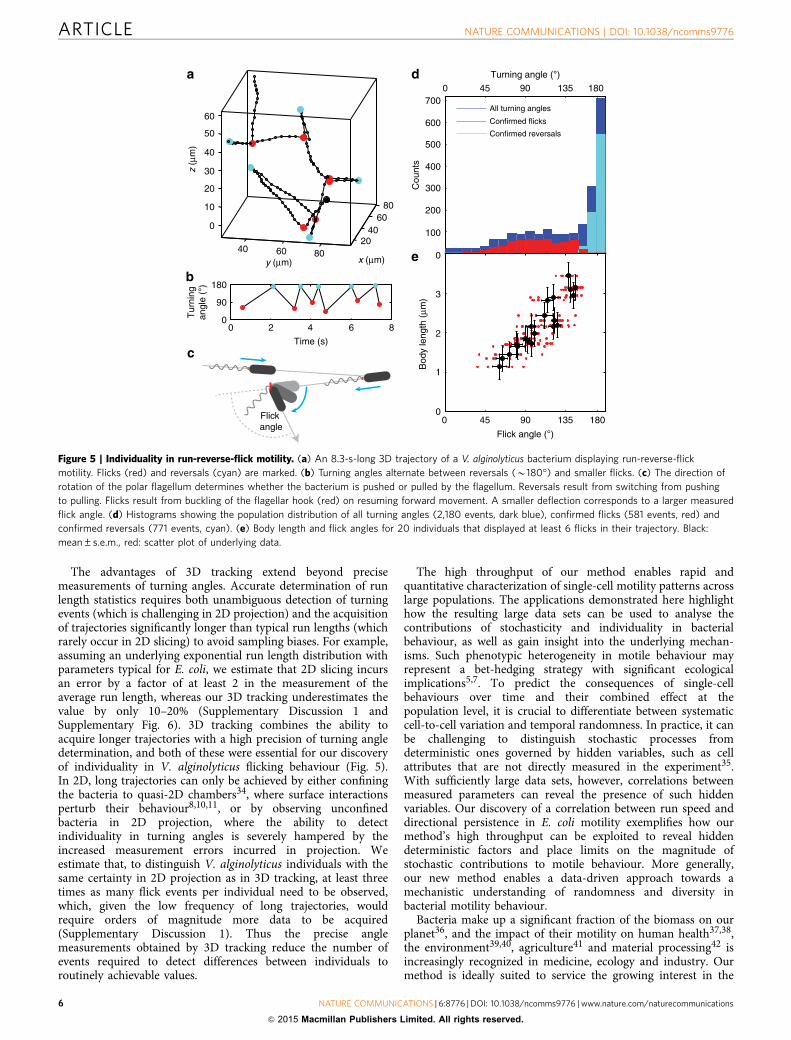
Our 3D trajectories confirm the run-reverse-flick behaviourrecently reported by Xie et al.3 as composed of runs interruptedby turning events that alternate between reversals (180�) and‘flicks’ of a smaller magnitude (Fig. 5a,b). Flicks were recentlyshown to result from buckling of the flagellar hook when bacteriaresume forward motion after a reversal4 (see Fig. 5c). Thebroadness of the flick angle distribution obtained by Xie et al.3 in2D at the population level leaves open the question whether theflick process is inherently random or whether individuals differ intheir flick behaviour.
Our large z range enables us to obtain many trajectories thatcontain a sufficient number of flicks to test the hypothesis ofinter-individual variability. While the broad population distribu-tion of flick angles we extract (Fig. 5d) is similar to that observedpreviously in 2D slicing3, we show that individuals actually showvery narrow flick angle distributions with different means(Fig. 5e). Moreover, we find that the flick angle, which isdefined as the angle between the reverse and forward runsflanking the flick event (Fig. 5c), shows a pronounced dependenceon body length (Fig. 5e). The observed dependence is consistentwith longer bacteria experiencing an increased viscous drag thatcounteracts the angular reorientation during a flick4, leading to aflick angle closer to 180�. Comparing the flick angle s.d. of 32�on the population level and B15� for individuals, we concludethat differences between individuals account for B80% of theobserved population variance.
Based on the previously measured population mean flick angleof B90 degrees (ref. 3), models of run-reverse-flick motility have
thus far assumed a complete randomization of the swimmingdirection during flicks33,29. In contrast, our data reveal asignificant level of determinism in the flicking behaviour ofindividuals that may have implications for the performance ofrun-reverse-flick motility in chemotaxis. In addition, the observedbehavioural individuality implies a spread in motility patternseven within isogenic populations which may have importantecological consequences. Furthermore, our result suggests thatindividuals might undergo a systematic shift in motility patternsduring their life cycle as they elongate between cell divisions.
DiscussionWe report a simple yet powerful method for high-throughputtracking of bacteria in 3D, which stands out among existingtechniques in its ease of use and broad applicability. Nocomponents beyond a standard phase contrast microscope anda camera are required for the data acquisition, and any micron-sized bacteria can be tracked. In contrast to physical trackingmethods that follow single cells14,15, dozens of trajectories can beacquired simultaneously. Relative to previous defocused imagingmethods21–23, our enhanced tracking range in z enablesacquisition of significantly longer 3D trajectories for unconfinedcells. The micron-scale resolution we present in the currentimplementation is adequate for most bacterial trackingapplications, but even higher resolution can be achieved bytrading off tracking range in favour of resolution. For instance,over a range of 40 mm in z, a z error o250 nm is achievableby removing the deliberately introduced spherical aberrations(Supplementary Discussion 2 and Supplementary Fig. 5).
20 30 40 50 600
30
60
90
Run speed (μm s–1)
Mea
n tu
rnin
g an
gle
(°)
0
0.2
0.4
0.6
0.8
1
Per
sist
ence
0 45 90 135 1800
0.2
0.4
0.6
0.8
1
1.2
Turning angle (°)
16.8 − 31.9 μm s–1
31.9 − 39.7 μm s–1
39.7 − 45.5 μm s–1
45.5 − 51.6 μm s–1
51.6 − 68.2 μm s–1
20 40 6020406080100
120140
−60
−40
−20
0
20
40
y (μm) x (μm)
z (μ
m)
0 1 2 3101
102
103
Time (s)
Cou
nts
Runs
Tumbles
a
c d
b
Figure 4 | Analysis of E. coli run-tumble motility. The analysis is based on 6 recordings of 100 s each from 4 different days, in which 14,188 s of
total trajectory time from 2,551 motile bacteria with a minimum trajectory duration of 3 s were considered. (a) Example trajectory with marked tumbles
(red) and runs (alternating between dark and light blue). (b) Histogram of run (blue) and tumble (red) durations from 6,015 and 8,350 events, respectively,
with exponential fit. (c) Turning angle distribution plotted for different ranges of median run speeds. Speed ranges are chosen to contain approximately
equal total trajectory time. The total number of analysed tumbles is 8,058. (d) Mean turning angle (black, left axis) and directional persistence
(mean cosine of the turning angle, grey, right axis) plotted against average run speed. All error bars denote the s.e.m.
NATURE COMMUNICATIONS | DOI: 10.1038/ncomms9776 ARTICLE
NATURE COMMUNICATIONS | 6:8776 | DOI: 10.1038/ncomms9776 | www.nature.com/naturecommunications 5
& 2015 Macmillan Publishers Limited. All rights reserved.
The advantages of 3D tracking extend beyond precisemeasurements of turning angles. Accurate determination of runlength statistics requires both unambiguous detection of turningevents (which is challenging in 2D projection) and the acquisitionof trajectories significantly longer than typical run lengths (whichrarely occur in 2D slicing) to avoid sampling biases. For example,assuming an underlying exponential run length distribution withparameters typical for E. coli, we estimate that 2D slicing incursan error by a factor of at least 2 in the measurement of theaverage run length, whereas our 3D tracking underestimates thevalue by only 10–20% (Supplementary Discussion 1 andSupplementary Fig. 6). 3D tracking combines the ability toacquire longer trajectories with a high precision of turning angledetermination, and both of these were essential for our discoveryof individuality in V. alginolyticus flicking behaviour (Fig. 5).In 2D, long trajectories can only be achieved by either confiningthe bacteria to quasi-2D chambers34, where surface interactionsperturb their behaviour8,10,11, or by observing unconfinedbacteria in 2D projection, where the ability to detectindividuality in turning angles is severely hampered by theincreased measurement errors incurred in projection. Weestimate that, to distinguish V. alginolyticus individuals with thesame certainty in 2D projection as in 3D tracking, at least threetimes as many flick events per individual need to be observed,which, given the low frequency of long trajectories, wouldrequire orders of magnitude more data to be acquired(Supplementary Discussion 1). Thus the precise anglemeasurements obtained by 3D tracking reduce the number ofevents required to detect differences between individuals toroutinely achievable values.
The high throughput of our method enables rapid andquantitative characterization of single-cell motility patterns acrosslarge populations. The applications demonstrated here highlighthow the resulting large data sets can be used to analyse thecontributions of stochasticity and individuality in bacterialbehaviour, as well as gain insight into the underlying mechan-isms. Such phenotypic heterogeneity in motile behaviour mayrepresent a bet-hedging strategy with significant ecologicalimplications5,7. To predict the consequences of single-cellbehaviours over time and their combined effect at thepopulation level, it is crucial to differentiate between systematiccell-to-cell variation and temporal randomness. In practice, it canbe challenging to distinguish stochastic processes fromdeterministic ones governed by hidden variables, such as cellattributes that are not directly measured in the experiment35.With sufficiently large data sets, however, correlations betweenmeasured parameters can reveal the presence of such hiddenvariables. Our discovery of a correlation between run speed anddirectional persistence in E. coli motility exemplifies how ourmethod’s high throughput can be exploited to reveal hiddendeterministic factors and place limits on the magnitude ofstochastic contributions to motile behaviour. More generally,our new method enables a data-driven approach towards amechanistic understanding of randomness and diversity inbacterial motility behaviour.
Bacteria make up a significant fraction of the biomass on ourplanet36, and the impact of their motility on human health37,38,the environment39,40, agriculture41 and material processing42 isincreasingly recognized in medicine, ecology and industry. Ourmethod is ideally suited to service the growing interest in the
2040
6080
40 60 80
0
10
20
30
40
50
60
x (μm)y (μm)
z (μ
m)
0 2 4 6 80
90
180
Time (s)
Tur
ning
angl
e (°
)
0 45 90 135 180
0
100
200
300
400
500
600
700
Turning angle (°)
Cou
nts
All turning angles
Confirmed flicks
Confirmed reversals
0 45 90 135 1800
1
2
3
Bod
y le
ngth
(μm
) Flick angle (°)
a d
e
b
c
Flick angle
Figure 5 | Individuality in run-reverse-flick motility. (a) An 8.3-s-long 3D trajectory of a V. alginolyticus bacterium displaying run-reverse-flick
motility. Flicks (red) and reversals (cyan) are marked. (b) Turning angles alternate between reversals (B180�) and smaller flicks. (c) The direction of
rotation of the polar flagellum determines whether the bacterium is pushed or pulled by the flagellum. Reversals result from switching from pushing
to pulling. Flicks result from buckling of the flagellar hook (red) on resuming forward movement. A smaller deflection corresponds to a larger measured
flick angle. (d) Histograms showing the population distribution of all turning angles (2,180 events, dark blue), confirmed flicks (581 events, red) and
confirmed reversals (771 events, cyan). (e) Body length and flick angles for 20 individuals that displayed at least 6 flicks in their trajectory. Black:
mean±s.e.m., red: scatter plot of underlying data.
ARTICLE NATURE COMMUNICATIONS | DOI: 10.1038/ncomms9776
6 NATURE COMMUNICATIONS | 6:8776 | DOI: 10.1038/ncomms9776 | www.nature.com/naturecommunications
& 2015 Macmillan Publishers Limited. All rights reserved.
study of bacterial motility across fields, as it enables accurate andefficient characterization of bacterial motility without specializedequipment. Because it does not require any labelling of bacteria, itis applicable to laboratory strains and natural/clinical isolatesalike. Since the technique is compatible with any assay amenableto phase contrast microscopy, it opens the doors to fullycapturing bacterial motility in a broad range of contexts frommicrofluidic platforms to complex 3D environments like thoseencountered in nature.
MethodsBacterial culturing. Overnight cultures of bacteria were inoculated from glycerolstocks stored at � 80 �C. Day cultures were inoculated with 40 ml overnight culturein 10 ml growth medium and grown in 100 ml culture flasks being shaken at200 r.p.m. Table 1 lists the bacterial strains, culture media and temperatures, andTable 2 the media compositions. Bacteria were harvested from the day cultures inmid-exponential phase. For dissimilar growth and motility medium, bacteria weredecanted into 50 ml plastic tubes and washed by three rounds of centrifugation(5 min at 5 k r.p.m. at 21� C in an Eppendorf 5804 R centrifuge), each followed bygentle resuspension in 10 ml motility medium. Bacteria were used for imagingwithin 2 h after washing.
Bacterial sample preparation. Sample chambers with a height of B300mm werecreated by using three layers of parafilm as a spacer between a microscopy slide andan 18� 18 mm #1 coverslip (Menzel Glaser, thickness 150±3 mm). The chamberwas heated on a hotplate and pressed to seal. Bacteria were diluted to a targetoptical density of 0.003–0.006 at 600 nm in the appropriate motility medium andflowed into the chamber via capillary forces. The ends of the chamber were thensealed with hot valap (a mixture of vaseline, lanolin and paraffin).
Microscopy and data acquisition. The sample chamber was placed on a NikonTE2000-U inverted optical microscope equipped with an air condenser(Nikon LWD, numerical aperture (NA) 0.52) and a � 40 phase contrast lens(Nikon, S Plan Fluor ELWD, � 40, Ph2, NA 0.6). We set the objective lens’scorrection collar to 1.2 mm to introduce spherical aberrations, which introduceasymmetry about the focal plane in the point spread function and avoidlocalization problems near the focus. As an alternative to using the correctioncollar, spherical aberrations can also be introduced by imaging through a thickersubstrate than the objective lens is optimized for, for example, a slide instead of acoverslip. We verified that the point spread function is robust to day-to-daychanges in the optical set-up as may arise from temporary removal of componentssuch as camera and objective lens, readjustments of movable parts such as fieldstops, small errors in the correction collar setting and the variation of coverslipthickness within one package, (± 3mm). For recordings, we moved the sample100mm towards the objective lens relative to the chamber’s inner bottom surface,corresponding to a focal position 133 mm inside the sample, given the refractiveindex of nMotM¼ 1.334 of our motility medium. The illumination was adjusted toproduce B20,000 counts per pixel. For each recording, 1,500 frames were acquiredat a frame rate of 15 Hz and an exposure time of 5 ms using a PCO.edge sCMOScamera (pixel size 6.5 mm, 2,560� 2,160 pixels). The data were saved as a series of16-bit tiff files of 193 images each, corresponding to a maximum file size of 2 GB.
Background correction. To remove unwanted background features, we adopt amedian-based correction technique. For each movie file, we compute the pixel-wisemedian of all contained images. We then divide each image by this median and
multiply by 20,000 to approximately restore the original mean intensity. Thisprocedure removes all stationary objects and creates a flat background.
Image cross-correlation. The normalized cross-correlation of two image matricesI1 and I2 is given by
C I1; I2ð Þ ¼ I1 � I1h ið Þ I2 � I2h ið Þh is I1ð Þs I2ð Þ
: ð1Þ
Here :::h i and s(...) denote the mean and s.d. across all pixels. In practice, imagesare subject to noise:
Ii ¼ Fi þNi; ð2Þwhere Ni refers to the noise and Fi to the feature of interest. What is generallyof interest is a measure of the similarity of the noisefree features of two images,C(F1, F2). Inserting equation (2) into equation (1), and assuming that the noise haszero mean and is uncorrelated with features or between different images, we find
C I1; I2ð Þ ¼ C F1; F2ð ÞX � 11 X � 1
2 : ð3Þ
which allows a conversion from the readily computed C(I1, I2) to the desiredC(F1, F2) via the correction factors
Xi ¼s Iið Þffiffiffiffiffiffiffiffiffiffiffiffiffiffiffiffiffiffiffiffiffiffiffiffiffiffiffiffiffiffi
s2 Iið Þ� s2 Nið Þp ð4Þ
which can be computed if the variance of the noise, s2(Ni), is known. For motilitymovies, we estimate a fixed value for the noise variance based on the variance of thebackground by measuring the inter-pixel intensity variance in areas of the samplethat show no features, but only background. For the reference library, the noisevaries between images as they differ in the amount of data contributing to them.We therefore estimate the noise separately for each image of the reference library.
Image cross-correlations are computed via fast Fourier transforms on regions ofinterest of 256� 256 pixels. The output is a matrix whose indices give the cross-correlation values for each possible lateral shift of the images against each other.
Reference stack generation. Reference stacks were created from images ofspherical beads rather than bacteria, which are generally elongated and oriented inrandom directions. The symmetry of the beads eases alignment of different stacksfor averaging, and prevents a bacterium’s orientation in the x–y plane fromaffecting its cross-correlation to the reference image. Glass beads with a nominaldiameter of 1 mm (PSi-1.0, Kisker Biotech, Germany) were empirically determinedto produce contrast similar to bacteria in phase contrast microscopy. To facilitateimage acquisition at defined positions relative to the focus with a surroundingmedium of refractive index similar to media used in motility assays, the beads wereimmobilized in a 3% polyacrylamide (PAC) gel. The refractive index of the gel atthis concentration is nPAC3¼ 1.338, comparable to nMotM¼ 1.334 measured formotility medium. Refractive index measurements were performed with a hand-heldrefractometer calibrated against sucrose solutions of known concentrations. Lowerconcentrations of acrylamide were found not to solidify. From a 50 mg ml� 1 stocksolution, the beads were diluted 1:100 into an acrylamide solution (375 ml 40%acrylamide, 4.57 ml H2O, 50 ml 10% ammonium persulfate in H2O, 5 ml N,N,N0 ,N0-tetramethylethane-1,2-diamine) which was then flowed into a sample chamber asdescribed above and sealed with nail polish. Once the PAC solution had solidified,image stacks were acquired of the now immobilized glass beads. Focal plane andimaging conditions were as for live bacteria. Using a piezo stage with a range of200 mm, the sample was moved in 1,000 steps of Dx¼ 100 nm, centred about thefocal plane, and one image acquired at each position. These steps correspond tosteps in focal plane by nDx¼ 134 nm inside the sample.
For each bead localized inside the scanned volume, a substack of 512� 512pixels in x and y approximately centred laterally about the bead was extracted.
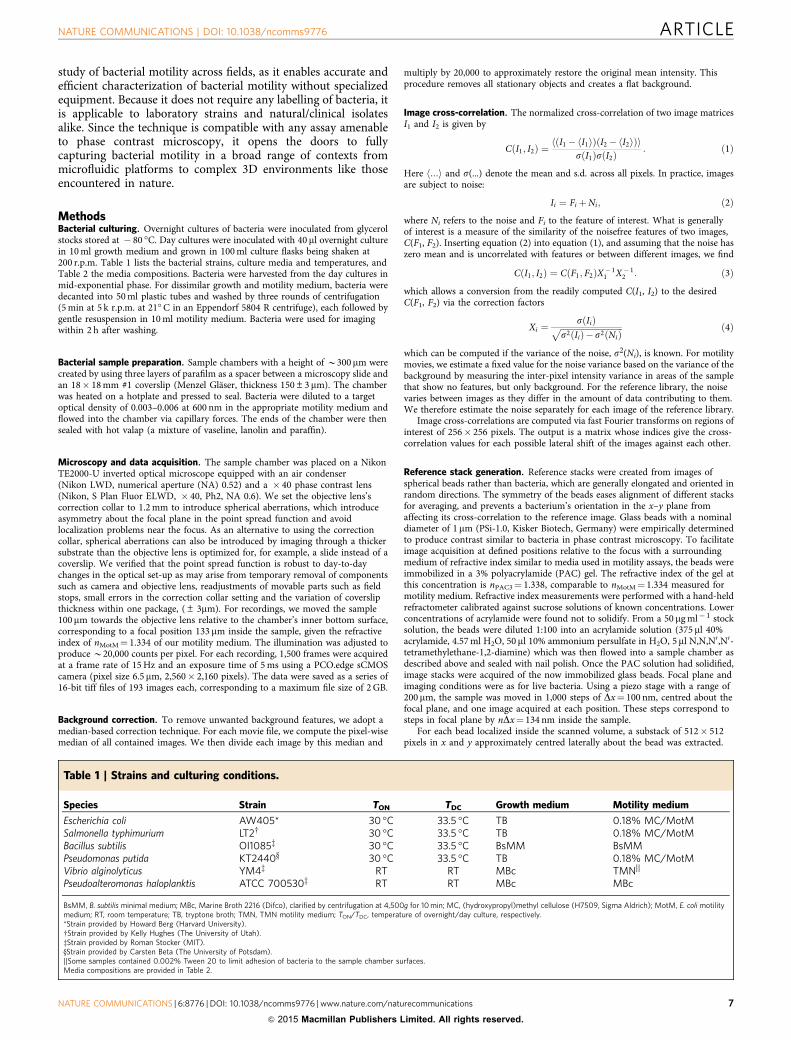
Table 1 | Strains and culturing conditions.
Species Strain TON TDC Growth medium Motility medium
Escherichia coli AW405* 30 �C 33.5 �C TB 0.18% MC/MotMSalmonella typhimurium LT2w 30 �C 33.5 �C TB 0.18% MC/MotMBacillus subtilis OI1085z 30 �C 33.5 �C BsMM BsMMPseudomonas putida KT2440y 30 �C 33.5 �C TB 0.18% MC/MotMVibrio alginolyticus YM4z RT RT MBc TMN||
Pseudoalteromonas haloplanktis ATCC 700530z RT RT MBc MBc
BsMM, B. subtilis minimal medium; MBc, Marine Broth 2216 (Difco), clarified by centrifugation at 4,500g for 10 min; MC, (hydroxypropyl)methyl cellulose (H7509, Sigma Aldrich); MotM, E. coli motilitymedium; RT, room temperature; TB, tryptone broth; TMN, TMN motility medium; TON/TDC, temperature of overnight/day culture, respectively.*Strain provided by Howard Berg (Harvard University).wStrain provided by Kelly Hughes (The University of Utah).zStrain provided by Roman Stocker (MIT).yStrain provided by Carsten Beta (The University of Potsdam).||Some samples contained 0.002% Tween 20 to limit adhesion of bacteria to the sample chamber surfaces.Media compositions are provided in Table 2.
NATURE COMMUNICATIONS | DOI: 10.1038/ncomms9776 ARTICLE
NATURE COMMUNICATIONS | 6:8776 | DOI: 10.1038/ncomms9776 | www.nature.com/naturecommunications 7
& 2015 Macmillan Publishers Limited. All rights reserved.
The substacks were background-corrected based on the median across the entiresubstack.
As beads were located at unknown random positions in x, y and z, theirimage stacks need to be aligned relative to each other before being combined.3D cross-correlations can be employed to determine their 3D positions relative toeach other. For each bead k, a 3D array Bk consisting of the inner 256� 256 pixelregion of its image stack is created. For one arbitrary, but fixed bead i and eachother bead j, the normalized 3D cross-correlation, Cij, of Bi and Bj is computed.Cij is another 3D array, with each entry representing the cross-correlation value ofthe arrays Bi and Bj at one particular 3D shift relative to each other. The position ofthe entry with the maximum value in Cij then reflects the 3D relative shift of thebeads i and j to each other.
With known relative 3D alignment, the full 512� 512 stacks could be combinedinto one reference library. Because the initial placement of the beads wasrandom across z, the substacks cover different ranges relative to the bead’s focus.Conversely, not every bead stack covers every possible z position relative to thebead’s focus. For each z position relative to the focus, an image was obtained as thepixel-wise median across the respective images from those substacks covering this zposition. Only those positions with at least 15 contributing substacks were retained.The resulting image stack covered 220 mm and was constructed from image stacksof 73 different beads.
Tracking algorithm. Tracking was implemented using a custom-written Matlab(The MathWorks) programme. Briefly, once a bacterium is identified, it is trackedboth forwards and backwards in time, always using the last known position toconstrain the search radius in all three spatial dimensions.
Positions are determined in a multistep procedure. A 256� 256 pixel region-of-interest around the last known position is cross-correlated against a substack of thereference library centred about the last known z position. For each reference imagein the substack, the maximum cross-correlation value across a range of lateral shiftsis determined. The search range is set to cover the maximal displacement possibleat the maximum plausible bacterial swimming speed, which we estimate as150mm s� 1 for the marine bacteria and 100mm s� 1 for the other species.
A 13-point neighbourhood around the maximum cross-correlation value isfitted with a second order polynomial to extract the z position of the maximum.The position of the parabola’s maximum is rounded to the z position of the nearest
reference image, which is taken as the object’s z position. The new lateral positionis determined from the lateral shift at which the cross-correlation with the chosenreference image is maximal. If the cross-correlation value at the determinedposition is lower than a retention threshold (typically set to 0.35), the trajectoryends. This can occur when the diffraction pattern of the tracked bacterium overlapswith another one with higher contrast. Positions are also rejected if they lieat the edge of the search range. This typically occurs when bacteria leave thetracking range.
For each frame, putative new bacteria are identified using a thresholdingprocedure. Briefly, the absolute difference to the image median is computed,and a threshold applied to create a binary image. Typical threshold values used are0.03–0.1 times the image median. The binary image is eroded to avoid spuriousnoise, followed by dilation to fill in gaps between diffraction rings. Disks with radiiof 3 pixels and 30 pixels are used as structuring elements for erosion and dilation,respectively. The resulting image is segmented, and the centroids of segments aretaken as putative lateral bacterial locations. Locations within a threshold lateraldistance of 60 pixels to known bacteria or 130 pixels to the image border arerejected. These distances are set deliberately large so as to accommodate theuncertainty of the putative locations.
For each remaining putative location, the reference library is searched for amatching image. The detection procedure is not sensitive enough to identifybacteria throughout the entire tracking range, therefore we constrain the search toapproximately the inner 60% of the reference library and thus miss trajectories thatnever enter this range. If a correlation with a reference image above an acceptancethreshold (typically set at 0.6) is found, a new trajectory is created if the positiondoes not lie within a joining distance to a known bacterium. We typically use ajoining distance of 10 pixels in x and y and 30 reference library slices with a spacingof 134 nm in z. Upon creation, the bacterium is tracked backwards in time. If itsposition at a frame in the past lies within the joining distance of the position atwhich another trajectory ended at the same frame, the trajectories are joined.
Our custom Matlab-based implementation of the tracking algorithm is availableon request. A user-friendly version is under development for release at a later date.
Determination of localization precision. To determine the localization precisionof our technique for bacteria, we prepared stacks for immobilized E. coli as for glassbeads above, but with either 100 or 200 nm steps between frames. The trackingprocedure was then applied to stacks of glass beads and bacteria. For glass beads,a rotated version of the reference library (180� about the z axis) is used to avoidartefacts from spurious correlations due to the fact that the reference library wascreated from these same stacks of 73 glass beads. For x and y, localization errorswere determined as s.d. of the lateral position. For z, localization errors aredetermined as the residuals of a linear fit to the extracted z position against theknown z position. As the magnitude of these errors depends on the z position, wecompute the r.m.s. error across 48 different bacteria for bins with a width of 2 mmin z (Fig. 3c).
E. coli run-tumble analysis. From the trajectories obtained from our trackingprocedure, velocities are computed as the fourth order central difference26,
vi ¼8 xiþ 1 � xi� 1ð Þ� xiþ 2 � xi� 2ð Þ
12T; ð5Þ
where T¼ 1/15 s is the time between frames, and direction changes Dcð Þ as theangles between subsequent velocity vectors.
We only consider trajectories that span at least 3 s and show a median speedlarger than 17mm s� 1. Our run-tumble calling algorithm follows the procedurelaid out by ref. 26 in that a run ends at time point ti if either Dci;Dciþ 14ac or ifDci4ac and the angle between the sum of the velocities from ti� 2� ti and thosefrom ti þ 1� tiþ 3 also exceed ac. A new run begins at ti if Dci;Dciþ 1;Dciþ 2oac.A run hence has a minimal duration of four time points, while a tumble can havezero length.
To cope with the large range of swimming speeds present in the bacterialpopulation, the threshold ac is determined relative to the median direction change,Dcmed, each individual displays during runs: ac ¼ cEDcmed, as opposed to using afixed absolute value as previously26. To arrive at a self-consistent definition of runs,we iterate this procedure 20 times. The number of tumbles found typicallystabilizes by about 10 iterations. The factor cE was chosen so as to balance the rateof missed tumbles and erroneously called tumbles based on visual inspection oftrajectories. At the chosen value of cE¼ 3, we observe B5% false negatives and5% false positives.
Turning angles are measured as the angle between the sum of the last threevelocity vectors of the run preceding the tumble and the first three of thesubsequent run.
V. alginolyticus run-reverse-flick analysis. For V. alginolyticus, we only considertrajectories that span at least 3 s and show a median speed larger than 40 mm s� 1 asflicks are rare at low speeds4. The average speed of motile bacteria is 48 mm s� 1. Todetect turning events, we employ a similar strategy as for the tumble detection forE. coli, with several modifications. First, rather than the iterative method used forE. coli, we fix the detection threshold at ac ¼ cVDcmed with cV¼ 4. Second, a new
Table 2 | Media used for growth and motility experiments.
Medium Composition
TB 1% bacto tryptone0.5% NaClpH 7.0
MBc Difco Marine Broth 2216Centrifuged to remove precipitate
MotM 10 mM KPO4
0.1 mM EDTA1mM L-methionine10 mM lactic acid0.067 mM NaClpH 7.0
BsMM 50 mM KPO4
1.2 mM MgCl20.14 mM CaCl21 mM (NH4)2SO4
0.01 mM MnCl220 mM sorbitol0.02% Bacto tryptone50mg ml� 1 L-histidine50mg ml� 1 L-methionine50mg ml� 1 L-tryptophanpH 7.0
TMN 50 mM Tris-HCl5 mM MgCl25 mM glucose300 mM NaClpH 7.5
BsMM, B. subtilis minimal medium; MBc, Marine Broth 2216 (Difco), clarified by centrifugation at4,500g for 10 min; MotM, E. coli motility medium; TB, tryptone broth; TMN, TMN motilitymedium.
ARTICLE NATURE COMMUNICATIONS | DOI: 10.1038/ncomms9776
8 NATURE COMMUNICATIONS | 6:8776 | DOI: 10.1038/ncomms9776 | www.nature.com/naturecommunications
& 2015 Macmillan Publishers Limited. All rights reserved.
run begins at ti if Dci;Dciþ 1oac, hence runs can be as short as three time points.And third, we measure turning angles between sums of two rather than threevelocity vectors.
Among these, we then identify flicks and reversals in a two-step procedure.First, if all even turning events within a trajectory with at least six events are at least2 s.d away from the mean of the odd turns, and vice versa, then the set with thesmaller mean is considered flicks and the other one reversals. If the odd and eventurns are not well-separated, then if a turn has a magnitude below a threshold andboth adjacent turns are above it, the middle turn is considered a flick and theadjacent ones reversals. Using a threshold of 155�, we identify 581 flicks and 771reversals out of 2,180 turns detected in more than 30 min of total trajectory time.
For a set of 20 trajectories that contained at least 6 flicks, body length wasmeasured from frames where the bacterium was swimming approximately in thex–y plane. Due to the spherical aberrations present, the bacterium’s body is visiblefor a range of z positions. We estimate an error of 2 pixels for the lengthmeasurement.
References1. Berg, H. & Brown, D. Chemotaxis in Escherichia coli analysed by three-
dimensional tracking. Nature 239, 500–504 (1972).2. Ahmed, T. & Stocker, R. Experimental verification of the behavioral foundation
of bacterial transport parameters using microfluidics. Biophys. J. 95, 4481–4493(2008).
3. Xie, L., Altindal, T., Chattopadhyay, S. & Wu, X.-L. Bacterial flagellum as apropeller and as a rudder for efficient chemotaxis. Proc. Natl Acad. Sci. USA108, 2246–2251 (2011).
4. Son, K., Guasto, J. S. & Stocker, R. Bacteria can exploit a flagellar bucklinginstability to change direction. Nat. Phys. 9, 494–498 (2013).
5. Spudich, J. & Koshland, D. Non-genetic individuality: chance in the single cell.Nature 262, 467–471 (1976).
6. Masson, J.-B., Voisinne, G., Wong-Ng, J., Celani, A. & Vergassola, M.Noninvasive inference of the molecular chemotactic response using bacterialtrajectories. Proc. Natl Acad. Sci. USA 109, 1802–1807 (2012).
7. Frankel, N. W. et al. Adaptability of non-genetic diversity in bacterialchemotaxis. eLife 3, e03526 (2014),
8. Frymier, P. & Ford, R. Three-dimensional tracking of motile bacteria near asolid planar surface. Proc. Natl Acad. Sci. USA 92, 6195–6199 (1995).
9. Berke, A., Turner, L., Berg, H. & Lauga, E. Hydrodynamic attraction ofswimming microorganisms by surfaces. Phys. Rev. Lett. 101, 038102 (2008).
10. Li, G., Tam, L.-K. & Tang, J. X. Amplified effect of Brownian motion inbacterial near-surface swimming. Proc. Natl Acad. Sci. USA 105, 18355–18359(2008).
11. Molaei, M., Barry, M., Stocker, R. & Sheng, J. Failed escape: solid surfacesprevent tumbling of Escherichia coli. Phys. Rev. Lett. 113, 068103 (2014).
12. Saragosti, J. et al. Directional persistence of chemotactic bacteria in a travelingconcentration wave. Proc. Natl Acad. Sci. USA 108, 16235–16240 (2011).
13. Bubendorfer, S., Koltai, M., Rossmann, F., Sourjik, V. & Thormann, K. M.Secondary bacterial flagellar system improves bacterial spreading by increasingthe directional persistence of swimming. Proc. Natl Acad. Sci. USA 111,11485–11490 (2014).
14. Berg, H. How to track bacteria. Rev. Sci. Instrum. 42, 868–871 (1971).15. Liu, B. et al. Helical motion of the cell body enhances Caulobacter crescentus
motility. Proc. Natl Acad. Sci. USA 111, 1–5 (2014).16. Garcia-Sucerquia, J. et al. Digital in-line holographic microscopy. Appl. Opt. 45,
836–850 (2006).17. Vater, S. M. et al. Swimming behavior of Pseudomonas aeruginosa studied by
holographic 3D tracking. PLoS ONE 9, e87765 (2014).18. Molaei, M. & Sheng, J. Imaging bacterial 3D motion using digital in-line
holographic microscopy and correlation-based de-noising algorithm. Opt.Express 22, 3232–3238 (2014).
19. Cheong, F. et al. Rapid, high-throughput tracking of bacterial motility in 3D viaphase-contrast holographic video microscopy. Biophys. J. 108, 1248–1256(2015).
20. Speidel, M., Jonas, A. & Florin, E.-L. Three-dimensional tracking of fluorescentnanoparticles with subnanometer precision by use of off-focus imaging. Opt.Lett. 28, 69–71 (2003).
21. Wu, M., Roberts, J. W., Kim, S., Koch, D. L. & DeLisa, M. P. Collective bacterialdynamics revealed using a three-dimensional population-scale defocusedparticle tracking technique. Appl. Environ. Microbiol. 72, 4987–4994 (2006).
22. Li, G. & Tang, J. Accumulation of microswimmers near a surface mediated bycollision and rotational brownian motion. Phys. Rev. Lett. 103, 078101 (2009).
23. Edwards, M. R., Carlsen, R. W., Zhuang, J. & Sitti, M. Swimmingcharacterization of Serratia marcescens for bio-hybrid micro-robotics.J. Micro-Bio Robot. 9, 47–60 (2014).
24. Duffy, K. & Ford, R. Turn angle and run time distributions characterize swimmingbehavior for Pseudomonas putida. J. Bacteriol. 179, 1428–1430 (1997).
25. Theves, M., Taktikos, J., Zaburdaev, V., Stark, H. & Beta, C. A bacterialswimmer with two alternating speeds of propagation. Biophys. J. 105,1915–1924 (2013).
26. Berg, H. & Brown, D. Chemotaxis in Escherichia coli analysed bythree-dimensional tracking. Antibiot. Chemother. 19, 55–78 (1974).
27. Locsei, J. T. Persistence of direction increases the drift velocity of run andtumble chemotaxis. J. Math. Biol. 55, 41–60 (2007).
28. Vladimirov, N., Lebiedz, D. & Sourjik, V. Predicted auxiliary navigationmechanism of peritrichously flagellated chemotactic bacteria. PLoS Comput.Biol. 6, e1000717 (2010).
29. Taktikos, J., Stark, H. & Zaburdaev, V. How the motility pattern of bacteriaaffects their dispersal and chemotaxis. PLoS ONE 8, e81936 (2013).
30. Turner, L., Ryu, W. & Berg, H. Real-time imaging of fluorescent flagellarfilaments. J. Bacteriol. 182 2793–2801 (2000).
31. Saragosti, J., Silberzan, P., Buguin, A. & Modeling, E. coli tumbles by rotationaldiffusion. Implications for chemotaxis. PLoS ONE 7, e35412 (2012).
32. Darnton, N. C., Turner, L., Rojevsky, S. & Berg, H. C. On torque and tumblingin swimming Escherichia coli. J. Bacteriol. 189, 1756–1764 (2007).
33. Altindal, T., Xie, L. & Wu, X.-L. Implications of three-step swimming patternsin bacterial chemotaxis. Biophys. J. 100, 32–41 (2011).
34. Sager, B. M., Sekelsky, J. J., Matsumura, P. & Adler, J. Use of a computer toassay motility in bacteria. Anal. Biochem. 173, 271–277 (1988).
35. Sandler, O. et al. Lineage correlations of single cell division time as a probe ofcell-cycle dynamics. Nature 519, 468–471 (2015).
36. Whitman, W. B., Coleman, D. C. & Wiebe, W. J. Prokaryotes: the unseenmajority. Proc. Natl Acad. Sci. USA 95, 6578–6583 (1998).
37. Terry, K., Williams, S. M., Connolly, L. & Ottemann, K. M. Chemotaxis playsmultiple roles during Helicobacter pylori animal infection. Infect. Immun. 73,803–811 (2005).
38. Lane, M. C., Alteri, C. J., Smith, S. N. & Mobley, H. L. T. Expression of flagellais coincident with uropathogenic Escherichia coli ascension to the upper urinarytract. Proc. Natl Acad. Sci. USA 104, 16669–16674 (2007).
39. Mitchell, J. G. & Kogure, K. Bacterial motility: links to the environment and adriving force for microbial physics. FEMS Microbiol. Ecol. 55, 3–16 (2006).
40. Berendsen, R. L., Pieterse, C. M. J. & Bakker, P. A. H. M. The rhizospheremicrobiome and plant health. Trends Plant Sci. 17, 478–486 (2012).
41. Lopez-Garca, S. L. et al. In-furrow inoculation and selection for higher motilityenhances the efficacy of Bradyrhizobium japonicum nodulation. Agron. J. 101,357–363 (2009).
42. Van Houdt, R. & Michiels, C. W. Biofilm formation and the food industry,a focus on the bacterial outer surface. J. Appl. Microbiol. 109, 1117–1131(2010).
AcknowledgementsWe would like to thank Howard Berg (Harvard University), Kelly Hughes (the Universityof Utah), Roman Stocker (MIT) and Carsten Beta (the University of Potsdam) for kindlysharing bacterial strains. This work is part of the research programme of the Foundationfor Fundamental Research on Matter (FOM), which is part of the NetherlandsOrganisation for Scientific Research (NWO). T.S.S. acknowledges support by thePaul G. Allen Family Foundation.
Author contributionsK.M.T., S.G., S.J.T. and T.S.S. conceived the method and devised the research; K.M.T.performed the experiments, wrote the tracking software and analysed the data;K.M.T. and S.G. performed the theoretical analyses in Supplementary Discussion 1;K.M.T. and T.S.S. wrote the manuscript with inputs from S.G. and S.J.T.
Additional informationSupplementary Information accompanies this paper at http://www.nature.com/naturecommunications
Competing financial interests: The authors declare no competing financial interests.
Reprints and permission information is available online at http://npg.nature.com/reprintsandpermissions/
How to cite this article: Taute, K. M. et al. High-throughput 3D tracking of bacteria on astandard phase contrast microscope. Nat. Commun. 6:8776 doi: 10.1038/ncomms9776(2015).
This work is licensed under a Creative Commons Attribution 4.0International License. The images or other third party material in this
article are included in the article’s Creative Commons license, unless indicated otherwisein the credit line; if the material is not included under the Creative Commons license,users will need to obtain permission from the license holder to reproduce the material.To view a copy of this license, visit http://creativecommons.org/licenses/by/4.0/
NATURE COMMUNICATIONS | DOI: 10.1038/ncomms9776 ARTICLE
NATURE COMMUNICATIONS | 6:8776 | DOI: 10.1038/ncomms9776 | www.nature.com/naturecommunications 9
& 2015 Macmillan Publishers Limited. All rights reserved.
Related Documents

![Engineering a vitamin B12 high-throughput screening system by riboswitch … · 2018. 5. 11. · 12 riboswitch has been found to widely regulate VB 12 biosynthesis in bacteria [15].](https://static.cupdf.com/doc/110x72/610e0818b285123cbc28e958/engineering-a-vitamin-b12-high-throughput-screening-system-by-riboswitch-2018-5.jpg)


