ORIGINAL PAPER High temperature structural and thermoelastic behaviour of mantle orthopyroxene: an in situ neutron powder diffraction study G. Diego Gatta Romano Rinaldi K. S. Knight G. Molin G. Artioli Received: 5 October 2006 / Accepted: 6 December 2006 / Published online: 26 January 2007 ȑ Springer-Verlag 2007 Abstract The temperature induced structural evolu- tion and thermoelastic behaviour of a natural (Pbca) orthopyroxene (Opx), with chemical formula M2 (Mg 0.856 Ca 0.025 Fe 2+ 0.119 ) M1 (Mg 0.957 Fe 2+ 0.011 Fe 3+ 0.016 Cr 0.011 Al 0.005 )Al 0.032 Si 1.968 O 6 , from a suite of high pressure ultramafic nodules of mantle origin, have been investigated by in-situ neutron powder diffraction at several temperatures starting from 1,200ŶC down to 150ŶC. Unit-cell parameter variations as a function of T show no phase transition within this tempera- ture range. The volume thermal expansion coefficient, a = V –1 (¶V/¶T) P0 , varies linearly with T. The axial thermal expansion coefficients, a j = l j –1 (¶l j /¶T) P0 , in- crease non-linearly with T. The principal Lagrangian unit-strain coefficients (e//a, e//b, e//c), increase continuously with T. However, the orientation of the unit-strain ellipsoid appears to change with T. With decreasing T, the values of the unit-strain coefficients along the b and c axes tend to converge. The orienta- tion at DT = 1,080ŶC is maintained down to the lowest temperature (150ŶC). The two non-equivalent tetra- hedral chains, TA n OA 3n and TB n OB 3n , are kinked differently. At room-T, the TB n OB 3n chain is more strongly kinked by about 23Ŷ than the TA n OA 3n chain. With increasing T, the difference decreases by 3Ŷ for the TB n OB 3n chain. The intersite cation exchange reaction between M1 and M2 (Mg 2+ and Fe 2+ ) shows a slight residual order at 1,200ŶC followed by reordering with decreasing temperature although seemingly not with a definite progressive trend. At the lowest tem- perature reached (150ŶC), reordering has occurred with the same value of partitioning coefficient K D as that before heating. The absence of the expected phase transition is most likely due to the presence of minor amounts of Fe 3+ , Al, Ca and Cr which must play a crucial role on the thermoelastic behaviour and phase stability fields in natural Opx, with consequent impor- tant petrologic and geological implications. Keywords Orthopyroxene High temperature Neutron powder diffraction Structural refinement Thermoelastic behaviour Cation-ordering Introduction Orthopyroxene (Opx) (Mg,Fe) 2 Si 2 O 6 , one of the most common rock-forming minerals of the lithosphere and a fundamental constituent of the Earth’s upper mantle, G. D. Gatta (&) G. Artioli Dipartimento di Scienze della Terra, Universita ` degli Studi di Milano, Via Botticelli, 23, 20133 Milano, Italy e-mail: [email protected] R. Rinaldi (&) Dipartimento di Scienze della Terra, Universita’ degli Studi di Perugia, 06100 Perugia, Italy e-mail: [email protected] K. S. Knight ISIS, Rutherford Appleton Laboratory, Chilton, Didcot, Oxon, UK K. S. Knight Department of Mineralogy, The Natural History Museum, London, UK G. Molin G. Artioli Dipartimento di Mineralogia e Petrologia, Universita ` degli Studi di Padova, Padova, Italy 123 Phys Chem Minerals (2007) 34:185–200 DOI 10.1007/s00269-006-0138-2

Welcome message from author
This document is posted to help you gain knowledge. Please leave a comment to let me know what you think about it! Share it to your friends and learn new things together.
Transcript
ORIGINAL PAPER
High temperature structural and thermoelastic behaviourof mantle orthopyroxene: an in situ neutron powderdiffraction study
G. Diego Gatta Æ Romano Rinaldi Æ K. S. Knight ÆG. Molin Æ G. Artioli
Received: 5 October 2006 / Accepted: 6 December 2006 / Published online: 26 January 2007� Springer-Verlag 2007
Abstract The temperature induced structural evolu-
tion and thermoelastic behaviour of a natural (Pbca)
orthopyroxene (Opx), with chemical formulaM2(Mg0.856Ca0.025Fe2+
0.119) M1(Mg0.957Fe2+0.011Fe3+
0.016
Cr0.011Al0.005)Al0.032Si1.968O6, from a suite of high
pressure ultramafic nodules of mantle origin, have
been investigated by in-situ neutron powder diffraction
at several temperatures starting from 1,200�C down
to 150�C. Unit-cell parameter variations as a function
of T show no phase transition within this tempera-
ture range. The volume thermal expansion coefficient,
a = V –1(¶V/¶T) P0, varies linearly with T. The axial
thermal expansion coefficients, aj = lj–1(¶lj/¶T)P0, in-
crease non-linearly with T. The principal Lagrangian
unit-strain coefficients (e//a, e//b, e//c), increase
continuously with T. However, the orientation of the
unit-strain ellipsoid appears to change with T. With
decreasing T, the values of the unit-strain coefficients
along the b and c axes tend to converge. The orienta-
tion at DT = 1,080�C is maintained down to the lowest
temperature (150�C). The two non-equivalent tetra-
hedral chains, TAnOA3n and TBnOB3n, are kinked
differently. At room-T, the TBnOB3n chain is more
strongly kinked by about 23� than the TAnOA3n chain.
With increasing T, the difference decreases by 3� for
the TBnOB3n chain. The intersite cation exchange
reaction between M1 and M2 (Mg2+ and Fe2+) shows a
slight residual order at 1,200�C followed by reordering
with decreasing temperature although seemingly not
with a definite progressive trend. At the lowest tem-
perature reached (150�C), reordering has occurred
with the same value of partitioning coefficient KD as
that before heating. The absence of the expected phase
transition is most likely due to the presence of minor
amounts of Fe3+, Al, Ca and Cr which must play a
crucial role on the thermoelastic behaviour and phase
stability fields in natural Opx, with consequent impor-
tant petrologic and geological implications.
Keywords Orthopyroxene � High temperature �Neutron powder diffraction � Structural refinement �Thermoelastic behaviour � Cation-ordering
Introduction
Orthopyroxene (Opx) (Mg,Fe)2Si2O6, one of the most
common rock-forming minerals of the lithosphere and
a fundamental constituent of the Earth’s upper mantle,
G. D. Gatta (&) � G. ArtioliDipartimento di Scienze della Terra,Universita degli Studi di Milano,Via Botticelli, 23, 20133 Milano, Italye-mail: [email protected]
R. Rinaldi (&)Dipartimento di Scienze della Terra,Universita’ degli Studi di Perugia,06100 Perugia, Italye-mail: [email protected]
K. S. KnightISIS, Rutherford Appleton Laboratory,Chilton, Didcot, Oxon, UK
K. S. KnightDepartment of Mineralogy,The Natural History Museum,London, UK
G. Molin � G. ArtioliDipartimento di Mineralogia e Petrologia,Universita degli Studi di Padova, Padova, Italy
123
Phys Chem Minerals (2007) 34:185–200
DOI 10.1007/s00269-006-0138-2

has Pbca symmetry and its structure consists of alter-
nating tetrahedral and octahedral layers. The tetra-
hedral layer has two non-equivalent tetrahedra TA and
TB, TA being smaller and more distorted than TB,
parallel to c. The octahedral layer consists of zig-zag
chains of regular M1 octahedra also parallel to c,
joined by larger and distorted M2 octahedra (Fig. 1).
Si–Al substitution occurs only in TB (Tazzoli and
Domeneghetti 1987; Molin and Stimpfl 1994). Mg2+and
Fe2+ occupy the M1 and M2 sites. The M1 site is
smaller and nearly regular, whereas the M2 site is
larger and more distorted. The cation ordering is very
strong, with Mg preferring the M1 site and Fe the M2
site (Ghose 1965). A crystal chemical model for Pbca
Opx was proposed by Domeneghetti et al. (1995a)
based on the structure refinements of more than 200
natural Opxs. Because of its importance in the deter-
mination of cooling rates of host rocks and the excess
thermodynamic properties of the Opx solid solution,
the thermoelastic behaviour and the intracrystalline
Fe–Mg partitioning in Opxs have been extensively
studied (Ghose and Hafner 1967; Smith 1969; Smyth
1969, 1971, 1973; Pannhorst 1979; Virgo and Hafner
1969; Saxena and Ghose 1971; Besancon 1981; Chatil-
lon-Colinet et al. 1983; Anovitz et al. 1988; Molin 1989;
Saxena et al. 1989; Molin et al. 1991; Chopelas and
Boehler 1992; Shimobayashi and Kitamura 1993;
Sykes-Nord and Molin 1993; Yang and Ghose 1994a,
1995a; Zhao et al. 1995; Hugh-Jones 1997; Hugh-Jones
et al. 1997; Stimpfl et al. 1999; Camara et al. 2000;
Chopelas 2000; Jackson et al. 2001; Angel and Jackson
2002; Tribaudino and Nestola 2002; Nestola and Tri-
baudino 2003; Zema et al. 2003; Jackson et al. 2004;
Nestola et al. 2006). The exchange reaction:
Mg2+(M1)+Fe2+(M2), Mg2+(M2)+Fe2+(M1) depends
on temperature and chemical composition (Mg/Fe
ratio and AlVI content; Ganguly and Ghose 1979;
Domeneghetti et al. 1985; Tazzoli and Domeneghetti
1987; Molin 1989).
The accurate determination of the equilibrium
constant, KD and the kinetic constants of the intra-
crystalline Mg2+–Fe2+ exchange reaction between the
two inequivalent M1 and M2 sites as a function of
temperature are essential for thermodynamic calcula-
tions and the evaluation of the cooling history of the
host rocks (Ganguly 1982). Disequilibrium studies can
be used to obtain activation energies and reaction rates
of both ordering and disordering. Many heating
experiments followed by quenching carried out in the
past using X-ray diffraction techniques and Mossbauer
resonance to establish the structural changes induced
at high temperature, yielded wrong results due to the
speed of the reaction at temperatures above 1,000�C.
At high temperature, Opx has been reported to
transform reconstructively to different phases depend-
ing on the chemical composition. Enstatite, Mg2Si2O6,
transforms to protoenstatite with the space group Pbcn
at about 1,030�C (e.g., Smyth 1971, 1974; Murakami
et al. 1982), whereas ferrosilite, Fe2Si2O6, transforms
reversibly to clinoferrosilite with the space group C2/c
at the same temperature (Sueno and Kimata 1981;
Sueno and Prewitt 1983; Sueno et al. 1984, 1985).
Shimobayashi and Kitamura (1993) reported a phase
transition of orthoenstatite to high-clinoenstatite by in-
situ TEM study at high temperature. Intermediate
Opxs with Fe/(Fe + Mg) > 13% also show transfor-
mations to C2/c clinopyroxenes (Smyth 1969; Sueno
et al. 1985), the transition being irreversible and non-
topotactic, with transition temperatures decreasing
from approximately 1,230–980�C with increasing Fe
content. Upon cooling, the C2/c phase (‘‘high clino-
pyroxene’’) undergoes a reversible and displacive
phase transition to P21/c clinopyroxene (‘‘low clino-
pyroxene’’) (Smyth 1969; Smyth and Burnham 1972;
Sueno and Kimata 1981; Sueno and Prewitt 1983;
Sueno et al. 1985). Protoenstatite transforms to either
P21/c clinopyroxene or a mixture of P21/c clinopyrox-
ene and Opx, depending on kinematic factors (Smyth
1974; Lee and Heuer 1987; Schrader et al. 1990; Boysen
et al. 1991).
At temperatures above 1,100�C, Opx becomes
unstable and transforms into a protopyroxene with the
Pbcn structure (Smyth and Ito 1977). This phase is
unquenchable with a field of stability described by
Reid et al. (1974), who also report the formation of a
clinobronzite from the rapid cooling of a protobronzite
corresponding to a pyroxene composition similar to
that studied in the present work. The in-situ monitor-
ing of this phase transition is necessary to establish
crystallographic and thermodynamic parameters
Fig. 1 Crystal structure of orthopyroxene viewed down [001].The orientation of the Lagrangian unit-strain ellipsoid at DT =1,180�C (with e//a :e//b = 1:1.41) is shown
186 Phys Chem Minerals (2007) 34:185–200
123
relevant to the cooling history of the host rocks. Yang
and Ghose (1995a) carried out in-situ structure and
site occupancy refinements of a synthetic Opx,
(Mg0.75Fe0.25)2Si2O6, by single-crystal X-ray diffraction
at 23, 727, 827, 927, and 1,027�C (with reversals)
whereby they observed an anomalous intracrystalline
Fe–Mg equilibrium distribution above 927�C which
they ascribed to the existence of a ‘‘transitional state’’
before the HT phase transition to the protoenstatite
structure. In contrast, no transitional state was ob-
served for Mg2Si2O6 before the T-induced phase
transition to protoenstatite at 1,087�C (Yang and
Ghose 1995b). Single-crystal Brillouin scattering mea-
surements on a natural orthoenstatite [with the com-
position (Mg0.994Fe0.002Al0.004)2(Si0.996Al0.004)2O6] to
T = 1,350�C and room pressure (Jackson et al. 2004),
showed a significant softening of the elastic moduli
(C33 and C55) above 900�C leading to a rapid phase
transition with some hysteresis in the temperature
range, 1,090(10) < Ttr < 1,175(10)�C. No evidence for
any other transitions (i.e., to the protoenstatite struc-
ture) was observed at least up to T = 1,350�C. The
authors suggested that the displacive phase transition
would lead to an unreported pyroxene structure with
Cmca symmetry, at variance with the suggestion of a
different Pbca structure by Miyake et al. (2004) from
molecular dynamic simulations. Clearly, the crystal
structure of such a polymorph is still unknown, pending
confirmation of a very recent experimental report by
Ohi et al. (2006).
The transition temperature of orthoenstatite to a
high-temperature phase shows a broad range: from
~950�C (Smyth 1971) to ~1,230�C (Shimobayashi and
Kitamura 1993). It appears that the conflicting results
on the stability of the enstatite polymorphs can be
explained in terms of: small differences in chemical
composition of the samples, grain size, thermal history
or microstructures (Jackson et al. 2004 and references
therein).
We report an in-situ structural study by neutron
powder diffraction of a natural Opx from a suite
of high pressure ultramafic nodules from Victoria,
Australia (Molin and Stimpfl 1994, sample LE8) with
the origin representative of an Earth’s upper mantle
environment and with the chemical composition:M2(Mg0.856Ca0.025Fe2+
0.119)M1(Mg0.957Fe2+0.011Fe3+
0.016
Cr0.011Al0.005)Al0.032Si1.968O6.
The use of a natural sample was felt mandatory in
order to correlate more closely with the actual petro-
logical and geological problems linked with this kind
of investigation. Neutron Time-of-Flight (ToF) tech-
niques, profiting from the low attenuation for neutrons
of most materials (high penetration), allow the simul-
taneous collection of diffraction data from a wide
range of reciprocal space under non-ambient condi-
tions. Furthermore, the coverage of a wide range of
scattering vectors, resulting from the very short neu-
tron scattering lengths [of the order of 10–15 m (1 fm)
as compared with 10–10 m (1 A) for X-rays], leads to
insignificant variations of scattering amplitude with
scattering vector Q (i.e., Bragg angle); hence, neutron
diffraction enables the study of fine structural details
and allows an easier separation of the information on
thermal motion from that of site occupancy in structure
refinements (Dove 2002; Rinaldi 2002; Rinaldi et al.
2002).
The present work is aimed at providing a novel
approach on the question raised by Kroll et al. (1997),
regarding the need for new, accurate and consistent
site occupancies for Opx solid solutions and a full
description of the crystal structure for any high-T
polymorph of enstatite, in particular at T > 900�C
where conflicting behaviours have previously been
found. The role played by the minor amounts of Al,
Ca, Fe3+ and Cr on the thermoelastic behaviour and
phase stability fields of this mineral have also been
considered.
Experimental
The chemical composition and crystal chemistry of the
natural Opx used for the high temperature experiment
is detailed in Molin and Stimpfl (1994; sample LE8). As
reported by the same authors, the provenance from the
same xenolith ensures a high degree of chemical
homogeneity of the Opx crystals. Much care was taken
in separating the Opx from the coexisting phases
(olivine, clinopyroxene, spinel) by means of magnetic,
heavy liquid, and optical methods; only some olivine
remained at the level of a detectable phase in the
powder spectra and was estimated by a quantitative
Rietveld procedure to be less than 10% of the dif-
fracting sample. Neutron powder diffraction data were
collected at the Polaris ToF beam line of the ISIS
pulsed spallation neutron source of the Rutherford
Appleton Laboratory (UK). After collecting a pre-
liminary data set at RT, 12 data sets were collected at
different temperatures starting with the highest tem-
perature of 1,200�C. Each data collection was started
after a time interval well in excess of that needed for
the small crystals of the powdered sample to reach
equilibrium at each temperature according to previous
kinetic experiments based on quenching (Molin et al.
1991; Sykes-Nord and Molin 1993). Each data set was
collected for a total of 500 lA corresponding to an
Phys Chem Minerals (2007) 34:185–200 187
123

average data collection time of approximately 2.75 h
(ISIS was operating at around 180 lA with a Ta tar-
get). The data were collected at the following tem-
peratures (equilibrating times in brackets): RT (20¢)1,200�C (12¢) 1,175�C (12¢) 1,150�C (15¢) 1,125�C (15¢)1,100�C (15¢) 1,075�C (30¢) 1,050�C (45¢) 1,025�C (45¢)1,000�C (180¢) 975�C (180¢) 150�C. More time, of the
order of 15–30¢, was allowed in between runs for tem-
perature ramping (up for the first HT value, down for
the following) and temperature stabilization. Based on
previous reports, the highest temperature (1,200�C) was
selected to be well above possible reversible phase
transformation of the Opx used in the experiments.
A ~4 g coarse powder sample was vacuum sealed in
a silica glass vial together with a buffer (~1 g of iron/
wustite powder) to prevent oxidation, separated from
the sample by some silica glass wool. The chance of
oxidation was also minimized by the good operating
vacuum reached in the Nb furnace (10–5 to 7 · 10–7
mbar). Another phase appeared at high temperature,
supposedly from a partial crystallisation of the glass
vial to high-cristobalite (cubic), which remained at the
level of 1.5% wt until the high to low phase transition
was reached (at approximately 250�C) bringing the
amount of this phase up to 10%, consistent with the
thickness of the silica vial. The vial was suspended
within the furnace by means of a thin Ta wire mesh.
Temperature stability was estimated to be better than
±5�C during each run. The data collected covered the
range between 2,000 and 18,800 ls from detector bank
1 (at 2h = 90�), between 2,000 and 19,600 ls from
detector bank 2 (at 2h = 145�) and between 2,000 and
16,000 ls from detector bank 3 (at 2h = 35�) (Fig. 2) of
the POLARIS ToF diffractometer. Further details
concerning the experiments at room and high tem-
perature are reported in Table 1.
Structure refinements
Crystal structure refinements of Opx (+olivine + cris-
tobalite) at different temperatures were carried out
using the GSAS Rietveld refinement package (Larson
and Von Dreele 2001) starting with the structural
model of Molin and Stimpfl (1994). The neutron scat-
tering lengths were taken from the GSAS library. Scale
factor, background (modelled with a Chebyschev
polynomial), cell dimensions (Table 2), and peak-
profile [exponential pseudo-Voigt convolution, profile
function n. 3 in GSAS, Von Dreele 1990 (unpub-
lished)] were refined first. The atomic parameters
(position, occupancy and isotropic thermal displace-
ment) were refined next. Three different strategies of
structure refinement were tested to evaluate the
amount of possible bias from the correlation between
occupancy and thermal parameters. Due to the dif-
ferent neutron cross-sections of iron and magnesium
(11.24 · 10–24 cm2 for Fe; 3.631 · 10–24 cm2 for Mg),
their occupancy factors in the octahedral M1 and M2
sites of Opx were determined with good reliability. All
refinements converged to Rwp values between 3 and
4% (Table 1). The following three different strategies
of structure refinement were used:
Fig. 2 Experimental (crosses) and calculated (solid line) TOFneutron diffraction patterns from the three detactor banks forOpx (+olivine + cristobalite) at 1,200�C. Calculated peak posi-tions and difference plots are shown at the bottom of eachpattern
188 Phys Chem Minerals (2007) 34:185–200
123

(i) refinement of Fe(M1) and Fe(M2) [with Fe(M1)
defined as (Fe2+ + Fe3+) in the M1 site] simulta-
neously with Uiso(M1) = Uiso(M2). This takes
care of the correlations at the expense of realistic
thermal parameters;
(ii) refinement of Fe(M1), Fe(M2), Uiso(M1), Uiso
(M2) in steps according to the following sequence:
(1) refinement of Fe(M1) and Fe(M2) with Uiso
(M1) = Uiso(M2),
(2) Fe(M1), Fe(M2) fixed at (1), Uiso(M1), Uiso
(M2) refined,
(3) Uiso(M1), Uiso(M2) fixed at (2), Fe(M1),
Fe(M2) refined and
(iii) refinement of Fe(M1), Fe(M2), Uiso(M1), Uiso
(M2) simultaneously varied. This naturally has the
largest correlation bias.
All refinements included: Cr(M1) = 0.01, Ca(M2) =
0.02, Fe(M1) + Fe(M2) = 0.15, Mg(M1) + Fe(M1) +
Cr(M1) = 1, Mg(M2) + Fe(M2) + Ca(M2) = 1.
The highest reliability was obtained in refinements
using strategy (ii) and the results are reported in
Table 3.
All structure refinements gave reasonable results in
terms of stability and precision, as shown in Tables 1,
2, 3 and 4. No stereochemical constraints were used for
the bond distances and no preferred orientation cor-
rection was applied. Convergence was rapidly achieved
after a first few cycles of refinement. In the last cycles,
the shifts in all parameters were less than their stan-
dard deviations. Refinement strategy No. (iii) gave
erratic occupancy parameters with very large error
bars. Such strategy, normally adopted in X-ray refine-
ments reported in the literature, should therefore be
considered with caution.
Refined atomic positions and thermal displacement
parameters are reported in Table 3 and bond distances
in Table 4. The Rietveld full-profile fits of Opx
(+ olivine + cristobalite) at 1,200�C are shown in Fig. 2
for each detector bank. For the olivine a pure Fo com-
position was found to provide the best fit as could be
expected from the low Fe content of this minor phase.
Results
Thermoelastic behaviour
The variation of the lattice parameters of Opx as
a function of T are shown in Fig. 3. Each trend is
Table 1 Experimental andinstrumental parameterspertaining to the datacollections and the Rietveldrefinements
Instrumental diffractometer POLARIS (neutron TOF powder diffract)Detector bank 1 ZnS scintillator—144 elements, 2h = 90�Detector bank 2 3He gas tubes—38 tubes, 2h = 145�Detector bank 3 3He gas tubes—80 tubes, 2h = 35TOF range (ms)/flight path (m):Bank 1 2.0–18.8/12.6030Bank 2 2.0–19.6/12.7794Bank 3 2.0–16.0/14.1402
Temperatures (�C)/equilibratingtimes (min)
20/20, 1,200/12, 1,175/12, 1,150/15, 1,125/15, 1,100/15,1,075/30, 1,050/45,
1,025/45, 1,000/180, 975/180, 150RefinementSpace group PbcaZ 8Unit cell refinement Whole patternObservations 9,200Refined parameters: 75 totalConstraints XCr(M1) = 0.01, XCa(M2) = 0.02,
XFe(M1) + XFe (M2) = 0.15,XMg(M1) +XFe (M1)+XCr(M1) = 1,XMg(M2) + XFe(M2)+XCa(M1) = 1,Uiso(SiA) = Uiso(SiB),Uiso(O1A) = Uiso(O1B) = Uiso(O2A) = Uiso(O2B)
= Uiso(O3A) = Uiso(O3B)Agreement factors wRp (20�C) = 0.0448; wRp (1,200�C) = 0.0290;
wRp (1,175�C) = 0.0294; wRp (1,150�C) = 0.0292;wRp (1,125�C) = 0.0288; wRp (1,100�C) = 0.0282;wRp (1,075�C) = 0.0297; wRp (1,050�C) = 0.0300;wRp (1,025�C) = 0.0291; wRp (1,000�C) = 0.0316;wRp (975�C) = 0.0318; wRp (150�C) = 0.0437;
Phys Chem Minerals (2007) 34:185–200 189
123

continuous and non-linear showing no anomaly within
the T-range investigated. The evolution of the volume
thermal expansion coefficient, a = V–1 (¶V/¶T)P0, with
T is linear (Fig. 4). A weighted linear regression trough
the data points yields:
aT ¼ a0þ a1T ¼ 1:53ð1Þ� 10�5þ 2:10ð2Þ� 10�8 T ð�CÞ:
For the temperature range between 975 and 1,200�C,
the aT value increases from 3.57(8) to 4.05(11) ·10–5�C–1, respectively. These values agree with previ-
ously determined thermal expansion coefficients for
Pbca Opxs, although with different compositions, as
reported by Yang and Ghose (1994b, 1995a, b) and
reviewed by Yang and Prewitt (2000). The volumes at
temperatures above RT can be calculated from the
thermodynamic equation: VT = V0 exp�aT dT. For a
given T, or a small T-range of interest, aT can be
considered independent of the temperature and a VT
value can be determined as VT = V 0 exp[aT(T–T0)].
As observed for the unit-cell volume, the axial thermal
expansion coefficients, aj = lj–1(¶lj/¶T)P0, also increase
non-linearly with T. The best fit through the data was
found using the weighted quadratic regression equa-
tion: aTj = a0j + a1jT + a2jT2.
The refined values of the a0j, a1jand a2j for the a-, b-
and c-axis are reported in Table 2. At T = 1,000�C we
can calculate aT(a) = 0.93(6) · 10–5, aT(b) = 1.39(10) ·10–5and aT(c) = 1.28(14) · 10–5�C–1, with aT(a): aT
(b):aT(c) = 1:1.49:1.38, in good agreement with Smyth
(1973), Yang and Ghose (1995a) and Yang and Prewitt
(2000). Alternatively, the VTand lTj values can be easily
calculated on the basis of the simple weighted quadratic
regressions through the data point (VT = VT0[1 + a1
(T – T0) + a2(T – T0) 2], lT = lT0[1 + a1(T – T0) + a2(T –
T0)2]) reported in Fig. 3. However, on the basis of the
previous results reported by Yang and Ghose (1995a, b)
and Camara and Nestola (2006), who showed that the
lattice parameters of ortho-enstatites follow a linear
trend with T up to 900�C and then deviate from the
linearity at T > 900�C, the equations reported above
should be used only at 950 < T < 1,200�C.
The magnitudes of the principal Lagrangian unit-
strain coefficients (e//a, e//b, e//c), between room
Table 2 Lattice parameters, axial and volume thermal expansion coefficients and Lagrangian unit-strain coefficients in Opx at dif-ferent temperatures
T (�C) a (A) b (A) c (A) V (A3)
20 18.2429(5) 8.8171(2) 5.1894(1) 834.71(3)1,200 18.4588(5) 8.9638(2) 5.2848(1) 874.43(3)1,175 18.4517(5) 8.9612(2) 5.2797(1) 872.99(3)1,150 18.4450(5) 8.9589(2) 5.2749(1) 871.66(3)1,125 18.4378(5) 8.9555(2) 5.2711(1) 870.37(3)1,100 18.4314(5) 8.9520(2) 5.2674(1) 869.11(3)1,075 18.4244(5) 8.9481(2) 5.2639(1) 867.83(3)1,050 18.4197(5) 8.9449(2) 5.2609(1) 866.79(3)1,025 18.4125(5) 8.9408(2) 5.2577(1) 865.53(3)1,000 18.4047(5) 8.9366(2) 5.2543(1) 864.21(3)975 18.3995(5) 8.9329(2) 5.2519(1) 863.21(3)150 18.2513(5) 8.8274(2) 5.1929(1) 836.63(2)a0 (�C–1) 2.50(5) · 10–6 8.0(1) · 10–6 4.7(2) · 10–6 1.53(1) · 10–5
a1 (�C–2)a 8. 5(2) · 10–9 9.6(5) · 10–9 4.0(7) · 10–9 2.10(2) · 10–8
a2 (�C–3)a –1.8(2) · 10–12 –3.6(4) · 10–12 4.2(6) · 10–12 –
T–T0 (�C) e//a (�C–1) · 10–5 e//b (�C–1) · 10–5 e//c (�C–1) · 10–5 (e//a):(e//b):(e//c)
1,180 1.003b 1.410b 1.558b 1:1.41:1.551,155 0.991 1.415 1.507 1:1.43:1.521,130 0.980 1.423 1.458 1:1.45:1.491,105 0.966 1.420 1.425 1:1.47:1.481,080 0.957 1.417 1.392 1:1.48:1.451,055 0.943 1.408 1.361 1:1.49:1.441,030 0.941 1.407 1.338 1:1.50:1.421,005 0.925 1.396 1.310 1:1.54:1.42980 0.905 1.383 1.276 1:1.53:1.41955 0.899 1.375 1.261 1:1.53:1.40130 0.354 0.899 0.519 1:2.54:1.47
a Axial and volume thermal expansion coefficients according to: aTj = a0j + a1jT + a2jT2 (see text)
b The e.s.ds are less than 0.004
190 Phys Chem Minerals (2007) 34:185–200
123

Table 3 Structural data for Opx at different temperatures
x y z Site occupancy KD Uiso · 100 (A2)
T = 20�CM1 0.3780(2) 0.6514(4) 0.8714(7) XFe = 0.023(6), XMg = 0.967(6) 0.159(42) 0.695(46)M2 0.3754(2) 0.4879(3) 0.3508(6) XFe = 0.127(6), XMg = 0.853(6) 1.089(54)Si(A) 0.2700(2) 0.3468(4) 0.0527(6) 0.153(11)Si(B) 0.4724(2) 0.3370(5) 0.7975(6) 0.153(11)O1(A) 0.1840(1) 0.3305(4) 0.0362(5) 0.218(12)O1(B) 0.5618(1) 0.3462(3) 0.7963(5) 0.218(12)O2(A) 0.3092(1) 0.5042(2) 0.0396(5) 0.218(12)O2(B) 0.4318(1) 0.4895(3) 0.6888(5) 0.218(12)O3(A) 0.3036(1) 0.2281(2) –0.1686(5) 0.218(12)O3(B) 0.4478(1) 0.1967(2) 0.6015(5) 0.218(12)
T = 1,200�CM1 0.3814(2) 0.6504(5) 0.8953(11) XFe = 0.071(6), XMg = 0.919(6) 0.881(100) 4.519(85)M2 0.3723(2) 0.4848(4) 0.3715(10) XFe = 0.079(6), XMg = 0.901(6) 5.034(112)Si(A) 0.2710(2) 0.3464(6) 0.0655(8) 1.735(26)Si(B) 0.4757(3) 0.3423(8) 0.7714(7) 1.735(26)O1(A) 0.1854(2) 0.3383(5) 0.0582(7) 1.959(29)O1(B) 0.5632(2) 0.3427(5) 0.7823(6) 1.959(29)O2(A) 0.3113(2) 0.5029(4) 0.0474(7) 1.959(29)O2(B) 0.4324(2) 0.4964(5) 0.7068(7) 1.959(29)O3(A) 0.3027(2) 0.2368(3) –0.1691(8) 1.959(29)O3(B) 0.4503(2) 0.2093(3) 0.5739(8) 1.959(29)
T = 1,175�CM1 0.3814(2) 0.6514(5) 0.8937(10) XFe = 0.062(6), XMg = 0.928(6) 0.677(80) 4.322(85)M2 0.3729(2) 0.4850(5) 0.3692(10) XFe = 0.088(6), XMg = 0.892(6) 4.855(110)Si(A) 0.2712(2) 0.3464(6) 0.0647(8) 1.682(26)Si(B) 0.4756(3) 0.3417(7) 0.7733(7) 1.682(26)O1(A) 0.1856(2) 0.3390(5) 0.0562(7) 1.900(28)O1(B) 0.5629(2) 0.3435(5) 0.7843(6) 1.900(28)O2(A) 0.3119(2) 0.5031(4) 0.0477(7) 1.900(28)O2(B) 0.4321(2) 0.4956(5) 0.7053(7) 1.900(28)O3(A) 0.3028(2) 0.2363(3) –0.1702(7) 1.900(28)O3(B) 0.4503(2) 0.2082(3) 0.5758(8) 1.900(28)
T = 1,150�CM1 0.3812(2) 0.6516(5) 0.8913(10) XFe = 0.063(6), XMg = 0.927(6) 0.697(82) 4.139(83)M2 0.3731(2) 0.4852(5) 0.3673(10) XFe = 0.087(6), XMg = 0.893(6) 4.650(108)Si(A) 0.2710(2) 0.3473(5) 0.0621(8) 1.572(25)Si(B) 0.4753(3) 0.3398(7) 0.7761(7) 1.572(25)O1(A) 0.1852(2) 0.3395(5) 0.0535(6) 1.780(27)O1(B) 0.5626(2) 0.3430(5) 0.7859(6) 1.780(27)O2(A) 0.3115(2) 0.5039(4) 0.0470(7) 1.780(27)O2(B) 0.4321(2) 0.4944(5) 0.7045(7) 1.780(27)O3(A) 0.3024(2) 0.2353(3) –0.1706(7) 1.780(27)O3(B) 0.4499(2) 0.2071(3) 0.5776(7) 1.780(27)
T = 1,125�CM1 0.3811(2) 0.6518(5) 0.8904(10) XFe = 0.065(6), XMg = 0.925(6) 0.739(86) 4.085(83)M2 0.3732(2) 0.4852(5) 0.3656(9) XFe = 0.085(6), XMg = 0.895(6) 4.562(108)Si(A) 0.2712(2) 0.3470(5) 0.0615(8) 1.538(24)Si(B) 0.4753(3) 0.3398(7) 0.7762(7) 1.538(24)O1(A) 0.1854(2) 0.3386(5) 0.0530(6) 1.742(27)O1(B) 0.5626(2) 0.3437(5) 0.7859(6) 1.742(27)O2(A) 0.3114(2) 0.5040(4) 0.0467(7) 1.742(27)O2(B) 0.4321(2) 0.4944(5) 0.7037(7) 1.742(27)O3(A) 0.3024(2) 0.2351(3) –0.1703(7) 1.742(27)O3(B) 0.4499(2) 0.2067(3) 0.5783(7) 1.742(27)
T = 1,100�CM1 0.3809(2) 0.6518(5) 0.8889(10) XFe = 0.065(6), XMg = 0.925(6) 0.739(86) 4.020(82)M2 0.3736(2) 0.4855(4) 0.3648(9) XFe = 0.085(6), XMg = 0.895(6) 4.412(104)
Phys Chem Minerals (2007) 34:185–200 191
123

Table 3 continued
x y z Site occupancy KD Uiso · 100 (A2)
Si(A) 0.2712(2) 0.3475(5) 0.0612(8) 1.488(24)Si(B) 0.4751(3) 0.3392(7) 0.7769(7) 1.488(24)O1(A) 0.1853(2) 0.3386(5) 0.0516(6) 1.687(26)O1(B) 0.5627(2) 0.3429(5) 0.7863(5) 1.687(26)O2(A) 0.3112(2) 0.5045(4) 0.0467(7) 1.687(26)O2(B) 0.4321(2) 0.4934(5) 0.7026(6) 1.687(26)O3(A) 0.3026(2) 0.2348(3) –0.1702(7) 1.687(26)O3(B) 0.4499(2) 0.2061(3) 0.5792(7) 1.687(26)
T = 1,075�CM1 0.3807(2) 0.6519(5) 0.8876(10) XFe = 0.066(6), XMg = 0.924(6) 0.761(88) 3.851(82)M2 0.3740(3) 0.4848(5) 0.3645(10) XFe = 0.084(6), XMg = 0.896(6) 4.247(106)Si(A) 0.2712(2) 0.3473(6) 0.0599(8) 1.460(25)Si(B) 0.4751(3) 0.3385(8) 0.7767(7) 1.460(25)O1(A) 0.1851(2) 0.3403(5) 0.0497(7) 1.656(27)O1(B) 0.5626(2) 0.3420(5) 0.7869(6) 1.656(27)O2(A) 0.3112(2) 0.5046(4) 0.0470(7) 1.656(27)O2(B) 0.4321(2) 0.4929(5) 0.7024(7) 1.656(27)O3(A) 0.3025(2) 0.2344(3) –0.1702(7) 1.656(27)O3(B) 0.4499(2) 0.2054(3) 0.5800(7) 1.656(27)
T = 1,050�CM1 0.3806(2) 0.6508(5) 0.8844(9) XFe = 0.066(6), XMg = 0.924(6) 0.761(88) 3.678(85)M2 0.3736(3) 0.4851(5) 0.3667(11) XFe = 0.084(6), XMg = 0.896(6) 4.140(107)Si(A) 0.2707(2) 0.3470(6) 0.0616(8) 1.394(24)Si(B) 0.4746(3) 0.3391(7) 0.7768(7) 1.394(24)O1(A) 0.1847(2) 0.3419(5) 0.0484(6) 1.583(27)O1(B) 0.5623(2) 0.3399(5) 0.7884(6) 1.583(27)O2(A) 0.3105(2) 0.5052(4) 0.0453(7) 1.583(27)O2(B) 0.4316(2) 0.4926(5) 0.7020(7) 1.583(27)O3(A) 0.3024(2) 0.2343(3) –0.1697(7) 1.583(27)O3(B) 0.4501(2) 0.2047(3) 0.5813(7) 1.583(27)
T = 1,025�CM1 0.3806(2) 0.6516(5) 0.8829(9) XFe = 0.061(6), XMg = 0.929(6) 0.657(79) 3.836(80)M2 0.3738(3) 0.4853(5) 0.3643(10) XFe = 0.089(6), XMg = 0.891(6) 4.045(101)Si(A) 0.2708(2) 0.3471(5) 0.0603(8) 1.337(23)Si(B) 0.4745(2) 0.3387(7) 0.7781(7) 1.337(23)O1(A) 0.1849(2) 0.3416(5) 0.0481(6) 1.520(25)O1(B) 0.5624(2) 0.3400(5) 0.7888(6) 1.520(25)O2(A) 0.3105(2) 0.5057(3) 0.0452(7) 1.520(25)O2(B) 0.4319(2) 0.4922(5) 0.7018(7) 1.520(25)O3(A) 0.3023(2) 0.2340(3) –0.1701(6) 1.520(25)O3(B) 0.4498(2) 0.2041(3) 0.5818(7) 1.520(25)
T = 1,000�CM1 0.3801(2) 0.6525(5) 0.8848(9) XFe = 0.062(6), X Mg = 0.928(6) 0.677(80) 3.640(81)M2 0.3748(2) 0.4852(5) 0.3611(9) XFe = 0.088(6), XMg = 0.892(6) 3.988(104)Si(A) 0.2711(2) 0.3481(5) 0.0582(8) 1.347(23)Si(B) 0.4747(3) 0.3375(7) 0.7783(7) 1.347(23)O1(A) 0.1852(2) 0.3385(5) 0.0474(6) 1.531(26)O1(B) 0.5624(2) 0.3426(5) 0.7875(6) 1.531(26)O2(A) 0.3108(2) 0.5052(3) 0.0462(7) 1.531(26)O2(B) 0.4322(2) 0.4911(5) 0.7018(7) 1.531(26)O3(A) 0.3027(2) 0.2335(3) –0.1701(7) 1.531(26)O3(B) 0.4496(2) 0.2037(3) 0.5820(7) 1.531(26)
T = 975�CM1 0.3803(2) 0.6520(5) 0.8821(9) XFe = 0.063(6), XMg = 0.927(6) 0.697(82) 3.589(79)M2 0.3743(3) 0.4852(5) 0.3617(10) XFe = 0.087(6), XMg = 0.893(6) 3.947(102)Si(A) 0.2707(2) 0.3472(5) 0.0590(8) 1.273(22)Si(B) 0.4744(2) 0.3376(7) 0.7791(7) 1.273(22)O1(A) 0.1849(2) 0.3408(5) 0.0471(6) 1.450(25)
192 Phys Chem Minerals (2007) 34:185–200
123

temperature and each measured T, were calculated
with the software STRAIN (Ohashi 1982) (Table 2).
The evolution of the principal unit-strain coefficients
with temperature is shown in Fig. 5 and the magnitude
of the strain coefficients at different (T–T0) values is
reported in Table 2. As shown in Fig. 5, each trend
appears to be continuous and the magnitude of all
three unit-strain coefficients increases with T. How-
ever, the orientation of the unit-strain ellipsoid appears
to change at different T regimes. At DT = 1,180�C, the
unit-strain ellipsoid is oriented with the major axis
parallel to c, being (e//a):(e//b):(e//c) = 1:1.41:1.55
(Fig. 1). With decreasing T, we observe a convergence
between the value of the unit-strain coefficients along
the b and c-axis (Table 2), being (e//a):(e//b):(e//c) =
1:1.47:1.48 at DT = 1,105�C. At DT = 1,080�C the
strain ellipsoid shows a different orientation with the
major axis parallel to b, with (e//a):(e//b):(e//c) =
1:1.48:1.45. The last orientation is maintained down to
the lowest temperatures. The structural reason of this
thermo-elastic behaviour is discussed in the following
paragraph.
Structural deformation at high temperature
The evolution of the unit-strain coefficients with T
(Fig. 5) shows that the main extensional deformation
mechanisms act along the b- and c-axis. However, it
appears that in the range between 1,100 and 1,200�C
the extensional strain along the c-axis is higher then
that along the b-axis. In contrast, at T < 1,100�C the T-
induced elastic strain is lower along the c-axis than
along the b-axis. The structural refinements performed
at different temperatures allow us to understand the
crystal chemical reason of such a behaviour.
The main mechanism responsible for the structural
expansion along the c-axis is the kinking of the TA-
nOA3nand TBnOB3n chains, represented by the varia-
tions of the O3A–O3A–O3A and O3B–O3B–O3B
angles. The TO4-tetrahedra in the pyroxene structure
do not expand significantly with increasing tempera-
ture (Cameron and Papike 1981), but the distortion
of the TB tetrahedron is stronger with increasing T
than that of TA (Table 5), in agreement with the
experimental findings of Yang and Ghose (1995a) for
En75Fs25. On the other hand, the structural extension
along the b-axis is mainly controlled by the M1 and M2
polyhedral edges that join the tetrahedral chains
(Fig. 6), and in particular by the M2 polyhedral edges
represented by the O3A–O1A, O2A–O1A, O3B–O1B
and O2B–O1B distances (Figs. 6, 7, Table 4). The
tetrahedral chains tend to extend monotonically with
increasing temperature, as shown by the evolution
of the angles O3A–O3A–O3A and O3B–O3B–O3B
(Table 4). In contrast, it appears that only the O3A–
O1A and O3B–O1B distances of the M2 polyhedral
edges increase with T, whereas the O2A–O1A and
O2B–O1B distances tend to remain almost constant
at the high temperature regime (Fig. 7, Table 4). This
behaviour leads to a more distorted configuration of
the M2 polyhedron at high temperature, as shown by
the polyhedral distortion coefficient in Table 5. The
extension of the tetrahedral chains gives rise to a
monotonic increase of the unit-strain coefficient along
Table 3 continued
x y z Site occupancy KD Uiso · 100 (A2)
O1(B) 0.5622(2) 0.3409(5) 0.7890(6) 1.450(25)O2(A) 0.3104(2) 0.5058(3) 0.0446(7) 1.450(25)O2(B) 0.4320(2) 0.4916(5) 0.7012(7) 1.450(25)O3(A) 0.3022(2) 0.2333(3) –0.1700(6) 1.450(25)O3(B) 0.4494(2) 0.2033(3) 0.5835(6) 1.450(25)
T = 150�CM1 0.3793(2) 0.6526(4) 0.8682(6) XFe = 0.018(6), XMg = 0.972(6) 0.118(40) 0.709(46)M2 0.3745(2) 0.4876(3) 0.3531(6) XFe = 0.132(6), XMg = 0.848(6) 0.974(52)Si(A) 0.2694(2) 0.3475(4) 0.0505(7) 0.361(13)Si(B) 0.4729(2) 0.3354(5) 0.7952(6) 0.361(13)O1(A) 0.1832(1) 0.3374(4) 0.0381(5) 0.447(14)O1(B) 0.5617(1) 0.3426(4) 0.7963(5) 0.447(14)O2(A) 0.3094(1) 0.5056(3) 0.0372(5) 0.447(14)O2(B) 0.4318(2) 0.4858(3) 0.6893(6) 0.447(14)O3(A) 0.3044(2) 0.2255(3) –0.1702(5) 0.447(14)O3(B) 0.4474(1) 0.1976(3) 0.6020(5) 0.447(14)
The fraction of Si and Al at the tetrahedral SiA and SiB sites were refined at 20�C. The refinement showed that the Al is mainly locatedat the SiB site, being X(AlB) @ 0.029, and a similar results was obtained at 1,200�C. Therefore, the fractions X(SiB) = 0.97,X(AlB) = 0.03 were fixed and not refined at any temperature
Phys Chem Minerals (2007) 34:185–200 193
123

Ta
ble
4S
ele
cte
db
on
dle
ng
ths
(A)
an
da
ng
les
(�)
inO
px
at
dif
fere
nt
tem
pe
ratu
res
T(�
C)
20
1,2
00
1,1
75
1,1
50
1,1
25
1,1
00
1,0
75
1,0
50
1,0
25
1,0
00
97
51
50
M1
–O
1A
2.1
23
(5)
2.2
58
(6)
2.2
57
(6)
2.2
52
(6)
2.2
44
(6)
2.2
40
(6)
2.2
45
(6)
2.2
61
(6)
2.2
57
(6)
2.2
40
(6)
2.2
44
(6)
2.1
78
(5)
M1
–O
1A
2.0
82
(4)
2.1
69
(6)
2.1
71
(6)
2.1
64
(6)
2.1
62
(6)
2.1
57
(5)
2.1
54
(6)
2.1
39
(6)
2.1
35
(5)
2.1
31
(5)
2.1
30
(5)
2.0
61
(4)
M1
–O
1B
2.0
44
(4)
1.9
88
(5)
1.9
87
(5)
1.9
94
(5)
1.9
98
(5)
2.0
03
(5)
2.0
07
(5)
2.0
19
(5)
2.0
22
(5)
2.0
27
(5)
2.0
26
(5)
2.0
47
(4)
M1
–O
1B
2.2
16
(4)
2.2
13
(6)
2.2
15
(6)
2.2
10
(6)
2.2
12
(6)
2.2
04
(6)
2.1
97
(6)
2.1
90
(6)
2.1
81
(5)
2.1
92
(5)
2.1
84
(5)
2.1
68
(5)
M1
–O
2A
2.0
06
(4)
2.0
17
(5)
2.0
18
(5)
2.0
21
(5)
2.0
20
(5)
2.0
20
(5)
2.0
21
(5)
2.0
19
(4)
2.0
23
(4)
2.0
19
(4)
2.0
22
(4)
2.0
20
(4)
M1
–O
2B
1.9
74
(4)
1.9
45
(7)
1.9
53
(6)
1.9
58
(6)
1.9
60
(6)
1.9
66
(6)
1.9
67
(6)
1.9
52
(6)
1.9
57
(6)
1.9
64
(6)
1.9
64
(6)
1.9
87
(4)
ÆM1
–O
æ2
.07
42
.09
82
.10
02
.09
92
.09
92
.09
82
.09
82
.09
72
.09
62
.09
52
.09
52
.07
7M
2–
O1
A2
.16
0(4
)2
.15
0(6
)2
.15
1(6
)2
.14
2(6
)2
.15
2(6
)2
.15
1(6
)2
.14
1(6
)2
.11
3(6
)2
.12
1(6
)2
.13
9(6
)2
.13
3(6
)2
.10
1(4
)M
2–
O1
B2
.00
8(4
)2
.11
4(6
)2
.10
3(6
)2
.10
4(6
)2
.09
5(6
)2
.09
1(6
)2
.09
8(6
)2
.12
3(6
)2
.11
4(6
)2
.09
5(6
)2
.09
8(6
)2
.05
0(4
)M
2–
O2
A2
.02
2(4
)2
.05
6(6
)2
.04
3(6
)2
.04
3(5
)2
.03
7(5
)2
.04
0(5
)2
.04
1(5
)2
.05
9(6
)2
.05
0(5
)2
.05
1(6
)2
.04
7(5
)2
.03
2(4
)M
2–
O2
B2
.03
4(5
)2
.09
3(6
)2
.08
6(6
)2
.08
8(6
)2
.08
9(6
)2
.08
2(6
)2
.07
7(6
)2
.06
4(7
)2
.07
3(6
)2
.07
7(6
)2
.07
6(6
)2
.03
5(5
)M
2–
O3
A2
.31
3(4
)2
.37
5(5
)2
.37
7(5
)2
.37
6(5
)2
.37
3(5
)2
.37
4(5
)2
.37
0(5
)2
.36
9(5
)2
.36
8(5
)2
.36
8(5
)2
.36
6(5
)2
.27
8(4
)M
2–
O3
B2
.46
3(4
)2
.75
2(6
)2
.72
8(6
)2
.70
4(6
)2
.69
3(6
)2
.68
0(6
)2
.66
4(6
)2
.66
9(6
)2
.65
3(6
)2
.63
2(6
)2
.62
3(6
)2
.47
9(4
)(M
2–
O3
B¢)
3.1
67
(6)
3.0
52
(9)
3.0
63
(9)
3.0
74
(9)
3.0
79
(10
)3
.08
4(9
)3
.08
1(9
)3
.09
0(8
)3
.09
7(9
)3
.09
6(9
)3
.09
9(9
)3
.16
2(8
)ÆM
2–
Oæ
2.1
67
2.2
57
2.2
48
2.2
43
2.2
40
2.2
36
2.2
32
2.2
33
2.2
30
2.2
27
2.2
24
2.1
63
SiA
–O
1A
1.5
78
(4)
1.5
83
(5)
1.5
81
(5)
1.5
85
(5)
1.5
85
(5)
1.5
86
(5)
1.5
89
(5)
1.5
86
(5)
1.5
84
(5)
1.5
81
(5)
1.5
81
(5)
1.5
77
(4)
SiA
–O
2A
1.5
62
(4)
1.5
91
(6)
1.5
95
(6)
1.5
91
(5)
1.5
91
(5)
1.5
89
(5)
1.5
90
(6)
1.5
97
(6)
1.5
97
(5)
1.5
94
(5)
1.5
96
(5)
1.5
77
(4)
SiA
–O
3A
1.6
71
(4)
1.6
87
(5)
1.6
88
(5)
1.6
87
(5)
1.6
82
(5)
1.6
85
(5)
1.6
80
(5)
1.6
84
(5)
1.6
81
(5)
1.6
83
(5)
1.6
79
(5)
1.6
98
(4)
SiA
–O
3A
1.7
04
(4)
1.6
93
(6)
1.6
88
(6)
1.6
94
(5)
1.6
95
(5)
1.6
96
(5)
1.6
99
(5)
1.6
93
(5)
1.6
94
(5)
1.6
98
(5)
1.6
97
(5)
1.7
11
(4)
ÆSiA
–O
æ1
.62
81
.63
91
.63
81
.63
91
.63
81
.63
91
.63
91
.64
01
.63
91
.63
91
.63
81
.64
1O
3A
–O
3A
–O
3A
16
3.0
5(2
8)
16
9.7
9(3
8)
16
9.4
1(3
6)
16
8.6
3(3
1)
16
8.4
7(2
8)
16
8.1
8(3
1)
16
7.8
8(2
8)
16
7.8
5(3
0)
16
7.5
5(2
7)
16
7.1
4(2
8)
16
7.0
5(2
9)
16
1.0
5(2
7)
SiB
–O
1B
1.6
33
(4)
1.6
16
(6)
1.6
12
(6)
1.6
12
(6)
1.6
11
(6)
1.6
16
(5)
1.6
13
(6)
1.6
16
(6)
1.6
19
(5)
1.6
18
(5)
1.6
17
(5)
1.6
22
(4)
SiB
–O
2B
1.6
35
(5)
1.6
32
(7)
1.6
36
(7)
1.6
41
(7)
1.6
42
(7)
1.6
39
(7)
1.6
39
(7)
1.6
32
(7)
1.6
30
(6)
1.6
26
(6)
1.6
34
(6)
1.6
21
(5)
SiB
–O
3B
1.6
63
(4)
1.6
53
(6)
1.6
54
(6)
1.6
52
(6)
1.6
52
(6)
1.6
49
(5)
1.6
46
(6)
1.6
45
(6)
1.6
49
(5)
1.6
49
(5)
1.6
45
(5)
1.6
44
(4)
SiB
–O
3B
1.6
67
(4)
1.7
29
(5)
1.7
23
(5)
1.7
10
(5)
1.7
12
(5)
1.7
07
(5)
1.7
08
(5)
1.7
10
(5)
1.7
04
(5)
1.7
03
(5)
1.7
03
(5)
1.6
85
(4)
ÆSiB
–O
æ1
.64
91
.65
71
.65
61
.65
41
.65
41
.65
31
.65
11
.65
11
.65
01
.64
91
.65
01
.64
3O
3B
–O
3B
–O
3B
14
0.1
6(2
2)
14
9.1
3(2
8)
14
8.3
4(2
8)
14
7.5
0(2
6)
14
7.2
1(2
3)
14
6.7
7(2
4)
14
6.2
3(2
5)
14
5.7
5(2
6)
14
5.2
5(2
5)
14
4.9
3(2
6)
14
4.7
8(2
6)
14
0.7
8(2
4)
O3
A–
O1
A3
.67
0(5
)3
.77
5(8
)3
.76
2(8
)3
.74
5(7
)3
.74
8(7
)3
.74
1(7
)3
.71
9(8
)3
.70
1(7
)3
.69
8(8
)3
.70
2(7
)3
.69
5(6
)3
.59
9(6
)O
2A
–O
1A
2.8
79
(5)
3.0
07
(7)
3.0
11
(7)
3.0
08
(6)
2.9
98
(5)
2.9
92
(6)
3.0
05
(6)
3.0
13
(6)
3.0
05
(6)
2.9
91
(6)
2.9
94
(5)
2.9
32
(6)
O3
B–
O1
B3
.14
0(6
)3
.38
2(7
)3
.35
9(7
)3
.34
9(8
)3
.33
7(8
)3
.33
6(7
)3
.33
4(7
)3
.34
2(7
)3
.33
4(8
)3
.31
6(6
)3
.31
3(7
)3
.18
2(7
)O
2B
–O
1B
3.1
49
(6)
3.1
05
(6)
3.1
20
(8)
3.1
25
(8)
3.1
30
(7)
3.1
31
(7)
3.1
26
(7)
3.1
09
(8)
3.1
12
(6)
3.1
27
(6)
3.1
22
(6)
3.1
52
(6)
Th
ea
ve
rag
eÆM
2–
Oæ
dis
tan
ceis
calc
ula
ted
on
the
ba
sis
of
CN
=6
194 Phys Chem Minerals (2007) 34:185–200
123
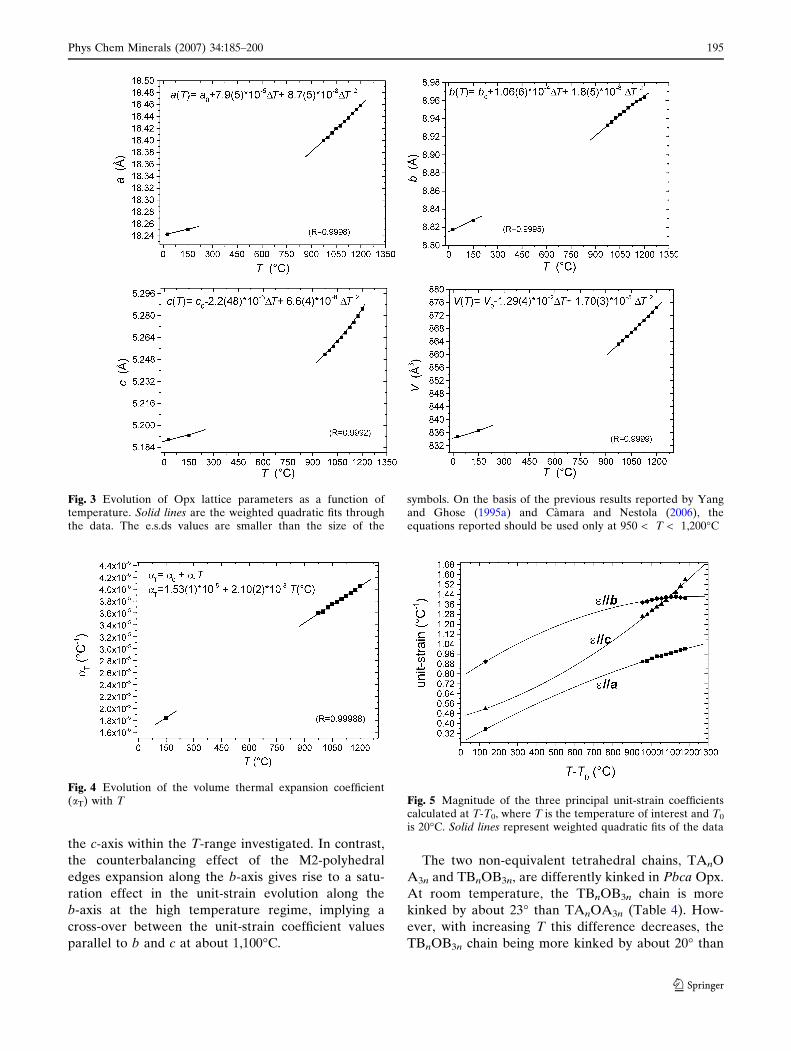
the c-axis within the T-range investigated. In contrast,
the counterbalancing effect of the M2-polyhedral
edges expansion along the b-axis gives rise to a satu-
ration effect in the unit-strain evolution along the
b-axis at the high temperature regime, implying a
cross-over between the unit-strain coefficient values
parallel to b and c at about 1,100�C.
The two non-equivalent tetrahedral chains, TAnO
A3n and TBnOB3n, are differently kinked in Pbca Opx.
At room temperature, the TBnOB3n chain is more
kinked by about 23� than TAnOA3n (Table 4). How-
ever, with increasing T this difference decreases, the
TBnOB3n chain being more kinked by about 20� than
Fig. 3 Evolution of Opx lattice parameters as a function oftemperature. Solid lines are the weighted quadratic fits throughthe data. The e.s.ds values are smaller than the size of the
symbols. On the basis of the previous results reported by Yangand Ghose (1995a) and Camara and Nestola (2006), theequations reported should be used only at 950 < T < 1,200�C
Fig. 4 Evolution of the volume thermal expansion coefficient(aT) with T Fig. 5 Magnitude of the three principal unit-strain coefficients
calculated at T-T0, where T is the temperature of interest and T0
is 20�C. Solid lines represent weighted quadratic fits of the data
Phys Chem Minerals (2007) 34:185–200 195
123

TAnOA3n at 1,200�C. This trend (Fig. 8) appears to
confirm a general tendency for Opx at HT (Smyth
1973; Sueno et al. 1976; Yang and Ghose 1995a, b),
independent of chemistry, to reduce the difference in
kinking between the two tetrahedral chains toward the
HT phase transition, either to Pbcn (proto) or C2/c
(high clino), above which the two chains become
equivalent.
The values of the refined Mg/Fe fractions at the M1
and M2 sites at different temperatures, and the res-
pective equilibrium constants of the cation exchange
reaction, KD, expressed as:
KD ¼ Fe(M1) �Mg(M2)½ �= Fe(M2) �Mg(M1)½ �;
are reported in Table 3. The value of KD = 1 repre-
sents the state of total disorder, KD = 0 represents total
order. The KD value at RT agrees with that previously
obtained by Molin and Stimpfl (1994) by means of
single-crystal X-ray diffraction. The evolution of KD
with T is shown in Fig. 9. The KD value drastically
increases between RT and 975�C, confirming previous
studies of Mg–Fe order–disorder in Opx with T (Yang
and Ghose 1994a, 1995a, b; Stimpfl et al. 1999 and
references therein). A residual order remains even at
1,200�C. All refinements suggest a general trend to-
wards increasing order as the temperature is decreased
from 1,175�C all the way down, although seemingly not
following a definite progressive trend. At the lowest
temperature reached on the way down (150�C), the KD
has reached the same value determined by the refine-
ment at room temperature before the heating and
cooling cycle. In view of the extremely long times
Table 5 Polyhedral volumes and polyhedral distortion coefficient (n, according to Balic-Zunic and Vickovic 1996, and Makovicky andBalic-Zunic 1998) in Opx at different temperatures
T (�C) VM1 (A3) nM1 VM2(A3) nM2 VSiA (A3) nSiA VSiB (A3) nSiB
20 11.74(4) 0.0099 12.71(4) 0.0722 2.18(1) 0.0080 2.29(2) 0.00401,200 12.11(6) 0.0091 14.08(7) 0.0982 2.23(2) 0.0031 2.31(1) 0.00601,175 12.14(6) 0.0095 13.94(6) 0.0964 2.23(2) 0.0034 2.31(2) 0.00601,150 12.14(6) 0.0094 13.88(7) 0.0936 2.24(2) 0.0035 2.30(2) 0.00581,125 12.14(6) 0.0093 13.85(6) 0.0927 2.23(2) 0.0036 2.30(2) 0.00551,100 12.13(6) 0.0092 13.80(6) 0.0907 2.23(2) 0.0037 2.30(2) 0.00571,075 12.13(6) 0.0094 13.74(7) 0.0895 2.24(2) 0.0036 2.29(3) 0.00611,050 12.10(6) 0.0093 13.76(7) 0.0865 2.24(2) 0.0031 2.29(2) 0.00791,025 12.09(6) 0.0090 13.74(7) 0.0857 2.24(2) 0.0031 2.29(2) 0.00721,000 12.13(6) 0.0090 13.65(6) 0.0858 2.23(2) 0.0041 2.28(2) 0.0055975 12.09(6) 0.0089 13.65(7) 0.0840 2.23(2) 0.0034 2.28(2) 0.0062150 11.79(4) 0.0104 12.67(4) 0.0668 2.23(2) 0.0074 2.26(2) 0.0053
Fig. 6 Two clinographicviews of the crystal structureof Opx showing some selectedoxygen–oxygen distancespertaining to the M1 and M2polyhedra mentioned in the‘‘Discussion and conclusion‘‘and plotted in the followingFig. 7
Fig. 7 Evolution of some O–O distances versus T involving themost affected polyhedral edges (see Fig. 6)
196 Phys Chem Minerals (2007) 34:185–200
123

expected for Opx to reach equilibrium at this temper-
ature, this may indicate that the equilibrium tempera-
ture of our natural sample was much higher than RT,
according with the volcanic history of the LE8 lherz-
olite xenolith ejecta associated with a basanitic lava. As
a matter of fact, the ‘‘closure temperature of ordering’’
(Tc) of our sample, calculated according to Stimpfl
et al. (2005), happens to be Tc = 648�C. Hence the low
temperatures reported in Fig. 9 (RT and 150�C) are to
be considered merely experimental temperatures,
representing a state of non-equilibrium in the mineral.
Furthermore, because of the complex crystal chemistry
of our sample (and possible interference on the Fe/Mg
partitioning) and because, as reported by Yang and
Ghose (1994a, 1995a), at T > 930–950�C the evolution
of KD with T follows an anomalous trend, if compared
to that at T < 930�C, due to structural rearrangements
for the impending phase transition, we avoid using the
KD values for a thermodynamic description of the HT
behaviour of Opx.
The thermal isotropic displacement parameters
(Uiso) for M1, M2 and T sites (we constrained Uiso
(TA) = Uiso(TB) in the structure refinements) increase
monotonically with T (with trends expressed by a
second-order polynomial, Fig. 10, Table 3), with Ui-
so(M2) > Uiso(M1) > Uiso(T). Also in this case,
no evidence of any anomalous behaviour within the
T-range investigated is observed.
Fig. 8 Top evolution of the kinking angles (O3A–O3A–O3A andO3B–O3B–O3B) of the tetrahedral chains TAnOA3n andTBnOB3n as a function of T. The kinking angle of the A-chain isplotted above 180�ð360� � \O3A--O3A--O3A�Þ and that of theB-chain below 180�, according to Sueno et al. (1976). Bottomevolution of D� ¼ ð\O3A--O3A--O3AÞ� � ð\O3B--O3B--O3BÞ�;which can be considered as an order parameter for a possible HT-phase transition. The solid lines represent the weighted quadraticregressions trough the data points
Fig. 9 Mg and Fe cation partitioning in M1 and M2 octahedralsites as a function of temperature expressed as KD versus Tin Opx. Total Mg/Fe disorder corresponds to KD = 1, totalorder corresponds to KD = 0 [with KD = (Fe(M1)Mg(M2))/(Fe(M2)Mg(M1))]. The two points at RT (before heating) and at150�C (after the heating cycle) are to be considered represen-tative of mere experimental temperatures. The effective ‘‘closuretemperature of ordering’’ (Tc) being in the 600–650�C range forthe two points (see text)
Fig. 10 Evolution with T of the isotropic thermal displacementparameters (Uiso) for the octahedral and tetrahedral sites[Uiso(M1), Uiso(M2) and Uiso(TA) = Uviso(TB)]
Phys Chem Minerals (2007) 34:185–200 197
123

Discussion and conclusion
The HT structural behaviour of a natural Opx
(Wo1En91Fs~7) with minor amounts of Ca, Fe3+, Cr and
Al, was investigated by in-situ neutron powder dif-
fraction up to 1,200�C. The high quality of the neutron
data allowed a detailed description of the thermo-
elastic behaviour and a precise analysis of the T-
induced deformation mechanisms based on full-profile
fit Rietveld structure refinements.
Quite surprisingly, no evidence of a phase transition
was observed in the Opx within the temperature range
investigated, as confirmed by a careful inspection of the
diffraction patterns (no symmetry violating reflections
were observed), by the evolution of the lattice con-
stants and of the elastic and structural parameters
(thermal displacement coefficients, bond distances and
angles, polyhedral volumes) with T. The discrepancy
with respect to the previous HT-experiments on syn-
thetic or natural Opx is most likely due to the stabil-
ising effect of the minor amounts of Ca, Fe3+, Al and
Cr which played a crucial role.
Several studies have been devoted to the effect of
Ca and Al on the crystal chemistry, HT Fe/Mg order-
ing and kinetic processes, elastic and thermoelastic
behaviour of Opx (Chatillon-Colinet et al. 1983; Molin
1989; Domeneghetti et al. 1995a, b; Hugh-Jones et al.
1997; Stimpfl et al. 1999; Camara et al. 2000; Tribau-
dino and Nestola 2002; Nestola and Tribaudino 2003;
Zema et al. 2003; Nestola et al. 2006). In particular,
Nestola and Tribaudino (2003) studied the effect of Ca
on the orthoenstatite structure along the synthetic join
diopside (CaMgSi2O6)–enstatite (Mg2Si2O6), showing
that the Ca substitution into the Pbca structure of
orthoenstatite implies local distortions of the tetra-
hedral chains acting against the stability of the Pbca
symmetry. Consequently, the orthoenstatite structure
cannot contain more than 0.09–0.10 a.p.f.u. of Ca. For
an amount of Ca of about 0.15 a.p.f.u., the stable phase
is that of pigeonite with P21/c symmetry at room con-
ditions (Tribaudino and Nestola 2002). The effect of
Ca on the kinetics of the Fe–Mg disordering process in
a natural Opx (Wo4En60Fs36) was reported by Zema
et al. (2003) who carried out a study at 730�C. The
authors showed that the presence of Ca in the M2 site
of the Opx does not seem to have any influence on the
mechanism of the Fe–Mg intracrystalline exchange.
The experiments performed on Al-bearing Opxs at
high-it T by Domeneghetti et al. (1985), Tazzoli and
Domeneghetti (1987) and Molin (1989) showed that:
(a) Fe–Mg disordering occurs more quickly in Opx
containing less AlVI, hence AlVI(M1) hinders the ex-
change reaction; (b) AlVI, Cr3+and Fe3+ occupy the M1
site at both low- and high-T, whereas AlIV remains
completely ordered in the TB site.
The effect of Ca and Al on the P-induced struc-
tural evolution and on the elastic behaviour was
studied by Hugh-Jones et al. (1997) and by Nestola
et al. (2006). Hugh-Jones et al. (1997) showed that
chemical substitution of (0.04 + 0.03) a.p.f.u. of Al
and 0.006 a.p.f.u. of Ca into the structure of Opx
inhibits the initial rapid compression of M2–O3
bonds and the tetrahedral compression above 4 GPa
observed in synthetic (Mg,Fe)SiO3 samples. Nestola
et al. (2006) showed that a Ca substitution
(0.07 a.p.f.u.) into the pure orthoenstatite structure
gives rise to an increase of the bulk modulus (KT0)
and a decrease of its pressure-derivative (K¢) with
respect to the synthetic end-member [KT0(Mg2Si2O6) =
105.8(5) GPa, K¢(Mg2Si2O6) = 8.5(3); KT0(Ca0.07Mg1.93
Si2O6) = 110(1) GPa, K¢(Ca0.07Mg1.93Si2O6) = 6.6(4)].
In Opx along the En–Fs join, excluding the En end-
member, the rapid straightening of the TBnOB3n chain
at HT gives rise to a change in the topological config-
uration of the M2-polyhedron (Smyth 1973; Sueno
et al. 1976; Yang and Ghose 1995a, b). In fact, by
limiting the coordination shell within 3.0 A, at LT, the
M2 site in Opx is coordinated by O1A, O1B, O2A,
O2B, O3A and O3B. With increasing T up to 830–
930�C, previous studies on En75Fe25 Opx (Yang and
Ghose 1995a) showed that the coordination number of
M2 increases to seven, bonding also with the O3B¢oxygen. A further increase in T up to 1,030�C leads to a
new configuration with CN = 6, with the M2–O3B
distance longer than 3.0 A. The latter was considered
by Yang and Ghose (1995a) as a ‘‘transitional state’’
before the HT phase transition to the protoenstatite
structure. In contrast, the En100 does not show any
transitional state before the T-induced phase transition
to protoenstatite at 1,087�C (Yang and Ghose 1995b).
In this study, we do not observe any evidence of
anomalous behaviour with respect to the topological
configuration of the M2 polyhedron within the T-range
investigated. The M2–O3B¢ bond appears to be longer
than 3.0 A up to 1,200�C, although it slightly decreases
with increasing T (Table 4). In addition, the evolution
of the ‘‘order parameter’’ D (defined as the difference
between the O3–O3–O3 angles of the A and B chains,
Yang and Ghose 1995a) with T (Fig. 8) appears to be
smooth with a concave downward shape, less pro-
nounced than that observed for the En75Fs25 Opx at
HT (at the ‘‘transitional state’’). The absence of any
discontinuity confirms that no first-order phase transi-
tion occurs within the T-range investigated.
The experimental data reported in this study indi-
cate that the chemical substitution of a small amount of
198 Phys Chem Minerals (2007) 34:185–200
123

Ca, Fe3+, Al and Cr can play a crucial role on the
thermoelastic behaviour and phase-stability fields of
Opxs with consequent important petrologic and geo-
logical implications, in particular on the thermody-
namic modelling of the Earth mantle processes.
Acknowledgments Financial support to the second author isacknowledged from MIUR (Italian Ministry of University andResearch; Grant No. 2004041033_4). The Italian National Re-search Council (CNR) is acknowledged for access to the ISISFacility through the mutual Agreement (No. 01/9001) betweenCNR and CCLRC. Many thanks are due to Subrata Ghose forprofitable discussion and critical reading of the manuscript be-fore submission. The authors thank the Editor M. Rieder, F.Nestola and an anonymous reviewer for their useful suggestions.
References
Angel RJ, Jackson MJ (2002) Elasticity and equation of state oforthoenstatite, MgSiO3. Am Mineral 87:558–561
Anovitz LM, Essene EJ, Dunham WR (1988) Order–disorderexperiments on orthopyroxene: implications for the ortho-pyroxene geospeedometer. Am Mineral 73:1060–1073
Balic-Zunic T, Vickovic I (1996) IVTON (Version 2)—programfor the calculation of geometrical aspects of crystal struc-tures and some crystal chemical applications. J Appl Cryst29:305–306
Besancon JR (1981) Rate of cation ordering in orthopyroxene.Am Mineral 66:965–973
Boysen H, Frey F, Schrader H, Eckhold G (1991) On the prototo ortho/clino enstatite phase transformation: single crystalX-ray and inelastic neutron investigation. Phys Chem Miner17:629–635
Camara F, Nestola F (2006) Anomalous thermal expansion inCa-rich orthoenstatite. In: Proceedings of EMPG XI, Bristol
Camara F, Doukhan JC, Domeneghetti MC, Zema M (2000) ATEM study of Ca-rich orthopyroxenes with exsolutionproducts: implications for the Mg–Fe ordering process.Eur J Mineral 12:735–748
Cameron M, Papike JJ (1981) Structural and chemical variationsin pyroxenes. Am Mineral 66:1–50
Chatillon-Colinet C, Newton RC, Perkins III D, Kleppa OJ(1983) Thermochemistry of (Fe2+, Mg)SiO3 orthopyroxene.Geochim Cosmochim Acta 47:1597–1603
Chopelas A (2000) Thermal expansivity of mantle relevantmagnesium silicates derived from vibrational spectroscopyat high-pressure. Am Mineral 85:270–278
Chopelas A, Boehler R (1992) High-pressure research: applica-tion to earth and planetary sciences. In: Syono Y, Mangh-nani MH (eds) Terra Scientific, Tokyo, p 101
Domeneghetti MC, Molin G, Tazzoli V (1985) Crystal-chemicalimplications of the Mg2+–Fe2+ distribution in orthopyrox-enes. Am Mineral 70:987–995
Domeneghetti MC, Molin G, Tazzoli V (1995a) A crystal-chemicalmodel for Pbca orthopyroxenes. Am Mineral 80:253–267
Domeneghetti MC, Molin G, Stimpfl M, Tribaudino M (1995b)Orthopyroxene from Serra de Mage’ meteorite: structurerefinement and estimation of C2/c pyroxene contributions toapparent Pbca diffraction violations. Am Mineral 80:923–929
Dove MT (2002) An introduction to the use of neutron scatteringmethods in mineral sciences. Eur J Mineral 14:203–224
Ganguly J (1982) Mg–Fe order–disorder in ferromagnesiansilicates II. In: Saxena S (ed) Thermodyamics: kinetics andgeological applications (advances physical geochemistry 2).Springer, Berlin, pp 58–99
Ganguly J, Ghose S (1979) Aluminous orthopyroxene: order–disorder, thermodynamic properties and petrologic implica-tions. Contrib Mineral Petrol 69:375–385
Ghose S (1965) Mg2+–Fe2+ order in an orthopyroxene,Mg0.93Fe1.07Si2O6. Z Kristallogr 122:81–99
Ghose S, Hafner S (1967) Mg2+–Fe2+ distribution in metamor-phic and volcanic orthopyroxenes. Z Kristallogr 125:1–6
Hugh-Jones DA (1997) Thermal expansion of MgSiO3andFeSiO3 ortho- and clinopyroxenes. Am Mineral 82:689–696
Hugh-Jones DA, Chopelas A, Angel RJ (1997) Tetrahedralcompression in (Mg,Fe)SiO3 orthopyroxenes. Phys ChemMiner 24:301–310
Jackson JM, Palko J, Sinogeikin SV, Bass JD, Andrault D, ZhaC (2001) High-temperature single-crystal elasticity andthermal expansion of orthoenstatite. EOS Trans (Fall Meet.Suppl.), Abstract T31C-0853
Jackson JM, Sinogeikin SV, Carpenter MA, Bass JD (2004) Novelphase transition in orthoenstatite. Am Mineral 89:239–245
Kroll H, Lueder T, Schlenz H, Kirfel A, Vad T (1997) The Fe2+,Mg distribution in orthopyroxene: a critical assessment of itspotential as a geospeedometer. Eur J Mineral 9:705–733
Larson AC, Von Dreele RB (2001) GSAS: general structureanalysis system. Document LAUR 86–748. Los AlamosNational Laboratory, New Mexico
Lee WE, Heuer AH (1987) On the polymorphism of enstatite.J Am Ceram Soc 70:349–360
Makovicky E, Balic-Zunic T (1998) New measure of distortionfor coordination polyhedra. Acta Crystallogr B54:766–773
Miyake A, Shimobayashi N, Kitamura M (2004) Isosymmetricstructural phase transition of orthoenstatite: moleculardynamics simulation. Am Mineral 89:1667–1672
Molin G (1989) Crystal-chemical study of cation disordering inAl-rich and Al-poor orthopyroxenes from spinel lherzolitexenoliths. Am Mineral 74:593–598
Molin G, Stimpfl M (1994) Crystal chemistry and intracrystallinerelationships of orthopyroxene in a suite of high pressureultramafic nodules from the ‘‘Newer Volcanics’’ of Victoria,Australia. Mineral Mag 58:325–332
Molin G, Saxena SK, Brizi E (1991) Iron–magnesium order–disorder in an orthopyroxene crystal from the Johnstownmeteorite. Earth Planet Sci Lett 105:260–265
Murakami T, Takeuchi Y, Yamanaka T (1982) The transition oforthoenstatite to protoenstatite and the structure at 1,080�C.Z Kristallogr 160:299–312
Nestola F, Tribaudino M (2003) The structure of Pbca ortho-pyroxenes along the join diopside–enstatite (CaMgSi2O6–Mg2Si2O6). Eur J Mineral 15:365–371
Nestola F, Gatta GD, Boffa Ballaran T (2006) The effect of Casubstitution on the elastic and structural behaviour of ortho-enstatite. Am Mineral 91:809–815
Ohashi Y (1982) STRAIN: a program to calculate the straintensor from two sets of unit-cell parameters. In: Hazen RM,Finger LW (eds) Comparative crystal chemistry, Wiley,New York, pp 92–102
Ohi S, Miyake A, Shimobayashi N, Kitamura M. (2006) Stabilityof high-temperature orthopyroxene in Mg2Si2O6–CaM-gSi2O6 system at atmospheric pressure. In: Proceedings ofthe 19th general meeting of the International mineralogicalassociation (IMA), Kobe, Japan, pp 1–7
Pannhorst W (1979) Structural relationship between pyroxenes.N Jb Miner Abh 135:1–7
Phys Chem Minerals (2007) 34:185–200 199
123

Reid AM, Williams RJ, Takeda H (1974) Coexisting bronziteand clinobronzite and the thermal evolution of the Stein-bach meteorite. Earth Planet Sci Lett 22:67–74
Rinaldi R (2002) Neutron scattering in mineral sciences. Eur JMineral 14:195–202
Rinaldi R, Gatta GD, Artioli G, Knight KS, Geiger CA (2005)Crystal chemistry, cation ordering and thermoelastic behav-iour of CoMgSiO4 olivine at high temperature as studied byin situ neutron powder diffraction. Phys Chem Miner32:655–664
Saxena SK, Ghose S (1971) Mg2+–Fe2+ order-disorder and thethermodynamics of orthopyroxene crystalline solution. AmMineral 56:532–559
Saxena SK, Domeneghetti MC, Molin G, Tazzoli V (1989) X-raydiffraction study of Fe2+ – Mg order-disorder in orthopy-roxene: Some kinetic results. Phys Chem Miner 16:421–427
Schrader H, Boysen H, Frey F, Convert P (1990) On the phasetransformation proto- to clino/orthoenstatite: neutron pow-der investigations. Phys Chem Miner 17:409–415
Shimobayashi N, Kitamura M (1993) Phase transition oforthoenstatite to high-clinoenstatite: in situ TEM study athigh temperatures. Mineral J 16:416–426
Smith JV (1969) Crystal structure and stability of the MgSiO3
polymorphs: physical properties and phase relations of Mg–Fe pyroxenes. Mineral Soc Am Spec Pap 2:3–30
Smyth JR (1969) Orthopyroxene high–low clinopyroxene inver-sions. Earth Planet Sci Lett 6:406–407
Smyth JR (1971) Protoenstatite: a crystal structure refinement at1,100�C. Z Kristallogr 134:262–274
Smyth JR (1973) An orthopyroxene structure up to 850�C. AmMineral 58:636–648
Smyth JR (1974) Experimental study on the polymorphism ofenstatite. Am Mineral 59:345–352
Smyth JR, Burnham CW (1972) The crystal structure of high andlow clinohypersthene. Earth Planet Sci Lett 14:183–189
Smyth JR, Ito J (1977) The synthesis and crystal structure of amagnesium lithium scandium protopyroxene. Am Mineral62:857–873
Stimpfl M, Ganguly J, Molin G (1999) Fe2+–Mg order–disorderin orthopyroxene: equilibrium fractionation between octa-hedral sites and thermodynamic analysis. Contrib MineralPetrol 136:297–309
Stimpfl M, Ganguly J, Molin G (2005) Kinetics of Fe2+–Mgorder–disorder in orthopyroxene: experimental studies andapplications to cooling rates of rocks. Contr Mineral Petrol150:319–334
Sueno S, Kimata M (1981) On the ortho–clino phase transition offerrosilite (FeSiO3) and Fe-rich pyroxenes. Acta CrystallogrA 37:C-111
Sueno S, Prewitt CT (1983) Models for phase transition betweenorthoferrosilite and high clinoferrosilite. Fortschr Mineral61:223–241
Sueno S, Cameron M, Prewitt CT (1976) Orthoferrosilite: hightemperature crystal chemistry. Am Mineral 61:38–53
Sueno S, Kimata M, Prewitt CT (1984) The crystal structure ofhigh clinoferrosilite. Am Mineral 69:264–269
Sueno S, Prewitt CT, Kimata M (1985) Structural aspects ofphase transitions in Fe–Mg–Ca pyroxenes. Am Mineral70:141–148
Sykes-Nord JA, Molin G (1993) Mg–Fe order–disorder inFe-rich orthopyroxene: structural variations and kinetics.Am Mineral 78:921–931
Tazzoli V, Domeneghetti MC (1987) Crystal-chemistry of naturaland heated aluminous orthopyroxenes. Phys Chem Miner15:131–139
Tribaudino M, Nestola F (2002) Average and local structure inP21/c clino-pyroxenes along the join diopside–enstatite(CaMgSi2O6). Eur J Mineral 14:549–555
Virgo D, Hafner SS (1969) Order–disorder in heated orthopy-roxenes. Mineral Soc Am Spec Pap 2:67–81
Yang H, Ghose S (1994a) In situ Fe–Mg order–disorder studiesand thermodynamic properties of orthopyroxene (Fe,Mg)2-
Si2O6. Am Mineral 79:633–643Yang H, Ghose S (1994b) Thermal expansion, Debye temper-
ature and Gruneisen parameter of synthetic (Fe,Mg)SiO3
orthopyroxenes. Phys Chem Miner 20:575–586Yang H, Ghose S (1995a) A transitional structural state and
anomalous Fe–Mg order–disorder in Mg-rich orthopyrox-ene, (Mg0.75 Fe0.25) Si2O6. Am Mineral 80:9–20
Yang H, Ghose S (1995b) High-temperature single-crystal X-raydiffraction studies of the ortho–proto phase transition inenstatite, Mg2Si2O6 at 1,360 K. Phys Chem Miner 22: 300–310
Yang H, Prewitt CT (2000) Chain and layer silicates at hightemperature and pressures. In: Hazen RM, Downs RT (eds)High-temperature and high-pressure crystal chemistry. Re-views in mineralogy and geochemistry, vol 41. MineralogicalSociety of America and Geochemical Society, Washington,pp 211–256
Zema M, Tarantino SC, Domeneghetti MC, Tazzoli V (2003) Cain orthopyroxene: structural variations and kinetics of thedisordering process. Eur J Mineral 15:373–380
Zhao Y, Schiferl D, Shankland TJ (1995) A high P-T single-crystal X-ray diffraction study of thermoelasticity of MgSiO3
orthoenstatite. Phys Chem Miner 22:393–398
200 Phys Chem Minerals (2007) 34:185–200
123
Related Documents


