JOURNAL OF PETROLOGY VOLUME 38 NUMBER 7 PAGES 877–910 1997 High-temperature Retrogression of Granulite-facies Marbles from the Reynolds Range Group, Central Australia: Phase Equilibria, Isotopic Resetting and Fluid Fluxes IAN S. BUICK 1 *, IAN CARTWRIGHT 2 AND IAN S. WILLIAMS 3 1 SCHOOL OF EARTH SCIENCES AND VICTORIAN INSTITUTE OF EARTH AND PLANETARY SCIENCES (VIEPS), LA TROBE UNIVERSITY, BUNDOORA, VIC. 3083, AUSTRALIA 2 DEPARTMENT OF EARTH SCIENCES AND VIEPS, MONASH UNIVERSITY, CLAYTON, VIC. 3168, AUSTRALIA 3 RESEARCH SCHOOL OF EARTH SCIENCES, AUSTRALIAN NATIONAL UNIVERSITY, CANBERRA, A.C.T. 0200, AUSTRALIA RECEIVED SEPTEMBER 10, 1996 REVISED TYPESCRIPT ACCEPTED FEBRUARY 21, 1997 Reynolds Range Group rocks underwent granulite-facies meta- INTRODUCTION morphism (M 2 ) at ~1·6 Ga (~5 kbar, 750–800°C) and were The uplift history of high-grade metamorphic belts com- subsequently retrogressed in narrow strike-parallel zones at 1·59– monly involves partial re-equilibration of mineral as- 1·57 Ga. Within these zones, metacarbonates that initially equi- semblages to lower temperature and pressure conditions. librated at X 2 >0·8 during M 2 were mineralogically reset This re-equilibration is facilitated by fluid–rock inter- by the infiltration of water-rich fluids (X 2 Ζ0·02–0·3) at action, and new mineral assemblages are often best 650–700°C and 3–4 kbar. d 18 O(Carb) values of the retrogressed developed in discrete zones of extensive retrogression metacarbonates were variably reset during fluid infiltration, with the (e.g. Van Reenen, 1986; Cartwright, 1988; Peters & lowest values (10–13‰) suggesting that the fluids that caused Wickham, 1994; Cartwright & Buick, 1995). Petrological retrogression were exsolved from segregated partial melts, themselves studies of retrograde mineral assemblages may provide derived from the underlying granulite-facies metapelites. Min- important information about the tectonics and hydro- eralogical and isotopic resetting were locally accompanied by silica geology of the lower and middle crust. metasomatism. The mineralogically reset marbles record time-in- However, although there have been many recent quan- tegrated fluid fluxes of typically ~10 1 –10 2 m 3 /m 2 , and metasomatic titative studies of metamorphic fluid–rock interaction in rocks record time-integrated fluid fluxes as high as ~10 3 –10 4 m 3 / contact aureoles (Cartwright & Valley, 1991; Ferry & m 2 . For upward flow of high-temperature fluids through the marbles Dipple, 1991; Young & Morrison, 1992; Jamveit et al., over a distance of ~200 m in ~18 Ma, the observed mineralogical 1992; Davis & Ferry, 1994) and during prograde regional and isotopic resetting, and metasomatism require intrinsic per- metamorphism (Bickle & Baker, 1990a, 1990b; Ferry, meabilities between ~10 –22 and 10 –19 m 2 that vary across strike 1992; Stern et al., 1992; Le ´ger & Ferry, 1993; Cartwright on a centimetre to metre scale, indicating that fluid flow was strongly et al., 1995; Buick & Cartwright, 1996), there have been channelled. relatively few studies of high-temperature retrogression (Vennemann & Stuart-Smith, 1992; Peters & Wickham, 1994; Cartwright & Buick, 1995). Therefore, the origins of the retrograde fluids, and the absolute timing of KEY WORDS: granulites; marbles; retrogression; petrology; fluid fluxes *Corresponding author. Fax: 61-3-94791272. e-mail: I.Buick @latrobe.edu.au Oxford University Press 1997

Welcome message from author
This document is posted to help you gain knowledge. Please leave a comment to let me know what you think about it! Share it to your friends and learn new things together.
Transcript
JOURNAL OF PETROLOGY VOLUME 38 NUMBER 7 PAGES 877–910 1997
High-temperature Retrogression ofGranulite-facies Marbles from the ReynoldsRange Group, Central Australia:Phase Equilibria, Isotopic Resetting andFluid Fluxes
IAN S. BUICK1∗, IAN CARTWRIGHT2 AND IAN S. WILLIAMS3
1SCHOOL OF EARTH SCIENCES AND VICTORIAN INSTITUTE OF EARTH AND PLANETARY SCIENCES (VIEPS), LA TROBE
UNIVERSITY, BUNDOORA, VIC. 3083, AUSTRALIA2DEPARTMENT OF EARTH SCIENCES AND VIEPS, MONASH UNIVERSITY, CLAYTON, VIC. 3168, AUSTRALIA3RESEARCH SCHOOL OF EARTH SCIENCES, AUSTRALIAN NATIONAL UNIVERSITY, CANBERRA, A.C.T. 0200, AUSTRALIA
RECEIVED SEPTEMBER 10, 1996 REVISED TYPESCRIPT ACCEPTED FEBRUARY 21, 1997
Reynolds Range Group rocks underwent granulite-facies meta- INTRODUCTIONmorphism (M2) at ~1·6 Ga (~5 kbar, 750–800°C) and were The uplift history of high-grade metamorphic belts com-subsequently retrogressed in narrow strike-parallel zones at 1·59– monly involves partial re-equilibration of mineral as-1·57 Ga. Within these zones, metacarbonates that initially equi-
semblages to lower temperature and pressure conditions.librated at X2>0·8 during M2 were mineralogically reset
This re-equilibration is facilitated by fluid–rock inter-by the infiltration of water-rich fluids (X2Ζ0·02–0·3) at
action, and new mineral assemblages are often best650–700°C and 3–4 kbar. d18O(Carb) values of the retrogressed
developed in discrete zones of extensive retrogressionmetacarbonates were variably reset during fluid infiltration, with the
(e.g. Van Reenen, 1986; Cartwright, 1988; Peters &lowest values (10–13‰) suggesting that the fluids that caused
Wickham, 1994; Cartwright & Buick, 1995). Petrologicalretrogression were exsolved from segregated partial melts, themselvesstudies of retrograde mineral assemblages may providederived from the underlying granulite-facies metapelites. Min-important information about the tectonics and hydro-eralogical and isotopic resetting were locally accompanied by silicageology of the lower and middle crust.metasomatism. The mineralogically reset marbles record time-in-
However, although there have been many recent quan-tegrated fluid fluxes of typically ~101–102 m3/m2, and metasomatictitative studies of metamorphic fluid–rock interaction inrocks record time-integrated fluid fluxes as high as ~103–104 m3/contact aureoles (Cartwright & Valley, 1991; Ferry &m2. For upward flow of high-temperature fluids through the marblesDipple, 1991; Young & Morrison, 1992; Jamveit et al.,over a distance of ~200 m in ~18 Ma, the observed mineralogical1992; Davis & Ferry, 1994) and during prograde regionaland isotopic resetting, and metasomatism require intrinsic per-metamorphism (Bickle & Baker, 1990a, 1990b; Ferry,meabilities between ~10–22 and 10–19 m2 that vary across strike1992; Stern et al., 1992; Leger & Ferry, 1993; Cartwrighton a centimetre to metre scale, indicating that fluid flow was stronglyet al., 1995; Buick & Cartwright, 1996), there have beenchannelled.relatively few studies of high-temperature retrogression(Vennemann & Stuart-Smith, 1992; Peters & Wickham,1994; Cartwright & Buick, 1995). Therefore, the originsof the retrograde fluids, and the absolute timing ofKEY WORDS: granulites; marbles; retrogression; petrology; fluid fluxes
∗Corresponding author. Fax: 61-3-94791272. e-mail: [email protected] Oxford University Press 1997
JOURNAL OF PETROLOGY VOLUME 38 NUMBER 7 JULY 1997
fluid–rock interaction in these granulite terrains is the bands (Dirks & Wilson, 1990), the dominant set of whichtrends at an angle to the regional strike of the Reynoldssubject of debate.
In this study, we provide constraints on the spatial Range (Fig. 2b). A minor set of crenulations trend parallelto the regional strike and coaxially refold F 2 folds on andistribution, composition, and origin of high-temperature
fluids that were responsible for retrogression of granulite- outcrop scale (Dirks & Wilson, 1990; Hand & Dirks,1991). The D 3 crenulation zones formed towards the endfacies dolomitic marbles and associated rocks from the
Reynolds Range Group, central Australia. We show that of the regional M 2 metamorphism. They are associatedwith the segregation and crystallization of partial meltsthe retrogression was sourced internally within the terrain
through the segregation and crystallization of locally sourced from metapelites or metagranites, and sub-sequent high-temperature retrogression (Hand & Dirks,derived partial melts, and calculate the time-integrated
fluid fluxes necessary to drive the mineralogical reactions, 1991; Cartwright et al., 1996). D 2 and D 3 structures aredisrupted by a system of major NE-dipping ductile thruststo isotopically reset the marbles, and to cause local
metasomatism and quartz veining. We use differences in developed during the ~300 Ma Alice Springs Orogeny(I. Cartwright & I. S. Buick, unpublished data, 1997).the length scales of isotopic and mineralogical resetting
to constrain the geometry of fluid flow, and calculate the These structures are associated with extensive hydration,but are not discussed further here.intrinsic permeabilities and Darcy fluxes during retro-
gression. In this paper we describe late-M 2 channelled retro-gression of Mg-rich marbles, calc-silicate rocks and meta-psammites from a granulite-facies portion of the UpperCalcsilicate Unit (Figs 1 and 2a), where peak-M 2 tem-
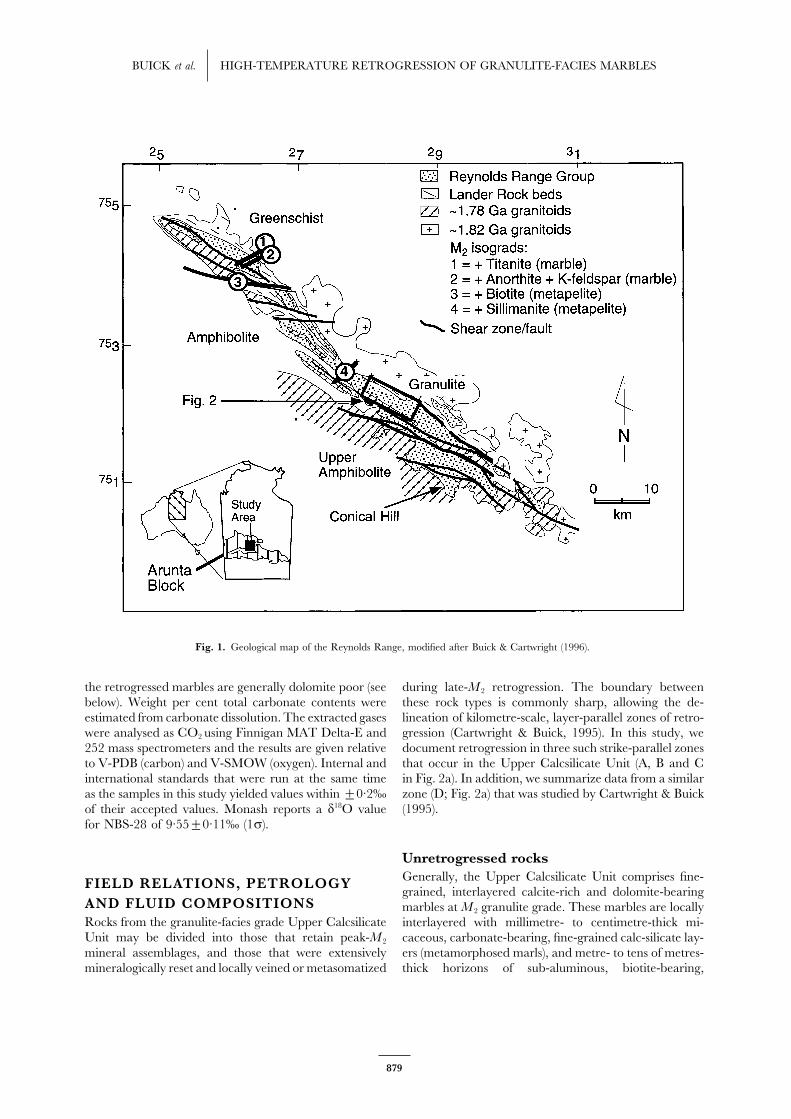
REGIONAL SETTING peratures were probably ~750°C (Dirks et al., 1991; Buick& Cartwright, 1996; Buick et al., 1997a). Geo-The Reynolds Range (Fig. 1) is a low-pressure meta-thermobarometry of garnet-bearing rocks in the retro-morphic belt in the northern Arunta Inlier. It containsgrade zones suggests that retrogression occurred at pres-metasediments of the Lander Rock Beds (local basement)sures of ~3–4 kbar and temperatures of ~650–700°Cand the Reynolds Range Group (local cover; Stewart et(Buick et al., 1997a), which we interpret as occurring afteral., 1981). The earliest metamorphism occurred only inminor decompression and cooling of the terrain fromthe basement before, and during, granite emplacement atthe M 2 peak. Minor decompression after M 2 is also~1·82–1·81 Ga (Collins & Williams, 1995). Subsequently,recorded by metasomatic rocks in the Lander Rock Bedsthe Reynolds Range Group was deposited between ~1·81(Vry & Cartwright, 1994; Vry et al., 1996).and 1·78 Ga (Collins & Williams, 1995; Williams et al.,
1996). The Reynolds Range Group comprises: the basalQuartzite Unit; the Lower Calcsilicate Unit, which is alateral equivalent of the Quartzite Unit; the overlying
ANALYTICAL METHODSPelite Unit; and the Upper Calcsilicate Unit, whichoccurs as a discontinuous horizon within the Pelite Unit. Proportions of calcite and dolomite in retrogressed mar-
bles were determined by point counting on stained thinA second generation of granites (Fig. 1) was emplacedinto both the Reynolds Range Group and the basement sections. Mineral compositions were determined using a
Cameca CAMEBAX SX50 electron microprobe at theat ~1·78 Ga (Collins & Williams, 1995) and causedlocalized amphibolite-facies contact metamorphism and University of Melbourne (15 kV, 25 nA) by wavelength-
dispersive spectrometry and incorporating Cameca PAPminor deformation (Dirks & Wilson, 1990; Dirks et al.,1991). Subsequently, the Reynolds Range Group, gran- matrix corrections. Total iron was analysed as FeO, and
in anhydrous Fe-bearing silicates has been re-cast as FeOites and basement were regionally metamorphosed duringM 2–D 2 (Dirks et al., 1991) at ~1·6 Ga (Williams et al., and Fe2O3 using stoichiometric constraints.
Stable isotope ratios were analysed at Monash Uni-1996). M 2 occurred at low pressures (~5 kbar) andincreased in grade from greenschist-facies (400–450°C) versity. Oxygen isotope ratios of silicate minerals and
whole rocks were analysed following Clayton & Mayedato granulite-facies (750–800°C) conditions along thelength of the Reynolds Range (Fig. 1; Dirks et al., 1991; (1963) using ClF3 as the oxidizing reagent. Silicate min-
erals were separated by hand picking. Stable isotopeBuick et al., 1997a) at approximately the same crustallevel. M 2 occurred synchronously with upright, NW–SE- ratios of carbonates were analysed from mixed car-
bonate–silicate powders by reaction with 105% phos-trending, tight to isoclinal folding (F 2) and the de-velopment of a penetrative, subvertical NW–SE-trending phoric acid in sealed vessels at 25°C for 12–18 h (McCrea,
1950). Stable isotope analyses were obtained from calcitefoliation (S 2). M 2 isograds cut the strike of major strati-graphic units at medium to high angles (Fig. 1). and dolomite mixtures because of the very small stable
isotopic fractionations between these minerals at elevatedThe D 2 structures are locally deformed on all scalesby conjugate, steeply dipping D 3 crenulations or shear temperatures (Sheppard & Schwarcz, 1970), and because
878
BUICK et al. HIGH-TEMPERATURE RETROGRESSION OF GRANULITE-FACIES MARBLES
Fig. 1. Geological map of the Reynolds Range, modified after Buick & Cartwright (1996).
the retrogressed marbles are generally dolomite poor (see during late-M 2 retrogression. The boundary betweenthese rock types is commonly sharp, allowing the de-below). Weight per cent total carbonate contents were
estimated from carbonate dissolution. The extracted gases lineation of kilometre-scale, layer-parallel zones of retro-gression (Cartwright & Buick, 1995). In this study, wewere analysed as CO2 using Finnigan MAT Delta-E and
252 mass spectrometers and the results are given relative document retrogression in three such strike-parallel zonesthat occur in the Upper Calcsilicate Unit (A, B and Cto V-PDB (carbon) and V-SMOW (oxygen). Internal and
international standards that were run at the same time in Fig. 2a). In addition, we summarize data from a similarzone (D; Fig. 2a) that was studied by Cartwright & Buickas the samples in this study yielded values within±0·2‰(1995).of their accepted values. Monash reports a d18O value
for NBS-28 of 9·55±0·11‰ (1r).
Unretrogressed rocksGenerally, the Upper Calcsilicate Unit comprises fine-FIELD RELATIONS, PETROLOGYgrained, interlayered calcite-rich and dolomite-bearing
AND FLUID COMPOSITIONS marbles at M 2 granulite grade. These marbles are locallyRocks from the granulite-facies grade Upper Calcsilicate interlayered with millimetre- to centimetre-thick mi-Unit may be divided into those that retain peak-M 2 caceous, carbonate-bearing, fine-grained calc-silicate lay-mineral assemblages, and those that were extensively ers (metamorphosed marls), and metre- to tens of metres-
thick horizons of sub-aluminous, biotite-bearing,mineralogically reset and locally veined or metasomatized
879
JOURNAL OF PETROLOGY VOLUME 38 NUMBER 7 JULY 1997
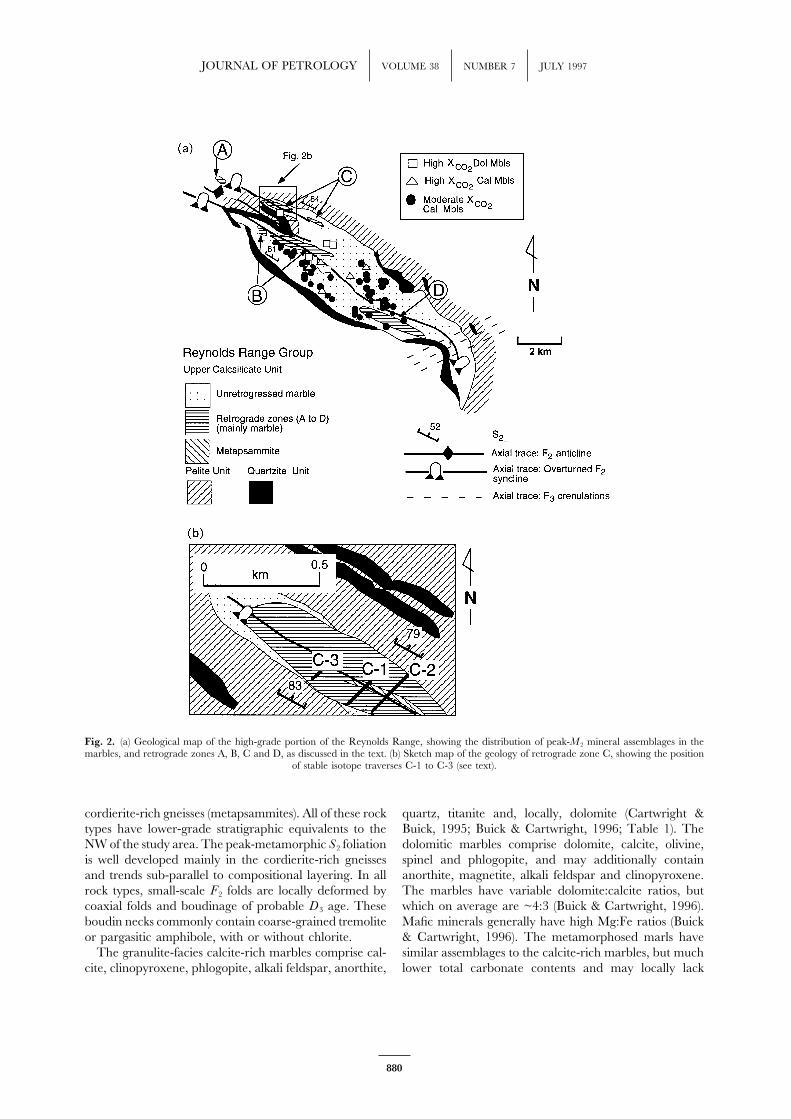
Fig. 2. (a) Geological map of the high-grade portion of the Reynolds Range, showing the distribution of peak-M 2 mineral assemblages in themarbles, and retrograde zones A, B, C and D, as discussed in the text. (b) Sketch map of the geology of retrograde zone C, showing the position
of stable isotope traverses C-1 to C-3 (see text).
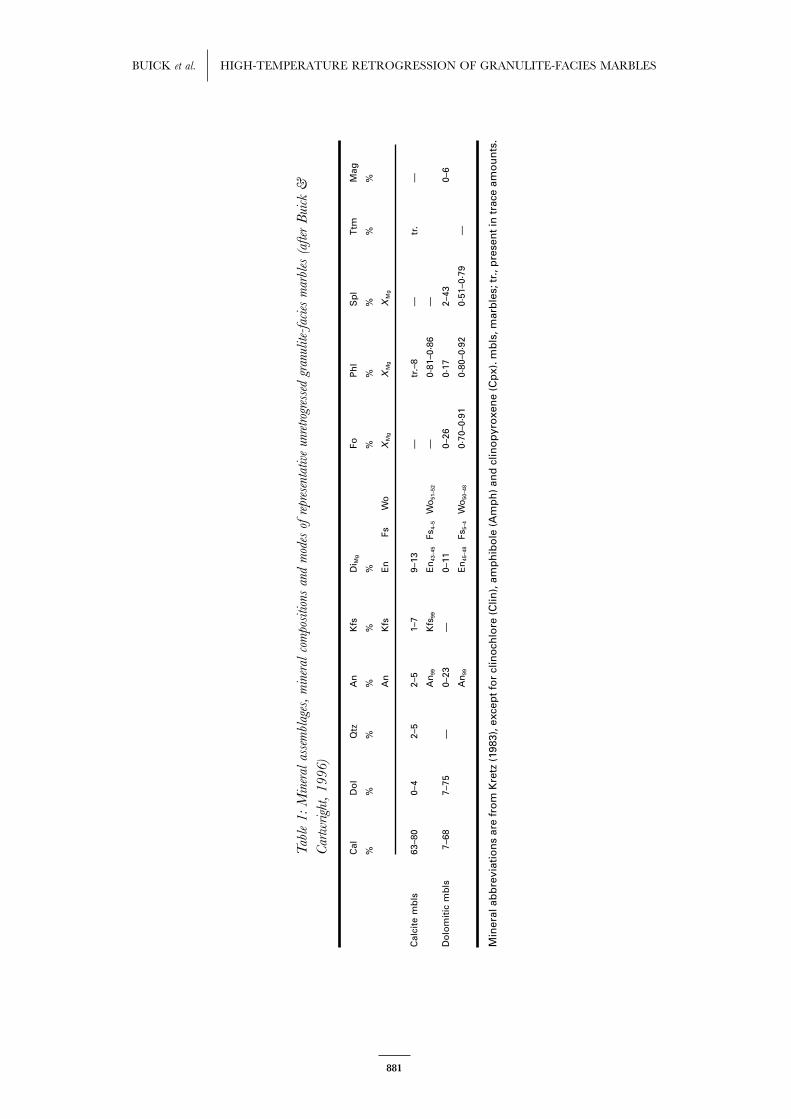
cordierite-rich gneisses (metapsammites). All of these rock quartz, titanite and, locally, dolomite (Cartwright &Buick, 1995; Buick & Cartwright, 1996; Table 1). Thetypes have lower-grade stratigraphic equivalents to the
NW of the study area. The peak-metamorphic S 2 foliation dolomitic marbles comprise dolomite, calcite, olivine,spinel and phlogopite, and may additionally containis well developed mainly in the cordierite-rich gneisses
and trends sub-parallel to compositional layering. In all anorthite, magnetite, alkali feldspar and clinopyroxene.The marbles have variable dolomite:calcite ratios, butrock types, small-scale F 2 folds are locally deformed by
coaxial folds and boudinage of probable D 3 age. These which on average are ~4:3 (Buick & Cartwright, 1996).Mafic minerals generally have high Mg:Fe ratios (Buickboudin necks commonly contain coarse-grained tremolite
or pargasitic amphibole, with or without chlorite. & Cartwright, 1996). The metamorphosed marls havesimilar assemblages to the calcite-rich marbles, but muchThe granulite-facies calcite-rich marbles comprise cal-
cite, clinopyroxene, phlogopite, alkali feldspar, anorthite, lower total carbonate contents and may locally lack
880
BUICK et al. HIGH-TEMPERATURE RETROGRESSION OF GRANULITE-FACIES MARBLES
Tab
le1:
Min
eral
asse
mbl
ages
,m
iner
alco
mpo
sition
san
dm
odes
ofre
pres
enta
tive
unre
trog
ress
edgr
anul
ite-
faci
esm
arbl
es(a
fter
Bui
ck&
Car
twri
ght,
1996)
Cal
Do
lQ
tzA
nK
fsD
i Mg
FoP
hl
Sp
lT
tmM
ag
%%
%%
%%
%%
%%
%
An
Kfs
En
FsW
oX
Mg
XM
gX
Mg
Cal
cite
mb
ls63
–80
0–4
2–5
2–5
1–7
9–13
—tr
.–8
—tr
.—
An
99K
fs99
En
43–4
5Fs
4–5
Wo
51–5
2—
0·81
–0·8
6—
Do
lom
itic
mb
ls7–
687–
75—
0–23
—0–
110–
260·
172–
430–
6
An
99E
n45
–48
Fs5–
4W
o50
–48
0·70
–0·9
10·
80–0
·92
0·51
–0·7
9—
Min
eral
abb
revi
atio
ns
are
fro
mK
retz
(198
3),e
xcep
tfo
rcl
ino
chlo
re(C
lin),
amp
hib
ole
(Am
ph
)an
dcl
ino
pyr
oxe
ne
(Cp
x).m
bls
,mar
ble
s;tr
.,p
rese
nti
ntr
ace
amo
un
ts.
881
JOURNAL OF PETROLOGY VOLUME 38 NUMBER 7 JULY 1997
quartz (Cartwright & Buick, 1995; Buick & Cartwright, marbles and marls are shown in Fig. 3b. The phase1996). diagrams were constructed at 3·5 kbar using Version 2.3
The fluid in equilibrium with the unretrogressed gran- of the THERMOCALC computer program and anulite-facies marbles and calc-silicate layers is generally unpublished update of the internally consistent thermo-CO2 rich. At 750°C, mineral assemblages in the dolomite- dynamic dataset of Holland & Powell (1990). Althoughrich marbles commonly constrain X2 values to be[0·9 they do not incorporate solid solutions, the use of theseat 4·5 kbar (Buick & Cartwright, 1996). In calcite-rich, end-member grids is reasonable because the compositionsquartz-bearing marbles the absence of wollastonite con- of the minerals in the rocks of interest are close to thosestrains X2 values to be >0·4 at 750°C and 4·5 kbar in the Mg end-member systems. Retro-(Buick & Cartwright, 1996). The calcite-rich marbles and gression probably occurred after limited decompressionmarls locally contain Cal+Phl+Kfs+Dol, indicating (~1·5 kbar) and cooling (~100°C) of the terrain fromvery high X2 conditions (~0·95; Buick & Cartwright, the M 2 peak, based on pressure–temperature estimates1996). obtained from the metasomatized margins of pegmatites
The high-grade, unretrogressed marbles (typically ~75 emplaced within the retrograde zones (Buick et al., 1997a).wt % carbonate) and metamorphosed marls (typically Figures 3a and 3b do not show the effects of varying~13 wt % carbonate) together have d18O(Carb) and pressure on mineral equilibria. Recalculation of thesed13C(Carb) values of 14·0–20·5‰ (mean 16·8±1·5‰) phase diagrams at syn-peak M 2 pressures (~5 kbar) resultsand –2·2 to 1·4 (mean –0·5±0·7‰, n=68), respectively, in only minor displacement of equilibria and isobaricthat are likely to represent the range of stable isotope invariant points.values in the marbles at the regional M 2 peak (Buick & Detailed stable isotope data were collected in a seriesCartwright, 1996). Unretrogressed dolomitic and calcite- of traverses across the strike of retrograde zone C (Fig.rich marbles have similar ranges of isotopic values. The 2b), together with representative samples of the samed18O(Carb) values of the unretrogressed marbles are rock types from retrograde zones A and B. In retrogradegenerally lower than the range typical for marine lime- zone C, samples were collected along two 100–200 mstones (20–30‰; Hoefs, 1987) and probably reflect non- long traverses (C-1 and C-2), approximately 75 m apart,pervasive fluid flow during contact metamorphism as- across the retrogressed equivalents of the dolomiticsociated with emplacement of the ~1·78 Ga granites marble, minor calcite marble and marl layers and meta-(Buick & Cartwright, 1996). The d18O values of granulite- psammite, as well as newly formed metasomatic rocksfacies metapelites (4·9–13·7‰) are also much lower than (see below). Traverse C-3 was undertaken across a latethose of typical unmetamorphosed shales (15–19‰; pegmatite emplaced into retrogressed marble further toHoefs, 1987), and also probably reflect early contact the NW of Traverse C-1 (Fig. 2b, see below).metamorphic fluid flow. Preservation of these stableisotope ratios through M 2 implies little fluid flow at that
Dolomite-bearing marblestime (Buick & Cartwright, 1996).The unretrogressed cordierite-rich metapsammites The retrogressed dolomitic rocks comprise forsterite or
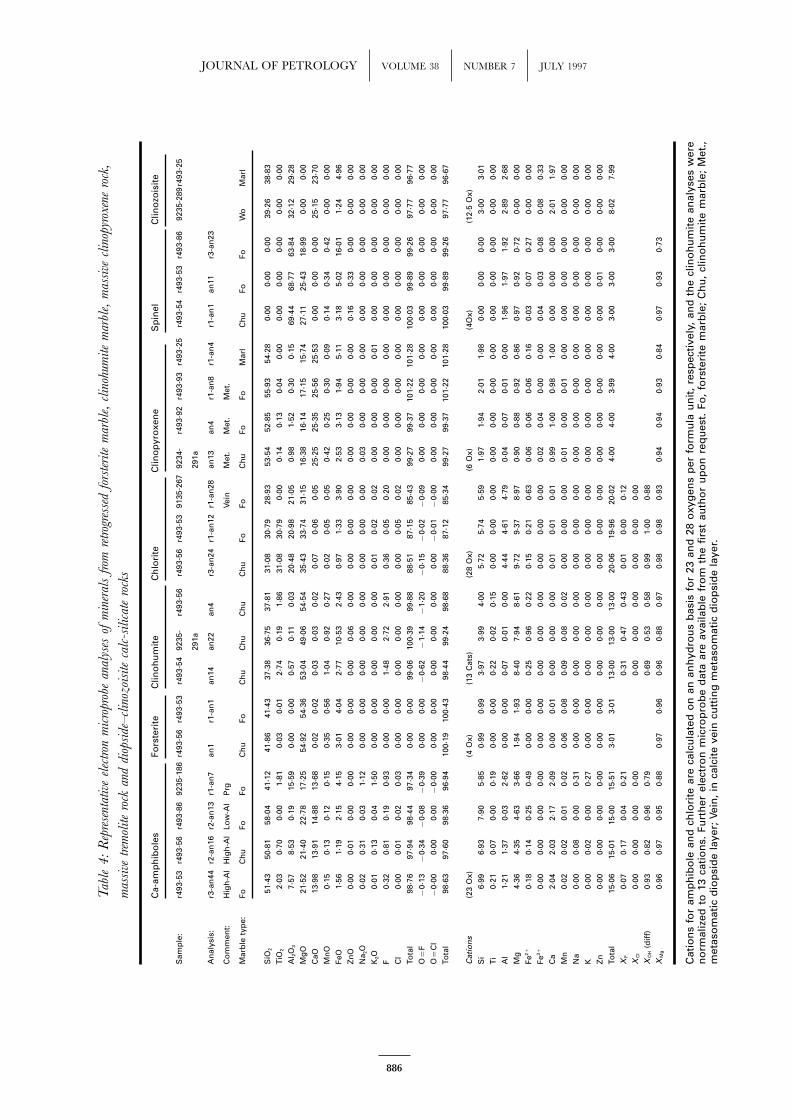
contain quartz, biotite, plagioclase, cordierite and il- clinohumite marbles (Table 2), and a variety of high-menite. M 2 temperatures do not appear to have been variance calc-silicate rocks (Table 3). The clinohumitehigh enough for these rocks to melt. Subordinate pelitic marbles are less common and locally occur close to late-interlayers contain similar assemblages to metapelites in M 2 pegmatites (see below). The forsterite marblesthe Pelite Unit, and may have partially melted at granulite contain: Cal±Dol+Fo (X Mg=0·73–0·96)+Spl (X Mg=grades (see Dirks et al., 1991). 0·57–0·93)±Prg (X Mg=0·82–0·96; X F=0·09–0·20;
X Alvi=0·06–0·12)±Tr (X Mg=0·76–0·97; X F=0·01–0·17;
X Alvi=0·00–0·08)±Chl (X Mg=0·89–0·98; X Al
vi=0·19–Retrogressed rocks 0·20)±Ilm (X Mg+X Mn=0·14–0·31)±Phl±Ttn (Table
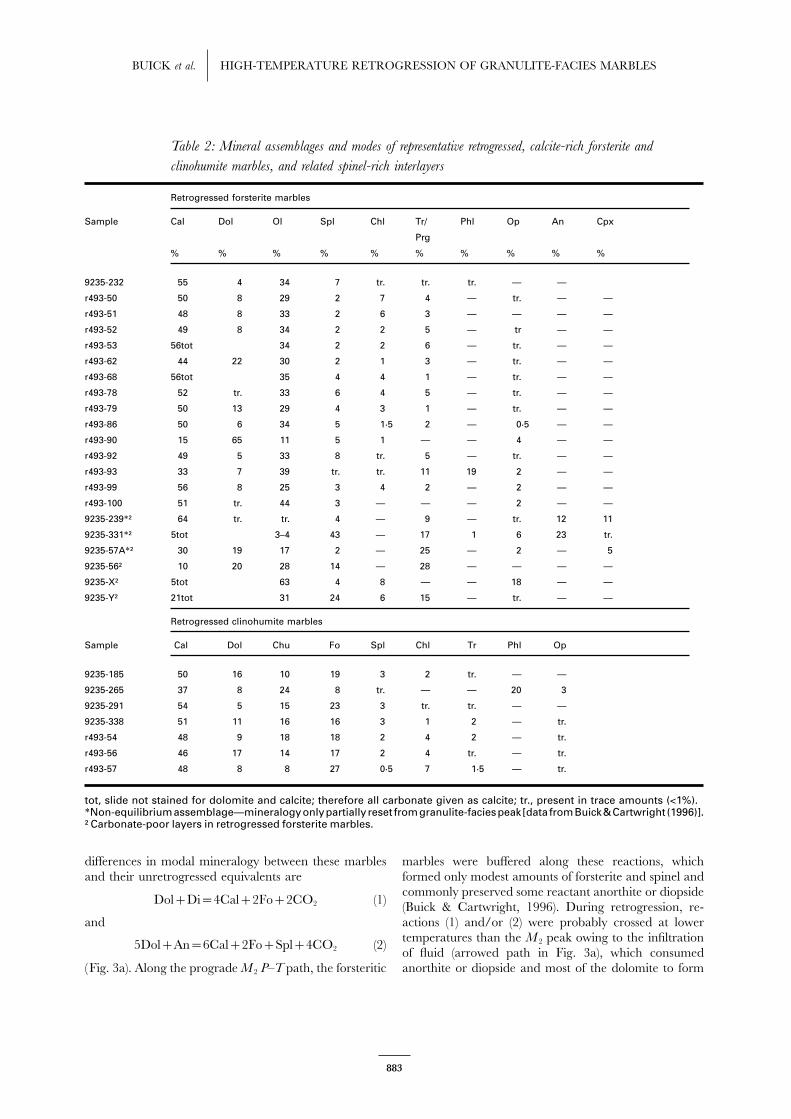
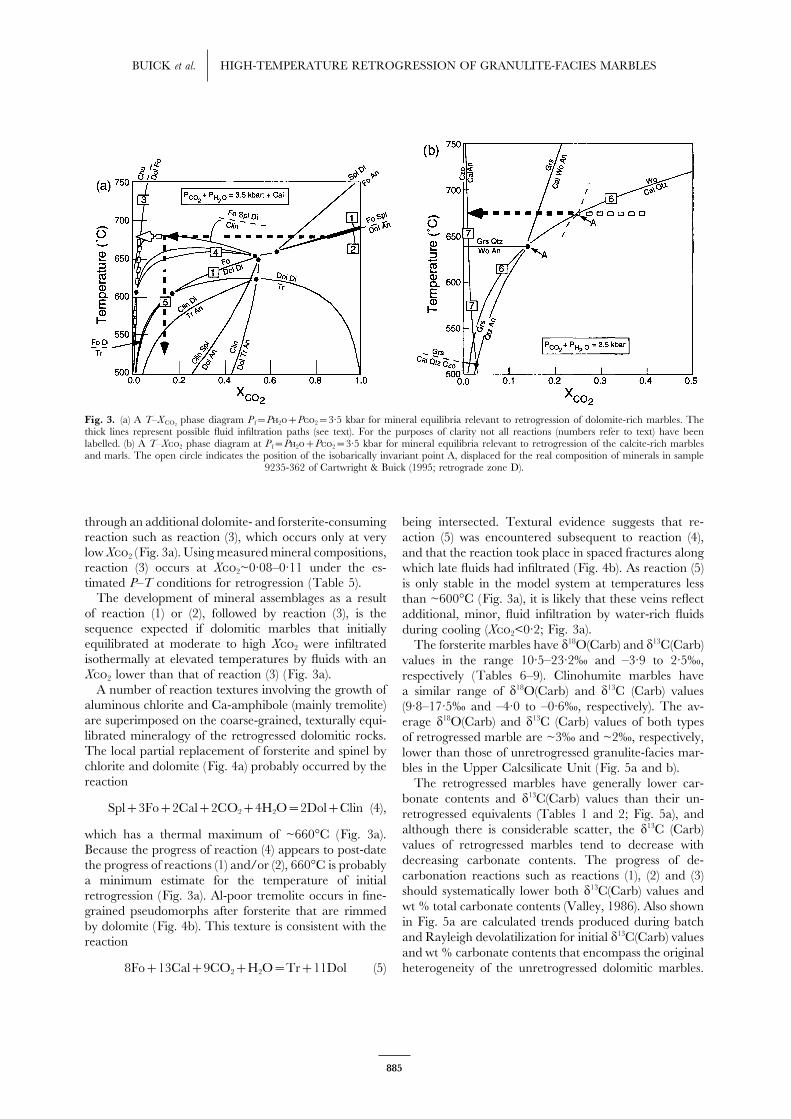
4). The most iron-rich assemblages are spinel rich andThe major rock types in retrograde zones A, B and Ccarbonate poor, otherwise the minerals are Mg rich.(Fig. 2a and b) are the altered equivalents of the dolomiticCompared with their unretrogressed equivalents, themarbles (Tables 2 and 3) and metapsammites. Theretrogressed dolomitic marbles are much coarser grained,altered equivalents of the calcite-rich marbles (Table 3)have lower total carbonate contents (~50 wt % comparedoccur locally, but are the main rock type only in ret-with ~75 wt %) and lower dolomite:calcite ratios (~1:4;rograde zone D. Figure 3a shows selected equilibria inTable 2, compared with ~4:3; Buick & Cartwright, 1996).T–X2 space for the CaO–MgO–Al2O3–They also contain no anorthite or diopside, but haveSiO2–CO2–H2O (CMAS-V) system, which are relevantmore forsterite (average ~30 vol. % compared withto retrogression of the dolomitic marbles. Mineral equi-~15 vol. %; Tables 1 and 2) than their unretrogressedlibria in the CaO–Al2O3–SiO2–CO2–H2O (CAS-V) sys-
tem that may be used to describe the retrogressed calcite counterparts. Possible reactions that may account for the
882
BUICK et al. HIGH-TEMPERATURE RETROGRESSION OF GRANULITE-FACIES MARBLES
Table 2: Mineral assemblages and modes of representative retrogressed, calcite-rich forsterite and
clinohumite marbles, and related spinel-rich interlayers
Retrogressed forsterite marbles
Sample Cal Dol Ol Spl Chl Tr/ Phl Op An Cpx
Prg
% % % % % % % % % %
9235-232 55 4 34 7 tr. tr. tr. — —
r493-50 50 8 29 2 7 4 — tr. — —
r493-51 48 8 33 2 6 3 — — — —
r493-52 49 8 34 2 2 5 — tr — —
r493-53 56tot 34 2 2 6 — tr. — —
r493-62 44 22 30 2 1 3 — tr. — —
r493-68 56tot 35 4 4 1 — tr. — —
r493-78 52 tr. 33 6 4 5 — tr. — —
r493-79 50 13 29 4 3 1 — tr. — —
r493-86 50 6 34 5 1·5 2 — 0·5 — —
r493-90 15 65 11 5 1 — — 4 — —
r493-92 49 5 33 8 tr. 5 — tr. — —
r493-93 33 7 39 tr. tr. 11 19 2 — —
r493-99 56 8 25 3 4 2 — 2 — —
r493-100 51 tr. 44 3 — — — 2 — —
9235-239∗† 64 tr. tr. 4 — 9 — tr. 12 11
9235-331∗† 5tot 3–4 43 — 17 1 6 23 tr.
9235-57A∗† 30 19 17 2 — 25 — 2 — 5
9235-56† 10 20 28 14 — 28 — — — —
9235-X† 5tot 63 4 8 — — 18 — —
9235-Y† 21tot 31 24 6 15 — tr. — —
Retrogressed clinohumite marbles
Sample Cal Dol Chu Fo Spl Chl Tr Phl Op
9235-185 50 16 10 19 3 2 tr. — —
9235-265 37 8 24 8 tr. — — 20 3
9235-291 54 5 15 23 3 tr. tr. — —
9235-338 51 11 16 16 3 1 2 — tr.
r493-54 48 9 18 18 2 4 2 — tr.
r493-56 46 17 14 17 2 4 tr. — tr.
r493-57 48 8 8 27 0·5 7 1·5 — tr.
tot, slide not stained for dolomite and calcite; therefore all carbonate given as calcite; tr., present in trace amounts (<1%).∗Non-equilibriumassemblage—mineralogyonlypartially reset fromgranulite-faciespeak [data fromBuick&Cartwright (1996)].†Carbonate-poor layers in retrogressed forsterite marbles.
differences in modal mineralogy between these marbles marbles were buffered along these reactions, whichformed only modest amounts of forsterite and spinel andand their unretrogressed equivalents arecommonly preserved some reactant anorthite or diopside
Dol+Di=4Cal+2Fo+2CO2 (1) (Buick & Cartwright, 1996). During retrogression, re-actions (1) and/or (2) were probably crossed at lowerandtemperatures than the M 2 peak owing to the infiltration5Dol+An=6Cal+2Fo+Spl+4CO2 (2)of fluid (arrowed path in Fig. 3a), which consumedanorthite or diopside and most of the dolomite to form(Fig. 3a). Along the prograde M 2 P–T path, the forsteritic
883
JOURNAL OF PETROLOGY VOLUME 38 NUMBER 7 JULY 1997
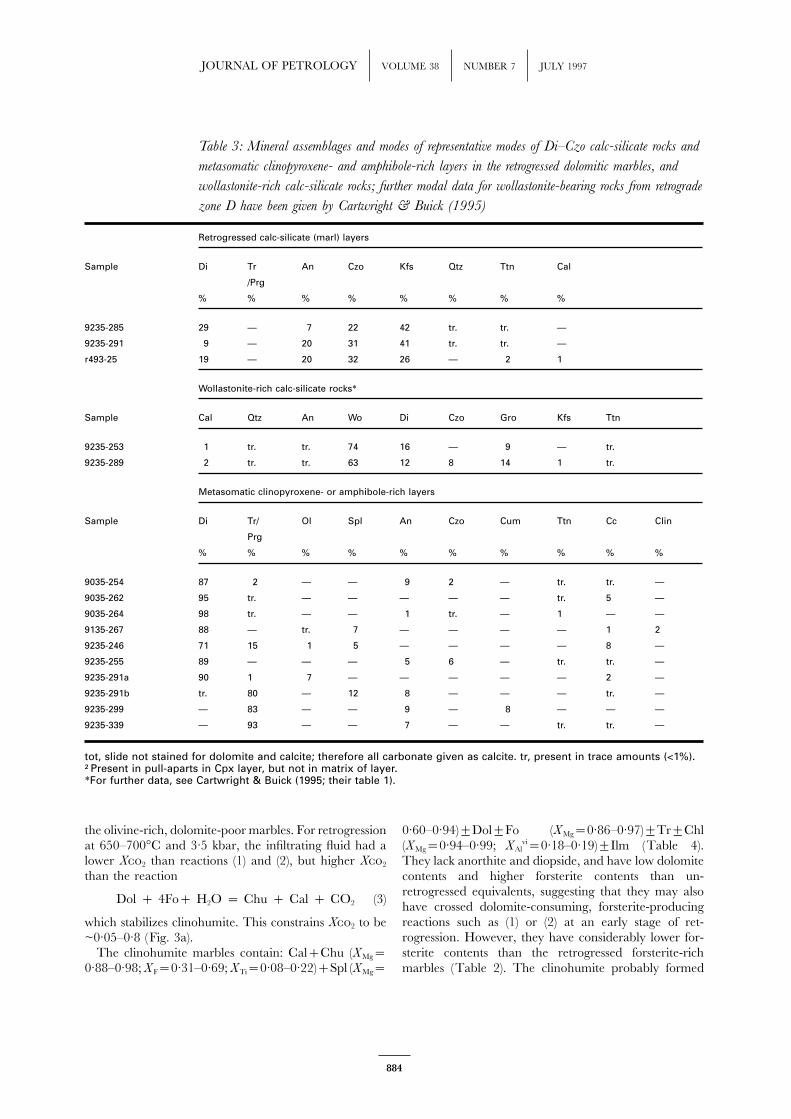
Table 3: Mineral assemblages and modes of representative modes of Di–Czo calc-silicate rocks and
metasomatic clinopyroxene- and amphibole-rich layers in the retrogressed dolomitic marbles, and
wollastonite-rich calc-silicate rocks; further modal data for wollastonite-bearing rocks from retrograde
zone D have been given by Cartwright & Buick (1995)
Retrogressed calc-silicate (marl) layers
Sample Di Tr An Czo Kfs Qtz Ttn Cal
/Prg
% % % % % % % %
9235-285 29 — 7 22 42 tr. tr. —
9235-291 9 — 20 31 41 tr. tr. —
r493-25 19 — 20 32 26 — 2 1
Wollastonite-rich calc-silicate rocks∗
Sample Cal Qtz An Wo Di Czo Gro Kfs Ttn
9235-253 1 tr. tr. 74 16 — 9 — tr.
9235-289 2 tr. tr. 63 12 8 14 1 tr.
Metasomatic clinopyroxene- or amphibole-rich layers
Sample Di Tr/ Ol Spl An Czo Cum Ttn Cc Clin
Prg
% % % % % % % % % %
9035-254 87 2 — — 9 2 — tr. tr. —
9035-262 95 tr. — — — — — tr. 5 —
9035-264 98 tr. — — 1 tr. — 1 — —
9135-267 88 — tr. 7 — — — — 1 2†
9235-246 71 15 1 5 — — — — 8 —
9235-255 89 — — — 5 6 — tr. tr. —
9235-291a 90 1 7 — — — — — 2 —
9235-291b tr. 80 — 12 8 — — — tr. —
9235-299 — 83 — — 9 — 8 — — —
9235-339 — 93 — — 7 — — tr. tr. —
tot, slide not stained for dolomite and calcite; therefore all carbonate given as calcite. tr, present in trace amounts (<1%).†Present in pull-aparts in Cpx layer, but not in matrix of layer.∗For further data, see Cartwright & Buick (1995; their table 1).
the olivine-rich, dolomite-poor marbles. For retrogression 0·60–0·94)±Dol±Fo (X Mg=0·86–0·97)±Tr±Chlat 650–700°C and 3·5 kbar, the infiltrating fluid had a (X Mg=0·94–0·99; X Al
vi=0·18–0·19)±Ilm (Table 4).lower X2 than reactions (1) and (2), but higher X2 They lack anorthite and diopside, and have low dolomitethan the reaction contents and higher forsterite contents than un-
retrogressed equivalents, suggesting that they may alsoDol + 4Fo+ H2O = Chu + Cal + CO2 (3) have crossed dolomite-consuming, forsterite-producing
reactions such as (1) or (2) at an early stage of ret-which stabilizes clinohumite. This constrains X2 to berogression. However, they have considerably lower for-~0·05–0·8 (Fig. 3a).sterite contents than the retrogressed forsterite-richThe clinohumite marbles contain: Cal+Chu (X Mg=
0·88–0·98; X F=0·31–0·69; X Ti=0·08–0·22)+Spl (X Mg= marbles (Table 2). The clinohumite probably formed
884
BUICK et al. HIGH-TEMPERATURE RETROGRESSION OF GRANULITE-FACIES MARBLES
Fig. 3. (a) A T–X CO2phase diagram P f=P2+P2=3·5 kbar for mineral equilibria relevant to retrogression of dolomite-rich marbles. The
thick lines represent possible fluid infiltration paths (see text). For the purposes of clarity not all reactions (numbers refer to text) have beenlabelled. (b) A T–X2 phase diagram at P f=P2+P2=3·5 kbar for mineral equilibria relevant to retrogression of the calcite-rich marblesand marls. The open circle indicates the position of the isobarically invariant point A, displaced for the real composition of minerals in sample
9235-362 of Cartwright & Buick (1995; retrograde zone D).
through an additional dolomite- and forsterite-consuming being intersected. Textural evidence suggests that re-reaction such as reaction (3), which occurs only at very action (5) was encountered subsequent to reaction (4),low X2 (Fig. 3a). Using measured mineral compositions, and that the reaction took place in spaced fractures alongreaction (3) occurs at X2~0·08–0·11 under the es- which late fluids had infiltrated (Fig. 4b). As reaction (5)timated P–T conditions for retrogression (Table 5). is only stable in the model system at temperatures less
The development of mineral assemblages as a result than ~600°C (Fig. 3a), it is likely that these veins reflectof reaction (1) or (2), followed by reaction (3), is the additional, minor, fluid infiltration by water-rich fluidssequence expected if dolomitic marbles that initially during cooling (X2<0·2; Fig. 3a).equilibrated at moderate to high X2 were infiltrated The forsterite marbles have d18O(Carb) and d13C(Carb)isothermally at elevated temperatures by fluids with an values in the range 10·5–23·2‰ and –3·9 to 2·5‰,X2 lower than that of reaction (3) (Fig. 3a). respectively (Tables 6–9). Clinohumite marbles have
A number of reaction textures involving the growth of a similar range of d18O(Carb) and d13C (Carb) valuesaluminous chlorite and Ca-amphibole (mainly tremolite) (9·8–17·5‰ and –4·0 to –0·6‰, respectively). The av-are superimposed on the coarse-grained, texturally equi- erage d18O(Carb) and d13C (Carb) values of both typeslibrated mineralogy of the retrogressed dolomitic rocks. of retrogressed marble are ~3‰ and ~2‰, respectively,The local partial replacement of forsterite and spinel by lower than those of unretrogressed granulite-facies mar-chlorite and dolomite (Fig. 4a) probably occurred by the bles in the Upper Calcsilicate Unit (Fig. 5a and b).reaction The retrogressed marbles have generally lower car-
bonate contents and d13C(Carb) values than their un-Spl+3Fo+2Cal+2CO2+4H2O=2Dol+Clin (4), retrogressed equivalents (Tables 1 and 2; Fig. 5a), and
although there is considerable scatter, the d13C (Carb)which has a thermal maximum of ~660°C (Fig. 3a).values of retrogressed marbles tend to decrease withBecause the progress of reaction (4) appears to post-datedecreasing carbonate contents. The progress of de-the progress of reactions (1) and/or (2), 660°C is probablycarbonation reactions such as reactions (1), (2) and (3)a minimum estimate for the temperature of initialshould systematically lower both d13C(Carb) values andretrogression (Fig. 3a). Al-poor tremolite occurs in fine-wt % total carbonate contents (Valley, 1986). Also showngrained pseudomorphs after forsterite that are rimmedin Fig. 5a are calculated trends produced during batchby dolomite (Fig. 4b). This texture is consistent with theand Rayleigh devolatilization for initial d13C(Carb) valuesreactionand wt % carbonate contents that encompass the originalheterogeneity of the unretrogressed dolomitic marbles.8Fo+13Cal+9CO2+H2O=Tr+11Dol (5)
885
JOURNAL OF PETROLOGY VOLUME 38 NUMBER 7 JULY 1997
Tab
le4:
Rep
rese
ntat
ive
elec
tron
mic
ropr
obe
anal
yses
ofm
iner
als
from
retrog
ress
edfo
rste
rite
mar
ble,
clin
ohum
ite
mar
ble,
mas
sive
clin
opyr
oxen
ero
ck,
mas
sive
trem
olite
rock
and
diop
side
–cl
inoz
oisi
teca
lc-s
ilic
ate
rock
s
Ca-
amp
hib
ole
sFo
rste
rite
Clin
oh
um
ite
Ch
lori
teC
lino
pyr
oxe
ne
Sp
inel
Clin
ozo
isit
e
Sam
ple
:r4
93-5
3r4
93-5
6r4
93-8
692
35-1
86r4
93-5
6r4
93-5
3r4
93-5
492
35-
r493
-56
r493
-56
r493
-53
9135
-267
9234
-r4
93-9
2r4
93-9
3r4
93-2
5r4
93-5
4r4
93-5
3r4
93-8
692
35-2
89r4
93-2
5
291a
291a
An
alys
is:
r3-a
n44
r2-a
n16
r2-a
n13
r1-a
n7
an1
r1-a
n1
an14
an22
an4
r3-a
n24
r1-a
n12
r1-a
n28
an13
an4
r1-a
n8
r1-a
n4
r1-a
n1
an11
r3-a
n23
Co
mm
ent:
Hig
h-A
lH
igh
-Al
Low
-Al
Prg
Vein
Met
.M
et.
Met
.
Mar
ble
typ
e:Fo
Ch
uFo
FoC
hu
FoC
hu
Ch
uC
hu
Ch
uFo
FoC
hu
FoFo
Mar
lC
hu
FoFo
Wo
Mar
l
SiO
251
·43
50·8
158
·04
41·1
241
·86
41·4
337
·38
36·7
537
·81
31·0
830
·79
28·9
353
·54
52·8
555
·93
54·2
80·
000·
000·
0039
·26
38·8
3
TiO
22·
030·
700·
001·
810·
030·
012·
740·
191·
8631
·08
30·7
90·
000·
140·
130·
040·
000·
000·
000·
000·
000·
00
Al 2
O3
7·57
8·53
0·19
15·5
90·
000·
000·
570·
110·
0320
·48
20·9
821
·05
0·98
1·52
0·30
0·15
69·4
468
·77
63·8
432
·12
29·2
8
Mg
O21
·52
21·4
022
·78
17·2
554
·92
54·3
653
·04
49·0
654
·54
35·4
333
·74
31·1
516
·38
16·1
417
·15
15·7
427
·11
25·4
318
·99
0·00
0·00
CaO
13·9
813
·91
14·8
813
·68
0·02
0·02
0·03
0·03
0·02
0·07
0·06
0·05
25·2
525
·35
25·5
625
·53
0·00
0·00
0·00
25·1
523
·70
Mn
O0·
150·
130·
120·
150·
350·
561·
040·
920·
270·
020·
050·
050·
420·
250·
300·
090·
140·
340·
420·
000·
00
FeO
1·56
1·19
2·15
4·15
3·01
4·04
2·77
10·5
32·
430·
971·
333·
902·
533·
131·
945·
113·
185·
0216
·01
1·24
4·96
Zn
O0·
000·
010·
000·
000·
000·
000·
000·
060·
000·
000·
000·
000·
000·
000·
000·
000·
160·
330·
000·
000·
00
Na 2
O0·
020·
310·
031·
120·
000·
000·
000·
000·
000·
000·
000·
000·
030·
000·
000·
000·
000·
000·
000·
000·
00
K2O
0·01
0·13
0·04
1·50
0·00
0·00
0·00
0·00
0·00
0·01
0·02
0·02
0·00
0·00
0·00
0·01
0·00
0·00
0·00
0·00
0·00
F0·
320·
810·
190·
930·
000·
001·
482·
722·
910·
360·
050·
200·
000·
000·
000·
000·
000·
000·
000·
000·
00
Cl
0·00
0·01
0·02
0·03
0·00
0·00
0·00
0·00
0·00
0·00
0·05
0·02
0·00
0·00
0·00
0·00
0·00
0·00
0·00
0·00
0·00
Tota
l98
·76
97·9
498
·44
97·3
40·
000·
0099
·06
100·
3999
·88
88·5
187
·15
85·4
399
·27
99·3
710
1·22
101·
2810
0·03
99·8
999
·26
97·7
796
·77
O=
F−
0·13
−0·
34−
0·08
−0·
390·
000·
00−
0·62
−1·
14−
1·20
−0·
15−
0·02
−0·
090·
000·
000·
000·
000·
000·
000·
000·
000·
00
O=
Cl
−0·
000·
000·
00−
0·00
0·00
0·00
0·00
0·00
0·00
0·00
−0·
01−
0·00
0·00
0·00
0·00
0·00
0·00
0·00
0·00
0·00
0·00
Tota
l98
·63
97·6
098
·36
96·9
410
0·19
100·
4398
·44
99·2
498
·68
88·3
687
·12
85·3
499
·27
99·3
710
1·22
101·
2810
0·03
99·8
999
·26
97·7
796
·67
Cat
ions
(23
Ox)
(4O
x)(1
3C
ats)
(28
Ox)
(6O
x)(4
Ox)
(12·
5O
x)
Si
6·99
6·93
7·90
5·85
0·99
0·99
3·97
3·99
4·00
5·72
5·74
5·59
1·97
1·94
2·01
1·98
0·00
0·00
0·00
3·00
3·01
Ti0·
210·
070·
000·
190·
000·
000·
220·
020·
150·
000·
000·
000·
000·
000·
000·
000·
000·
000·
000·
000·
00
Al
1·21
1·37
0·03
2·62
0·00
0·00
0·07
0·01
0·00
4·44
4·61
4·79
0·04
0·07
0·01
0·00
1·96
1·97
1·92
2·89
2·68
Mg
4·36
4·35
4·63
3·66
1·94
1·93
8·40
7·94
8·61
9·72
9·37
8·97
0·90
0·88
0·92
0·86
0·97
0·92
0·72
0·00
0·00
Fe2+
0·18
0·14
0·25
0·49
0·00
0·00
0·25
0·96
0·22
0·15
0·21
0·63
0·06
0·06
0·06
0·16
0·03
0·07
0·27
0·00
0·00
Fe3+
0·00
0·00
0·00
0·00
0·00
0·00
0·00
0·00
0·00
0·00
0·00
0·00
0·02
0·04
0·00
0·00
0·04
0·03
0·08
0·08
0·33
Ca
2·04
2·03
2·17
2·09
0·00
0·01
0·00
0·00
0·00
0·01
0·01
0·01
0·99
1·00
0·98
1·00
0·00
0·00
0·00
2·01
1·97
Mn
0·02
0·02
0·01
0·02
0·06
0·08
0·09
0·08
0·02
0·00
0·00
0·00
0·01
0·00
0·01
0·00
0·00
0·00
0·00
0·00
0·00
Na
0·00
0·08
0·00
0·31
0·00
0·00
0·00
0·00
0·00
0·00
0·00
0·00
0·00
0·00
0·00
0·00
0·00
0·00
0·00
0·00
0·00
K0·
000·
020·
000·
270·
000·
000·
000·
000·
000·
000·
000·
000·
000·
000·
000·
000·
000·
000·
000·
000·
00
Zn
0·00
0·00
0·00
0·00
0·00
0·00
0·00
0·00
0·00
0·00
0·00
0·00
0·00
0·00
0·00
0·00
0·00
0·01
0·00
0·00
0·00
Tota
l15
·06
15·0
115
·00
15·5
13·
013·
0113
·00
13·0
013
·00
20·0
619
·96
20·0
24·
004·
003·
994·
003·
003·
003·
008·
027·
99
XF
0·07
0·17
0·04
0·21
0·31
0·47
0·43
0·01
0·00
0·12
XC
l0·
000·
000·
000·
000·
000·
000·
000·
000·
000·
00
XO
H(d
iff)
0·93
0·82
0·96
0·79
0·69
0·53
0·58
0·99
1·00
0·88
XM
g0·
960·
970·
950·
880·
970·
960·
960·
880·
970·
980·
980·
930·
940·
940·
930·
840·
970·
930·
73
Cat
ion
sfo
ram
ph
ibo
lean
dch
lori
tear
eca
lcu
late
do
nan
anh
ydro
us
bas
isfo
r23
and
28o
xyg
ens
per
form
ula
un
it,
resp
ecti
vely
,an
dth
ecl
ino
hu
mit
ean
alys
esw
ere
no
rmal
ized
to13
cati
on
s.Fu
rth
erel
ectr
on
mic
rop
rob
ed
ata
are
avai
lab
lefr
om
the
firs
tau
tho
ru
po
nre
qu
est.
Fo,
fors
teri
tem
arb
le;
Ch
u,
clin
oh
um
ite
mar
ble
;M
et.,
met
aso
mat
icd
iop
sid
ela
yer;
Vein
,in
calc
ite
vein
cutt
ing
met
aso
mat
icd
iop
sid
ela
yer.
886
BUICK et al. HIGH-TEMPERATURE RETROGRESSION OF GRANULITE-FACIES MARBLES
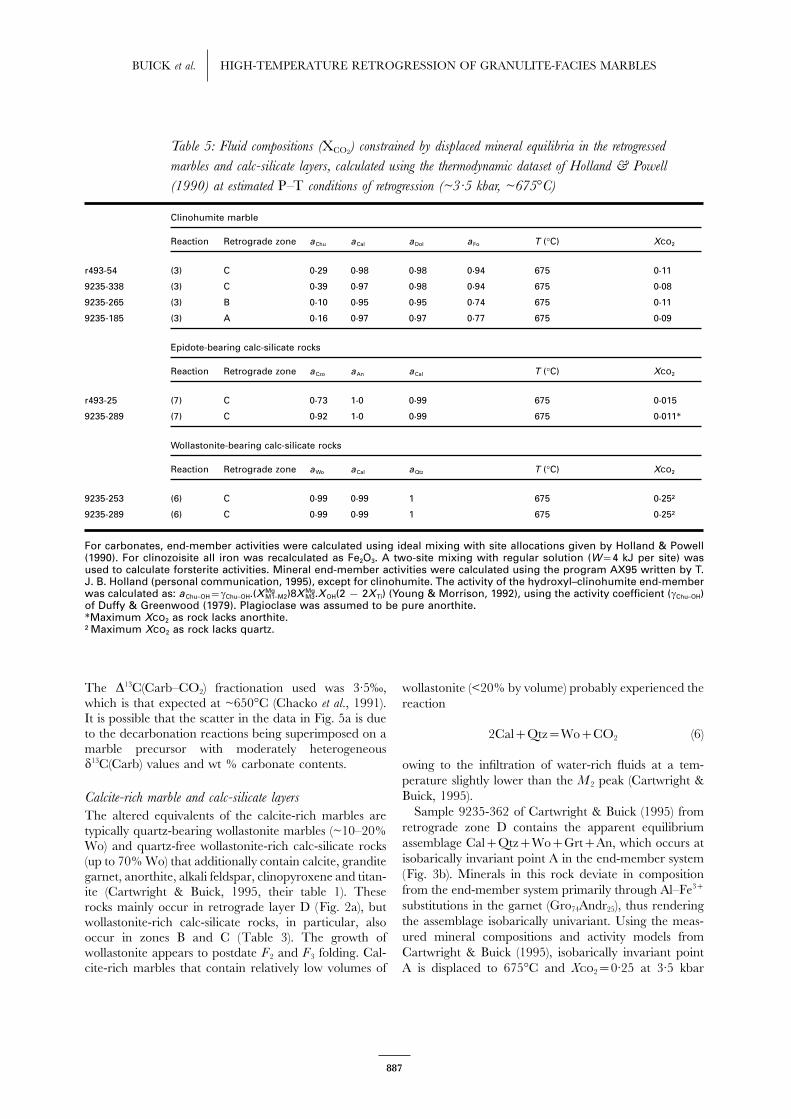
Table 5: Fluid compositions (XCO2) constrained by displaced mineral equilibria in the retrogressed
marbles and calc-silicate layers, calculated using the thermodynamic dataset of Holland & Powell
(1990) at estimated P–T conditions of retrogression (~3·5 kbar, ~675°C)
Clinohumite marble
Reaction Retrograde zone aChu aCal aDol aFo T (°C) Xco2
r493-54 (3) C 0·29 0·98 0·98 0·94 675 0·11
9235-338 (3) C 0·39 0·97 0·98 0·94 675 0·08
9235-265 (3) B 0·10 0·95 0·95 0·74 675 0·11
9235-185 (3) A 0·16 0·97 0·97 0·77 675 0·09
Epidote-bearing calc-silicate rocks
Reaction Retrograde zone aCzo aAn aCal T (°C) Xco2
r493-25 (7) C 0·73 1·0 0·99 675 0·015
9235-289 (7) C 0·92 1·0 0·99 675 0·011∗
Wollastonite-bearing calc-silicate rocks
Reaction Retrograde zone aWo aCal aQtz T (°C) Xco2
9235-253 (6) C 0·99 0·99 1 675 0·25†
9235-289 (6) C 0·99 0·99 1 675 0·25†
For carbonates, end-member activities were calculated using ideal mixing with site allocations given by Holland & Powell(1990). For clinozoisite all iron was recalculated as Fe2O3. A two-site mixing with regular solution (W=4 kJ per site) wasused to calculate forsterite activities. Mineral end-member activities were calculated using the program AX95 written by T.J. B. Holland (personal communication, 1995), except for clinohumite. The activity of the hydroxyl–clinohumite end-memberwas calculated as: aChu–OH=cChu–OH.(X Mg
M1–M2)8X MgM3.XOH(2− 2XTi) (Young & Morrison, 1992), using the activity coefficient (cChu–OH)
of Duffy & Greenwood (1979). Plagioclase was assumed to be pure anorthite.∗Maximum Xco2 as rock lacks anorthite.†Maximum Xco2 as rock lacks quartz.
The D13C(Carb–CO2) fractionation used was 3·5‰, wollastonite (<20% by volume) probably experienced thewhich is that expected at ~650°C (Chacko et al., 1991). reactionIt is possible that the scatter in the data in Fig. 5a is dueto the decarbonation reactions being superimposed on a 2Cal+Qtz=Wo+CO2 (6)marble precursor with moderately heterogeneousd13C(Carb) values and wt % carbonate contents. owing to the infiltration of water-rich fluids at a tem-
perature slightly lower than the M 2 peak (Cartwright &Buick, 1995).Calcite-rich marble and calc-silicate layers
Sample 9235-362 of Cartwright & Buick (1995) fromThe altered equivalents of the calcite-rich marbles areretrograde zone D contains the apparent equilibriumtypically quartz-bearing wollastonite marbles (~10–20%assemblage Cal+Qtz+Wo+Grt+An, which occurs atWo) and quartz-free wollastonite-rich calc-silicate rocksisobarically invariant point A in the end-member system(up to 70% Wo) that additionally contain calcite, grandite(Fig. 3b). Minerals in this rock deviate in compositiongarnet, anorthite, alkali feldspar, clinopyroxene and titan-from the end-member system primarily through Al–Fe3+ite (Cartwright & Buick, 1995, their table 1). Thesesubstitutions in the garnet (Gro74Andr25), thus renderingrocks mainly occur in retrograde layer D (Fig. 2a), butthe assemblage isobarically univariant. Using the meas-wollastonite-rich calc-silicate rocks, in particular, alsoured mineral compositions and activity models fromoccur in zones B and C (Table 3). The growth ofCartwright & Buick (1995), isobarically invariant pointwollastonite appears to postdate F 2 and F 3 folding. Cal-
cite-rich marbles that contain relatively low volumes of A is displaced to 675°C and X2=0·25 at 3·5 kbar
887
JOURNAL OF PETROLOGY VOLUME 38 NUMBER 7 JULY 1997
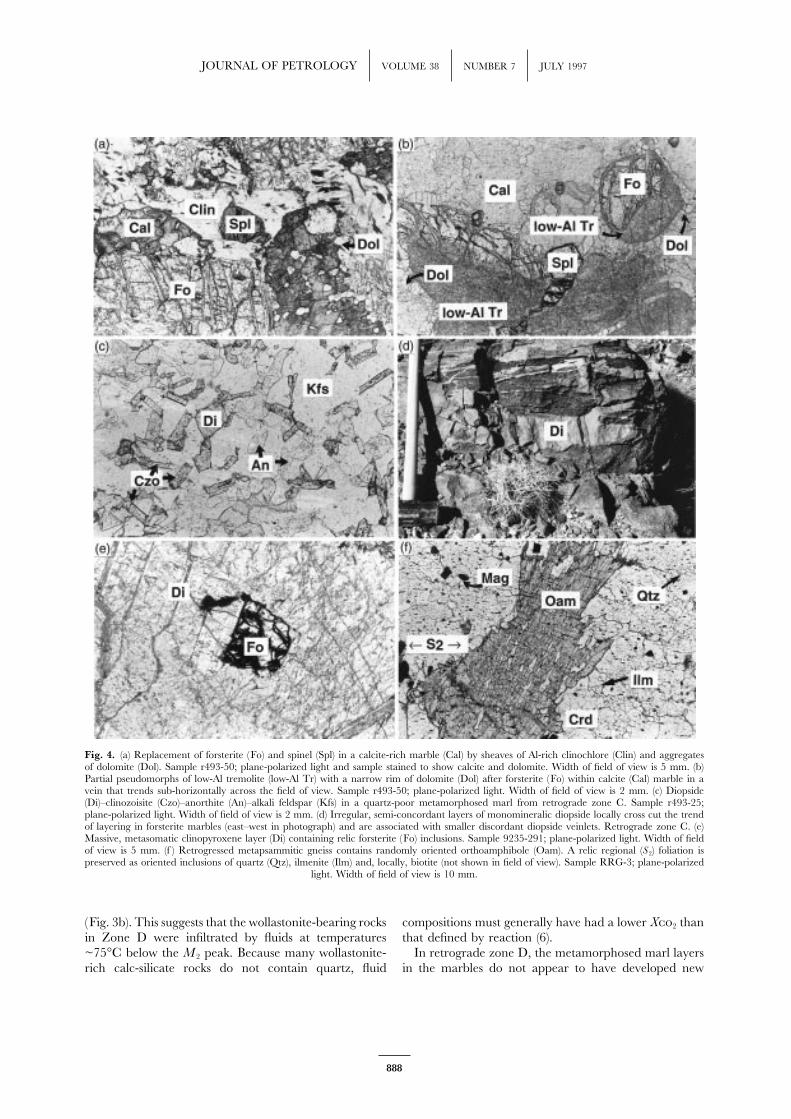
Fig. 4. (a) Replacement of forsterite (Fo) and spinel (Spl) in a calcite-rich marble (Cal) by sheaves of Al-rich clinochlore (Clin) and aggregatesof dolomite (Dol). Sample r493-50; plane-polarized light and sample stained to show calcite and dolomite. Width of field of view is 5 mm. (b)Partial pseudomorphs of low-Al tremolite (low-Al Tr) with a narrow rim of dolomite (Dol) after forsterite (Fo) within calcite (Cal) marble in avein that trends sub-horizontally across the field of view. Sample r493-50; plane-polarized light. Width of field of view is 2 mm. (c) Diopside(Di)–clinozoisite (Czo)–anorthite (An)–alkali feldspar (Kfs) in a quartz-poor metamorphosed marl from retrograde zone C. Sample r493-25;plane-polarized light. Width of field of view is 2 mm. (d) Irregular, semi-concordant layers of monomineralic diopside locally cross cut the trendof layering in forsterite marbles (east–west in photograph) and are associated with smaller discordant diopside veinlets. Retrograde zone C. (e)Massive, metasomatic clinopyroxene layer (Di) containing relic forsterite (Fo) inclusions. Sample 9235-291; plane-polarized light. Width of fieldof view is 5 mm. (f ) Retrogressed metapsammitic gneiss contains randomly oriented orthoamphibole (Oam). A relic regional (S 2) foliation ispreserved as oriented inclusions of quartz (Qtz), ilmenite (Ilm) and, locally, biotite (not shown in field of view). Sample RRG-3; plane-polarized
light. Width of field of view is 10 mm.
(Fig. 3b). This suggests that the wollastonite-bearing rocks compositions must generally have had a lower X2 thanthat defined by reaction (6).in Zone D were infiltrated by fluids at temperatures
~75°C below the M 2 peak. Because many wollastonite- In retrograde zone D, the metamorphosed marl layersin the marbles do not appear to have developed newrich calc-silicate rocks do not contain quartz, fluid
888
BUICK et al. HIGH-TEMPERATURE RETROGRESSION OF GRANULITE-FACIES MARBLES
Tab
le6:
Sta
ble
isot
ope
geoc
hem
istr
yof
retrog
ress
eddo
lom
itic
mar
bles
from
retrog
rade
zone
sA
and
B
Sam
ple
Zo
ne
Wt.
%d13
Cd18
Od18
Od18
Od18
OD
18O
D18
OR
ock
typ
e
(A/B
)C
arb
.(C
arb
)(C
arb
)(D
i)(P
hl)
(Am
ph
)(C
al–D
i)(C
al–A
mp
h)
9235
-183
A76
−2·
113
·9C
lino
zois
ite-
and
dio
psi
de-
bea
rin
gca
lcit
em
arb
le92
35-1
84A
9·8
Mas
sive
met
aso
mat
icd
iop
sid
ela
yer
9235
-185
aA
37−
2·3
14·1
Clin
oh
um
ite
mar
ble
9235
-185
bA
77−
2·0
14·4
Clin
oh
um
ite
mar
ble
9235
-185
cA
59−
1·7
15·0
Clin
oh
um
ite
mar
ble
9235
-185
dA
61−
1·8
14·7
Clin
oh
um
ite
mar
ble
9235
-185
eA
55−
2·6
14·7
Clin
oh
um
ite
mar
ble
9235
-185
fA
49−
3·4
13·5
Clin
oh
um
ite
mar
ble
9235
-185
gA
07−
4·0
14·1
Sp
inel
-ric
hla
yer
incl
ino
hu
mit
em
arb
le92
35-1
93A
42−
2·2
13·5
Fors
teri
tem
arb
le90
35-2
54B
11·5
Mas
sive
met
aso
mat
icd
iop
sid
ela
yer
9135
-211
B45
−2·
014
·59·
55·
0Fo
rste
rite
mar
ble
;D
ifr
om
met
aso
mat
icin
terl
ayer
9135
-212
B48
−2·
912
·6Fo
rste
rite
mar
ble
9135
-217
B58
−2·
214
·2Fo
rste
rite
mar
ble
9135
-230
aB
68−
2·2
14·0
Fors
teri
tem
arb
le91
35-2
65B
89−
0·6
16·0
10·1
Clin
oh
um
ite
mar
ble
;P
hl
fro
ma
spin
el-r
ich
inte
rlay
er91
35-2
68B
52−
1·7
14·0
Fors
teri
tem
arb
le92
35-5
7aB
21−
1·3
14·8
11·1
3·7
Sp
inel
-ric
hla
yer
info
rste
rite
mar
ble
9235
-210
B68
−1·
013
·4Fo
rste
rite
mar
ble
9235
-227
B51
−2·
612
·5Fo
rste
rite
mar
ble
9235
-227
csB
08−
2·1
13·3
Am
ph
ibo
le-r
ich
laye
rin
mar
ble
9235
-229
B88
−1·
814
·6Fo
rste
rite
mar
ble
9235
-XB
05−
0·9
14·0
Sp
inel
-ric
hla
yer
info
rste
rite
mar
ble
r493
-175
B6·
6M
etas
om
atic
trem
olit
ela
yer
r493
-175
B43
−2·
413
·3C
lino
hu
mit
em
arb
ler4
93-1
76B
10·9
10·8
Inte
rgro
wn
met
aso
mat
icd
iop
sid
ean
dtr
emo
lite
laye
rr4
93-1
77B
32−
1·4
15·0
10·8
4·2
Clin
oh
um
ite
mar
ble
r493
-178
B45
−1·
617
·5C
lino
hu
mit
em
arb
ler4
95-5
6B
−2·
514
·310
·34·
0Fo
rste
rite
mar
ble
r495
-71
B75
−1·
913
·7Fo
rste
rite
mar
ble
r495
-72
B46
−1·
714
·0Fo
rste
rite
mar
ble
r495
-74
B50
−3·
612
·1Fo
rste
rite
mar
ble
r495
-RA
B−
2·2
14·4
11·8
2·6
Fors
teri
tem
arb
le91
35-2
27†
B13
0·2
12·9
Wo
llast
on
ite-
rich
calc
-sili
cate
rock
9135
-229
†B
48−
0·9
17·4
Wo
llast
on
ite-
rich
calc
-sili
cate
rock
9125
-262
†B
14−
2·1
14·9
Wo
llast
on
ite-
rich
calc
-sili
cate
rock
9135
-264
†B
31−
0·1
16·1
Wo
llast
on
ite-
rich
calc
-sili
cate
rock
†Dat
afr
om
Car
twri
gh
t&
Bu
ick
(199
5).
889
JOURNAL OF PETROLOGY VOLUME 38 NUMBER 7 JULY 1997
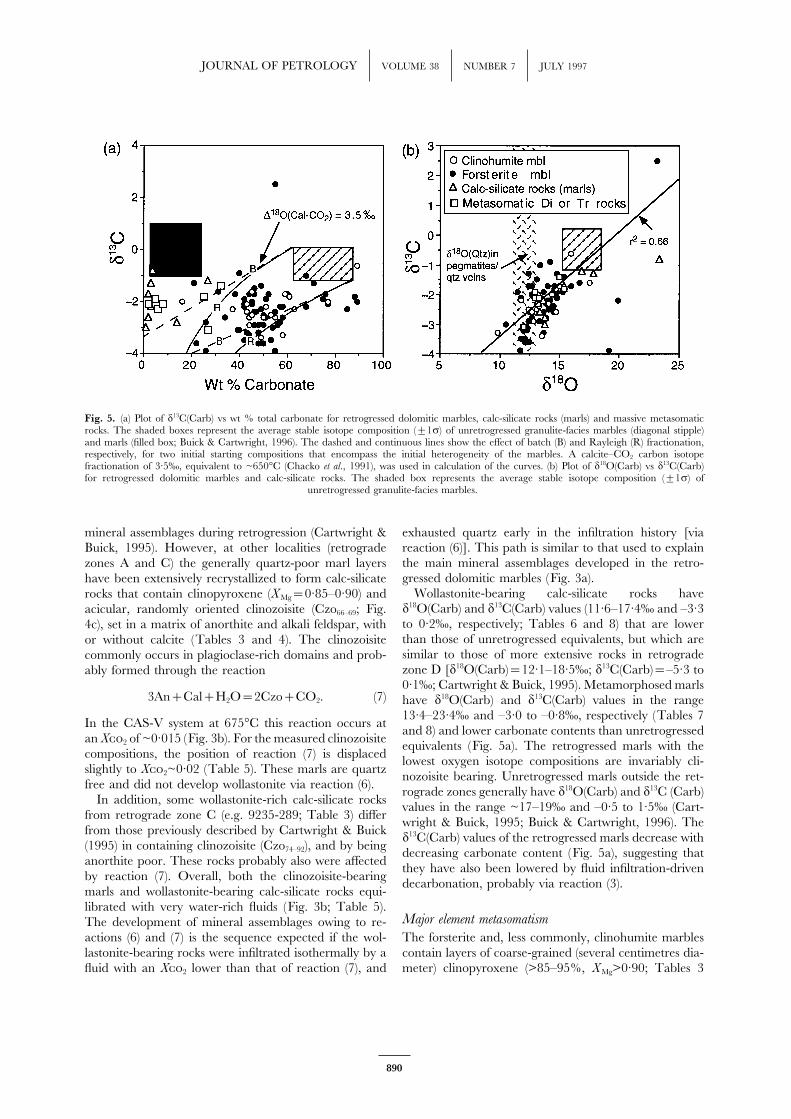
Fig. 5. (a) Plot of d13C(Carb) vs wt % total carbonate for retrogressed dolomitic marbles, calc-silicate rocks (marls) and massive metasomaticrocks. The shaded boxes represent the average stable isotope composition (±1r) of unretrogressed granulite-facies marbles (diagonal stipple)and marls (filled box; Buick & Cartwright, 1996). The dashed and continuous lines show the effect of batch (B) and Rayleigh (R) fractionation,respectively, for two initial starting compositions that encompass the initial heterogeneity of the marbles. A calcite–CO2 carbon isotopefractionation of 3·5‰, equivalent to ~650°C (Chacko et al., 1991), was used in calculation of the curves. (b) Plot of d18O(Carb) vs d13C(Carb)for retrogressed dolomitic marbles and calc-silicate rocks. The shaded box represents the average stable isotope composition (±1r) of
unretrogressed granulite-facies marbles.
mineral assemblages during retrogression (Cartwright & exhausted quartz early in the infiltration history [viareaction (6)]. This path is similar to that used to explainBuick, 1995). However, at other localities (retrogradethe main mineral assemblages developed in the retro-zones A and C) the generally quartz-poor marl layersgressed dolomitic marbles (Fig. 3a).have been extensively recrystallized to form calc-silicate
Wollastonite-bearing calc-silicate rocks haverocks that contain clinopyroxene (X Mg=0·85–0·90) andd18O(Carb) and d13C(Carb) values (11·6–17·4‰ and –3·3acicular, randomly oriented clinozoisite (Czo66–69; Fig.to 0·2‰, respectively; Tables 6 and 8) that are lower4c), set in a matrix of anorthite and alkali feldspar, withthan those of unretrogressed equivalents, but which areor without calcite (Tables 3 and 4). The clinozoisitesimilar to those of more extensive rocks in retrogradecommonly occurs in plagioclase-rich domains and prob-zone D [d18O(Carb)=12·1–18·5‰; d13C(Carb)=–5·3 toably formed through the reaction0·1‰; Cartwright & Buick, 1995). Metamorphosed marls
3An+Cal+H2O=2Czo+CO2. (7) have d18O(Carb) and d13C(Carb) values in the range13·4–23·4‰ and –3·0 to –0·8‰, respectively (Tables 7
In the CAS-V system at 675°C this reaction occurs at and 8) and lower carbonate contents than unretrogressedan X2 of ~0·015 (Fig. 3b). For the measured clinozoisite equivalents (Fig. 5a). The retrogressed marls with thecompositions, the position of reaction (7) is displaced lowest oxygen isotope compositions are invariably cli-slightly to X2~0·02 (Table 5). These marls are quartz nozoisite bearing. Unretrogressed marls outside the ret-free and did not develop wollastonite via reaction (6). rograde zones generally have d18O(Carb) and d13C (Carb)
In addition, some wollastonite-rich calc-silicate rocks values in the range ~17–19‰ and –0·5 to 1·5‰ (Cart-from retrograde zone C (e.g. 9235-289; Table 3) differ wright & Buick, 1995; Buick & Cartwright, 1996). Thefrom those previously described by Cartwright & Buick d13C(Carb) values of the retrogressed marls decrease with(1995) in containing clinozoisite (Czo74–92), and by being decreasing carbonate content (Fig. 5a), suggesting thatanorthite poor. These rocks probably also were affected they have also been lowered by fluid infiltration-drivenby reaction (7). Overall, both the clinozoisite-bearing decarbonation, probably via reaction (3).marls and wollastonite-bearing calc-silicate rocks equi-librated with very water-rich fluids (Fig. 3b; Table 5).
Major element metasomatismThe development of mineral assemblages owing to re-actions (6) and (7) is the sequence expected if the wol- The forsterite and, less commonly, clinohumite marbles
contain layers of coarse-grained (several centimetres dia-lastonite-bearing rocks were infiltrated isothermally by afluid with an X2 lower than that of reaction (7), and meter) clinopyroxene (>85–95%, X Mg>0·90; Tables 3
890
BUICK et al. HIGH-TEMPERATURE RETROGRESSION OF GRANULITE-FACIES MARBLES
Tab
le7:
Sta
ble
isot
ope
geoc
hem
istr
yof
retrog
ress
eddo
lom
itic
mar
bles
from
retrog
rade
zone
sC
,tr
aver
seC
-1(F
ig.
2b)
Sam
ple
Dis
tan
ceW
t.%
d13C
d18O
d18O
d18O
d18O
D18
OD
18O
Ro
ckty
pe
(m)
Car
b.
(Car
b)
(Car
b)
(WR
)(D
i)(A
mp
h)
(Cal
–Di)
(Cal
–Am
ph
)
r493
-73
0·0
46−
1·2
13·1
Fors
teri
tem
arb
ler4
93-7
43·
955
2·5
23·2
Fors
teri
tem
arb
ler4
93-7
55·
242
−2·
114
·8Fo
rste
rite
mar
ble
r493
-76
12·0
45−
2·1
11·8
Fors
teri
tem
arb
ler4
93-7
712
·704
−0·
823
·4M
etam
orp
ho
sed
mar
l,n
ocl
ino
zois
ite
r493
-78
16·1
49−
2·3
13·3
Fors
teri
tem
arb
ler4
93-7
919
·155
−2·
414
·5Fo
rste
rite
mar
ble
r493
-80
23·3
51−
1·9
14·8
Fors
teri
tem
arb
ler4
93-8
131
·040
−0·
914
·2Fo
rste
rite
mar
ble
r493
-82
31·6
12·5
Bio
tite
-bea
rin
gm
etap
sam
mit
er4
93-8
334
·812
·8B
ioti
te-b
eari
ng
met
apsa
mm
ite
r493
-84
36·9
49−
1·4
15·4
Fors
teri
tem
arb
ler4
93-8
5a40
·946
−2·
414
·1Fo
rste
rite
mar
ble
r493
-85b
40·9
85−
2·3
13·9
Par
gas
ite–
calc
ite
vein
cutt
ing
mar
ble
r493
-86
48·2
57−
2·2
13·4
Fors
teri
tem
arb
ler4
93-8
758
·357
−2·
211
·8Fo
rste
rite
mar
ble
r493
-88
60·0
42−
1·9
11·5
Fors
teri
tem
arb
ler4
93-8
964
·538
−1·
714
·6Fo
rste
rite
mar
ble
r493
-90
75·0
44−
1·7
16·0
11·5
4·6
Fors
teri
tem
arb
ler4
93-9
176
·114
−2·
813
·8M
etam
orp
ho
sed
mar
l,co
nta
ins
clin
ozo
isit
er4
93-9
2a80
·647
−2·
414
·2Fo
rste
rite
mar
ble
r493
-92b
80·6
34−
2·6
14·5
Fors
teri
tem
arb
lew
ith
dio
psi
de-
rich
laye
rsr4
93-9
381
·325
−1·
815
·412
·511
·52·
93·
9Fo
rste
rite
mar
ble
wit
hd
iop
sid
e-ri
chla
yers
r493
-94
84·2
50−
2·5
14·1
Fors
teri
tem
arb
ler4
93-9
590
·858
−2·
613
·7Fo
rste
rite
mar
ble
r493
-96
96·3
10·3
Ort
ho
amp
hib
olit
e–co
rdie
rite
gn
eiss
r493
-98
106·
331
−1·
616
·7Fo
rste
rite
mar
ble
r493
-99
109·
848
−3·
612
·39·
72·
6Fo
rste
rite
mar
ble
r493
-100
113·
922
−3·
612
·6Fo
rste
rite
mar
ble
r493
-25a
115·
167
−1·
512
·8Q
uar
tz-a
bse
nt
clin
ozo
isit
e-b
eari
ng
mar
ble
r493
-102
126·
710
·2B
ioti
te-b
eari
ng
met
apsa
mm
ite
r493
-103
136·
410
·1B
ioti
te-b
eari
ng
met
apsa
mm
ite
r493
-105
143·
79·
6B
ioti
te-b
eari
ng
met
apsa
mm
ite
r493
-107
143·
99·
6B
ioti
te-b
eari
ng
met
apsa
mm
ite
r493
-108
144·
97·
7O
rth
oam
ph
ibo
lite–
cord
ieri
teg
nei
ssr4
93-1
0614
6·4
8·2
Ort
ho
amp
hib
olit
e–co
rdie
rite
gn
eiss
r493
-109
147·
58·
0O
rth
oam
ph
ibo
lite–
cord
ieri
teg
nei
ssr4
93-1
1616
3·7
58−
3·3
9·8
Clin
oh
um
ite
mar
ble
r493
-116
a16
7·7
54−
3·0
10·5
Fors
teri
tem
arb
ler4
93-1
17o
ther∗
10·7
Mas
sive
met
aso
mat
icd
iop
sid
ela
yer
r493
-179
oth
er∗
16−
2·2
13·2
10·1
3·1
Clin
oh
um
ite
mar
ble
9235
-331
oth
er∗
03−
1·5
12·4
Sp
inel
-ric
hla
yer
inm
arb
le
∗Lo
ose
sam
ple
sn
ot
take
no
nth
etr
aver
selin
e.
891
JOURNAL OF PETROLOGY VOLUME 38 NUMBER 7 JULY 1997
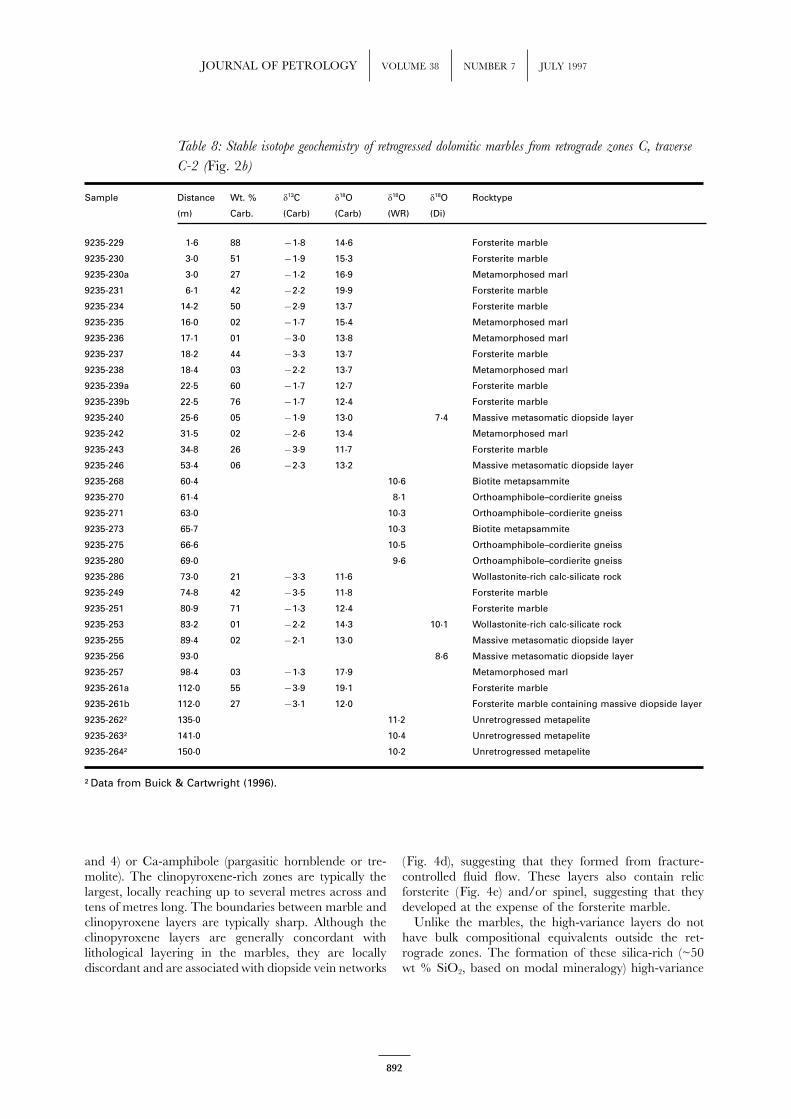
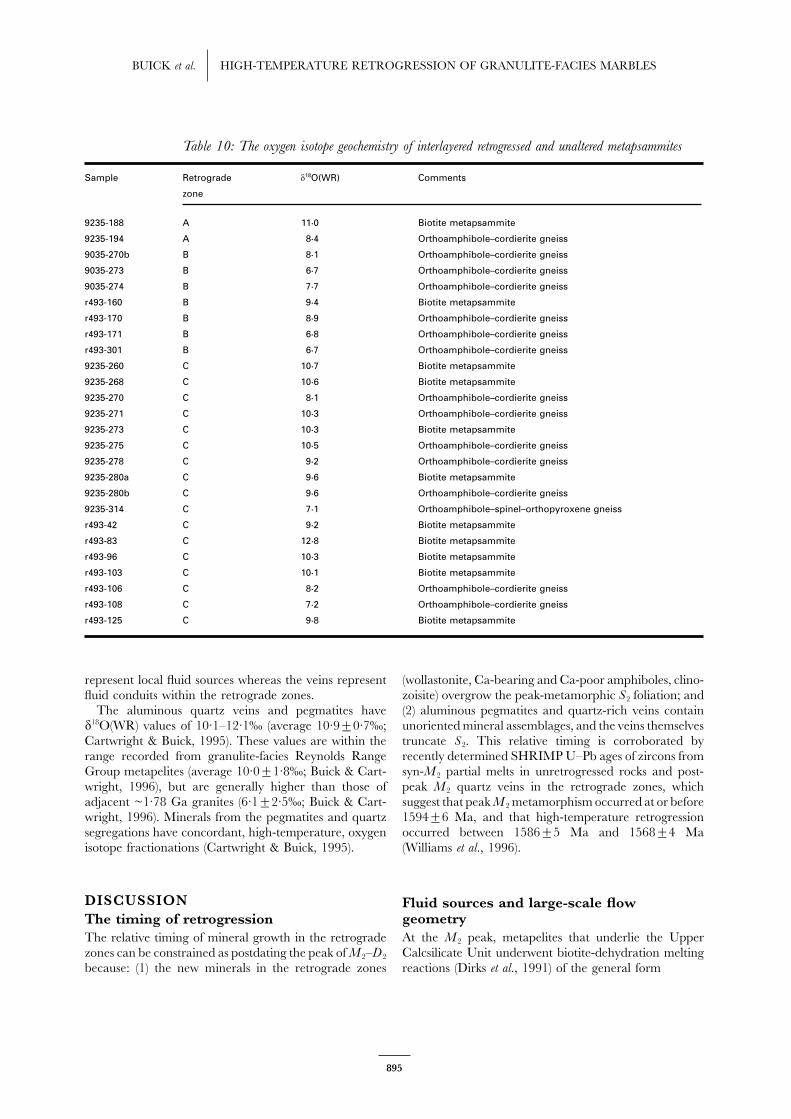
Table 8: Stable isotope geochemistry of retrogressed dolomitic marbles from retrograde zones C, traverse
C-2 (Fig. 2b)
Sample Distance Wt. % d13C d18O d18O d18O Rocktype
(m) Carb. (Carb) (Carb) (WR) (Di)
9235-229 1·6 88 −1·8 14·6 Forsterite marble
9235-230 3·0 51 −1·9 15·3 Forsterite marble
9235-230a 3·0 27 −1·2 16·9 Metamorphosed marl
9235-231 6·1 42 −2·2 19·9 Forsterite marble
9235-234 14·2 50 −2·9 13·7 Forsterite marble
9235-235 16·0 02 −1·7 15·4 Metamorphosed marl
9235-236 17·1 01 −3·0 13·8 Metamorphosed marl
9235-237 18·2 44 −3·3 13·7 Forsterite marble
9235-238 18·4 03 −2·2 13·7 Metamorphosed marl
9235-239a 22·5 60 −1·7 12·7 Forsterite marble
9235-239b 22·5 76 −1·7 12·4 Forsterite marble
9235-240 25·6 05 −1·9 13·0 7·4 Massive metasomatic diopside layer
9235-242 31·5 02 −2·6 13·4 Metamorphosed marl
9235-243 34·8 26 −3·9 11·7 Forsterite marble
9235-246 53·4 06 −2·3 13·2 Massive metasomatic diopside layer
9235-268 60·4 10·6 Biotite metapsammite
9235-270 61·4 8·1 Orthoamphibole–cordierite gneiss
9235-271 63·0 10·3 Orthoamphibole–cordierite gneiss
9235-273 65·7 10·3 Biotite metapsammite
9235-275 66·6 10·5 Orthoamphibole–cordierite gneiss
9235-280 69·0 9·6 Orthoamphibole–cordierite gneiss
9235-286 73·0 21 −3·3 11·6 Wollastonite-rich calc-silicate rock
9235-249 74·8 42 −3·5 11·8 Forsterite marble
9235-251 80·9 71 −1·3 12·4 Forsterite marble
9235-253 83·2 01 −2·2 14·3 10·1 Wollastonite-rich calc-silicate rock
9235-255 89·4 02 −2·1 13·0 Massive metasomatic diopside layer
9235-256 93·0 8·6 Massive metasomatic diopside layer
9235-257 98·4 03 −1·3 17·9 Metamorphosed marl
9235-261a 112·0 55 −3·9 19·1 Forsterite marble
9235-261b 112·0 27 −3·1 12·0 Forsterite marble containing massive diopside layer
9235-262† 135·0 11·2 Unretrogressed metapelite
9235-263† 141·0 10·4 Unretrogressed metapelite
9235-264† 150·0 10·2 Unretrogressed metapelite
†Data from Buick & Cartwright (1996).
and 4) or Ca-amphibole (pargasitic hornblende or tre- (Fig. 4d), suggesting that they formed from fracture-controlled fluid flow. These layers also contain relicmolite). The clinopyroxene-rich zones are typically the
largest, locally reaching up to several metres across and forsterite (Fig. 4e) and/or spinel, suggesting that theydeveloped at the expense of the forsterite marble.tens of metres long. The boundaries between marble and
clinopyroxene layers are typically sharp. Although the Unlike the marbles, the high-variance layers do nothave bulk compositional equivalents outside the ret-clinopyroxene layers are generally concordant with
lithological layering in the marbles, they are locally rograde zones. The formation of these silica-rich (~50wt % SiO2, based on modal mineralogy) high-variancediscordant and are associated with diopside vein networks
892
BUICK et al. HIGH-TEMPERATURE RETROGRESSION OF GRANULITE-FACIES MARBLES
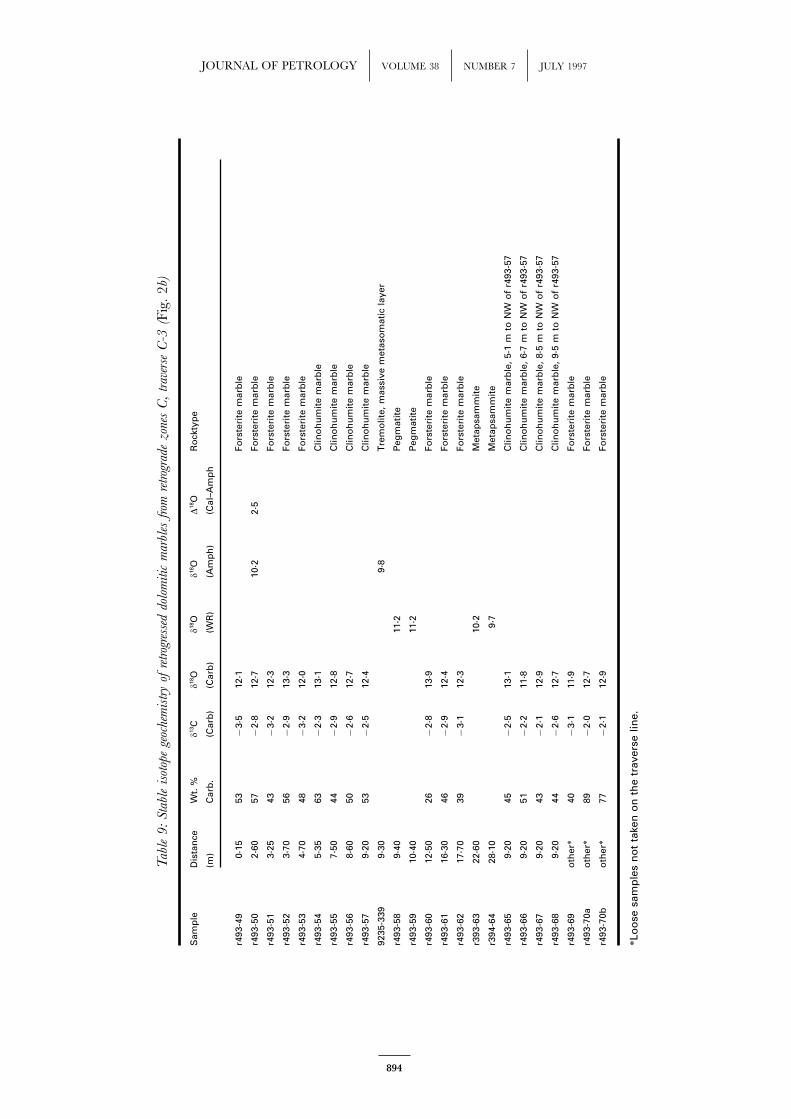
layers from silica-poor dolomitic marbles (typically <10 Bt+Qtz=Oam+Crd+H2O+K2O (11)wt % SiO2) probably involved the introduction of aqueous
as has been invoked in similar rock types in low-pressuresilica in the infiltrating fluid via reactions such asterrains elsewhere (see Arnold & Sandiford, 1990). A
2SiO2(aq)+Dol=Di+2CO2 (8) detailed study of these rocks is beyond the scope of thispaper, and is the subject of a separate contribution (Buick
oret al., in preparation). Similar, although more magnesian,assemblages that formed during high-temperature, late-8SiO2(aq)+5Dol+H2O=3Cal+Tr+7CO2. (9)M 2 fluid-driven metasomatism of metapsammites in the
The metasomatic layers lack quartz because the aqueous basement to the Reynolds Range Group have recentlyfluids infiltrated marbles in which quartz was not stable been described by Vry & Cartwright (1994) and Vry etwith dolomite at the P–T conditions of infiltration. The al. (1996).metasomatic clinopyroxene layers show a relatively small Metapsammitic rocks have d18O(WR) values betweenrange of d18O(Carb) and d13C(Carb) values (12·0–13·2‰ 6·7 and 12·8‰ (average 9·1±1·6‰), with little differenceand –3·1 to –1·9‰, respectively; Tables 6, 7 and 8) that on an outcrop scale between unretrogressed meta-are similar to the most reset stable isotope compositions psammites and those quartz-bearing gneisses that containin the forsterite and clinohumite marbles (Fig. 5a and extensive late orthoamphibole or cummingtonite (Tableb). The oxygen isotope ratios of clino- 10). The lower d18O(WR) values generally come frompyroxene from the metasomatic layers vary between 7·4 samples with extensive, late Ca-poor amphibole (or-and 12·5‰, with most values below 11‰ (Tables 6, 7 thoamphibole or cummingtonite) and that lack matrixand 8). quartz, and hence may reflect bulk compositional differ-
The wollastonite-rich calc-silicate rocks from retro- ences.grade zones B, C and D contain up to 50 vol. % morewollastonite than can be accounted for by reaction (6),given the low quartz content (~10 vol. %) of the un- Aluminous segregations and pegmatitesretrogressed calcite-rich marbles (Cartwright & Buick, The zones of retrogression contain decimetre- to several1995). The additional wollastonite probably formed metres-thick, coarse-grained leucocratic rocks of generallythrough the introduction of aqueous silica during fluid pegmatitic character, which are laterally continuous forinfiltration via a reaction such as up to several tens of metres. There are two types of
pegmatitic rocks: (1) feldspar-poor, quartz-rich (typically2Cal+SiO2(aq)=Wo+CO2 (10)60–80 vol. % quartz) veins; and (2) true two-feldsparpegmatites that may also contain tourmaline, with or(Cartwright & Buick, 1995). As discussed below, thesewithout biotite and sillimanite. Locally, the quartz veinsmetasomatic rocks record high time-integrated fluidcan be traced into pegmatites over several metres. Thefluxes.quartz-rich veins commonly contain optically continuousOther rock types also show evidence for open systemintergrowths of cordierite, sillimanite and tourmaline thatbehaviour during retrogression. Metapsammites with theare interpreted as having co-crystallized in the veins.same mineralogy as those in marbles outside the retro-The pegmatites are commonly semi-concordant to grossgrade zones occur in retrograde zones A, B and C. Theselithological layering and tectonic strike, whereas thegneisses, which are interlayered with thin quartzites, arequartz veins are more typically discordant (Williams etinferred to have been unaffected by retrogression. Alignedal., 1996; their fig. 3a). The latest quartz veins lackbiotite, ilmenite, plagioclase and cordierite define the S 2
aluminosilicate minerals and cut the tectonic strike at afoliation. The metapsammites are interlayered with, andhigh angle. In the pegmatites and quartz veins there ispass along strike into, quartz-poor Ca-poor amphibolelittle alignment of mineral assemblages within S 2, and no(Al-rich anthophyllite or cummingtonite)-bearing gneissesalignment of elongate minerals parallel to L 2.that are interpreted as being their retrogressed equi-
Metasomatic haloes commonly separate the pegmatitesvalents. In these gneisses, Ca-poor amphiboles are typ-or segregations from metapsammitic gneisses (Fig. 6a)ically randomly oriented and grow in rosettes. A relic S 2
and marbles. Haloes adjacent to metapsammitic gneissesfoliation is locally preserved as inclusion trails of quartzthat lack sillimanite comprise unoriented, centimetre-and ilmenite (with or without biotite) in cordierite (Fig.sized crystals of sillimanite, biotite and cordierite. Peg-4f ). Discontinuous biotite quartz-bearing lenses are com-matite–marble contacts may also be marked by thepletely surrounded by quartz-poor, orthoamphibole- andoccurrence of metasomatic clinopyroxene (Fig. 6b) orcordierite-rich domains, suggesting that the ortho-Ca-amphibole-rich layers. The occurrence of clinohumiteamphibole has grown at the expense of the biotite andin the dolomitic marbles is commonly localized to withinquartz, probably through an open-system reaction of the
general form several metres of the pegmatites (Fig. 6c). The pegmatites
893
JOURNAL OF PETROLOGY VOLUME 38 NUMBER 7 JULY 1997
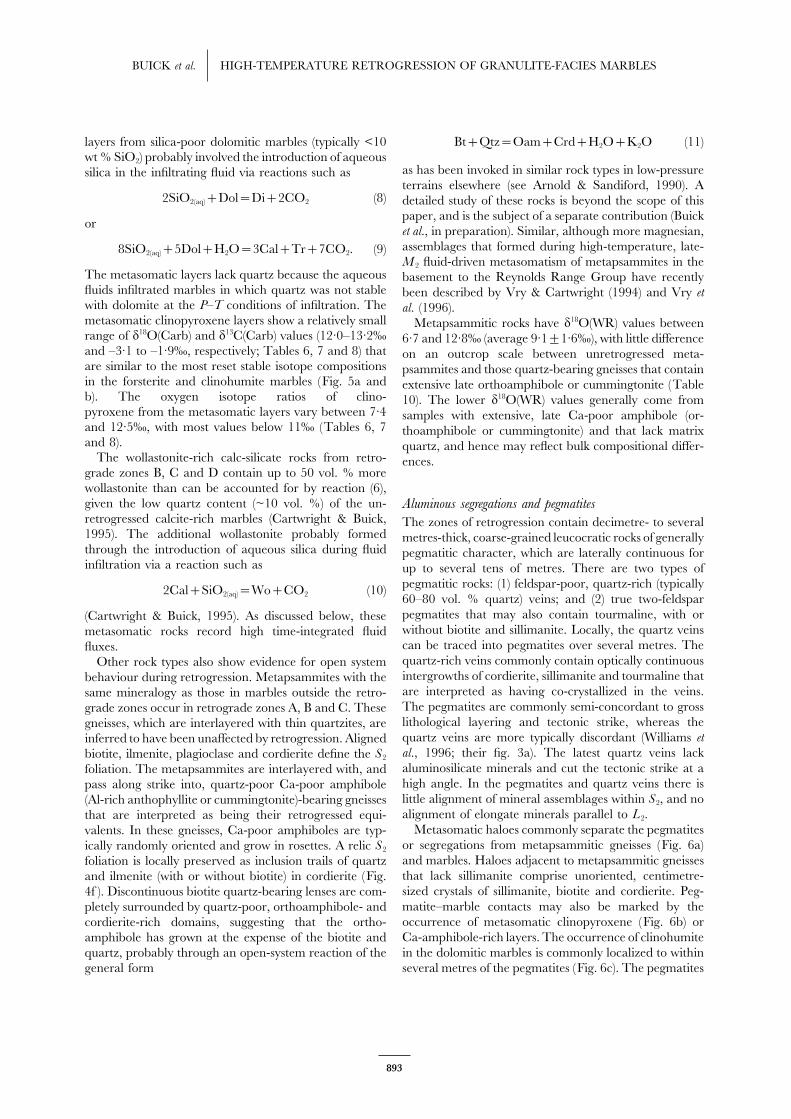
Tab
le9:
Sta
ble
isot
ope
geoc
hem
istr
yof
retrog
ress
eddo
lom
itic
mar
bles
from
retrog
rade
zone
sC
,tr
aver
seC
-3(F
ig.
2b)
Sam
ple
Dis
tan
ceW
t.%
d13C
d18O
d18O
d18O
D18
OR
ock
typ
e
(m)
Car
b.
(Car
b)
(Car
b)
(WR
)(A
mp
h)
(Cal
–Am
ph
r493
-49
0·15
53−
3·5
12·1
Fors
teri
tem
arb
le
r493
-50
2·60
57−
2·8
12·7
10·2
2·5
Fors
teri
tem
arb
le
r493
-51
3·25
43−
3·2
12·3
Fors
teri
tem
arb
le
r493
-52
3·70
56−
2·9
13·3
Fors
teri
tem
arb
le
r493
-53
4·70
48−
3·2
12·0
Fors
teri
tem
arb
le
r493
-54
5·35
63−
2·3
13·1
Clin
oh
um
ite
mar
ble
r493
-55
7·50
44−
2·9
12·8
Clin
oh
um
ite
mar
ble
r493
-56
8·60
50−
2·6
12·7
Clin
oh
um
ite
mar
ble
r493
-57
9·20
53−
2·5
12·4
Clin
oh
um
ite
mar
ble
9235
-339
9·30
9·8
Trem
olit
e,m
assi
vem
etas
om
atic
laye
r
r493
-58
9·40
11·2
Peg
mat
ite
r493
-59
10·4
011
·2P
egm
atit
e
r493
-60
12·5
026
−2·
813
·9Fo
rste
rite
mar
ble
r493
-61
16·3
046
−2·
912
·4Fo
rste
rite
mar
ble
r493
-62
17·7
039
−3·
112
·3Fo
rste
rite
mar
ble
r393
-63
22·6
010
·2M
etap
sam
mit
e
r394
-64
28·1
09·
7M
etap
sam
mit
e
r493
-65
9·20
45−
2·5
13·1
Clin
oh
um
ite
mar
ble
,5·
1m
toN
Wo
fr4
93-5
7
r493
-66
9·20
51−
2·2
11·8
Clin
oh
um
ite
mar
ble
,6·
7m
toN
Wo
fr4
93-5
7
r493
-67
9·20
43−
2·1
12·9
Clin
oh
um
ite
mar
ble
,8·
5m
toN
Wo
fr4
93-5
7
r493
-68
9·20
44−
2·6
12·7
Clin
oh
um
ite
mar
ble
,9·
5m
toN
Wo
fr4
93-5
7
r493
-69
oth
er∗
40−
3·1
11·9
Fors
teri
tem
arb
le
r493
-70a
oth
er∗
89−
2·0
12·7
Fors
teri
tem
arb
le
r493
-70b
oth
er∗
77−
2·1
12·9
Fors
teri
tem
arb
le
∗Lo
ose
sam
ple
sn
ot
take
no
nth
etr
aver
selin
e.
894
BUICK et al. HIGH-TEMPERATURE RETROGRESSION OF GRANULITE-FACIES MARBLES
Table 10: The oxygen isotope geochemistry of interlayered retrogressed and unaltered metapsammites
Sample Retrograde d18O(WR) Comments
zone
9235-188 A 11·0 Biotite metapsammite
9235-194 A 8·4 Orthoamphibole–cordierite gneiss
9035-270b B 8·1 Orthoamphibole–cordierite gneiss
9035-273 B 6·7 Orthoamphibole–cordierite gneiss
9035-274 B 7·7 Orthoamphibole–cordierite gneiss
r493-160 B 9·4 Biotite metapsammite
r493-170 B 8·9 Orthoamphibole–cordierite gneiss
r493-171 B 6·8 Orthoamphibole–cordierite gneiss
r493-301 B 6·7 Orthoamphibole–cordierite gneiss
9235-260 C 10·7 Biotite metapsammite
9235-268 C 10·6 Biotite metapsammite
9235-270 C 8·1 Orthoamphibole–cordierite gneiss
9235-271 C 10·3 Orthoamphibole–cordierite gneiss
9235-273 C 10·3 Biotite metapsammite
9235-275 C 10·5 Orthoamphibole–cordierite gneiss
9235-278 C 9·2 Orthoamphibole–cordierite gneiss
9235-280a C 9·6 Biotite metapsammite
9235-280b C 9·6 Orthoamphibole–cordierite gneiss
9235-314 C 7·1 Orthoamphibole–spinel–orthopyroxene gneiss
r493-42 C 9·2 Biotite metapsammite
r493-83 C 12·8 Biotite metapsammite
r493-96 C 10·3 Biotite metapsammite
r493-103 C 10·1 Biotite metapsammite
r493-106 C 8·2 Orthoamphibole–cordierite gneiss
r493-108 C 7·2 Orthoamphibole–cordierite gneiss
r493-125 C 9·8 Biotite metapsammite
represent local fluid sources whereas the veins represent (wollastonite, Ca-bearing and Ca-poor amphiboles, clino-zoisite) overgrow the peak-metamorphic S 2 foliation; andfluid conduits within the retrograde zones.
The aluminous quartz veins and pegmatites have (2) aluminous pegmatites and quartz-rich veins containunoriented mineral assemblages, and the veins themselvesd18O(WR) values of 10·1–12·1‰ (average 10·9±0·7‰;
Cartwright & Buick, 1995). These values are within the truncate S 2. This relative timing is corroborated byrecently determined SHRIMP U–Pb ages of zircons fromrange recorded from granulite-facies Reynolds Range
Group metapelites (average 10·0±1·8‰; Buick & Cart- syn-M 2 partial melts in unretrogressed rocks and post-peak M 2 quartz veins in the retrograde zones, whichwright, 1996), but are generally higher than those of
adjacent ~1·78 Ga granites (6·1±2·5‰; Buick & Cart- suggest that peak M 2 metamorphism occurred at or before1594±6 Ma, and that high-temperature retrogressionwright, 1996). Minerals from the pegmatites and quartz
segregations have concordant, high-temperature, oxygen occurred between 1586±5 Ma and 1568±4 Maisotope fractionations (Cartwright & Buick, 1995). (Williams et al., 1996).
DISCUSSION Fluid sources and large-scale flowgeometryThe timing of retrogressionAt the M 2 peak, metapelites that underlie the UpperThe relative timing of mineral growth in the retrogradeCalcsilicate Unit underwent biotite-dehydration meltingzones can be constrained as postdating the peak of M 2–D 2
because: (1) the new minerals in the retrograde zones reactions (Dirks et al., 1991) of the general form
895
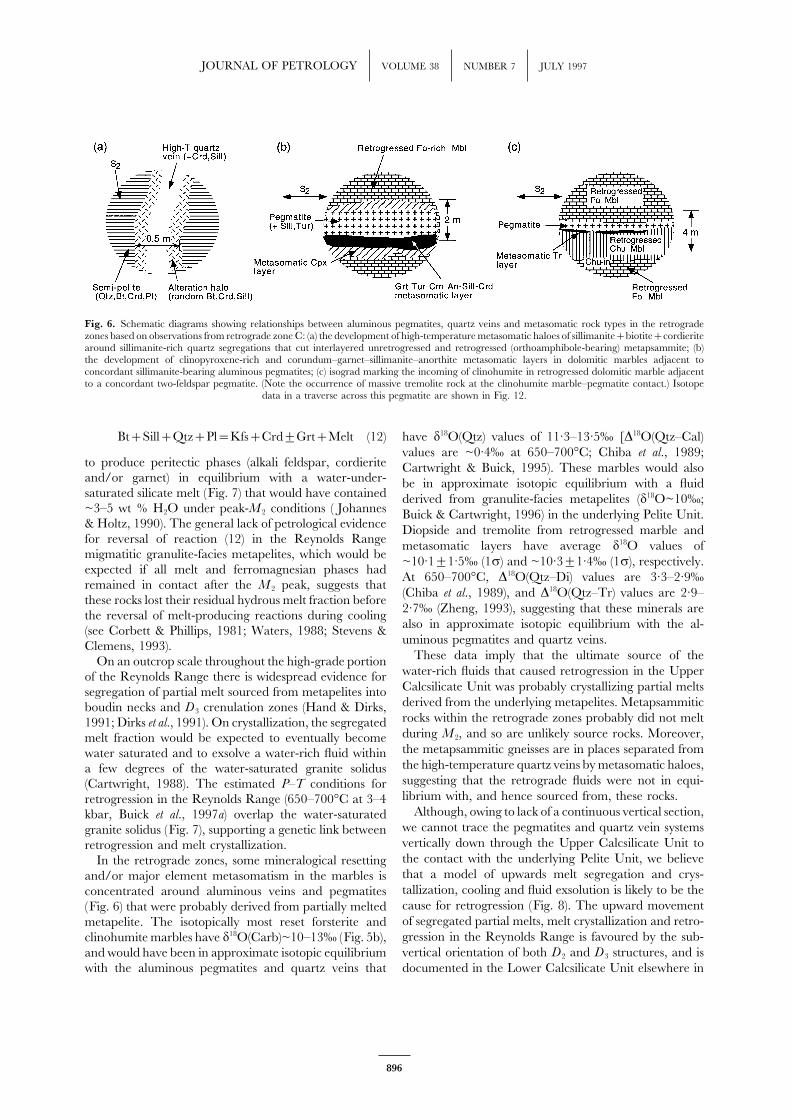
JOURNAL OF PETROLOGY VOLUME 38 NUMBER 7 JULY 1997
Fig. 6. Schematic diagrams showing relationships between aluminous pegmatites, quartz veins and metasomatic rock types in the retrogradezones based on observations from retrograde zone C: (a) the development of high-temperature metasomatic haloes of sillimanite+biotite+cordieritearound sillimanite-rich quartz segregations that cut interlayered unretrogressed and retrogressed (orthoamphibole-bearing) metapsammite; (b)the development of clinopyroxene-rich and corundum–garnet–sillimanite–anorthite metasomatic layers in dolomitic marbles adjacent toconcordant sillimanite-bearing aluminous pegmatites; (c) isograd marking the incoming of clinohumite in retrogressed dolomitic marble adjacentto a concordant two-feldspar pegmatite. (Note the occurrence of massive tremolite rock at the clinohumite marble–pegmatite contact.) Isotope
data in a traverse across this pegmatite are shown in Fig. 12.
Bt+Sill+Qtz+Pl=Kfs+Crd±Grt+Melt (12) have d18O(Qtz) values of 11·3–13·5‰ [D18O(Qtz–Cal)values are ~0·4‰ at 650–700°C; Chiba et al., 1989;
to produce peritectic phases (alkali feldspar, cordierite Cartwright & Buick, 1995). These marbles would alsoand/or garnet) in equilibrium with a water-under- be in approximate isotopic equilibrium with a fluidsaturated silicate melt (Fig. 7) that would have contained derived from granulite-facies metapelites (d18O~10‰;~3–5 wt % H2O under peak-M 2 conditions ( Johannes Buick & Cartwright, 1996) in the underlying Pelite Unit.& Holtz, 1990). The general lack of petrological evidence Diopside and tremolite from retrogressed marble andfor reversal of reaction (12) in the Reynolds Range metasomatic layers have average d18O values ofmigmatitic granulite-facies metapelites, which would be ~10·1±1·5‰ (1r) and ~10·3±1·4‰ (1r), respectively.expected if all melt and ferromagnesian phases had At 650–700°C, D18O(Qtz–Di) values are 3·3–2·9‰remained in contact after the M 2 peak, suggests that
(Chiba et al., 1989), and D18O(Qtz–Tr) values are 2·9–these rocks lost their residual hydrous melt fraction before2·7‰ (Zheng, 1993), suggesting that these minerals arethe reversal of melt-producing reactions during coolingalso in approximate isotopic equilibrium with the al-(see Corbett & Phillips, 1981; Waters, 1988; Stevens &uminous pegmatites and quartz veins.Clemens, 1993).
These data imply that the ultimate source of theOn an outcrop scale throughout the high-grade portionwater-rich fluids that caused retrogression in the Upperof the Reynolds Range there is widespread evidence forCalcsilicate Unit was probably crystallizing partial meltssegregation of partial melt sourced from metapelites intoderived from the underlying metapelites. Metapsammiticboudin necks and D 3 crenulation zones (Hand & Dirks,rocks within the retrograde zones probably did not melt1991; Dirks et al., 1991). On crystallization, the segregatedduring M 2, and so are unlikely source rocks. Moreover,melt fraction would be expected to eventually becomethe metapsammitic gneisses are in places separated fromwater saturated and to exsolve a water-rich fluid withinthe high-temperature quartz veins by metasomatic haloes,a few degrees of the water-saturated granite solidussuggesting that the retrograde fluids were not in equi-(Cartwright, 1988). The estimated P–T conditions forlibrium with, and hence sourced from, these rocks.retrogression in the Reynolds Range (650–700°C at 3–4
Although, owing to lack of a continuous vertical section,kbar, Buick et al., 1997a) overlap the water-saturatedwe cannot trace the pegmatites and quartz vein systemsgranite solidus (Fig. 7), supporting a genetic link betweenvertically down through the Upper Calcsilicate Unit toretrogression and melt crystallization.the contact with the underlying Pelite Unit, we believeIn the retrograde zones, some mineralogical resettingthat a model of upwards melt segregation and crys-and/or major element metasomatism in the marbles istallization, cooling and fluid exsolution is likely to be theconcentrated around aluminous veins and pegmatitescause for retrogression (Fig. 8). The upward movement(Fig. 6) that were probably derived from partially meltedof segregated partial melts, melt crystallization and retro-metapelite. The isotopically most reset forsterite andgression in the Reynolds Range is favoured by the sub-clinohumite marbles have d18O(Carb)~10–13‰ (Fig. 5b),vertical orientation of both D 2 and D 3 structures, and isand would have been in approximate isotopic equilibrium
with the aluminous pegmatites and quartz veins that documented in the Lower Calcsilicate Unit elsewhere in
896
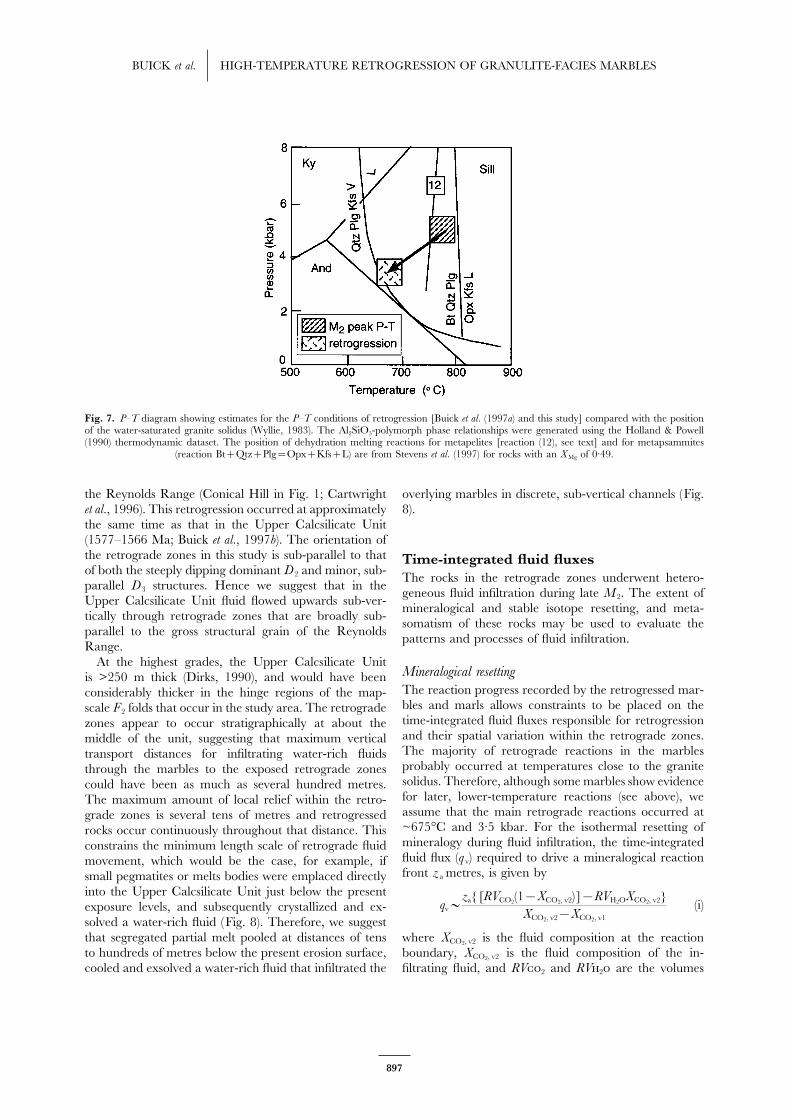
BUICK et al. HIGH-TEMPERATURE RETROGRESSION OF GRANULITE-FACIES MARBLES
Fig. 7. P–T diagram showing estimates for the P–T conditions of retrogression [Buick et al. (1997a) and this study] compared with the positionof the water-saturated granite solidus (Wyllie, 1983). The Al2SiO5-polymorph phase relationships were generated using the Holland & Powell(1990) thermodynamic dataset. The position of dehydration melting reactions for metapelites [reaction (12), see text] and for metapsammites
(reaction Bt+Qtz+Plg=Opx+Kfs+L) are from Stevens et al. (1997) for rocks with an X Mg of 0·49.
the Reynolds Range (Conical Hill in Fig. 1; Cartwright overlying marbles in discrete, sub-vertical channels (Fig.8).et al., 1996). This retrogression occurred at approximately
the same time as that in the Upper Calcsilicate Unit(1577–1566 Ma; Buick et al., 1997b). The orientation ofthe retrograde zones in this study is sub-parallel to that Time-integrated fluid fluxesof both the steeply dipping dominant D 2 and minor, sub- The rocks in the retrograde zones underwent hetero-parallel D 3 structures. Hence we suggest that in the geneous fluid infiltration during late M 2. The extent ofUpper Calcsilicate Unit fluid flowed upwards sub-ver- mineralogical and stable isotope resetting, and meta-tically through retrograde zones that are broadly sub- somatism of these rocks may be used to evaluate theparallel to the gross structural grain of the Reynolds patterns and processes of fluid infiltration.Range.
At the highest grades, the Upper Calcsilicate UnitMineralogical resettingis >250 m thick (Dirks, 1990), and would have beenThe reaction progress recorded by the retrogressed mar-considerably thicker in the hinge regions of the map-bles and marls allows constraints to be placed on thescale F 2 folds that occur in the study area. The retrogradetime-integrated fluid fluxes responsible for retrogressionzones appear to occur stratigraphically at about theand their spatial variation within the retrograde zones.middle of the unit, suggesting that maximum verticalThe majority of retrograde reactions in the marblestransport distances for infiltrating water-rich fluidsprobably occurred at temperatures close to the granitethrough the marbles to the exposed retrograde zonessolidus. Therefore, although some marbles show evidencecould have been as much as several hundred metres.for later, lower-temperature reactions (see above), weThe maximum amount of local relief within the retro-assume that the main retrograde reactions occurred atgrade zones is several tens of metres and retrogressed~675°C and 3·5 kbar. For the isothermal resetting ofrocks occur continuously throughout that distance. Thismineralogy during fluid infiltration, the time-integratedconstrains the minimum length scale of retrograde fluidfluid flux (q v) required to drive a mineralogical reactionmovement, which would be the case, for example, iffront z a metres, is given bysmall pegmatites or melts bodies were emplaced directly
into the Upper Calcsilicate Unit just below the presentqv>
za{[RVCO2(1−XCO2, v2) ]−RVH2OXCO2, v2}XCO2, v2−XCO2, v1
(i)exposure levels, and subsequently crystallized and ex-solved a water-rich fluid (Fig. 8). Therefore, we suggestthat segregated partial melt pooled at distances of tens where XCO2, v2 is the fluid composition at the reactionto hundreds of metres below the present erosion surface, boundary, XCO2, v2 is the fluid composition of the in-
filtrating fluid, and RV2 and RV2 are the volumescooled and exsolved a water-rich fluid that infiltrated the
897
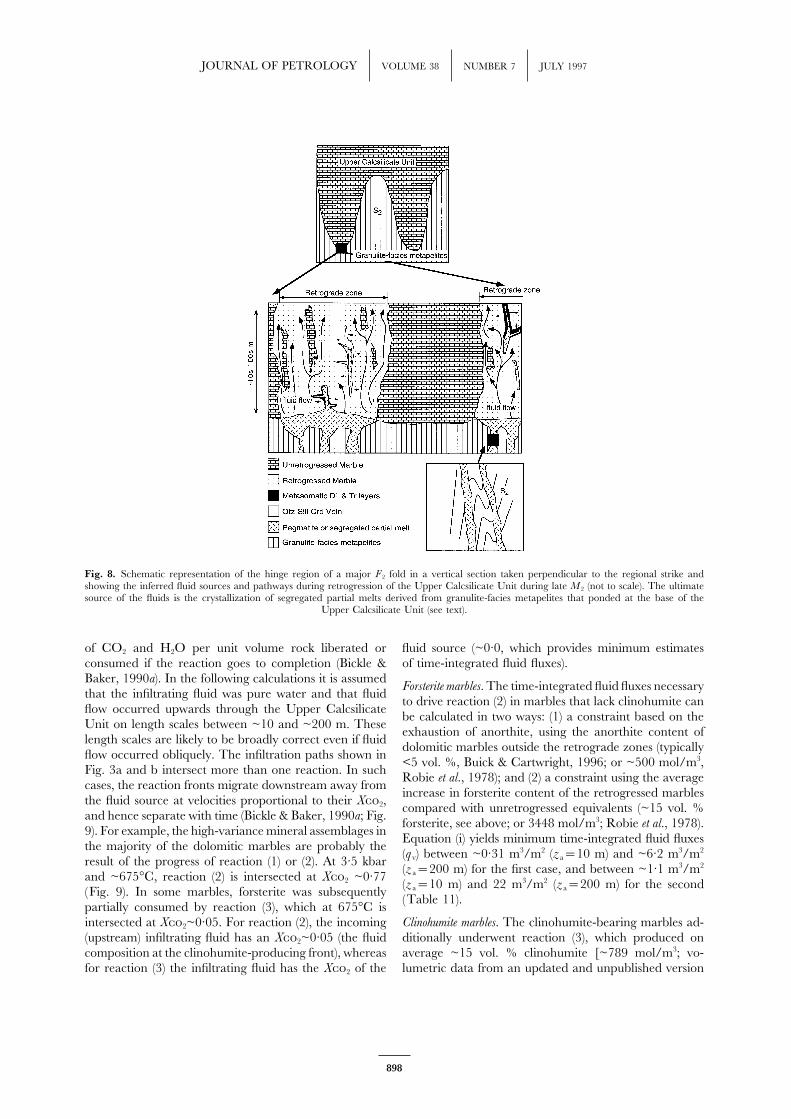
JOURNAL OF PETROLOGY VOLUME 38 NUMBER 7 JULY 1997
Fig. 8. Schematic representation of the hinge region of a major F 2 fold in a vertical section taken perpendicular to the regional strike andshowing the inferred fluid sources and pathways during retrogression of the Upper Calcsilicate Unit during late M 2 (not to scale). The ultimatesource of the fluids is the crystallization of segregated partial melts derived from granulite-facies metapelites that ponded at the base of the
Upper Calcsilicate Unit (see text).
of CO2 and H2O per unit volume rock liberated or fluid source (~0·0, which provides minimum estimatesof time-integrated fluid fluxes).consumed if the reaction goes to completion (Bickle &
Baker, 1990a). In the following calculations it is assumedForsterite marbles. The time-integrated fluid fluxes necessarythat the infiltrating fluid was pure water and that fluid to drive reaction (2) in marbles that lack clinohumite canflow occurred upwards through the Upper Calcsilicate be calculated in two ways: (1) a constraint based on theUnit on length scales between ~10 and ~200 m. These exhaustion of anorthite, using the anorthite content oflength scales are likely to be broadly correct even if fluid dolomitic marbles outside the retrograde zones (typicallyflow occurred obliquely. The infiltration paths shown in <5 vol. %, Buick & Cartwright, 1996; or ~500 mol/m3,Fig. 3a and b intersect more than one reaction. In such Robie et al., 1978); and (2) a constraint using the averagecases, the reaction fronts migrate downstream away from increase in forsterite content of the retrogressed marblesthe fluid source at velocities proportional to their X2, compared with unretrogressed equivalents (~15 vol. %and hence separate with time (Bickle & Baker, 1990a; Fig. forsterite, see above; or 3448 mol/m3; Robie et al., 1978).9). For example, the high-variance mineral assemblages in Equation (i) yields minimum time-integrated fluid fluxesthe majority of the dolomitic marbles are probably the (q v) between ~0·31 m3/m2 (z a=10 m) and ~6·2 m3/m2
result of the progress of reaction (1) or (2). At 3·5 kbar (z a=200 m) for the first case, and between ~1·1 m3/m2
and ~675°C, reaction (2) is intersected at X2 ~0·77 (z a=10 m) and 22 m3/m2 (z a=200 m) for the second(Fig. 9). In some marbles, forsterite was subsequently (Table 11).partially consumed by reaction (3), which at 675°C isintersected at X2~0·05. For reaction (2), the incoming Clinohumite marbles. The clinohumite-bearing marbles ad-
ditionally underwent reaction (3), which produced on(upstream) infiltrating fluid has an X2~0·05 (the fluidcomposition at the clinohumite-producing front), whereas average ~15 vol. % clinohumite [~789 mol/m3; vo-
lumetric data from an updated and unpublished versionfor reaction (3) the infiltrating fluid has the X2 of the
898
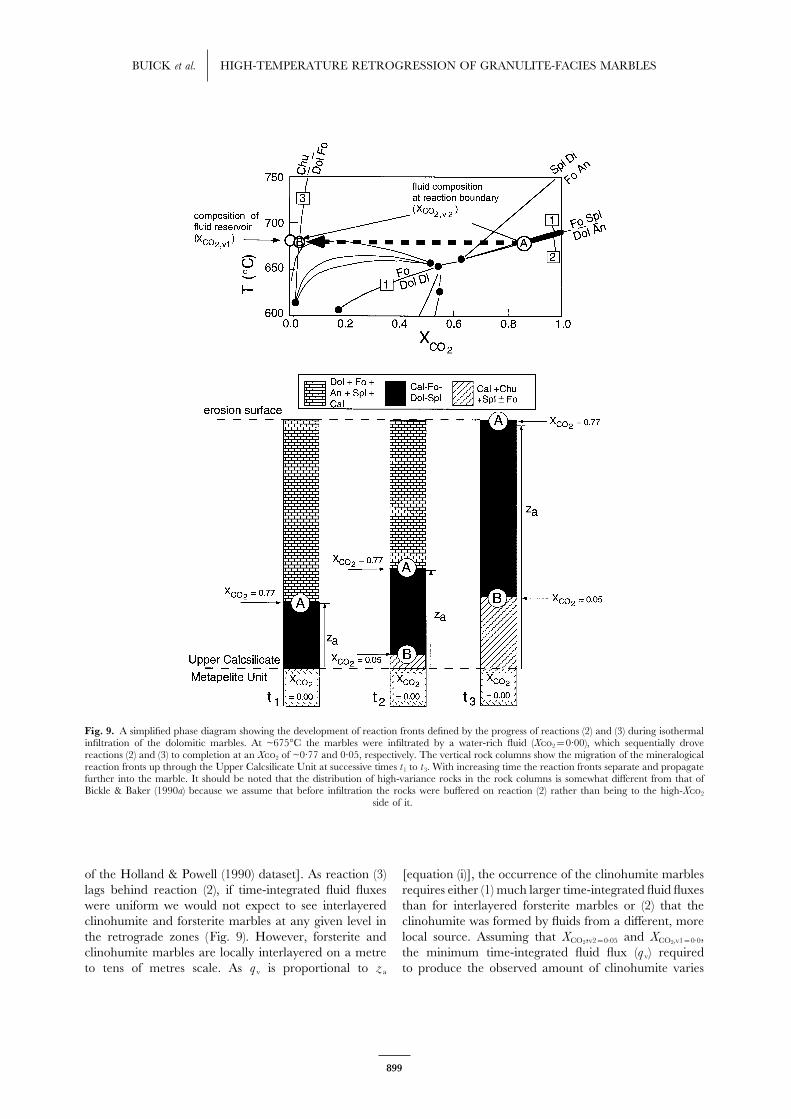
BUICK et al. HIGH-TEMPERATURE RETROGRESSION OF GRANULITE-FACIES MARBLES
Fig. 9. A simplified phase diagram showing the development of reaction fronts defined by the progress of reactions (2) and (3) during isothermalinfiltration of the dolomitic marbles. At ~675°C the marbles were infiltrated by a water-rich fluid (X2=0·00), which sequentially drovereactions (2) and (3) to completion at an X2 of ~0·77 and 0·05, respectively. The vertical rock columns show the migration of the mineralogicalreaction fronts up through the Upper Calcsilicate Unit at successive times t 1 to t 3. With increasing time the reaction fronts separate and propagatefurther into the marble. It should be noted that the distribution of high-variance rocks in the rock columns is somewhat different from that ofBickle & Baker (1990a) because we assume that before infiltration the rocks were buffered on reaction (2) rather than being to the high-X2
side of it.
of the Holland & Powell (1990) dataset]. As reaction (3) [equation (i)], the occurrence of the clinohumite marblesrequires either (1) much larger time-integrated fluid fluxeslags behind reaction (2), if time-integrated fluid fluxes
were uniform we would not expect to see interlayered than for interlayered forsterite marbles or (2) that theclinohumite was formed by fluids from a different, moreclinohumite and forsterite marbles at any given level in
the retrograde zones (Fig. 9). However, forsterite and local source. Assuming that XCO2,v2=0·05 and XCO2,v1=0·0,the minimum time-integrated fluid flux (q v) requiredclinohumite marbles are locally interlayered on a metre
to tens of metres scale. As q v is proportional to z a to produce the observed amount of clinohumite varies
899
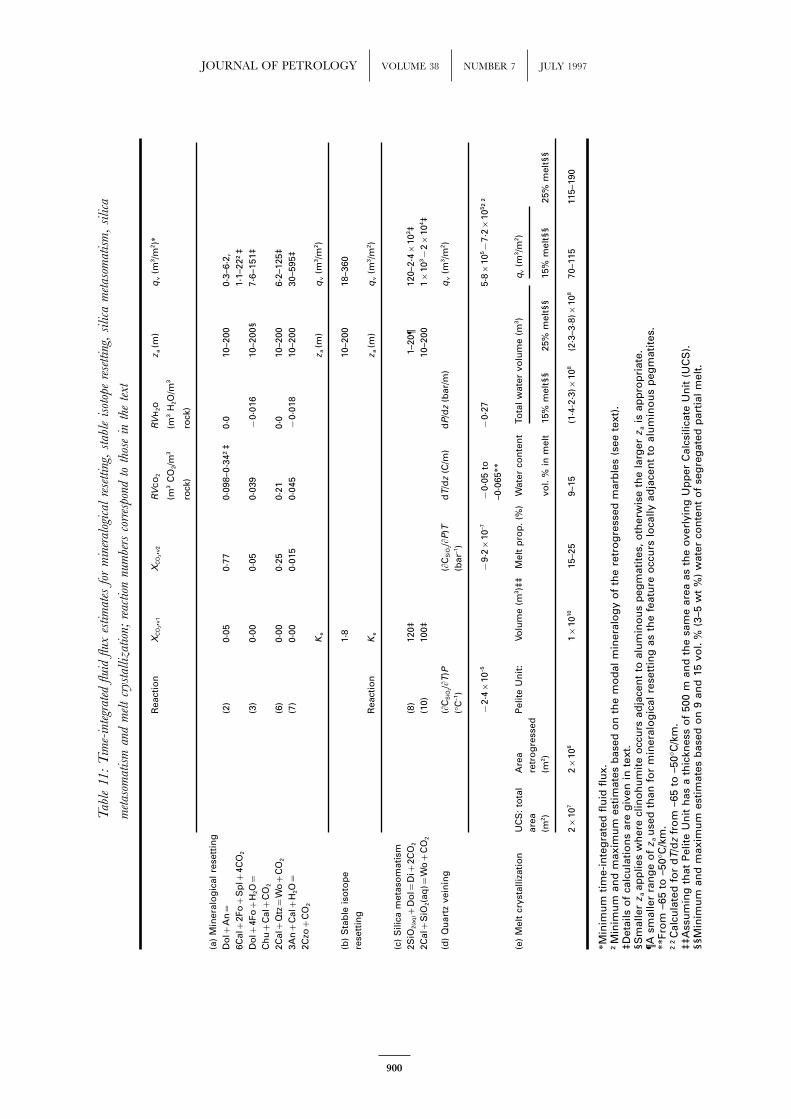
JOURNAL OF PETROLOGY VOLUME 38 NUMBER 7 JULY 1997
Tab
le11
:T
ime-
inte
grat
edflu
idflu
xes
tim
ates
for
min
eral
ogic
alre
settin
g,st
able
isot
ope
rese
ttin
g,si
lica
met
asom
atis
m,
silica
met
asom
atis
man
dm
elt
crys
talliz
atio
n;re
action
num
bers
corr
espo
ndto
thos
ein
the
text
Rea
ctio
nX
CO
2, v1
XC
O2, v
2R
Vco
2R
Vh
2oz a
(m)
qv
(m3 /m
2 )∗
(m3
CO
2/m
3(m
3H
2O/m
3
rock
)ro
ck)
(a)
Min
eral
og
ical
rese
ttin
gD
ol+
An=
(2)
0·05
0·77
0·09
8–0·
34†‡
0·0
10–2
000·
3–6·
2,6C
al+
2Fo+
Sp
l+4C
O2
1·1–
22†‡
Do
l+4F
o+
H2O=
(3)
0·00
0·05
0·03
9−
0·01
610
–200
§7·
6–15
1‡C
hu+
Cal+
CO
2
2Cal+
Qtz=
Wo+
CO
2(6
)0·
000·
250·
210·
010
–200
6·2–
125‡
3An+
Cal+
H2O=
(7)
0·00
0·01
50·
045
−0·
018
10–2
0030
–595
‡2C
zo+
CO
2
Ke
z a(m
)q
v(m
3 /m2 )
(b)
Sta
ble
iso
top
e1·
810
–200
18–3
60re
sett
ing
Rea
ctio
nK
ez a
(m)
qv
(m3 /m
2 )
(c)
Sili
cam
etas
om
atis
m2S
iO2(
aq)+
Do
l=D
i+2C
O2
(8)
120‡
1–20
¶12
0–2·
4×10
3 ‡2C
al+
SiO
2(aq
)=W
o+
CO
2(1
0)10
0‡10
–200
1×10
3 −2×
104 ‡
(d)
Qu
artz
vein
ing
(∂C
SiO
2/∂T)
P(∂
CS
iO2/∂
P)T
dT/
dz
(C/m
)d
P/d
z(b
ar/m
)q
v(m
3 /m2 )
(°C
–1)
(bar
–1)
−2·
4×10
–5−
9·2×
10–7
−0·
05to
−0·
275·
8×10
5 −7·
2×10
5 ††–0
·065∗∗
(e)
Mel
tcr
ysta
lliza
tio
nU
CS
:to
tal
Are
aP
elit
eU
nit
:Vo
lum
e(m
3 )‡‡
Mel
tp
rop
.(%
)W
ater
con
ten
tTo
tal
wat
ervo
lum
e(m
3 )q v
(m3 /m
2 )ar
eare
tro
gre
ssed
(m2 )
(m2 )
vol.
%in
mel
t15
%m
elt§
§25
%m
elt§
§15
%m
elt§
§25
%m
elt§
§
2×10
72×
106
1×10
1015
–25
9–15
(1·4
-2·3
)×10
8(2
·3–3
·8)×
108
70–1
1511
5–19
0
∗Min
imu
mti
me-
inte
gra
ted
flu
idfl
ux.
†Min
imu
man
dm
axim
um
esti
mat
esb
ased
on
the
mo
dal
min
eral
og
yo
fth
ere
tro
gre
ssed
mar
ble
s(s
eete
xt).
‡Det
ails
of
calc
ula
tio
ns
are
giv
enin
text
.§S
mal
ler
z aap
plie
sw
her
ecl
ino
hu
mit
eo
ccu
rsad
jace
nt
toal
um
ino
us
peg
mat
ites
,o
ther
wis
eth
ela
rger
z ais
app
rop
riat
e.¶A
smal
ler
ran
ge
of
z au
sed
than
for
min
eral
og
ical
rese
ttin
gas
the
feat
ure
occ
urs
loca
llyad
jace
nt
toal
um
ino
us
peg
mat
ites
.∗∗
Fro
m–6
5to
–50°
C/k
m.
††C
alcu
late
dfo
rd
T/d
zfr
om
–65
to–5
0°C
/km
.‡‡
Ass
um
ing
that
Pel
ite
Un
ith
asa
thic
knes
so
f50
0m
and
the
sam
ear
eaas
the
ove
rlyi
ng
Up
per
Cal
csili
cate
Un
it(U
CS
).§§
Min
imu
man
dm
axim
um
esti
mat
esb
ased
on
9an
d15
vol.
%(3
–5w
t%
)w
ater
con
ten
to
fse
gre
gat
edp
arti
alm
elt.
900
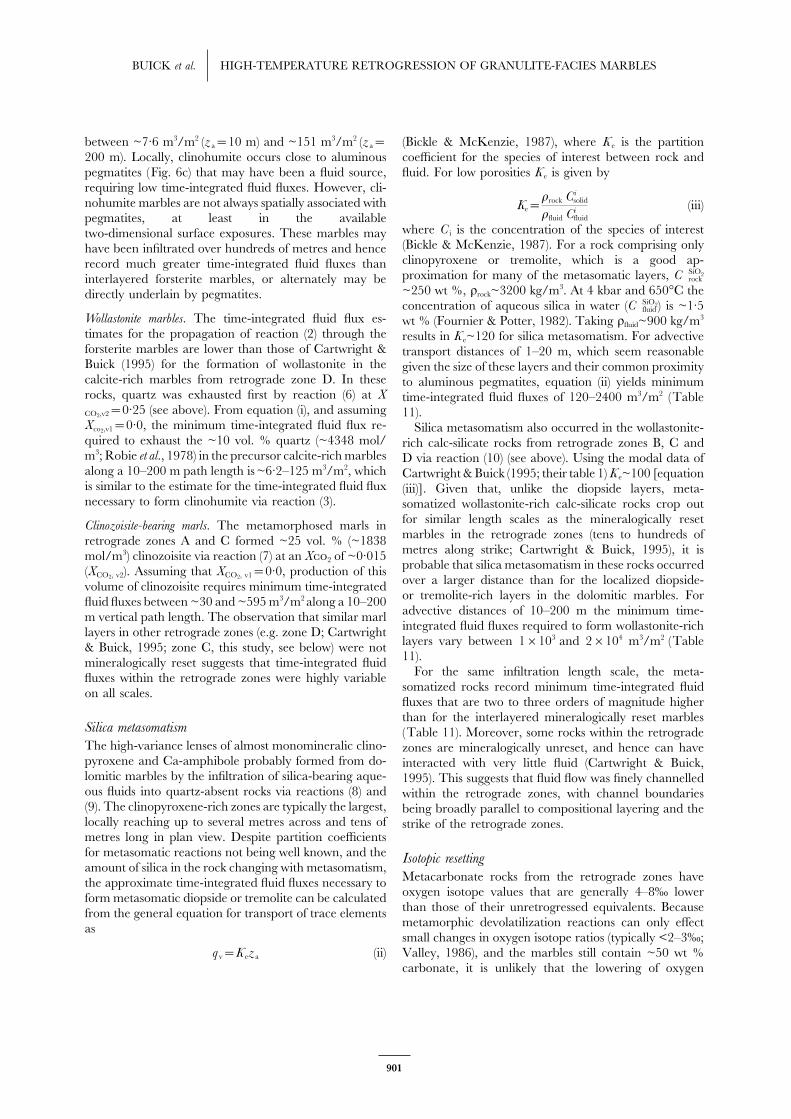
BUICK et al. HIGH-TEMPERATURE RETROGRESSION OF GRANULITE-FACIES MARBLES
between ~7·6 m3/m2 (z a=10 m) and ~151 m3/m2 (z a= (Bickle & McKenzie, 1987), where K e is the partitioncoefficient for the species of interest between rock and200 m). Locally, clinohumite occurs close to aluminous
pegmatites (Fig. 6c) that may have been a fluid source, fluid. For low porosities K e is given byrequiring low time-integrated fluid fluxes. However, cli-nohumite marbles are not always spatially associated with Ke=
qrock Cisolid
qfluid Cifluid
(iii)pegmatites, at least in the available
where C i is the concentration of the species of interesttwo-dimensional surface exposures. These marbles may(Bickle & McKenzie, 1987). For a rock comprising onlyhave been infiltrated over hundreds of metres and henceclinopyroxene or tremolite, which is a good ap-record much greater time-integrated fluid fluxes thanproximation for many of the metasomatic layers, C SiO2
rockinterlayered forsterite marbles, or alternately may be~250 wt %, qrock~3200 kg/m3. At 4 kbar and 650°C thedirectly underlain by pegmatites.concentration of aqueous silica in water (C SiO2
fluid ) is ~1·5Wollastonite marbles. The time-integrated fluid flux es- wt % (Fournier & Potter, 1982). Taking qfluid~900 kg/m3
timates for the propagation of reaction (2) through the results in K e~120 for silica metasomatism. For advectiveforsterite marbles are lower than those of Cartwright & transport distances of 1–20 m, which seem reasonableBuick (1995) for the formation of wollastonite in the given the size of these layers and their common proximitycalcite-rich marbles from retrograde zone D. In these to aluminous pegmatites, equation (ii) yields minimumrocks, quartz was exhausted first by reaction (6) at X time-integrated fluid fluxes of 120–2400 m3/m2 (TableCO2,v2=0·25 (see above). From equation (i), and assuming 11).Xco2,v1=0·0, the minimum time-integrated fluid flux re- Silica metasomatism also occurred in the wollastonite-quired to exhaust the ~10 vol. % quartz (~4348 mol/ rich calc-silicate rocks from retrograde zones B, C andm3; Robie et al., 1978) in the precursor calcite-rich marbles D via reaction (10) (see above). Using the modal data ofalong a 10–200 m path length is ~6·2–125 m3/m2, which Cartwright & Buick (1995; their table 1) K e~100 [equationis similar to the estimate for the time-integrated fluid flux (iii)]. Given that, unlike the diopside layers, meta-necessary to form clinohumite via reaction (3). somatized wollastonite-rich calc-silicate rocks crop out
for similar length scales as the mineralogically resetClinozoisite-bearing marls. The metamorphosed marls in
marbles in the retrograde zones (tens to hundreds ofretrograde zones A and C formed ~25 vol. % (~1838metres along strike; Cartwright & Buick, 1995), it ismol/m3) clinozoisite via reaction (7) at an X2 of ~0·015probable that silica metasomatism in these rocks occurred(XCO2, v2). Assuming that XCO2, v1=0·0, production of thisover a larger distance than for the localized diopside-volume of clinozoisite requires minimum time-integratedor tremolite-rich layers in the dolomitic marbles. Forfluid fluxes between ~30 and ~595 m3/m2 along a 10–200advective distances of 10–200 m the minimum time-m vertical path length. The observation that similar marlintegrated fluid fluxes required to form wollastonite-richlayers in other retrograde zones (e.g. zone D; Cartwrightlayers vary between 1×10³ and 2×10⁴ m3/m2 (Table& Buick, 1995; zone C, this study, see below) were not11).mineralogically reset suggests that time-integrated fluid
For the same infiltration length scale, the meta-fluxes within the retrograde zones were highly variablesomatized rocks record minimum time-integrated fluidon all scales.fluxes that are two to three orders of magnitude higherthan for the interlayered mineralogically reset marbles
Silica metasomatism (Table 11). Moreover, some rocks within the retrogradeThe high-variance lenses of almost monomineralic clino- zones are mineralogically unreset, and hence can havepyroxene and Ca-amphibole probably formed from do- interacted with very little fluid (Cartwright & Buick,lomitic marbles by the infiltration of silica-bearing aque- 1995). This suggests that fluid flow was finely channelledous fluids into quartz-absent rocks via reactions (8) and within the retrograde zones, with channel boundaries(9). The clinopyroxene-rich zones are typically the largest, being broadly parallel to compositional layering and thelocally reaching up to several metres across and tens of strike of the retrograde zones.metres long in plan view. Despite partition coefficientsfor metasomatic reactions not being well known, and the Isotopic resettingamount of silica in the rock changing with metasomatism,
Metacarbonate rocks from the retrograde zones havethe approximate time-integrated fluid fluxes necessary tooxygen isotope values that are generally 4–8‰ lowerform metasomatic diopside or tremolite can be calculatedthan those of their unretrogressed equivalents. Becausefrom the general equation for transport of trace elementsmetamorphic devolatilization reactions can only effectassmall changes in oxygen isotope ratios (typically <2–3‰;Valley, 1986), and the marbles still contain ~50 wt %q v=K ez a (ii)carbonate, it is unlikely that the lowering of oxygen
901
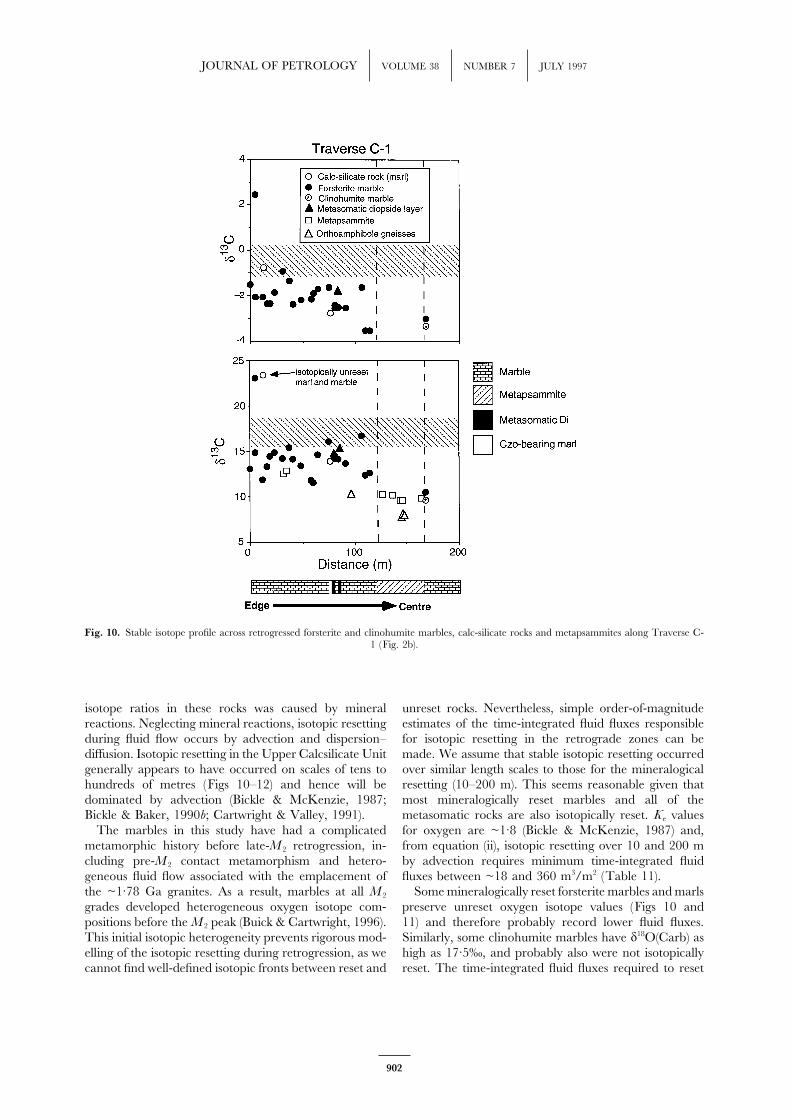
JOURNAL OF PETROLOGY VOLUME 38 NUMBER 7 JULY 1997
Fig. 10. Stable isotope profile across retrogressed forsterite and clinohumite marbles, calc-silicate rocks and metapsammites along Traverse C-1 (Fig. 2b).
isotope ratios in these rocks was caused by mineral unreset rocks. Nevertheless, simple order-of-magnitudeestimates of the time-integrated fluid fluxes responsiblereactions. Neglecting mineral reactions, isotopic resetting
during fluid flow occurs by advection and dispersion– for isotopic resetting in the retrograde zones can bemade. We assume that stable isotopic resetting occurreddiffusion. Isotopic resetting in the Upper Calcsilicate Unit
generally appears to have occurred on scales of tens to over similar length scales to those for the mineralogicalresetting (10–200 m). This seems reasonable given thathundreds of metres (Figs 10–12) and hence will be
dominated by advection (Bickle & McKenzie, 1987; most mineralogically reset marbles and all of themetasomatic rocks are also isotopically reset. K e valuesBickle & Baker, 1990b; Cartwright & Valley, 1991).
The marbles in this study have had a complicated for oxygen are ~1·8 (Bickle & McKenzie, 1987) and,from equation (ii), isotopic resetting over 10 and 200 mmetamorphic history before late-M 2 retrogression, in-
cluding pre-M 2 contact metamorphism and hetero- by advection requires minimum time-integrated fluidfluxes between ~18 and 360 m3/m2 (Table 11).geneous fluid flow associated with the emplacement of
the ~1·78 Ga granites. As a result, marbles at all M 2 Some mineralogically reset forsterite marbles and marlspreserve unreset oxygen isotope values (Figs 10 andgrades developed heterogeneous oxygen isotope com-
positions before the M 2 peak (Buick & Cartwright, 1996). 11) and therefore probably record lower fluid fluxes.Similarly, some clinohumite marbles have d18O(Carb) asThis initial isotopic heterogeneity prevents rigorous mod-
elling of the isotopic resetting during retrogression, as we high as 17·5‰, and probably also were not isotopicallyreset. The time-integrated fluid fluxes required to resetcannot find well-defined isotopic fronts between reset and
902
BUICK et al. HIGH-TEMPERATURE RETROGRESSION OF GRANULITE-FACIES MARBLES
Fig. 11. Stable isotope profile across retrogressed forsterite marbles, calc-silicate rocks and metapsammites, and unretrogressed granulite-faciesmetapelites in Traverse C-2 (Fig. 2b). It should be noted that not all metasomatic diopside layers logged along the traverse contained calcite for
analysis.
the mineralogy of the forsterite and clinohumite marbles origin. Silica solubility in water-rich fluids varies withtemperature and to a lesser extent pressure (Fournier &via reactions (2) and (3) over a 10–200 m length scale
are less than the time-integrated fluid flux required to Potter, 1982). In general, quartz will be precipitated fromsilica-saturated aqueous fluids flowing down temperaturereset oxygen isotopes over the same distances (Table 11).
Therefore, it is not surprising that mineralogically reset, and down pressure (Wood & Walther, 1986; Ferry &but isotopically unreset forsterite and clinohumite marbles Dipple, 1991). Many of the quartz veins are discordantwould be present. In contrast, the time-integrated fluid to the strike of the retrograde zones and locally overprintflux required to form clinozoisite over a given distance already retrogressed rocks, suggesting that they mayin the metamorphosed marls via reaction (7) is com- have formed during cooling after initial, near-isothermalparable with, or larger than, that necessary to infiltration.cause isotopic resetting (Table 11). This is consistent The time-integrated fluid flux necessary to precipitatewith the observation that all mineralogically reset a 1 m2 area of quartz in a vein is given by(clinozoisite-bearing) marls in the retrograde zones arealso isotopically reset (Tables 7 and 8).
qv=VH2O. C −1/VQtz
(∂CSiO2/∂T)p(dT/dz)+(∂CSiO2
/∂P)T(dP/dz)D (iv)
High-temperature quartz veining
(Ferry & Dipple, 1991), where VH2O and VQtz are the molarThe retrograde zones locally contain quartz veins thatvolumes of water and quartz, and CSiO2 is the concentrationcontain complexly intergrown cordierite, sillimanite and
tourmaline, suggesting that they have a high-temperature of aqueous silica in the fluid. VH2O~2·5×10–5 m3/mol at
903
JOURNAL OF PETROLOGY VOLUME 38 NUMBER 7 JULY 1997
650°C and 4 kbar (Labotka, 1991), and VQtz~2·3× and retrogression in the overlying Upper Calcsilicate10–5 m3/mol (Robie et al., 1978). The values of (∂CSiO2/∂T)P Unit is provided by calculations of the volumes of fluidsand (∂CSiO2/∂P)T in pure water at 650°C and 4 kbar were contained within the partial melts (Table 11). We assumecalculated from the experimental studies of Fournier & that: (1) all water necessary to drive retrogression wasPotter (1982) as –2·4×10–5°C–1 and –9·2×10–7 bar–1, re- sourced from the ~500 m thick Pelite Unit that underliesspectively. During retrogression, the occurrence of high- the Upper Calcsilicate Unit; (2) the granulite-facies meta-grade rocks (~650°C) at shallow crustal levels (10–13 km) pelites contained ~15–25% melt by volume with a dis-suggests high vertical thermal gradients (dT/dz) of ~– solved H2O content of ~3–5 wt % ( Johannes & Holtz,0·065 to –0·05°C/m (–65 to –50°C/km). For upwards 1990); and (3) the retrograde zones occupy ~10% of thefluid flow along a lithostatic pressure gradient of –0·27 exposed surface area of the Upper Calcsilicate Unitbar/m (–270 bar/km), the time-integrated fluid flux (q v) (Fig. 2a). If all of this water was exsolved during thevaries between ~7·2×105 m3/m2 (dT/dz~–0·05°C/m) crystallization of segregated partial melts that ponded atand ~5·8×105 m3/m2 (dT/dz~–0·065°C/m; Table 11). the base of the Upper Calcsilicate Unit (Fig. 8) andThese estimates are similar to those of Ferry & Dipple flowed upwards uniformly through the surface area of(1991) for quartz veining in other terrains. the retrograde zones, then the retrograde zones would
The physical situation modelled by Ferry & Dipple record average time-integrated fluid fluxes of ~70–190(1991) involves quartz precipitation during long-distance m3/m2 (Table 11). Locally higher and lower fluid fluxesfluid flow along temperature and pressure gradients. could be recorded in different portions of the retrogradeAdditionally, quartz precipitation within veins may occur zones if fluid flow was finely channelled within them, asowing to local, transient fluid pressure changes associated is suggested by the petrological and stable isotopic evi-with repeated ‘crack-seal’ episodes. However, the mag- dence (see above; also Cartwright & Buick, 1995).nitude of the pressure difference between the vein and It is unlikely that all water dissolved in the pelite-wall rock is constrained by the tensile strength of the derived leucosomes flowed upwards into the retrograderock, which is less than a few hundred bars (Norris & zones. Hence, the calculated fluid fluxes calculated areHenley, 1976). Thus, transient pressure variations will be maxima. Nevertheless, they match fairly well the fluida second-order control on quartz precipitation, compared fluxes necessary to cause mineralogical and stable isotopicwith temperature and pressure decreases along the ver- resetting in the majority of the retrogressed marblestical flow path. (101−102 m3/m2). This suggests that rather than requiring
Alternatively, several studies have suggested that rather the input of large volumes of fluids exotic to the Reynoldsthan being precipitated during long-distance fluid flow, Range Group, the retrograde zones mark pathways ofvein systems may be locally sourced from adjacent rock internal fluid focusing and recycling within the terrain.units through diffusion (Gray et al., 1991; Yardley & Bot- There are few other estimates of fluid fluxes responsibletrell, 1992; Cartwright et al., 1994). Long-distance trans- for retrogression in high-grade terrains. Peters & Wick-port models predict that the solubility of other elements ham (1994) estimated time-integrated fluid fluxes of 30–(notably K) in the fluid will also decrease with decreasing 700 m3/m2, similar to this study, for the non-pervasivetemperature and pressure (Dipple & Ferry, 1992), leading retrogression of upper amphibolite-facies marbles duringto the development of selvedges of micas around the veins. the crystallization of leucogneisses and pegmatites inIn this study, quartz veins that cut metapsammitic rocks the East Humboldt Range, Nevada (USA). The time-are commonly surrounded by biotite-rich selvedges (Fig. integrated fluid flux estimates for retrogression in the6a), suggesting that the fluid that precipitated the quartz Reynolds Range are smaller than those calculated forwas not in equilibrium with the wall rocks, and hence not regional-scale, up-temperature metamorphic fluid flowsourced locally. Therefore, we believe that the mechanism (~104−105 m3/m2; Ferry, 1992; Stern et al., 1992; Legerproposed for quartz veining is realistic, and that the time- & Ferry, 1993; Cartwright et al., 1995), but overlap withintegrated fluid fluxes estimated for quartz precipitation the lower range calculated for fluid–rock interaction inare reasonable. Although the time-integrated fluid flux contact aureoles (q v~102−103 m3/m2; Ferry & Dipple,required to precipitate quartz in the veins is several orders 1991; Davis & Ferry, 1994).of magnitude greater than that necessary to reset the min-eralogy of the marbles throughout the retrograde zones,the quartz veins make up a very small proportion of the
Across-strike fluid flow and overprinting byretrogressed rocks (p1 %), and do not require huge ab-local fluid flow featuressolute fluid volumes for their formation.Over a given length scale, the minimum time-integrated
Fluid available from crystallizing partial melts fluid fluxes recorded by mineralogically and isotopicallyunreset marbles, mineralogically reset but isotopicallyA test of the proposed causal link between crystallization
of partial melts sourced from granulite-facies metapelites unreset marbles, mineralogically and isotopically reset
904
BUICK et al. HIGH-TEMPERATURE RETROGRESSION OF GRANULITE-FACIES MARBLES
marbles and metasomatic calc-silicate rocks increase by Traverse C-3 (Fig. 2b) shows the development of localfeatures superimposed on the general fluid flow pattern.at least three orders of magnitude (Table 11). If significantAt this locality, a clinohumite-in isograd can be mappedacross-strike fluid flow occurred in the retrograde zones,in marble around one of the two-feldspar pegmatiteswith constant time-integrated fluid fluxes we would expect(Figs 6c and 12). The clinohumite probably formed bya transition from metasomatic rocks close to the fluidreaction (3) and occurs only within 4 m of one contactsource, to mineralogically and isotopically reset marbleswith the pegmatite, which may have provided the water-at intermediate distances, to mineralogically reset butrich fluid necessary to drive the reaction. A metasomatic,isotopically unreset rocks, and finally to mineralogicallyalmost monomineralic layer of tremolite (d18O=9·8‰)and isotopically unreset rocks furthest away from theof several centimetres width occurs sporadically alongfluid source. However, in Traverse C-1 (Fig. 10) rocksthe pegmatite–marble contact (Fig. 12). The tremolitethat record low- and high-time-integrated fluid fluxes arelayer probably formed from the marble by the infiltrationnot distributed in this systematic manner. For example,of an aqueous silica-bearing fluid via reaction (9). Iso-isotopically reset marble occurs on either side of iso-topically reset marbles [d18O(Carb)=11·8–13·9‰] occurtopically unreset marble and marl across strike, andfor at least 8 m across strike on either side of the pegmatitemetasomatic clinopyroxene rocks that record very high(d18O=11·8‰; Fig. 12) and are in approximate isotopictime-integrated fluid fluxes are interlayered with un-equilibrium with a fluid derived from the pegmatite.metasomatized marbles that have only been isotopically
If an aqueous fluid flowed across strike from thereset, and thus record moderate time-integrated fluidpegmatite into the dolomitic marble, the time-integratedfluxes. This suggests that fluid flow was channelled parallelfluid flux necessary to displace the clinohumite-producingto the overall strike of the retrograde zones. Cartwrightreaction 4 m away from the marble–pegmatite contact& Buick (1995) also suggested that fluid flow in theis ~3·0 m3/m2 [equation (i)]. For the same time-integratedretrograde zone D was channelled parallel to tectonicfluid flux, equation (ii) predicts that the oxygen isotopestrike based on the juxtaposition of metasomatized, min-front should propagate only ~1·8 m away from theeralogically reset, isotopically reset, and unretrogressedpegmatite. However, the marbles have reset d18O(Carb)calcite-rich marbles on a centimetre scale.values for at least 8 m on either side of the pegmatiteHowever, unlike Traverse C-1, Traverse C-2 (Fig. 11),(Fig. 12). In contrast, the distance that a silica meta-taken ~75 m along strike (Fig. 2b), shows a broad increasesomatism front (K e~120) would be shifted away from thein the oxygen isotope ratios of retrogressed marbles andpegmatite margin is ~2·5 cm, which is similar to themarls on either side of a unit of ~25 m thick retrogressedwidth of the metasomatic tremolite layer. That the lengthmetapsammite. Although no precise isotopic front isscale of isotopic resetting in this traverse is much greaterevident, the distended pattern of isotopic resetting isthan can be accounted for by the amount of fluid neces-somewhat similar to that expected for a component ofsary to shift the mineralogical and metasomatic frontsacross-strike advection, broadened by dispersion, awayfrom the pegmatite–marble contact suggests that resetting
from a channel within, or along the margins of, theof oxygen isotope ratios was unrelated to the emplacement
metapsammite unit. Fluid flow in a channel through the of the pegmatite and the development of the clinohumitemetapsammite layer is unlikely because unaltered and and tremolite. The development of the clinohumite-inretrogressed metapsammites are interlayered within the mineralogical front and the tremolite-in metasomaticunit, suggesting that fluid flow was not pervasive within front at this locality are most probably local effectsit. Additionally, metasomatic diopside-rich layers, which of across-strike flow of fluids sourced locally from theindicate high time-integrated fluid fluxes (Table 11) occur pegmatite, superimposed on larger-scale fluid flow thatthroughout the marbles (Fig. 11). If these layers formed reset the stable isotope ratios.during across-strike fluid flow, then they should be re-stricted to a distance of <1 m on either side of themetapsammite unit. However, they occur at a variety of
d18O(Carb) vs d13C(Carb) trendsdistances from the metapsammite layer, including withinseveral centimetres of isotopically unreset marble (Fig. The trend of d18O(Carb) vs d13C(Carb) values (Fig. 5b)11), again suggesting that fluid flow was channelled is unlike that predicted for fluid infiltration alone. Becauseparallel to tectonic strike. Overall we conclude that fluid of the different volumes of water-rich fluids required toflow in this example was also largely strike parallel. reset C- and O-isotope ratios, both advection–dispersionFluids channelled along lithological layering have been and one-box models predict that the infiltration of water-documented from a number of terrains (Bebout & rich fluids into carbonates will produce L-shaped trendsCarlson, 1986; Jamveit et al., 1992; Cartwright & Buick, on d18O(Carb) vs d13C(Carb) diagrams (Baumgartner &1995) and are predicted from numerical models (Cart- Rumble, 1988) if infiltration does not additionally drive
mineralogical reactions. Changing C contents duringwright & Weaver, 1997).
905
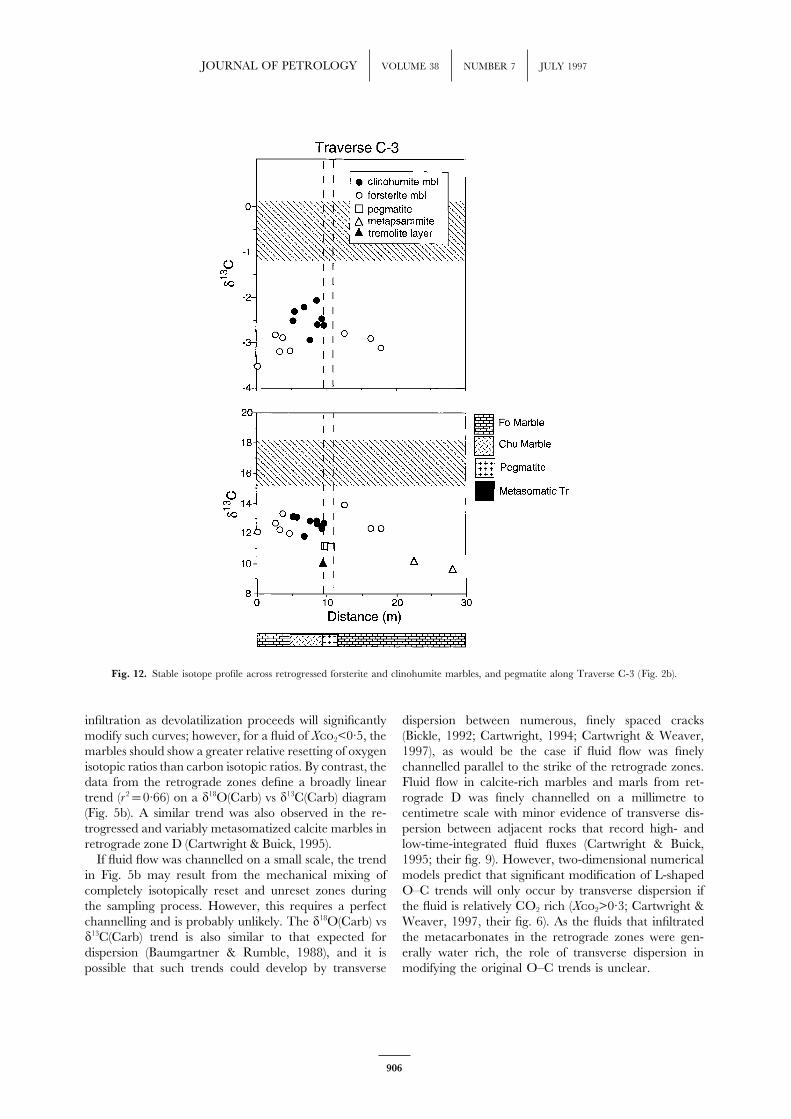
JOURNAL OF PETROLOGY VOLUME 38 NUMBER 7 JULY 1997
Fig. 12. Stable isotope profile across retrogressed forsterite and clinohumite marbles, and pegmatite along Traverse C-3 (Fig. 2b).
infiltration as devolatilization proceeds will significantly dispersion between numerous, finely spaced cracks(Bickle, 1992; Cartwright, 1994; Cartwright & Weaver,modify such curves; however, for a fluid of X2<0·5, the
marbles should show a greater relative resetting of oxygen 1997), as would be the case if fluid flow was finelychannelled parallel to the strike of the retrograde zones.isotopic ratios than carbon isotopic ratios. By contrast, the
data from the retrograde zones define a broadly linear Fluid flow in calcite-rich marbles and marls from ret-rograde D was finely channelled on a millimetre totrend (r 2=0·66) on a d18O(Carb) vs d13C(Carb) diagram
(Fig. 5b). A similar trend was also observed in the re- centimetre scale with minor evidence of transverse dis-persion between adjacent rocks that record high- andtrogressed and variably metasomatized calcite marbles in
retrograde zone D (Cartwright & Buick, 1995). low-time-integrated fluid fluxes (Cartwright & Buick,1995; their fig. 9). However, two-dimensional numericalIf fluid flow was channelled on a small scale, the trend
in Fig. 5b may result from the mechanical mixing of models predict that significant modification of L-shapedO–C trends will only occur by transverse dispersion ifcompletely isotopically reset and unreset zones during
the sampling process. However, this requires a perfect the fluid is relatively CO2 rich (X2>0·3; Cartwright &Weaver, 1997, their fig. 6). As the fluids that infiltratedchannelling and is probably unlikely. The d18O(Carb) vs
d13C(Carb) trend is also similar to that expected for the metacarbonates in the retrograde zones were gen-erally water rich, the role of transverse dispersion indispersion (Baumgartner & Rumble, 1988), and it is
possible that such trends could develop by transverse modifying the original O–C trends is unclear.
906
BUICK et al. HIGH-TEMPERATURE RETROGRESSION OF GRANULITE-FACIES MARBLES
The marbles and marls have also decarbonated ap- (Fig. 4d), and common evidence of late-stage fracture-controlled infiltration (Fig. 4b) in the marbles.preciably during fluid infiltration via reactions (2), (3), (6)
and (7), and have similar d18O vs d13C trends (Fig. 5b). On the basis of SHRIMP zircon U–Pb ages obtainedfrom newly formed zircon in relatively early and lateBoth marbles and marls show a trend of decreasing
d13C values with decreasing wt % carbonate (Fig. 5a), quartz veins from retrograde zone C, Williams et al.(1996) suggested that retrogression occurred over a periodconsistent with infiltration-driven decarbonation having
lowered d13C values (Valley, 1986). Therefore, in addition of ~18 Ma (~5·7×1014 s). If we use this estimate for thetotal duration of retrogression, the Darcy fluxes for fluidto the role of tranverse dispersion, it is possible that the
coupled O–C trends are the result of two other processes; flow over a 200 m path length vary between ~3·9×10–14
m3/m2/s (mineralogically reset but isotopically unresetthe resetting of oxygen isotopes was accomplished by theinfiltration of a low-18O fluid, and at least some lowering forsterite marbles) and 3·5×10–11 m3/m2/s (meta-
somatized wollastonite-rich calc-silicate rocks; Table 12).of carbon isotopes occurred through the progress ofdecarbonation reactions driven by the fluid infiltration. For sub-vertical fluid flow through the retrograde zones
owing to buoyancy, dP/dz~–19 000 Pa/m. Under typicalThe wide scatter of the data in Fig. 5b probably ad-ditionally reflects the superposition of these processes on metamorphic conditions, aqueous fluids have viscosities
of ~10–4 Pa s (Bickle & McKenzie, 1987). Therefore, themetacarbonates that had an originally heterogeneousrange of d18O and d13C values owing to pre-M 2 fluid–rock Darcy fluxes calculated above require time-averaged
intrinsic permeabilities that range from ~2·1×10–22 (min-interaction (Buick & Cartwright, 1996). However, we donot have data on a sufficiently fine scale to further eralogically reset and isotopically unreset forsterite mar-
bles) to ~1·2×10–19 m2 (metasomatized wollastonite-elucidate the relative importance of infiltration-drivendecarbonation and transverse dispersion in generating rich calc-silicate rocks; Table 12) over the duration of
retrograde fluid flow. These estimates fall towards thethe observed d18O vs d13C trends.lower end of the range determined from other studies ofregional or contact metamorphism, or experimentallydetermined in situ (~10–16−10–23 m2; Brace, 1980; Bickle
Spatial variations in Darcy flux and & Baker, 1990b; Baumgartner & Ferry, 1991; Davis &intrinsic permeability Ferry, 1994; Cartwright et al., 1995). It is possible thatFrom Table 11 it is evident that, for any given distance fluid flow did not occur continuously throughout thealong a flow path, mineralogical resetting, isotopic retrogression episode, in which case the intrinsic per-resetting and major element metasomatism require meabilities would be larger.minimum time-integrated fluid fluxes that differ by as For fracture-hosted fluid flow, the width and spacingmuch as three orders of magnitude. If fluid flow on a of fractures required to accommodate fluid flow aresmall scale occurs over a similar period of time, variations related to the intrinsic permeabilities calculated abovein time-integrated fluid fluxes correspond to similar vari- by the relationshipations in actual (Darcy) fluid fluxes. Darcy fluxes (m) arerelated to intrinsic permeability (Ku) via Darcy’s Law: Ku=
a3fs12
(vi)
m=−Ku
g.dP
dz(v) (Walther & Wood, 1984; Cartwright, 1994), where a is
the aperture spacing, f is the fracture density (fracturelength per squared metre of rock), and s is tortuosity(e.g. de Marsily, 1986), where g is the fluid viscosity,
and dP/dz is the fluid pressure gradient. Hence, the (~0·3–0·7 for metamorphic rocks; Walther & Wood,1984; Bickle & Baker, 1990b). For the range of per-difference in time-integrated fluid fluxes inferred above
may reflect variations in intrinsic permeabilities of several meabilities discussed above (~10–22 to 10–19 m2), if micro-cracks were 10 lm (10–5 m) wide, f would equal ~2×10⁻⁶orders of magnitude on the scale of a tens of centimetres
to several metres. Fluid flow may have been along the to 4×10⁻³ m/m2, whereas for 100 lm (10–4 m) widemicrocracks, f would equal ~2×10⁻⁹ to 4×10⁻⁶ m/m2.grain boundaries, especially if permeabilities are en-
hanced by metamorphic reactions. However, it is more These calculations indicate that relatively low fracturedensities are required to permit fluid fluxes of the mag-likely that flow occurred within microcracks (see Ether-
idge et al., 1983). At high fluid pressure, as is likely nitude inferred in the retrograde zones. Regardless ofthe absolute values, inspection of equations (v) and (vi)during retrogression, experimental studies suggest that
microcrack-controlled permeability can be enhanced by indicates that, if fluid flow occurred for similar periodsthroughout the retrograde zones, the order of magnitudeseveral orders of magnitude even with very low strain
deformations (Cox, 1994). There is some evidence of variation in time-integrated fluid fluxes reflects variationsin intrinsic permeabilities that may correlate with micro-fracture-controlled flow at an early stage in the retrograde
history from some of the metasomatic clinopyroxene rocks fracture density.
907
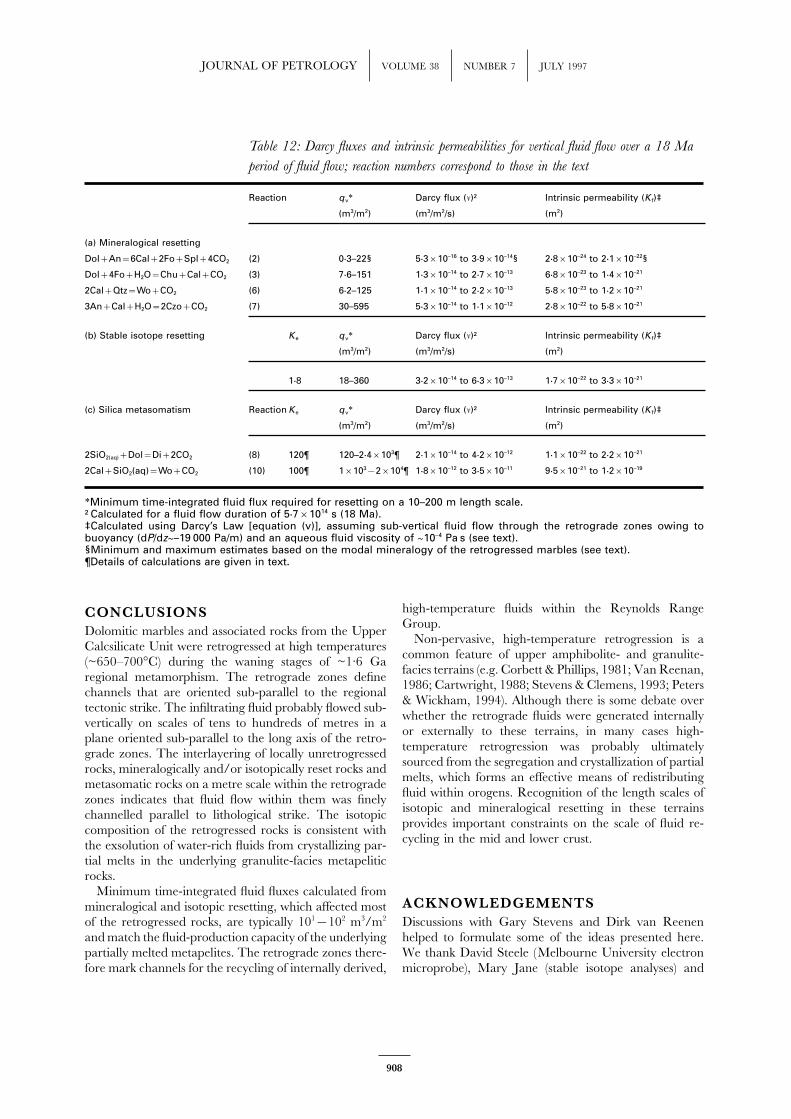
JOURNAL OF PETROLOGY VOLUME 38 NUMBER 7 JULY 1997
Table 12: Darcy fluxes and intrinsic permeabilities for vertical fluid flow over a 18 Ma
period of fluid flow; reaction numbers correspond to those in the text
Reaction qv∗ Darcy flux (m)† Intrinsic permeability (Kf)‡
(m3/m2) (m3/m2/s) (m2)
(a) Mineralogical resetting
Dol+An=6Cal+2Fo+Spl+4CO2 (2) 0·3–22§ 5·3×10–16 to 3·9×10–14§ 2·8×10–24 to 2·1×10–22§
Dol+4Fo+H2O=Chu+Cal+CO2 (3) 7·6–151 1·3×10–14 to 2·7×10–13 6·8×10–23 to 1·4×10–21
2Cal+Qtz=Wo+CO2 (6) 6·2–125 1·1×10–14 to 2·2×10–13 5·8×10–23 to 1·2×10–21
3An+Cal+H2O=2Czo+CO2 (7) 30–595 5·3×10–14 to 1·1×10–12 2·8×10–22 to 5·8×10–21
(b) Stable isotope resetting Ke qv∗ Darcy flux (m)† Intrinsic permeability (Kf)‡
(m3/m2) (m3/m2/s) (m2)
1·8 18–360 3·2×10–14 to 6·3×10–13 1·7×10–22 to 3·3×10–21
(c) Silica metasomatism Reaction Ke qv∗ Darcy flux (m)† Intrinsic permeability (Kf)‡
(m3/m2) (m3/m2/s) (m2)
2SiO2(aq)+Dol=Di+2CO2 (8) 120¶ 120–2·4×103¶ 2·1×10–14 to 4·2×10–12 1·1×10–22 to 2·2×10–21
2Cal+SiO2(aq)=Wo+CO2 (10) 100¶ 1×10³−2×10⁴¶ 1·8×10–12 to 3·5×10–11 9·5×10–21 to 1·2×10–19
∗Minimum time-integrated fluid flux required for resetting on a 10–200 m length scale.†Calculated for a fluid flow duration of 5·7×1014 s (18 Ma).‡Calculated using Darcy’s Law [equation (v)], assuming sub-vertical fluid flow through the retrograde zones owing tobuoyancy (dP/dz~–19 000 Pa/m) and an aqueous fluid viscosity of ~10–4 Pa s (see text).§Minimum and maximum estimates based on the modal mineralogy of the retrogressed marbles (see text).¶Details of calculations are given in text.
high-temperature fluids within the Reynolds RangeCONCLUSIONSGroup.Dolomitic marbles and associated rocks from the Upper
Non-pervasive, high-temperature retrogression is aCalcsilicate Unit were retrogressed at high temperaturescommon feature of upper amphibolite- and granulite-(~650–700°C) during the waning stages of ~1·6 Gafacies terrains (e.g. Corbett & Phillips, 1981; Van Reenan,regional metamorphism. The retrograde zones define1986; Cartwright, 1988; Stevens & Clemens, 1993; Peterschannels that are oriented sub-parallel to the regional& Wickham, 1994). Although there is some debate overtectonic strike. The infiltrating fluid probably flowed sub-whether the retrograde fluids were generated internallyvertically on scales of tens to hundreds of metres in aor externally to these terrains, in many cases high-plane oriented sub-parallel to the long axis of the retro-temperature retrogression was probably ultimatelygrade zones. The interlayering of locally unretrogressedsourced from the segregation and crystallization of partialrocks, mineralogically and/or isotopically reset rocks andmelts, which forms an effective means of redistributingmetasomatic rocks on a metre scale within the retrogradefluid within orogens. Recognition of the length scales ofzones indicates that fluid flow within them was finelyisotopic and mineralogical resetting in these terrainschannelled parallel to lithological strike. The isotopicprovides important constraints on the scale of fluid re-composition of the retrogressed rocks is consistent withcycling in the mid and lower crust.the exsolution of water-rich fluids from crystallizing par-
tial melts in the underlying granulite-facies metapeliticrocks.
Minimum time-integrated fluid fluxes calculated frommineralogical and isotopic resetting, which affected most ACKNOWLEDGEMENTS
Discussions with Gary Stevens and Dirk van Reenenof the retrogressed rocks, are typically 101−102 m3/m2
and match the fluid-production capacity of the underlying helped to formulate some of the ideas presented here.We thank David Steele (Melbourne University electronpartially melted metapelites. The retrograde zones there-
fore mark channels for the recycling of internally derived, microprobe), Mary Jane (stable isotope analyses) and
908
BUICK et al. HIGH-TEMPERATURE RETROGRESSION OF GRANULITE-FACIES MARBLES
Cartwright, I. & Valley, J. W., 1991. Steep oxygen-isotope gradientsJodie Miller (photography). Careful and constructive re-at marble–metagranite contacts in the northwest Adirondack Moun-views by Alasdair Skelton and Simon Harley are gratefullytains, New York, USA: products of fluid-hosted diffusion. Earth andacknowledged. I.S.B. acknowledges an ARC AustralianPlanetary Science Letters 107, 148–163.Research Fellowship, and I.C. acknowledges an ARC
Cartwright, I. & Weaver, T. R., 1997. Two-dimensional patterns ofQueen Elizabeth II Fellowship. This research was sup- metamorphic fluid flow and isotopic resetting in layered and fracturedported by ARC Large Grant A39030662 to I.C. and an rocks. Journal of Metamorphic Geology 15, in press.ARC Small Grant to I.S.B. This is a contribution to IGCP Cartwright, I., Power, W. L., Oliver, N. H. S., Valenta, R. K. &
McLatchie, G. S., 1994. Fluid migration and vein formation duringProject 368 (Proterozoic Events in East Gondwana).deformation and greenschist-facies metamorphism at OrmistonGorge, central Australia. Journal of Metamorphic Geology 12, 373–386.
Cartwright, I., Vry, J. K. & Sandiford, M. J., 1995. Changes instable isotope ratios of metapelites and marbles during regionalREFERENCESmetamorphism, Mount Lofty Ranges, South Australia: implicationsArnold, J. & Sandiford, M., 1990. Petrogenesis of cordierite–for crustal fluid flow. Contributions to Mineralogy and Petrology 120,orthoamphibole assemblages from the Springton region, South Aus-292–310.tralia. Contributions to Mineralogy and Petrology 106, 100–109.
Cartwright, I., Buick, I. S. & Vry, J. K., 1996. Polyphase metamorphicBaumgartner, L. P. & Ferry, J. M., 1991. A model for coupled fluid-fluid flow in the Lower Calcsilicate Unit, Reynolds Range, centralflow and mixed volatile mineral reactions with applications toAustralia. Precambrian Research 77, 211–229.regional metamorphism. Contributions to Mineralogy and Petrology 106,
Chacko, T., Mayeda, T. K., Clayton, R. N. & Goldsmith, J. R., 1991.273–285.Oxygen and carbon isotope fractionations between CO2 and calcite.Baumgartner, L. P. & Rumble, D., 1988. Transport of stable isotopes:
1. Development of a kinetic continuum theory for stable isotope Geochimica et Cosmochimica Acta 55, 2867–2882.transport. Contributions to Mineralogy and Petrology 98, 417–430. Chiba, H., Chacko, T., Clayton, R. N. & Goldsmith, J., 1989. Oxygen
Bebout, G. E. & Carlson, W. D., 1986. Fluid evolution and transport isotope fractionations involving diopside, forsterite, magnetite, andduring metamorphism: evidence from the Llano Uplift, Texas. calcite: application to geothermometry. Geochimica et Cosmochimica
Contributions to Mineralogy and Petrology 92, 518–529. Acta 53, 2985–2995.Bickle, M. J., 1992. Transport mechanisms by fluid-flow in metamorphic Clayton, R. N. & Mayeda, T. K., 1963. The use of bromine penta-
rocks: oxygen and strontium decoupling in the Trois Seigneurs fluoride in the extraction of oxygen from oxides and silicates forMassif—a consequence of kinetic dispersion. American Journal of Science isotopic analysis. Geochimica et Cosmochimica Acta 27, 43–52.292, 289–316. Collins, W. J. & Williams, I. S., 1995. SHRIMP ionprobe dating of
Bickle, M. J. & Baker, J. M., 1990a. Migration of reaction and isotopic short-lived Proterozoic tectonic cycles in the northern Arunta Inlier,fronts in infiltration zones; assessments of fluid fluxes in metamorphic central Australia. Precambrian Research 71, 69–89.terrains. Earth and Planetary Science Letters 98, 1–13. Corbett, G. J. & Phillips, G. N., 1981. Regional metamorphism of a
Bickle, M. J. & Baker, J. M., 1990b. Advective–diffusive transport of high grade terrain: the Willyama complex, Broken Hill, Australia.isotopic fronts: an example from Naxos, Greece. Earth and Planetary Lithos 14, 59–79.Science Letters 97, 78–93. Cox, S. F., 1994. Deformation controls on the dynamics of fluid
Bickle, M. J. & McKenzie, D., 1987. The transport of heat and matter migration and ore genesis in metamorphic environments. Geologicalby fluids during metamorphism. Contributions to Mineralogy and Petrology
Society of Australia Abstracts 37.95, 384–392. de Marsily, G., 1986. Quantitative Hydrogeology. San Diego: Academic
Brace, W. F., 1980. Permeability of crystalline and argillaceous rocks. Press, pp. 1–440.International Journal of Rock Mechanics and Mineral Science 17, 241–251.
Davis, S. R. & Ferry, J. M., 1994. Fluid infiltration during contactBuick, I. S. & Cartwright, I., 1996. Fluid/rock interaction during low-
metamorphism of interbedded marble and calc-silicate hornfels,pressure polymetamorphism of the Reynolds Range Group, central
Twin Lakes area, central Sierra Nevada, California. Journal of Meta-Australia. Journal of Petrology 37, 1097–1124.
morphic Geology 11, 71–88.Buick, I. S., Cartwright, I. & Harley, S. L., 1997a. The retrogradeDipple, G. M. & Ferry, J. M., 1992. Metasomatism and fluid flow in
P–T–t path for low-pressure granulites from the Reynolds Range,ductile fault zones. Contributions to Mineralogy and Petrology 112, 149–164.central Australia: petrological constraints and implications for LP/
Dirks, P. H. G. M., 1990. Intertidal and subtidal sedimentation duringHT metamorphism. Journal of Metamorphic Geology (submitted).a mid-Proterozoic marine transgression, Reynolds Range Group,Buick, I. S., Frei, R. & Cartwright, I., 1997b. The timing of high-Arunta Block, central Australia. Australian Journal of Earth Science 37,temperature retrogression in the Reynolds Range, central Australia:409–422.constraints from single mineral Pb–Pb dating. Contributions to Min-
Dirks, P. H. G. M. & Wilson, C. J. L., 1990. The geological evolutioneralogy and Petrology (submitted).of the Reynolds Range, central Australia: evidence for three distinctCartwright, I., 1988. Crystallization of melts, pegmatite intrusion andstructural–metamorphic cycles. Journal of Structural Geology 12, 651–the Iverian retrogression of the Scourian complex, north-west Scot-665.land. Journal of Metamorphic Geology 6, 77–93.
Dirks, P. H. G. M., Hand, M. & Powell, R., 1991. The P–T deformationCartwright, I., 1994. The two-dimensional pattern of metamorphicpath for a mid-Proterozoic, low-pressure terrane: the Reynoldsfluid flow at Mary Kathleen, Australia: fluid focusing, transverseRange, central Australia. Journal of Metamorphic Geology 9, 641–661.dispersion, and implications for modelling fluid flow. American Min-
Duffy, C. J. & Greenwood, H. J., 1979. Phase equilibria in the systemeralogist 79, 526–535.MgO–MgF2–SiO2–H2O. American Mineralogist 64, 1156–1174.Cartwright, I. & Buick, I. S., 1995. Formation of wollastonite-bearing
Etheridge, M. A., Wall, V. J. & Vernon, R. H., 1983. The role of themarbles during late-regional metamorphic channelled fluid flow influid phase during regional metamorphism and deformation. Journalthe Upper Calcsilicate Unit, Reynolds Range Group, central Aus-
tralia. Journal of Metamorphic Geology 13, 397–418. of Metamorphic Geology 1, 205–226.
909
JOURNAL OF PETROLOGY VOLUME 38 NUMBER 7 JULY 1997
Ferry, J. W., 1992. Regional metamorphism of the Waits River for- a Barrovian metamorphic terrain, Vermont, USA. Contributions to
Mineralogy and Petrology 112, 475–489.mation, Eastern Vermont: delineation of a new type of giant hy-drothermal system. Journal of Petrology 33, 45–94. Stevens, G. & Clemens, J. D., 1993. Fluid-absent melting and the roles
of fluids in the lithosphere: a slanted summary? Chemical Geology 108,Ferry, J. W. & Dipple, G. M., 1991. Models for coupled fluid flow,mineral reaction and isotopic alteration during contact meta- 1–17.
Stevens, G., Clemens, J. D. & Droop, G. T., 1997. Melt productionmorphism: the Notch Peak aureole, Utah. American Mineralogist 77,577–591. during granulite-facies anatexis: experimental data from ‘primitive’
metasedimentary protoliths. Contributions to Mineralogy and Petrology (inFournier, R. O. & Potter, I., 1982. An equation correlating the solubilityof quartz in water from 25°C to 900°C at pressures up to 10,000 press).
Stewart, A. J., Offe, L. A., Glikson, A. J. & Warren, R. G., 1981. Thebars. Geochimica et Cosmochimica Acta 46, 1969–1973.Gray, D. R., Gregory, R. T. & Durney, D. W., 1991. Rock-buffered geology of the Reynolds Range region, Northern Territory, Australia,
1:100 000 Geological Map Series. Canberra, A.C.T.: Australianfluid–rock interaction in deformed quartz-rich turbidite sequences,eastern Australia. Journal of Geophysical Research 96, 19681–19704. Bureau of Mineral Resources, Geology and Geophysics.
Valley, J. W., 1986. Stable isotope geochemistry of metamorphic rocks.Hand, M. & Dirks, P. H. G. M., 1991. The influence of deformationon the formation of axial-planar leucosomes and the segregation of In: Valley, J. W., Taylor, H. P. & O’Neil, J. R. (eds) Stable Isotopes
in High Temperature Geological Processes. Mineralogical Society of America,small melt bodies within the migmatitic Napperby Gneiss, centralAustralia. Journal of Structural Geology 14, 591–604. Reviews in Mineralogy 16, 445–490.
Van Reenen, D. D., 1986. Hydration of cordierite and hyperstheneHoefs, J., 1987. Stable Isotope Geochemistry, 3rd edn. Minerals and Rocks 9.Berlin: Springer-Verlag, pp. 1–241. and a description of the retrograde orthoamphibole isograd. American
Mineralogist 71, 900–915.Holland, T. J. B. & Powell, R., 1990. An enlarged and updatedinternally consistent thermodynamic dataset with uncertainties and Vennemann, T. & Stuart-Smith, H., 1992. Stable isotope profile across
the orthoamphibole isograd in the Southern Marginal Zone of thecorrelations: the system K2O–Na2O–CaO–MgO–MnO–FeO–Fe2O3–Al2O3–TiO2–SiO2–C–H2–O2. Journal of Metamorphic Geo- Limpopo Belt, South Africa. Precambrian Research 55, 365–397.
Vry, J. K. & Cartwright, I., 1994. Sapphirine–kornerupine rocks fromlogy 8, 89–124.Jamveit, B., Bucher-Nurminen, K. & Stijfhoorn, D., 1992. Contact the Reynolds Range, central Australia: constraints on the uplift
history of a Proterozoic low pressure terrain. Contributions to Mineralogymetamorphism of layered shale–carbonate sequences in the OsloRift: I. Buffering, infiltration, and the mechanisms of mass transport. and Petrology 116, 78–91.
Vry, J. K., Compston, W. & Cartwright, I., 1996. SHRIMP II datingJournal of Petrology 33, 377–422.Johannes, W. & Holtz, F., 1990. Formation and composition of H2O- of zircons and monazites: reassessing the timing of high-grade
metamorphism and fluid flow in the Reynolds Range, northernundersaturated granitic melts. In: Ashworth, J. R. & Brown, M.(eds) High-temperature Metamorphism and Crustal Anatexis. The Mineralogical Arunta Block, Australia. Journal of Metamorphic Geology 14, 335–350.
Walther, J. V. & Wood, B. J., 1984. Rate and mechanisms in progradeSociety Series 2. London: Unwin Hyman, pp. 87–104.Kretz, R., 1983. Symbols for rock-forming minerals. American Mineralogist metamorphism. Contributions to Mineralogy and Petrology 88, 246–259.
Waters, D. J., 1988. Partial melting and the formation of granulite68, 277–279.Labotka, T. C., 1991. Chemical and physical properties of fluids. In: facies assemblages in Namaqualand, South Africa. Journal of Meta-
morphic Geology 6, 387–404.Kerrick, D. M. (ed.) Contact Metamorphism. Mineralogical Society of
America, Reviews in Mineralogy 26, 43–104. Williams, I. S., Buick, I. S. & Cartwright, I., 1996. An extended episodeof early Mesoproterozoic metamorphic fluid flow in the ReynoldsLeger, A, & Ferry, J. M., 1993. Fluid infiltration and regional meta-
morphism of the Waits River Formation, north-east Vermont, USA. Range, central Australia. Journal of Metamorphic Geology 14, 29–47.Wood, B. J. & Walther, J. V., 1986. Fluid flow during metamorphismJournal of Metamorphic Geology 11, 3–30.
McCrea, J. M., 1950. On the isotope chemistry of carbonates and a and its implications for fluid–rock ratios. In: Walther, J. V. & Wood,B. J. (eds) Fluid–Rock Interactions During Metamorphism. Berlin: Springer-paleotemperature scale. Journal of Chemical Physics 18, 849–857.
Norris, R. J. & Henley, R. W., 1976. Dewatering of a metamorphic Verlag, pp. 89–108.Wyllie, P. J., 1983. Experimental studies on biotite- and muscovite-pile. Geology 4, 333–336.
Peters, M. T. & Wickham, S. M., 1994. Petrology of upper amphibolite bearing granites and some crustal magmatic sources. In: Atherton,M. P. & Gribble, C. D (eds) Migmatites, Melting, and Metamorphism.facies marbles from the East Humboldt Range, Nevada, USA;
evidence for high-temperature, retrograde, hydrous volatile fluxes Nantwich, UK: Shiva, pp. 12–26.Yardley, B. W. D. & Bottrell, S. H., 1992. Silica mobility and fluidat mid-crustal levels. Journal of Petrology 35, 205–238.
Robie, R. A., Hemingway, B. S. & Fisher, J. R., 1978. Thermodynamic movement during metamorphism of the Connemara schists, Ireland.Journal of Metamorphic Geology 10, 453–464.properties of minerals and related substances at 298·15 K and 1 bar
(105 pascals) pressure and higher temperatures. US Geological Survey Young, E. D. & Morrison, J., 1992. Relations among net-transferreaction progress, 18O–13C depletion and fluid infiltration in aBulletin 1452, 456 pp.
Sheppard, S. M. F. & Schwarcz, H. P., 1970. Fractionation of carbon clinohumite-bearing marble. Contributions to Mineralogy and Petrology
111, 391–408.and oxygen isotopes and magnesium between metamorphic calciteand dolomite. Contributions to Mineralogy and Petrology 26, 161–198. Zheng, Y.-F., 1993. Calculation of oxygen isotope fractionation in
hydroxyl-bearing silicates. Earth and Planetary Science Letters 120, 247–Stern, L. A., Chamberlain, C. P., Barnett, D. E. & Ferry, J. M.,1992. Stable isotope evidence for regional-scale fluid migration in 263.
910
Related Documents