e University of Maine DigitalCommons@UMaine Electronic eses and Dissertations Fogler Library 2007 High Temperature Compression Testing of Monolithic Silicon Carbide (SiC) Adam L. McNaughton Follow this and additional works at: hp://digitalcommons.library.umaine.edu/etd Part of the Mechanical Engineering Commons is Open-Access esis is brought to you for free and open access by DigitalCommons@UMaine. It has been accepted for inclusion in Electronic eses and Dissertations by an authorized administrator of DigitalCommons@UMaine. Recommended Citation McNaughton, Adam L., "High Temperature Compression Testing of Monolithic Silicon Carbide (SiC)" (2007). Electronic eses and Dissertations. 270. hp://digitalcommons.library.umaine.edu/etd/270

Welcome message from author
This document is posted to help you gain knowledge. Please leave a comment to let me know what you think about it! Share it to your friends and learn new things together.
Transcript

The University of MaineDigitalCommons@UMaine
Electronic Theses and Dissertations Fogler Library
2007
High Temperature Compression Testing ofMonolithic Silicon Carbide (SiC)Adam L. McNaughton
Follow this and additional works at: http://digitalcommons.library.umaine.edu/etd
Part of the Mechanical Engineering Commons
This Open-Access Thesis is brought to you for free and open access by DigitalCommons@UMaine. It has been accepted for inclusion in ElectronicTheses and Dissertations by an authorized administrator of DigitalCommons@UMaine.
Recommended CitationMcNaughton, Adam L., "High Temperature Compression Testing of Monolithic Silicon Carbide (SiC)" (2007). Electronic Theses andDissertations. 270.http://digitalcommons.library.umaine.edu/etd/270

HIGH TEMPERATURE COMPRESSION TESTING OF
MONOLITHIC SILICON CARBIDE (SiC)
By
Adam L. McNaughton
B.S. University of Maine, 2005
A THESIS
Submitted in Partial Fulfillment of the
Requirements for the Degree of
Master of Science
(in Mechanical Engineering)
The Graduate School
The University of Maine
August, 2007
Advisory Committee:
Vincent Caccese, Associate Professor of Mechanical Engineering, Advisor
Donald A. Grant, R. C. Hill Professor and Chairman of Mechanical Engineering
Michael L. Peterson, Professor of Mechanical Engineering

LIBRARY RIGHTS STATEMENT
In presenting this thesis in partial fulfillment of the requirements for an advanced
degree at The University of Maine, I agree that the Library shall make it freely available
for inspection. I further agree that permission for “fair use” copying of this thesis for
scholarly purposes may be granted by the Librarian. It is understood that any copying or
publication of this thesis for financial gain shall not be allowed without my written
permission.
Signature:
Date:

HIGH TEMPERATURE COMPRESSION TESTING OF
MONOLITHIC SILICON CARBIDE (SiC)
By Adam L. McNaughton
Thesis Advisor: Dr. Vincent Caccese
An Abstract of the Thesis Presented in Partial Fulfillment of the Requirements for the
Degree of Master of Science (in Mechanical Engineering)
August, 2007
High temperature compression tests were administered in an oxidizing atmosphere on a
commercially available monolithic (un-reinforced) reaction bonded silicon carbide (RB-
SiC) and an in-house processed silicon carbide based on a pre-ceramic polymer
precursor. Ceramics such as silicon carbide have exceptional mechanical properties for
both structural and thermal load applications. High tolerance specimen preparation via
diamond wheel cutting and grinding to allow for compression testing on both types of
silicon carbide ceramic at temperatures ranging from 20°C (68°F) to 1000°C (1832°F) is
also addressed. Two types of specimen geometry were chosen due to the high strength
and high stiffness of silicon carbide materials. A reduced gage section specimen
geometry, often referred to as a dumbbell shaped geometry, and a constant cross section
rectangular prism shaped specimen were used in a direct end loading compression test
using custom machined ceramic fixtures. To allow for minimal failure of the custom
ground silicon carbide load platens, the dumbbell shaped specimens were loaded to
ultimate failure, which in many cases was a brittle, high energy release failure, whereas
the constant cross section specimens were loaded only to retrieve strain data for
calculation of the specimen compressive modulus of elasticity. In-house processed
specimens were tested using only the rectangular prism specimen geometry, due to their
lower strength and stiffness; which did not require a dumbbell geometry.
Results from compressive testing in an oxidizing (air) atmosphere demonstrate both
silicon carbide types, commercial and in-house processed, had significant strength and
stiffness dependence on temperature. Failure modes for the commercial grade allowed
for a brittle, pulverizing failure at temperatures up to 600°C (1112°F), with a yielding and
plastic deformation failure mode at temperatures ranging from 800-1000°C (1472-
1832°F), where the in-house grade only pulverized upon failure. Average compressive
strength and modulus of elasticity for the commercial grade ranged from 346 ksi (2385
MPa) and 34.9 msi (241 GPa) at room temperature, respectively, to 88.3 ksi (608 MPa)
and 12.4 msi (85 GPa) at 1000°C (1832°F). Density of the reaction bonded commercial
grade silicon carbide specimens was consistent at 3.00 g/cm3. For the in-house processed
grade, lower strength and stiffness data resulted from testing, due to the porosity of the
material and due to flaws and imperfections in the form of cracks from processing.
Density of the processed silicon carbide ranged from 2.41 g/cm3 to 2.57 g/cm3. Average
compressive strength and modulus of elasticity for the in-house grade ranged from 109.1
ksi (752 MPa) and 25.6 msi (177 GPa) at room temperature, respectively, to 80.6 ksi (556
MPa) and 9.93 msi (69 GPa) at 1000°C (1832°F), respectively.

ii
ACKNOWLEDGEMENTS
The author would like to acknowledge the sponsorship of Maine Monolite, LLC of
Topsham, ME, under the leadership of Mr. Anthony Burich, Mr. Chris Hendricks and the
late Mr. Ronald Huegli, partially through Mobile-TIPSS contract number N61339-03-D-
0300-0113, sponsored by the U.S. Army Tank and Automotive Command (TACOM).
The author would also like to thank his advisor, Dr. Vincent Caccese, for his support and
suggestions throughout the project, as well as his thesis committee, Dr. Donald Grant and
Dr. Michael Peterson. The assistance of Arthur Pete as coordinator of Crosby Laboratory
is appreciated as well.
The author would also like to give thanks to the support of the Advanced Manufacturing
Center on the project under direction of Thomas Christensen, Steve Rioux and Brian
Barker and undergraduates Tom Lamontange, Tom Stukas and Parker Eason. Also,
undergraduate work in the Hybrid Structures Laboratory by Ken West, Radek Glaser and
Brendan Owen is greatly appreciated.
Finally, the author would like to thank his wife, Lindsay, and his parents and in-laws for
their enduring support throughout the project.

iii
TABLE OF CONTENTS
ACKNOWLEDGEMENTS................................................................................................ ii
LIST OF TABLES............................................................................................................. vi
LIST OF FIGURES .......................................................................................................... vii
Chapter 1. OVERVIEW ...................................................................................................................1
1.1. Motivation................................................................................................................1
1.2. Objective and Scope of Work ..................................................................................2
1.3. Literature Review.....................................................................................................3
1.3.1. Applications for Silicon Carbide Materials ................................................... 3
1.3.2. Material Properties......................................................................................... 6
1.3.2.1. Property Comparison ............................................................................... 6
1.3.2.2. Oxidation Resistance ............................................................................. 12
1.3.3. Processing Options of SiC Materials ........................................................... 15
1.3.3.1. Hot Press / Sintering .............................................................................. 17
1.3.3.2. Chemical Vapor Deposition/Infiltration (CVD/CVI) ............................ 19
1.3.3.3. Reaction Bonding/Forming.................................................................... 19
1.3.3.4. Powder Injection Molding (PIM)........................................................... 20
1.3.3.5. Successes with Ceramic Injection Molding........................................... 21
1.3.3.6. Injection Molding with Pre-Ceramic Polymer Precursors..................... 22
1.3.3.7. Combinational Methods......................................................................... 25
1.3.4. Polycarbosilane Based Pre-Ceramic Polymer Precursors............................ 25
1.3.5. Curing and Pyrolysis Options for Preceramic Polymers ............................. 28
1.3.6. Other Options for High Temperature Materials........................................... 31
1.4. Mechanical Testing Methods.................................................................................35
1.4.1. Experimental Approaches to Compression Testing..................................... 35
1.4.2. ASTM C773................................................................................................. 37
1.4.3. ASTM C1424............................................................................................... 38

iv
2. EXPERIMENTAL APPARATUS AND PROCEDURES...........................................41
2.1. AHPCS Specimen Processing................................................................................41
2.2. Specimen Preparation ............................................................................................44
2.2.1. Reaction Bonded SiC Specimens................................................................. 44
2.2.2. AHPCS SiC Specimens ............................................................................... 54
2.3. Compression Testing Equipment...........................................................................57
2.3.1. MTS 653 Furnace and Temperature Control Equipment ............................ 57
2.3.1.1. MTS 653 Furnace .................................................................................. 58
2.3.1.2. Electrical and Wiring ............................................................................. 59
2.3.1.3. Data Acquisition .................................................................................... 60
2.3.1.4. Temperature Control Program (Autoclave) ........................................... 61
2.3.1.5. Control Algorithm.................................................................................. 64
2.3.1.6. Calibration.............................................................................................. 69
2.3.2. MTS 810 Hydraulic Actuator with FlexTest SE.......................................... 72
2.3.2.1. Fixtures .................................................................................................. 73
2.3.2.2. High Temperature Extensometer ........................................................... 75
3. MECHANICAL PROPERTIES OF SILICON CARBIDE..........................................78
3.1. Processing of AHPCS Specimens..........................................................................78
3.2. Compression Tests .................................................................................................81
3.2.1. Reaction Bonded Silicon Carbide................................................................ 85
3.2.2. AHPCS Silicon Carbide............................................................................... 96
3.3. Oxidation Tests ....................................................................................................107
3.3.1. Reaction Bonded Silicon Carbide.............................................................. 107
3.3.2. AHPCS Silicon Carbide............................................................................. 108
4. CONCLUSIONS.........................................................................................................113
4.1. Discussion............................................................................................................113
4.2. Future Work .........................................................................................................118

v
REFERENCES ................................................................................................................121
APPENDICES .................................................................................................................125
Appendix A: Compression Test Data .........................................................................126
Appendix B: Oxidation Test Results...........................................................................133
Appendix B.1. Reaction Bonded Silicon Carbide Specimens (RB-SiC) Data.......133
Appendix B.2. AHPCS Based Silicon Carbide Data .............................................133
Appendix C: Procedures .............................................................................................135
Appendix C.1. AHPCS Specimen Preparation ......................................................135
Appendix C.2. Procedure for MTS 810 and FlexTest SE......................................137
Appendix C.3. Procedure for bonding alumina and silicon carbide fixtures .........139
Appendix C.4. Procedure for High Temperature Compression Tests....................141
Appendix D: Relay Box Wiring Schematic ................................................................144
Appendix E: Temperature Computer Program Code (Autoclave)..............................145
Appendix F: Technical Drawings for Mold Pieces.....................................................160
Appendix G: Technical Drawings for Dumbbell Shape Specimens...........................162
Appendix H: Compression Test Results .....................................................................163
BIOGRAPHY OF THE AUTHOR..................................................................................194
vi
LIST OF TABLES
Table 1.1: Property Comparison of Ceramics and Metallic Alloys.....................................7
Table 1.2: Typical Physical Properties of Sintered Alpha SiC............................................8
Table 1.3: Elastic Modulus of Reaction Bonded SiC (Kraft, 1976) ..................................10
Table 1.4: Ceramic suspension compositions....................................................................24
Table 1.5: Conversion of Polycarbosilane to SiC..............................................................24
Table 2.1: Times allocated for high temperature tests.......................................................62
Table 3.1: Room Temperature RB-SiC Compression Proof Test Data Summary ............87
Table 3.2: Room Temperature RB-SiC Compression Proof Test Statistics ......................87
Table 3.3: Average compression test results summary, reaction bonded specimens ........89
Table 3.4: AHPCS specimen room temperature compression test data ..........................100
Table 3.5: AHPCS specimen high temperature compression test data............................103
Table 3.6: Oxidation Results for RB-SiC specimens.......................................................107
Table 3.7: Properties of AHPCS specimens, pyrolysis at 1100°C (2012°F)...................109
Table 3.8: Properties of AHPCS specimens due to oxidation at 1000°C (1832°F).........111
Table 4.1: Percentage strength and modulus of AHPCS compared with RB-SiC...........117
Table A.1: Reaction Bonded Silicon Carbide (RB-SiC) Specimen Data ........................127
Table A.2: AHPCS Silicon Carbide Specimen Data .......................................................130
Table E.1: SetPointDataForm Computer Code................................................................145
Table E.2: SetPoint Computer Code................................................................................149

vii
LIST OF FIGURES Figure 1.1: Flexure Strength of Sintered α-SiC (Coppola, et al., 1978) ..............................9
Figure 1.2: Sintered and Reaction Bonded SiC Flexural Strength (Kraft, 1976) ..............11
Figure 1.3: Logarithmic Oxidation Rate of α-SiC (Coppola, et. al., 1978) .......................14
Figure 1.4: Phase Diagram for SiC....................................................................................16
Figure 1.5: Polycarbosilane Chemical Reaction Forming SiC (Brown, 2000)..................27
Figure 1.6: Thermogravimetric loss of: i, wax; ii, polycarbosilane; iii, wax +
polycarbosilane in weight ratio 1:4; iv, theoretical curve for the mixture
(Zhang, 1991)...............................................................................................................28
Figure 1.7: Typical Load Train for ASTM C773 ..............................................................38
Figure 1.8: Typical reduced gage section (dumbbell) specimen, ASTM C1424-04 .........39
Figure 2.1: Process Flow Chart for Manufacturing AHPCS Specimens ...........................42
Figure 2.2: Photograph of MK 470 Wet Saw with cutting fixture ....................................46
Figure 2.3: Photograph of Cut Specimen Removed From Fixture ....................................47
Figure 2.4: Failed silicon carbide platen............................................................................49
Figure 2.5: Failed alumina (fully fired) platen...................................................................49
Figure 2.6: Technical drawing of dumbbell shape specimen ............................................51
Figure 2.7: Profiled grinding wheel dimensions................................................................52
Figure 2.8: Okamoto grinder used to grind reaction bonded specimens ...........................52
Figure 2.9: Dumbbell shaped reaction bonded silicon carbide specimen..........................53
Figure 2.10: Photograph of South Bay Technology Wet Saw...........................................55
Figure 2.11: Schematic of Furnace and Temperature Control Equipment ........................57
Figure 2.12: Heating elements and thermocouples............................................................58
Figure 2.13: Furnace electrical box ...................................................................................59
Figure 2.14: Furnace electrical box interior view..............................................................60
Figure 2.15: Temperature vs. time profile for high temperature compression tests ..........62
Figure 2.16: Autoclave Input Temperature File ................................................................63
Figure 2.17: Autoclave Control Front End User Interface ................................................64
Figure 2.18: PI Gain Control Parameters...........................................................................67
Figure 2.19 Furnace Calibration using HH506RA Thermometer .....................................71
Figure 2.20: Schematic of High Temperature Compression Test Setup ...........................72

viii
Figure 2.21: Furnace and Fixtures Assembled on MTS 810 (W/O SiC Platens) ..............73
Figure 2.22: Silicon carbide and alumina fixtures prior to bonding in place ....................74
Figure 2.23: High Temperature Extensometer...................................................................75
Figure 2.24: Photograph of fixtures and high temperature extensometer..........................76
Figure 2.25: Photograph of furnace assembly with extensometer and cooling
fixtures .........................................................................................................................77
Figure 3.1: Specimen (I22) in the 400°C cured state from injection molding...................79
Figure 3.2: Specimen Batch 2 in the 400°C cured state from injection molding
process after sanding rough surfaces ...........................................................................79
Figure 3.3: Specimen Batch 2 in 400°C cured state from the injection molding
process, after cutting and sanding to shape..................................................................80
Figure 3.4: Processed specimens at the pyrolyzed 850°C state (Batch 2) ........................81
Figure 3.5: Comparison of RB-SiC and AHPCS specimens, strength vs.
temperature ..................................................................................................................83
Figure 3.6: Comparison of RB-SiC and AHPCS specimens, modulus vs.
temperature ..................................................................................................................84
Figure 3.7: Example shear failure of a reaction bonded specimen with comparison
to original dumbbell shape...........................................................................................85
Figure 3.8: RB-SiC-RT-02 Compressive Response ..........................................................86
Figure 3.9: Failure of alumina rods and silicon carbide load platens, RB-SiC-RT-
10..................................................................................................................................91
Figure 3.10: Failure strength of RB-SiC specimens as a function of temperature ............92
Figure 3.11: Modulus of RB-SiC specimens as a function of temperature .......................92
Figure 3.12: Modulus of reaction bonded specimens at room temperature.......................94
Figure 3.13: Modulus of reaction bonded specimens at 600°C (1112°F) .........................94
Figure 3.14: Modulus of reaction bonded specimens at 800°C (1472°F) .........................95
Figure 3.15: Modulus of reaction bonded specimens at 1000°C (1832°F) .......................95
Figure 3.16: AHPCS specimens (I6 group) before testing ................................................98
Figure 3.17: AHPCS specimen compressive-shear failure (AHPCS-RT-I6-05)...............99
Figure 3.18: Typical stress-strain plot, AHPCS-RT-06-01 .............................................101
Figure 3.19: Failure Strength of AHPCS specimens as a function of temperature .........104

ix
Figure 3.20: Modulus of AHPCS specimens as a function of temperature .....................104
Figure 3.21: Modulus of Trial I8 AHPCS specimens at room temperature ....................105
Figure 3.22: Modulus of AHPCS specimens at 600°C (1112°F) ....................................105
Figure 3.23: Modulus of AHPCS specimens at 800°C (1472°F) ....................................106
Figure 3.24: Modulus of AHPCS specimens at 1000°C (1832°F) ..................................106
Figure 3.25: AHPCS specimen surface area oxidation versus time ................................112
Figure A.1: Dumbbell Shape Specimen Geometry..........................................................126
Figure A.2: Rectangular Prism Shape Specimen Geometry............................................126
Figure H.1: RB-SiC-RT-01..............................................................................................163
Figure H.2: RB-SiC-RT-02..............................................................................................163
Figure H.3: RB-SiC-RT-03..............................................................................................164
Figure H.4: RB-SiC-RT-04..............................................................................................164
Figure H.5: RB-SiC-RT-05..............................................................................................165
Figure H.6: RB-SiC-RT-06..............................................................................................165
Figure H.7: RB-SiC-RT-10..............................................................................................166
Figure H.8: RB-SiC-RT-13-E..........................................................................................166
Figure H.9: RB-SiC-RT-14-E..........................................................................................167
Figure H.10: RB-SiC-RT-15-E........................................................................................167
Figure H.11: RB-SiC-RT-16-E........................................................................................168
Figure H.12: RB-SiC-HT-01 ...........................................................................................168
Figure H.13: RB-SiC-HT-02 ...........................................................................................169
Figure H.14: RB-SiC-600-01...........................................................................................169
Figure H.15: RB-SiC-600-02...........................................................................................170
Figure H.16: RB-SiC-600-03...........................................................................................170
Figure H.17: RB-SiC-600-04...........................................................................................171
Figure H.18: RB-SiC-600-05...........................................................................................171
Figure H.19: RB-SiC-600-06-E.......................................................................................172
Figure H.20: RB-SiC-600-07-E.......................................................................................172
Figure H.21: RB-SiC-600-08-E.......................................................................................173
Figure H.22: RB-SiC-600-09-E.......................................................................................173
Figure H.23: RB-SiC-800-01...........................................................................................174
x
Figure H.24: RB-SiC-800-04...........................................................................................174
Figure H.25: RB-SiC-800-05...........................................................................................175
Figure H.26: RB-SiC-800-06-E.......................................................................................175
Figure H.27: RB-SiC-800-07-E.......................................................................................176
Figure H.28: RB-SiC-800-08-E.......................................................................................176
Figure H.29: RB-SiC-1000-01.........................................................................................177
Figure H.30: RB-SiC-1000-02.........................................................................................177
Figure H.31: RB-SiC-1000-03.........................................................................................178
Figure H.32: RB-SiC-1000-04-E.....................................................................................178
Figure H.33: RB-SiC-1000-05-E.....................................................................................179
Figure H.34: RB-SiC-1000-06-E.....................................................................................179
Figure H.35: AHPCS-RT-I5-01.......................................................................................180
Figure H.36: AHPCS-RT-I5-02.......................................................................................180
Figure H.37: AHPCS-RT-I5-03.......................................................................................181
Figure H.38: AHPCS-RT-I5-04.......................................................................................181
Figure H.39: AHPCS-RT-I5-05.......................................................................................182
Figure H.40: AHPCS-RT-I5-06.......................................................................................182
Figure H.41: AHPCS-RT-I6-01.......................................................................................183
Figure H.42: AHPCS-RT-I6-02.......................................................................................183
Figure H.43: AHPCS-RT-I6-03.......................................................................................184
Figure H.44: AHPCS-RT-I6-04.......................................................................................184
Figure H.45: AHPCS-RT-I6-05.......................................................................................185
Figure H.46: AHPCS-RT-I8-01.......................................................................................185
Figure H.47: AHPCS-RT-I8-02.......................................................................................186
Figure H.48: AHPCS-RT-I8-03.......................................................................................186
Figure H.49: AHPCS-RT-I9 ............................................................................................187
Figure H.50: AHPCS-RT-I22-01.....................................................................................187
Figure H.51: AHPCS-RT-I22-02.....................................................................................188
Figure H.52: AHPCS-RT-I22-03.....................................................................................188
Figure H.53: AHPCS-600-I8 ...........................................................................................189
Figure H.54: AHPCS-600-I9 ...........................................................................................189

xi
Figure H.55: AHPCS-600-I22 .........................................................................................190
Figure H.56: AHPCS-800-I8 ...........................................................................................190
Figure H.57: AHPCS-800-I9 ...........................................................................................191
Figure H.58: AHPCS-800-I22 .........................................................................................191
Figure H.59: AHPCS-1000-I8 .........................................................................................192
Figure H.60: AHPCS-1000-I9 .........................................................................................192
Figure H.61: AHPCS-1000-I22 .......................................................................................193

1
CHAPTER 1
OVERVIEW
1.1. Motivation In recent years, various research efforts have focused on advanced materials for
applications requiring exceptional mechanical properties under high temperature and
structural loading. Ceramic materials are among the variety of monolithic or composite
materials considered for use in high thermal loading applications, as well as in structural
applications. Due to variation in mechanical properties at low and high temperatures,
material performance must be validated over a temperature range. This work considers
the use of silicon carbide (SiC) ceramic as a structural material in applications requiring
high temperature operation.
Silicon carbide is processed in varying ways. Due to the complexity of processing
techniques and cost of tooling and equipment used, several methods have been developed
to produce ceramic materials in a more effective manner. Geometry of monolithic
ceramics and ceramic matrix composite materials (CMCs) is a major constraint due to
processing. “Near net” shape fabrication methods of ceramics, methods that allow for
complex geometries to be attained, has been a topic of research for several years.
Parameters such as high temperatures and pressures that are associated with ceramics
processing, as well as the specific atmosphere, whether inert or reactive, may allow for
difficulty in processing ceramic materials.

2
No matter the method of processing, the processed material must be verified for
mechanical properties. Verification of properties can be undertaken using several
methods. At the microscopic scale, x-ray diffraction (XRD) and scanning electron
microscopy (SEM) is typically used to study the material microstructure. On the
macroscopic scale, materials are tested for bulk mechanical properties using methods of
destructive or non-destructive structural testing. Destructive testing may be employed
due to the indication of material response up to the failure envelope of the material.
Structural testing includes modes of failure relating to static or fatigue response of the
material, under compressive, tensile or flexural loading. Mechanical properties typically
vary quite drastically with the introduction of high temperatures.
1.2. Objective and Scope of Work A study was undertaken on verifying the mechanical properties at varying temperatures
of a silicon carbide processed in-house with a pre-ceramic polymer precursor, as well as a
commercially available monolithic reaction bonded silicon carbide. To evaluate
mechanical properties of the materials, compression tests were conducted on both types
of silicon carbide from room temperature to 1000°C (1832°F). The objective of the
research is to determine whether silicon carbide processed via a pre-ceramic polymer
precursor will perform in comparison to a commercially available silicon carbide
material. Scope of work includes materials processing research of ceramics including
monolithic and composite silicon carbide materials, experimentally determining an
effective route to near net shape SiC components and mechanical testing of processed
and commercially available SiC at varying temperatures.

3
1.3. Literature Review 1.3.1. Applications for Silicon Carbide Materials Silicon carbide (SiC) is a ceramic material that is processed in several ways to produce
monolithic SiC as well as reinforced composite materials. Applications for the material
are quite diverse and are of interest as thermally stable components ranging from brake
discs to furnace heating elements. Due to the high non-melting decomposition
temperature of 2815°C (5099°F) and service temperatures of up to 1800°C (3272°F), and
dependent on the processing technique and crystalline structure of the material, SiC has
exceptional potential for carrying thermal loads (Harper, 2001). Silicon carbide also
performs reasonably well as a structural material due to its relatively good strength and
stiffness properties. For example, a sintered (particle bonded SiC) from Saint-Gobain
Ceramics (Niagara Falls, NY) has a compression strength of 3900 MPa (560 ksi), three
point flexure strength of 380 MPa (55 ksi) and an elastic modulus of 410 GPa (59 msi).
However, like many other ceramics, silicon carbide suffers from low fracture toughness.
Silicon carbide ceramics are used in the powder coating, abrasives, grinding and cutting
tool industries. SiC is used in refractory applications such as kiln furniture, retorts,
furnaces, and as heating elements (Harper, 2001). Monolithic and ceramic matrix
composites (CMCs) using SiC are of interest in the aerospace, automotive and electronics
markets. In the aerospace sector, silicon carbide based composite materials have been
considered for engine combustion chambers to reduce engine weight, reduce air cooling
requirements, improve fuel efficiency and reduce emissions (DiCarlo et al, 2004). In
automotive applications, monolithic silicon carbide has been used successfully in

4
producing turbocharger rotors (Hinton et al, 1985) and has been developed for
experimental research studies on various sizes of internal combustion engines (Flynn,
1986). Other applications include pump sealing materials, mechanical shaft seals and
bearings. Chemical Vapor Deposition (CVD) silicon carbide is used primarily in the
semi-conductor wafer industry (Harper, 2001), mostly for computer electronics, due to its
relatively high dielectric constant and moderate thermal conductivity.
Studies on low heat rejection engines as well as “adiabatic” (well insulated) engines have
allowed consideration of ceramics such as silicon carbide for use in internal combustion
engine components. Thring (1986) describes the heat energy rejection of water cooled
diesel and gasoline engines in a balance of two thirds heat rejected based on fuel
consumption. One third of the energy from combusted fuel is rejected to coolant and one
third flows out as exhaust gases. The remaining third of combustion energy is useful
energy for power output. If heat rejection can be reduced, potentially through the use of a
ceramic insulating material, thermal efficiency will increase to the Carnot efficiency limit
as set by the second law of thermodynamics. Engine components must also withstand the
intense heat from combustion, which may allow ceramics to be considered as metallic
components are more susceptible to deformation and melting at extreme temperatures.
Benefits to low heat rejection engines include improved fuel economy and lower
hydrocarbon and carbon monoxide emissions (Thring, 1986), with a downside of
possibly increasing nitrogen oxide emissions (NOx).

5
Feasibility studies (Kamo, 1984) and finite difference method analysis (Hoag, 1985)
conducted by Cummins and the U.S. Army Tank and Automotive Command (TACOM)
in the 1980’s involved research of ceramic materials aside metal components for use in
diesel truck engines. Pressures peak in the range of 2,000 psi and temperatures approach
1000°C (1800°F) inside the reciprocating piston-cylinder engine combustion chamber,
which allow for structural ceramics to be considered for the design of engine components
(Kamo, 1984). Also in an attempt to increase thermal efficiency, Isuzu Motors Ltd. and
Kyocera Corp. developed a diesel engine using a ceramic to metal bonding method,
where pistons were comprised of silicon nitride bonded to cast iron (Matsuoka, 1986).
Temperatures of 900°C were observed during performance testing; silicon nitride used
for resistance to high temperature, bonded to an alumina fiber gasket providing insulation
and reduced heat transfer to the cast iron piston.
An un-cooled single cylinder engine sprayed with a zirconia coating on the surfaces of
the combustion chamber allowed an improvement from 5 to 9 percent in fuel
consumption under EPA urban driving cycle tests (Havstad, 1986). Havstad reports
approximately 20% heat loss in a direct injection water cooled diesel engine. In testing
after elimination of coolant, combustion chamber surfaces withstand temperatures in the
range of 1500°F (815°C). Sintered (alpha crystalline) silicon carbide was investigated in
testing an un-lubricated and un-cooled diesel engine, where the material was used as a
piston and cylinder liner. Fracture failure in the piston and bending failure in the cylinder
liner allowed for less than 200 hours of test operation (Flynn, 1986).
6
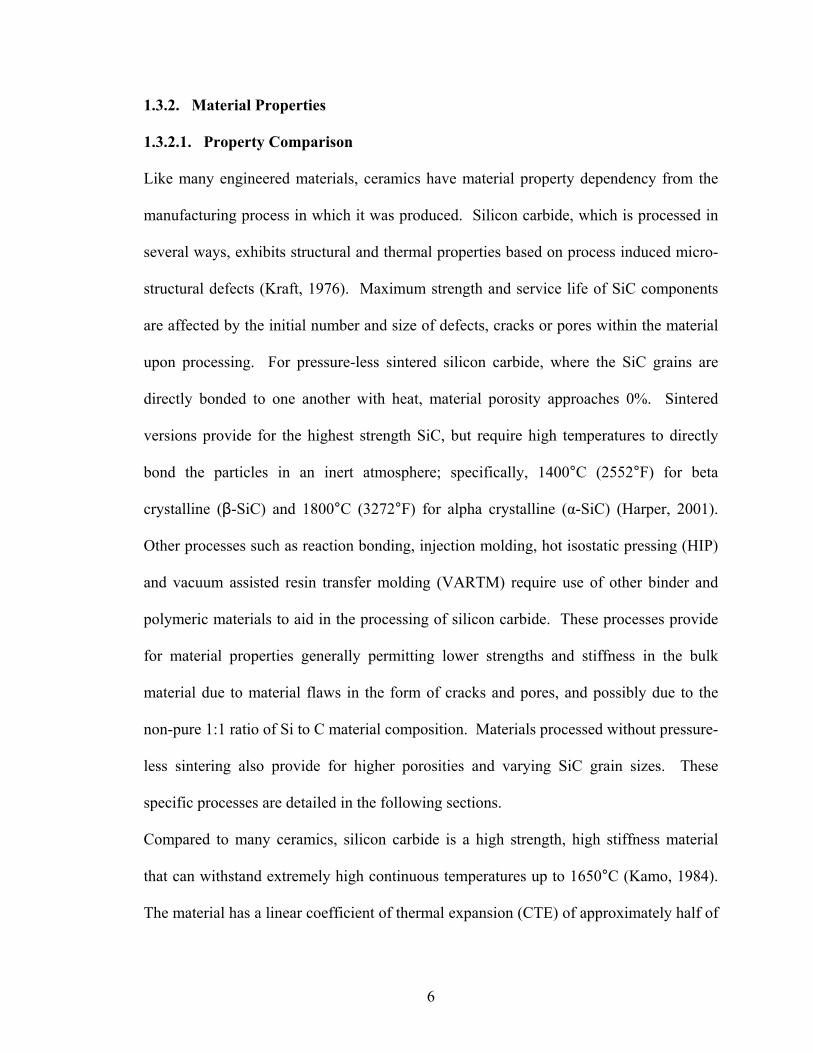
1.3.2. Material Properties 1.3.2.1. Property Comparison Like many engineered materials, ceramics have material property dependency from the
manufacturing process in which it was produced. Silicon carbide, which is processed in
several ways, exhibits structural and thermal properties based on process induced micro-
structural defects (Kraft, 1976). Maximum strength and service life of SiC components
are affected by the initial number and size of defects, cracks or pores within the material
upon processing. For pressure-less sintered silicon carbide, where the SiC grains are
directly bonded to one another with heat, material porosity approaches 0%. Sintered
versions provide for the highest strength SiC, but require high temperatures to directly
bond the particles in an inert atmosphere; specifically, 1400°C (2552°F) for beta
crystalline (β-SiC) and 1800°C (3272°F) for alpha crystalline (α-SiC) (Harper, 2001).
Other processes such as reaction bonding, injection molding, hot isostatic pressing (HIP)
and vacuum assisted resin transfer molding (VARTM) require use of other binder and
polymeric materials to aid in the processing of silicon carbide. These processes provide
for material properties generally permitting lower strengths and stiffness in the bulk
material due to material flaws in the form of cracks and pores, and possibly due to the
non-pure 1:1 ratio of Si to C material composition. Materials processed without pressure-
less sintering also provide for higher porosities and varying SiC grain sizes. These
specific processes are detailed in the following sections.
Compared to many ceramics, silicon carbide is a high strength, high stiffness material
that can withstand extremely high continuous temperatures up to 1650°C (Kamo, 1984).
The material has a linear coefficient of thermal expansion (CTE) of approximately half of

7
steel; 3.8 x 10^-6 cm/cm-°C (Harper, 2001), where steel alloys have an approximate 6-7
x 10^-6 cm/cm-°C CTE. SiC has a high hardness, second only to that of diamond and
comparable to boron carbide (B4C) and cubic boron nitride (CBN), also known as
Borazon. SiC has a low density, provides for excellent wear resistance due to the
lubricity provided by the carbon in the material (Harper, 2001), and excellent corrosion
and oxidation resistance due to the formation of silicon dioxide (SiO2), otherwise referred
to as silica, on the outside surface of the material at high temperatures (Coppola et al,
1978). Disadvantages of silicon carbide as a structural material include its low fracture
toughness and its brittle elastic response. Table 1.1 outlines a compilation of material
properties from Harper (2001), Kamo (1984) and Saint Gobain Ceramics (2007) outlining
silicon carbide with other structural ceramics such as silicon nitride (Si3N4), 99.5%
alumina (Al2O3) and zirconia (ZrO2).
Table 1.1: Property Comparison of Ceramics and Metallic Alloys
SiC* Si3N4** Al2O3* ZrO2*** SS-304 Al-356 Density (g/cc) 3.21 3.19 3.96 5.91 7.93 2.69 Comp. Strength, MPa (ksi)
3900 (560)
3500 (507)
2620 (380)
1965 (285) - -
Tensile Strength MPa (ksi)
350 (50) -
262 (38)
414 (60)
75 (110)
240 (35)
Flexure Strength MPa (ksi)
450 (65)
750 (109)
550 (80)
1020 (148) - -
Modulus of Elasticity GPa (msi)
410 (60)
300 (44)
372 (54)
205 (30)
224 (32)
72 (10)
Poisson's Ratio 0.16 0.27 0.23 0.38 0.29 0.33 Hardness (Moh) 9.1 9.0 9.0 8.0 - - Fracture Toughness, KIC (MN/m^3/2) 4.6 3.6 5 8.4 80 30 CTE, linear (x 10^-6/°C) 3.8 3.2 6.5 6.5 17.3 23.5 Thermal Conductivity (W/m-K) 70 32 39 3 16 160 Max use Temp. °C (°F)
1650 (3002)
1500 (2732)
1750 (3182)
1500 (2732)
1400 (2552)
555 (1031)
*Sintered ** Hot Pressed *** Partially Stabilized

8
In the previous table, the ceramics SiC and Al2O3 are sintered, Si3N4 is listed as hot
pressed and the ZrO2 is partially stabilized with magnesium oxide (MgO). Compressive
and tensile strength of sintered SiC is data from Saint-Gobain Hexoloy™ data sheets.
The table includes data for two metals, AISI-304 stainless steel and SAE A-356 cast
aluminum, to compare the ceramics with metallic alloys typically used in structural
applications. Coppola et al (1978) describes average expected properties for sintered
alpha phase silicon carbide, as listed in Table 1.2.
Table 1.2: Typical Physical Properties of Sintered Alpha SiC
Bulk Density (g/cc) 3.14 - 3.18 Hardness (Knoop, kg/mm^2) 2800 Young's Modulus (GPa) 406 Shear Modulus (GPa) 25.8 Poisson's Ratio 0.14 Weibull Modulus 12.3 CTE (10^-6/°C) RT-700°C 4.02 700-2000°C 5.32 Thermal Conductivity (W/m-K) 25°C 172.9 200°C 96.3 400°C 77.5 600°C 58.6
It is clear that the material has a high stiffness of 406 GPa (58.8 msi), high hardness, and
thermal properties that coincide with the properties in Table 1.1. Coppola (1978) further
describes the flexural strength of sintered alpha SiC with respect to temperature, as seen
in Figure 1.1. Figure 1.1 outlines α-SiC having a flexural strength dependence on
temperature over 1200°C (2192°F). Below 1200°C, the material strength is virtually
unaffected by temperature. The tested material had a 10 μm grain size, with evidence of
slow crack propogation at 1500°C (Coppola, 1978).

9
Figure 1.1: Flexure Strength of Sintered α-SiC (Coppola, et al., 1978)
Kraft and Dooher (1976) report elastic modulus temperature dependence for reaction
bonded silicon carbide, as is detailed in Table 1.2. It is clear that with higher
temperatures, the elastic modulus decreases by approximately 10% from room
temperature to 1200°C (2192°F) when tested in three point bending. From this data, it
can be expected that the elastic modulus will have temperature dependence and will
decrease similarly with compression or tensile testing.

10
Table 1.3: Elastic Modulus of Reaction Bonded SiC (Kraft, 1976)
Elastic Modulus Temp., °C (°F) GPa (msi)
Room 365 (53) 600 (1112) 344 (50) 1000 (1832) 338 (49) 1200 (2192) 331 (48)
Kraft and Dooher (1976) also report flexural strength under three point bending for both a
sintered α-SiC as well a reaction bonded type. Contrary to Coppola et al. (1978), test
results from Kraft and Dooher allow for an increasing constant flexural strength best fit
curve for tests at varying temperatures. With α-SiC, the increase in strength up to
1650°C (3002°F) is possibly due to micro-crack healing (Kraft, 1976), where a heat-
treating effect is observed. Nevertheless, the important observation is that the sintered α-
SiC allows for no strength degradation with increasing temperature. The reaction bonded
SiC, however, starts to degrade post 1200°C (2192°F). This degradation is potentially
due to the temperature the reaction bonded material was processed, which may be lower
than 1200°C. In this case, properties are highly process temperature dependent. The
peak flexural strength observed at 1200°C is most likely due to crack blunting, where the
transition to the melting point of the silicon phase resembles a strain hardening effect
(Kraft, 1976).

11
Figure 1.2: Sintered and Reaction Bonded SiC Flexural Strength (Kraft, 1976)
Due to statistical variation in mechanical properties, one accepted measure in the strength
of ceramic materials is the Weibull Distribution. This distribution is a “weakest link”
model that is concerned with the failure stress, σ, the zero failure probability stress, σo,
the characteristic stress, σc, and the shape parameter, m, known as the Weibull Modulus
(Kraft, 1976). The cumulative distribution function is given in equation 1.
m
oc
oF ⎟⎟⎠
⎞⎜⎜⎝
⎛⎥⎦
⎤⎢⎣
⎡−−
−−=σσσσ
σ exp1)( (1)
The characteristic stress, σc, is typically the 63.2 percentile, indicating 63.2% of the data
is less than that value of stress, and σo is usually set to zero to set a lower bound on the
cumulative distribution of failure stress.

12
If σo is set to zero, a double logarithmic transformation yields a linear function. A least
squares fit of the test data to the function yields the Weibull Modulus, m, and the
characteristic stress σc. This linear function is listed in equation 2.
⎟⎟⎠
⎞⎜⎜⎝
⎛⎟⎟⎠
⎞⎜⎜⎝
⎛−
=−)(1
1lnln)ln(lnσ
σσF
m c (2)
Kraft (1976) describes the Weibull modulus as a good indication of material uniformity.
A uniform material yields a close distribution of strength values with a corresponding
high value of Weibull Modulus. Typical values of the Wiebull modulus of 15 to 20 are
acceptable for design of materials using silicon carbide. Values below 5 will exhibit
wide property variation and are unacceptable for most applications.
1.3.2.2. Oxidation Resistance Due to high temperature service of many advanced ceramic materials, oxidation
resistance at these temperatures for large periods of time is of concern when
implementing advanced ceramics into design. Many ceramics allow for good oxidation
resistance due to their oxide based chemical composition. Oxide ceramics such as
alumina (aluminum oxide, Al2O3), zirconia (zirconium oxide, ZrO2) and beryllia
(beryllium oxide, BeO) have good structural properties and perform well in high
temperature oxidizing atmospheres due to their oxygen based composition. Non-oxide
structural ceramics that are carbon or nitrogen based, known as carbides or nitrides, also
have high temperature capabilities in oxidizing atmospheres. Such materials in the
carbide family include silicon carbide (SiC), tungsten (mono)carbide or tungsten di-
13
carbide (WC or W2C) (otherwise known as simply carbide in the cutting tool industry)
vanadium carbide (VC), titanium carbide (TiC) and zirconium carbide (ZrC).
Throughout the family of carbides, silicon carbide is the highest performing oxidation
resistant material used in oxidizing atmospheres above temperatures of 1000°C (1832°F).
The good oxidation resistance parameter of silicon carbide is due to the formation of the
silica (SiO2) layer on the outer surface of the material (Harper, 2001). For SiC, reported
operating temperatures of 1700°C (3092°F) in oxidizing atmospheres, with operating
temperatures up to 2200°C (3992°F) in inert atmospheres. Nitride ceramics include but
are not limited to silicon nitride (Si3N4), titanium nitride (TiN) and boron nitride (BN).
Nitride ceramics have low thermal conductivities, low coefficients of thermal expansion
and can be used up to temperatures up to 1100°C (2012°F). Above these temperatures,
nitrides exhibit high rates of material oxidation (Harper, 2001).
Coppola et. al. (1978) descrbes a logarithmic behavior of sintered α-SiC when oxidized in
air at temperatures ranging from 1200°C (2192°F) to 1500°C (2732°F). Degradation of
SiC is described as passive, where the outer layer of silicon carbide reacts with oxygen,
forming silica (SiO2). This very thin layer of SiO2 protects the base material of SiC from
oxidation (Harper, 2001). Oxidation of SiC is described in Equation 3.
COSiOOSiC 2232 22 +→+ (3)
The α-SiC oxidized had an average grain size of 10 μm, of 1-2% closed (non-connecting)
porosity, of bulk density 3.14 g/cc (97.8% theoretical at 3.21 g/cc). The samples were

14
rectangular of surface area 30 cm2, polished with a diamond paste of 1 μm grain size, and
oxidized in a tube furnace of alumina composition. Samples were removed from the
furnace at intervals of time and weighed. Figure 1.3 details the logarithmic oxidation in
weight gain per unit area versus time curves for α-SiC.
Figure 1.3: Logarithmic Oxidation Rate of α-SiC (Coppola, et. al., 1978)
Oxidation resistance of silicon carbide as studied by Ogbuji and Singh (1995) included
reaction formed silicon carbide with infiltration of molten silicon into a micro-porous
carbon pre-form, as well as a second variation using an infiltration of 3.2% Molybdenum
alloy (Mo) with silicon. These types of reaction bonded SiC specimens were compared
with CVD SiC. The purpose of the study was to determine if the melt infiltration

15
reaction formed SiC of near net shape allowed for similar oxidation resistance of that to
the more complex manufactured CVD SiC. The oxidation study included a
thermogravimetric analysis (TGA), mass loss at elevated temperatures, of polished
specimens in pure oxygen for 50 hours at temperatures ranging from 1100 to 1400°C.
After the oxidation cycle, the specimens were re-polished and examined by light
microscopy and scanning electron microscopy (SEM) to determine internal porosity due
to oxidation. Specific weight change in units of mass per unit volume was plotted versus
oxidation time, where at 1150°C specific weight increased as a function of the square of
time in hours. Overall, the study determined that the lower purity reaction bonded 3.2%
molybdenum samples had the highest rate of oxidation, the Si/SiC (specimens with free
silicon) oxidized less rapidly, and the CVD SiC performed best resisting oxidation over
time. The argument for the highest purity SiC remains valid in order to allow for better
oxidation resistance under high temperatures.
1.3.3. Processing Options of SiC Materials Silicon carbide materials are processed in several ways. Due to the lack of melt property
but high decomposition temperature of silicon carbide, near 2815°C (5099°F) (Harper,
2001), processing of the material can prove difficult based on the high temperatures
required to form the 1:1 bond between silicon and carbon. Service temperatures for SiC,
dependent on methods of processing, typically range up to 1800°C (3272°F). Silicon
carbide was first discovered in 1891 by Edward Goodrich Acheson, who later formed
Carborundum Corporation (Harper, 2001). The Acheson process for silicon carbide
allows an electrical current to flow through particles of carbon and sand in the following

16
chemical reaction in Equation (4). By today’s standards, silicon carbide powder is
initially sintered in an electric furnace from carbon coke and silica sand of purity greater
than 99.4% silicon dioxide (SiO2) (Harper, 2001). Typically, sawdust and salt binders
are used in the mixture to prevent the formation of impurities during the sintering
process.
COSiCCSiO 232 +→+ (4)
β-SiC, the cubic crystalline form, is formed from 1400°C to 1800°C, where α-SiC, the
hexagonal crystalline, is formed at temperatures above 1800°C. A phase diagram
(Tairov, 1988) is given in Figure 1.5 describing the binary phase Si and C to SiC
materials, in which α describes a solid solution of C in Si, and β is a solid solution of Si
in C. In this diagram, the melting point of silicon metal is 1412°C (2573°F), and the
melting point of carbon is 4050°C (7322°F). Decomposition of 1:1 SiC at 50% carbon
concentration is listed at 2830°C (5126°F). This temperature corresponds with Harper
(2001) as the decomposition temperature.
Figure 1.4: Phase Diagram for SiC
Si C
17
In order to process silicon carbide materials at lower temperatures using lower cost
equipment, many processes have been used other than direct carbon and silica sand
sintering. Several common methods for processing silicon carbide into useful stand alone
ceramics or ceramic matrix composite materials are listed in the following sections.
These methods include but are not limited to sintering, hot pressing, chemical vapor
deposition, reaction bonding and injection molding.
1.3.3.1. Hot Press / Sintering SiC powders can be sintered, or by definition, powder particles are directly bonded
together to form a dense part, either without pressure or by using a combination press and
furnace. Direct sintering allows bonding of powder particles using only temperature.
Sintering of silicon carbide powders requires high temperatures up to 2500°C within an
inert atmosphere or vacuum to produce a covalently bonded α-SiC ceramic material
(Munro, 1997). To sinter these materials, aids such as boron, carbon or alumina are used
to form a continuous bonded mass. Variations in the sintering aid materials allow for
variations in the sintering temperature. Silicon carbide can be sintered to 97% theoretical
density at 2100°C with the addition of 0.5% by weight boron and 1.5% by weight carbon
(Matsumoto, 1995).
Use of pressure may allow reduction of the temperature required to attain the bonds
between material powders. Hot Isostatic Pressing is defined as the addition of pressure to
aid in the processing of materials to allow for a type of sintering reaction to occur
(Campbell, 2003). Moderate pressures in the range of 20 atmospheres (293 psi) up to
very high pressures of 1000 atm (14,600 psi) improve mechanical properties of metals
18
and ceramic materials when processing at temperatures near the material melting point.
Typically when using a hot isostatic pressing method, property improvement is based on
the reduction of material porosity due to the creation of a fine grained material matrix.
Silicon carbide materials are a good candidate for this processing method in which to
achieve more dense components with low porosity. However, if a one dimensional press
is used, shapes of the processed components are limited. High tooling costs may arise
due to the use of furnace platens and/or molds that need to withstand very high
temperatures usually above 1000°C (1832°F). As a result, tooling and molds for sintered
materials usually is comprised of ceramics. Using low cost molding, cold pressing using
steel or aluminum molds along with binders such as pre-ceramic polymers can be used.
After cold pressing at up to 9000 psi (6894 kPa) pressure in air, components can be cured
at 500°C (932°F) and sintered in an inert atmosphere up to 1600°C (2912°F) to achieve
porous silicon carbide components (Hayes, 2003). Using pressing methods, parts may
require some post machining, dependent on tolerancing requirements, which can prove
costly in the case of silicon carbide and other hard ceramics. Selective laser sintering
(SLS) is under investigation where rapid prototyping and rapid manufacturing of sintered
silicon carbide ceramic materials of complex shape is of interest (Evans, 2005). Powder
is fed onto a platform, where a very fine, high temperature laser beam passes over the
powder in a specific tool path, in order to build parts from the ground up. Typically, the
sintered product in SLS is a pre-form, where further processing is necessary to densify
and reduce porosity of the silicon carbide part. A method in rapid prototyping of
ceramics parallel to SLS using an ultraviolet laser, which allows precise tolerances
attainable to the micrometer scale (Knitter, 2003).
19
1.3.3.2. Chemical Vapor Deposition/Infiltration (CVD/CVI) The most common method for processing silicon carbide materials is through the use of
Chemical Vapor Deposition or Infiltration (CVD/CVI) (Interrante et. al, 1995). CVD is a
chemical process in which ceramics are formed when a substrate is exposed to a chemical
precursor under high temperatures in an inert atmosphere. These precursors react on the
substrate surface producing a deposit. This deposit is the desired ceramic material. In
many cases, the byproducts of this type of chemical reaction are highly volatile. In the
forming of silicon carbide, hydrogen chloride is a common byproduct of the CVD
reaction, based on the precursor chemicals used. The equipment necessary to handle
these chemical reactions and byproducts to form such materials can be costly. Silicon
wafers are commonly processed into silicon carbide based semiconductor materials
through CVD processes.
1.3.3.3. Reaction Bonding/Forming The reaction bonding method allows a reaction to occur between two materials, typically
between a molten constituent and a pre-formed, dry or powder constituent. For example,
reaction bonded or reaction formed silicon carbide (RB-SiC or RFSiC) can be formed by
infiltrating a carbon pre-form with molten silicon (Ogbuji, 1995). The porous carbon
pre-form could be processed by pressing or selective laser sintering methods. Based on
the chemistry of the reaction, the result is typically a silicon-carbide material with
residual free silicon (Si/SiC), not pure SiC (Harper, 2001). Reaction bonding can also
describe the bonding between powder and resins such as pre-ceramic polymer precursors
to ceramics such as SiC and silicon nitride (Si3N4). Processing of this type is discussed in
Section 1.3.3.6.

20
1.3.3.4. Powder Injection Molding (PIM) Injection molding is a common method for producing plastics, as well as metal and
ceramic matrix composites, using powder as a base component of the material. Powder is
mixed with a molten binder resin and injected into a mold under pressures as low as 0.6
MPa (87 psi) (Whalen, et al. 1991). The molten mixture is allowed to cool to room
temperature if mixed with a chemical catalyst, or cure at high temperature, for materials
typically with melt or sintering temperatures above 1000°C (1832°F) (Johnson, 2005)
within the heated mold if heat is required to catalyze the powder/binder mixture.
Injection molding allows very little restriction on part geometry due to the pressure and
heat applied to the viscous flowing powder/binder slurry within a machined mold cavity.
A multitude of research has been performed on this process in the field of ceramic PIM.
Silicon carbide materials are a good candidate for PIM due to the availability of
manufacturing equipment from the plastics industry, popularity of the ability to attain
near net shape parts (little or no post machining), and the ability to tailor part geometry
requirements using molds. Green parts are formed once the PIM slurry is cured in the
mold and the mold is removed. At this point the binder is still present in the cured part.
The part is then post cured in a furnace under an inert atmosphere to create another
chemical reaction that either allows burnoff of the binder or a secondary bond of the
binder to the silicon carbide powder. Once the de-binding process is complete, the part
can be finish machined or re-infiltrated with more polymer binder material and post cured
until a desired density and porosity of the part is attained (Johnson, 2005).

21
1.3.3.5. Successes with Ceramic Injection Molding Several sources report successful injection molding avenues for manufacture of silicon
carbide materials. Injection molded sintered alpha silicon carbide (SASC) was used in
the development of ceramic engine components, particularly turbocharger rotors, where
alpha-SiC (α-SiC) is the hexagonal crystalline form of SiC, formed above 1800°C
(3272°F) (Harper, 2001). The injection molding method was chosen based on its net
shape fabrication of parts and “low cost potential for high volume manufacturing”
(Hinton et al, 1985).
Mutsuddy (1991) describes use of three polymeric binders in addition to silicon carbide
powder for use in the process. Ethylene Vinyl Acetate (EVA) 633, EVA 9169 and
Ethylene Vinyl were mixed with silicon carbide powder, pelletized and injected into a
mold under high pressure in an injection molding machine. Various binder to powder
loadings were studied ranging from 40% to 87.5% by volume. The binder/powder
slurries exhibited high viscosities, in ranges higher than 104 poise (103 N-s/m2 or Pa-s)
for 40% loading, up to over 1010 poise (109 N-s/m2) for the 87.5% loading cases. The
study included the use of plasticizers and processing aids such as paraffin wax, mineral
oils and very low cost vegetable and animal oils such as cotton seed, peanut, corn and
codliver. (Mutsuddy, 1991) The plasticizer (wax, or oils) replaced some of the organic
binder used (EVA) in an attempt to both reduce the viscosity of the injected slurry and to
replace some of the binder chemical with lower cost alternatives. The plasticizer
typically burns out before the crosslinking or cure temperature of the binder material, so
22
that the slurry is compacted further. If the plasticizer does not burn out before binder
crosslinking, a de-binding cycle is used to rid the part of the plasticizer.
Binder removal in the cases of injection molding with EVA and processing aids after
injecting the slurry into the mold is a key step in processing. Mutsuddy (1991) describes
that a binder removal system must allow a slow release of the binder over time, so that it
can escape the part over time without causing part failure in the form of cracks. Also, for
non-oxide ceramics, such as silicon carbide, it is important to allow for an inert
environment due to the ceramic being unable to tolerate oxidizing atmospheres during de-
binding. Methods of pyrolysis in an inert atmosphere or vacuum extraction of the binder
at high temperatures are discussed. Other studies narrowed in on the viscosity of the
silicon carbide slurry for injection molding also included work using plasticizers and
processing aids. Gasic (1999) reports the best results using paraffin wax and stearic acid
after sampling viscosities of slurries of silicon carbide with these two constituents, as
well as polyethylene, polypropylene, glycerine and fish oil. As a plasticizer with a low
melt temperature of approximately 60°C (140°F) and boiling point of 150°C (302°F),
paraffin wax proved to allow good flow of the slurry into the mold, with sufficient de-
binding properties as temperature of the mold increased above 150°C as the slurry
remained under pressure.
1.3.3.6. Injection Molding with Pre-Ceramic Polymer Precursors Injection molding of ceramics using a ceramic precursor was patented in 1993 by
Alexander Lukacs of Hercules Incorporated (Wilmington, DE). In order to allow for
sintered ceramic parts, specific pre-ceramic polymers are mixed with at least 40% by

23
volume powder of either ceramic or metallic composition and injected into a heated
mold. The mold containing the mixed slurry of polymer and powder is heated to a cure
temperature where the materials crosslink irreversibly under the appropriate gas
atmosphere, forming a hard, green part. The term Reaction Injection Molding (RIM) is
used to describe the process of injecting and reacting powder with the pre-ceramic
polymer resin. The green body cured part is relieved of the mold, and then pyrolyzed in
the appropriate atmosphere, forming a ceramic material, and can be sintered or densified
further, forming ceramics of low porosity with some shrinkage. Lukacs (1993) identifies
specific precursors such as polysilazane, polyureasilazane, polythioureasilazane,
polycarbosilane and polysiloxane as candidates for polymers to be used in a reaction
injection molding process. Ceramic and metallic powders can be used in the process.
Ceramic powders include silicon nitride, silicon carbide and alumina. Metal powders
include silicon, aluminum and any of the transition metals listed in the periodic table.
Lukacs (1993) describes processing recommendations include ram or piston extrusion in
comparison to a screw type feeder for pressurizing the polymer/powder mixture during
injection into a mold. Velocity of the ram is recommended from 3 to 10 inches per
second (ips), injection pressures should range from 100 to 2000 psi and injection
pressures during the curing of the polymer/powder slurry should range from 1000 to 4000
psi (Lukacs, 1993). Several processing examples of attaining ceramic materials are listed
in the patent. One example includes mixing 766.4 grams of β-SiC powder with 276.6
grams of polyureasilazane, 1.04 grams of MAZOL 300K dispersant, and 1.11 grams of
dicumyl peroxide in a mixer. This mixture is molded at 50°C on a Hull Model 120-25

24
injection molder ram at 4 inches per second under 500 psi. The part is cured at 150°C for
30 minutes. Lukacs reports the cured part is strong and has good surface finish once
pulled from the mold.
A study performed using a suspension of polycarbosilane (PCS) and paraffin wax with
silicon carbide powder in an injection molding operation allowed a lower softening point
of the heated slurry within the molding machine, as well as a lower viscosity for a greater
silicon carbide powder loading. (Zhang, 1991) Two compositions of PCS and SiC
powder were compared; one with the addition of paraffin wax, and one without.
Properties of the two compositions of slurries with polycarbosilane conversion to SiC
after the 900°C (1652°F) pyrolysis temperature are summarized in Table 1.4 and 1.5.
Table 1.4: Ceramic suspension compositions
Density % weight Material (kg/m^3) Comp 1 Comp 2
Silicon Carbide powder 3200 75 80 Polycarbosilane resin 1070 25 16 Paraffin Wax 916 0 4 SiC % by vol 50 56
Table 1.5: Conversion of Polycarbosilane to SiC
Loss on pyrolysis (900°C) Composition 1 Composition 2 Weight loss, % 31.6 +/- 1.6 (8) 32.2 +/- 1.3 (14) Volume loss, % 38.5 +/- 0.3 (8) 36.3 +/- 0.1 (14) Linear shrinkage 4.2 +/- 0.3 (8) 2.1 +/- 0.2 (14) Calculated density, % (a,b) 61.4 +/- 0.3 (3) 63.7 +/- 0.1 (5) Measured density, % (b) 72 (2) 67 (4) (a) Assume no shrinkage
(b) Assume SiC density of 3200 kg/m^3 Number of experiments in parentheses
95% confidence limits are given

25
1.3.3.7. Combinational Methods Many methods described previously can be used in conjunction with one another to attain
a tailored manufacturing process of silicon carbide materials. If a part cannot be
processed to attain near full density with little or no porosity in one manufacturing step,
typically several methods are used. Allowing parallels between the methods previously
described, reaction bonding or polymer binder re-infiltration can be used in conjunction
with pressing methods, injection molding or selective laser sintering to form ceramic or
ceramic or metal matrix composite materials. Evans et al. (2005) describes the use of
infiltration of silicon, aluminum, iron and other metals in a furnace to densify laser
sintered silicon carbide powder parts.
Autoclave resin transfer molding/vacuum bagging of composite materials is a topic of
extensive research. SiC ceramics and ceramic matrix composites (CMCs) have been
successfully produced using these methods. Muliple sources report using pre-ceramic
polymer binder resins to infiltrate pre-forms or fiber reinforcement to be cured using
these processes.
1.3.4. Polycarbosilane Based Pre-Ceramic Polymer Precursors The chemical composition of the pre-ceramic polymer precursor used in the
aforementioned polycarbosilane injection molding studies to produce silicon carbide is
taken into further consideration. The polymer is comprised of three elemental
constituents, silicon, carbon and hydrogen, and is derived from a byproduct of the
silicone industry, methylthichlorosilane (Interrante, 1995). The primary backbone

26
constistuent of the polymer is the carbosilane molecule, SiH2CH2, which has a carbon to
silicon ratio of 1:1 (Whitmarsh, 1992). Branched off this carbosilane based backbone is
hydrogen. The backbone of the pre-ceramic polymer consists of four molecular units,
including the primary carbosilane molecule, of SiH3CH2, SiH2CH2, SiHCH2 and SiCH2,
which are linked along a chain. These molecules are all silane based, a compound
consisting of silicon and hydrogen with the formula SinH2n+2, where n is an integer 1, 2,
3, etc. (Soukhanov, 1999) Typically, the silane SiH4, silicon tetrahydride, is most
common in describing the gaseous form of silane. The addition of carbon, C, into the
multiple molecular units of the chain results in a multiple carbon based silane chain
known as polycarbosilane.
Introducing the allyl compound, C3H5, allows carbon and hydrogen to remain in the
equation, but condenses the formula into a more compact form. AHPCS is nominally
[Si(C3H5)0.1H0.9CH2]n, where n repeats the compound forming a polymer backbone chain
(Interrnate, 2002). With the allyl substitution, typically 5 to 10% (Interrante 1995), the
polymer chain still retains its SiH2CH2 structure (Kotani, 2003). Overall, the
arrangement of the polymer molecules along the backbone results in alternating Si and C
bonds. During heating and pyrolysis of the polymer, hydrogen bonds off the backbone
and branches are broken, resulting in ceramic SiC of over 90% yield with pyrolysis at
1000°C (1832°F) (Whitmarsh, 1992). Studies performed by Zhang and Evans (1991)
report the main chemical reaction of polycarbosilane similar to that of repeating chains of
polydimethylsilane, a similar material used in the formation of silicon carbide materials,
where the reacting products are silicon carbide, methane and hydrogen (Brown, 2000):

27
Figure 1.5: Polycarbosilane Chemical Reaction Forming SiC (Brown, 2000)
In the previous diagram, SiC is the resulting ceramic silicon carbide yield, with CH4
methane gas and H2 as hydrogen gas as byproducts. The left side of the diagram links to
another methylene (CH2) molecule in the polymer chain. Theoretical yield for
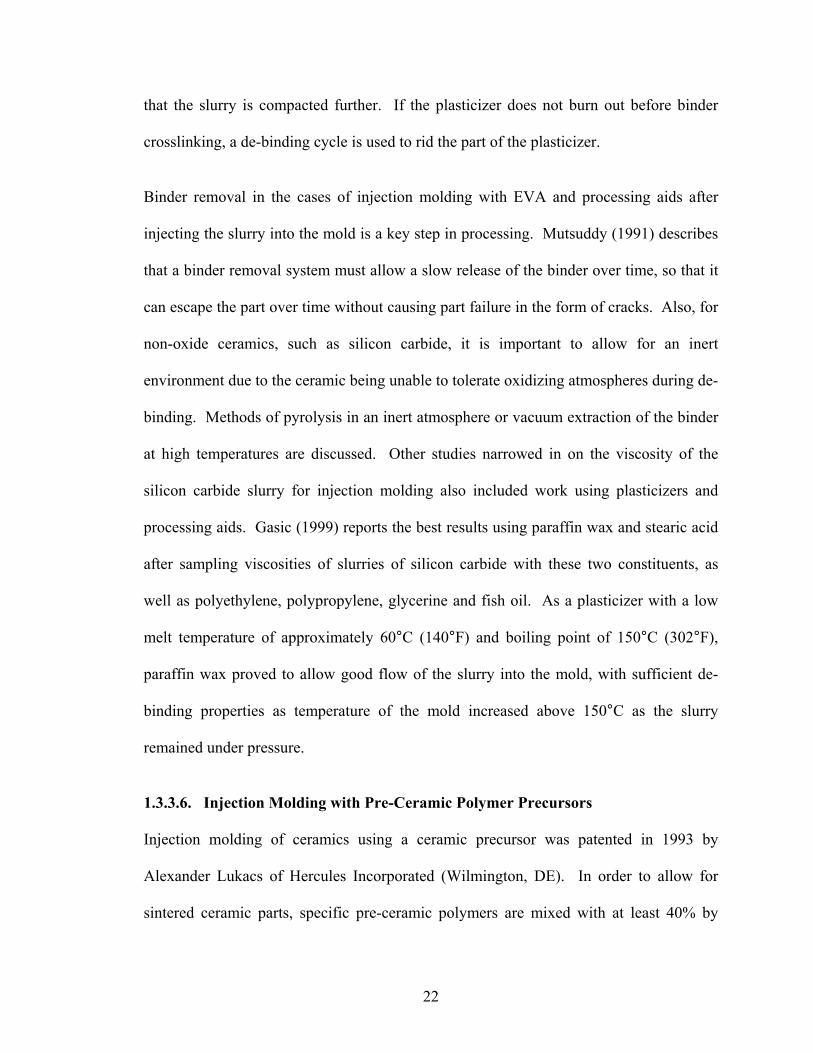
polycarbosilane polymers is 68% by weight at 900°C (Zhang, 1991). Weight loss
occurred in stages from 180-370°C, and from 370-500°C, with continuous loss up to
900°C when the polymer was fully cured. Figure 1.6 gives four curves of mass loss
versus temperature for paraffin wax, polycarbosilane, and wax and polycarbosilane. The
fourth curve gives a theoretical curve based on the mixture of wax and polycarbosilane.
Si CH2
CH3
H
SiC + CH4 + H2
28
Figure 1.6: Thermogravimetric loss of: i, wax; ii, polycarbosilane; iii, wax +
polycarbosilane in weight ratio 1:4; iv, theoretical curve for the mixture (Zhang,
1991)
1.3.5. Curing and Pyrolysis Options for Preceramic Polymers Pre-ceramic polymers undergo a polymer to ceramic conversion when heated to about
800°C (1472°F). Typically, pyrolysis temperatures below 1200°C (2192°F) are low for
conversion to ceramic materials, where the material is classified as amorphous (non-
crystalline) and covalently bonded. Sintering at higher temperatures will crystallize the
material into a ceramic structure. Reacting atmospheres such as air, oxygen, hydrogen or
ammonia, or inert atmospheres using argon, helium, nitrogen or a vacuum can be used to
pyrolyze polymers into ceramics. Conventional oven, furnace or vacuum furnace
equipment can be used in order to apply high temperatures necessary to cure and

29
pyrolyze ceramics. Danko (2000) investigated conventional oven heated versus
microwave heating of preceramic polymers into silicon carbide (SiC), silicon oxycarbide
(SiOC) and silicon mono cyanide (SiNC) ceramics.
The advantage of microwave heating is to achieve an inverse temperature gradient, where
the inside of the heated sample is warmer than the outside surfaces. In the curing and
pyrolysis of preceramic polymers, the sample has the potential of curing from the center
outward (Danko, 2000). Pyrolysis of six preceramic polymers were investigated using a
hybrid microwave and conventional oven heating system, as well as the single
conventional oven system. Two polysiloxanes, yielding SiOC, three polycarbosilanes,
yielding SiC and a polysilazane yielding either SiNC or Si3N4 were cured at low
temperatures of 300°C and pyrolyzed to 1000-1500°C in an open alumina crucible. The
hybrid microwave and conventional oven consisted of a 6 kW, 2.45 GHz microwave
source, of size 12 cm in diameter by 10 cm tall alumina insulated furnace lined with
silicon carbide. The SiC liner, once heated with the microwave, allows for radiative
heating of the specimen as well. After curing, SR 350 (GE Silicone Products Division,
Waterford, NY), a methyl hydroxysiloxane, was pyrolyzed to 1500°C.
Conventional oven heating showed a significant weight loss of the products, whereas the
hybrid system did not exhibit loss. Under pyrolysis, CERASET™ (Allied Signal
Advanced Composites, Newark, DE), a polyureasilazane, underwent the opposite in
weight loss, with 40-45% using the conventional heating and 25-30% with microwave
heating. For the polycarbosilane group, both consisting of allylhydridopolycarbosilane

30
(AHPCS) (Starfire Systems, Watervliet, NY), both consisting of AHPCS and AHPCS
plus a 1% by weight SiC powder, weight loss between both heating systems was
comparable upon pyrolysis to 1500°C (2732°F). Danko (2000) found overall that
nanocrystalline β-SiC is formed using both conventional heating and a hybrid microwave
system. Polycarbosilane polymers form small graphite clusters at 1000°C (1832°F) and
disappear at 1300°C (2372°F) under conventional oven heating, but still remain at
1500°C (2732°F) using microwave heating. One theory behind this behavior is due to the
microwave creating hot spots within the polymer, forming carbon spots within the SiC.
Polysiloxane polymers are carbon rich, and produce β-SiC more effectively at 1500°C
using conventional oven heating. On the other hand, polyureasilazane produces β -SiC
more effectively by microwave heating.
Miller (1997) reports fabrication of silicon carbide ceramic matrix composites (CMCs)
using a polymer infiltration and pyrolysis technique. The preceramic polymer, a
polyureasilazane based polymer under the trade name CERASET™ SN, manufactured by
Lanxide Corporation (Newark, DE) and supplied by Kion Corporation (Huntingdon
Valley, PA). The preceramic polymer has a specific gravity of approximately 1.0, and
has a range of viscosity ranging from 50-30,000 centipoise (mPa-s) and can be thermoset
(cured) to a solid state with a free radical initiator such as an organic peroxide. Cure
temperature ranges from 80 to 200°C (176 to 428°F), depending on the choice of the
peroxide. Plate specimens using Nicalon™ fiber plies were fabricated with CERASET™
SN in methods varying from resin transfer molding (RTM), vacuum bag with autoclave
processing and vacuum assisted resin infusion.
31
For all processing techniques, the polymer matrix phase was cured at 150°C (302°F) for
one hour using a peroxide initiator. The cured composite plates were pyrolyzed to
1000°C (1832°F) using a slow heating rate, allowing the polymer to slowly react, losing
most of its mass from 300 to 700°C (572 to 1292°F). The pyrolyzed plates were then
immersed in CERASET polymer containing the peroxide initiator, and pulled to 30
inches Hg vacuum until all bubbling within the part ceased. The part was removed from
the polymer bath, wiped free of resin, then cured at 150°C (302°F) for one hour, and
pyrolyzed from 1000 to 1600°C (1832°F to 2912°F). Seven infiltration/densification
cycles were performed on the specimens to achieve average flexural strengths in the
range of 263 to 447 MPa (38 to 65 ksi) at pyrolysis temperatures of 1300 to 1600°C
(2372 to 2912°F), the higher strength corresponding to the 1300°C temperature.
Densities ranged from 2.57 g/cc at 1300°C pyrolysis temperature to 2.87 g/cc at 1600°C.
1.3.6. Other Options for High Temperature Materials Nano-particle composite materials have been of interest to many research groups. Gozzi
(2000) reports use of polymethylsilane polymeric precursors to Si3N4/SiC nano-
composites for further processing routes to binders or sintering aids in formation of
composite parts. The composite powder was derived from a mixture of polymethylsilane
(PMS) and tetra-allylsilane (TAS) and Si3N4 powder, to evaluate microstructure and
crystalline phases of the material upon pyrolysis. In a related study, PMS and TAS was
used as a precursor to silicon carbide of 60% yield. Si3N4/SiC nanopowder was prepared
using 4 grams of Si3N4 powder, 1 gram of PMS and 0.5 cm3 of TAS into slurry of high
viscosity. Pyrolysis of the viscous slurry once poured into an alumina crucible, was

32
achieved under argon flow at 1000°C (1832°F). Nanoparticles of mean 83 nm of β-SiC
were observed within an Si3N4 matrix. The mixture did not leave any residues after
pyrolysis; all binder and powder material was useful ceramic.
Besides monolithic ceramics and ceramic matrix composite materials comprised of SiC,
Si3N4 or Al2O3 compositions, many high performance polymer thermoset resins have
been developed for high temperature use for military and aerospace research programs.
The preference of polymer resins in composite material matrices over metals or ceramics
is based on the longer fatigue life of polymer thermosets, when compared to brittle
ceramics, and lower overall material weight in compared to metals (Black, 2004).
Developed in the 1970s at NASA Lewis Research Center, thermosetting polyimides have
been produced for use in aircraft engine parts. The original formulation that produced
good thermal and mechanical properties contained a potential health and safety issue due
to the hazardous compound methylenedianiline (MDA). RP-46, a safer version of this
polyimide, was patented in 1991, allowing similar polymer resin properties to be attained.
Licensed by Unitech Corp (Wake Forest, NC), the resin system is used as a matrix for
carbon fiber reinforced materials. The glass transition temperature (Tg) of 397°C
(747°F) allows a continuous service temperature of 357°C (675°F), and short term
temperature spikes of 815°C (1500°F) without resin breakdown have been reported
(Black, 2004). Thermoxidative stability, or resistance to oxidation and mass loss at high
temperature, is high and flexural strengths of 71 ksi (490 MPa) are reported at 343°C
(650°F). The resin exhibits a brittle nature with micro-cracking under repeated heat

33
cycles. Typically, this type of resin is combined with fiber reinforcement in a pre-
impregnation process (pre-preg) to form thin sheets of composite material. The pre-preg
sheets are cured in an autoclave to form parts of the desired shape. Other companies such
as Goodrich Corp. (Stow, Ohio) have commercialized polyimide composite material
production for aircraft engine and brake applications, offering continuous service
temperatures of 343°C (650°F).
Polyimides commercialized by Maverick Corp. (Blue Ash, Ohio) and UBE America
(New York, NY) have developed a phenylethynyl terminated imide, in reference to the
polymer chain’s end caps, with a glass transistion temperature (Tg) of 330°C (630°F) and
continuous temperatures of 288°C (550°F) (Black, 2004) Using a resin transfer molding
(RTM) method, or vacuum-assisted resin transfer molding (VARTM) method allows for
one step processing of composites suited for high temperature service.
Cyanate ester resins have been tailored to composites used in space applications. This
resin has very low dielectric properties (material response to electromagnetic signals) and
can be used in high-temperature applications with less moisture uptake, lower shrinkage
during cure, and more resistant to microcracking when compared to polyimide based
resins. Similar to cyanate esters, Bismaleimide (BMI) resins are described as the bridge
between epoxies and polyimide resins for high temperature service (Black, 2004). Both
of these resins are produced by Cytec Engineered Materials Inc. (Tempe, AZ).
Continuous service temperatures for the BMI type resins are reported up to 204°C
(400°F), and have been used in F-22 fighter jet parts.
34
Phenolic resins have a high carbon content, 50-60% by weight, and a low glass transition
temperature (Tg) of 160°C (320°F). The high carbon content, highest of any thermoset
resin, gives phenolic resin its ablative properties. In very high temperature service,
typically for use in rocket nozzles, phenolic resins are used in fiber-reinforced composites
to protect the structure of the rocket nozzle. As the very hot exhaust gases pass through
the rocket nozzle, the carbon in the phenolic resin pyrolyzes forming a layer of carbon
char on the surface of the composite. The char layer acts as an insulator for the structural
base material, protecting it from the hot exhaust gases. Pre-preg carbon fiber/phenolic
resin sheets manufactured by Lewcott Corp. (Millbury, MA) have been fabricated into
rocket booster motor exit cones for the Space Shuttle by ATK Aerospace Inc. (Clearfield,
Utah) (Black, 2004).
Related to rocket nozzle ablative materials, nanofillers have been incorporated into
composites to improve on erosion resistance and heat transfer properties by the U. S Air
Force Office of Scientific Research (AFOSR). Nanoclay, carbon nanofibers and hybrid
silica/silicone nanoparticles were dispersed in a phenolic resin (Black, 2004). Carbon
fiber/phenolic composite specimens were prepared by Cytec Engineered Materials
(Tempe, AZ) and fitted to a steel backer with an imbedded thermocouple. This
composite ablative material, combined with a set of nano-particles, was tested using a
laboratory scale rocket motor with gas torch and spray of abrasive aluminum oxide
particles. The test with exhaust plume of temperatures up to 2200°C (3992°F) and
velocity near 2000 meters per second proved that the carbon nanofillers at 28 percent

35
loading showed that erosion resistance was improved, compared to the baseline ablative
material. Temperatures measured were also lower within the heated test samples (Black,
2004).
1.4. Mechanical Testing Methods Characterization of material mechanical properties can be determined in a destructive or
non-destructive method of testing. While non-destructive methods allow for the material
structural integrity to not be compromised, destructive methods are typically employed in
structural or mechanical testing due to the direct measurement of load, displacement and
strain up to the failure limit of the material. For this study, material characterization and
testing of both commercial grade and in-house processed silicon carbide specimens is
performed with uni-axial compressive loading.
1.4.1. Experimental Approaches to Compression Testing Measurement of material displacement or strain is considered most importantly for
determination of the specimen elastic modulus, particularly for uni-axial compressive (or
tensile) test methods. There are several measurement devices that allow for
determination of material strain to determine the specimen elastic modulus. These
devices include lower cost electric resistance metallic foil strain gages, up to higher cost
electric resistance displacement gages known as extensometers. To alleviate contact with
the specimen, optical and laser strain extensometers can be used (Dyson, 1989). In
mechanical testing of ceramics at high temperatures, metallic foil strain gages cannot be
used. These types of sensors, which are bonded to the test specimen with an adhesive,

36
typically require temperatures below 100°C to ensure successful measurement without
temperature effects. Some specialty ceramic bonded wire resistance gages made of
Palladium Chromate (PdCr) have been used with successful repeatability up to
temperatures of 800°C (1470°F) in gas turbine engine testing (Lei, 1993). Attaining
accurate data using these sensors is not a function of temperature, however, factors of
purity of the gage wire, purity of installation materials, and quality of the installation
technique proved to allow for highly varying strain measurement.
In testing of ceramics, at any temperature, there are several requirements of the testing
apparatus that must be considered to ensure proper loading of specimens. Experimental
errors can occur primarily within the specimen shape and in the design of the test
fixtures. Testing of silicon carbide, due to its high strength, high stiffness and high
hardness, creates difficulties in the design of both test fixtures and specimen geometry.
Without considering the test specimens, silicon carbide is considered for use in test
fixtures for testing other engineering ceramics at temperatures up to 1500°C in air
(Dyson, 1989). Testing a material that is used for the fixture material in testing other
high performance ceramics in uni-axial compression proves that design of test fixtures
and specimen geometry is not trivial. To further increase complexity, strength and
stiffness data of ceramic materials allow for scattered results due to the sensitivity of
material properties to material structure defects (Dyson, 1989). To determine test
specimen geometry, method of loading, and further design of fixtures, pertinent ASTM
standards to compression testing of ceramic materials were considered.

37
1.4.2. ASTM C773 ASTM C773-88 (1999), Standard Method for Compressive (Crushing) Strength of Fired Whiteware Materials. This standard tests the load bearing capabilities of ceramic materials through an end
loading technique. Right cylindrical specimens are loaded by ceramic contact cylinders
or load platens which are attached to bearing plates and attached to the load platens of the
test machine. The specimen size is much smaller than that of the test machine, and of a
size 0.250 +/-.001 inches in diameter and 0.500 inches +/- 0.002 inches long. Contact
faces of the specimens should be parallel to within 0.0005 inches. It is recommended to
diamond grind the ends of all specimens with a 100 grit or finer wheel.
In order to allow for a good statistical distribution of the data, the standard recommends
the number of test specimens to be no less than ten. Ceramic contact cylinder size is
slightly larger than the test specimen at 0.5 inches tall and 0.625 inches in diameter, with
contact faces being parallel to 0.0005 inches. The standard recommends that the two
contact cylinders must be replaced after each specimen is tested, to ensure that the next
tested specimen data is not affected if any micro-cracking of the contact cylinders occurs
and the contact cylinder fails. The contact cylinders should be of similar composition, of
equal or greater stiffness (elastic modulus) and of equal or higher tensile strength to that
of the test specimen. The bearing plates used in the test apparatus should be of hardened
steel, Rockwell hardness C60, of 2.5 inches in diameter by 1.0 inches tall, and have a
surface ground finish flat and parallel to 0.001 inches. A diagram of the test apparatus
for compressive strength is shown in Figure 1.7.
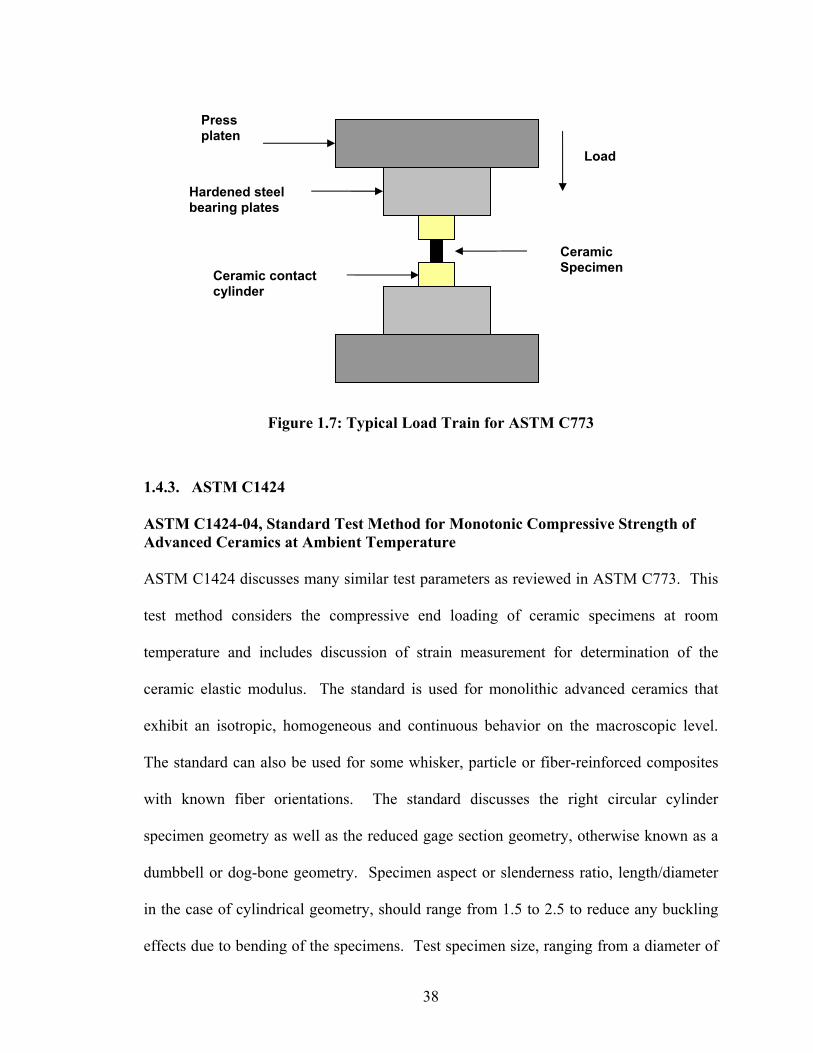
38
Figure 1.7: Typical Load Train for ASTM C773
1.4.3. ASTM C1424 ASTM C1424-04, Standard Test Method for Monotonic Compressive Strength of Advanced Ceramics at Ambient Temperature ASTM C1424 discusses many similar test parameters as reviewed in ASTM C773. This
test method considers the compressive end loading of ceramic specimens at room
temperature and includes discussion of strain measurement for determination of the
ceramic elastic modulus. The standard is used for monolithic advanced ceramics that
exhibit an isotropic, homogeneous and continuous behavior on the macroscopic level.
The standard can also be used for some whisker, particle or fiber-reinforced composites
with known fiber orientations. The standard discusses the right circular cylinder
specimen geometry as well as the reduced gage section geometry, otherwise known as a
dumbbell or dog-bone geometry. Specimen aspect or slenderness ratio, length/diameter
in the case of cylindrical geometry, should range from 1.5 to 2.5 to reduce any buckling
effects due to bending of the specimens. Test specimen size, ranging from a diameter of
Ceramic Specimen Ceramic contact
cylinder
Hardened steel bearing plates
Press platen
Load

39
0.200 to 0.250 inches with aspect ratios from 1.5 to 2.5, results in lengths ranging from
0.300 to 0.625 inches, depending on the aspect ratio used. Along with a reduced gage
section geometry with cylindrical shape and a revolved fillet about the vertical axis of the
specimen, hardened steel load bearing plates with a similar revolved fillet of larger
diameter are recommended for contact with the specimens. It is recommended to use
contoured, reduced gage sections to allow for better results of maximum strength of the
material based on prior experiments and finite element modeling. Figure 1.8 gives an
example geometry recommended as a function of specimen height (not to scale).
Figure 1.8: Typical reduced gage section (dumbbell) specimen, ASTM C1424-04
Use of strain gages and extensometers is discussed for strain measurement, where the
gage section of the material is along the length of the small specimen. The allowable
bending of the specimens is minimized by the design of the test fixtures, with loading
surfaces parallel to 0.005 inches. With testing performed at room temperature, four
H
0.26H
0.17H
0.65H
0.17H
0.35H

40
bondable foil strain gages can be placed around the circumference of the specimen, 90
degrees apart from one another, so that bending effects can be detected if one or two
sides strains in compression, while the other one or two gages strains in tension. Ideally,
there should be no bending of the specimen and all strain will be compressive due to the
test. If bondable gages are not used and bending is still of concern, the failure mode of
the material can allow insight. Vertical cracking or splitting of the specimen indicates a
non-axial stress as a result of bending or misalignment of the specimen about the load
path. It is desired to have failure along the reduced gage section of the specimen so that
the gage section pulverizes. Upon failure, the amount of energy release with ceramic
materials is high.
With monolithic ceramics, typical failure releases a high amount of energy upon rupture,
possibly causing the specimen to pulverize and shatter into pieces. A comparison to the
Euler column buckling equation can be used if specimens fail at stresses greater than or
equal to the critical buckling stress. These specimens would not represent the uni-axial
compressive strength of the material. The Euler column buckling equation for a
specimen of elastic modulus, E, moment of inertia, I, and length, L, for fixed or clamped
boundaries is given in the following equation.
2
24AL
EIA
Pcr πσ == (5)
As a check, the Euler buckling load and buckling stress can be calculated to assure that
there is no failure occurring due to the geometry of the specimens.
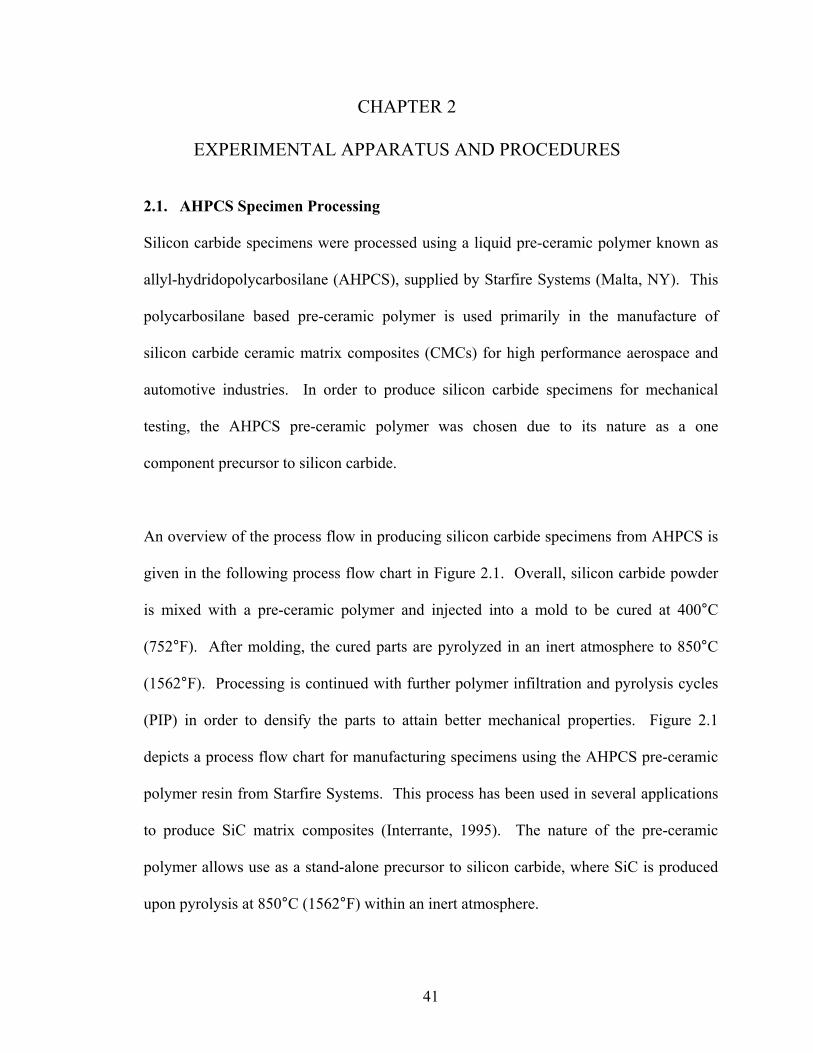
41
CHAPTER 2
EXPERIMENTAL APPARATUS AND PROCEDURES
2.1. AHPCS Specimen Processing Silicon carbide specimens were processed using a liquid pre-ceramic polymer known as
allyl-hydridopolycarbosilane (AHPCS), supplied by Starfire Systems (Malta, NY). This
polycarbosilane based pre-ceramic polymer is used primarily in the manufacture of
silicon carbide ceramic matrix composites (CMCs) for high performance aerospace and
automotive industries. In order to produce silicon carbide specimens for mechanical
testing, the AHPCS pre-ceramic polymer was chosen due to its nature as a one
component precursor to silicon carbide.
An overview of the process flow in producing silicon carbide specimens from AHPCS is
given in the following process flow chart in Figure 2.1. Overall, silicon carbide powder
is mixed with a pre-ceramic polymer and injected into a mold to be cured at 400°C
(752°F). After molding, the cured parts are pyrolyzed in an inert atmosphere to 850°C
(1562°F). Processing is continued with further polymer infiltration and pyrolysis cycles
(PIP) in order to densify the parts to attain better mechanical properties. Figure 2.1
depicts a process flow chart for manufacturing specimens using the AHPCS pre-ceramic
polymer resin from Starfire Systems. This process has been used in several applications
to produce SiC matrix composites (Interrante, 1995). The nature of the pre-ceramic
polymer allows use as a stand-alone precursor to silicon carbide, where SiC is produced
upon pyrolysis at 850°C (1562°F) within an inert atmosphere.

42
Figure 2.1: Process Flow Chart for Manufacturing AHPCS Specimens
Upon mixing the AHPCS polymer resin and silicon carbide powder in a conventional
mixer, the slurry is loaded into a cylinder with ram piston. A flow tube is attached to the
loaded piston/cylinder, which is then attached to a steel mold which is located inside a
furnace. Gas pressure is applied to the slurry via the piston, in which the slurry is
injected into the mold through the flow tube. When injecting, pressure is held constant as
the mold is heated to the cure temperature of the pre-ceramic polymer resin. Once cured,
a green body silicon carbide part consisting of cured polymer and SiC powder is removed
from the mold. The molded component or components are then placed in a tube furnace,
without the mold, and pyrolyzed freestanding in an inert atmosphere. The pyrolyzed
SiC Powder Pre-ceramic polymer resin
Mixing
Injection
Cure
Pyrolysis
Mass, density measurement
Mold Removal/Machining
Polymer Infiltration (VARTM)
Yes
No
Machining
1 cycle
Porosity measurement
2+ cycles
Finished Part

43
component is measured for mass, and density is calculated from mass and the part
dimensions once it has cooled. If the desired part needs to be more dense (less porous),
the part is infiltrated with more pre-ceramic polymer resin using vacuum assisted resin
infusion (VARI), a vacuum assisted resin transfer molding (VARTM) method, or a
method known as polymer infiltration and pyrolysis (PIP). These three methods achieve
the same goal, where polymer is introduced to the pores of the ceramic to create a more
dense material under vacuum in the absence of air in the atmosphere. Regardless of resin
transfer method to the material, multiple infiltration cycles should be performed. Up to
eight cycles in previous research have yielded desirable results for material strength and
stiffness (Interrante, et. al, 1995), where the component saturated with polymer resin is
placed back in a furnace in an inert atmosphere and pyrolyzed. With this particular
polymer resin, a specimen or group of specimens is cured using the injection molding
process previously described at 400°C (752°F), and then pyrolyzed to 850°C (1562°F) to
fully convert the pre-ceramic polymer to a ceramic silicon carbide state. Porosity after
each cycle can be calculated from the change in volume from the dry state to the wet state
by taking mass and volume measurements.
After pyrolysis, if machining is desired after one cycle, it is recommended to machine the
components in the early stages of the processing due to the large amount of open porosity
and low density of the silicon carbide. Dense silicon carbide requires diamond tooling,
wearing the tool much faster when dealing with close to 0% porosity SiC components.
The component is measured once again for mass, density and porosity after machining.
If satisfactory properties of the SiC component are met, the part is completely processed.
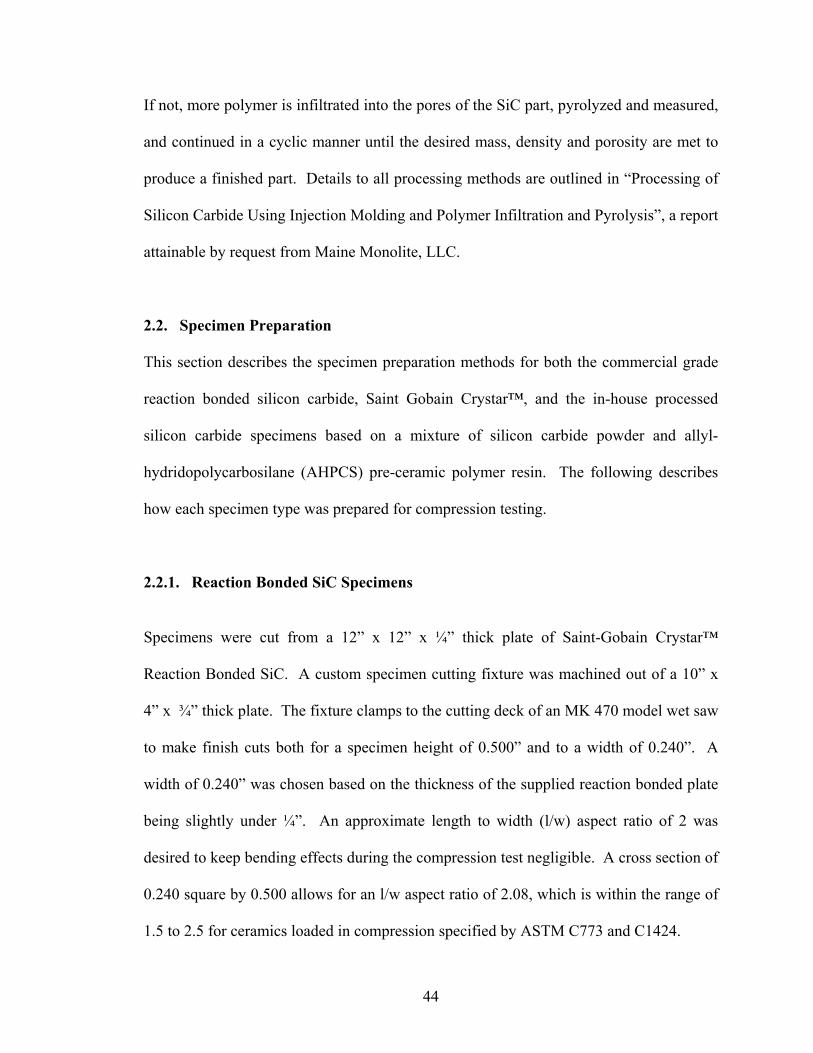
44
If not, more polymer is infiltrated into the pores of the SiC part, pyrolyzed and measured,
and continued in a cyclic manner until the desired mass, density and porosity are met to
produce a finished part. Details to all processing methods are outlined in “Processing of
Silicon Carbide Using Injection Molding and Polymer Infiltration and Pyrolysis”, a report
attainable by request from Maine Monolite, LLC.
2.2. Specimen Preparation This section describes the specimen preparation methods for both the commercial grade
reaction bonded silicon carbide, Saint Gobain Crystar™, and the in-house processed
silicon carbide specimens based on a mixture of silicon carbide powder and allyl-
hydridopolycarbosilane (AHPCS) pre-ceramic polymer resin. The following describes
how each specimen type was prepared for compression testing.
2.2.1. Reaction Bonded SiC Specimens Specimens were cut from a 12” x 12” x ¼” thick plate of Saint-Gobain Crystar™
Reaction Bonded SiC. A custom specimen cutting fixture was machined out of a 10” x
4” x ¾” thick plate. The fixture clamps to the cutting deck of an MK 470 model wet saw
to make finish cuts both for a specimen height of 0.500” and to a width of 0.240”. A
width of 0.240” was chosen based on the thickness of the supplied reaction bonded plate
being slightly under ¼”. An approximate length to width (l/w) aspect ratio of 2 was
desired to keep bending effects during the compression test negligible. A cross section of
0.240 square by 0.500 allows for an l/w aspect ratio of 2.08, which is within the range of
1.5 to 2.5 for ceramics loaded in compression specified by ASTM C773 and C1424.
45
The plate was initially cut using an MK 101 wet saw with 10 inch diamond impregnated
wheel. Cuts taken along one side of the plate allowed for a rough oversized dimension of
approximately 0.575 inch wide by 12 inches long. The 10 inch wheel proved to be too
large for cutting specimens of small, accurate dimension due to the vibrations that
occurred during the cut. An MK 470 Wet Saw with 7 inch diameter wheel was used to
make the more precise cuts to attain dimensional stability with all specimens.
The oversized dimension was affixed in the custom aluminum fixture attached to the MK
470 wet saw with 7 inch diameter wheel. This fixture was aligned and perpendicular to
the cutting wheel on the MK 470 with a tolerance of 0.003” along the length of the 12
inch SiC strip. The strip of SiC was clamped along the long edge of the fixture using ¼-
20 UNC cap screws, and then cut to a finish 0.500” width. This dimension is the height
of the specimens for testing. The height dimension, using the finish cut to 0.500” with a
tolerance of .003” along the 12 inch length of the strip allowed for specimens to be within
the 0.0005” length and parallelism requirements for testing. In other words, one side of
the height dimension had to be with this tolerance to the height measurement on the other
side of the specimen. Once this dimension was established, the SiC strips were ground
on all sides using an upright belt sander. An upright belt sander aided in polishing the
surface of the SiC, but had no affect on the dimensional stability.

46
Figure 2.2: Photograph of MK 470 Wet Saw with cutting fixture
The specimens are then cut to width of 0.240” using the same fixture. When the fixture
is rotated 90 degrees from the original cut, the cutting wheel is allowed to pass through it
through a slot. The purpose of this slot for the cutting wheel is to support the specimen
on both sides as slowly being cut to a width of 0.240”. When doing so, the specimen
rests in another milled slot perpendicular to the cutting wheel path, so that it is supported
as it is being cut. A cover allows a clamp to be placed on the cut specimen to further
restrict movement. Since this material is extremely brittle and it is desired for small,
precise dimensions, the fixture aids in specimen cutting significantly. Cutting to a width
of 0.240” allowed for a good width dimension to be attained, all specimen widths were
within 0.010” of one another, as well as the dimension from the thickness of the plate.

47
Since the plate is pressed from a reaction bonding process using an SiC preform
infiltrated with molten silicon, the plate thickness was fairly constant, and was well
within this 0.010” tolerance.
Figure 2.3 is a photograph of a silicon carbide specimen pulled from the aluminum
cutting fixture soon after a cut was made. The micrometer used in the photo was used to
only hold the specimen in place for the photograph. The specimen was cut from the
sample on the right hand side of the cutting wheel path, where the cutting wheel passes
through the slot running perpendicular to the silicon carbide strip. The SiC strip is held
in place by the ¼”-20 UNC cap screw at the upper right hand corner of the photo.
Figure 2.3: Photograph of Cut Specimen Removed From Fixture

48
To experiment with the cutting of the MK470 wet saw and aluminum test fixture, E-
glass/vinyl-ester composite plates that were readily available as scrap in the laboratory
from previous projects were cut to size to fine tune the measurement and cutting
techniques for cutting the silicon carbide specimens. Measurements were taken with a
dial indicator with 0.001” resolution to test the size of the cut accurately.
After administering a few compression tests, it was determined early in testing that either
the specimen geometry needed to be changed to allow for better failure of the specimens
or the fixtures needed to be modified or completely changed. Initial compression testing
performed at both room temperatures and one test at 800°C (1472°F) and 1000°C
(1832°F) allow for data to be compared with the reaction bonded Saint Gobain Crystar™
specimens. During preliminary compression testing, the silicon carbide platens, also of
the same composition of that of the test specimens, were prone to failure when the
specimens were loaded to rupture. A photograph of one of the failed silicon carbide
platens is given in Figure 2.4. Figure 2.5 details the vertical cracking failure of the fully
fired alumina platen. This behavior is expected in any material when the load platens are
of the same material composition of the tested specimen, but was more apparent at high
temperatures when using the silicon carbide material. Upon failure of one of the high
temperature tests, RB-SiC-HT-02, which was a test administered at 800°C, it was
observed that not only the silicon carbide platen failed before ultimate failure of the test
specimen, but the lower fully fired alumina platen also failed.

49
Figure 2.4: Failed silicon carbide platen
Figure 2.5: Failed alumina (fully fired) platen

50
The rectangular prism geometry allows for good strength and stiffness data, but tests
were prone to premature failure of the silicon carbide load platens. Upon failure of these
fixtures, it was determined that there were two options to improve the test setup. The
first was to fabricate a load platen with a spherical ball end, which would mate to the
90% alumina fixture with a female spherical socket. This would require a strong, stiff,
oxidation resistant platen to be manufactured out of either alumina or silicon carbide.
Upon investigation of processing such a fixture, high costs and lead times are inherent
due to the method of form grinding a spherical ball shape with a diamond wheel. It was
determined that the specimen geometry could be altered instead. This option would
allow use of the dumbbell shape specimen similar to what was previously mentioned in
ASTM standard C1424. Fabricating a dumbbell specimen would require use of a profiled
grinding wheel to create the desired geometry at a lower cost compared to fabricating the
spherical ball and socket fixtures. The dumbbell geometry was chosen to compress the
reaction bonded silicon carbide to failure, where a rectangular prism geometry, of the
same material, would be used to attain stiffness data with the extensometer, without
loading the material to failure. This would give an accurate representation of the reaction
bonded specimen data, to prove that the method of compression testing works well
enough to allow for accurate testing of the AHPCS specimens fabricated in-house. A
technical drawing of the dumbbell shape specimens is given in Figure 2.6.
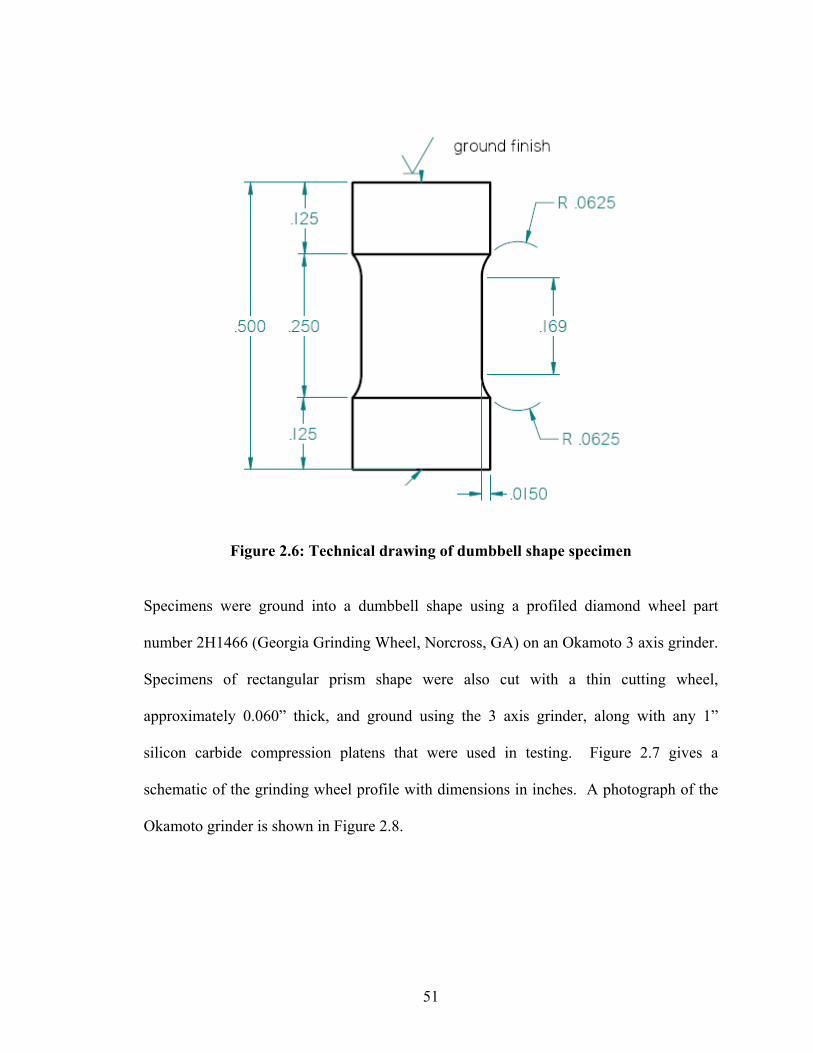
51
Figure 2.6: Technical drawing of dumbbell shape specimen
Specimens were ground into a dumbbell shape using a profiled diamond wheel part
number 2H1466 (Georgia Grinding Wheel, Norcross, GA) on an Okamoto 3 axis grinder.
Specimens of rectangular prism shape were also cut with a thin cutting wheel,
approximately 0.060” thick, and ground using the 3 axis grinder, along with any 1”
silicon carbide compression platens that were used in testing. Figure 2.7 gives a
schematic of the grinding wheel profile with dimensions in inches. A photograph of the
Okamoto grinder is shown in Figure 2.8.

52
Figure 2.7: Profiled grinding wheel dimensions
Figure 2.8: Okamoto grinder used to grind reaction bonded specimens
8
1.25
0.125
R = 0.0625
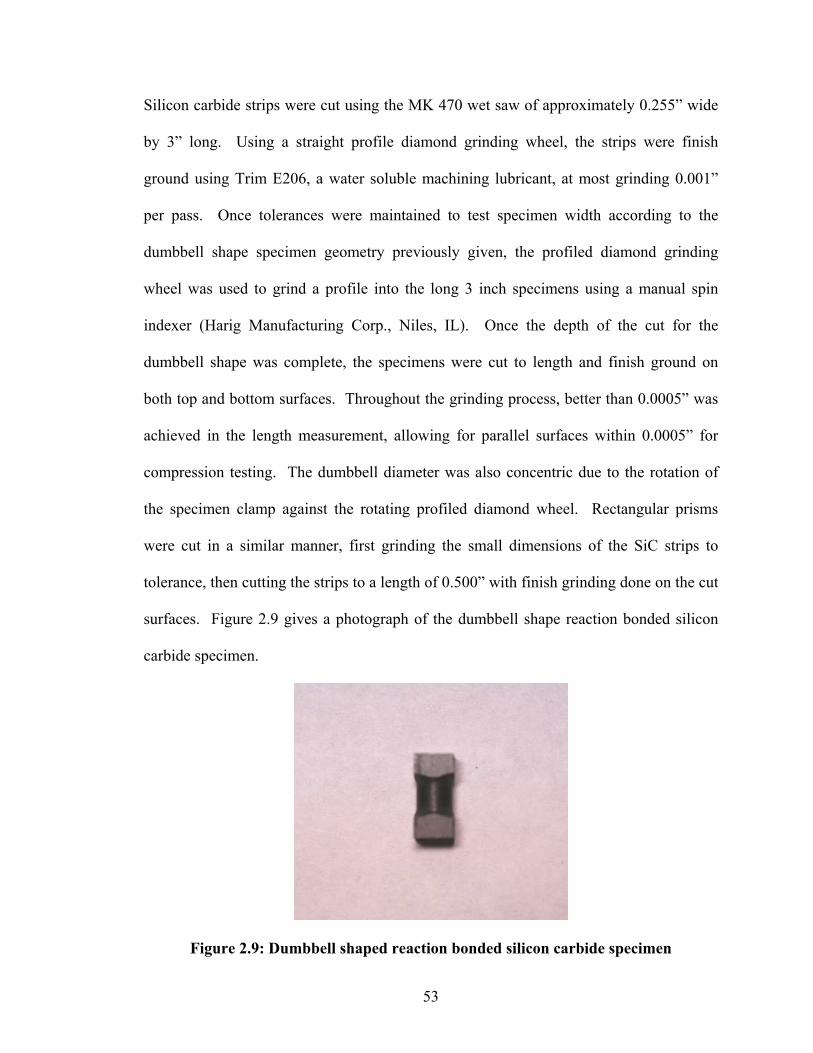
53
Silicon carbide strips were cut using the MK 470 wet saw of approximately 0.255” wide
by 3” long. Using a straight profile diamond grinding wheel, the strips were finish
ground using Trim E206, a water soluble machining lubricant, at most grinding 0.001”
per pass. Once tolerances were maintained to test specimen width according to the
dumbbell shape specimen geometry previously given, the profiled diamond grinding
wheel was used to grind a profile into the long 3 inch specimens using a manual spin
indexer (Harig Manufacturing Corp., Niles, IL). Once the depth of the cut for the
dumbbell shape was complete, the specimens were cut to length and finish ground on
both top and bottom surfaces. Throughout the grinding process, better than 0.0005” was
achieved in the length measurement, allowing for parallel surfaces within 0.0005” for
compression testing. The dumbbell diameter was also concentric due to the rotation of
the specimen clamp against the rotating profiled diamond wheel. Rectangular prisms
were cut in a similar manner, first grinding the small dimensions of the SiC strips to
tolerance, then cutting the strips to a length of 0.500” with finish grinding done on the cut
surfaces. Figure 2.9 gives a photograph of the dumbbell shape reaction bonded silicon
carbide specimen.
Figure 2.9: Dumbbell shaped reaction bonded silicon carbide specimen

54
Silicon carbide load platens of the same composition were also ground to high tolerance
using the straight profile grinding wheel and Okamoto grinder. This allowed the
specimens to be loaded against a parallel surface, well within 0.005”, to promote failure
of the specimen. It was found that even though the specimen failed under load, the
silicon carbide platens had a short life as they tended to crack after several tests.
2.2.2. AHPCS SiC Specimens At the 400°C (752°F) green cured state from the injection molding process, the
specimens can be easily machined and formed into shape using a diamond wheel, or
sanded, ground or filed dry using grinding or sanding equipment. A belt sander was used
to prepare the specimens for pyrolysis. The specimens were sanded into rectangular
prisms to relieve them from all major flaws and imperfections in the form of cracks and
porosity to attain good dimensional stability for volume measurements. Specimens cut to
relieve the specimens of imperfections or sheared corners that occurred from removal of
the part from the mold, or from part cracking due to high porosity, were cut with a South
Bay Technology low speed wet saw. The diamond wheel thickness of 0.008” and 3”
diameter provided for a thin cut with minimal specimen loss, and was used without water
cooling. The dry cutting allowed for some sticking of the specimen, but allowed the
specimen to be cut easily due to the green state it was cured in. One cut through a
specimen thickness of approximately 0.75” and height 1.0” takes approximately 5-10
minutes. As previously mentioned, some specimens were sanded to relieve minor
blemishes and imperfections, and some specimens had to be cut into as many as three
separate pieces to remove undesired imperfections to allow for reasonable specimens for

55
processing and compression testing. Once specimens are cut using the saw, the
specimens can be finish sanded to attain good dimensional stability. A photograph of the
South Bay Technology wet saw is shown in Figure 2.10.
Figure 2.10: Photograph of South Bay Technology Wet Saw
Calipers of 0.001” tolerance were used to measure the dimensions of the specimens
during preparation. A tolerance of 0.005” between surfaces was desired, most
dimensions being with 0.002-0.003”, one dimension varied as much as 0.009” on a side.
Three measurements per side were taken. Once dimensions are determined, average
volume can be calculated and the specimen can be weighed on a 0.0001 gram resolution
scale (Denver Instruments, Model AE100). The specimens are placed on a graphite plate
for pyrolysis in the furnace in an inert atmosphere.
SiC specimen

56
To pyrolyze the specimens, an alumina tube furnace with a P.I.D. temperature controller
under a flow of nitrogen gas was used. Overall, the furnace was vacuumed and the
chamber was flooded with nitrogen. Upon three vacuum and nitrogen flooding cycles,
the nitrogen gas was left on to flow through the furnace, relieving any byproducts of
hydrogen and methane upon pyrolysis through the outlet valve. Dry specimens were
processed at a ramp rate of 2°C/min up to 400°C, the temperature was held for one hour.
After the dwell period, the temperature was ramped at 1°C/min up to 850°C, where the
temperature would dwell for another hour. Wet specimens that were infiltrated with
polymer were processed at 1°C/min from room temperature to 850°C, and held at 850°C
for one hour. This processing was done at the recommendations of Starfire Systems.
Upon pyrolysis, the furnace naturally cooled to room temperature, where the specimens
could be handled. Specimen dimensions and mass were recorded, and the specimens
were prepared for a polymer infiltration cycle. Under vacuum, polymer was infused into
the pores of the part using the specific cycle as previously described. Porosity of the
parts was measured using the following equation, after the polymer had been vacuumed
into the pores of the specimens.
100% ×−
=bulk
immersedbulk
VVV
Porosity (1)
AHPCS
wetimmersed
mV
ρ= (2)

57
2.3. Compression Testing Equipment 2.3.1. MTS 653 Furnace and Temperature Control Equipment In order to conduct compression testing under high temperature to verify the mechanical
properties of the commercial and in-house processed silicon carbide, an MTS model 653
furnace is used in conjunction with the MTS 810 hydraulic actuator. The original furnace
temperature controller was insufficient for accurate temperature control. A computer
program written in Delphi code was developed (Caccese, Malm and Walls, 1999) and
later modified using a custom electrical relay box and data acquisition for high
temperature testing of carbon/carbon composites (Walls, 2002). The temperature control
program is integrated for use on several pieces of equipment due to its modular platform.
A schematic of the furnace, relay box, DAQBook and PC interface with appropriate
wiring is given in Figure 2.11.
Figure 2.11: Schematic of Furnace and Temperature Control Equipment
Furnace
Relay Box
PC and control programThermocouples Data Acquisition

58
2.3.1.1. MTS 653 Furnace The MTS 653 model furnace consists of a two sided assembly less than a cubic foot in
volume resting on a cantilever beam support frame. The two sided assembly allows the
furnace to slide open so that the specimen tested is surrounded by six graphite heating
elements three to each side, capable of withstanding continuous temperatures of 1400°C
(2552°F). Fully fired porous alumina of one inch thickness is used to insulate the furnace
on all sides, which is supported by a stainless steel shell. Five platinum/rhodium thin
gauge Type R thermocouples (Omega Engineering, Stamford, CT) with maximum use
temperature of 1450°C are installed on one side of the furnace near the heating elements
to provide temperature measurement. The five thermocouples are shown in Figure 2.12.
Figure 2.12: Heating elements and thermocouples
Five thermocouples
Heating Elements

59
2.3.1.2. Electrical and Wiring The furnace heating elements are wired in parallel in three sets in order for the top,
middle and bottom heating elements to turn on or off during heating of the furnace. The
photograph in Figure 2.12 shows the three heating elements. The electrical box
containing the relays to turn power on or off to the elements is shown in Figure 2.13.
Figure 2.13: Furnace electrical box
Two sets of cables running from the furnace into the electrical box allow for parallel
wiring to three solid state 24-280 VAC relays (Omega Engineering, Stamford, CT)
controlled by a 0-5 VDC signal. Each relay corresponds to the appropriate set of heating
elements used in the furnace; top, middle and bottom, respectively. An electrical cable
with a 9-pin D-sub connector is used to transmit the 0-5 VDC signal from the digital card
on the DAQBook 200 to the three relays in the electrical box. Green pilot lights are used
240V power
D-sub 9 pin
Furnace power

60
to display live electrical current when power is on, and an orange service light is turned
on as the heating elements receive current from the relays, as seen in Figure 2.14,
remaining off when the elements are off.
Figure 2.14: Furnace electrical box interior view
2.3.1.3. Data Acquisition A high/low voltage signal ranging from 0-5 Volts is transmitted to the solid state relays in
the electrical box via the electrical cable with 9-pin D-sub connector from the DAQBook
200 digital card. A constant DC voltage, approximately 3.7 volts, is applied when the PC
based Delphi temperature control program sends a binary high signal, specifically a 1, to
turn the heating elements on. A binary low signal, a 0, opens the relays and does not
allow a voltage to power the heating elements. Based on the furnace heating elements
turning on or off using binary control, all of the positive terminal and negative terminal
wiring is wired into the same ports on the DAQBook 200 digital card.
Solid State Relays

61
The five MTS 653 Furnace Type R thermocouples are used for temperature measurement
of five zones of the furnace. These thermocouples are wired into a DBK-19
thermocouple card in the DAQBook 200. Typically read as electromotive force (EMF)
or millivolts DC current when calibrating to temperature, these thermocouple signals are
read by the temperature control program as digital count signals. These signals provide
for temperature measurement for the temperature control program used to control heating
of the furnace. If temperatures desired by the control program are too low in the furnace
as read by the thermocouples, the program turns the heating elements on using the binary
signal through the digital card in the DAQBook 200. When temperatures are too high in
the furnace, a 0 binary signal sent through the digital card allows no current to pass
through the relays, resulting in natural cooling of the furnace.
2.3.1.4. Temperature Control Program (Autoclave) Control of the furnace using the temperature control program was originally written in a
Delphi program language (Caccese, Malm and Walls, 1999) and later modified several
times, improving on the control program and the front end PC interface. The furnace
operator can input the desired test temperature profile into a spreadsheet based form, or
use a configuration file loaded into the control program. A schematic of the temperature
ramp up, dwell and ramp down is shown in Figure 2.15. Table 2.1 lists the parameters of
time and temperature used for the varying high temperature tests.

62
Figure 2.15: Temperature vs. time profile for high temperature compression tests
Table 2.1: Times allocated for high temperature tests
Temp (Tss)
°C (°F) t1
(min) t2
(min) t3
(min) 600 (1112) 82 92 120 800 (1472) 110 120 160
1000 (1832) 140 150 200
A slow ramp rate of 7°C/min (12.6°F/min) up to the test temperature of 600°C (1112°F)
allows for slow heating of the alumina and silicon carbide fixtures, as well as the
specimen, as to not thermally shock the components for premature failure. This ramp
rate was used with success in a previous study of high temperature carbon-carbon
composites (Walls, 2002). With a dwell at the test temperature for 10 minutes and a 5
minute temperature equilibrium period, the approximate 4 minute compression test with a
load rate of 0.005 in/min resulted in ample time to administer the compression test. A
20°C/min (36°F/min) cooling period allows for assisted cooling with the furnace. It was
determined during testing that the cooling period was more critical at temperatures above
t0 t1 t2 t3
TSS
TROOM
Time
Temp

63
600°C, due to the rapid cooling of the test assembly. A screen capture of an example
input temperature profile is given in Figure 2.16, corresponding to a 7°C/min ramp to a
600°C (1112°F) high temperature test.
Figure 2.16: Autoclave Input Temperature File
Specific commands such as ramp and stop allow temperatures to ramp up the temperature
of the furnace to a desired set point over a specific period of time, dwell the temperature
profile using the same ramp command without specifying a change in temperature about
the start and end dwell points, and use the stop command to end the test. A screen
capture of the front end user interface is shown from one of the reaction bonded
compressive strength tests, specimen RB-SiC-600-05, during the cool down period after
92 minutes, in Figure 2.17.

64
Figure 2.17: Autoclave Control Front End User Interface 2.3.1.5. Control Algorithm The program utilizes a closed loop feedback control system to allow for temperature
control of the furnace with limited overshoot and steady operation at the set point
temperature. Most industrial process control systems use a P.I.D. control system,
specifically a Proportional-Integral-Derivative system. The MTS 653 Furnace and
Autoclave control program operates on a P.I. control system. In general, to control a
specific output via an input function using a P.I.D. controlled system, gain parameters are
multiplied by the input function in a proportional, integrated and differential format.

65
If a function e(t) is the error function of the P.I.D. controller, the output of the controller
m(t) is given in the following equation (Ogata, 2004):
⎥⎦
⎤⎢⎣
⎡++= ∫ ∞−
t
di
p dttdeTdtte
TteKtm )()(1)()( (3)
The parameters Kp, Ki and Kd are the controller gain parameters. Ti and Td are time
constants. Parameters Ki and Kd are equivalent to Kp/Ti and Kp*Td, respectively. The
error function in a P.I.D. controlled system is the difference in the measurement of the
system variable and the desired input variable, as in Equation 4. In the case of a furnace
that is temperature controlled, the measured thermocouple temperature is subtracted from
the set point temperature to result in the total error. This can be expressed as Equation 5.
measureddesiredte −=)( (4)
error = set point temperature – measured temperature (5)
Kp, the proportional gain, adjusts the output of the of the controller, m(t) according to a
proportional band of the error function e(t). A general system with only proportional
control can be described using Equation 6, where the furnace proportional control system
is described in Equation 7:
)()( teKtm p= (6) errorKOutput p *= (7) Ki, the integral gain, adjusts the output of the general controller, m(t), using the
proportional band, Kp and a time constant, Ti. For a general P.I. controlled system where
Ki = Kp/Ti, the output response is given in Equation 8. For the furnace, the integral gain,

66
Ki, adjusts the output of the system so that the total of error summed over time up to the
present is included in monitoring the error between the measured temperature and the set
point temperature. The furnace control response is listed in Equation 9.
⎥⎦
⎤⎢⎣
⎡+= ∫ ∞−
t
ip dtte
TteKtm )(1)()( (8)
( )dterrorKerrorKOutput ip ∫+= ** (9) Kd, the derivative gain, adjusts the output of the general controller, m(t), using the
proportional band, Kp, and a time constant, Td. For a general P.I.D. controlled system,
where Kd = Kp*Td, the output response is given in Equation 3, listed previously. For the
furnace, the derivative gain, Kd, adjusts the output of the system according to the rate of
change of the error (set point – measured) from the previous value. A P.I.D. output for
the general system follows Equation 3, listed previously, where a furnace control system
is listed in Equation 10.
( ) errordtdKdterrorKerrorKOutput dip ++= ∫** (10)
In any control system, the gains Kp, Ki and Kd are adjusted according to the desired
response required by the system. The furnace temperature control system uses these
three gain parameters to adjust the output temperature of the furnace. Systems using the
time constants, Ti and/or Td can also be adjusted. Typically, the integral time constant, Ti,
can be adjusted with the proportional gain, Kp to decrease steady state error of the output
function, but can increase the initial overshoot in the system. The derivative time

67
constant, Td, can be used with Kp to decrease the initial overshoot of the output function,
but also slows the transient response of the output. The time constants are not regarded
further in the temperature control program of the MTS 653 furnace due to the gains Kp,
Ki and Kd being used directly as control parameters. Gain controls of Kp = 0.05 and Ki =
0.01 are typically used to give good temperature control of the furnace at the steady-state
compression test temperature. An overshoot of 1 degree Celsius can be used, any finer
resolution is not necessarily feasible when testing at temperatures above a few hundred
degrees to control the steady-state temperature. Figure 2.18 displays the dialog box
where the control gains are input into the Autoclave control program.
Figure 2.18: PI Gain Control Parameters
In order to control the MTS 653 furnace, the control algorithm employs the proportional
and integral control bands (Walls, 2002). A differential control band could be
68
implemented, but is not necessary due to the response of the furnace output temperature
when given a control temperature profile. To allow for a description of the function of
the P.I. algorithm within the control program, one zone of the furnace is considered, as all
three zones of the furnace are controlled similarly. The proportional part of the control
algorithm is calculated by multiplying the proportional gain constant by the error, with
respect to the particular control zone, where the error is the difference in temperature
between the set point and the current temperature of the furnace. The control
programming for the proportional portion is listed as the following Equation 11, where
zone1Pterm is the proportional term for the upper zone of the furnace, zone 1.
ErrorzoneKpzonePtermzone 1*11 = (11)
The integral part of the control algorithm is calculated by multiplying the integral gain
constant by the sum of the error over time, which calculates the error at each data
sampling time increment of one second, as shown in Equation 12.
SumErrorzoneKizoneItermzone 1*11 = (12)
The output for the gains to supply the signal to turn on the heating elements, based on the
error, summed error over time, and the tuning constants, zone1Kp and zone1Ki are given
in Equation 13.
ItermzonePtermzonenPercentGaizone 111 += (13)
Zone1Kp and zone1Ki are the proportional and integral constants the user can tune,
which can be seen in the screen capture in Figure 2.17. In order to implement the gain

69
control with a P.I. controlled algorithm, a duty cycle is used. The heating elements can
only be turned on or off, due to the constant voltage applied to the solid state relays (0-
5V), which turns the heating elements on or off. A duty cycle allows for the heating
elements to remain on for a period of time. If a gain of 10 seconds in the duty cycle is
used, and a gain of 100% is returned from the P.I. algorithm, then the heating elements
will remain on for 10 seconds, consequently, if a 10% gain is returned, the elements will
return on for one second. As the error between the set point and the actual temperature
decreases, the gain will decrease, and the heating elements will only remain on for a short
amount of time, adjusting very well to the set point temperature based on the error, giving
a good steady-state temperature, within a few degrees, required for testing the silicon
carbide specimens under compressive loading.
2.3.1.6. Calibration The analog interface for the furnace allows for up to five thermocouples to be read by a
DBK19 thermocouple card. These five thermocouple signals are read as a digital signal,
analogous to the analog version of millivolts DC, by the temperature control program.
This digital signal was calibrated based on a known temperature using a set of Type R
thermocouples. A NIST (National Institute of Standards and Technology) traceable high
temperature dual thermocouple input digital thermometer, model HH506RA (Omega
Engineering, Stamford, CT) was used to calibrate the furnace thermocouples. Using a
raw data mode when running the furnace temperature control program, a temperature
profile was specified using the input ramp and stop functions. The furnace was ramped
up to an un-calibrated temperature based on the counts read in raw data mode.
70
Safe operating temperature during calibration was insured by using two furnace type R
thermocouples that were plugged into the HH506RA thermometer. An average reading
between both thermocouples, with several calibrations performed gave an accurate
temperature measurement. Raw data counts read by two of the three remaining
thermocouples on the temperature control program allowed for a raw data average. The
two thermometer thermocouples read temperatures close to one another inside the
furnace, while the two raw data thermocouples read temperatures outside of the
temperatures read by the thermometer.
For example, thermocouples two and three on the furnace output readings to the
HH506RA, while thermocouple one and four (top and second from bottom on the
furnace) were used as the raw data thermocouples. One thermocouple in each set
measured temperature very close to a heating element, and one was not. This procedure
allowed for good average measurement of temperature for calibration when running the
furnace at a steady state set point specified by the temperature control program.
The final calibration allowed data points to be taken at steady state temperatures using a
step temperature profile versus time, giving approximately 100°C between each
calibration point over a 1200°C range of the furnace. 1200°C was chosen as the high
temperature limit, despite the 1400°C maximum temperature of the heating elements, and
1450°C maximum of the thermocouples. Raw data counts plotted versus temperature in
degrees Celsius allowed for a fourth order polynomial line of best fit curve of better than
99.9% correlation between points. The coefficients and y-intercept of this polynomial are

71
input into the temperature control program entitled DAQ32HeatInterface. Post
calibration measurement comparison using both the control program and the HH506RA
thermometer allowed for average temperatures to be within 5°C throughout the 1200°C
temperature range. However, individual thermocouple readings displayed large
temperature gradients within the furnace of up to 100°C, when comparing the top and
bottom thermocouples during ramp up and steady state dwell periods. A calibration plot
is given in Figure 2.19
y = -1E-12x4 + 1E-08x3 - 8E-05x2 + 0.4365x - 64.608R2 = 0.9999
-200
0
200
400
600
800
1000
1200
1400
0 1000 2000 3000 4000 5000
Counts
Tem
p, C
Figure 2.19 Furnace Calibration using HH506RA Thermometer
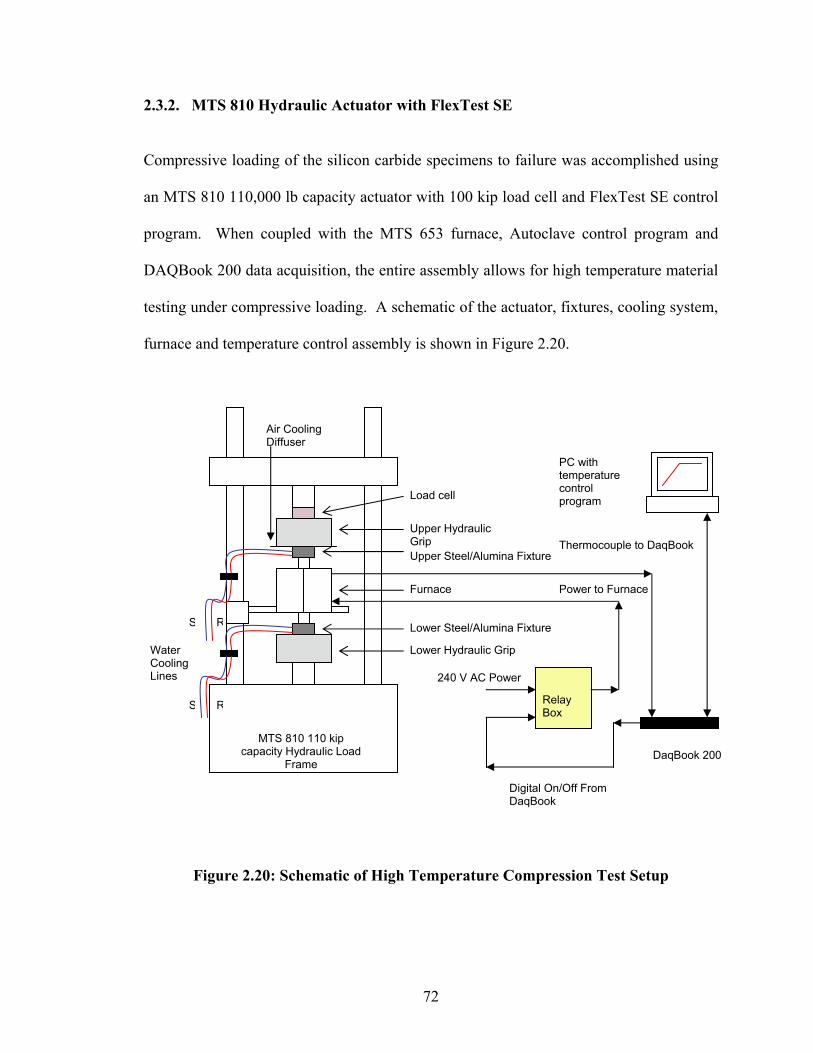
72
2.3.2. MTS 810 Hydraulic Actuator with FlexTest SE Compressive loading of the silicon carbide specimens to failure was accomplished using
an MTS 810 110,000 lb capacity actuator with 100 kip load cell and FlexTest SE control
program. When coupled with the MTS 653 furnace, Autoclave control program and
DAQBook 200 data acquisition, the entire assembly allows for high temperature material
testing under compressive loading. A schematic of the actuator, fixtures, cooling system,
furnace and temperature control assembly is shown in Figure 2.20.
Figure 2.20: Schematic of High Temperature Compression Test Setup
S R
S R
Water Cooling Lines
Furnace
Lower Hydraulic Grip
Upper Hydraulic Grip
Load cell
MTS 810 110 kip capacity Hydraulic Load
Frame
Upper Steel/Alumina Fixture
Lower Steel/Alumina Fixture
240 V AC Power
Digital On/Off From DaqBook
Relay Box
Thermocouple to DaqBook
Power to Furnace
DaqBook 200
PC with temperature control program
Air Cooling Diffuser

73
2.3.2.1. Fixtures The fixtures used to apply the compressive load to the silicon carbide specimens must be
able to attain high temperatures without degrading or oxidizing, while maintaining high
strength and stiffness. In a previous study used to test compressive response of a 3-D
woven carbon-carbon composite (Walls, 2002), alumina fixtures comprised of 90% dense
Rescor rods (Cotronics Corp., Brooklyn, NY) and fully-fired alumina discs of near 0%
porosity (Aremco Products, Inc., Valley Cottage, NY) were used successfully. The
Rescor alumina rods are interference fit into steel blocks, with two through holes drilled
and tapped for water coolant fittings. These fixtures can be seen in Figures 2.21, 2.22,
and 2.24.
Figure 2.21: Furnace and Fixtures Assembled on MTS 810 (W/O SiC Platens)
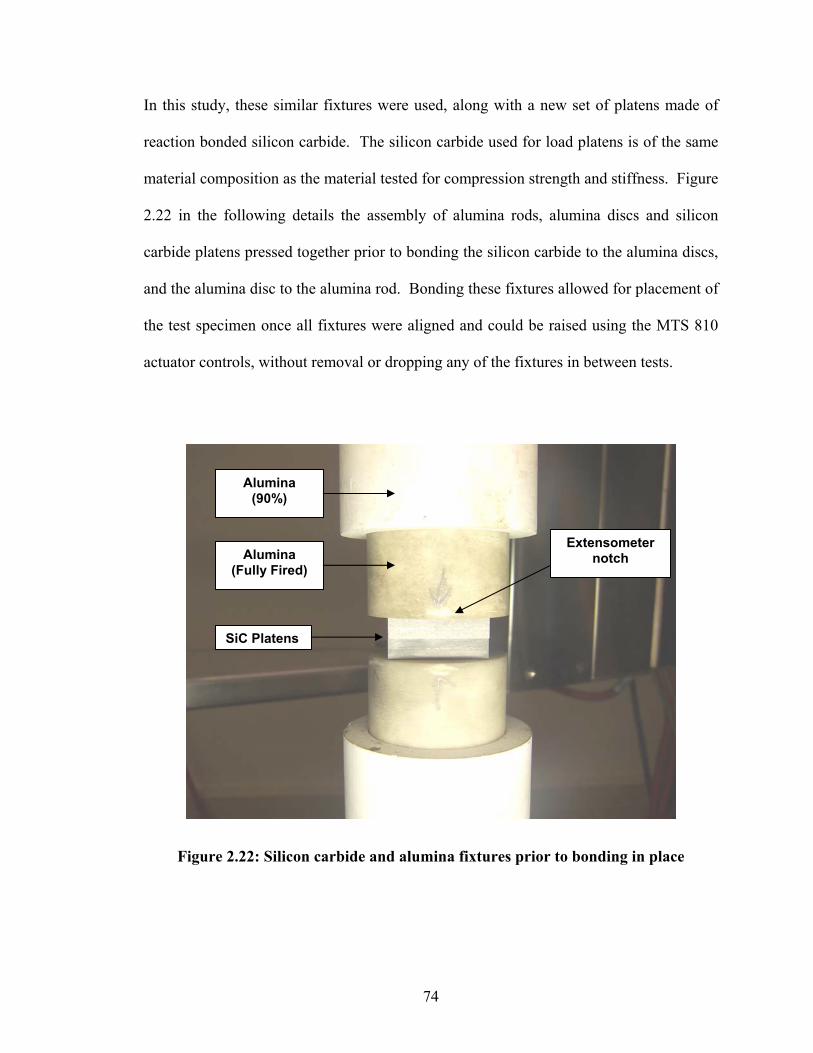
74
In this study, these similar fixtures were used, along with a new set of platens made of
reaction bonded silicon carbide. The silicon carbide used for load platens is of the same
material composition as the material tested for compression strength and stiffness. Figure
2.22 in the following details the assembly of alumina rods, alumina discs and silicon
carbide platens pressed together prior to bonding the silicon carbide to the alumina discs,
and the alumina disc to the alumina rod. Bonding these fixtures allowed for placement of
the test specimen once all fixtures were aligned and could be raised using the MTS 810
actuator controls, without removal or dropping any of the fixtures in between tests.
Figure 2.22: Silicon carbide and alumina fixtures prior to bonding in place
SiC Platens
Alumina (Fully Fired)
Alumina (90%)
Extensometer notch

75
2.3.2.2. High Temperature Extensometer In order to measure the strain of the 0.500” tall specimens, an MTS model 632.54E-11
high temperature extensometer was used. The device measures strain directly as a
percentage of its overall calibrated gage length of 1.000”. In tension, the gage measures
+10%, in compression it measures -5% of the gage length. The quartz lead rods run into
the furnace through a stainless steel housing the extensometer is fixed to, in order to
attach to the slots cut in the fully fired alumina platens, as seen in Figure 2.22. This
allows measurement of strain to calculate specimen stiffness under test conditions.
Figure 2.23: High Temperature Extensometer
Due to the gage length of 1.000”, the silicon carbide specimens were cut to length of
0.500” to keep a specimen slenderness ratio of approximately 2, due to the stock reaction
bonded SiC plate thickness of 0.235”-0.240”. This allowed a ground silicon carbide

76
platen of 1” square by 0.220” thick to be used to apply the compressive load to the
specimens, providing for a notch in the fully fired alumina discs of approximately 0.050”,
to allow for an approximate starting gage length at room temperature of 1.040”. Under
thermal expansion to high temperature, the maximum gage length measured by the
extensometer is 1.100” (+ 10% of gage length). This length was not exceeded, due to the
low thermal expansion of the SiC platens and specimen tested, once the extensometer
was attached to the notches of the alumina disc and the temperature was ramped to the
compression test temperature. Figure 2.24 details all of the fixtures in place, without the
furnace and cooling diffuser for the extensometer in place, with the specimen loaded and
extensometer attached.
Figure 2.24: Photograph of fixtures and high temperature extensometer
High Temp Extensometer
Alumina platens
Quartz rods
SiC Platens
SiC Specimen

77
Figure 2.25 is a photograph of the furnace enclosing the compression test specimen and
load platens. The extensometer extends through the furnace into and affixes to the
notches in the fully fired alumina platens. The air cooling diffuser on the left of the photo
cools the extensometer to allow for minimal strain dependency on temperature. Clean,
dry, shop air from the AMC building was used at 15 psi to allow for ample air cooling of
the extensometer, without affecting strain measurements. The stainless steel housing also
allows for deflection of radiation heat transferred from the furnace.
Figure 2.25: Photograph of furnace assembly with extensometer and cooling fixtures
Cooling diffuser S.S. Bracket
Extensometer
To Bendix Connector
78
CHAPTER 3
MECHANICAL PROPERTIES OF SILICON CARBIDE 3.1. Processing of AHPCS Specimens AHPCS specimens were processed using injection molding and later pyrolyzed in a
nitrogen atmosphere in an alumina tube furnace. Processing methods were experimented
with in the injection molding process, as well as the polymer infiltration and pyrolysis
cycles based on the literature and previous research success. The overall goal in
processing was to attain a repeatable method throughout the processing cycles in order to
achieve the best possible mechanical properties, when considering the material
compressive strength and stiffness. Overall, 23 specimens were cured using the injection
molding equipment and process previously described. Variation in test parameters
throughout the molding trials allowed for determining improvements for the process, as
well as to determine unnecessary or minor variations. Upon extraction from the mold, all
specimens in the 400°C (752°F) state had some sort of scattered porosity apparent on the
surface of the specimens with multiple cracks and imperfect edges from the inside of the
mold. An example of a specimen with good surface finish and low porosity is given in
Figure 3.1. All specimens were sanded with an upright belt sander to relieve the
specimens of all major sheared corners, cracks and porosity, to prepare for polymer
infiltration and pyrolysis, as seen in Figure 3.2. Some were cut into smaller shape with a
diamond wheel, yielding multiple specimens per molded trial, as seen in Figure 3.3 to
prepare the specimens for polymer infiltration and pyrolysis.

79
Figure 3.1: Specimen (I22) in the 400°C cured state from injection molding
Figure 3.2: Specimen Batch 2 in the 400°C cured state from injection molding
process after sanding rough surfaces
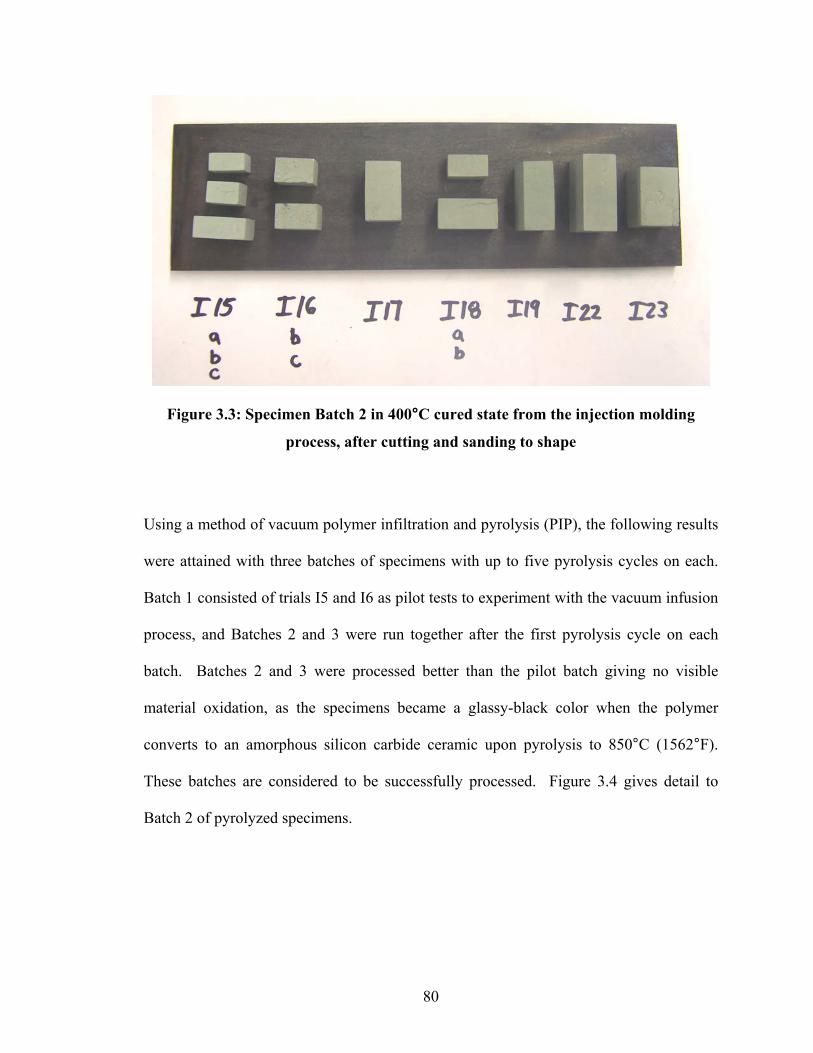
80
Figure 3.3: Specimen Batch 2 in 400°C cured state from the injection molding
process, after cutting and sanding to shape
Using a method of vacuum polymer infiltration and pyrolysis (PIP), the following results
were attained with three batches of specimens with up to five pyrolysis cycles on each.
Batch 1 consisted of trials I5 and I6 as pilot tests to experiment with the vacuum infusion
process, and Batches 2 and 3 were run together after the first pyrolysis cycle on each
batch. Batches 2 and 3 were processed better than the pilot batch giving no visible
material oxidation, as the specimens became a glassy-black color when the polymer
converts to an amorphous silicon carbide ceramic upon pyrolysis to 850°C (1562°F).
These batches are considered to be successfully processed. Figure 3.4 gives detail to
Batch 2 of pyrolyzed specimens.
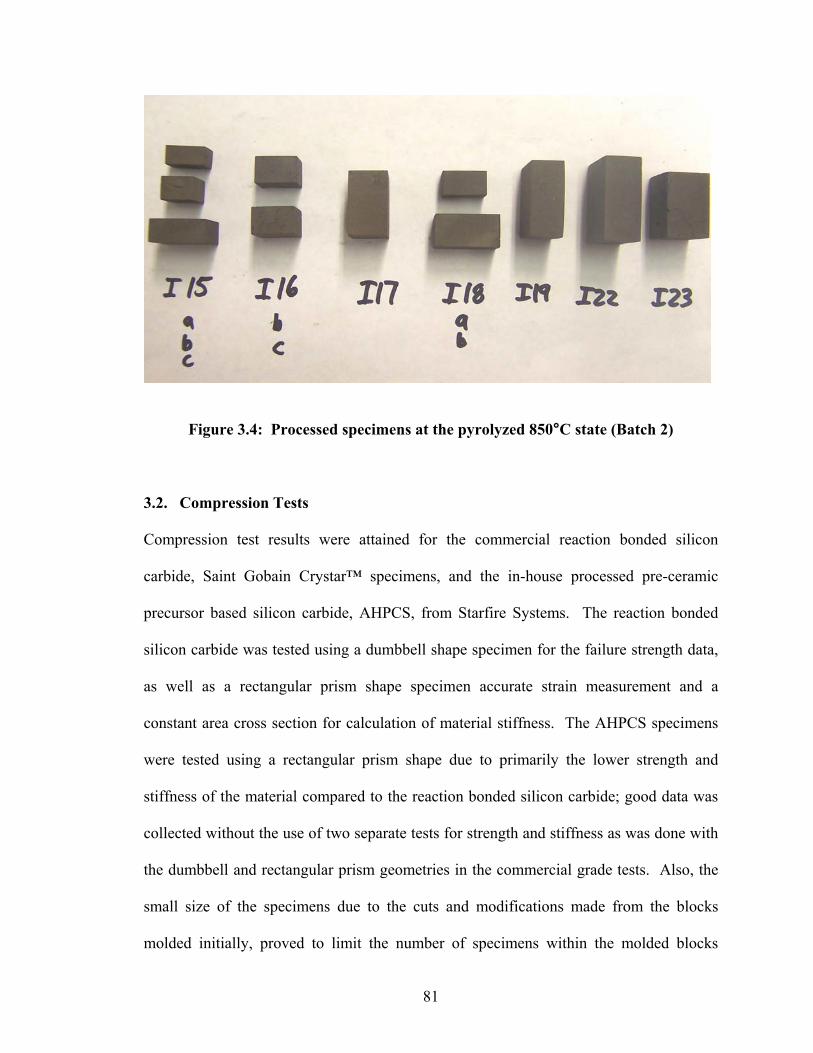
81
Figure 3.4: Processed specimens at the pyrolyzed 850°C state (Batch 2)
3.2. Compression Tests Compression test results were attained for the commercial reaction bonded silicon
carbide, Saint Gobain Crystar™ specimens, and the in-house processed pre-ceramic
precursor based silicon carbide, AHPCS, from Starfire Systems. The reaction bonded
silicon carbide was tested using a dumbbell shape specimen for the failure strength data,
as well as a rectangular prism shape specimen accurate strain measurement and a
constant area cross section for calculation of material stiffness. The AHPCS specimens
were tested using a rectangular prism shape due to primarily the lower strength and
stiffness of the material compared to the reaction bonded silicon carbide; good data was
collected without the use of two separate tests for strength and stiffness as was done with
the dumbbell and rectangular prism geometries in the commercial grade tests. Also, the
small size of the specimens due to the cuts and modifications made from the blocks
molded initially, proved to limit the number of specimens within the molded blocks

82
chosen for compression testing. It would further limit the number of tested specimens if
a dumbbell shape was desired.
The high temperature tests for the reaction bonded SiC yielded results that were
significantly higher in strength and stiffness when compared to the in-house processed
specimens. This result was expected, as the reaction bonded Saint Gobain Crystar™
plate was initially processed using a pressing method resulting in a very low porosity, on
the order of 0.1%, where the AHPCS specimens had higher porosity from processing
using injection molding. In order to gain an understanding of how well the AHPCS
specimens compare to the commercial reaction bonded silicon carbide, Figure 3.5 gives a
plot of the failure strength versus temperature for both materials; Figure 3.6 displays
elastic modulus versus temperature for both materials.
Average data for the reaction bonded specimens is taken from Table 3.9, where average
data for the AHPCS specimens is taken from Table 3.10 and Table 3.11 in the following
sections. One specimen was tested at room temperature for the reaction bonded
specimens, and three were tested to attain an average at the higher temperatures. Three
specimens, each from a different molded, pyrolyzed and infiltrated specimen, were tested
at each temperature including room temperature. For the reaction bonded specimens, a
significant decrease in strength occurs with increasing temperature. This may be
explained by the material composition, as the commercial grade Saint-Gobain Crystar
plate is not pure SiC; it is a re-crystallized Si-SiC composite of density 3.00-3.10 g/cc,
where the excess silicon reduces the density of the material, also allowing for a lower
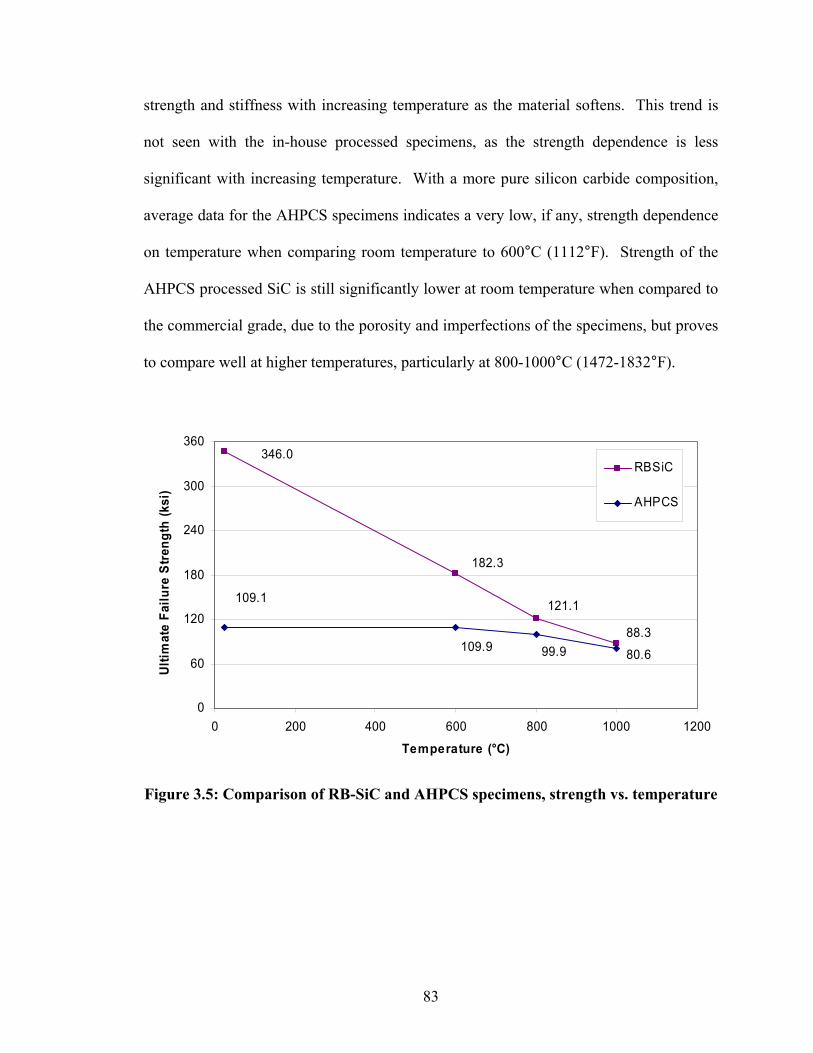
83
strength and stiffness with increasing temperature as the material softens. This trend is
not seen with the in-house processed specimens, as the strength dependence is less
significant with increasing temperature. With a more pure silicon carbide composition,
average data for the AHPCS specimens indicates a very low, if any, strength dependence
on temperature when comparing room temperature to 600°C (1112°F). Strength of the
AHPCS processed SiC is still significantly lower at room temperature when compared to
the commercial grade, due to the porosity and imperfections of the specimens, but proves
to compare well at higher temperatures, particularly at 800-1000°C (1472-1832°F).
346.0
88.3
121.1
182.3
80.699.9109.9
109.1
0
60
120
180
240
300
360
0 200 400 600 800 1000 1200
Temperature (°C)
Ulti
mat
e Fa
ilure
Stre
ngth
(ksi
)
RBSiC
AHPCS
Figure 3.5: Comparison of RB-SiC and AHPCS specimens, strength vs. temperature

84
34.91
29.22
17.35
12.39
9.9313.72
18.06
25.63
0
10
20
30
40
50
0 200 400 600 800 1000 1200
Temperature (°C)
Mod
ulus
of E
last
icity
(msi
)RBSiC
AHPCS
Figure 3.6: Comparison of RB-SiC and AHPCS specimens, modulus vs.
temperature
It is clear that on average the AHPCS specimens have a lower strength and stiffness at
any test temperature. These results are due to the lower density and higher porosity of
the AHPCS specimens compared to the commercial grade, due to the method of
processing. The reaction bonded specimens tested until material failure and ruptured
with a high amount of energy release, in many cases shearing the specimen at an
approximate 45 degree angle along the reduced gage section of the dumbbell. These
sheared specimens allow for a good representation of the compressive response of the
material to failure. The AHPCS specimens sheared similarly without the dumbbell shape
in many cases, at lower loads. A comparison of an example reaction bonded silicon
carbide failure specimen to the original dumbbell shape specimen is shown in Figure 3.7.

85
Figure 3.7: Example shear failure of a reaction bonded specimen with comparison
to original dumbbell shape
3.2.1. Reaction Bonded Silicon Carbide Results attained in compression testing using the silicon carbide load platens of Saint-
Gobain Crystar™ reaction bonded composition are listed in tabular form and in stress-
strain plots in the Appendix. Tests administered at room temperature allow for good data
representation without the addition of the temperature variable. The reaction bonded
silicon carbide material was first tested to allow for baseline data before testing the in-
house processed AHPCS based SiC specimens. The following plot indicates an example
of one of the room temperature tests of the RB-SiC specimens cut from the Saint Gobain
Crystar™ plate.

86
0
20
40
60
80
100
120
140
0.000 0.005 0.010 0.015 0.020 0.025 0.030Strain (in/in)
Stre
ss (k
si)
ExtensometerMTS disp
Figure 3.8: RB-SiC-RT-02 Compressive Response
The above stress-strain curve plots both the extensometer response and the MTS 810
hydraulic actuator displacement response. The MTS displacement curve allows for
continuous data up to the point of material rupture at maximum failure. A lower stiffness
is indicated by the slope of the MTS displacement curve which measures the specimen
strain as well as the strain in the tall alumina fixtures as well as any small amount of
machine deflection from the test machine itself. The extensometer curve indicates only
the strain in the specimen and silicon carbide platens, not the entire test assembly. This
curve measures the strain with the quartz extension rods set into two notched alumina
platens. The steeper slope of the extensometer curve indicates a higher modulus of
elasticity of the specimen when compared to the slope of the MTS displacement curve.
Compressive modulus of elasticity of the specimen is most near the slope of the

87
extensometer response curve. Table 3.1 details the first round of tests administered with
the rectangular prism cross section at room temperature with the Crystar™ reaction
bonded silicon carbide.
Table 3.1: Room Temperature RB-SiC Compression Proof Test Data Summary
Specimen Strength, ksi (MPa)
Modulus, msi (GPa)
Failure Mode
RB-SiC-RT-01 128.0 (883) - Vertical axis
RB-SiC-RT-02 134.1 (925) 29.1 (201) Vertical axis
RB-SiC-RT-03 53.9 (372) 20.9 (144) Vertical axis
RB-SiC-RT-04 109.3 (754) 34.7 (239) Vertical axis
RB-SiC-RT-05 128.6 (887) 24.0 (166) Vertical axis
RB-SiC-RT-06 118.2 (815) 26.3 (181) Shear
Table 3.2: Room Temperature RB-SiC Compression Proof Test Statistics
Parameter Strength ksi (MPa)
Modulus msi (GPa)
Mean 112.0 (772) 27.0 (186) Std Dev 29.6 (204) 4.9 (33.7) Mean, no outlier 123.6 (852) 28.5 (197) Std Dev, no outlier 14.6 (101) 4.3 (29.6)
Listed RB-SiC 123 (850) 47.8-53.6 (330-370)
99% Alumina inserts 340 (2344) 57 (393)
When observing Tables 3.1 and 3.2, it is clear that most of the data is consistent for all of
the room temperature tests. Although the high temperature extensometer was not used in
the first test, RB-SiC-RT-01, the ultimate failure strength indicates a value in the
expected range of the material, according to the data in Table 3.2 and to the listed RB-
SiC strength of 123 ksi (850 MPa) in the Table 3.2. RB-SiC-RT-02 clearly failed
prematurely, most likely due to alignment along the vertical load path, where the
specimen could have been offset slightly from the load path, causing a severe bending
effect. A comments table is available in the Appendix, which details some of the

88
specimen irregularities that may have led to failure. Upon the addition of the temperature
variable in compression testing, only two preliminary tests were completed before failure
of the lower platen and failure of the lower fully fired alumina platen during the second
test. A 1000°C (1832°F) test, RB-SiC-HT-01, failed at a lower strength of 56.6 ksi,
approximately half of the listed data. A second test, RB-SiC-HT-02, yielded a lower
modulus of elasticity of 15.23 msi at 800°C (1472°F) when compared to room
temperature due to the early removal of the extensometer. Specimens RB-SiC-HT-02
data showed only correlation to the listed strength and tested strength of the room
temperature specimens, the modulus data was lower than expected, but with no data at
high temperature to compare to, the data is not an indicator of high temperature modulus
of the material. Unfortunately, upon failure of the silicon carbide platens, and the lower
alumina platen, it was clear that a better method of measuring the strains for modulus
calculation and strength of the reaction bonded specimens.
Section 2.2.1 detailed the specimen preparation methods for the reaction bonded silicon
carbide. Due to the high stiffness and high strength of the material, alignment of the
specimens along the load path and with the silicon carbide platens, of the same material,
were critical variables in compression testing. This critical variable was controlled by the
cutting and surface preparation of the specimens. It is possible the alumina platen failure,
indicated in the previous Figure 2.5 in Section 2.2.1, was attributed to the silicon carbide
platen failure in Figure 2.4, as the silicon carbide platen pinched the alumina under high
temperature, causing a tensile failure of the alumina. If the test setup were to be changed,
it is recommended that sintered silicon carbide platens, with the highest possible strength

89
and stiffness of all silicon carbide materials, could be used to load the specimens to
failure. A ball and socket joint comprised of either alumina of silicon carbide was
considered, to allow for self-alignment of the specimens when loaded in compression.
After investigation of possibilities, it was determined that the interface between the
silicon carbide platens and the surfaces of the specimen was the critical parameter to
control in compression testing. Silicon carbide platens and specimens were ground to
better than 0.0005” parallel using the Okamoto three axis grinder previously mentioned.
Also, the dumbbell shape was ground into the specimens that would be taken to failure,
leaving the stiffness measurement to be performed with the strain measurement of the
extensometer and the rectangular prism specimens. Table 3.3 details results for room to
high temperature testing up to 1000°C (1832°F) with the dumbbell and rectangular prism
specimens. This data does not include the proof specimen data in Tables 3.1, 3.2, or the
two initial high temperature proof tests.
Table 3.3: Average compression test results summary, reaction bonded specimens
Average Std. Temp, °C (°F) Strength (ksi) low high Dev., σ
25 (77) 123.3* - - 25 (77) 346.0 - - -
600 (1112) 182.3 173.2 188.5 7.0 800 (1472) 121.1 112.4 135.1 10.0 1000 (1832) 88.3 87.5 88.8 0.6
*Listed RB-SiC failure strength
Average Std. Temp, °C (°F) Modulus (msi) low high Dev., σ
25 (77) 48.30* 43.50 53.10 - 25 (77) 34.91 34.77 49.48 8.42
600 (1112) 29.22 28.52 29.73 0.51 800 (1472) 17.35 16.47 18.78 1.02
1000 (1832) 12.39 11.79 13.09 0.53 *Listed RB-SiC average modulus

90
Testing of the reaction bonded plate could have been administered until the initial failure
or cracking of the specimen or tested with rectangular specimens, allowing for a more
mild failure, when compared to the extremely high energy brittle failure using the
dumbbell shape. When running the dumbbell shape specimen tests at high temperature,
higher failure strengths were recorded, without causing failure to the load platens.
However, at room temperature, only one specimen was tested to ultimate failure using the
dumbbell shape specimen. This failure strength is greater than the listed compressive
strength by a factor of 2.8. Due to the high load, approximately 11,500 lb on an
extremely small load area of diameter 0.210 inches, failure at room temperature caused
such a high energy release in the material that the load platens failed as they were
shocked back to a zero load state. The failure strength of the 2 inch diameter, 90%
alumina rods is approximately 46 ksi, much higher than their compressive stress state at
this 11,500 lb load of approximately 3600 psi. The rods failed in tension as they returned
back to a no load state from this high compressive load. Also, the alumina rods had been
loaded multiple times at high temperatures; a thermal fatigue could have lowered their
failure strength even further. Figure 3.9 details the failure, upon which they were
replaced and testing resumed.

91
Figure 3.9: Failure of alumina rods and silicon carbide load platens, RB-SiC-RT-10
Dumbbell shape specimens were loaded to failure, and rectangular shape specimens were
loaded to give representative strain measurement for calculation of the compressive
modulus of elasticity. The following figures, Figures 3.10 and 3.11 plot the average
compressive strength and modulus of elasticity versus test temperature, respectively. A
linear trendline is fit, using Microsoft excel, to the average tested data with a correlation
coefficient R2 and trendline equation listed in the plot. Average failure strength data is
correlated within 99.34%, and modulus of elasticity is less correlated at 87.04%. The
listed failure strength and stiffness is also given in the plots. Failure strengths overall are
most likely higher than the listed strength due to the method of testing. Strength testing
to attain the listed values for Saint Gobain was most likely administered to a first
cracking failure mode, as opposed to the ultimate high energy explosive failure. The high
energy failure at varying temperatures is compared throughout the reaction bonded tests.

92
88.3
123.3
182.3
121.1
346.0
y = -0.2715x + 349.03R2 = 0.9934
0
50
100
150
200
250
300
350
400
0 200 400 600 800 1000 1200
Temperature (°C)
Ulti
mat
e Fa
ilure
Str
engt
h (k
si)
dum bbell
lis ted
Figure 3.10: Failure strength of RB-SiC specimens as a function of temperature
34.91
29.22
17.35
12.39
48.30
y = -0.0231x + 37.446R2 = 0.8704
0
10
20
30
40
50
60
0 200 400 600 800 1000 1200
Temperature (°C)
Mod
ulus
of E
last
icity
(msi
)
rectangular prism
lis ted
Figure 3.11: Modulus of RB-SiC specimens as a function of temperature

93
For the reaction bonded specimens tested, specimen stiffness is more conservative. This
is most likely due to the method of strain measurement and loading. The alumina load
platens with notches used to detect material strain with the high temperature
extensometer are as stiff as the specimens, approximately 57 msi (393 GPa), where the
stiffness of the reaction bonded silicon carbide should range from 47.8 to 53.6 msi (330-
370 GPa). Due to this relationship between the load fixtures and the tested material, this
allows for some displacement of the alumina load platens, causing some bending of not
only the alumina platens, but bending and stretching of the silicon carbide platens,
allowing for more displacement to be seen by the extensometer in the form of material
strain, thus reducing the modulus of elasticity of the specimen when calculating the slope
of steepest portion of the stress-strain curve. If the load platens were of an order of
magnitude stiffer than the tested specimen, this would allow for a more accurate strain
measurement, thus, a closer value of strain to the listed value on the commercial grade
data sheet. At varying temperatures, this method of measurement was constant through
all the tests, proving that valid data could be attained at higher temperatures with a degree
of accuracy. To compare specimen variability, the specimen modulus of elasticity is
plotted for the specimens tested at each temperature in the following figures. Four
specimens were tested at room temperature due to the high variability, and four were
tested at 600°C (1112°F), where the distribution and variability became more correlated.
At 800°C (1472°F), the specimens exhibited a tight distribution with only 3 specimens
tested at each temperature, similarly, three specimens were tested at 1000°C (1832°F).
Specimens are designated RB-SiC-temp-specimen ##-E, where E designates specimen
modulus test. The ‘E’ suffix is dropped for the dumbbell strength tests.

94
0
20
40
60
80
100
0.000 0.001 0.002 0.003 0.004 0.005 0.006
Strain (in/in)
Stre
ss (k
si)
RBSiC-RT-13-E
RBSiC-RT-14-E
RBSiC-RT-15-E
RBSiC-RT-16-E
Figure 3.12: Modulus of reaction bonded specimens at room temperature
0
20
40
60
80
100
0.000 0.001 0.002 0.003 0.004 0.005
Strain (in/in)
Stre
ss (k
si)
RBSiC-600-06-E
RBSiC-600-07-E
RBSiC-600-08-E
RBSiC-600-09-E
Figure 3.13: Modulus of reaction bonded specimens at 600°C (1112°F)

95
0
20
40
60
80
100
0.000 0.001 0.002 0.003 0.004 0.005
Strain (in/in)
Stre
ss (k
si)
RBSiC-800-06-E
RBSiC-800-07-E
RBSiC-800-08-E
Figure 3.14: Modulus of reaction bonded specimens at 800°C (1472°F)
0
20
40
60
80
100
0.000 0.001 0.002 0.003 0.004 0.005
Strain (in/in)
Stre
ss (k
si)
RBSiC-1000-04-E
RBSiC-1000-05-E
RBSiC-1000-06-E
Figure 3.15: Modulus of reaction bonded specimens at 1000°C (1832°F)

96
Overall, testing of the reaction bonded silicon carbide gives satisfactory data to prove that
the test method works within a degree of accuracy to allow for repeatable results. The
data gives not only a proof of the test method, but allows for a benchmark in data to
allow for comparison to the in-house processed AHPCS pre-ceramic polymer precursor
based silicon carbide.
3.2.2. AHPCS Silicon Carbide Specimens processed with injection molding and the polymer infiltration and pyrolysis
methods previously mentioned were cut and ground into compression test specimens with
the Okamoto three axis grinder. These specimens were cut from the injection molded
specimens, which were pyrolyzed and infiltrated over five cycles. Specimen blocks I5
and I6 were chosen as a baseline for cutting and grinding, similar to their role as pilot
specimens in the polymer infiltration and pyrolysis cycles. The size of the ground
compression test specimens were rectangular prisms of dimensions 0.250” x 0.250” x
0.500”, ±0.002” tolerance. The rectangular prisms were tested at room temperature to
failure. Specimens are designated on the following nomenclature; AHPCS-temp-molding
trial-##. A room temperature test with specimen I5, test number 4 is labeled AHPCS-RT-
I5-04, for example. The high temperature tests use the nomenclature AHPCS-temp-
molding trial, for only one specimen is tested at each temperature per molding trial block.
This is due to not only the molded and pyrolyzed block size restrictions, but due to time
restrictions on cutting and grinding high tolerance specimens, and due to the length of
time consumed running the high temperature tests.

97
A higher number of room temperature tests are run to allow for determination of property
variability among specimens, where high temperature tests allow for property
dependence on temperature, with the understanding that the properties may vary to a
degree at the tested temperature. Upon administering the first few room temperature
compression tests, it was determined that the material had a considerably lower strength
and slightly lower stiffness when compared to the commercial grade reaction bonded
silicon carbide. This was anticipated due to the method of processing and due to
specimen imperfections in the form of cracks and porosity from the molding and polymer
infiltration processes.
Because of the less than desired mechanical properties, the material did not cause failure
of the load platens after each test. It was determined that a dumbbell specimen shape was
not necessary for these specimens based good strain data and maximum strength data
attained from administering one compression test with the rectangular prism shape,
instead of running two compression tests to achieve both sets of data. Several tests did
crack the lower platen due to stress concentrations on the load platens upon material
failure, which are commented in the Appendix, as the specimen shifted during the test
due to uneven crack distribution and imperfections in the material. These platens were
replaced upon cracking, and testing was resumed. Some groups of specimens did prove
to allow for better than expected mechanical properties, where a dumbbell shape
specimen could have been considered. A photograph of a test specimen group for the
room temperature tests administered for group I6 prior to testing is given in Figure 3.16.
Figure 3.17 details the typical shear failure from a compression test with this material

98
type. It is clear that some of the specimens have significant cracks along the outer
surface. This prohibited a high strength specimen to be tested. Despite the cracks and
flaws, the specimens did test out well, at room temperature the average strength for the I6
molded group was 60.4 ksi, standard deviation 7.9, with average modulus of 18.7 msi,
standard deviation 2.4. The porosity and possibly excess carbon is present in the
specimens, as shown by the darker colored sections in Figure 3.16. Note that these
specimens are wet with the water soluable Trim E206 lubricant from grinding, as the
photograph was taken prior to drying the specimens at 120°C (248°F) in air. This
temperature was chosen due to the 100°C (212°F) boiling point of the lubricant. The
lubricant produces oxides of carbon, nitrogen and sulfur upon thermal decomposition,
allowing for a slightly higher mass and density of the specimen when compared to the
density of the molded block the specimens were cut from originally. The density is used
as a gauge for the material specific strength and stiffness when comparing all tested
specimens at varying temperatures.
Figure 3.16: AHPCS specimens (I6 group) before testing

99
Figure 3.17: AHPCS specimen compressive-shear failure (AHPCS-RT-I6-05)
The following table, Table 3.4, lists the data compiled from the room temperature tests of
the AHPCS processed specimens. It is clear there is a high degree of variability in the
test results. This variability is primarily due to the uneven distribution of imperfections
and flaws in the test specimens. Based on the number of specimens cut and ground from
the original molded and pyrolyzed/infiltrated block, six specimens were tested from the
I5 specimen group and five specimens were tested from the I6 group. To continue with
high temperature tests, six specimens were cut from both the I8 and I22 blocks, allowing
three room temperature tests to be performed, and three high temperature tests. Four
specimens were cut from specimen I9, where one was tested at room temperature and
three were tested at high temperature. Running a batch of tests on several groups of
specimens cut from the same injection molded specimen gives an idea of the variability
in mechanical properties between molded sets given a constant test temperature.

100
Table 3.4: AHPCS specimen room temperature compression test data
Specific Specific Max Stiffness Strength Density Modulus Stress E/ρ σ/ρ Failure
Specimen ρ, (g/cc) E, (msi) σ (ksi) MN-m/kg kN-m/kg Mode AHPCS-RT-I5-01 2.493 14.97 42.3 41.4 117.0 crushing AHPCS-RT-I5-02 2.466 3.78 17.5 10.6 49.0 vertical edge AHPCS-RT-I5-03 2.439 18.66 53.1 52.7 150.1 crack AHPCS-RT-I5-04 2.430 14.90 50.1 42.3 142.2 high energy shear AHPCS-RT-I5-05 2.434 8.60 41.7 24.4 118.0 high energy shear AHPCS-RT-I5-06 2.451 5.82 37.4 16.4 105.2 crushing
Average 2.452 11.12 40.4 31.3 113.6 Std. Dev. 5.4 11.5
AHPCS-RT-I6-01 2.392 17.72 61.0 51.1 175.8 high energy shear AHPCS-RT-I6-02 2.382 19.33 61.1 55.9 176.9 high energy shear AHPCS-RT-I6-03 2.411 22.56 68.5 64.5 195.8 high energy shear AHPCS-RT-I6-04 2.357 15.01 45.6 66.0 133.4 high energy shear AHPCS-RT-I6-05 2.417 18.70 65.6 53.3 187.0 high energy shear
Average 2.392 18.66 60.4 58.2 173.8 Std. Dev. 2.4 7.9
AHPCS-RT-I8-01 2.471 26.23 115.0 73.2 321.0 high energy shear AHPCS-RT-I8-02 2.468 26.47 111.0 73.9 310.0 high energy shear AHPCS-RT-I8-03 2.473 24.67 97.9 68.8 273.0 high energy shear
Average 2.471 25.79 108.0 72.0 301.3 Std. Dev. 1.0 7.3
AHPCS-RT-I9-01 2.525 28.77 112.1 78.6 306.0 high energy shear
AHPCS-RT-I22-01 2.501 24.66 106.2 68.0 292.8 high energy shear AHPCS-RT-I22-02 2.508 29.55 113.6 81.2 312.2 high energy shear AHPCS-RT-I22-03 2.482 18.93 107.9 52.6 299.8 high energy shear
Average 2.497 24.38 109.2 67.3 301.6 Std. Dev. 4.3 10.9
RT Average 2.450 18.85 72.6 54.2 203.6 Std. Dev. 7.3 31.3
Average I8,I9,I22 2.490 25.61 109.1 70.9 302.1 Std. Dev 3.2 5.4
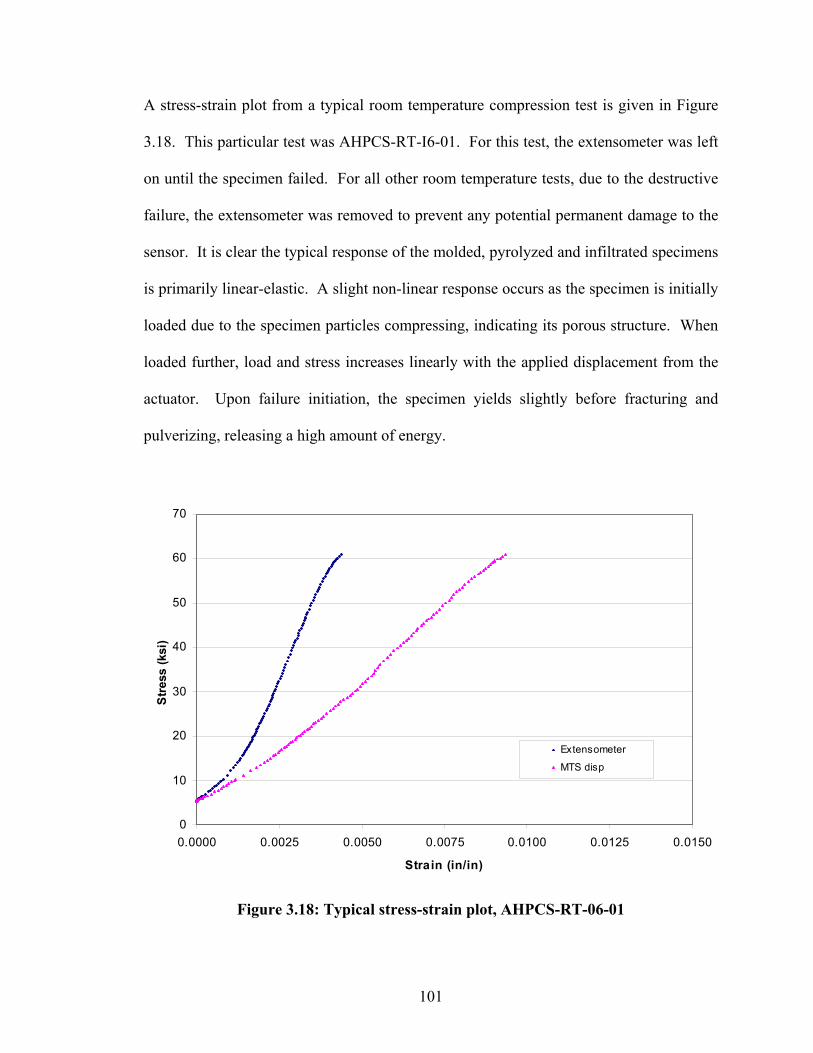
101
A stress-strain plot from a typical room temperature compression test is given in Figure
3.18. This particular test was AHPCS-RT-I6-01. For this test, the extensometer was left
on until the specimen failed. For all other room temperature tests, due to the destructive
failure, the extensometer was removed to prevent any potential permanent damage to the
sensor. It is clear the typical response of the molded, pyrolyzed and infiltrated specimens
is primarily linear-elastic. A slight non-linear response occurs as the specimen is initially
loaded due to the specimen particles compressing, indicating its porous structure. When
loaded further, load and stress increases linearly with the applied displacement from the
actuator. Upon failure initiation, the specimen yields slightly before fracturing and
pulverizing, releasing a high amount of energy.
0
10
20
30
40
50
60
70
0.0000 0.0025 0.0050 0.0075 0.0100 0.0125 0.0150
Strain (in/in)
Stre
ss (k
si)
Extensometer
MTS disp
Figure 3.18: Typical stress-strain plot, AHPCS-RT-06-01
102
Upon testing two batches of specimens cut from the I5 and I6 molded blocks and
attaining reasonably good data, it was desired to examine the material dependence on
temperature. Three injection molded and pyrolyzed/infiltrated blocks were cut into at
least four specimens each. These specimens were the best molded specimens and were
chosen based on their larger size, low porosity, consistent surface finish and minimal
cracks and flaws on the surface of the specimens. One specimen per injection molded
block trial was tested at each test temperature, specifically, 600°C (1112°F), 800°C
(1472°F) and 1000°C (1832°F), including room temperature of 23°C (75°F). Based on
the high degree of variability in properties in the room temperature tests, it is assumed
that the data will also be scattered in the high temperature portion. Due to slow ramp rate
of 7°C/min of the furnace to test temperature, in order to not thermally shock the ceramic,
the number of tests must be constrained to one test per specimen cut from the molded
block per temperature tested. Despite the high variability, this allows for varying
temperatures to be tested, keeping a consistent molded material across the range of
temperatures. Table 3.5 details the high temperature compression test results of the
AHPCS specimens from 600°C (1112°F) to 1000°C (1832°F).

103
Table 3.5: AHPCS specimen high temperature compression test data
Specific Specific Max Stiffness Strength Density Modulus Stress E/ρ σ/ρ Failure
Specimen ρ, (g/cc) E, (msi) σ (ksi) MN-m/kg kN-m/kg Mode AHPCS-600-I8 2.501 20.66 106.2 57.0 292.8 crack, stopped AHPCS-600-I9 2.488 15.45 113.6 42.8 314.7 high energy shear
AHPCS-600-I22 2.470 18.97 107.9 high energy shear Average 2.486 18.06 109.9 49.9 303.7 Std. Dev. 2.2 3.1
AHPCS-800-I8 2.491 14.22 96.4 39.4 266.7 crack, stopped AHPCS-800-I9 2.535 10.32 100.5 28.1 273.4 high energy shear
AHPCS-800-I22 2.507 16.61 102.8 45.7 282.6 yield started Average 2.392 13.72 99.9 37.7 274.2 Std. Dev. 8.5 4.4
AHPCS-1000-I8 2.568 11.08 82.6 29.7 221.7 yield started AHPCS-1000-I9 2.547 9.46 78.1 25.6 211.6 yield started AHPCS-1000-I22 2.521 9.24 81.2 25.3 222.0 yield started
Average 2.545 9.93 80.6 26.9 218.4 Std. Dev. 1.4 2.7
Figure 3.19 details the AHPCS specimen failure strength as a function of temperature
visually as also reported in the average room temperature data in Table 3.4 and the high
temperature data in Table 3.5. Figure 3.20 details AHPCS specimen modulus of
elasticity as a function of temperature. Figures 3.21 through 3.24 detail the specimen
modulus plots at respective temperatures to display the correlation between specimens
tested at the respective temperature. There is more variability in the data when compared
to the reaction bonded specimens, which is to be expected, but overall, the specimens
give good results for the modulus of elasticity of the specimens when considering a
common linear portion of the stress-strain curve, which is typically between values of
0.001 to 0.003 in/in strain.

104
0
30
60
90
120
150
0 200 400 600 800 1000 1200Temperature (°C)
Ulti
mat
e Fa
ilure
Str
engt
h (k
si)
I8
I9
I22
Figure 3.19: Failure Strength of AHPCS specimens as a function of temperature
0
10
20
30
40
0 200 400 600 800 1000 1200
Temperature (°C)
Mod
ulus
of E
last
icity
(msi
)
I8
I9
I22
Figure 3.20: Modulus of AHPCS specimens as a function of temperature
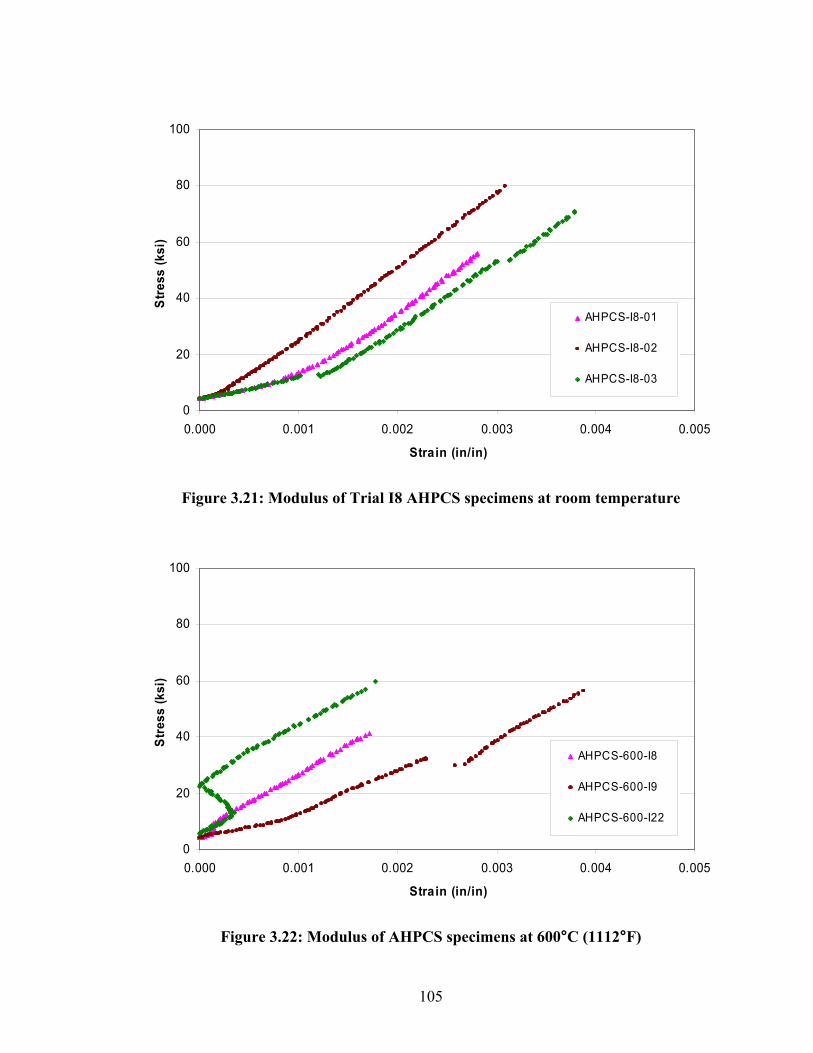
105
0
20
40
60
80
100
0.000 0.001 0.002 0.003 0.004 0.005
Strain (in/in)
Stre
ss (k
si)
AHPCS-I8-01
AHPCS-I8-02
AHPCS-I8-03
Figure 3.21: Modulus of Trial I8 AHPCS specimens at room temperature
0
20
40
60
80
100
0.000 0.001 0.002 0.003 0.004 0.005
Strain (in/in)
Stre
ss (k
si)
AHPCS-600-I8
AHPCS-600-I9
AHPCS-600-I22
Figure 3.22: Modulus of AHPCS specimens at 600°C (1112°F)

106
0
20
40
60
80
100
0.000 0.001 0.002 0.003 0.004 0.005
Strain (in/in)
Stre
ss (k
si)
AHPCS-800-I8
AHPCS-800-I9
AHPCS-800-I22
Figure 3.23: Modulus of AHPCS specimens at 800°C (1472°F)
0
20
40
60
80
100
0.000 0.001 0.002 0.003 0.004 0.005 0.006 0.007
Strain (in/in)
Stre
ss (k
si)
AHPCS-1000-I8
AHPCS-1000-I9
AHPCS-1000-I22
Figure 3.24: Modulus of AHPCS specimens at 1000°C (1832°F)

107
3.3. Oxidation Tests The following data outlines the oxidation test results from tests administered on the
silicon carbide specimens. The purpose of this set of tests is to evaluate any oxidation
during compression testing up to 1000°C (1832°F) for both specimen types.
3.3.1. Reaction Bonded Silicon Carbide To test the reaction bonded silicon carbide (RB-SiC) cut from the Saint Gobain Crystar™
plate, specimens were placed inside a furnace and tested at 1000°C (1832°F) for a 24
hour dwell period. Based on the data sheet for Crystar™ RB-SiC plate, the material
should withstand continuous operating temperatures of 1350°C with no material
oxidation. Table 3.6 details the five specimens tested to check this data.
Table 3.6: Oxidation Results for RB-SiC specimens
pre-test post-test mass
Specimen mass (g) mass (g) change (g) RB-SiC-
01 1.491 1.490 -0.001 RB-SiC-
02 1.388 1.388 0.000 RB-SiC-
03 1.373 1.372 -0.001 RB-SiC-
04 1.367 1.367 0.000 RB-SiC-
05 1.401 1.400 -0.001 As seen in Table 3.6, the specimen masses did not change when weighing after the 24
hour dwell period at 1000°C. Uncertainty of +/- 0.001 due to the resolution of the Ohaus
Adventurer 300 gram bench scale allowed for a minimal fluctuation in mass of the
specimens. Density of the specimens was also calculated and proved to have an
oxidation rate of less than 0.002 g/cm3 for a 24 hour test at this temperature. Further
108
investigation of mass change per unit surface area versus time is unnecessary, due to the
negligible mass change over a 24 hour period of time. Therefore, oxidation resistance of
the Saint-Gobain reaction bonded silicon carbide specimens is high, proving no short
term oxidation and comparing with the data on the Crystar™ data sheet. Using this
material, there is no effect on the strength of stiffness of the material when administering
a compression test at 1000°C due to material oxidation. Test data and dimensional
parameters for the silicon carbide specimens of this type are available in the Appendix.
3.3.2. AHPCS Silicon Carbide Specimens processed using the cure and pyrolysis methods described in the previous
sections were cut and measured for material oxidation at 1000°C. Since the specimens
are processed up to temperatures of 850°C in an inert atmosphere, the material should
withstand testing up to those temperatures. However, the resin manufacturer, Starfire
Systems, recommends operating temperatures of at least 100°C lower than the pyrolysis
processing temperature, to allow for material structure stability. It was found during
compression testing that the first 800°C specimen did partially oxidize, leaving a darker
specimen color and slightly higher mass that recorded initially. Specimens tested at
600°C did not show any visual signs of oxidation, nor did they gain any mass when
checking them after the compression test (on the specimens that did not completely fail
and shatter into many pieces). It was determined that the remaining five 800°C and
1000°C compression tests to be performed with the AHPCS specimens would have to be
pyrolyzed at a temperature greater than the test temperature, unless they were to be tested
and assumed to oxidize. The tests could have been administered with the specimens in

109
this state, as the first 800°C test specimen exhibited high compression strength and
stiffness of 96.4 ksi and 14.22 msi, respectively. Following the recommendations of the
resin manufacturer, the specimens could be pyrolyzed to 1100°C (2012°F) (100°C above
test temperature) to be sure they did not oxidize. This would also indicate any shrinkage
and density increase when performing the higher temperature pyrolysis. Average linear
dimensional change from the 850°C cure state to the 1100°C state of the original 0.500”
x 0.250” x 0.250” specimens was measured as -0.73%, when averaging dimensional
change along all sides of the specimen. Volume of the specimens also decreased with
change of -2.19%. With the respective mass of specimens, density increased by an
average of 1.87%. The 1100°C pyrolysis cycle purpose was to assure that the five
remaining compression test specimens would not oxidize at all during the compression
test at either 800 or 1000°C. Based on surface color and post test mass (for the
specimens that did not shatter upon failure) specimens did not appear to oxidize during
the test. Raw data for the 1100°C pyrolysis is available in the Appendix.
Table 3.7: Properties of AHPCS specimens, pyrolysis at 1100°C (2012°F)
Dimensional Volumetric Density Specimen Change, % Change, % Change, % AHPCS-800-I9 -0.73 -2.18 1.82 AHPCS-800-I22 -0.73 -2.18 1.97 AHPCS-1000-I8 -0.73 -2.18 1.97 AHPCS-1000-I9 -0.73 -2.18 1.56 AHPCS-1000-I22 -0.74 -2.20 2.01
Average -0.73 -2.19 1.87
To determine the material oxidation, given a reference pyrolysis temperature, a batch of
specimens, with initial volume fraction of 50% resin by 50% powder, was tested at

110
1000°C in air. This effort would determine if this material could withstand any short
term high temperature compression tests without oxidizing. If oxidation is severe, the
compression test data would have to be modified to account for any loss in cross
sectional area and/or material mass. Five specimens were chosen from the injection
molded and pyrolyzed blocks previously described. Specimens chosen for this test were
ones that were either too small too allow for more than one compression test specimen,
or, had significant cracks, pores or other imperfections to allow for good compression test
data. These specimens were dried in the alumina tube furnace at 120°C (248°F) for one
hour (ramp rate of 2°C/min) to allow for burnoff of any moisture trapped within the pores
of the specimen from storage in a sealed plastic bag.
Once dried and weighed, the specimens were placed in the tube furnace on an alumina
plate and ramped to 1000°C (1832°F), and held at that temperature for ten minutes. This
test would simulate the compression test environment without loading the specimens. It
was determined that the AHPCS specimens underwent very little oxidation, thus,
oxidation of the processed SiC would effect the compression test procedure very
minimally, causing little change in material properties at high temperature. The material
changed color from a glassy black color to a bluish-black color. The surface of the
specimens can be scratched with a fingernail; indicating their high hardness property is
lost due to oxidation to SiO2.
At a ramp rate of 1°C/min to 1000°C above the original 850°C pyrolysis temperature,
with a dwell temperature of 10 minutes, specimens gained on average 0.44% by mass,
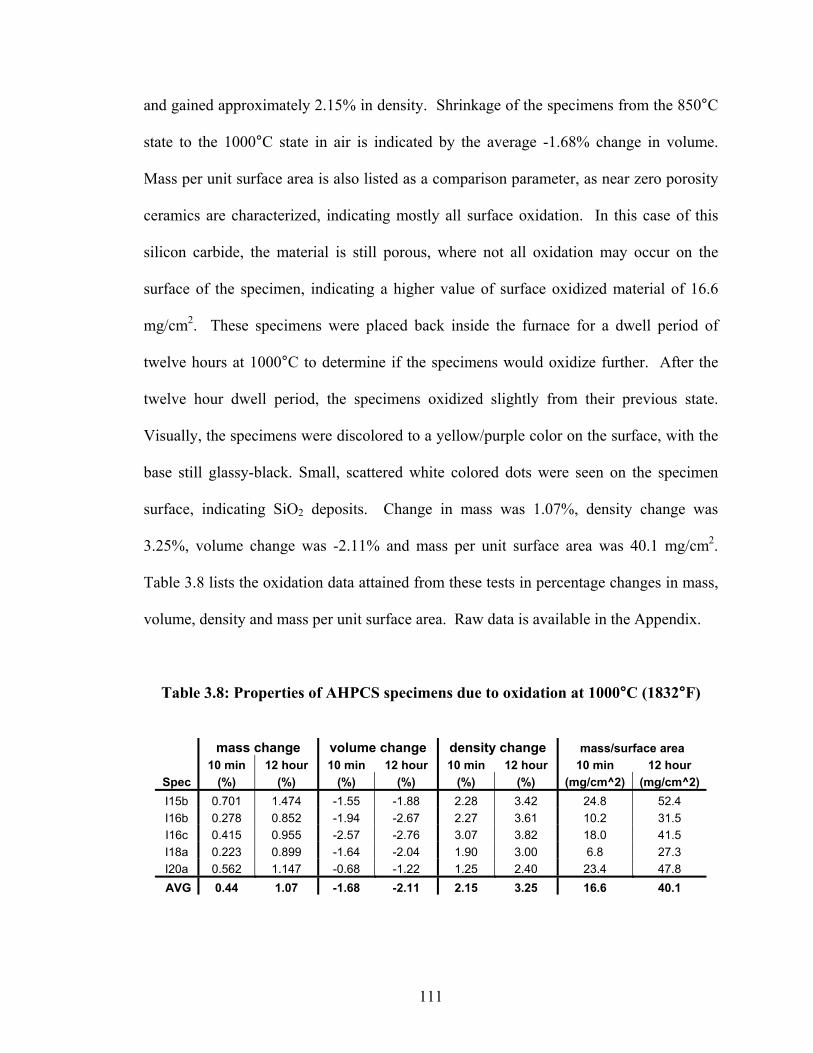
111
and gained approximately 2.15% in density. Shrinkage of the specimens from the 850°C
state to the 1000°C state in air is indicated by the average -1.68% change in volume.
Mass per unit surface area is also listed as a comparison parameter, as near zero porosity
ceramics are characterized, indicating mostly all surface oxidation. In this case of this
silicon carbide, the material is still porous, where not all oxidation may occur on the
surface of the specimen, indicating a higher value of surface oxidized material of 16.6
mg/cm2. These specimens were placed back inside the furnace for a dwell period of
twelve hours at 1000°C to determine if the specimens would oxidize further. After the
twelve hour dwell period, the specimens oxidized slightly from their previous state.
Visually, the specimens were discolored to a yellow/purple color on the surface, with the
base still glassy-black. Small, scattered white colored dots were seen on the specimen
surface, indicating SiO2 deposits. Change in mass was 1.07%, density change was
3.25%, volume change was -2.11% and mass per unit surface area was 40.1 mg/cm2.
Table 3.8 lists the oxidation data attained from these tests in percentage changes in mass,
volume, density and mass per unit surface area. Raw data is available in the Appendix.
Table 3.8: Properties of AHPCS specimens due to oxidation at 1000°C (1832°F)
mass change volume change density change mass/surface area 10 min 12 hour 10 min 12 hour 10 min 12 hour 10 min 12 hour Spec (%) (%) (%) (%) (%) (%) (mg/cm^2) (mg/cm^2) I15b 0.701 1.474 -1.55 -1.88 2.28 3.42 24.8 52.4 I16b 0.278 0.852 -1.94 -2.67 2.27 3.61 10.2 31.5 I16c 0.415 0.955 -2.57 -2.76 3.07 3.82 18.0 41.5 I18a 0.223 0.899 -1.64 -2.04 1.90 3.00 6.8 27.3 I20a 0.562 1.147 -0.68 -1.22 1.25 2.40 23.4 47.8 AVG 0.44 1.07 -1.68 -2.11 2.15 3.25 16.6 40.1

112
The logarithmic behavior of silicon carbide material oxidation rate at high temperatures is
plotted as surface area oxidation versus time in Figure 3.25. A logarithmic trendline is
fitted using Microsoft excel to all of the data recorded from the oxidation test
administered at 1000°C (1832°F). To allow for a logarithmic curve fit, the zero time is
assumed to be 1 minute. Reducing the time from one to the zero minute causes the curve
fit to approach a correlation coefficient (R2) of zero. Similarly, approaching higher
values of time, toward 10 minutes for the second set of data points, also allows the curve
fit to skew toward a correlation coefficient of zero. Note that oxidation surface area is
only a demonstration of the in-house processed material resistance to oxidation under
1000°C test conditions with specimens pyrolyzed at 850°C, using a ramp rate of 1°C/min
from 850°C to 1000°C. It is assumed that this curve fit is conservative, as the material
did oxidize (based on the 850°C pyrolysis temperature) from 850 to 1000°C during
furnace ramp up. Similar results are attained when plotting mass or density versus time.
y = 6.0148Ln(x) + 1.1013R2 = 0.8478
0
10
20
30
40
50
0 100 200 300 400 500 600 700 800
Time (minutes)
Surf
ace
Area
Oxi
datio
n (m
g/cm
^2)
Figure 3.25: AHPCS specimen surface area oxidation versus time

113
CHAPTER 4
CONCLUSIONS 4.1. Discussion Several conclusions can be made and discussed based on the multiple aspects of this
study. First, processing of silicon carbide to produce “near net” shape parts for
commercial or industrial use is not a trivial task, particularly when considering
processing using an injection molding operation. Mechanical properties of the desired
ceramic tend to vary significantly based on the slight variations in processing variables.
Second, polymer infiltration and pyrolysis methods prove to work well, but there may be
other alternatives to densifying silicon carbide materials in order to produce completed
parts in a more timely manner. Finally, the compression test method used to verify the
mechanical properties overall worked well to give conservative uni-axial maximum
strength and elastic modulus data to compare material performance throughout a range of
temperatures. These major issues of the study are further discussed in Section 4.1.
Upon completion of the processing of the silicon carbide specimens, several conclusions
can be made. First, the molding process needs to be further fine tuned and perfected.
Processing of specimens of near net shapes can be achieved, by definition, a reaction
injection molding process was used, similar to what Lukacs patented in 1993 (Section
1.3.3.6), which is a process of reacting powder with a pre-ceramic polymer resin under
injection pressure inside a mold. In the case of the specimens processed for this project, a
significant amount of machining in the form of sanding in the 400°C (752°F) cure state
and diamond cutting and grinding in the 850°C (1562°F) pyrolysis state proved to allow
114
for a compression test specimen size that was much smaller dimensionally than that of
the original molded shape. Although the size of the specimen was desired to allow for
multiple test specimens for varying molding trials, further sanding cutting and grinding
was necessary primarily due to the open porosity in the molded specimens. This was
based on the formation of cracks due to insufficient compaction of the powder and resin
slurry upon injection into the steel mold and curing to 400°C (752°F). A more robust gas
release or vacuum assisted system to initially relieve the mold of all residual air, as well
as pull all reacting gases out of the mold upon material curing must be developed to allow
for cured specimens with the best surface finish, lowest porosity and good particle
compaction of the powder and resin slurry.
Polymer infiltration and pyrolysis proved to have good results overall on processed
specimens. Due to the porous nature of the specimens, the ceramic can be infiltrated with
polymer without completely immersing the specimens in the polymer resin. Pulling resin
into the pores using a dry specimen under vacuum with a thin film of resin at the base of
the specimen proved to work fairly well when given enough time to fill the pores to the
top of the specimen, which was on the order of one to four hours, depending on the
porosity of the specimen and at what cycle the specimen was processed to. The best
results on polymer infiltration into the pores of the specimens were attained when
allowing the vacuum pump to run overnight, after vacuuming the specimens with a thin
film of resin for up to four hours, then fully immersing the specimens in the pre-ceramic
polymer. An ultra-high vacuum pump would allow for better vacuum to relieve the gas
from the pores, and should do so in a more timely fashion.
115
Overall, the average density of the specimens upon processing was 2.41 g/cc (0.087
lb/in3). A higher density was observed in all of the cut and ground AHPCS based
compression test specimens, which averaged 2.47 g/cc (0.089 lb/in3). The density
measured from the cut specimens is higher due to two main factors. One factor is that the
specimens were cut from the injection molded, pyrolyzed and infiltrated blocks based on
the best surface finish and least amount of specimen imperfections in the form of porosity
and cracks, giving a higher overall specimen density. The second factor that may lead to
a higher measured density of the compression test specimens is due to the fact that the
porous AHPCS specimens were cut with a lubricant that is water soluable and may form
carbon, nitrogen and sulfur based products upon boiling off the lubricant above 100°C
(212°F). This may form deposits within the specimen, causing a higher density. Based
on the average density of the specimens, when compared to a reaction bonded density of
3.10 g/cc, as opposed to a fully sintered density of 3.21 g/cc for a-SiC, the specimens are
on average 77.6% of the full density of a reaction bonded silicon carbide. Full density
percentages of the AHPCS specimens were observed as low as 71.8% (specimen I18a)
and as high as 81.6% (specimen I15c). Porosity measured from the specimens in the wet,
saturated state after polymer infiltration allows for a low estimate of porosity based on
the incomplete infiltration due to non-connecting porosity. Average porosity upon the
initial infiltration of polymer is most likely the closest measurement of porosity among
all of the polymer infiltration and pyrolysis cycles. The average calculated porosity of
the specimens upon the first infiltration cycle after the first pyrolysis cycle was 35.3%,
minimum of 25.3% (specimen I18b) and maximum of 42.8% (specimen I8). Overall,
comparing specimens based on the average density property is a more accurate

116
description of the material compared to the measured porosity of the material. It should
also be noted that although some specimens, such as specimen I8 for example, had a very
high measured porosity (42.8%) and low density of 1.72 g/cc (55.5% full density),
subsequent infiltration cycles allowed the compression test specimens cut from the
processed block to perform very well under compressive loading. For this molded trial,
the specimen yielded a 1000°C (1832°F) compression strength of 82.6 ksi (569.5 MPa)
and modulus of elasticity of 11.08 msi (76.4 GPa), with room temperature averages of
108.0 ksi (744.6 MPa) strength and 25.79 msi (177.8 GPa) compressive modulus.
Compression testing allowed for good commercial and in-house processed specimen data
throughout the temperature range, where for both types of specimens, strength and
stiffness reduced with higher temperatures. In the commercial grade specimen type,
failure modes with increase in temperature to 800°C (1472°F) caused a more ductile
failure with following plastic deformation, as the dumbbell shaped specimens strained
heavily under load without failing. This observation could be attributed to the softening
of the material due to the response of the silicon phase at higher temperatures, as the
commercial grade is actually silicon-silicon carbide (Si-SiC) material, not pure reaction
bonded or sintered silicon carbide.
Although the temperature variable adds one more complexity to the compression test
procedure, the room temperature tests proved to be the most difficult for the reaction
bonded specimens. This was due to the highest possible strength and stiffness achieved
at room temperature. The brittle nature of the ceramic allowed for difficulty due to the
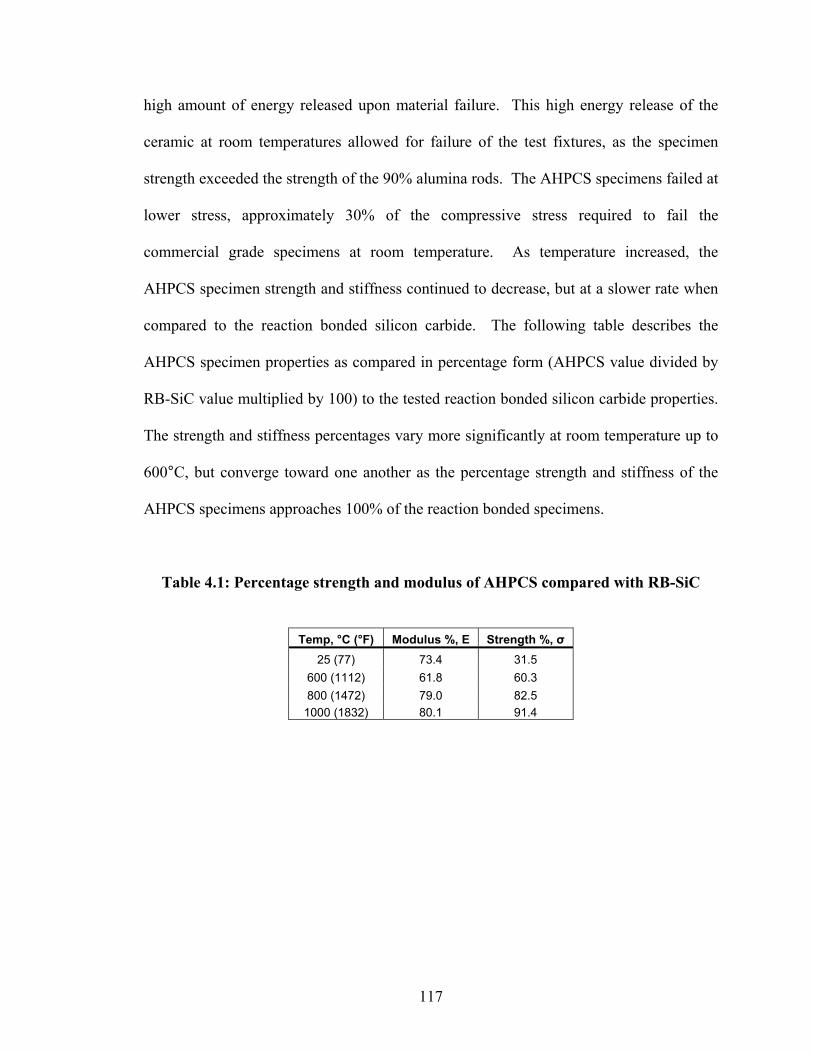
117
high amount of energy released upon material failure. This high energy release of the
ceramic at room temperatures allowed for failure of the test fixtures, as the specimen
strength exceeded the strength of the 90% alumina rods. The AHPCS specimens failed at
lower stress, approximately 30% of the compressive stress required to fail the
commercial grade specimens at room temperature. As temperature increased, the
AHPCS specimen strength and stiffness continued to decrease, but at a slower rate when
compared to the reaction bonded silicon carbide. The following table describes the
AHPCS specimen properties as compared in percentage form (AHPCS value divided by
RB-SiC value multiplied by 100) to the tested reaction bonded silicon carbide properties.
The strength and stiffness percentages vary more significantly at room temperature up to
600°C, but converge toward one another as the percentage strength and stiffness of the
AHPCS specimens approaches 100% of the reaction bonded specimens.
Table 4.1: Percentage strength and modulus of AHPCS compared with RB-SiC
Temp, °C (°F) Modulus %, E Strength %, σ 25 (77) 73.4 31.5
600 (1112) 61.8 60.3 800 (1472) 79.0 82.5
1000 (1832) 80.1 91.4

118
4.2. Future Work Future material testing includes a multitude of low and high temperature tests to attain
empirical material properties and characterize the structural properties of the silicon
carbide and SiC composites. To compliment compressive testing, tensile and flexure
tests would allow a good indication of the stress-strain response for each test, the tensile
and flexure modulus of the material, as well as significant failure modes up to the point
of material rupture. A specific method would need to be developed for both tension
testing and flexure testing in the high temperature ranges. Flexure testing may allow for
less direct loading of the specimen, ceramics in flexure have a much lower strength due
to their brittle nature. Also, the failure is not concentrated directly on a loaded area, as it
is with compressive loading. This may allow for more repeatable tests without swapping
out fixtures or load platens due to small cracks from failure.
If the same MTS 653 furnace were to be used in testing at high temperatures, specimen
size would increase drastically for tensile specimens, due to the size of the furnace and
inability for the actuator hydraulic grips to reach inside the high temperature region.
Shear testing would allow indication of the shear modulus of the material, which would
be advantageous in the case of a fiber-reinforced ceramic. Further testing, based on
silicon carbide as a ceramic, may include testing for fracture toughness by administering
a notch or impact test. Fatigue testing of ceramics may be advantageous in any design
criteria that may require cyclic loading, as crack propogration in ceramics under cyclic
loading may significantly decrease the life of the material or component.
119
Future work on manufacturing and processing consists of identifying and implementing
the equipment necessary in order to successfully produce more volume of samples more
effectively. A multitude of projects could be undertaken with the injection molding
process in order to fine tune the process and allow for more repeatable results. This
would include minimizing cracks and flaws in the material via a vacuum assisted method
or other venting and gas release procedure. Other potential pre-ceramic precursors to
silicon carbide, such as polysilazane or polyureasilazane, could be investigated for use in
injection molding of ceramics, where yield characteristics and pyrolysis temperatures
based on the polymer chemistry may allow for variations in the process, possibly
allowing for improvements over the allyl-hydridopolycarbosilane based precursors.
Brittle fracture of the ceramic upon failure may allow for consideration of adding fiber
reinforcement, creating a fiber-reinforced ceramic matrix composite material (CMC).
The addition of reinforcement into a ceramic matrix would be a major endeavor in
processing of silicon carbide materials, with subsequent validation of material property
tests. The addition of fiber would allow for a more ductile failure as the fiber still carries
load with a matrix failure or crack propagation, along with the potential for decreasing
the overall material density, for example, with carbon or glass fibers. Fiber
reinforcement would be advantageous particularly in controlling failure in cyclically
loaded applications, such as in a gas turbine or internal combustion engine, when
compared to the monolithic ceramic material. Other ceramic binders or high temperature
metallic powders bonded within a matrix may allow for an increase in fracture toughness,
as diffusion of particles, or material transport by atomic motion, allows for a softening
120
effect at high temperatures if a crack is propagated in the material. If a material is
inhomogeneous due to an impurity with a binder or other material composition, a high
temperature environment may allow for particles to be distributed in an arrangement
resulting in a slight change in properties, reducing potential for brittle failure.
Reinforcement and/or other binder materials of a small percentage within a matrix would
allow for a failure of a more ductile nature, rather than a complete catastrophic brittle
failure witnessed with both types of material tested in this study. Regardless of the
desired composition of the material, an analytical or experimental study should be
performed on such materials to verify the mechanical properties and investigate failure
modes, as materials with slight variations in chemical composition will have drastic
variation in properties.

121
REFERENCES Black, S. Are High Temperature Thermoset Resins ready to go commercial? High Performance Composites Magazine. Nov. 2004. Brown, T. L., Lemay, E. H. Jr. and B. E. Bursten. Chemistry: The Central Science. 8th Ed. New Jersey: Prentice Hall, 2000. pp. 456. Campbell, John. Castings, The New Metallurgy of Cast Metals. Burlington, MA: Butterworth-Heinemann, 2003. Coppola, J. A., et al. High Temperature Properties of Sintered Alpha Silicon Carbide. Carborundum Corporation, 1978. DiCarlo, J. A., et al. High-Performance SiC/SiC Ceramic Composite Systems Developed for 1315 °C (2400 °F) Engine Components. Research & Technology 2003, NASA/TM--2004-212729, 2004, 12-13. Danko, G. A., et al. Comparison of Microwave Hybrid and Conventional Heating of Preceramic Polymers to From Silicon Carbide and Silicon Oxycarbide Ceramics. Journal of the American Ceramic Society. Vol. 83, Issue 7. July 2000. Dyson, B.F., Lohr, R. D., and R. Morrell. Mechanical Testing of Engineering Ceramics at High Temperatures. New York: Elsevier Science Publishing Co., Inc., 1989. Flynn, G. and J. W. Macbeth. A Low Friction, Unlubricated, Uncooled Ceramic Diesel Engine- Chapter II. The Adiabatic Engine: Global Developments. SAE Paper 860448. (1986): 185-191. Evans, R. S. et al. Rapid Manufacturing of Silicon Carbide Composites. Rapid Prototyping Journal. Vol. 11, Issue 1. (2005): 37-40. Gozzi, M. F., Radovanovic, E. and I Valeria P. Yoshida. Si3N4/SiC Nanocomposite Powder From a Preceramic Polymeric Network Based on Polymethylsilane as the SiC precursor. Materials Research. Vol. 4, Issue 1. (2001): 13-17. Hoag, K. L., Brands, M. C. and W. Bryzik. Cummins/TACOM Adiabatic Engine Program. Advances in Adiabatic Engines. SAE Paper 850356. (1985): 1-9. Hinton, J. W., Macbeth, J. W. and M. O. TenEyck. Recent Developments in the Fabrication and Testing of Ceramic Engine Components. Proceedings of the 22nd Automotive Technology Development Contractors Coordination Meeting P-155. (1985): 505-517.
122
Harper, Charles A. Handbook of Ceramics, Glasses and Diamonds. New York: McGraw-Hill, 2001.
Havstad, P. H., Garwin I. J. and W. R. Wade. A Ceramic Insert Uncooled Diesel Engine. The Adiabatic Engine: Global Developments. SAE Paper 860447. (1986): 169-183.
Hayes, Susan, et al. Thermal Properties of Polycarbosilane Derived Porous Silicon Carbide Composites. Ceramic Engineering and Science Proceedings. Vol. 24, No. 4 (2003): 555-560. Interrante, Leonard V., Whitmarsh, C.W. and W. Sherwood. Fabrication of SiC Matrix Composites by Liquid Phase Infiltration with a Polymeric Precursor. Materials Research Society Symposia Proceedings. Vol. 365. (1995): 139-146.
Interrante, L.V., et al. Si-Based Ceramics from Polymer Precursors (abstract). The Fifth Conference on Solid State Chemistry 2002. Bratislava, Slovak Republic. July 7-12, 2002.
Johnson, John L. and Randall M. German. Design Capabilities of Powder Injection Molded Materials. Journal of Advanced Materials. Vol. 37, Issue 3. (2005). 51-59.
Kamo, R. and W. Bryzik. Cummins/TACOM Advanced Adiabatic Engine. Adiabatic Engines: Worldwide Review, SP-581. SAE Paper 840428. (1984): 21-34
Knitter, R., Bauer, W. and D Göhring. Microfabrication of ceramics by rapid prototyping process chains. Journal of Mechanical Engineering Science. Vol. 217, Part C. (2003): 41.
Kotani, Masaki et al. Fabrication and Oxidation-Resistance Property of Allylhydridopolycarbosilane Derived SiC/SiC Composites. Journal of the Ceramic Society of Japan. Vol. 11, No. 5. (2003): 300-307.
Kraft, E. H. and G. I. Dooher. Mechanical Properties of High Performance Silicon Carbides. Second International Conference on Mechanical Behavior of Materials. Carborundum Corporation. Boston, MA, Aug. 16-20, 1976. Lei, Jih-Fen, Fitchel, Ed and Amos McDaniel. High Temperature Strain Measurement with a Resistance Strain Gage. SEM Fall Conference and Exhibit: Structural Testing Technology at High Temperatures. Ojai, CA. Nov. 1993. Lukacs, III; Alexander. Reaction Injection Molding of Ceramics Using a Ceramic Precursor as a Binder. US Patent 5190709. Mar. 2, 1993. Matsumoto, et. al. Shape Sintered Articles Derived From Boro-Containing Polysilazanes. US Patent 5386006. Jan. 31, 1995.

123
Matsuoka, H., Kawamura, H. and R. Matsuda. New Connection System Between Ceramic and Metal for Adiabatic Piston Head. The Adiabatic Engine: Global Developments. SAE Paper 860441. (1986): 121-129.
Miller, David. V., Pommell, Donald L. and Gerhard H. Schiroky. Fabrication and Properties of SiC/SiC Composites Derived From CERASET SN Preceramic Polymer. Ceramic Engineering and Science Proceedings. Vol. 18, No. 3, 409-417. 1997.
Munro, R. G. Material Properties of a Sintered alpha-SiC. Journal of Physical and Chemical Reference Data. Vol. 26. (1997): 1195-1203.
Mutsuddy, B.C. Prospects and Problems with Ceramic Injection Molding. Key Engineering Materials. Vols. 56-57. (1991): 265-302.
Ogata, Katsuhiko. System Dynamics, 4th Ed. New Jersey: Pearson Prentice Hall, 2004.
Ogbuji, Linus U. J. T. and M. Singh. Oxidation resistance of reaction-formed silicon carbide ceramics. Ceramic Engineering and Science Proceedings. Vol. 16 No. 5. (1995): 1121-1126.
Saint Gobain Ceramics. Tensile Strength of Hexoloy SA Silicon Carbide, Technical Data Sheet. Feb 20, 2007. <www.hexoloy.com> Saint Gobain Ceramics. Enhanced Hexoloy SA Silicon Carbide, Technical Data Sheet. Feb 20, 2007. <www.hexoloy.com> Starfire Systems. Storage and Handling Instructions- SMP-10, SMP-25, SMP-75. Technical Data Sheets. December, 2005. Soukhanov, Anne. H. silane. Encarta World English Dictionary. Bloomsbury Publishing, PLC. New York: 1999. Tairov, Y.M., V.F. Tsvetkov. Handbook on Electrotechnical Materials. Vol. 3, Issue 19. (1988): 446-471. Mar 19, 2007. <www.ioffe.ru/SVA/NSM/Semicond/SiC/thermal.html> Thring, R. H. Low Heat Rejection Engines. The Adiabatic Engine: Global Developments. SAE Paper 860314. (1986): 43-49. Walls, Joshua. High Temperature Compression Testing of an Advanced Carbon-Carbon Composite in an Oxidizing Atmosphere. Master’s Thesis, University of Maine, 2002. Whalen, T. J., Trela, W. and John R. Baer. Injection Molding of Silicon Carbide: Statistical Design of Experiments. American Powder Metallurgy Institute. Vol 27, No. 2. (1991) 155-158.

124
Whitmarsh, C. K. and L. V. Interrante. Carbosilane Polymer Precursors to Silicon Carbide Ceramics. US Patent 5,153,295. October 6, 1992. Zhang, T. and J. R. G. Evans. The Properties of a Ceramic Injection Molding Suspension Based on a Preceramic Polymer. Journal of the European Ceramic Society. Vol. 7. (1991): 405-412.

125
APPENDICES

126
Appendix A: Compression Test Data
Figure A.1: Dumbbell Shape Specimen Geometry
Figure A.2: Rectangular Prism Shape Specimen Geometry

127
Table A.1: Reaction Bonded Silicon Carbide (RB-SiC) Specimen Data
L1 (L) L2 L3 L4 W1 W2 D1 area mass Specimen (in) (in) (in) (in) (in) (in) (in) (in^2) (g) RB-SiC-HT-01 0.500 - - - 0.236 0.239 - 0.056 - RB-SiC-HT-02 0.496 - - - 0.238 0.240 - 0.057 - RB-SiC-RT-01 0.500 - - - 0.234 0.241 - 0.056 - RB-SiC-RT-02 0.498 - - - 0.239 0.242 - 0.058 - RB-SiC-RT-03 0.501 - - - 0.231 0.240 - 0.055 - RB-SiC-RT-04 0.498 - - - 0.235 0.242 - 0.057 - RB-SiC-RT-05 0.500 - - - 0.236 0.236 - 0.056 - RB-SiC-RT-06 0.501 - - - 0.237 0.237 - 0.056 - RB-SiC-RT-10 0.497 0.122 0.120 0.255 0.236 0.236 0.206 0.0333 1.153 RB-SiC-RT-13-E 0.500 - - - 0.230 0.231 - 0.0531 1.335 RB-SiC-RT-14-E 0.496 - - - 0.229 0.230 - 0.0527 1.310 RB-SiC-RT-15-E 0.500 - - - 0.230 0.230 - 0.0529 1.328 RB-SiC-RT-16-E 0.500 - - - 0.230 0.230 - 0.0529 1.328 RB-SiC-600-01 0.497 0.125 0.124 0.248 0.230 0.230 0.211 0.0350 1.130 RB-SiC-600-02 0.499 0.123 0.128 0.248 0.231 0.231 0.211 0.0350 1.140 RB-SiC-600-03 0.499 0.123 0.125 0.251 0.231 0.231 0.211 0.0350 1.145 RB-SiC-600-04 0.497 0.125 0.123 0.249 0.231 0.230 0.214 0.0360 1.153 RB-SiC-600-05 0.498 0.123 0.123 0.252 0.230 0.230 0.210 0.0346 1.144 RB-SiC-600-06-E 0.498 - - - 0.229 0.230 - 0.0527 1.324 RB-SiC-600-07-E 0.499 - - - 0.235 0.235 - 0.0552 1.392 RB-SiC-600-08-E 0.499 - - - 0.230 0.231 - 0.0531 1.327 RB-SiC-600-09-E 0.499 - - - 0.230 0.230 - 0.0529 1.327 RB-SiC-800-01 0.498 0.122 0.124 0.252 0.230 0.230 0.209 0.0343 1.134 RB-SiC-800-02 0.496 0.122 0.122 0.252 0.230 0.230 0.209 0.0343 1.130 RB-SiC-800-03 0.498 0.122 0.124 0.252 0.235 0.235 0.210 0.0346 1.173 RB-SiC-800-04 0.495 0.123 0.124 0.248 0.229 0.230 0.210 0.0346 1.136 RB-SiC-800-05 0.495 0.124 0.125 0.246 0.231 0.231 0.215 0.0363 1.148 RB-SiC-800-06-E 0.499 - - - 0.230 0.230 - 0.0529 1.333 RB-SiC-800-07-E 0.500 - - - 0.230 0.230 - 0.0529 1.330 RB-SiC-800-08-E 0.499 - - - 0.230 0.230 - 0.0529 1.330 RB-SiC-1000-01 0.496 0.122 0.122 0.252 0.230 0.231 0.210 0.0346 1.141 RB-SiC-1000-02 0.497 0.123 0.122 0.252 0.230 0.229 0.209 0.0343 1.134 RB-SiC-1000-03 0.495 0.123 0.122 0.250 0.231 0.230 0.209 0.0343 1.130 RB-SiC-1000-04-E 0.499 - - - 0.230 0.230 - 0.0529 1.328 RB-SiC-1000-05-E 0.500 - - - 0.230 0.231 - 0.0531 1.331 RB-SiC-1000-06-E 0.500 - - - 0.231 0.231 - 0.0534 1.335

128
Temp Max Ext. Modulus Stress Failure Specimen (°C) Load (lb) Off (lb) (msi) (ksi) mode RB-SiC-HT-01 800 3192 - - 56.6 Vertical axis
RB-SiC-HT-02 1000 6304 5000 17.42 110.3 Platen failure
RB-SiC-RT-01 23 7216 - - 127.9 Vertical axis
RB-SiC-RT-02 23 7754 5000 29.1 134.1 Vertical axis
RB-SiC-RT-03 23 2989 2989 20.9 53.9 Vertical axis
RB-SiC-RT-04 23 6214 5000 34.7 109.2 Vertical axis
RB-SiC-RT-05 23 7164 5000 24.0 128.6 Vertical axis
RB-SiC-RT-06 23 6640 5000 26.3 118.2 Shear
RB-SiC-RT-10 23 11531.5 - - 345.9 Brittle high energy RB-SiC-RT-13-E 23 1752 1752 20.20 - - RB-SiC-RT-14-E 23 4945.1 5000 35.18 - - RB-SiC-RT-15-E 23 4947.0 5000 34.77 - - RB-SiC-RT-16-E 23 4924.2 5000 49.48 - - RB-SiC-600-01 605 6094 - 0.248 174.2 Brittle high energy RB-SiC-600-02 599 6577 - 0.248 188.1 Brittle high energy RB-SiC-600-03 600 6057 - - 173.2 Brittle high energy RB-SiC-600-04 605 6780.7 - - 188.5 Brittle high energy RB-SiC-600-05 596 6495.6 - - 187.5 Brittle high energy RB-SiC-600-06-E 615 1642 1642 11.63 - - RB-SiC-600-07-E 596 4918.4 4918.4 28.52 - - RB-SiC-600-08-E 604 4916.4 4916.4 29.73 - - RB-SiC-600-09-E 598 5001.2 5001.2 29.41 - - RB-SiC-800-01 810 3856.1 - - 112.4 Plastic deformation RB-SiC-800-02 - - - - - - RB-SiC-800-03 - - - - - - RB-SiC-800-04 825 4013.8 - - 115.8 Plastic deformation RB-SiC-800-05 794 4904.9 - - 135.1 Plastic deformation RB-SiC-800-06-E 783 4353.5 4353.5 18.78 - - RB-SiC-800-07-E 803 4942.9 4942.9 16.81 - - RB-SiC-800-08-E 810 4909.2 4909.2 16.47 - - RB-SiC-1000-01 990 3076.9 - - 88.8 Plastic deformation RB-SiC-1000-02 997 3001.0 - - 87.4 Plastic deformation RB-SiC-1000-03 1001 3034.9 - - 88.4 Plastic deformation RB-SiC-1000-04-E 990 3149.6 3149.6 12.30 - - RB-SiC-1000-05-E 999 3169.8 3169.8 11.79 - - RB-SiC-1000-06-E 996 3170.9 3170.9 13.09 - -

129
Specimen Comments RB-SiC-HT-01
Crack propogation along vertical axis on both sides
RB-SiC-HT-02
No visible cracks, was still taking load when test was complete, early removal due to premature cracking due to failure
RB-SiC-RT-01
small corner chip, .030" wide, cut at 45 deg. Great parallelism, .0005 on length, +/- .001 on sides failed spectacularly, broke bottom, 1" wide SiC platen and chipped alumina platen, parts of specimen lost in room, in room, vertical axis failure
RB-SiC-RT-02
0.050" corner chip at 45 deg angle. One side parallel to +/- 0.002, other is .001, Great Parallelism top-bottom, 0.0005" Did not fail completely, failure on one side, crack propogated vertically and sheared corner half way up through specimen
RB-SiC-RT-03
insignificant knicks from cutting, less than 0.010" on corners at 45 deg, Great parallelism. Top to bottom perfect (.0005"), sides within +/- .001, Premature failure, looks to have failed along a bond line of the plate from processing
RB-SiC-RT-04
.058" corner sheared at 45 deg from cutting, few knicks and imperfections, Two long cracks propogating along vertical axis through entire length
RB-SiC-RT-05
No sheared corners, some slight knicks, great parallelism all around, no significant bond line. Failure with small crack initially, took load until the material, started to soften near 7000 lb, stopped test at 7000 lb, Cracks along vertical axis
RB-SiC-RT-06
Failure along corners and sides, no visible cracks along the vertical axis, Failed the lower SiC platen, possibly due to stress concentration on one corner due to lack of perfect alignment along load path
RB-SiC-RT-10
cracked at 1500 lb, cracked at 2000 lb, cracked at 6700 lb, cracked at 11000 lb, failed at 11531 lb, failed top and bottom 90% alumina Rescor rods. Upon failure of the SiC specimen, the load platens were shocked and failed due to the energy release
RB-SiC-RT-13-E
specimen cracked at 1700 lb, test stopped early to avoid extensometer damage and failure to load platens, strain too high, stiffness low
RB-SiC-RT-14-E
specimen cracked at 2500 lb, continued test to 5000 lb, much higher stiffness at higher loads
RB-SiC-RT-15-E
no cracking of specimen, took to 5000 lb
RB-SiC-RT-16-E
best strain/modulus measurement yet
RB-SiC-600-01
Specimen pulverized, 45 degree shear failure along gage section, good failure, high strength, had to re-bond top SiC platen
RB-SiC-600-02
Specimen pulverized, completely sheared on all four sides leaving a point in the center of the specimen, appromately halfway up specimen height, re-bond top SiC platen
RB-SiC-600-03
sheared along gage section, up through the height of the specimen, re-bond top SiC platen
RB-SiC-600-04
sheared along gage section. Completely pulverized into multiple pieces
RB-SiC-600-05
Excellent failure along gage section, top and bottom sections in tact. Top SiC platen has three cracks, replaced with another.
RB-SiC-600-06-E
specimen cracked and test was stopped early
RB-SiC-600-07-E
good measurement of stiffness, test ran to 5000 lb where the test stopped, bottom platen cracked slightly, replaced
RB-SiC-600-08-E
good measurement, test ran to 5000 lb and stopped
RB-SiC-600-09-E
good measurement, test ran to 5000 lb and stopped
RB-SiC-800-01
Extreme deformation beyond typical failure, specimen did not fail in pulverizing manner
RB-SiC-800-02
Failed when loading into the fixture.
RB-SiC-800-03
Failed during warm up, machine was in force mode but did not activate
RB-SiC-800-04
Good failure, strained after peak load reached, same failure type as RB-SiC-800-01
RB-SiC-800-05
Failed with high strain after peak load

130
RB-SiC-800-06-E
less stiff than 600 C, stopped test at 4300 lb
RB-SiC-800-07-E
Test ran to 5000 lb, looks like it started to yield on extensometer curve, specimen length plastically deformed to .498" from .500
RB-SiC-800-08-E
ran to 5000 lb, started to yield, good data, specimen deformed from .499 to .498
RB-SiC-1000-01
Failed with high strain similar to 800 C specimens, with less load at peak
RB-SiC-1000-02
Failed with plastic deformation effect after peak, took beyond failure with temperature still in 1000 C test range
RB-SiC-1000-03
Plastic deformation after peak, 5 min test
RB-SiC-1000-04-E
Did not yield, stopped test at 3150 lbs, top platen developed a crack, replaced with a new one
RB-SiC-1000-05-E
Good stiffness, load jumped around 0.002 in/in due to a crack in specimen, test stopped at 3150 lb, specimen did not yield and plastically deform
RB-SiC-1000-06-E
Extensometer measurement not linear but gives good data when taking strains from 0.003 to 0.004 in/in, stopped test at 3150 lb. replaced lower platen, had a crack starting
Table A.2: AHPCS Silicon Carbide Specimen Data
L W1 W2 Area mass Density Specimen (in) (in) (in) (in^2) (g) (g/cc) AHPCS-RT-I5-01 0.501 0.250 0.250 0.0625 1.279 2.493 AHPCS-RT-I5-02 0.495 0.250 0.250 0.0625 1.250 2.466 AHPCS-RT-I5-03 0.500 0.250 0.250 0.0625 1.249 2.439 AHPCS-RT-I5-04 0.499 0.250 0.250 0.0625 1.242 2.430 AHPCS-RT-I5-05 0.501 0.248 0.250 0.0620 1.239 2.434 AHPCS-RT-I5-06 0.500 0.250 0.250 0.0625 1.255 2.451 AHPCS-RT-I6-01 0.500 0.250 0.250 0.0625 1.225 2.392 AHPCS-RT-I6-02 0.500 0.250 0.250 0.0625 1.220 2.382 AHPCS-RT-I6-03 0.499 0.250 0.250 0.0625 1.232 2.411 AHPCS-RT-I6-04 0.501 0.248 0.250 0.0620 1.200 2.357 AHPCS-RT-I6-05 0.500 0.249 0.249 0.0620 1.228 2.417 AHPCS-RT-I8-01 0.499 0.250 0.250 0.0625 1.263 2.471 AHPCS-RT-I8-02 0.500 0.250 0.250 0.0625 1.264 2.468 AHPCS-RT-I8-03 0.499 0.250 0.250 0.0625 1.264 2.473 AHPCS-RT-I9-01 0.500 0.250 0.250 0.0625 1.293 2.525 AHPCS-RT-I22-01 0.499 0.250 0.250 0.0625 1.278 2.501 AHPCS-RT-I22-02 0.496 0.250 0.250 0.0625 1.274 2.508 AHPCS-RT-I22-03 0.500 0.249 0.250 0.0623 1.266 2.482 AHPCS-600-I8 0.499 0.249 0.250 0.0623 1.273 2.501 AHPCS-600-I9 0.500 0.250 0.250 0.0625 1.274 2.488 AHPCS-600-I22 0.500 0.249 0.249 0.0620 1.255 2.470 AHPCS-800-I8 0.499 0.249 0.249 0.0620 1.263 2.491 AHPCS-800-I9 0.497 0.248 0.248 0.0615 1.270 2.535 AHPCS-800-I22 0.497 0.248 0.248 0.0615 1.256 2.507 AHPCS-1000-I8 0.496 0.248 0.248 0.0615 1.284 2.568 AHPCS-1000-I9 0.497 0.248 0.248 0.0615 1.275 2.547 AHPCS-1000-I22 0.497 0.248 0.243 0.0603 1.237 2.521

131
Temp Max Ext. Modulus Stress Failure Specimen (°C) Load (lb) Off (lb) (msi) (ksi) mode AHPCS-RT-I5-01 23 2644.5 2644.5 14.97 42.3 crushing AHPCS-RT-I5-02 23 1096.2 1096.2 3.78 17.5 vertical edge AHPCS-RT-I5-03 23 3318.6 3318.6 18.66 53.1 crack AHPCS-RT-I5-04 23 3133.3 3133.3 14.90 50.1 high energy shear AHPCS-RT-I5-05 23 2583.6 2583.6 8.60 41.7 high energy shear AHPCS-RT-I5-06 23 2337.1 2337.1 5.82 37.4 crushing AHPCS-RT-I6-01 23 3812.6 3812.6 17.72 61.0 high energy shear AHPCS-RT-I6-02 23 3820.6 2500 19.33 61.1 high energy shear AHPCS-RT-I6-03 23 4279.1 2500 22.56 68.5 high energy shear AHPCS-RT-I6-04 23 2828.8 2500 15.01 45.6 high energy shear AHPCS-RT-I6-05 23 4064.6 2500 18.70 65.6 high energy shear AHPCS-RT-I8-01 23 7190.6 3500 26.23 115.0 high energy shear AHPCS-RT-I8-02 23 6935.2 5000 26.47 111.0 high energy shear AHPCS-RT-I8-03 23 6119.6 5000 24.19 97.9 high energy shear AHPCS-RT-I9-01 23 7004.9 5000 28.77 112.1 high energy shear AHPCS-RT-I22-01 23 6593.5 5000 24.66 106.2 high energy shear AHPCS-RT-I22-02 23 7086.8 5000 29.55 113.6 high energy shear AHPCS-RT-I22-03 23 5442.9 5000 18.93 107.9 high energy shear AHPCS-600-I8 604 6610.7 2500 20.66 106.2 crack, stopped AHPCS-600-I9 592 7097.3 3500 15.45 113.6 high energy shear AHPCS-600-I22 599 6692.4 3500 18.97 107.9 high energy shear AHPCS-800-I8 794 5974.4 2500 14.22 96.4 crack, stopped AHPCS-800-I9 794 6181.7 2500 10.32 100.5 high energy shear AHPCS-800-I22 796 6319.6 3500 16.61 102.8 crack, yield started AHPCS-1000-I8 994 5079.4 3500 11.08 82.6 yield started AHPCS-1000-I9 996 4806.1 3500 9.46 78.1 yield started AHPCS-1000-I22 990 4891.0 3500 9.24 81.2 yield started

132
Specimen Comments
AHPCS-RT-I5-01 Crushing of specimen started on the side where at location of large crack
AHPCS-RT-I5-02 Specimen split on one side, causing premature failure, side with failure has several small cracks
AHPCS-RT-I5-03 Very small crack on one edge, failure with small cracking noise, no shearing or vertical failure, specimen still all in tact
AHPCS-RT-I5-04
Failed vertically along the corners of the specimen, and sheared into the center of the specimen close, to a 45 degree angle, pinched lower platen, causing a crack. Replaced with another SiC platen
AHPCS-RT-I5-05 A few cracks on the sides and top of the specimen initially, failed in shear and vertically on one side
AHPCS-RT-I5-06 A few small cracks on 2 sides of the specimen before testing, specimen crushed in the center at the location of the cracks
AHPCS-RT-I6-01 Good failure, high energy, sheared at a 45 degree angle all around specimen, meeting at the center half way up height
AHPCS-RT-I6-02 Another good failure, high energy, removed extensometer at 2500 lb before failure, specimen failed at 45 degree toward the center and shattered similar to the reaction bonded specimens
AHPCS-RT-I6-03 Good failure, high energy, specimen failed at 45 degree toward the center and shattered similar to the reaction bonded specimens and I6-02
AHPCS-RT-I6-04 Good failure, due to a few very small surface pores and lower density, it is assumed at the material is quite porous, sheared toward center cross section and height at a 45 degree
AHPCS-RT-I6-05 Good failure, just as others, shear failure in the center of specimen after extensometer removal
AHPCS-RT-I8-01 Crack at 3500 lb, extensometer removed, crack at 6700, brittle failure, lower SiC platen failed, replaced with a new one
AHPCS-RT-I8-02 Ext removed at 5000 lb, first crack at 6000 lb, good shear brittle failure
AHPCS-RT-I8-03 Good shear brittle failure, ext removed at 5000 lb, crack at 850 lb, no cracks on the surface of the part, possibly an inclusion
AHPCS-RT-I9-01 Brittle shear, upper platen cracked, good failure and strain measurement
AHPCS-RT-I22-01 Brittle shear, good failure and strain measurement
AHPCS-RT-I22-02 Nice linear extensometer strain measurement, high modulus, good failure
AHPCS-RT-I22-03 Low failure point, must have had an internal flaw or crack that was not seen on the surface
AHPCS-600-I8
High strength, very minimal cracks in material before test, one crack propogated through and measured after test, no material brittle failure, stopped test at 6600, specimen started to yield. Stiffness compares to room temperature due to near flawless material surface finish, post test mass and surface finish not affected by temperature
AHPCS-600-I9 Crack at 2200 lb,didn't effect stiffness through strain measurement, top platen fell out of top fixture, possibly this cracked at 2200, failing the top platen. Rebonded top platen
AHPCS-600-I22 Extensometer slipped but still gives good data
AHPCS-800-I8
High strength, started to yield, stopped test when cracked and strain decreased, specimen deformed to 0.498" length after test, specimen discolored to a darker brown than other specimens upon testing. Measured mass, found it to be 1.277 g, indicating oxidation
AHPCS-800-I9
Specimen taken to failure, could not determine if specimen oxidized, the color of the specimen did not change at all, pulverized significantly, possibly more than the 850 C pyrolyzed specimens.
AHPCS-800-I22 Good high failure cracking, stopped due to high load and yielding, initial stiffness very high, mass 1.260 g after test
AHPCS-1000-I8
More initial strain due to softening of silicon carbide platens, this material does not soften due to excess silicon whereas the platens do, high stress, good stiffness, comparable to 800 C. Corner chipped off during test before failure, slightly darker color than non-tested sample, no evidence of oxidation (no white dots).
AHPCS-1000-I9
Yield started, test stopped at 4800 lb, crack in platen, small, did not replace, may allow for a higher strain measurement, giving lower stiffness, strain for these specs calculated from .003 to .005
AHPCS-1000-I22 More strain due to crack, still gave a good modulus from .003 to .007, test stopped when starting to yield, chip taken out of specimen. Lower platen cracked again, replaced

133
Appendix B: Oxidation Test Results Appendix B.1. Reaction Bonded Silicon Carbide Specimens (RB-SiC) Data
volume volume pre-test post-test mass Specimen L (in) w1 (in) w2 (in) (in^3) (cm^3) mass (g) mass (g) change (g)
RB-SiC-01 0.505 0.238 0.259 0.031 0.510 1.491 1.490 -0.001 RB-SiC-02 0.489 0.238 0.243 0.028 0.463 1.388 1.388 0.000 RB-SiC-03 0.500 0.235 0.239 0.028 0.460 1.373 1.372 -0.001 RB-SiC-04 0.502 0.231 0.240 0.028 0.456 1.367 1.367 0.000 RB-SiC-05 0.495 0.237 0.246 0.029 0.473 1.401 1.400 -0.001
pre-test post-test density density density change Specimen (g/cm^3) (g/cm^3) (g/cm^3) Comments
RB-SiC-01 2.923 2.921 -0.002 length not parallel, sides not parallel RB-SiC-02 2.995 2.995 0.000 length too short, corner missing, good parallelism RB-SiC-03 2.984 2.981 -0.002 one end parallel on short sides RB-SiC-04 2.997 2.997 0.000 nub would cause early failure in compression on end RB-SiC-05 2.962 2.960 -0.002 long ends not parallel
Appendix B.2. AHPCS Based Silicon Carbide Data
Pre-test dimensions volume volume Specimen L (in) w1 (in) w2 (in) (in^3) (cm^3)
I15b 0.551 0.366 0.511 0.103 1.689 I16b 0.651 0.415 0.528 0.143 2.338 I16c 0.696 0.417 0.642 0.186 3.053 I18a 0.686 0.378 0.386 0.100 1.640 I20a 0.684 0.461 0.613 0.193 3.168
Post-test dimensions, 1000 C 10 minutes volume volume Specimen L (in) w1 (in) w2 (in) (in^3) (cm^3)
I15b 0.548 0.365 0.508 0.101 1.662 I16b 0.646 0.414 0.525 0.140 2.292 I16c 0.686 0.412 0.638 0.182 2.975 I18a 0.680 0.380 0.383 0.098 1.613 I20a 0.680 0.460 0.613 0.192 3.146

134
Post-test dimensions, 1000 C 12 hours volume volume Specimen L (in) w1 (in) w2 (in) (in^3) (cm^3)
I15b 0.549 0.365 0.508 0.101 1.657 I16b 0.645 0.412 0.524 0.139 2.275 I16c 0.685 0.415 0.637 0.181 2.969 I18a 0.680 0.381 0.377 0.098 1.607 I20a 0.678 0.460 0.611 0.191 3.129
mass volume density original 10 min 12 hour original 10 min 12 hour original 10 min 12 hour Spec (g) (g) (g) (cm^3) (cm^3) (cm^3) (g/cm^3) (g/cm^3) (g/cm^3)
I15b 4.1398 4.1688 4.2008 1.689 1.662 1.657 2.451 2.508 2.535 I16b 5.5018 5.5171 5.5487 2.338 2.292 2.275 2.354 2.407 2.439 I16c 7.2359 7.2659 7.3050 3.053 2.975 2.969 2.370 2.443 2.461 I18a 4.0386 4.0476 4.0749 1.640 1.613 1.607 2.462 2.509 2.536 I20a 7.5556 7.5981 7.6423 3.168 3.146 3.129 2.385 2.415 2.443
mass change volume change density change mass/surface area 10 min 12 hour 10 min 12 hour 10 min 12 hour 10 min 12 hour Spec (%) (%) (%) (%) (%) (%) (mg/cm^2) (mg/cm^2) I15b 0.701 1.474 -1.55 -1.88 2.28 3.42 24.8 52.4 I16b 0.278 0.852 -1.94 -2.67 2.27 3.61 10.2 31.5 I16c 0.415 0.955 -2.57 -2.76 3.07 3.82 18.0 41.5 I18a 0.223 0.899 -1.64 -2.04 1.90 3.00 6.8 27.3 I20a 0.562 1.147 -0.68 -1.22 1.25 2.40 23.4 47.8 AVG 0.44 1.07 -1.68 -2.11 2.15 3.25 16.6 40.1

135
Appendix C: Procedures
Appendix C.1. AHPCS Specimen Preparation
1. At the green cured state (400°C) from the injection molding process, the
specimens can be easily machined and formed into shape using a saw with a
diamond wheel, or sanded, ground or filed dry using grinding or sanding
equipment. A belt sander was used to prepare the specimens for pyrolysis. Sand
the specimens into rectangular prisms to relieve the specimens from all
imperfections and to attain good dimensional stability for volume measurements.
2. A respirator, gloves and glasses are to be used when preparing the specimens,
whether using a wet saw or sanding equipment. A lab coat or other protective
clothing can be worn to shield the body from airborne particles.
3. Specimens can be cut with a water cooled or un-cooled diamond wheel in order to
relieve the specimens of imperfections or sheared corners that occurred from
removal of the part from the mold, or from part cracking due to high porosity.
The parts cut very easily in the cured state. It is recommended to cut the
specimens dry as to not contaminate the specimens with water prior to the
pyrolysis procedure. When cutting with the South Bay Technology low speed
saw, a blade thickness of 0.008” and 3” diameter was used. One cut through a
specimen thickness of approximately 0.75” and height 1.0” takes approximately
5-10 minutes. Some specimens were sanded to relieve minor blemishes and
imperfections, and some needed to be cut into as many as three separate pieces to
remove undesired imperfections to allow for reasonable specimens for processing
and compression testing. Once specimens are cut using the diamond saw, the
136
specimens can be finish sanded to attain good dimensional stability.
4. The specimens can be sanded very easily in the green cured state. When sanding,
rotate the sides of the specimen to get flat, parallel and perpendicular edges, the
deck surface of the belt sander may not be perfectly aligned, but should be within
a few thousandths of an inch. Use calipers to check and measure the dimensions
of the parts. A tolerance of 0.005” between the largest and smallest dimension on
a side was desired. Most dimensions were within 0.002-0.003”, and one
dimension varied from 0.009” on a side.
5. Measure all dimensions of the specimens cured at 400°C using a caliper, attaining
measurements to the nearest 0.001”. Take three measurements per side to attain a
good average for calculation of volume.
6. Once the specimens dimensions are measured, the specimens can be weighed
using the Model AE100 +\- 0.0001 gram scale in Crosby Hall, room 102. Be sure
the scale attains a constant measurement for each specimen, take up to three
measurements for accuracy. Align the specimens on the graphite plate that is
used to hold the specimens in the tube furnace during pyrolysis. Keep all
specimens in the same location, documenting the location with pictures and
labels, a sheet of white paper in the background works well for documenting and
labeling the specimens.
7. Calculate density from the measured dimensions and volume calculated, and from
the mass attained when weighing each specimen.
8. The specimens are now ready for pyrolysis in the tube furnace under an inert
atmosphere.
137
Appendix C.2. Procedure for MTS 810 and FlexTest SE
1. Turn on MTS Flex Test SE
2. Turn on computer, load Station Manager (Programs, MTS FlexTest, Station
Manager)
3. Load “UMaine” Configuration
4. Load configuration name “SiC Compression”
5. Load Procedure “SiCCompressionWstrain”. This procedure allows data
acquisition of actuator load, actuator displacement and extensometer strain.
6. Check procedure for appropriate load rate of 0.005 in/min, hold during test for
extensometer removal at desired load, and end of test parameters.
7. Create a folder for the specimens. Go to Specimen Editor.
8. Once a folder is created, reset the specimen name.
9. Turn on hydraulics in the hydraulic room. Make sure the hydraulic service
manifold (HSM) is turned to off, as the default will be.
10. Turn on the hydraulics first to low position, then to high. A pressure reading on
the gauge under high pressure will indicate that it is on.
11. Click on the exclusive control button, this will allow control of the station and
actuator.
12. Reset or override any interlock buttons on the station manager.
13. Turn on the HSM first to low, then high in the station manager.
14. Click on the manual command control button. This will allow manual control of
the lower actuator.

138
15. Make sure the active mode is set to displacement. This controls the actuator
displacements. If the values under the manual command are changed, the actuator
will move. Make sure there is nothing in the way of the actuator before turning
this on. If the actuator is set to force, the actuator will move into position until the
command force is attained. If desired with fixture setup, set to force. If not, make
sure to use displacement mode.
16. To move the upper actuator, switch the manual lever to on. This is located on the
right, front side of the actuator. Move the top actuator up and down with the
switch to position.
17. To use the grips, turn on the pressure at the rear box, and apply the pressure
desired to grip specimens or fixtures. Adjust the pressure using the knobs.
18. Once all of this is done, the actuator and grips are functional.

139
Appendix C.3. Procedure for bonding alumina and silicon carbide fixtures
1. Heat the steel block fixture until the Rescor alumina fixture fits the inner diameter
of the bore of the interference fit. A hot plate or oxygen/acetylene torch can be
used to heat the block.
2. Use a weight or the hydraulic actuator to apply pressure to the fixture and steel
block, keeping the assembly vertically aligned as it cools.
3. Once the alumina inserts are fit into the steel blocks, install the Aremco alumina
inserts into the bore of the Rescor alumina.
4. Fit both fixtures into the grips of the actuator.
5. Adjust the height of the top load head manually using the switch on the right,
front side of the load frame.
6. Install the silicon carbide load platens in between the Aremco alumina inserts.
Carefully adjust the height of the upper load head until contact is made between
the SiC platens.
7. Allow vertical alignment of the top and bottom fixtures using a set of machinist
gage blocks of the appropriate size. The Aremco alumina inserts used were 1.5”
diameter discs, and the silicon carbide platens were ground square to 1.000” ±
0.002”. Gage blocks with a thickness of 0.250” can be used to create a centered
and square SiC platen on the Aremco alumina disc. This will allow good
alignment of the specimens using the gage blocks to reference from the SiC
platens when loading specimens for testing.
8. Once the fixtures are aligned, switch the control mode to force on the MTS
FlexTest Station Manager and apply 250 lb to the assembly.

140
9. Bond the upper Aremco alumina insert to the Rescor alumina rod, and the SiC
platen to the Aremco insert using high temperature alumina ceramic putty,
Thermeez (Cotronics Corp, NY).
10. Bond the lower SiC load platen to the lower Aremco alumina insert using the
putty. Surround the test fixtures with the furnace after 1-2 hours of room
temperature cure.
11. Ramp the furnace up to approximately 100°C (212°F) at a rate of 7-10°C/min to
cure the putty for 1 hour.
12. When the 100°C cure time is complete, open the furnace, remove the load from
the fixtures. The upper fixtures will be bonded as one piece, allowing the upper
load platen to move upward without dropping any fixture pieces.
13. The fixtures are ready for compression testing once the bonding of ceramic is
complete.

141
Appendix C.4. Procedure for High Temperature Compression Tests
1. Install the lower steel load platen with alumina fixture into the bottom grip with
the 9/16”-12 UNC threaded rod. Apply pressure at the grips, approximately 2000
psi.
2. Install the upper fixture in the same manner. Install the upper fixture thin plate
diffuser for high temperature tests.
3. Adjust the height of the lower and upper load heads until a satisfactory height is
attained for aligning the furnace with the load platens and extensometer bracket.
4. Make sure the notches in the Aremco alumina inserts are located at the front of
the assembly. The extensometer will reach through the furnace and attach to
these notches.
5. Mount the furnace on the load frame. Adjust the height accordingly so the center
of the furnace surrounds the specimen area, and allow room for the extensometer
ceramic leads to attach to the alumina inserts through the holes in the side of the
furnace.
6. If the furnace is in position, open it along its cantilever beam and swing it open to
allow room for specimen loading onto the silicon carbide load platens.
7. Gently raise the lower actuator using the manual command using very small
increments.
8. A right angle square tool should be used to check the alignment of the fixtures.
Due to the interference fit of the alumina rods within the steel blocks, alignment
should not be an issue. If the fixtures are out of alignment, heat the steel blocks to
remove the alumina rods, clean the blocks and the alumina rods with a fine grit

142
sandpaper, blow any dust or residue off the fixtures, and reheat the block to allow
the alumina to be fit into the steel fixture. This will eliminate bending of the
fixtures as well as the specimen, to allow for good load distribution through the
vertical centerline of the entire assembly. Reattach the steel blocks and alumina
into the MTS grips using the threaded rod once this is complete and check for
alignment.
9. Once the fixtures are aligned, place a specimen in the center of the lower SiC load
platen with a pair of tweezers or extended gripping tool. Align the specimen on
the silicon carbide load platens using machinist gage blocks of the desired sizes
for to align the specimen along the centerline of the load path. Lower the upper
load head until the specimen touches the upper load fixtures, or use the
displacement command to come close to the specimen without touching it, then
use the force command to allow the specimen to be loaded up to 50 lb.
10. If a satisfactory parallel connection is made between the specimen and the load
fixtures, switch the control mode to force. Apply a force of 50-250 pounds to put
pressure on the specimen to allow it to stay in place. Switch the control mode
back to displacement.
11. Attach the extensometer mounting arm to the load frame. Adjust the height so
that the center of the extensometer is aligned with the center of the specimen.
12. Attach the ceramic extensometer leads within the notches of the Aremco alumina
inserts. This will allow for a starting gage length of approximately 10% larger
gage length than the 1.000” gage length of the extensometer. The extensometer
maximum extended length is approximately 10%, be sure that a positive strain

143
percentage is reading on the MTS FlexTest SE monitor. Once loaded in
compression, the strain will decrease until failure as the extensometer follows the
loaded specimen. Be sure to check the strain under high temperature loads, as the
silicon carbide will expand under temperature. With the extensometer attached, it
is important not to over-extend the extensometer during this ramp up period.
Strain can be monitored using the extensometer output and the displacement
output, as the displacement output will be much larger than the strain output due
to the larger length of the test assembly as compared to the gage length of the
extensometer.
13. Zero the displacement, force and strain using the Auto offset button once the
extensometer is attached.
14. Once all is checked, if a high temperature test is desired, turn on the furnace and
allow warm up to the test temperature.
15. Place the steel safety cage around the test assembly.
16. Attach the coolant fittings to the steel fixtures, use Teflon tape on the fitting
threads to prevent leaks. Open the valves, run the tubing to and from a sink, and
turn on the water to allow coolant flow through the steel fixtures.
17. When a steady-state test temperature is achieved, start the test program on the
MTS Station Manager.
18. Run the test.
19. Once the test hold command is reached, remove the extensometer from the
assembly. Continue the test until the specimen is loaded to failure.
20. Save the data file and repeat the test with another specimen.

144
Appendix D: Relay Box Wiring Schematic
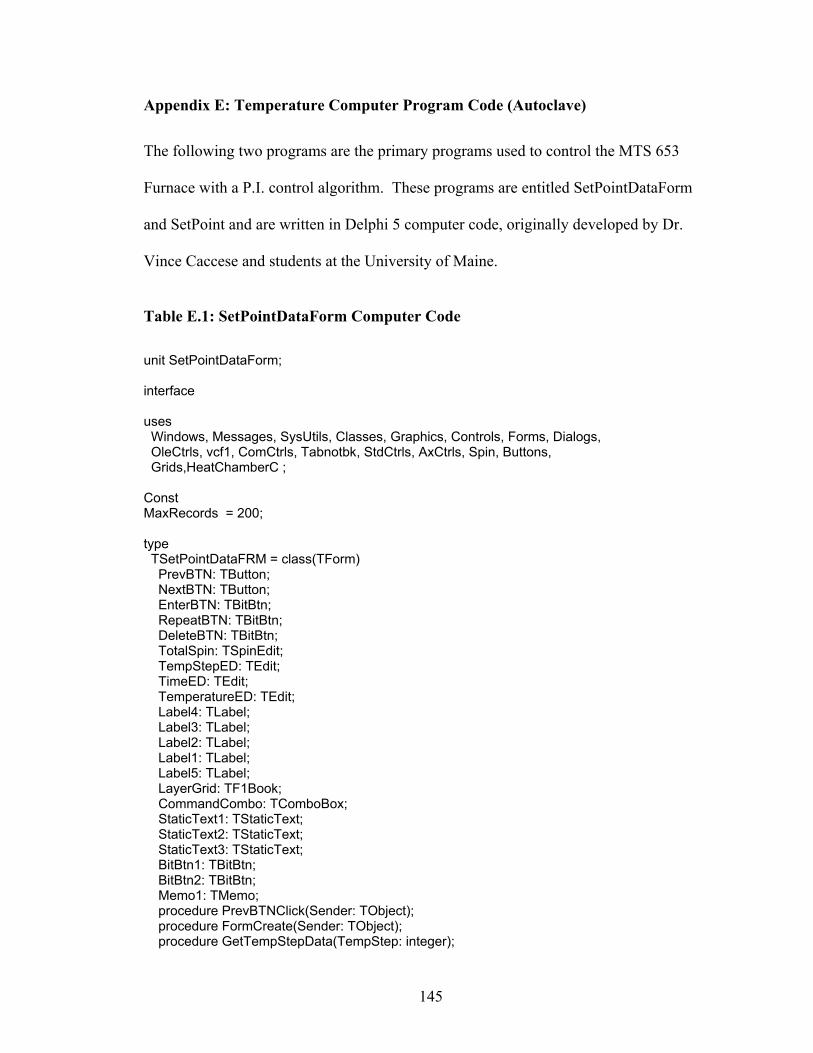
145
Appendix E: Temperature Computer Program Code (Autoclave)
The following two programs are the primary programs used to control the MTS 653
Furnace with a P.I. control algorithm. These programs are entitled SetPointDataForm
and SetPoint and are written in Delphi 5 computer code, originally developed by Dr.
Vince Caccese and students at the University of Maine.
Table E.1: SetPointDataForm Computer Code
unit SetPointDataForm; interface uses Windows, Messages, SysUtils, Classes, Graphics, Controls, Forms, Dialogs, OleCtrls, vcf1, ComCtrls, Tabnotbk, StdCtrls, AxCtrls, Spin, Buttons, Grids,HeatChamberC ; Const MaxRecords = 200; type TSetPointDataFRM = class(TForm) PrevBTN: TButton; NextBTN: TButton; EnterBTN: TBitBtn; RepeatBTN: TBitBtn; DeleteBTN: TBitBtn; TotalSpin: TSpinEdit; TempStepED: TEdit; TimeED: TEdit; TemperatureED: TEdit; Label4: TLabel; Label3: TLabel; Label2: TLabel; Label1: TLabel; Label5: TLabel; LayerGrid: TF1Book; CommandCombo: TComboBox; StaticText1: TStaticText; StaticText2: TStaticText; StaticText3: TStaticText; BitBtn1: TBitBtn; BitBtn2: TBitBtn; Memo1: TMemo; procedure PrevBTNClick(Sender: TObject); procedure FormCreate(Sender: TObject); procedure GetTempStepData(TempStep: integer);

146
procedure SetTempStepData(TempStep: integer); procedure EnterBTNClick(Sender: TObject); procedure WriteGridData(CurrentStep: integer); procedure NextBTNClick(Sender: TObject); procedure RepeatBTNClick(Sender: TObject); procedure TotalSpinChange(Sender: TObject); procedure BitBtn1Click(Sender: TObject); private { Private declarations } public CurrentTempStep : integer; { TotalTempSteps : integer; } ControlData : array[1..MaxRecords] of ControlTempRec; procedure ShowListBox; procedure WriteCFGData(CFGName: String); procedure ReadCFGData(CFGName: String); { Public declarations } end; var SetPointDataFRM: TSetPointDataFRM; implementation {$R *.DFM} uses Daqfi32Main, SetPoint; procedure TSetPointDataFRM.ShowListBox; var i,ssError : integer; pShown : SmallInt; pX,pY,pCX,PCy: integer; ThisWidth, ThisHeight : integer; nRow1,nCol1,nRow2, nCol2 : integer; List1 : TList; Txt : String; PTxt : PChar; begin For i:=0 to 3 do begin Txt := Inttostr(i); StrPCopy(PTxt,Txt); List1.Add(PTxt); end; end; procedure TSetPointDataFRM.WriteCFGData(CFGName: String); var i : integer; FN : textFile; begin {$I-} AssignFile(FN,CFGFileName); Rewrite(FN); Writeln(FN,'TEMPERATURE CONTROL DATA'); Writeln(FN,TotalTempSteps); for i:=1 to TotalTempSteps do

147
begin Writeln(FN,ControlData[i].CommandType); Writeln(FN,ControlData[i].Command); Writeln(FN,ControlData[i].Time); Writeln(FN,ControlData[i].Temperature); end; CloseFile(FN); {$I+} end; procedure TSetPointDataFRM.ReadCFGData(CFGName: String); var i : integer; FN : textFile; tmpstr : string; begin AssignFile(FN,CFGFileName); Reset(FN); Readln(FN,tmpstr); Readln(FN,TotalTempSteps); TotalSpin.Value := TotalTempSteps; TempStepED.text := '1'; for i:=1 to TotalTempSteps do begin Readln(FN,ControlData[i].CommandType); Readln(FN,ControlData[i].Command); Readln(FN,ControlData[i].Time); Readln(FN,ControlData[i].Temperature); CurrentTempStep := i; WriteGridData(i); end; CurrentTempStep := 1; GetTempStepData(CurrentTempStep); end; procedure TSetPointDataFRM.PrevBTNClick(Sender: TObject); begin If CurrentTempStep > 1 then begin dec(CurrentTempStep); GetTempStepData(CurrentTempStep); end else begin CurrentTempStep := 1; GetTempStepData(CurrentTempStep); end; end; procedure TSetPointDataFRM.GetTempStepData(TempStep: integer); begin TempStepED.Text := IntToStr(CurrentTempStep); CommandCombo.ItemIndex := ControlData[TempStep].CommandType; TimeED.text := FloatToStr(ControlData[TempStep].Time); TemperatureED.text := FloatToStr(ControlData[TempStep].Temperature);

148
end; procedure TSetPointDataFRM.SetTempStepData(TempStep: integer); begin ControlData[TempStep].CommandType := CommandCombo.ItemIndex; ControlData[TempStep].Command := CommandCombo.Items[CommandCombo.ItemIndex]; ControlData[TempStep].Time := StrToFloat(TimeED.text); ControlData[TempStep].Temperature := StrToFloat(TemperatureED.text); end; procedure TSetPointDataFRM.FormCreate(Sender: TObject); begin CurrentTempStep :=1; TotalTempSteps :=1; CommandCombo.ItemIndex := CM_RAMP; SetPointDataValid := false; PrevBTNClick(Sender); end; procedure TSetPointDataFRM.EnterBTNClick(Sender: TObject); begin SetTempStepData(CurrentTempStep); WriteGridData(CurrentTempStep); end; procedure TSetPointDataFRM.WriteGridData(CurrentStep: integer); var pText : String; begin LayerGrid.SetactiveCell(CurrentStep,1); pText := ControlData[CurrentStep].Command; LayerGrid.Text := pText; LayerGrid.SetactiveCell(CurrentStep,2); pText := Format('%*.*f', [8, 2, ControlData[CurrentStep].Time]); LayerGrid.Text := pText; LayerGrid.SetactiveCell(CurrentStep,3); pText := Format('%*.*f', [8, 2, ControlData[CurrentStep].Temperature]); LayerGrid.Text := pText; end; procedure TSetPointDataFRM.NextBTNClick(Sender: TObject); begin If CurrentTempStep < TotalTempSteps then begin inc(CurrentTempStep); GetTempStepData(CurrentTempStep); end; end; procedure TSetPointDataFRM.RepeatBTNClick(Sender: TObject); begin

149
if CurrentTempStep < TotalTempSteps then begin inc(CurrentTempStep); SetTempStepData(CurrentTempStep); WriteGridData(CurrentTempStep); end; end; procedure TSetPointDataFRM.TotalSpinChange(Sender: TObject); begin TotalTempSteps := TotalSpin.Value; end; procedure TSetPointDataFRM.BitBtn1Click(Sender: TObject); begin SetPointDataValid := true; HeatChamberMainFrm.show; end; end. Table E.2: SetPoint Computer Code unit SetPoint; interface uses Windows, Messages, SysUtils, Classes, Graphics, Controls, Forms, Dialogs, StdCtrls, HeatChamberC,DAQ32HeatInterface, Daqfi32Main,SetPointDataForm, ExtCtrls, Grids, ComCtrls; Const IntervalTime = 1; {Gain Timer Interval} Period = 5; type TSetPointFRM = class(TForm) ControlTimer: TTimer; Timer2: TTimer; zone3DutyCycleBar: TProgressBar; GroupBox1: TGroupBox; Label1: TLabel; Label2: TLabel; Label3: TLabel; Label4: TLabel; Label5: TLabel; zone1DutyCycleBar: TProgressBar; Label6: TLabel; zone2DutyCycleBar: TProgressBar; Label7: TLabel; Label8: TLabel;

150
Edit1: TEdit; Edit2: TEdit; Edit3: TEdit; Button1: TButton; Label9: TLabel; Label10: TLabel; zone1KpED: TEdit; zone1KiED: TEdit; zone2KpED: TEdit; zone2KiED: TEdit; zone3KpED: TEdit; zone3KiED: TEdit; Label11: TLabel; SetPoint_Ed: TEdit; Label12: TLabel; Label13: TLabel; incr_ed: TEdit; PTemp_ED: TEdit; Label14: TLabel; Label15: TLabel; Time_ED: TEdit; Label16: TLabel; Command_ED: TEdit; Label17: TLabel; Overshoot_CB: TComboBox; Overshoot_CkB: TCheckBox; procedure TemperatureControlData; procedure TurnElementOn(ElementNo: integer); procedure TurnElementOff(ElementNo: integer); procedure Hold(TimeIncr: integer); procedure ControlTimerTimer(Sender: TObject); procedure Timer2Timer(Sender: TObject); procedure CalculateSetPoint(Time: real); Procedure AdjustTemperature; procedure FormCreate(Sender: TObject); procedure Zone1Gain(GainTimeIncr1: integer); procedure Zone2Gain(GainTimeIncr2: integer); procedure Zone3Gain(GainTimeIncr3: integer); procedure PIControl; procedure PIControlParameters; procedure Button1Click(Sender: TObject); procedure Overshoot_CBChange(Sender: TObject); procedure WriteCFGData(CFGName: String); procedure ReadCFGData(CFGName: String); private {StepNo,} TimeStepNo, Command: integer; Gain1StepNo,Gain2StepNo,Gain3StepNo: longint; HoldTime,PreviousError1,PreviousError2,PreviousError3: real; zone1Ki,zone2Ki,zone3Ki,zone1Kp,zone2Kp,zone3Kp : real; HoldTemp,StopInc,Zone1,Zone2,Zone3 : boolean;

151
CalculateGain1,CalculateGain2,CalculateGain3 : boolean; ResetZone1,ResetZone2,ResetZone3 : boolean; PreviousTargetTemp : real; { Private declarations } public { Public declarations } ElapsedTime : real; DeltaT : real; Overshoot : real; end; var SetPointFRM: TSetPointFRM; CurrentSetPoint : real; PreviousTemp,CurrentTemp: Real; {High Temp Furnace Control} implementation uses PressureControl; {$R *.DFM} {*************WriteCFGData**************************} procedure TSetPointFRM.WriteCFGData(CFGName: String); var FN : textFile; begin {$I-} AssignFile(FN,CFGFileName); Append(FN); Writeln(FN,'SET Point Form CONTROL DATA'); Writeln(FN,zone1Ki,zone2Ki,zone3Ki,zone1Kp,zone2Kp,zone3Kp); Writeln(FN, Overshoot); If Overshoot_CkB.Checked then Writeln(FN, 'ON') else Writeln(FN, 'OFF'); CloseFile(FN); {$I+} end; {*************WriteCFGData**************************} procedure TSetPointFRM.ReadCFGData(CFGName: String); var FN : textFile; TmpStr : String; TS,i : integer; begin AssignFile(FN,CFGFileName); Reset(FN); Readln(FN,tmpstr); Readln(FN,TS); for i:=1 to TS do begin Readln(FN,tmpstr); Readln(FN,tmpstr); Readln(FN,tmpstr); Readln(FN,tmpstr); end; Readln(FN,tmpstr);

152
Readln(FN,zone1Ki,zone2Ki,zone3Ki,zone1Kp,zone2Kp,zone3Kp); Readln(FN, Overshoot); Overshoot_CB.Text := FloatToStr(Overshoot); Readln(FN, TmpStr); If TmpStr='ON' then Overshoot_CkB.Checked:=true else Overshoot_CkB.Checked:=false; CloseFile(FN); end; {*************Heating Element Control-ON/OFF**************************} procedure TSetPointFRM.TurnElementOn(ElementNo: integer); //Edited - Brian Baillargeon 05/28/2002 var Out1,Out2,Out3,ALL : integer ; begin Out1 := Heat_Ch1; Out2 := Heat_Ch2; //zone3 := Heat_Ch4; {Channel three on DaqBook does not work} //ALL := Heat_ALL; Case ElementNo of 1 : TempControl.TurnHeatOn(Out1); 2 : TempControl.TurnHeatOn(Out2); {3 : TempControl.TurnHeatOn(zone3); 4 : TempControl.TurnHeatOn(ALL);} end; {Case} end; procedure TSetPointFRM.TurnElementOff(ElementNo: integer); //Editted - Brian Baillargeon 05/28/2002 var Out1,Out2,Out3,ALL : integer ; begin Out1 := Heat_Ch1; Out2 := Heat_Ch2; //zone3 := Heat_Ch4; {Channel three on DaqBook does not work} //ALL := Heat_ALL; Case ElementNo of 1 : TempControl.TurnHeatOff(Out1); 2 : TempControl.TurnHeatOff(Out2); {3 : TempControl.TurnHeatOff(zone3); 4 : TempControl.TurnHeatOFF(ALL);} end; {Case} end; {*****************Reads Input Data From SetPointDataForm***************} procedure TSetPointFRM.TemperatureControlData; Var i : integer; PreviousTime : real; begin for i:=1 to TotalTempSteps do begin PreviousTime := SetpointDataFRM.ControlData[i-1].Time; Control_Temp[i].Temperature:= SetpointDataFRM.ControlData[i].Temperature; Control_Temp[i].Time:= SetpointDataFRM.ControlData[i].Time; Control_Temp[i].CommandType:=SetpointDataFRM.ControlData[i].CommandType;

153
end end; {******************Set Point Temperature Control**********************} procedure TSetPointFRM.CalculateSetPoint(Time: Real); //Edited - Brian Baillargeon 05/28/2002 var Interval1 : cardinal; STemp, ETemp : real; STime,ETime : real; TSlope : real; DelT : real; i,CIncr : integer; begin StepNo := 0; TemperatureControlData; for i:= 2 to TotalTempSteps do begin if (Time >= Control_Temp[i-1].Time) and (Time < Control_Temp[i].Time) then begin StepNo:=i-1; break; end; end; Command := Control_Temp[StepNo].CommandType; STime := Control_Temp[StepNo].Time; ETime := Control_Temp[StepNo + 1].Time; DelT := ETime-STime; case Command of CM_HOLD : begin Command_ED.text := 'HOLD'; STemp:= Control_Temp[StepNo].Temperature; ETemp:= Control_Temp[StepNo].Temperature; end; CM_RAMP : begin Command_ED.text := 'RAMP'; STemp:= Control_Temp[StepNo].Temperature; ETemp:= Control_Temp[StepNo + 1].Temperature; end; end; {case} TSlope := (ETemp-STemp)/DelT; CurrentSetPoint := STemp + TSlope*(Time-STime); if (Time<1e-10) then CurrentSetPoint := Control_Temp[1].Temperature; if (Time>Control_Temp[TotalTempSteps].Time) then CurrentSetPoint := 0; end; {***************Time Counter For Hold Command*************************} procedure TsetPointFRM.Hold(TimeIncr: integer); begin If HoldTemp then

154
begin ElapsedTime := Deltat*TimeIncr; if ElapsedTime >= HoldTime then begin HoldTemp := false; Inc(StepNo); end; end; end; {****************Timer For Set Point Temperature Control***************} procedure TSetPointFRM.ControlTimerTimer(Sender: TObject); var StepTemp,StepTime : Real; begin DeltaT := ControlTimer.Interval/1000/60; If StartSetpoint then begin TemperatureControlData; PressureControl.CheckPressure; CurrentTemp := AveAirTemp; ETime := (Deltat*TimeInc); CalculateSetPoint(ETime); AdjustTemperature; Time_ED.Text := Floattostr(time); Incr_ED.text := Inttostr(StepNo); inc(TimeInc); { if Holdtemp = true then Inc(TimeStepNo) } end end; {********************Check Furnace Temperature*********************} Procedure TSetPointFRM.AdjustTemperature; //Edited - Brian Baillargeon 05/28/2002 var zone1Temp,zone2Temp,zone3Temp,AveTemp,HTOverShoot : real; begin Timer2.Enabled := true; {zone2Temp := Temperature[3]; zone3Temp := Temperature[5]; AveTemp := (zone1Temp+zone2Temp+zone3Temp)/3 ;} HTOverShoot := 5; If CurrentTemp >= HighTempLimit Then begin TurnElementOff(1); TurnElementOff(2); Go := false ; StartSetpoint := false ;

155
showmessage('TooHot'); end else If (CurrentTemp < CurrentSetPoint) and not Zone1 then begin if command = CM_RAMP then begin TurnElementON(1); TurnElementON(2); Zone1:= true; end else if command = CM_Hold then begin if Which_Heater = 0 then begin TurnElementOn(1); //Test - Baillargeon 06/20/2002 TurnElementOn(2); //HeatChamberMainFRM.HeatMsgEd.Text := 'Heater #1 On'; Zone1 := true; end else if Which_Heater = 1 then begin TurnElementON(2); //Test - Baillargeon 06/20/2002 TurnElementON(1); //HeatChamberMainFRM.HeatMsgEd.Text := 'Heater #2 On'; Zone1 := true; end; end; end {If (zone2Temp < Temp) and not Zone2 then begin TurnElementON(2); Zone2:= true; end; If (zone3Temp < Temp) and not Zone3 then begin TurnElementON(3); Zone3:= true; end} else {Prevents excessive overshoot in the event that the PI control is incorrectly tuned} If Overshoot_CkB.Checked and (CurrentTemp >= CurrentSetPoint + Overshoot) then begin TurnElementOFF(1); TurnElementOFF(2); zone1DutyCycleBar.Position := 0; end; end; {*************************PI Control Parameters********************} procedure TSetPointFRM.PIControlParameters; begin zone1Kp:= StrToFloat(zone1KpED.text); zone2Kp:= StrToFloat(zone2KpED.text);

156
zone3Kp:= StrToFloat(zone3KpED.text); zone1Ki:= StrToFloat(zone1KiED.text); zone2Ki:= StrToFloat(zone2KiED.text); zone3Ki:= StrToFloat(zone3KiED.text); end; {************************* PI Algorithm *****************************} Procedure TSetPointFRM.PIControl; var zone1Temp,zone2Temp,zone3Temp,zone1Error,zone2Error,zone3Error: real; zone1Pterm,zone2Pterm,zone3Pterm,zone1sumError,Zone2sumError: real; Zone3sumError,zone1Iterm,zone2Iterm,zone3Iterm: real; TempCommand: real; begin SetPointFRM.PIControlParameters; SetPoint_ED.Text := FloatToStr(CurrentSetPoint); zone1Temp := AveAirTemp; {zone2Temp := Temperature[3]; zone3Temp := Temperature[5];} TempCommand:=CurrentSetPoint; {Zone 1} zone1Error := TempCommand-zone1Temp; zone1SumError := PreviousError1+zone1Error; If ResetZone1 then PreviousError1:=0 else PreviousError1:= zone1SumError; zone1Pterm :=zone1Kp*Zone1Error; zone1Iterm :=zone1Ki*zone1SumError; ResetZone1 :=false; If zone1Iterm < 0 then {Bounds the Integral term in the event of integral wind up} begin zone1Iterm:=0; ResetZone1:= true; end; If zone1Iterm > 1 then begin zone1Iterm:=1; ResetZone1:= true; end; Edit1.Text:= FloatToStr(zone1Iterm); If CalculateGain1 then zone1PercentGain:=zone1Pterm + zone1Iterm ; end; {************************** Gain Control**************************} {Zone1} procedure TSetPointFRM.Zone1Gain(GainTimeIncr1: integer); var Z1ElapsedTime: real; begin CalculateGain1 := false; If Zone1 = true then begin zone1DutyCycleBar.Position := Round(zone1PercentGain*100); Z1ElapsedTime:= GainTimeIncr1*IntervalTime; end;

157
If Z1ElapsedTime >= Period*zone1PercentGain then begin TurnElementOff(1); TurnElementOff(2); zone1DutyCycleBar.Position := 0; end; If Z1ElapsedTime >= Period then begin CalculateGain1:= true; Zone1:= false; Gain1StepNo:= 0; end end; {Zone 2} procedure TSetPointFRM.Zone2Gain(GainTimeIncr2: integer); var Z2ElapsedTime: real; begin CalculateGain2 := false; If Zone2 = true then zone2DutyCycleBar.Position := Round(zone2PercentGain*100); Z2ElapsedTime:= GainTimeIncr2*IntervalTime; If Z2ElapsedTime >= Period*zone2PercentGain then begin TurnElementOff(2); zone2DutyCycleBar.Position := 0; end; If Z2ElapsedTime >= Period then begin CalculateGain2:= true; Zone2:= false; Gain2StepNo:= 0; end end; {Zone3} procedure TSetPointFRM.Zone3Gain(GainTimeIncr3: integer); var Z3ElapsedTime : real; begin CalculateGain3 := false; If Zone3= true then zone3DutyCycleBar.Position := Round(zone3PercentGain*100); Z3ElapsedTime:= GainTimeIncr3*IntervalTime; If Z3ElapsedTime >= Period*zone3PercentGain then begin TurnElementOff(3); zone3DutyCycleBar.Position := 0; end; If Z3ElapsedTime >= Period then begin CalculateGain3:= true; Zone3:= false; Gain3StepNo:= 0; end end; {***************************Gain Timer******************************}

158
procedure TSetPointFRM.Timer2Timer(Sender: TObject); begin SetPointFRM.PIControl; If Zone1 = true then begin Inc(Gain1StepNo); SetPointFRM.Zone1Gain(Gain1StepNo); end; If Zone2 = true then begin Inc(Gain2StepNo); SetPointFRM.Zone2Gain(Gain2StepNo); end; If Zone3 = true then begin Inc(Gain3StepNo); SetPointFRM.Zone3Gain(Gain3StepNo); end; end; {********************************************************************} procedure TSetPointFRM.FormCreate(Sender: TObject); var Interval2: cardinal; begin PIControlValid := false; ControlTimer.Enabled := false; Timer2.Enabled := false; StartSetpoint := false; Go := false; HoldTemp := false; Zone1 := false; Zone2 := false; Zone3 := false; CalculateGain1:= true; CalculateGain2:= true; CalculateGain3:= true; ResetZone1 := false; ResetZone2 := false; ResetZone3 := false; StepNo :=1; TimeStepNo :=0; Gain1StepNo :=0; PreviousError1:=0; PreviousError2:=0; PreviousError3:=0; PreviousTargetTemp:=0; Interval2 := round(IntervalTime*1000); {Gain Timer Interval} Timer2.Interval := Interval2; ETime := 0.0; TimeInc := 0; Overshoot_CB.ItemIndex :=1; end; procedure TSetPointFRM.Button1Click(Sender: TObject); begin HeatChamberMainFrm.show;

159
PIControlValid := true; TemperatureControlData; end; procedure TSetPointFRM.Overshoot_CBChange(Sender: TObject); var code : integer; begin val(Overshoot_CB.text,Overshoot,Code); Overshoot_CB.text := FloatToStr(Overshoot); end; end.

160
Appendix F: Technical Drawings for Mold Pieces
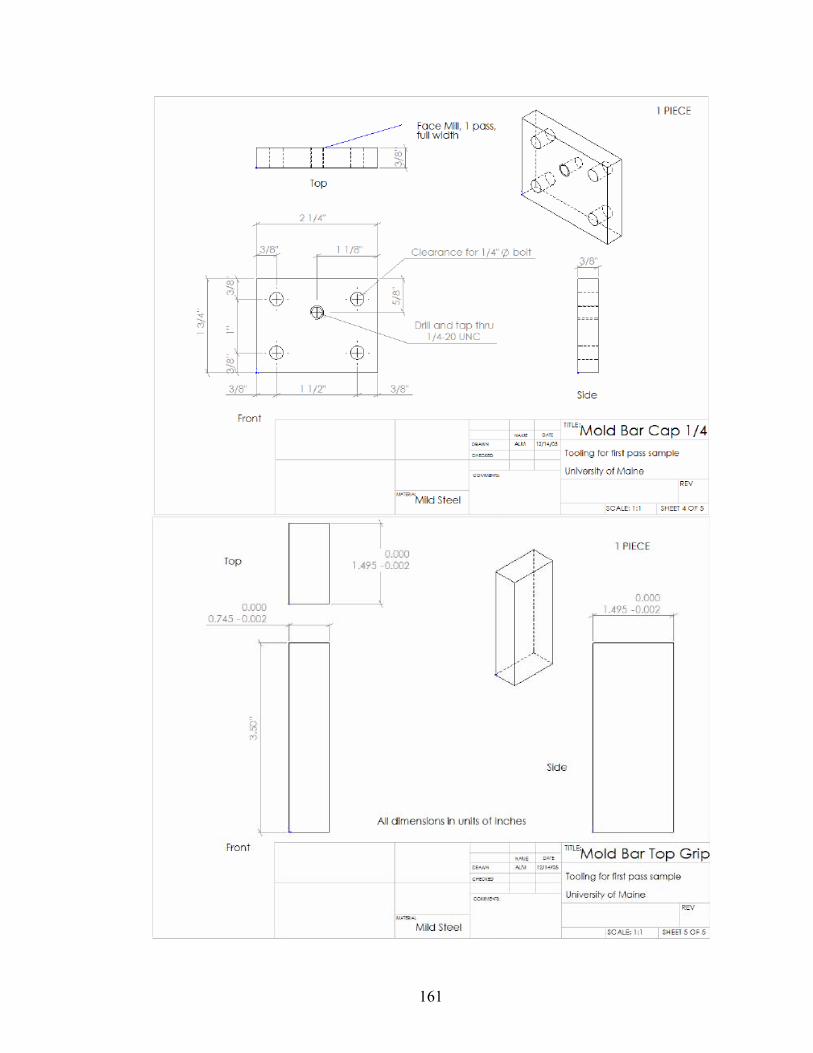
161

162
Appendix G: Technical Drawings for Dumbbell Shape Specimens

163
Appendix H: Compression Test Results Figure H.1: RB-SiC-RT-01
0
20
40
60
80
100
120
140
0.000 0.005 0.010 0.015 0.020 0.025 0.030Strain (in/in)
Str
ess
(ksi
)
Extensometer
MTS disp
Figure H.2: RB-SiC-RT-02
0
20
40
60
80
100
120
140
0.000 0.005 0.010 0.015 0.020 0.025 0.030Strain (in/in)
Stre
ss (k
si)
ExtensometerMTS disp

164
Figure H.3: RB-SiC-RT-03
0
20
40
60
80
100
0.000 0.005 0.010 0.015 0.020 0.025 0.030
Strain (in/in)
Stre
ss (k
si)
ExtensometerMTS disp
Figure H.4: RB-SiC-RT-04
0
20
40
60
80
100
120
140
0.000 0.005 0.010 0.015 0.020 0.025 0.030Strain (in/in)
Stre
ss (k
si)
ExtensometerMTS disp

165
Figure H.5: RB-SiC-RT-05
0
20
40
60
80
100
120
140
0.000 0.005 0.010 0.015 0.020 0.025 0.030
Strain (in/in)
Stre
ss (k
si)
ExtensometerMTS disp
Figure H.6: RB-SiC-RT-06
0
20
40
60
80
100
120
140
0.000 0.005 0.010 0.015 0.020 0.025 0.030Strain (in/in)
Stre
ss (k
si)
ExtensometerMTS disp
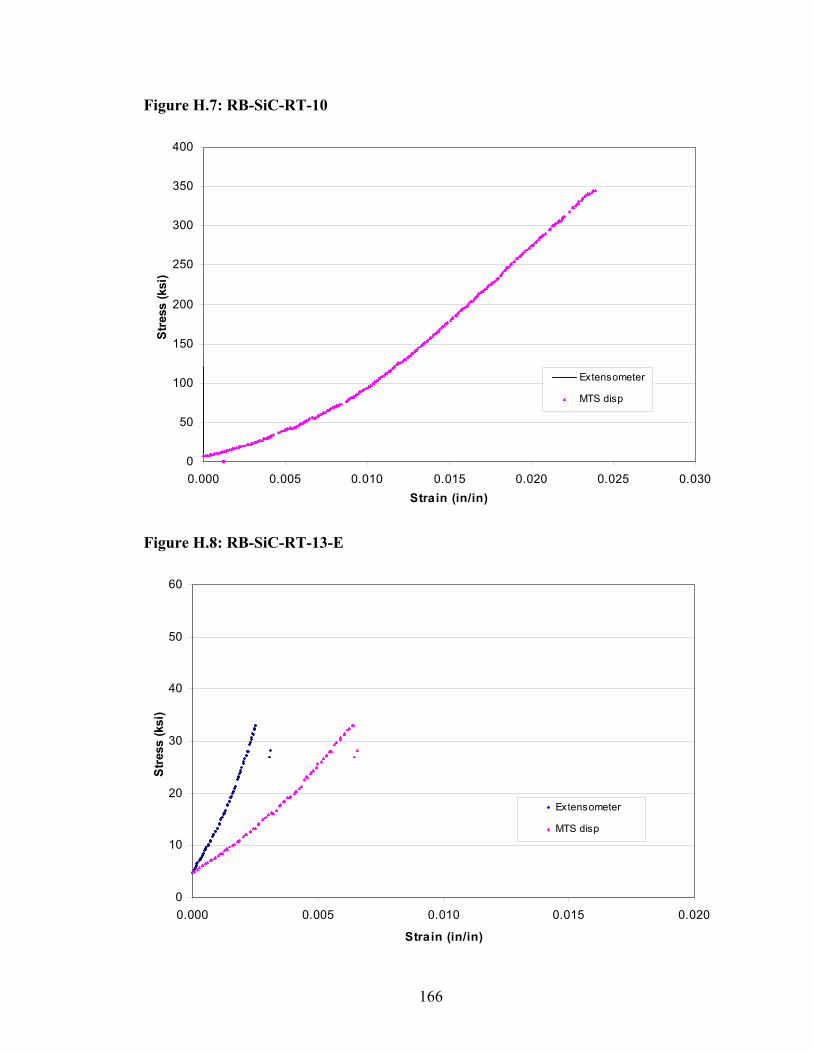
166
Figure H.7: RB-SiC-RT-10
0
50
100
150
200
250
300
350
400
0.000 0.005 0.010 0.015 0.020 0.025 0.030Strain (in/in)
Stre
ss (k
si)
Extensometer
MTS disp
Figure H.8: RB-SiC-RT-13-E
0
10
20
30
40
50
60
0.000 0.005 0.010 0.015 0.020
Strain (in/in)
Str
ess
(ksi
)
Extensometer
MTS disp
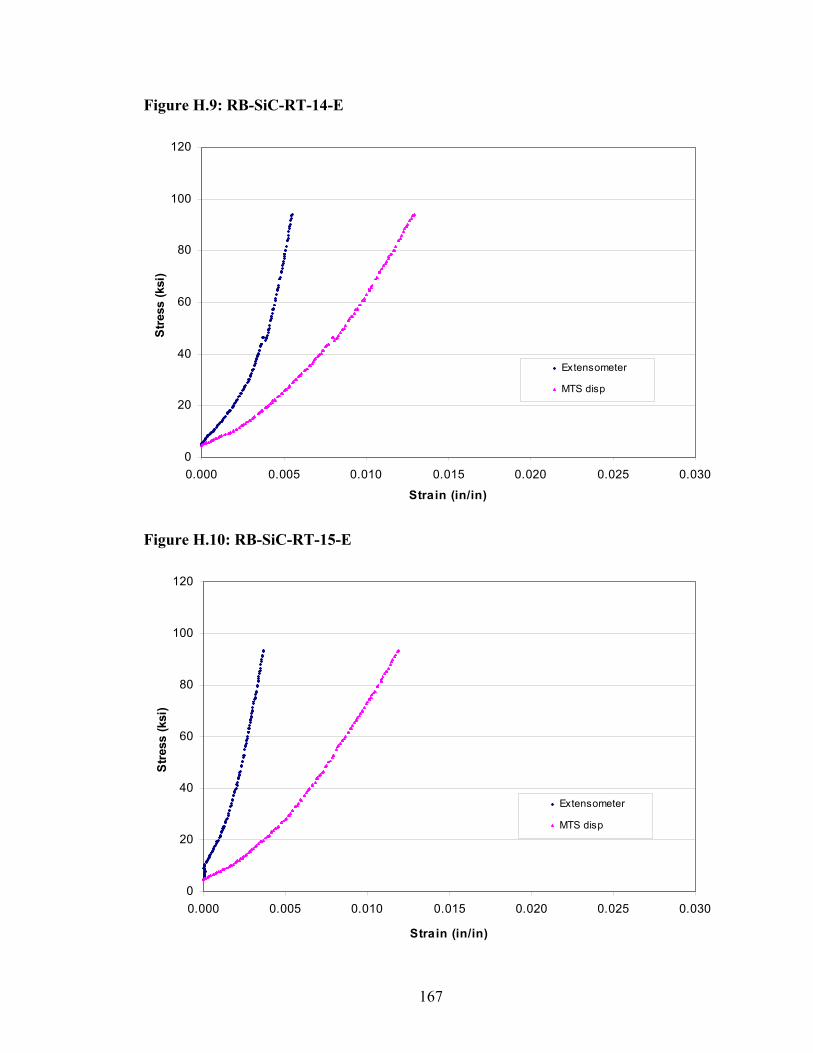
167
Figure H.9: RB-SiC-RT-14-E
0
20
40
60
80
100
120
0.000 0.005 0.010 0.015 0.020 0.025 0.030
Strain (in/in)
Stre
ss (k
si)
Extensometer
MTS disp
Figure H.10: RB-SiC-RT-15-E
0
20
40
60
80
100
120
0.000 0.005 0.010 0.015 0.020 0.025 0.030
Strain (in/in)
Str
ess
(ksi
)
Extensometer
MTS disp

168
Figure H.11: RB-SiC-RT-16-E
0
20
40
60
80
100
120
0.000 0.005 0.010 0.015 0.020 0.025 0.030Strain (in/in)
Str
ess
(ksi
)
Extensometer
MTS disp
Figure H.12: RB-SiC-HT-01
0
20
40
60
80
100
0.000 0.005 0.010 0.015 0.020 0.025 0.030Strain (in/in)
Stre
ss (k
si)
ExtensometerMTS disp
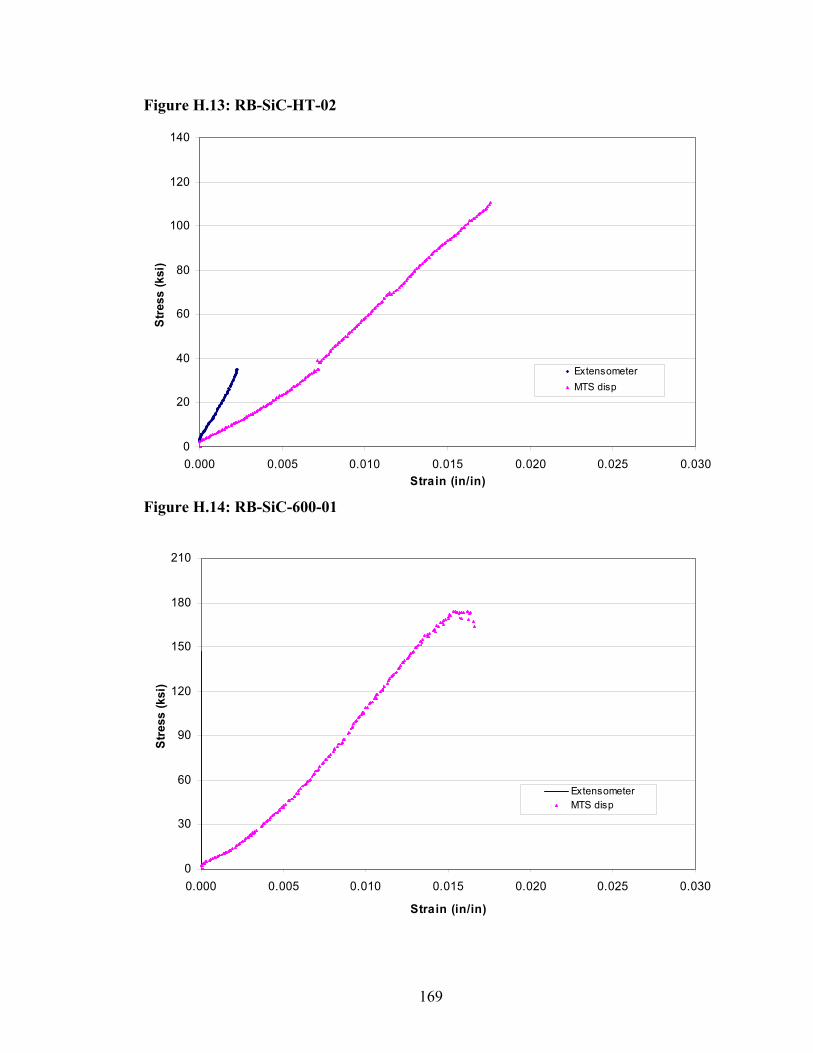
169
Figure H.13: RB-SiC-HT-02
0
20
40
60
80
100
120
140
0.000 0.005 0.010 0.015 0.020 0.025 0.030Strain (in/in)
Stre
ss (k
si)
ExtensometerMTS disp
Figure H.14: RB-SiC-600-01
0
30
60
90
120
150
180
210
0.000 0.005 0.010 0.015 0.020 0.025 0.030
Strain (in/in)
Stre
ss (k
si)
ExtensometerMTS disp

170
Figure H.15: RB-SiC-600-02
0
30
60
90
120
150
180
210
0.000 0.005 0.010 0.015 0.020 0.025 0.030
Strain (in/in)
Stre
ss (k
si)
ExtensometerMTS disp
Figure H.16: RB-SiC-600-03
0
30
60
90
120
150
180
210
0.000 0.005 0.010 0.015 0.020 0.025 0.030
Strain (in/in)
Stre
ss (k
si)
ExtensometerMTS disp

171
Figure H.17: RB-SiC-600-04
0
30
60
90
120
150
180
210
0.000 0.005 0.010 0.015 0.020 0.025 0.030Strain (in/in)
Stre
ss (k
si)
ExtensometerMTS disp
Figure H.18: RB-SiC-600-05
0
30
60
90
120
150
180
210
0.000 0.005 0.010 0.015 0.020 0.025 0.030
Strain (in/in)
Stre
ss (k
si)
ExtensometerMTS disp

172
Figure H.19: RB-SiC-600-06-E
0
5
10
15
20
25
30
35
40
0.000 0.005 0.010 0.015 0.020
Strain (in/in)
Stre
ss (k
si)
Extensometer
MTS disp
Figure H.20: RB-SiC-600-07-E
0
20
40
60
80
100
120
0.000 0.005 0.010 0.015 0.020 0.025 0.030
Strain (in/in)
Str
ess
(ksi
)
ExtensometerMTS disp
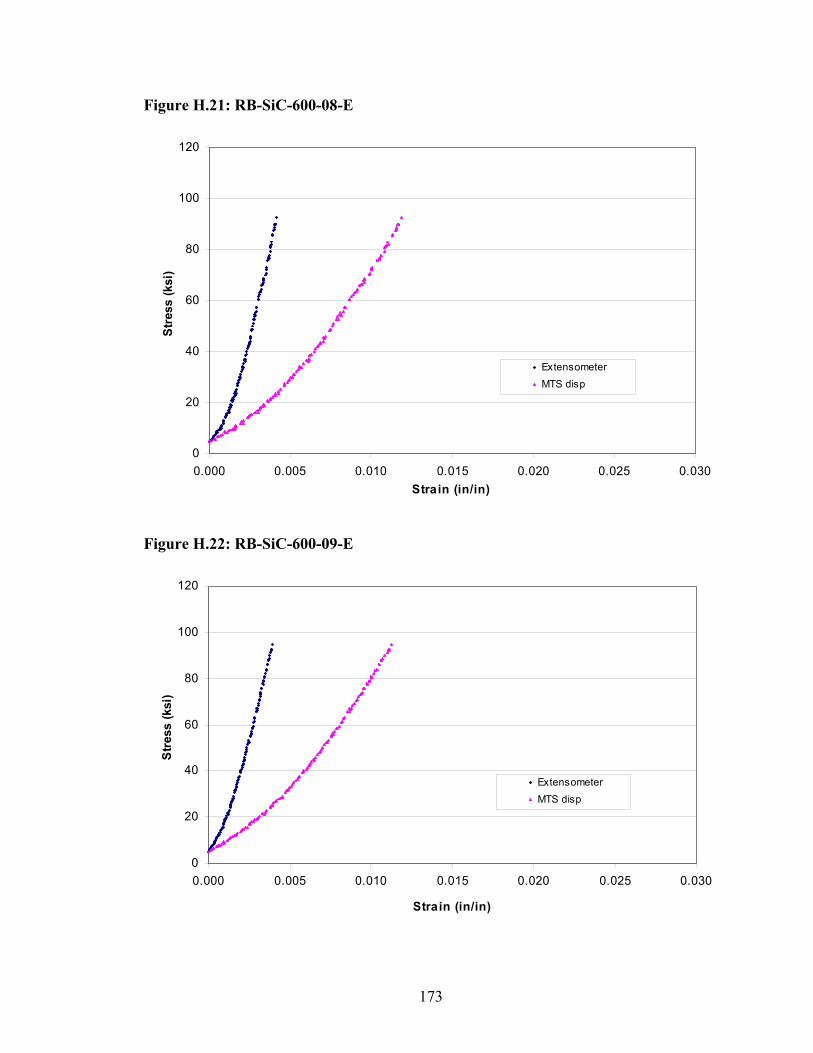
173
Figure H.21: RB-SiC-600-08-E
0
20
40
60
80
100
120
0.000 0.005 0.010 0.015 0.020 0.025 0.030Strain (in/in)
Stre
ss (k
si)
ExtensometerMTS disp
Figure H.22: RB-SiC-600-09-E
0
20
40
60
80
100
120
0.000 0.005 0.010 0.015 0.020 0.025 0.030
Strain (in/in)
Str
ess
(ksi
)
ExtensometerMTS disp

174
Figure H.23: RB-SiC-800-01
0
30
60
90
120
150
180
210
0.000 0.005 0.010 0.015 0.020 0.025 0.030
Strain (in/in)
Stre
ss (k
si)
ExtensometerMTS disp
Figure H.24: RB-SiC-800-04
0
30
60
90
120
150
180
210
0.000 0.005 0.010 0.015 0.020 0.025 0.030Strain (in/in)
Str
ess
(ksi
)
ExtensometerMTS disp

175
Figure H.25: RB-SiC-800-05
0
30
60
90
120
150
180
210
0.000 0.005 0.010 0.015 0.020 0.025 0.030
Strain (in/in)
Str
ess
(ksi
)
ExtensometerMTS disp
Figure H.26: RB-SiC-800-06-E
0
20
40
60
80
100
120
0.000 0.005 0.010 0.015 0.020 0.025 0.030
Strain (in/in)
Stre
ss (k
si)
Extensometer
MTS disp
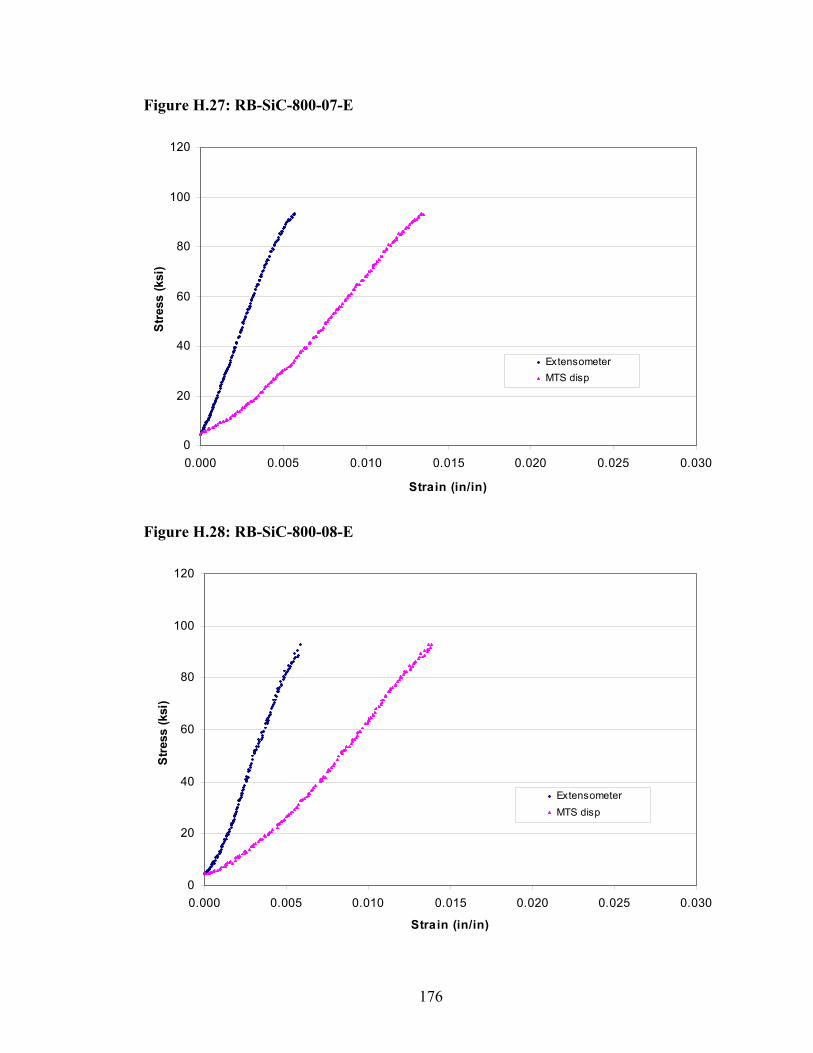
176
Figure H.27: RB-SiC-800-07-E
0
20
40
60
80
100
120
0.000 0.005 0.010 0.015 0.020 0.025 0.030
Strain (in/in)
Stre
ss (k
si)
ExtensometerMTS disp
Figure H.28: RB-SiC-800-08-E
0
20
40
60
80
100
120
0.000 0.005 0.010 0.015 0.020 0.025 0.030
Strain (in/in)
Stre
ss (k
si)
ExtensometerMTS disp
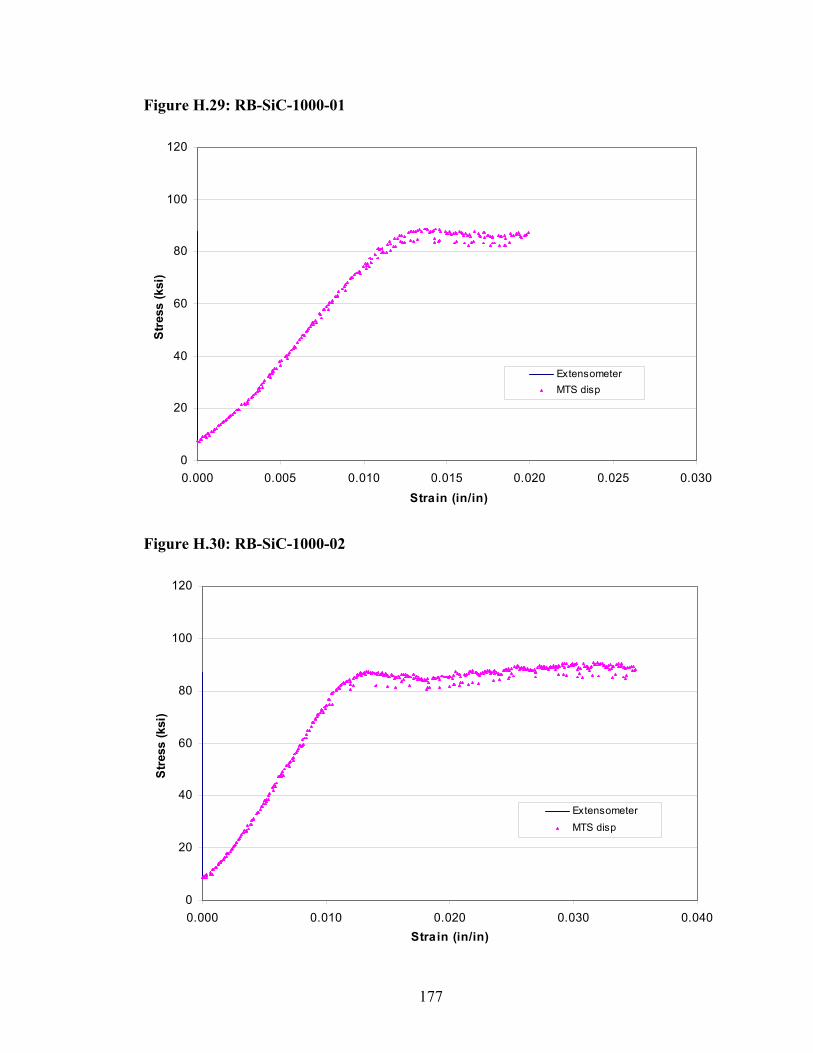
177
Figure H.29: RB-SiC-1000-01
0
20
40
60
80
100
120
0.000 0.005 0.010 0.015 0.020 0.025 0.030Strain (in/in)
Stre
ss (k
si)
ExtensometerMTS disp
Figure H.30: RB-SiC-1000-02
0
20
40
60
80
100
120
0.000 0.010 0.020 0.030 0.040Strain (in/in)
Str
ess
(ksi
)
ExtensometerMTS disp

178
Figure H.31: RB-SiC-1000-03
0
20
40
60
80
100
120
0.000 0.005 0.010 0.015 0.020 0.025 0.030Strain (in/in)
Stre
ss (k
si)
ExtensometerMTS disp
Figure H.32: RB-SiC-1000-04-E
0
20
40
60
80
0.000 0.005 0.010 0.015 0.020 0.025 0.030
Strain (in/in)
Stre
ss (k
si)
ExtensometerMTS disp

179
Figure H.33: RB-SiC-1000-05-E
0
20
40
60
80
0.000 0.005 0.010 0.015 0.020 0.025 0.030
Strain (in/in)
Str
ess
(ksi
)
Extensometer
MTS disp
Figure H.34: RB-SiC-1000-06-E
0
20
40
60
80
0.000 0.005 0.010 0.015 0.020 0.025 0.030
Strain (in/in)
Stre
ss (k
si)
ExtensometerMTS disp

180
Figure H.35: AHPCS-RT-I5-01
0
10
20
30
40
50
60
0.0000 0.0025 0.0050 0.0075 0.0100 0.0125 0.0150
Strain (in/in)
Stre
ss (k
si)
ExtensometerMTS disp
Figure H.36: AHPCS-RT-I5-02
0
5
10
15
20
25
30
0.0000 0.0025 0.0050 0.0075 0.0100 0.0125 0.0150
Strain (in/in)
Stre
ss (k
si)
ExtensometerMTS disp
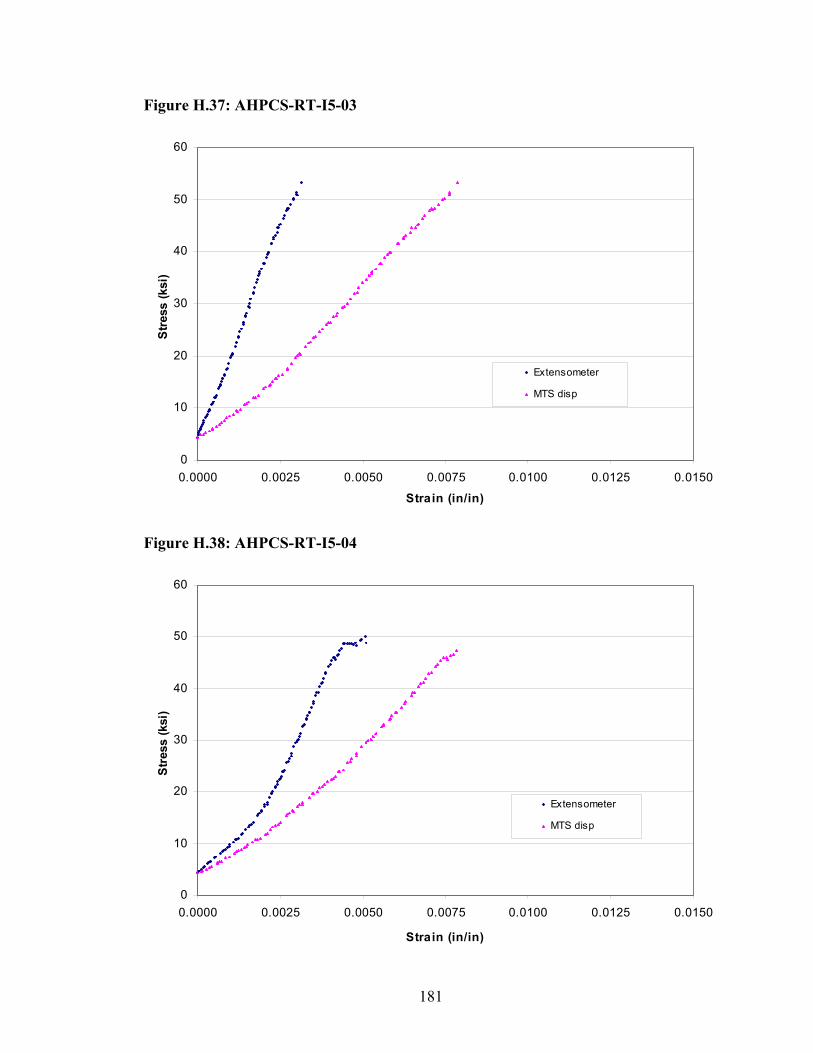
181
Figure H.37: AHPCS-RT-I5-03
0
10
20
30
40
50
60
0.0000 0.0025 0.0050 0.0075 0.0100 0.0125 0.0150
Strain (in/in)
Stre
ss (k
si)
Extensometer
MTS disp
Figure H.38: AHPCS-RT-I5-04
0
10
20
30
40
50
60
0.0000 0.0025 0.0050 0.0075 0.0100 0.0125 0.0150
Strain (in/in)
Stre
ss (k
si)
Extensometer
MTS disp

182
Figure H.39: AHPCS-RT-I5-05
0
5
10
15
20
25
30
35
40
0.0000 0.0025 0.0050 0.0075 0.0100 0.0125 0.0150
Strain (in/in)
Str
ess
(ksi
)
Extensometer
MTS disp
Figure H.40: AHPCS-RT-I5-06
0
10
20
30
40
50
60
0.0000 0.0025 0.0050 0.0075 0.0100 0.0125 0.0150
Strain (in/in)
Str
ess
(ksi
)
Extensometer
MTS disp

183
Figure H.41: AHPCS-RT-I6-01
0
10
20
30
40
50
60
70
0.0000 0.0025 0.0050 0.0075 0.0100 0.0125 0.0150
Strain (in/in)
Stre
ss (k
si)
Extensometer
MTS disp
Figure H.42: AHPCS-RT-I6-02
0
10
20
30
40
50
60
70
0.0000 0.0025 0.0050 0.0075 0.0100 0.0125 0.0150
Strain (in/in)
Stre
ss (k
si)
Extensometer
MTS disp

184
Figure H.43: AHPCS-RT-I6-03
0
10
20
30
40
50
60
70
80
0.0000 0.0025 0.0050 0.0075 0.0100 0.0125 0.0150Strain (in/in)
Stre
ss (k
si)
Extensometer
MTS disp
Figure H.44: AHPCS-RT-I6-04
0
10
20
30
40
50
60
0.0000 0.0025 0.0050 0.0075 0.0100 0.0125 0.0150
Strain (in/in)
Stre
ss (k
si)
Extensometer
MTS disp

185
Figure H.45: AHPCS-RT-I6-05
0
10
20
30
40
50
60
70
80
0.0000 0.0025 0.0050 0.0075 0.0100 0.0125 0.0150
Strain (in/in)
Stre
ss (k
si)
Extensometer
MTS disp
Figure H.46: AHPCS-RT-I8-01
0
20
40
60
80
100
120
0.000 0.005 0.010 0.015 0.020
Strain (in/in)
Str
ess
(ksi
)
ExtensometerMTS disp

186
Figure H.47: AHPCS-RT-I8-02
0
20
40
60
80
100
120
0.000 0.005 0.010 0.015 0.020
Strain (in/in)
Stre
ss (k
si)
ExtensometerMTS disp
Figure H.48: AHPCS-RT-I8-03
0
20
40
60
80
100
120
0.000 0.005 0.010 0.015 0.020
Strain (in/in)
Stre
ss (k
si)
ExtensometerMTS disp

187
Figure H.49: AHPCS-RT-I9
0
20
40
60
80
100
120
0.000 0.005 0.010 0.015 0.020
Strain (in/in)
Str
ess
(ksi
)
ExtensometerMTS disp
Figure H.50: AHPCS-RT-I22-01
0
20
40
60
80
100
120
0.000 0.005 0.010 0.015 0.020
Strain (in/in)
Str
ess
(ksi
)
ExtensometerMTS disp

188
Figure H.51: AHPCS-RT-I22-02
0
20
40
60
80
100
120
0.000 0.005 0.010 0.015 0.020
Strain (in/in)
Stre
ss (k
si)
ExtensometerMTS disp
Figure H.52: AHPCS-RT-I22-03
0
20
40
60
80
100
120
0.000 0.005 0.010 0.015 0.020
Strain (in/in)
Str
ess
(ksi
)
ExtensometerMTS disp

189
Figure H.53: AHPCS-600-I8
0
20
40
60
80
100
120
0.000 0.005 0.010 0.015 0.020
Strain (in/in)
Stre
ss (k
si)
ExtensometerMTS disp
Figure H.54: AHPCS-600-I9
0
20
40
60
80
100
120
0.000 0.005 0.010 0.015 0.020
Strain (in/in)
Str
ess
(ksi
)
ExtensometerMTS disp

190
Figure H.55: AHPCS-600-I22
0
20
40
60
80
100
120
0.000 0.005 0.010 0.015 0.020
Strain (in/in)
Stre
ss (k
si)
ExtensometerMTS disp
Figure H.56: AHPCS-800-I8
0
20
40
60
80
100
120
0.000 0.005 0.010 0.015 0.020
Strain (in/in)
Stre
ss (k
si)
ExtensometerMTS disp

191
Figure H.57: AHPCS-800-I9
0
20
40
60
80
100
120
0.000 0.005 0.010 0.015 0.020 0.025
Strain (in/in)
Stre
ss (k
si)
ExtensometerMTS disp
Figure H.58: AHPCS-800-I22
0
20
40
60
80
100
120
0.000 0.005 0.010 0.015 0.020 0.025
Strain (in/in)
Str
ess
(ksi
)
ExtensometerMTS disp

192
Figure H.59: AHPCS-1000-I8
0
20
40
60
80
100
0.000 0.005 0.010 0.015 0.020
Strain (in/in)
Stre
ss (k
si)
ExtensometerMTS disp
Figure H.60: AHPCS-1000-I9
0
20
40
60
80
100
0.000 0.005 0.010 0.015 0.020
Strain (in/in)
Stre
ss (k
si)
ExtensometerMTS disp

193
Figure H.61: AHPCS-1000-I22
0
20
40
60
80
100
0.000 0.005 0.010 0.015 0.020
Strain (in/in)
Str
ess
(ksi
)
ExtensometerMTS disp

194
BIOGRAPHY OF THE AUTHOR
Adam McNaughton was born in Bangor, Maine on September 14, 1983. He was
raised in Newport, Maine and graduated from Nokomis Regional High School in 2001.
He attended the University of Maine and graduated in May, 2005 with a Bachelors
Degree in Mechanical Engineering. Adam is a candidate for the Master of Science
Degree in Mechanical Engineering from the University of Maine in August, 2007.
Related Documents