1 High Strain R 33. High Strain Rate and Impact Experiments K. T. Ramesh Experimental techniques for high-strain-rate measurements and for the study of impact- related problems are described. An approach to classifying these experimental techniques is presented, and the state-of-the-art is briefly de- scribed. An in-depth description of the basis for high-strain-rate experiments is presented, with an emphasis on the development of a range of strain rates and a range of stress states. The is- sues associated with testing metals, ceramics and soft materials are reviewed. Next, experi- mental techniques that focus on studying the propagation of waves are considered, including plate impact and shock experiments. Experiments that focus on the development of dynamic fail- ure processes are separately reviewed, including experiments for studying spallation and dynamic fracture. 33.1 High Strain Rate Experiments ................ 2 33.1.1 Split-Hopkinson or Kolsky Bars ...... 3 33.1.2 Extensions and Modifications of Kolsky Bars .............................. 9 33.1.3 The Miniaturized Kolsky Bar ........... 13 33.1.4 High Strain Rate Pressure-Shear Plate Impact ................................ 14 33.2 Wave Propagation Experiments ............. 17 33.2.1 Plate Impact Experiments .............. 17 33.3 Taylor Impact Experiments .................... 21 33.4 Dynamic Failure Experiments ................. 21 33.4.1 Void Growth and Spallation Experiments ........... 22 33.4.2 Shear Band Experiments ............... 23 33.4.3 Expanding Ring Experiments ......... 24 33.4.4 Dynamic Fracture Experiments ....... 25 33.4.5 Charpy Impact Testing ................... 25 33.5 Further Reading ................................... 25 References .................................................. 26 From a mechanics viewpoint, the consequences of an impact are threefold. First, stress waves or shock waves are propagated inside the impacted bodies, and the propagation of these waves must be understood. Sec- ond, large inelastic deformations might be developed, typically at high rates of deformation. Third, the en- tire impacted structure might be excited by the impact, leading to structural dynamics and vibration problems, typically at long times. This chapter explicitly ignores the last of these consequences. Further, if the impact velocity is sufficiently small, all of the stress waves propagated inside the impacted bodies will be elas- tic. The measurement of elastic wave propagation is discussed in other chapters, notably those on ultrason- ics and photoacoustic characterization. Thus, our focus is on the experimental techniques associated with the propagation of nonelastic waves, and with the meas- urement of high-strain-rate behavior. Our emphasis is therefore on the measurement of the phenomena that are developed during the early times after a relatively high velocity impact. It is useful to develop a sense of the range of strain rates developed during typical impact problems (note that the strain rates developed as a result of an im- pact are always functions of time, and therefore we focus here on the peak strain rates developed). Thus during an asteroid impact on the Earth, the peak strain rates that are developed are likely to be of the or- der of 10 8 s −1 (this results from hypervelocity impact, i. e. impact velocities above 5 km/s). For impacts cor- responding to typical velocities from defense-related terminal ballistics (≈ 1–2km/s), the peak strain rates developed are of the order of 10 5 s −1 to 10 6 s −1 . All strain rates below the peak strain rate are likely to be de- veloped during the event at sufficiently long times, and their significance to the problem must be determined on a case-by-case basis. In both the planetary impact and ballistic impact cases, for example, substantial parts of Part D 33

Welcome message from author
This document is posted to help you gain knowledge. Please leave a comment to let me know what you think about it! Share it to your friends and learn new things together.
Transcript
1
High Strain Ra33. High Strain Rate and Impact Experiments
K. T. Ramesh
Experimental techniques for high-strain-ratemeasurements and for the study of impact-related problems are described. An approachto classifying these experimental techniques ispresented, and the state-of-the-art is briefly de-scribed. An in-depth description of the basis forhigh-strain-rate experiments is presented, withan emphasis on the development of a range ofstrain rates and a range of stress states. The is-sues associated with testing metals, ceramicsand soft materials are reviewed. Next, experi-mental techniques that focus on studying thepropagation of waves are considered, includingplate impact and shock experiments. Experimentsthat focus on the development of dynamic fail-ure processes are separately reviewed, includingexperiments for studying spallation and dynamicfracture.
33.1 High Strain Rate Experiments ................ 233.1.1 Split-Hopkinson or Kolsky Bars ...... 333.1.2 Extensions and Modifications
of Kolsky Bars .............................. 933.1.3 The Miniaturized Kolsky Bar........... 1333.1.4 High Strain Rate Pressure-Shear
Plate Impact ................................ 14
33.2 Wave Propagation Experiments ............. 1733.2.1 Plate Impact Experiments.............. 17
33.3 Taylor Impact Experiments .................... 21
33.4 Dynamic Failure Experiments ................. 2133.4.1 Void Growth
and Spallation Experiments ........... 2233.4.2 Shear Band Experiments ............... 2333.4.3 Expanding Ring Experiments ......... 2433.4.4 Dynamic Fracture Experiments ....... 2533.4.5 Charpy Impact Testing................... 25
33.5 Further Reading ................................... 25
References .................................................. 26
From a mechanics viewpoint, the consequences of animpact are threefold. First, stress waves or shock wavesare propagated inside the impacted bodies, and thepropagation of these waves must be understood. Sec-ond, large inelastic deformations might be developed,typically at high rates of deformation. Third, the en-tire impacted structure might be excited by the impact,leading to structural dynamics and vibration problems,typically at long times. This chapter explicitly ignoresthe last of these consequences. Further, if the impactvelocity is sufficiently small, all of the stress wavespropagated inside the impacted bodies will be elas-tic. The measurement of elastic wave propagation isdiscussed in other chapters, notably those on ultrason-ics and photoacoustic characterization. Thus, our focusis on the experimental techniques associated with thepropagation of nonelastic waves, and with the meas-urement of high-strain-rate behavior. Our emphasis istherefore on the measurement of the phenomena that are
developed during the early times after a relatively highvelocity impact.
It is useful to develop a sense of the range of strainrates developed during typical impact problems (notethat the strain rates developed as a result of an im-pact are always functions of time, and therefore wefocus here on the peak strain rates developed). Thusduring an asteroid impact on the Earth, the peak strainrates that are developed are likely to be of the or-der of 108 s−1 (this results from hypervelocity impact,i. e. impact velocities above 5 km/s). For impacts cor-responding to typical velocities from defense-relatedterminal ballistics (≈ 1–2 km/s), the peak strain ratesdeveloped are of the order of 105 s−1 to 106 s−1. Allstrain rates below the peak strain rate are likely to be de-veloped during the event at sufficiently long times, andtheir significance to the problem must be determined ona case-by-case basis. In both the planetary impact andballistic impact cases, for example, substantial parts of
PartD
33
2 Part D Sample Chapter
the deformation occur at lower strain rates (perhaps aslow as 102 s−1). Further, significant parts of the damagethat occur as a result of these events might be a re-sult of the lower strain rate deformations (dependingon the damage growth kinetics). This is because thehigh-strain-rates are typically sustained for much longertimes than the ultra-high-strain-rates, and it takes timefor many damage mechanisms (for example, the nucle-ation and growth of voids) to develop.
Experimental techniques that are colloquially de-fined as impact experiments can have dramaticallydifferent objectives. Since the design of the experi-mental technique is critically influenced by the finalobjective of the experiment, it is important to firstdecide what information one wishes to extract fromthe experiment. Typically, what are commonly calledimpact experiments fall into one of four different cate-gories in order of increasing complexity in terms of thedynamics.
• High-strain-rate experiments, that is, experimentsdesigned to measure the high-strain-rate propertiesof a material.• Wave-propagation experiments, that is, experimentsdesigned to understand the characteristics of wavepropagation within the material or structure; thesemay develop high strain rates as well, but thehigh rate deformations vary in both space andtime.• Dynamic failure experiments, that is, experimentsdesigned to understand the processes of dynamicfailure within a material or structure.• Direct impact experiments, that is, experiments de-signed to understand or discover broad impactphenomena (such as cratering efficiency experi-ments or vehicle crash experiments).
We now examine each of these types of experiments indetail.
33.1 High Strain Rate Experiments
One of the defining features of impacts that occur atvelocities sufficiently large to cause inelastic (and par-ticularly plastic) deformations is that most of thesedeformations occur at high strain-rates. These de-formations may also lead to large strains and hightemperatures. Unfortunately, we do not understand thehigh-strain-rate behavior of many materials (often de-fined as the dependence σf(ε, ε, T ) of the flow stresson the strain, strain rate and temperature), and this isparticularly true at high strains and high temperatures.A number of experimental techniques have thereforebeen developed to measure the properties of materialsat high strain-rates. In this section we focus on thoseexperimental techniques that develop controlled highrates of deformation in the bulk of the specimen, ratherthan those in which high-strain-rates are developed justbehind a propagating wave front.
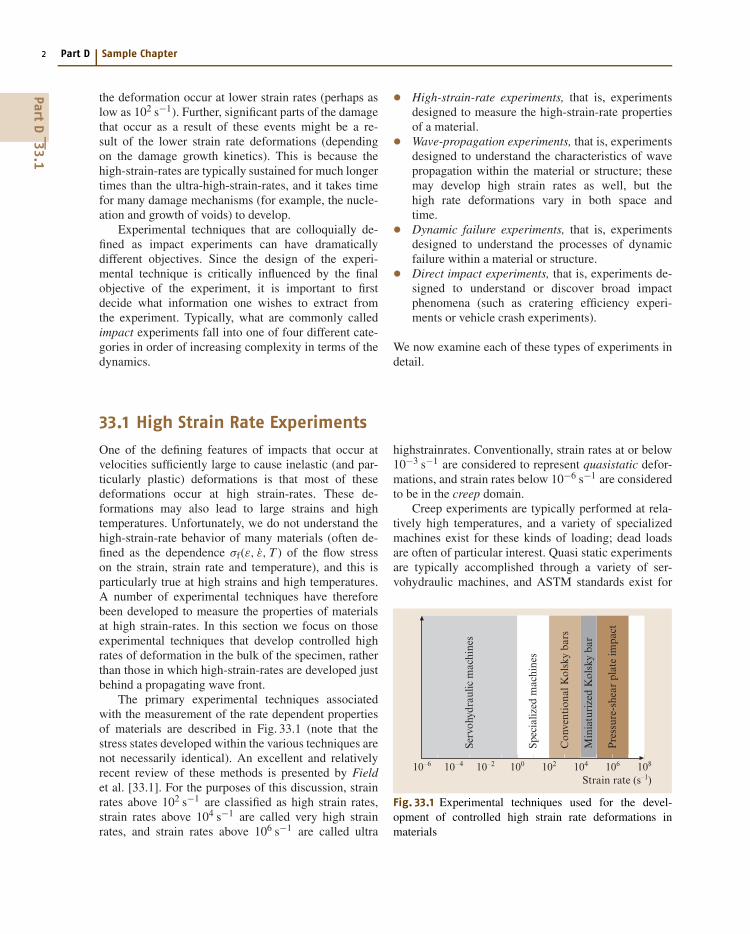
The primary experimental techniques associatedwith the measurement of the rate dependent propertiesof materials are described in Fig. 33.1 (note that thestress states developed within the various techniques arenot necessarily identical). An excellent and relativelyrecent review of these methods is presented by Fieldet al. [33.1]. For the purposes of this discussion, strainrates above 102 s−1 are classified as high strain rates,strain rates above 104 s−1 are called very high strainrates, and strain rates above 106 s−1 are called ultra
highstrainrates. Conventionally, strain rates at or below10−3 s−1 are considered to represent quasistatic defor-mations, and strain rates below 10−6 s−1 are consideredto be in the creep domain.
Creep experiments are typically performed at rela-tively high temperatures, and a variety of specializedmachines exist for these kinds of loading; dead loadsare often of particular interest. Quasi static experimentsare typically accomplished through a variety of ser-vohydraulic machines, and ASTM standards exist for
10–6 10– 4 10–2 100 102 104 106 108
Strain rate (s–1)
Serv
ohyd
raul
ic m
achi
nes
Spec
ializ
ed m
achi
nes
Con
vent
iona
l Kol
sky
bars
Min
iatu
rize
d K
olsk
y ba
r
Pre
ssur
e-sh
ear
plat
e im
pact
Fig. 33.1 Experimental techniques used for the devel-opment of controlled high strain rate deformations inmaterials
PartD
33.1
High Strain Rate and Impact Experiments 33.1 High Strain Rate Experiments 3
most of these experiments. Most servohydraulic ma-chines are unable to develop strain rates larger than100 s−1 repeatably, but some specialized servohydraulicmachines can achieve strain rates of 101 s−1. Finally,the strain rates in the intermediate rate domain (be-tween 100 s−1 and 102 s−1) are extremely difficult tostudy, since this is a domain in which wave-propagationis relevant and cannot be easily accounted for (how-ever, the strain rates in this domain are indeed ofinterest to a number of machining problems). The pri-mary approach to testing in this strain rate range usesdrop towers or dropweight machines [33.2], and greatcare must be exercised in interpreting the data becauseof the coupling between impact-induced wave prop-agation and machine vibrations [33.3–7]. There areexisting ASTM standards for some drop-weight tests,including ASTM E208-95a (2000) for measuring theductility transition temperature of steels, ASTM E436-03 for performing drop-weight tear testing of steels andASTM E680-79 (1999) for measuring the impact sensi-tivity of solid phase hazardous materials.
In this section we focus on experimental techniquesfor the higher strain rates (greater than 102 s−1), includ-ing the high (102 –104 s−1), very high (104 –106 s−1)and ultra-high-strain-rate (> 106 s−1) domains.
33.1.1 Split-Hopkinson or Kolsky Bars
The now-classical experimental technique in the high-strain-rate domain is the Kolsky bar or Split-Hopkinsonpressure bar (SHPB) experiment for determining themechanical properties of various materials (e.g. [33.8–11] in metals, ceramics and polymers respectively) inthe strain rate range of 10+2 –8 × 10+3 s−1. The termsSplit-Hopkinson pressure bar and Kolsky bar are oftenused interchangeably. However, one should note that theterm Split-Hopkinson pressure bar implies the perfor-mance of compression experiments, whereas the termKolsky bar is more general and may include compres-sion, tension, torsion or combinations of all of these.Since the fundamental concept involved in this tech-nique – that of determining the dynamic properties ofmaterials using two long bars as transducers, with thespecimen size much smaller than the pulse length –was developed by Kolsky [33.12], we will use the termKolsky bar in the rest of this chapter.
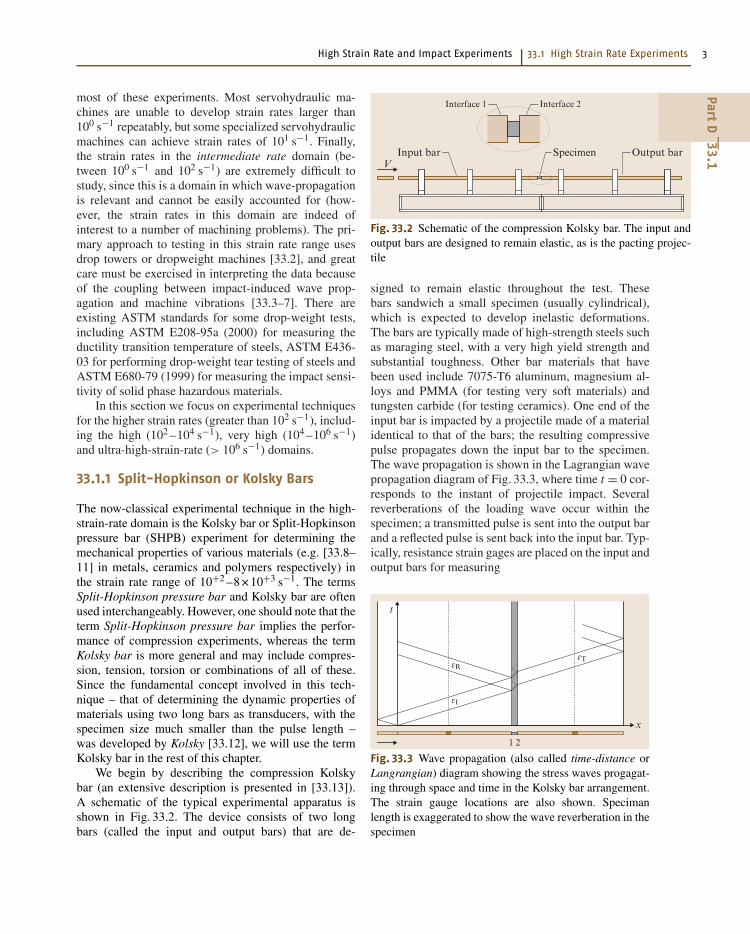
We begin by describing the compression Kolskybar (an extensive description is presented in [33.13]).A schematic of the typical experimental apparatus isshown in Fig. 33.2. The device consists of two longbars (called the input and output bars) that are de-
VSpecimen Output barInput bar
Interface 2Interface 1
Fig. 33.2 Schematic of the compression Kolsky bar. The input andoutput bars are designed to remain elastic, as is the pacting projec-tile
signed to remain elastic throughout the test. Thesebars sandwich a small specimen (usually cylindrical),which is expected to develop inelastic deformations.The bars are typically made of high-strength steels suchas maraging steel, with a very high yield strength andsubstantial toughness. Other bar materials that havebeen used include 7075-T6 aluminum, magnesium al-loys and PMMA (for testing very soft materials) andtungsten carbide (for testing ceramics). One end of theinput bar is impacted by a projectile made of a materialidentical to that of the bars; the resulting compressivepulse propagates down the input bar to the specimen.The wave propagation is shown in the Lagrangian wavepropagation diagram of Fig. 33.3, where time t = 0 cor-responds to the instant of projectile impact. Severalreverberations of the loading wave occur within thespecimen; a transmitted pulse is sent into the output barand a reflected pulse is sent back into the input bar. Typ-ically, resistance strain gages are placed on the input andoutput bars for measuring
t
x
1 2
εRεT
εI
Fig. 33.3 Wave propagation (also called time-distance orLangrangian) diagram showing the stress waves progagat-ing through space and time in the Kolsky bar arrangement.The strain gauge locations are also shown. Specimanlength is exaggerated to show the wave reverberation in thespecimen
PartD
33.1
4 Part D Sample Chapter
1. the incident pulse generated by the impacting pro-jectile,
2. the reflected pulse from the input bar/specimen in-terface and
3. the transmitted pulse through the specimen to theoutput bar.
Note that the strain gauge locations are ideally suchthat the incident and reflected pulses do not overlap, asshown in Fig. 33.3. The strain gage signals are typicallymeasured using high-speed digital oscilloscopes withat least 10-bit accuracy and preferably with differentialinputs to reduce noise.
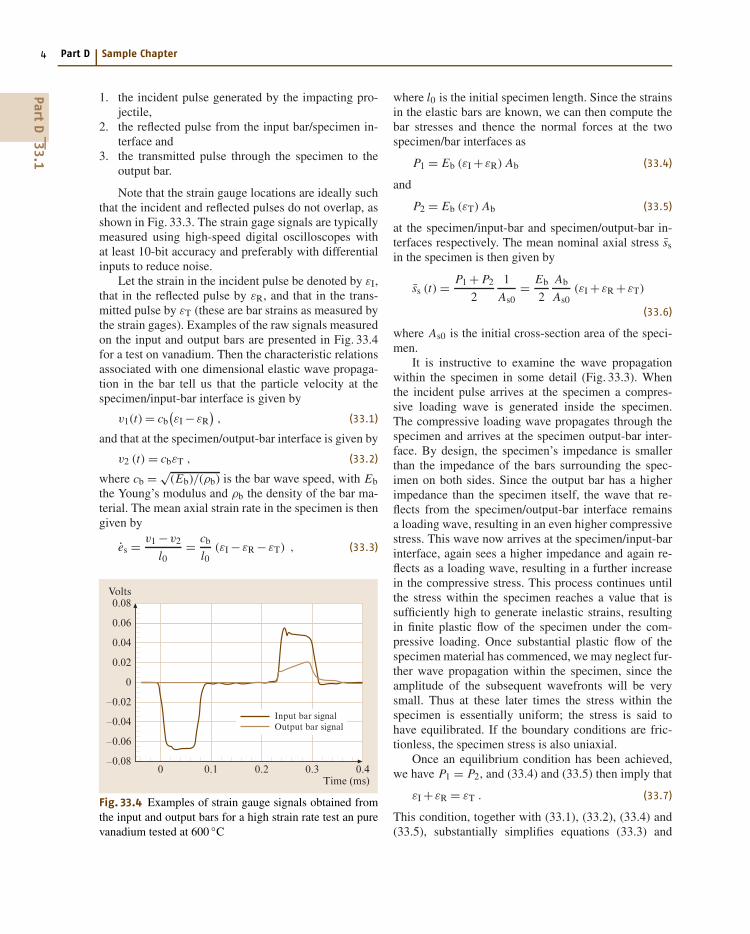
Let the strain in the incident pulse be denoted by εI,that in the reflected pulse by εR, and that in the trans-mitted pulse by εT (these are bar strains as measured bythe strain gages). Examples of the raw signals measuredon the input and output bars are presented in Fig. 33.4for a test on vanadium. Then the characteristic relationsassociated with one dimensional elastic wave propaga-tion in the bar tell us that the particle velocity at thespecimen/input-bar interface is given by
v1(t) = cb(εI − εR
), (33.1)
and that at the specimen/output-bar interface is given by
v2 (t) = cbεT , (33.2)
where cb = √(Eb)/(ρb) is the bar wave speed, with Eb
the Young’s modulus and ρb the density of the bar ma-terial. The mean axial strain rate in the specimen is thengiven by
es = v1 −v2
l0= cb
l0(εI − εR − εT) , (33.3)
0.40.30.2
Input bar signalOutput bar signal
0.10
Volts
Time (ms)
0.08
0.06
0.04
0.02
0
–0.02
–0.04
–0.06
–0.08
Fig. 33.4 Examples of strain gauge signals obtained fromthe input and output bars for a high strain rate test an purevanadium tested at 600 ◦C
where l0 is the initial specimen length. Since the strainsin the elastic bars are known, we can then compute thebar stresses and thence the normal forces at the twospecimen/bar interfaces as
P1 = Eb (εI + εR) Ab (33.4)
and
P2 = Eb (εT) Ab (33.5)
at the specimen/input-bar and specimen/output-bar in-terfaces respectively. The mean nominal axial stress ssin the specimen is then given by
ss (t) = P1 + P2
2
1
As0= Eb
2
Ab
As0(εI + εR + εT)
(33.6)
where As0 is the initial cross-section area of the speci-men.
It is instructive to examine the wave propagationwithin the specimen in some detail (Fig. 33.3). Whenthe incident pulse arrives at the specimen a compres-sive loading wave is generated inside the specimen.The compressive loading wave propagates through thespecimen and arrives at the specimen output-bar inter-face. By design, the specimen’s impedance is smallerthan the impedance of the bars surrounding the spec-imen on both sides. Since the output bar has a higherimpedance than the specimen itself, the wave that re-flects from the specimen/output-bar interface remainsa loading wave, resulting in an even higher compressivestress. This wave now arrives at the specimen/input-barinterface, again sees a higher impedance and again re-flects as a loading wave, resulting in a further increasein the compressive stress. This process continues untilthe stress within the specimen reaches a value that issufficiently high to generate inelastic strains, resultingin finite plastic flow of the specimen under the com-pressive loading. Once substantial plastic flow of thespecimen material has commenced, we may neglect fur-ther wave propagation within the specimen, since theamplitude of the subsequent wavefronts will be verysmall. Thus at these later times the stress within thespecimen is essentially uniform; the stress is said tohave equilibrated. If the boundary conditions are fric-tionless, the specimen stress is also uniaxial.
Once an equilibrium condition has been achieved,we have P1 = P2, and (33.4) and (33.5) then imply that
εI + εR = εT . (33.7)
This condition, together with (33.1), (33.2), (33.4) and(33.5), substantially simplifies equations (33.3) and
PartD
33.1
High Strain Rate and Impact Experiments 33.1 High Strain Rate Experiments 5
(33.6) for the specimen strain rate and specimen stress.That is, by assuming stress equilibrium, uniaxial stressconditions in the specimen and 1-D elastic stress wavepropagation without dispersion in the bars (discussed etseq.), the nominal strain rate es, nominal strain es andnominal stress ss (all in the specimen) can be estimatedusing
es (t) = −2cb
l0εR (t) , (33.8)
es (t) =t∫
0
es (τ) dτ , (33.9)
and
ss (t) = Eb Ab
AsεT (t) , (33.10)
where As and l0 are the initial cross-sectional area andlength of the specimen respectively. Note the negativesign in (33.8). This arises because the strain in the re-flected pulse has the opposite side of the strain in theincident pulse; the latter is compressive and is conven-tionally considered positive in these experiments. Thusthe specimen strain rate expressed by equation (33.8) isa positive strain-rate, i. e., in this convention, a compres-sive strain-rate. The true strain and true strain rate in thespecimen are then given by [33.14]
εs (t) = − ln [1− es (t)] , (33.11)
and
εs (t) = es (t)
1− es (t). (33.12)
0.25
Vanadium (600 °C) at 4500 s–1
0 0.05 0.1 0.15 0.2
True stress (MPa)
True strain
300
250
200
150
100
50
0
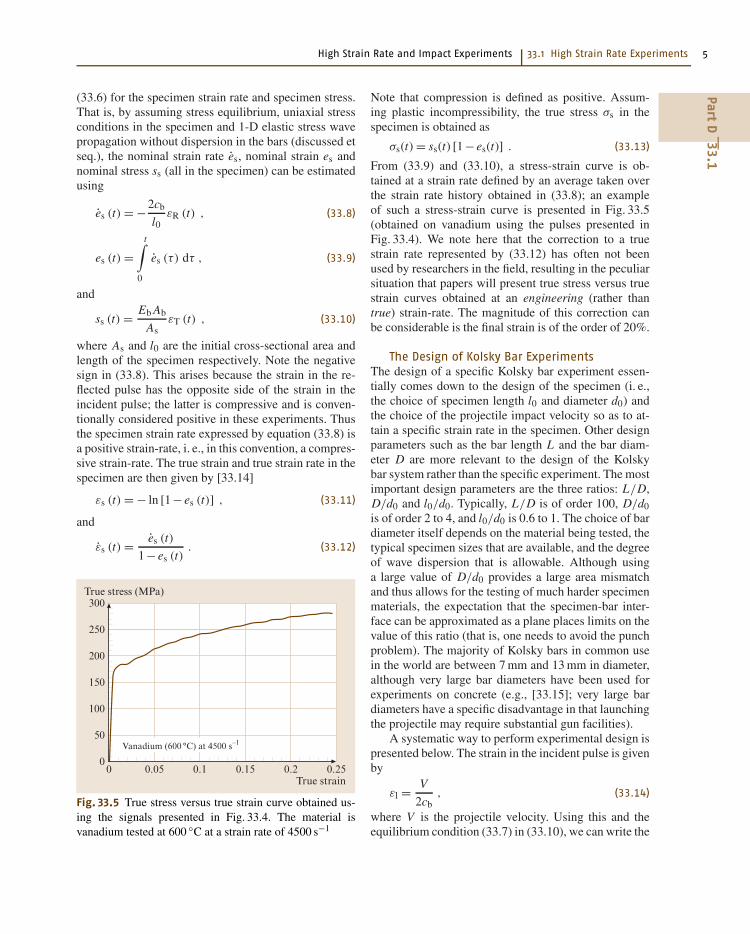
Fig. 33.5 True stress versus true strain curve obtained us-ing the signals presented in Fig. 33.4. The material isvanadium tested at 600 ◦C at a strain rate of 4500 s−1
Note that compression is defined as positive. Assum-ing plastic incompressibility, the true stress σs in thespecimen is obtained as
σs(t) = ss(t) [1− es(t)] . (33.13)
From (33.9) and (33.10), a stress-strain curve is ob-tained at a strain rate defined by an average taken overthe strain rate history obtained in (33.8); an exampleof such a stress-strain curve is presented in Fig. 33.5(obtained on vanadium using the pulses presented inFig. 33.4). We note here that the correction to a truestrain rate represented by (33.12) has often not beenused by researchers in the field, resulting in the peculiarsituation that papers will present true stress versus truestrain curves obtained at an engineering (rather thantrue) strain-rate. The magnitude of this correction canbe considerable is the final strain is of the order of 20%.
The Design of Kolsky Bar ExperimentsThe design of a specific Kolsky bar experiment essen-tially comes down to the design of the specimen (i. e.,the choice of specimen length l0 and diameter d0) andthe choice of the projectile impact velocity so as to at-tain a specific strain rate in the specimen. Other designparameters such as the bar length L and the bar diam-eter D are more relevant to the design of the Kolskybar system rather than the specific experiment. The mostimportant design parameters are the three ratios: L/D,D/d0 and l0/d0. Typically, L/D is of order 100, D/d0is of order 2 to 4, and l0/d0 is 0.6 to 1. The choice of bardiameter itself depends on the material being tested, thetypical specimen sizes that are available, and the degreeof wave dispersion that is allowable. Although usinga large value of D/d0 provides a large area mismatchand thus allows for the testing of much harder specimenmaterials, the expectation that the specimen-bar inter-face can be approximated as a plane places limits on thevalue of this ratio (that is, one needs to avoid the punchproblem). The majority of Kolsky bars in common usein the world are between 7 mm and 13 mm in diameter,although very large bar diameters have been used forexperiments on concrete (e.g., [33.15]; very large bardiameters have a specific disadvantage in that launchingthe projectile may require substantial gun facilities).
A systematic way to perform experimental design ispresented below. The strain in the incident pulse is givenby
εl = V
2cb, (33.14)
where V is the projectile velocity. Using this and theequilibrium condition (33.7) in (33.10), we can write the
PartD
33.1
6 Part D Sample Chapter
specimen stress entirely in terms of the reflected strainand the impact velocity:
ss (t) = Eb Ab
AsεT (t) = Eb Ab
As(εI + εR)
= Eb Ab
As
(V
2cb+ εR
). (33.15)
However, (33.8) allows us to write the strain in the re-flected pulse in terms of the specimen strain rate
εR = − l0
2cbes . (33.16)
Using this in (33.15), we obtain the relation between thespecimen stress and the specimen strain rate that mustbe satisfied during any given test using a specific Kol-sky bar, a specific specimen, and a particular choice ofimpact velocity
ss (t) = Eb
(Ab
As
)(V
2cb
)
− Eb
(Ab
As
)(l0
2cb
)es . (33.17)
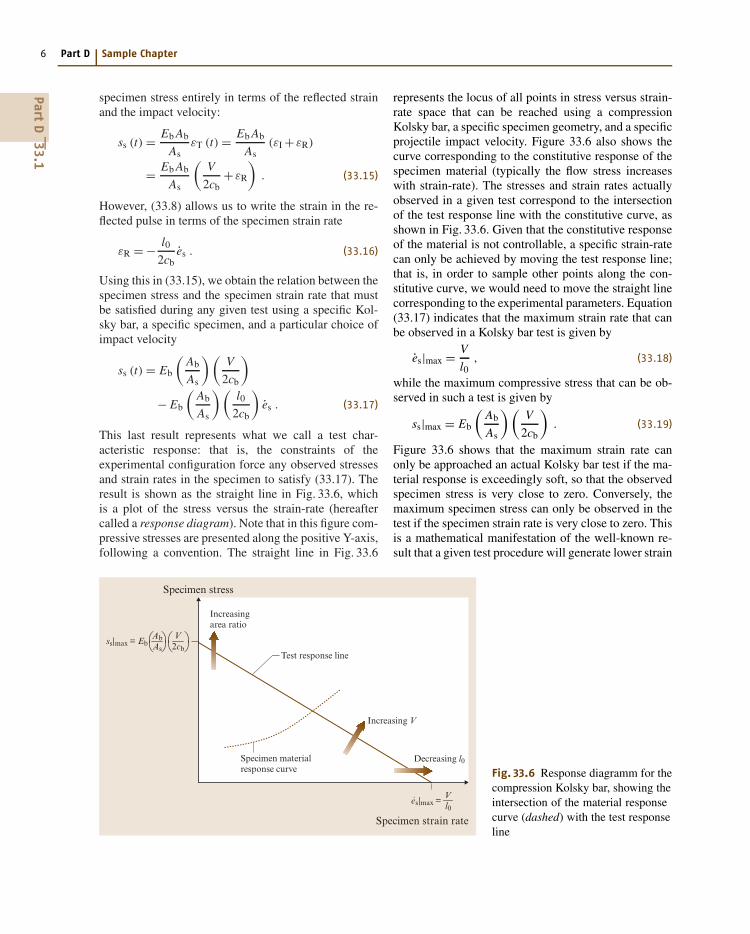
This last result represents what we call a test char-acteristic response: that is, the constraints of theexperimental configuration force any observed stressesand strain rates in the specimen to satisfy (33.17). Theresult is shown as the straight line in Fig. 33.6, whichis a plot of the stress versus the strain-rate (hereaftercalled a response diagram). Note that in this figure com-pressive stresses are presented along the positive Y-axis,following a convention. The straight line in Fig. 33.6
Ve·s|max = l0
Abss|max = Eb⎛⎝⎛⎝As
V⎛⎝
⎛⎝2cb
Specimen stress
Specimen strain rate
Test response line
Increasingarea ratio
Specimen materialresponse curve
Increasing V
Decreasing l0
Fig. 33.6 Response diagramm for thecompression Kolsky bar, showing theintersection of the material responsecurve (dashed) with the test responseline
represents the locus of all points in stress versus strain-rate space that can be reached using a compressionKolsky bar, a specific specimen geometry, and a specificprojectile impact velocity. Figure 33.6 also shows thecurve corresponding to the constitutive response of thespecimen material (typically the flow stress increaseswith strain-rate). The stresses and strain rates actuallyobserved in a given test correspond to the intersectionof the test response line with the constitutive curve, asshown in Fig. 33.6. Given that the constitutive responseof the material is not controllable, a specific strain-ratecan only be achieved by moving the test response line;that is, in order to sample other points along the con-stitutive curve, we would need to move the straight linecorresponding to the experimental parameters. Equation(33.17) indicates that the maximum strain rate that canbe observed in a Kolsky bar test is given by
es|max = V
l0, (33.18)
while the maximum compressive stress that can be ob-served in such a test is given by
ss|max = Eb
(Ab
As
)(V
2cb
). (33.19)
Figure 33.6 shows that the maximum strain rate canonly be approached an actual Kolsky bar test if the ma-terial response is exceedingly soft, so that the observedspecimen stress is very close to zero. Conversely, themaximum specimen stress can only be observed in thetest if the specimen strain rate is very close to zero. Thisis a mathematical manifestation of the well-known re-sult that a given test procedure will generate lower strain
PartD
33.1
High Strain Rate and Impact Experiments 33.1 High Strain Rate Experiments 7
rates on strong materials, while very soft materials canbe deformed at very high strain rates in an identicaltest. As Fig. 33.6 shows, it is apparent that the easi-est way to get a higher maximum strain rate would beto increase the impact velocity or to reduce the spec-imen length. Similarly, an increase in the maximumobservable stress (e.g. when studying very strong mater-ials) can be obtained by increasing the impact velocityor by increasing the area mismatch Ab/As. However,these parameters cannot be varied arbitrarily; restric-tions are usually imposed by the requirements for testvalidity (see, for example, Jia and Ramesh [33.16], out-lined next. Other restrictions arise from such issuesas the yielding of the bar material (which limits im-pact velocity) and the sensitivity of the strain gagesand signal-to-noise ratio of instrumentation (which de-termines the smallest stresses that can be effectivelymeasured).
Requirements for Valid Kolsky Bar ExperimentsSeveral basic requirements must be satisfied in orderto ensure that the measured response in a Kolsky barexperiment is truly the constitutive behavior of the spec-imen material. We discuss each of these requirementsbriefly below.
Equilibrated Stresses. The nature of the Kolsky barexperiment is such that the loading arrives first at oneside of the specimen. Because stress waves propagatein the specimen at finite speeds, equilibration of thestresses takes a non-zero time. Equilibration of thestresses is required to ensure that the stress measuredfrom the output bar side of the specimen representsthe average stress in the specimen. In terms of experi-mental design, equilibration of the stresses will occurif the loading time of interest is long in comparisonwith the specimen characteristic time (τs = csp/l0, thetime for the compressive wave to traverse the lengthof the specimen). Davies and Hunter estimated thatthree reverberations of the loading wave in the spec-imen are required for stress equilibration [33.17] forductile metal specimens. The ability to check that theaxial stress has in fact equilibrated at the time of inter-est is critical for the successful use of any Kolsky bartechnique. The typical approach to checking equilib-rium involves a comparison of the force histories on thetwo sides of the specimen [33.13]. Note that the axialstress distributions in the specimen cannot be measuredin Kolsky bar experiments, since only the forces at thetwo ends of the specimen are experimentally accessible.For some situations (such as an experiment on a soft
specimen material or at very high strain rates) eventhe force at the input-bar/specimen interface is difficultto obtain accurately, because the measure of this forceinvolves a subtraction of two pulses with similar magni-tudes that have suffered wave dispersion. For the morecomplex experiments, involving very soft specimens orextremely high-strain-rates, it is sometimes necessary toperform a full computational analysis of the wave prop-agation within the specimen to obtain an estimate of thetime required for equilibration [33.16].
Friction Effects. Friction at the specimen/bar inter-faces causes the state of stress to deviate from theuniaxial stress condition and leads to spuriously stiffresults [33.18, 19]. As Fig. 33.5 shows, decreasing thespecimen length can greatly increase the accessiblestrain rate range for a given experiment. However, asthe l0/d0 ratio of the specimen becomes smaller, theeffects of friction at the interfaces become substantialif the coefficient of friction at the specimen/bar in-terfaces is not sufficiently low, leading to inaccuratemeasures of the stress [33.19]. For quasi-static com-pression tests, specimen l0/d0 ratios of 1.5 to 3.0 arerecommended in various ASTM standards [33.20], withproper use of lubricant. In contrast, for conventionalcompression Kolsky bar tests, l0/d0 ratios of 0.5–1.0are widely used, following Bertholf and Karnes [33.19].The interfacial friction depends on the smoothnessof the end surfaces, the bar and specimen materialsand lubricant used, impact velocity and temperature.Commonly used lubricants in Kolsky bar experimentsinclude MoS2 lubricants and lithium greases. Severalresearchers have measured the friction of lubricants atvarious strain rates using ring specimens (e.g. [33.21]).These measurements have generally shown that the fric-tion decreases at high strain rates.
Dispersion Effects. Longitudinal waves in elastic barssuffer from geometric dispersion, so that the inci-dent, reflected and transmitted pulses change as theypropagate along the input and output bars; however,(33.1–33.13) essentially ignore dispersion. Wave dis-persion affects the measured strain pulses, which inturn affect the measured stress-strain response. Disper-sion effects can be rigorously included through elasticwave propagation computations (e.g. [33.22]), but twoconsequences of dispersion remain important. First, dis-persion inevitably induces superimposed oscillationsin the loading of the specimen. Second, shorter stresspulses with sharper rise times cause greater dispersionbecause of the high-frequency content and the wider
PartD
33.1
VP
Highlight
8 Part D Sample Chapter
range. It is now possible to routinely correct for the ef-fects of dispersion are using elastic-wave propagationcalculations, and indeed this must be done for someexperiments where information that is present early inthe stress-time signal is important. One approach tominimizing the effects of dispersion is to use so-calledbuffer materials or shaper materials that are placed be-tween the impacting projectile and input bar [33.23].This results in the shaping of the incident wave witha longer rise time and thus lower dispersion.
Inertial Effects. The stresses associated with axial andradial inertia should be small compared with the flowstress of the material under investigation. The stresswave loading that is used in high strain rate experimentscauses inertia to have an influence on the measuredproperties, particularly at very high strain rates [33.24].The magnitude of the inertial contribution to the appar-ent stress also depends on the density and size of thespecimen [33.16]. Gorham [33.24] (following [33.25])developed an approach to estimate the inertial effect inKolsky bar experiments that can be rewritten to empha-size specimen size and l/d ratio effects as follows:
σs,2 −σy = ρd2ε2
[1
64+ 1
6
(l0
d0
)2]
−ρd2ε
[1
32− 1
6
(l0
d0
)2]
− ρlv
2,
(33.20)
where σs,2 and σy are the flow stress measured from theoutput bar and the actual yield stress of the material re-spectively, ρ is the density of the specimen material andv is the velocity of the interface between the specimenand the output bar. This rearrangement is useful becausethe l/d ratio is constrained to remain within a fairly nar-row range (0.5 ≤ l/d ≤ 1), and so (33.20) allows us tofocus on the effect of specimen size through the speci-men diameter. In any experiment with a nearly constantstrain rate, the magnitude of the second term is muchsmaller than that of the first term, and the magnitude ofthe third term is generally small for materials which donot exhibit a very high strain hardening. Ignoring thesecond and the third terms, the relative error (r) in flowstress measurement due to inertia is
σs,2 −σy
σy= r = ρd2
σy
[1
64+ 1
6
(l0
d0
)2]
ε2 .
(33.21)
It is apparent that (for a given strain rate) the errordrops significantly when the specimen size (length ordiameter, given l0/d0 is reduced (this is one driver forminiaturizing the Kolsky bar arrangement). It is alsoapparent that tests on materials with high flow stressand low density are less prone to such inertial errors,whereas very high density materials and very soft ma-terials will be problematic. A useful way to considerinertial effects is to examine the limiting strain rate thatcan be attained while keeping the inertial error belowsome chosen value. For a given value of the relativeerror rin stress and a given ratio of l0/d0, the limit-ing strain rate can be expressed as a function of thespecimen length and the specific strength σy/ρ as
εlim = 1
l0
√√√√√
σy
ρr
⎛
⎝ 192
32+(
3β2
)
⎞
⎠ , (33.22)
where β = (l0)/(d0).This gives us, for example, εlim = 1/l0[(48r)/11]1/2
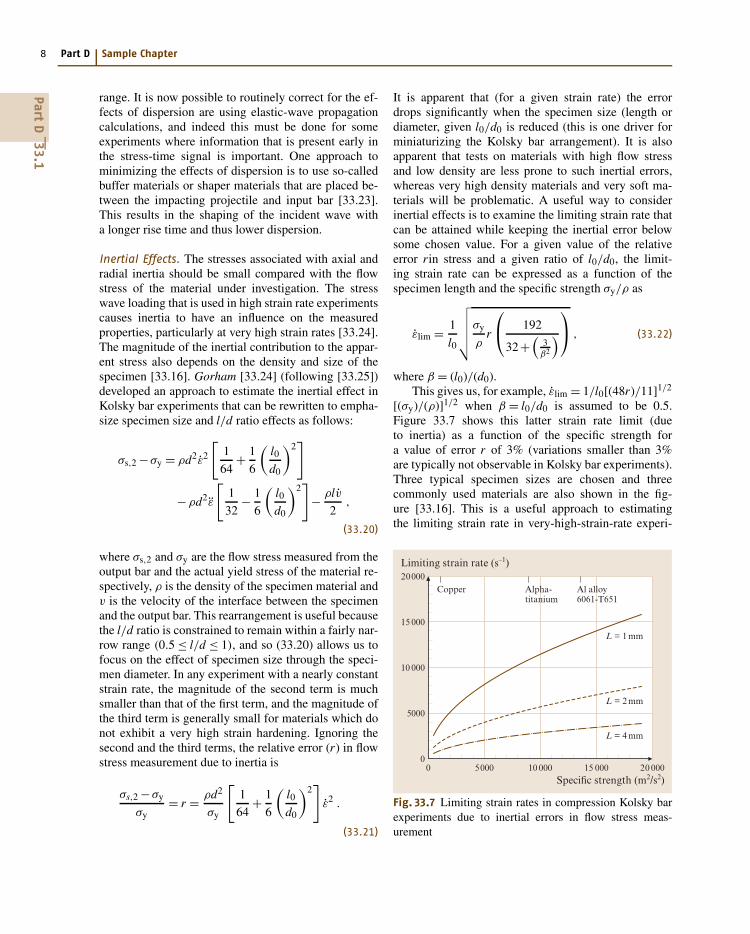
[(σy)/(ρ)]1/2 when β = l0/d0 is assumed to be 0.5.Figure 33.7 shows this latter strain rate limit (dueto inertia) as a function of the specific strength fora value of error r of 3% (variations smaller than 3%are typically not observable in Kolsky bar experiments).Three typical specimen sizes are chosen and threecommonly used materials are also shown in the fig-ure [33.16]. This is a useful approach to estimatingthe limiting strain rate in very-high-strain-rate experi-
0 5000 10 000 15 000
L = 4 mm
L = 2 mm
L = 1 mm
Copper Alpha-titanium
Al alloy6061-T651
20 000
Limiting strain rate (s–1)
Specific strength (m2/s2)
20000
15 000
10 000
5000
0
Fig. 33.7 Limiting strain rates in compression Kolsky barexperiments due to inertial errors in flow stress meas-urement
PartD
33.1
High Strain Rate and Impact Experiments 33.1 High Strain Rate Experiments 9
ments for a given specimen size and a known specificstrength of the material. This is also helpful for clarify-ing the sometimes dramatic reported changes of flowstresses in the range of strain rates of ≈ 1 × 10³ –≈ 5 × 10⁴ s−1, by helping to distinguish valid from in-valid tests.
33.1.2 Extensions and Modificationsof Kolsky Bars
A very large number of extensions and modificationsof the traditional Kolsky bar system have been devel-oped over the last five decades. Most of these are listedin Table I of the review by Field et al. [33.1], who in-clude an exhaustive literature set. We discuss some ofthe key modifications in the rest of this section, focusingon some particular challenges.
Modifications for CeramicsThere are three major difficulties associated with test-ing ceramics in the conventional compression Kolskybar. First, these materials are extremely hard, and thusare likely to cause damage to the bar ends. Second,these materials do not develop substantial plastic strain,so that failure will be caused essentially in the elas-tic domain and specimen strain can be very difficultto measure. Third, since these materials are extremelybrittle, the specimen design can easily introduce defectsthat will cause premature failure, raising the questionof whether the material properties can be measured.An excellent summary of these issues is presented inthe ASM Handbook article by Subhash and Ravichan-dran [33.26]. The first of these difficulties can besomewhat mitigated by using special inserts (calledplatens) at the end of the bars that are made of evenharder ceramics, e.g. [33.27]. The second and third dif-ficulties are much harder to address. The fact that failureoccurs immediately after the elastic domain means thatit becomes very important to ensure a stress equilibra-tion was in the specimen, and this cannot be done withthe traditional trapezoidal pulse. The best way to re-solve this issue is to use a controlled rise time for theincident pulse, and to ensure that equilibration occurswell before failure develops. The incident pulse shape iscontrolled [33.23] by using a buffer material or a pulse-shaper material at the projectile/impact-bar interface(this material is typically a soft metal, for example cop-per) [33.28]. The question of when equilibration occursremains a matter of some debate. A rule of thumb thatis commonly used is that at least five reverberations ofthe elastic wave should occur before the difference in
the stress in the two sides of the specimen becomes suf-ficiently small to be ignored. This also generates limitson the effective strain rates that can be developed forvalid Kolsky bar testing [33.29]. Note that for the harderhot-pressed ceramics, the specimen strain is extraordi-narily difficult to measure because of indentation of theceramics into the platens.
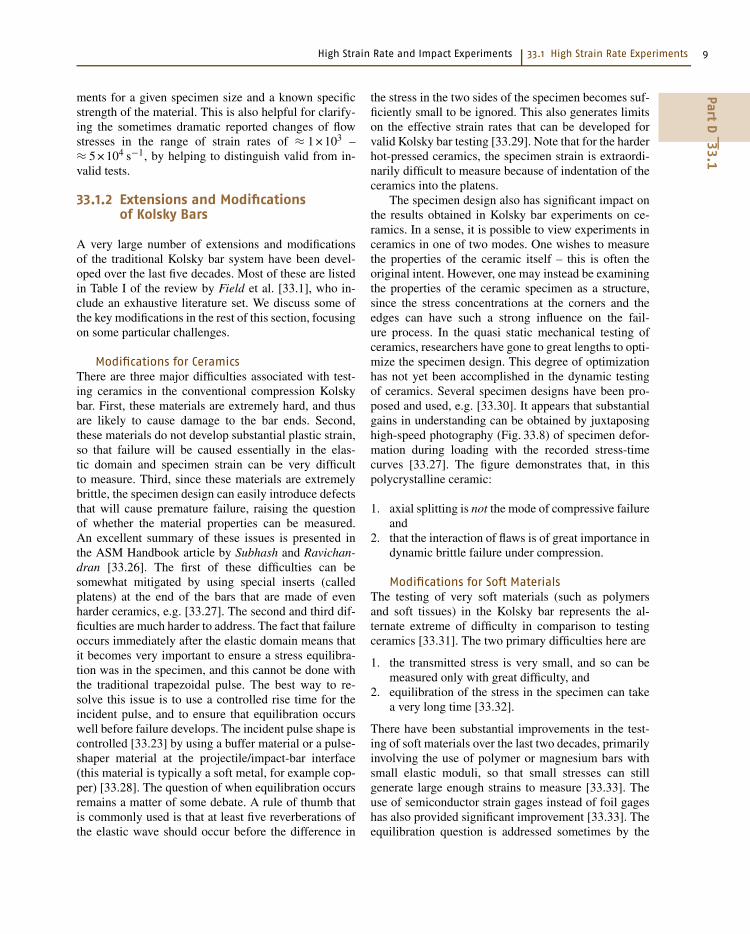
The specimen design also has significant impact onthe results obtained in Kolsky bar experiments on ce-ramics. In a sense, it is possible to view experiments inceramics in one of two modes. One wishes to measurethe properties of the ceramic itself – this is often theoriginal intent. However, one may instead be examiningthe properties of the ceramic specimen as a structure,since the stress concentrations at the corners and theedges can have such a strong influence on the fail-ure process. In the quasi static mechanical testing ofceramics, researchers have gone to great lengths to opti-mize the specimen design. This degree of optimizationhas not yet been accomplished in the dynamic testingof ceramics. Several specimen designs have been pro-posed and used, e.g. [33.30]. It appears that substantialgains in understanding can be obtained by juxtaposinghigh-speed photography (Fig. 33.8) of specimen defor-mation during loading with the recorded stress-timecurves [33.27]. The figure demonstrates that, in thispolycrystalline ceramic:
1. axial splitting is not the mode of compressive failureand
2. that the interaction of flaws is of great importance indynamic brittle failure under compression.
Modifications for Soft MaterialsThe testing of very soft materials (such as polymersand soft tissues) in the Kolsky bar represents the al-ternate extreme of difficulty in comparison to testingceramics [33.31]. The two primary difficulties here are
1. the transmitted stress is very small, and so can bemeasured only with great difficulty, and
2. equilibration of the stress in the specimen can takea very long time [33.32].
There have been substantial improvements in the test-ing of soft materials over the last two decades, primarilyinvolving the use of polymer or magnesium bars withsmall elastic moduli, so that small stresses can stillgenerate large enough strains to measure [33.33]. Theuse of semiconductor strain gages instead of foil gageshas also provided significant improvement [33.33]. Theequilibration question is addressed sometimes by the
PartD
33.1
10 Part D Sample Chapter
5.2 mm1 2 3 4
5 6 7 8
2.3 mm
Fig. 33.8 High speed photographs of the development of microcracks in a transparent polycrystalline ceramic (AION)under dynamic compression along the horizontal axis [33.27]. The interframe times is 1 μs and each exposure timesis 20 ns
direct measurement of force using piezoelectric quartzgages [33.34]. All of these approaches require great carewith both experimental setup and data analysis [33.35].One particularly important question that must be ex-plicitly addressed for each material is that of materialincompressibility.
Modifications for High Temperature TestingThe most common approach to running high temper-ature Kolsky bar experiments is to simply heat thespecimen while it is in contact with the input and outputbars (typically inside a tube furnace), allowing a strongtemperature gradient to develop within the bars. If anestimate of the temperature gradient can be made, itseffect can be compensated for by making the properadjustments to the wave-speeds due to the temperature-dependent elastic modulus of the bar material [33.36].Such techniques have limitations on the attainable spec-imen temperature that are imposed by heat conductionin the bars and by the properties of the bar mater-ials. One solution to this problem has been to providean insulating layer between the specimen and bars inthe form of a short length of impedance-matched ce-ramic bar [33.37]. A variant of this technique has beenused to perform high temperature torsion tests [33.38].One method of providing rapid heating in such anarrangement (for conductive specimens) is inductionheating [33.37].
A second, more modern approach to running hightemperature experiments in the Kolsky bar is to heatthe specimen alone, and then to bring the bars into
contact with the specimen just before impact [33.39].This setup has the advantage of reducing temperaturegradients in the bars, and the added benefit of requir-ing relatively small energy inputs to heat the specimen.The major design issue in such a system is the coldcontact time – the duration of time over which theinput and output bars are in contact with the speci-men before the arrival of the incident wave. Duringthis contact time, thermal gradients develop within thespecimen, and the overall specimen temperature dropsby an amount that is typically not recorded. Vari-ous arrangements have been used to reduce this coldcontact time, e.g. [33.39] and [33.40]. Approaches toheating the specimen include RF heating and radiativeheating [33.39]. Conductive heating and pulse heatingapproaches have also been used to develop very largeheating rates in metallic specimens [33.41].
Tension Kolsky BarsA version of the Kolsky bar system that is effective intension was developed in the 1960s [33.42]. The basicprinciple of this system is identical to the compressionsystem, except that a method for generating a tensilewave must be used, and special tension grips are re-quired for the specimen. That are two basic approachesto generate a tensile wave in input bar. The first ap-proach, known as an impact-tension approach, consistsof firing a tubular projectile at a flange at the end ofa bar, thereby generating a tensile wave within the bar.A variant of this approach uses a reaction mass andcauses the reflection of a compressive wave as a tensile
PartD
33.1
High Strain Rate and Impact Experiments 33.1 High Strain Rate Experiments 11
wave [33.43]. The second, and less common, approachconsists of storing a large tensile strain within a sectionof a bar and then suddenly releasing it is so as to gen-erate a tensile wave (this is known as the direct-tensionapproach) [33.44].
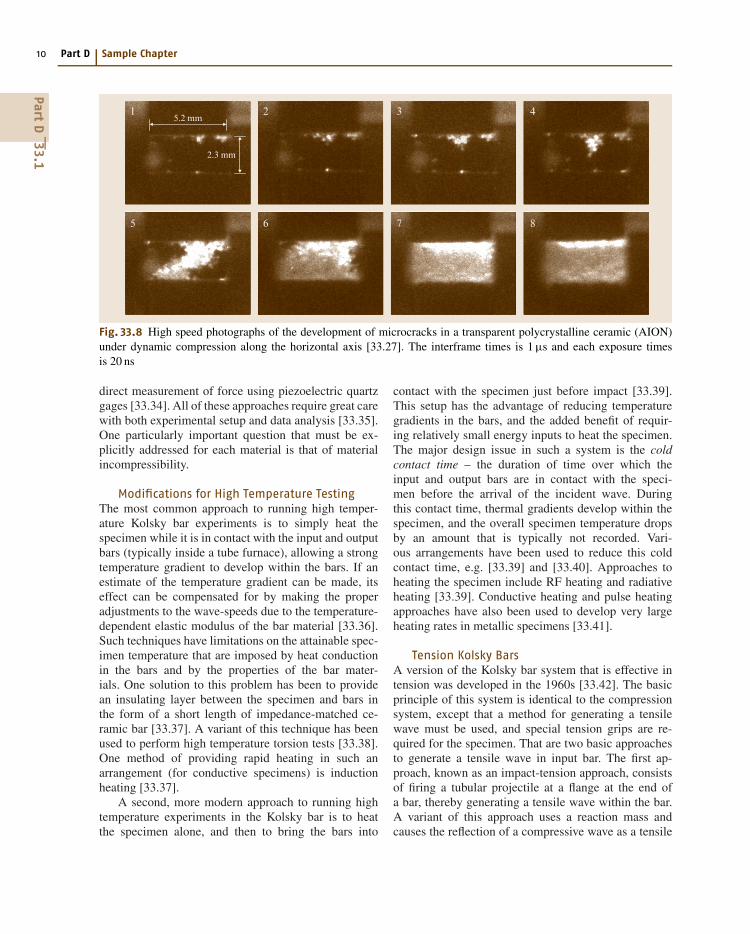
The gripping of tensile specimens requires somecare, because otherwise the spurious wave reflectionsfrom the grips would make it difficult to interpret theexperiments. Commonly used grips include threadedends and adhesively bonded ends. A general rule ofthumb is that if the gripped ends are made of the samematerial as the bar and are no longer than the bar diam-eter, then the effect on the wave propagation will beminimal. An example of the direct-tension Kolsky baris shown in Fig. 33.9 [33.45]. A tensile force is ap-plied to a section of the input bar using the hydraulicactuator system, while the rest of the input bar is re-strained using a friction clamp. When the friction clampis suddenly released, a tensile pulse propagates downthe input bar and loads the specimen in tension; partof this incident pulse is transmitted into the output bar,and part is reflected back to the input bar. Strain gagesare mounted on the input and output bars to measureelastic strain in the bars. Using these strain gages, theincident, reflected and transmitted pulses in the bars canbe measured. As before, the transmitted pulse providesthe stress history of the specimen, while the reflectedpulse provides the strain rate history (which can thenbe integrated over time to obtain the specimen strain).Multiple strain gauge stations may be needed in orderto separate out the incident and reflected pulses. The
Specimen
Strain gauge stations
L1
L0
L2 L2
R
D1-20-UNF D0
3048 1524
Output barInput barAxial actuator Clamp
2 31
Fig. 33.9 Schematic of the direct-tension Kolsky bar. The inset shows an example of a threaded specimen
equations are identical to those used for the compres-sion Kolsky bar, but the specimen length replaced bya gauge length on the tensile specimen. A full tensilestress-strain curve is obtained at fairly high strain rates(on the order of 102 –103 s−1 using this system).
However, the traditional approach to obtaining thespecimen strain in the tension Kolsky bar provides aninaccurate measure of strain, in general. This is be-cause it measures the relative displacement of the twospecimen-bar interfaces, and converting this to speci-men strain requires an assumption of a specimen gaugelength (this is very well known in compression, butis not well defined in tension). Since fillets are re-quired in tensile specimens in order to avoid failuredue to stress concentrations at the specimen flanges,the non-uniform deformation developed at the flangescontributes to the total deformation of the specimen.It is therefore difficult and at times impossible to de-termine the effective gauge length to be used in thecalculation of specimen axial strains [33.42]. Ideallyone should have a strain-gage mounted directly onthe specimen to provide measures of strain through-out the experiment. One alternative approach is to usea high-speed camera to directly measure the specimendiameter and length during an experiment. A sec-ond alternative is to use the Laser Occlusive RadiusDetector (LORD) technique to directly determine thelocal specimen strains during high-strain-rate experi-ments [33.45]. This approach requires the assumptionof incompressibility in the specimen in order to es-timate the axial specimen strain (an assumption that
PartD
33.1
12 Part D Sample Chapter
is typically not valid once necking begins). However,it is capable of measuring fairly large plastic strains,which are generally not measurable using standard on-specimen strain gauges because they debond during thedeformation.
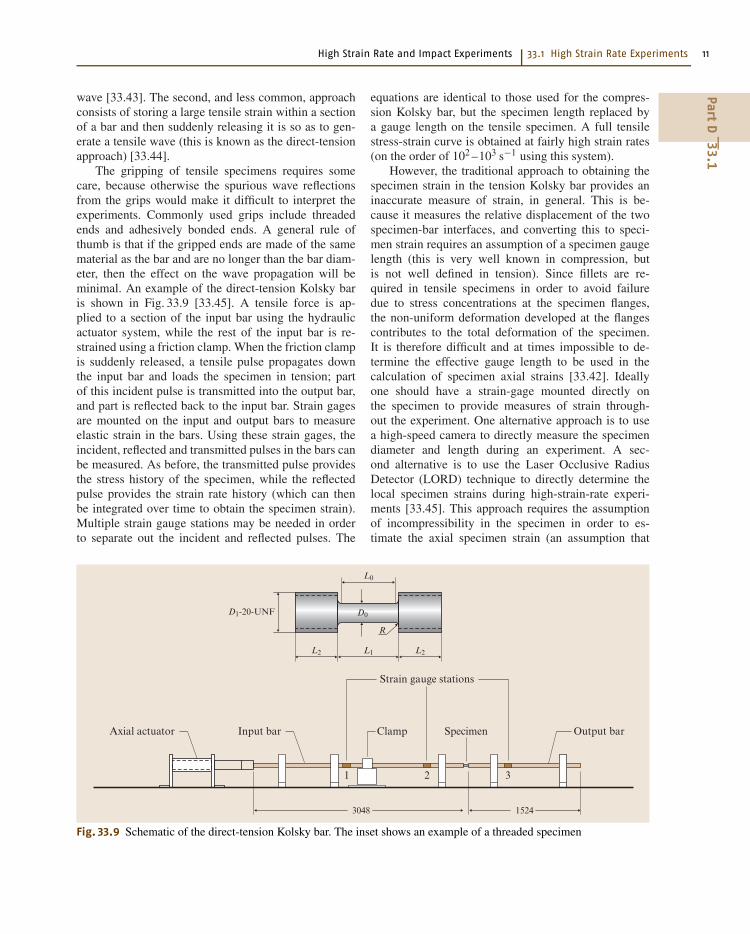
Torsional Kolsky BarsThe torsional Kolsky bar is an adaptation of the com-pression Kolsky bar that is used to generate high strainrate shearing deformations within typically tubularspecimens [33.46]. An excellent summary of the tech-nique is presented by Hartley et al. [33.47]. A schematicof such a device is presented in Fig. 33.10. The principleof operation of this bar is identical to that in the tensionKolsky bar, except that a torsional wave is now prop-agated down the input bar towards the specimen. Oneadvantage of the torsional Kolsky bar is that primary-mode torsional waves are not dispersive in the bar, sothat dispersion corrections are not necessary. A secondadvantage of this system is that (in principle) very largeshearing strains can be sustained and so material be-havior can be studied over very large strain regimes.That is, the difficulties associated with maintaining fric-tion during large deformations (in the compression bar)and avoiding necking (in the tension bar) are avoided inthe torsional bar system. Further, radial expansion andcontraction are not significant in torsion of isotropic ma-terials, so that the inertial and end effects present in thetension and compression tests are absent in the torsionalKolsky bar experiment. However, shear bands may de-velop during torsional deformations: in fact this is oneof the most common applications of the torsional barsystem [33.48].
A significant experimental concern in the setup ofthe torsional Kolsky bar system is the avoidance of
Specimen Output barInput barClamp
Torquingdevice
Fig. 33.10 Schematic of the torsional Kolsky bar. Note the location of the friction clamp with respect to the supports
bending waves. Flexural waves in a long bar may havesignal content propagating at speeds similar to that ofthe torsional wave, resulting in some difficulties in waveanalysis. It is particularly important that the frictionclamp design not generate flexural waves within thelaws – note in particular that the use of heavy frictionclamps is not an advantage. Careful placement of thesupports and specific initial measurement of the propa-gation of bending waves within the bar is warranted.
The difficulties associated with specimen grippingare also an issue with the torsional Kolsky bar design.Typical approaches to gripping the specimen includethe use of adhesives, asymmetric flanges, and varioustypes of compression grips. Specimen design is critical,with the usual questions associated with the definitionof specimen gauge length and definition of fillet radii. Itis recommended that a full finite deformation analysisof the plastic deformation of a specimen be performedbefore using the given specimen design with an experi-ment.
The equations associated with the use of the tor-sional Kolsky bar system are different in detail, butnot in character, from those used for the compressionKolsky bar system. A full description of the relevantequations is presented by Hartley et al. [33.47]. The pri-mary distinctions arise because of the torsional mode:one must consider torques and angular velocities ratherthan axial forces and translational velocities. We notethat a response diagram very similar to Fig. 33.6 mayalso be constructed for the torsional Kolsky bar, andmay be used in a very similar way to accomplishexperimental design. Examples of show stress versusshear-strain curves obtained using the torsional Kolskybar are presented in Fig. 33.15 for the aluminum alloy6061-T6.
PartD
33.1
High Strain Rate and Impact Experiments 33.1 High Strain Rate Experiments 13
The torsional Kolsky bar system has also been mod-ified to perform high-temperature testing at high shearstrain rates [33.38]. In this approach the necessity ofusing grips on the specimen can be turned into an ad-vantage, with the grips acting as thermal insulators andreducing the heating of the bars themselves.
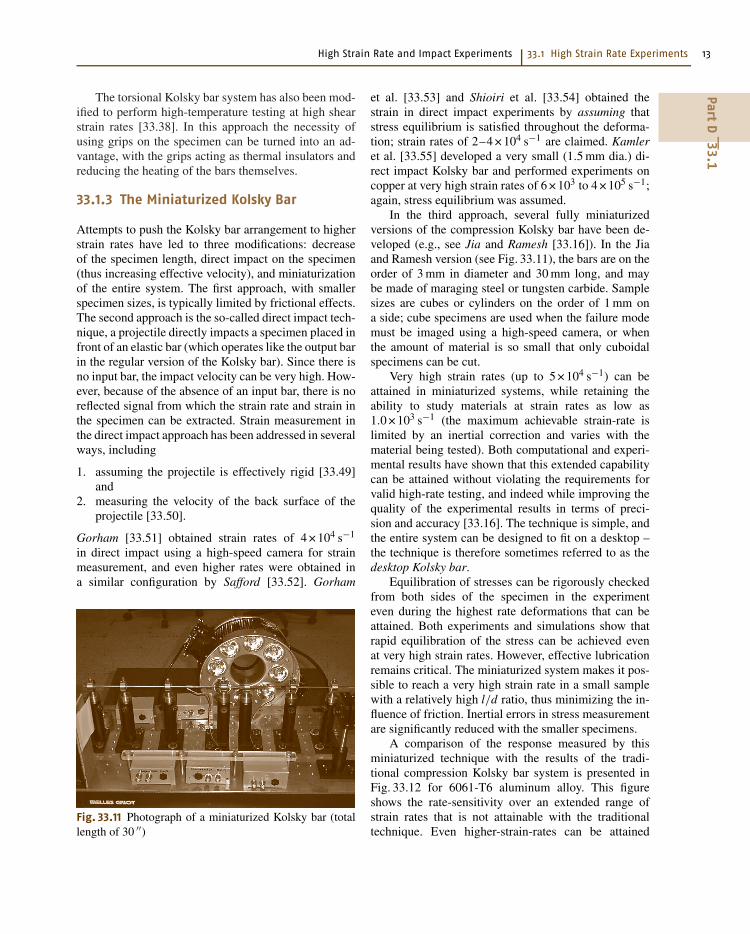
33.1.3 The Miniaturized Kolsky Bar
Attempts to push the Kolsky bar arrangement to higherstrain rates have led to three modifications: decreaseof the specimen length, direct impact on the specimen(thus increasing effective velocity), and miniaturizationof the entire system. The first approach, with smallerspecimen sizes, is typically limited by frictional effects.The second approach is the so-called direct impact tech-nique, a projectile directly impacts a specimen placed infront of an elastic bar (which operates like the output barin the regular version of the Kolsky bar). Since there isno input bar, the impact velocity can be very high. How-ever, because of the absence of an input bar, there is noreflected signal from which the strain rate and strain inthe specimen can be extracted. Strain measurement inthe direct impact approach has been addressed in severalways, including
1. assuming the projectile is effectively rigid [33.49]and
2. measuring the velocity of the back surface of theprojectile [33.50].
Gorham [33.51] obtained strain rates of 4 × 10⁴ s−1
in direct impact using a high-speed camera for strainmeasurement, and even higher rates were obtained ina similar configuration by Safford [33.52]. Gorham
Fig. 33.11 Photograph of a miniaturized Kolsky bar (totallength of 30 ′′)
et al. [33.53] and Shioiri et al. [33.54] obtained thestrain in direct impact experiments by assuming thatstress equilibrium is satisfied throughout the deforma-tion; strain rates of 2–4 × 10⁴ s−1 are claimed. Kamleret al. [33.55] developed a very small (1.5 mm dia.) di-rect impact Kolsky bar and performed experiments oncopper at very high strain rates of 6 × 10³ to 4 × 10⁵ s−1;again, stress equilibrium was assumed.
In the third approach, several fully miniaturizedversions of the compression Kolsky bar have been de-veloped (e.g., see Jia and Ramesh [33.16]). In the Jiaand Ramesh version (see Fig. 33.11), the bars are on theorder of 3 mm in diameter and 30 mm long, and maybe made of maraging steel or tungsten carbide. Samplesizes are cubes or cylinders on the order of 1 mm ona side; cube specimens are used when the failure modemust be imaged using a high-speed camera, or whenthe amount of material is so small that only cuboidalspecimens can be cut.
Very high strain rates (up to 5 × 10⁴ s−1) can beattained in miniaturized systems, while retaining theability to study materials at strain rates as low as1.0 × 103 s−1 (the maximum achievable strain-rate islimited by an inertial correction and varies with thematerial being tested). Both computational and experi-mental results have shown that this extended capabilitycan be attained without violating the requirements forvalid high-rate testing, and indeed while improving thequality of the experimental results in terms of preci-sion and accuracy [33.16]. The technique is simple, andthe entire system can be designed to fit on a desktop –the technique is therefore sometimes referred to as thedesktop Kolsky bar.
Equilibration of stresses can be rigorously checkedfrom both sides of the specimen in the experimenteven during the highest rate deformations that can beattained. Both experiments and simulations show thatrapid equilibration of the stress can be achieved evenat very high strain rates. However, effective lubricationremains critical. The miniaturized system makes it pos-sible to reach a very high strain rate in a small samplewith a relatively high l/d ratio, thus minimizing the in-fluence of friction. Inertial errors in stress measurementare significantly reduced with the smaller specimens.
A comparison of the response measured by thisminiaturized technique with the results of the tradi-tional compression Kolsky bar system is presented inFig. 33.12 for 6061-T6 aluminum alloy. This figureshows the rate-sensitivity over an extended range ofstrain rates that is not attainable with the traditionaltechnique. Even higher-strain-rates can be attained
PartD
33.1
14 Part D Sample Chapter
Desktop Kolsky bar (l /d = 0.55)Desktop Kolsky bar (l /d = 1.1)Conventional Kolsky bar (l /d = 0.55)
103 104 105
Flow stress (MPa)
Strain rate (s–1)
600
500
400
300
200
100
0
Fig. 33.12 Comparison of results obtained using the minia-turized and traditional compression Kolsky bars. Thematerial is 6061-T6 aluminium alloy
using the pressure-shear plate impact experiment, de-scribed et seq.
The miniaturized Kolsky bar or desktop Kolsky barexperimental technique is particularly effective when itcomes to understanding the properties of nanostructuredmaterials, or of materials with very fine grain sizes.Note, however, that the small specimen sizes can makeit difficult to use this approach with materials (such assolders) that have large grain sizes or a large microstruc-tural length scale.
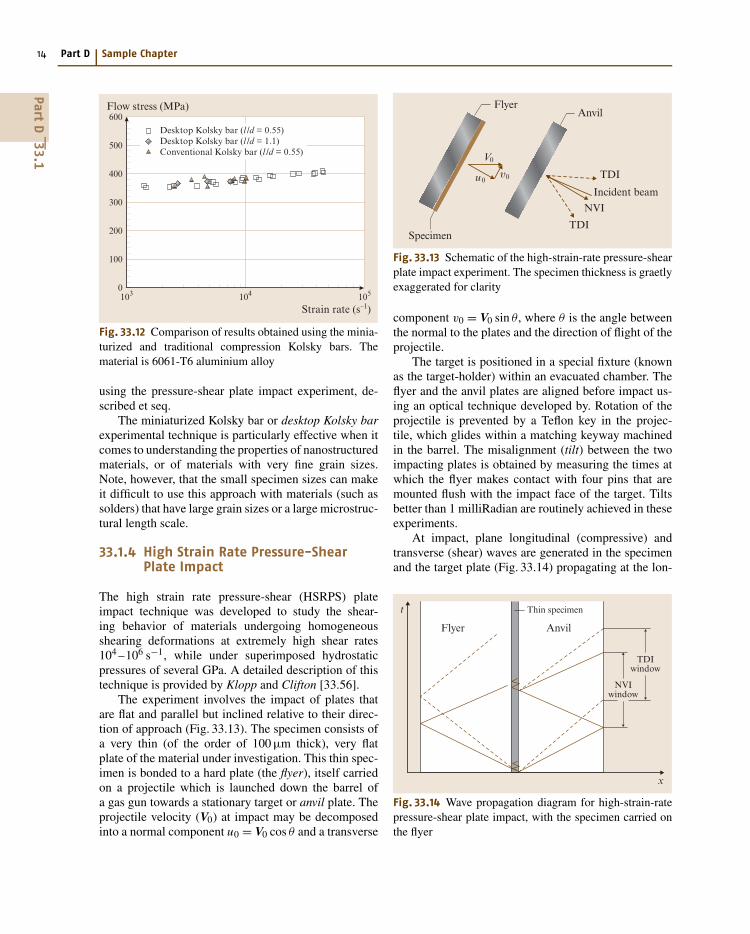
33.1.4 High Strain Rate Pressure-ShearPlate Impact
The high strain rate pressure-shear (HSRPS) plateimpact technique was developed to study the shear-ing behavior of materials undergoing homogeneousshearing deformations at extremely high shear rates104 –106 s−1, while under superimposed hydrostaticpressures of several GPa. A detailed description of thistechnique is provided by Klopp and Clifton [33.56].
The experiment involves the impact of plates thatare flat and parallel but inclined relative to their direc-tion of approach (Fig. 33.13). The specimen consists ofa very thin (of the order of 100 μm thick), very flatplate of the material under investigation. This thin spec-imen is bonded to a hard plate (the flyer), itself carriedon a projectile which is launched down the barrel ofa gas gun towards a stationary target or anvil plate. Theprojectile velocity (V0) at impact may be decomposedinto a normal component u0 = V0 cos θ and a transverse
Flyer
V0
υ0u 0
Specimen
Anvil
TDI
TDI
NVI
Incident beam
Fig. 33.13 Schematic of the high-strain-rate pressure-shearplate impact experiment. The specimen thickness is graetlyexaggerated for clarity
component v0 = V0 sin θ, where θ is the angle betweenthe normal to the plates and the direction of flight of theprojectile.
The target is positioned in a special fixture (knownas the target-holder) within an evacuated chamber. Theflyer and the anvil plates are aligned before impact us-ing an optical technique developed by. Rotation of theprojectile is prevented by a Teflon key in the projec-tile, which glides within a matching keyway machinedin the barrel. The misalignment (tilt) between the twoimpacting plates is obtained by measuring the times atwhich the flyer makes contact with four pins that aremounted flush with the impact face of the target. Tiltsbetter than 1 milliRadian are routinely achieved in theseexperiments.
At impact, plane longitudinal (compressive) andtransverse (shear) waves are generated in the specimenand the target plate (Fig. 33.14) propagating at the lon-
t
x
Anvil
Thin specimen
NVIwindow
TDIwindow
Flyer
Fig. 33.14 Wave propagation diagram for high-strain-ratepressure-shear plate impact, with the specimen carried onthe flyer
PartD
33.1
High Strain Rate and Impact Experiments 33.1 High Strain Rate Experiments 15
gitudinal wave speed cl and the shear wave speed cs.These waves reverberate within the specimen, result-ing in a buildup of the normal stress and of the shearstress within the specimen material. Information on thestress levels sustained by the specimen material is car-ried by the normal and transverse waves propagatinginto the target plate. Since the target remains elastic,there is a linear relationship between the stresses andthe particle velocities in the target plate. Thus it issufficient to measure the normal and transverse par-ticle velocities in the target plate to deduce the stressstate and deformation state within the specimen. Theentire experiment is completed before any unloadingwaves from the periphery of the plates arrives at thepoint of observation, so that only plane waves are in-volved and a one dimensional analysis is both sufficientand rigorously correct. Like most plate impact experi-ments, this is a uniaxial strain experiment in that notransverse normal strains can occur during the time ofinterest.
a) Normal stress σ
u0
Anvilstates
clρ
clρ
Flyerstates
b) Shear stress τ
υ0
Anvilstates csρ
τf
υA υfs υF
Flyerstates
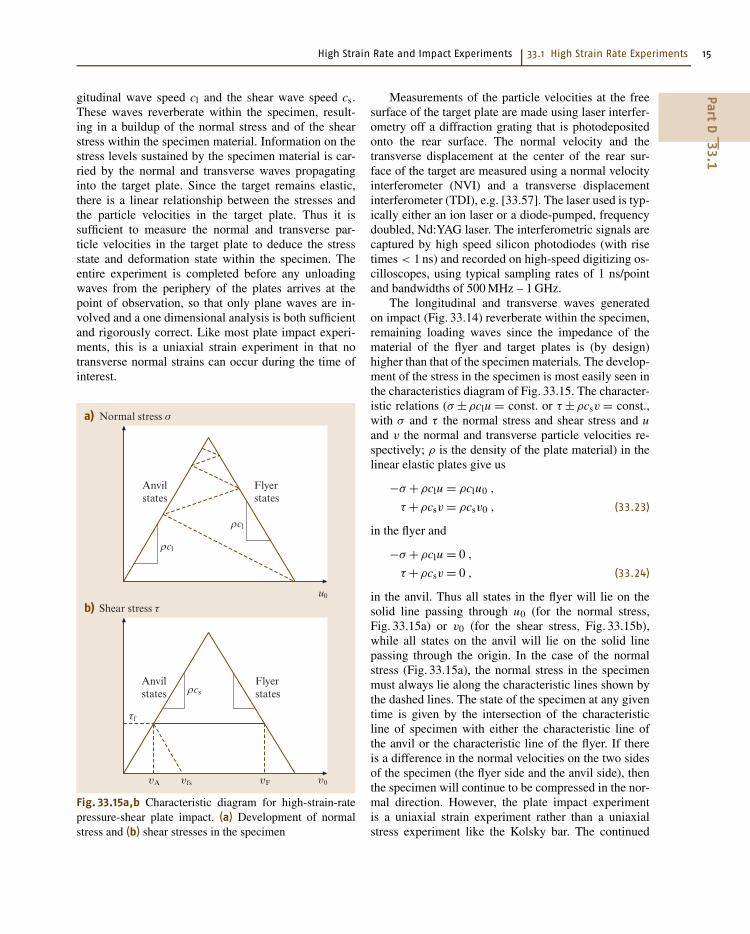
Fig. 33.15a,b Characteristic diagram for high-strain-ratepressure-shear plate impact. (a) Development of normalstress and (b) shear stresses in the specimen
Measurements of the particle velocities at the freesurface of the target plate are made using laser interfer-ometry off a diffraction grating that is photodepositedonto the rear surface. The normal velocity and thetransverse displacement at the center of the rear sur-face of the target are measured using a normal velocityinterferometer (NVI) and a transverse displacementinterferometer (TDI), e.g. [33.57]. The laser used is typ-ically either an ion laser or a diode-pumped, frequencydoubled, Nd:YAG laser. The interferometric signals arecaptured by high speed silicon photodiodes (with risetimes < 1 ns) and recorded on high-speed digitizing os-cilloscopes, using typical sampling rates of 1 ns/pointand bandwidths of 500 MHz – 1 GHz.
The longitudinal and transverse waves generatedon impact (Fig. 33.14) reverberate within the specimen,remaining loading waves since the impedance of thematerial of the flyer and target plates is (by design)higher than that of the specimen materials. The develop-ment of the stress in the specimen is most easily seen inthe characteristics diagram of Fig. 33.15. The character-istic relations (σ ±ρclu = const. or τ ±ρcsv = const.,with σ and τ the normal stress and shear stress and uand v the normal and transverse particle velocities re-spectively; ρ is the density of the plate material) in thelinear elastic plates give us
−σ +ρclu = ρclu0 ,
τ +ρcsv = ρcsv0 , (33.23)
in the flyer and
−σ +ρclu = 0 ,
τ +ρcsv = 0 , (33.24)
in the anvil. Thus all states in the flyer will lie on thesolid line passing through u0 (for the normal stress,Fig. 33.15a) or v0 (for the shear stress, Fig. 33.15b),while all states on the anvil will lie on the solid linepassing through the origin. In the case of the normalstress (Fig. 33.15a), the normal stress in the specimenmust always lie along the characteristic lines shown bythe dashed lines. The state of the specimen at any giventime is given by the intersection of the characteristicline of specimen with either the characteristic line ofthe anvil or the characteristic line of the flyer. If thereis a difference in the normal velocities on the two sidesof the specimen (the flyer side and the anvil side), thenthe specimen will continue to be compressed in the nor-mal direction. However, the plate impact experimentis a uniaxial strain experiment rather than a uniaxialstress experiment like the Kolsky bar. The continued
PartD
33.1
16 Part D Sample Chapter
compression along the normal direction thus impliesa change in volume. Due to the finite compressibility ofthe specimen, the normal stress in the specimen attainsan equilibrium value (corresponding to the intersectionof the flyer and anvil characteristics) given by
σeqm ∼= 1
2ρclV0 cos θ , (33.25)
where ρcl is the acoustic impedance of the steel, V0is the projectile velocity and θ is the skew angle.At equilibrium, the hydrostatic pressure in the speci-men can be approximated to the normal compressivestress, differing from it by at most the strength of thespecimen material. Note that the difference in normalvelocities on the two sides of the specimen contin-uously decreases. Thus the normal strain-rate in thehigh-strain-rate pressure-shear plate impact experimentis initially high but tends towards zero, actually approx-imating zero when normal stress equilibrium has beenachieved. This is again a result of the uniaxial straincondition.
The shear stress in the specimen also increaseswith each reverberation of the shear wave within thespecimen (Fig. 33.15b), until the specimen starts flow-ing at a stress level τf (the flow stress). Thereafter,a finite difference in the transverse velocity can be main-tained across the two surfaces of the specimen (unlikethe normal velocity situation, it is possible to sustaina difference in transverse velocities across the spec-imen because the uniaxial strain condition does notpresent a constraint in this case). The velocity differ-ence vF −vA also corresponds to (see Fig. 33.15b) thevelocity difference v0 −v fs, where v fs is the transversefree-surface velocity measured at the rear surface of thetarget using the TDI. The nominal shear strain rate inthe specimen is then given as
γ = V0 sin θ −v fs
h, (33.26)
where h is the specimen thickness. The nominal strainrate in the specimen can be integrated to give the nomi-nal strain history in the specimen:
γ (t) =t∫
0
γ (τ)dτ . (33.27)
The shear stress history in the specimen is obtainedfrom the transverse particle velocity history using theelastic characteristics of the target plate (Fig. 33.14b)
τ(t) = ρcsvA = 1
2ρcsv fs(t) , (33.28)
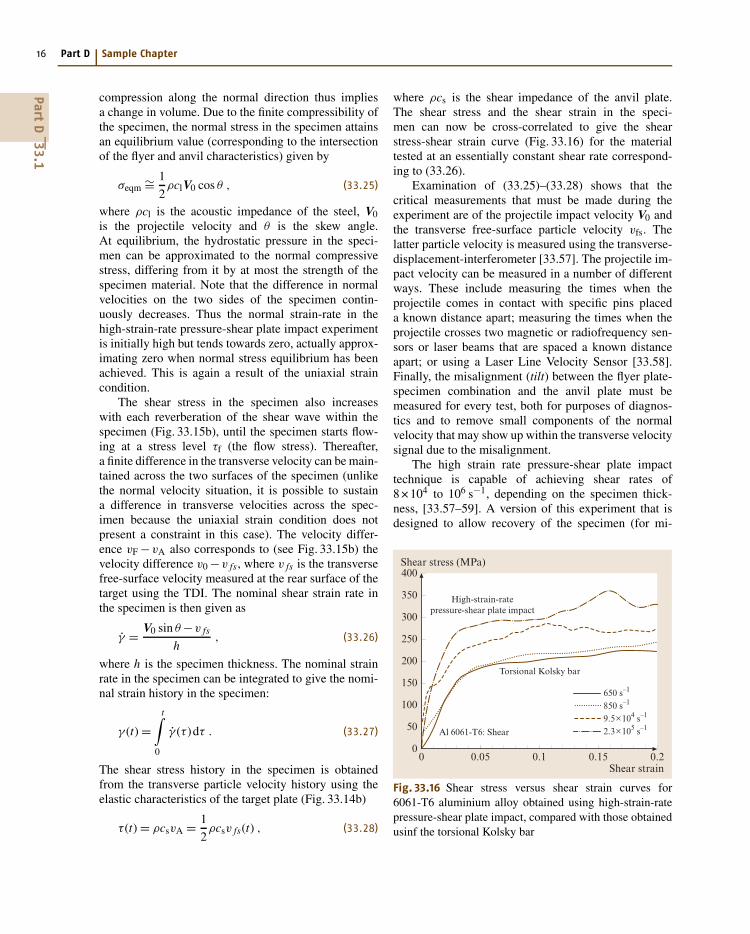
where ρcs is the shear impedance of the anvil plate.The shear stress and the shear strain in the speci-men can now be cross-correlated to give the shearstress-shear strain curve (Fig. 33.16) for the materialtested at an essentially constant shear rate correspond-ing to (33.26).
Examination of (33.25)–(33.28) shows that thecritical measurements that must be made during theexperiment are of the projectile impact velocity V0 andthe transverse free-surface particle velocity vfs. Thelatter particle velocity is measured using the transverse-displacement-interferometer [33.57]. The projectile im-pact velocity can be measured in a number of differentways. These include measuring the times when theprojectile comes in contact with specific pins placeda known distance apart; measuring the times when theprojectile crosses two magnetic or radiofrequency sen-sors or laser beams that are spaced a known distanceapart; or using a Laser Line Velocity Sensor [33.58].Finally, the misalignment (tilt) between the flyer plate-specimen combination and the anvil plate must bemeasured for every test, both for purposes of diagnos-tics and to remove small components of the normalvelocity that may show up within the transverse velocitysignal due to the misalignment.
The high strain rate pressure-shear plate impacttechnique is capable of achieving shear rates of8 × 104 to 106 s−1, depending on the specimen thick-ness, [33.57–59]. A version of this experiment that isdesigned to allow recovery of the specimen (for mi-
0 0.05 0.1 0.15 0.2
Shear stress (MPa)
650 s–1
850 s–1
9.5×10⁴ s–1
2.3×10⁵ s–1
Torsional Kolsky bar
Shear strain
400
350
300
250
200
150
100
50
0
Al 6061-T6: Shear
High-strain-ratepressure-shear plate impact
Fig. 33.16 Shear stress versus shear strain curves for6061-T6 aluminium alloy obtained using high-strain-ratepressure-shear plate impact, compared with those obtainedusinf the torsional Kolsky bar
PartD
33.1
High Strain Rate and Impact Experiments 33.2 Wave Propagation Experiments 17
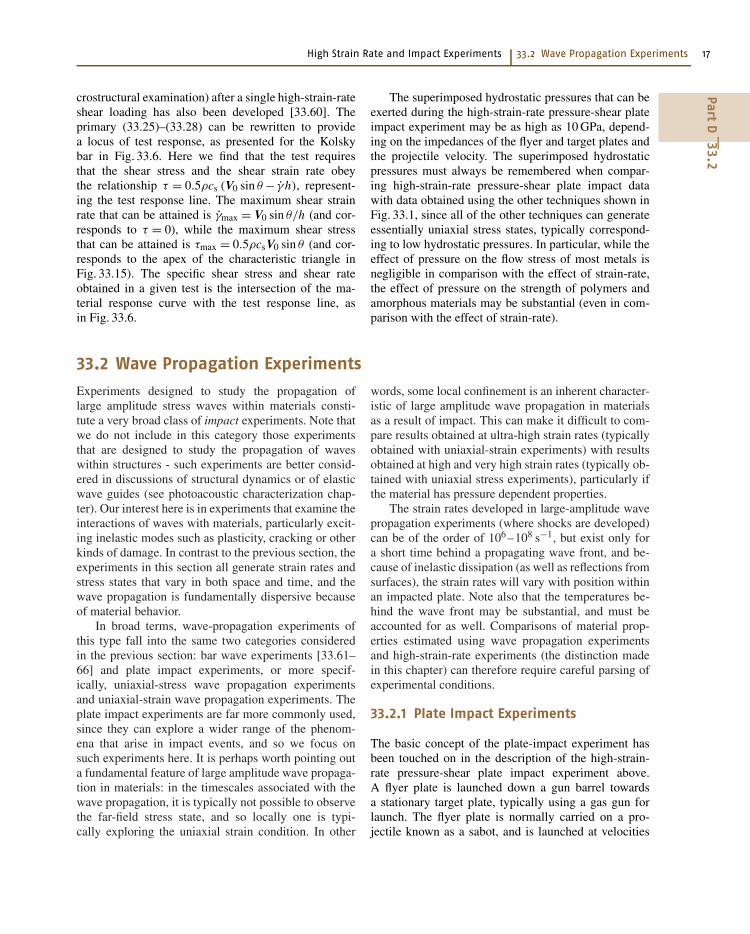
crostructural examination) after a single high-strain-rateshear loading has also been developed [33.60]. Theprimary (33.25)–(33.28) can be rewritten to providea locus of test response, as presented for the Kolskybar in Fig. 33.6. Here we find that the test requiresthat the shear stress and the shear strain rate obeythe relationship τ = 0.5ρcs (V0 sin θ − γh), represent-ing the test response line. The maximum shear strainrate that can be attained is γmax = V0 sin θ/h (and cor-responds to τ = 0), while the maximum shear stressthat can be attained is τmax = 0.5ρcsV0 sin θ (and cor-responds to the apex of the characteristic triangle inFig. 33.15). The specific shear stress and shear rateobtained in a given test is the intersection of the ma-terial response curve with the test response line, asin Fig. 33.6.
The superimposed hydrostatic pressures that can beexerted during the high-strain-rate pressure-shear plateimpact experiment may be as high as 10 GPa, depend-ing on the impedances of the flyer and target plates andthe projectile velocity. The superimposed hydrostaticpressures must always be remembered when compar-ing high-strain-rate pressure-shear plate impact datawith data obtained using the other techniques shown inFig. 33.1, since all of the other techniques can generateessentially uniaxial stress states, typically correspond-ing to low hydrostatic pressures. In particular, while theeffect of pressure on the flow stress of most metals isnegligible in comparison with the effect of strain-rate,the effect of pressure on the strength of polymers andamorphous materials may be substantial (even in com-parison with the effect of strain-rate).
33.2 Wave Propagation Experiments
Experiments designed to study the propagation oflarge amplitude stress waves within materials consti-tute a very broad class of impact experiments. Note thatwe do not include in this category those experimentsthat are designed to study the propagation of waveswithin structures - such experiments are better consid-ered in discussions of structural dynamics or of elasticwave guides (see photoacoustic characterization chap-ter). Our interest here is in experiments that examine theinteractions of waves with materials, particularly excit-ing inelastic modes such as plasticity, cracking or otherkinds of damage. In contrast to the previous section, theexperiments in this section all generate strain rates andstress states that vary in both space and time, and thewave propagation is fundamentally dispersive becauseof material behavior.
In broad terms, wave-propagation experiments ofthis type fall into the same two categories consideredin the previous section: bar wave experiments [33.61–66] and plate impact experiments, or more specif-ically, uniaxial-stress wave propagation experimentsand uniaxial-strain wave propagation experiments. Theplate impact experiments are far more commonly used,since they can explore a wider range of the phenom-ena that arise in impact events, and so we focus onsuch experiments here. It is perhaps worth pointing outa fundamental feature of large amplitude wave propaga-tion in materials: in the timescales associated with thewave propagation, it is typically not possible to observethe far-field stress state, and so locally one is typi-cally exploring the uniaxial strain condition. In other
words, some local confinement is an inherent character-istic of large amplitude wave propagation in materialsas a result of impact. This can make it difficult to com-pare results obtained at ultra-high strain rates (typicallyobtained with uniaxial-strain experiments) with resultsobtained at high and very high strain rates (typically ob-tained with uniaxial stress experiments), particularly ifthe material has pressure dependent properties.
The strain rates developed in large-amplitude wavepropagation experiments (where shocks are developed)can be of the order of 106 –108 s−1, but exist only fora short time behind a propagating wave front, and be-cause of inelastic dissipation (as well as reflections fromsurfaces), the strain rates will vary with position withinan impacted plate. Note also that the temperatures be-hind the wave front may be substantial, and must beaccounted for as well. Comparisons of material prop-erties estimated using wave propagation experimentsand high-strain-rate experiments (the distinction madein this chapter) can therefore require careful parsing ofexperimental conditions.
33.2.1 Plate Impact Experiments
The basic concept of the plate-impact experiment hasbeen touched on in the description of the high-strain-rate pressure-shear plate impact experiment above.A flyer plate is launched down a gun barrel towardsa stationary target plate, typically using a gas gun forlaunch. The flyer plate is normally carried on a pro-jectile known as a sabot, and is launched at velocities
PartD
33.2
18 Part D Sample Chapter
ranging from a few tens of meters per second up to sev-eral kilometers per second using a variety of gas andpowder guns. The flyer plate may impact the target plateat normal incidence, resulting in what is called a normalplate impact experiment. In oblique plate impact experi-ment consists of an impact that occurs at an angle asdescribed in the pressure-shear plate impact experiment.The vast majority of plate impact experiments that areperformed today are normal plate impact experiments,largely because oblique plate impact experiments typ-ically require a keyed gun barrel to prevent rotationof the projectile during flight. We consider only nor-mal plate impact experiments in the remainder of thissection.
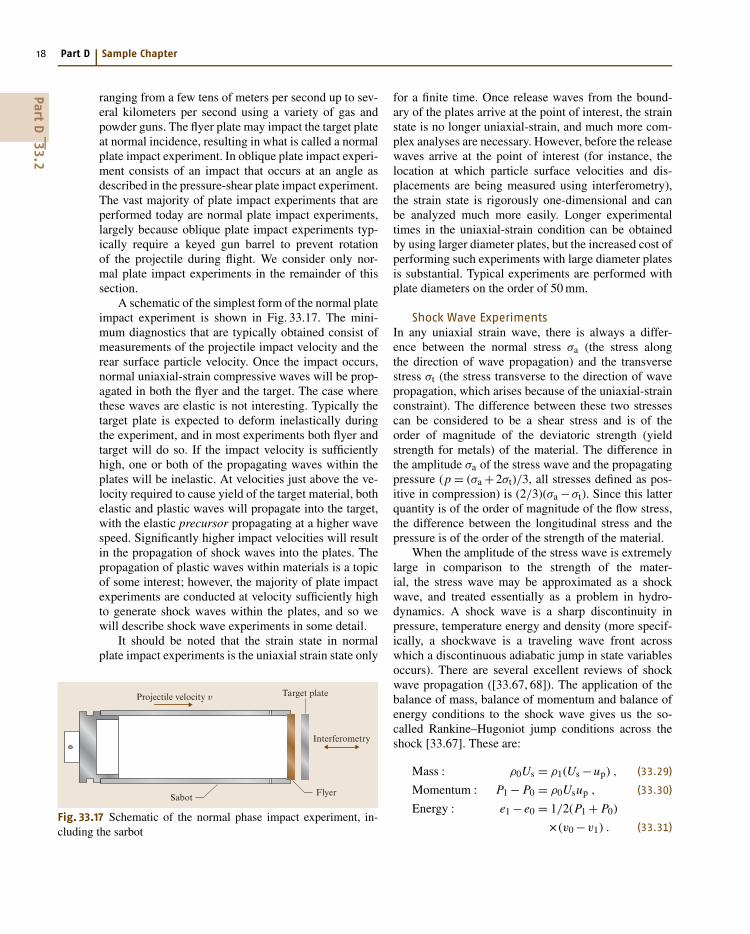
A schematic of the simplest form of the normal plateimpact experiment is shown in Fig. 33.17. The mini-mum diagnostics that are typically obtained consist ofmeasurements of the projectile impact velocity and therear surface particle velocity. Once the impact occurs,normal uniaxial-strain compressive waves will be prop-agated in both the flyer and the target. The case wherethese waves are elastic is not interesting. Typically thetarget plate is expected to deform inelastically duringthe experiment, and in most experiments both flyer andtarget will do so. If the impact velocity is sufficientlyhigh, one or both of the propagating waves within theplates will be inelastic. At velocities just above the ve-locity required to cause yield of the target material, bothelastic and plastic waves will propagate into the target,with the elastic precursor propagating at a higher wavespeed. Significantly higher impact velocities will resultin the propagation of shock waves into the plates. Thepropagation of plastic waves within materials is a topicof some interest; however, the majority of plate impactexperiments are conducted at velocity sufficiently highto generate shock waves within the plates, and so wewill describe shock wave experiments in some detail.
It should be noted that the strain state in normalplate impact experiments is the uniaxial strain state only
Projectile velocity υ
Interferometry
Target plate
FlyerSabot
Fig. 33.17 Schematic of the normal phase impact experiment, in-cluding the sarbot
for a finite time. Once release waves from the bound-ary of the plates arrive at the point of interest, the strainstate is no longer uniaxial-strain, and much more com-plex analyses are necessary. However, before the releasewaves arrive at the point of interest (for instance, thelocation at which particle surface velocities and dis-placements are being measured using interferometry),the strain state is rigorously one-dimensional and canbe analyzed much more easily. Longer experimentaltimes in the uniaxial-strain condition can be obtainedby using larger diameter plates, but the increased cost ofperforming such experiments with large diameter platesis substantial. Typical experiments are performed withplate diameters on the order of 50 mm.
Shock Wave ExperimentsIn any uniaxial strain wave, there is always a differ-ence between the normal stress σa (the stress alongthe direction of wave propagation) and the transversestress σt (the stress transverse to the direction of wavepropagation, which arises because of the uniaxial-strainconstraint). The difference between these two stressescan be considered to be a shear stress and is of theorder of magnitude of the deviatoric strength (yieldstrength for metals) of the material. The difference inthe amplitude σa of the stress wave and the propagatingpressure (p = (σa +2σt)/3, all stresses defined as pos-itive in compression) is (2/3)(σa −σt). Since this latterquantity is of the order of magnitude of the flow stress,the difference between the longitudinal stress and thepressure is of the order of the strength of the material.
When the amplitude of the stress wave is extremelylarge in comparison to the strength of the mater-ial, the stress wave may be approximated as a shockwave, and treated essentially as a problem in hydro-dynamics. A shock wave is a sharp discontinuity inpressure, temperature energy and density (more specif-ically, a shockwave is a traveling wave front acrosswhich a discontinuous adiabatic jump in state variablesoccurs). There are several excellent reviews of shockwave propagation ([33.67, 68]). The application of thebalance of mass, balance of momentum and balance ofenergy conditions to the shock wave gives us the so-called Rankine–Hugoniot jump conditions across theshock [33.67]. These are:
Mass : ρ0Us = ρ1(Us −up) , (33.29)
Momentum : P1 − P0 = ρ0Usup , (33.30)
Energy : e1 − e0 = 1/2(P1 + P0)
× (v0 −v1) . (33.31)
PartD
33.2
High Strain Rate and Impact Experiments 33.2 Wave Propagation Experiments 19
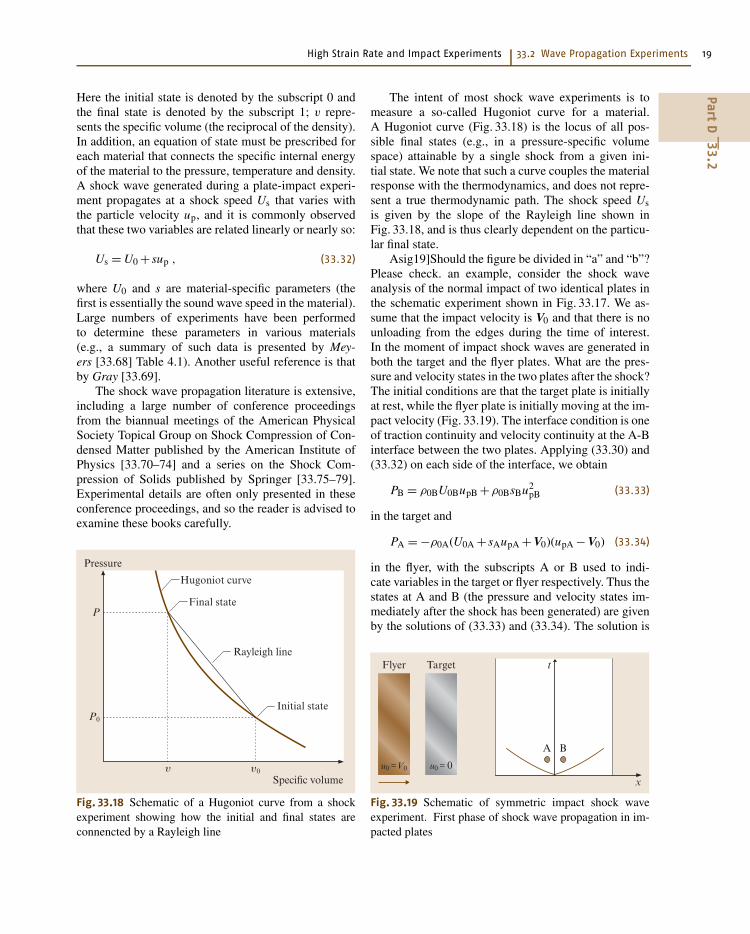
Here the initial state is denoted by the subscript 0 andthe final state is denoted by the subscript 1; v repre-sents the specific volume (the reciprocal of the density).In addition, an equation of state must be prescribed foreach material that connects the specific internal energyof the material to the pressure, temperature and density.A shock wave generated during a plate-impact experi-ment propagates at a shock speed Us that varies withthe particle velocity up, and it is commonly observedthat these two variables are related linearly or nearly so:
Us = U0 + sup , (33.32)
where U0 and s are material-specific parameters (thefirst is essentially the sound wave speed in the material).Large numbers of experiments have been performedto determine these parameters in various materials(e.g., a summary of such data is presented by Mey-ers [33.68] Table 4.1). Another useful reference is thatby Gray [33.69].
The shock wave propagation literature is extensive,including a large number of conference proceedingsfrom the biannual meetings of the American PhysicalSociety Topical Group on Shock Compression of Con-densed Matter published by the American Institute ofPhysics [33.70–74] and a series on the Shock Com-pression of Solids published by Springer [33.75–79].Experimental details are often only presented in theseconference proceedings, and so the reader is advised toexamine these books carefully.
Pressure
Specific volume
Final state
Rayleigh line
P0
P
υ υ0
Initial state
Hugoniot curve
Fig. 33.18 Schematic of a Hugoniot curve from a shockexperiment showing how the initial and final states areconnencted by a Rayleigh line
The intent of most shock wave experiments is tomeasure a so-called Hugoniot curve for a material.A Hugoniot curve (Fig. 33.18) is the locus of all pos-sible final states (e.g., in a pressure-specific volumespace) attainable by a single shock from a given ini-tial state. We note that such a curve couples the materialresponse with the thermodynamics, and does not repre-sent a true thermodynamic path. The shock speed Usis given by the slope of the Rayleigh line shown inFig. 33.18, and is thus clearly dependent on the particu-lar final state.
Asig19]Should the figure be divided in “a” and “b”?Please check. an example, consider the shock waveanalysis of the normal impact of two identical plates inthe schematic experiment shown in Fig. 33.17. We as-sume that the impact velocity is V0 and that there is nounloading from the edges during the time of interest.In the moment of impact shock waves are generated inboth the target and the flyer plates. What are the pres-sure and velocity states in the two plates after the shock?The initial conditions are that the target plate is initiallyat rest, while the flyer plate is initially moving at the im-pact velocity (Fig. 33.19). The interface condition is oneof traction continuity and velocity continuity at the A-Binterface between the two plates. Applying (33.30) and(33.32) on each side of the interface, we obtain
PB = ρ0BU0BupB +ρ0BsBu2pB (33.33)
in the target and
PA = −ρ0A(U0A + sAupA + V0)(upA − V0) (33.34)
in the flyer, with the subscripts A or B used to indi-cate variables in the target or flyer respectively. Thus thestates at A and B (the pressure and velocity states im-mediately after the shock has been generated) are givenby the solutions of (33.33) and (33.34). The solution is
Flyer
u0 =V0
Target
u0 = 0
x
t
A B
Fig. 33.19 Schematic of symmetric impact shock waveexperiment. First phase of shock wave propagation in im-pacted plates
PartD
33.2
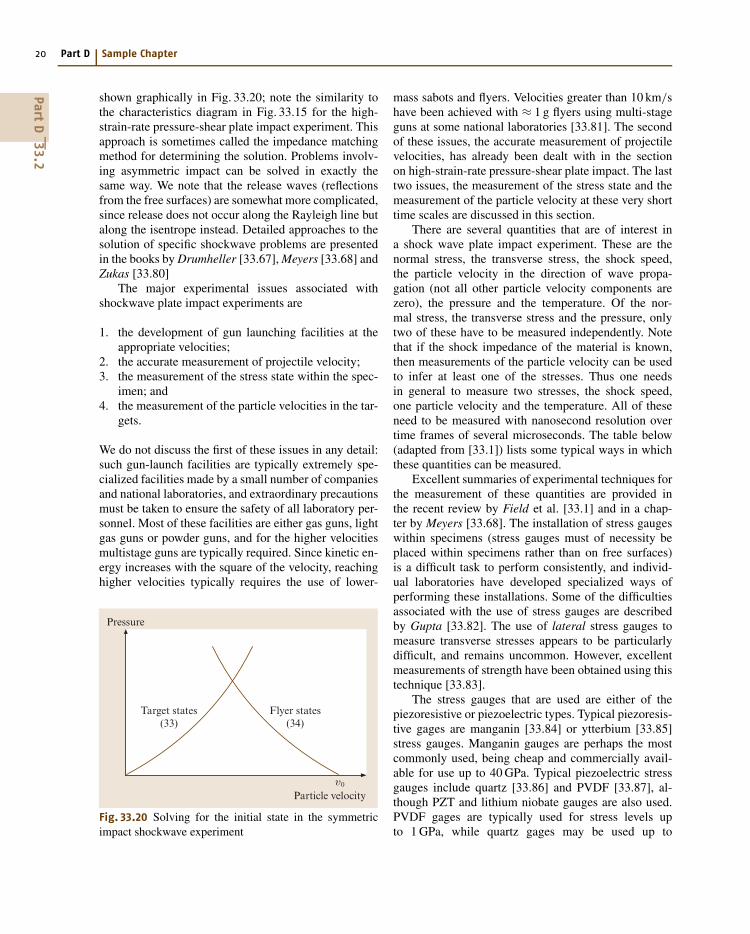
20 Part D Sample Chapter
shown graphically in Fig. 33.20; note the similarity tothe characteristics diagram in Fig. 33.15 for the high-strain-rate pressure-shear plate impact experiment. Thisapproach is sometimes called the impedance matchingmethod for determining the solution. Problems involv-ing asymmetric impact can be solved in exactly thesame way. We note that the release waves (reflectionsfrom the free surfaces) are somewhat more complicated,since release does not occur along the Rayleigh line butalong the isentrope instead. Detailed approaches to thesolution of specific shockwave problems are presentedin the books by Drumheller [33.67], Meyers [33.68] andZukas [33.80]
The major experimental issues associated withshockwave plate impact experiments are
1. the development of gun launching facilities at theappropriate velocities;
2. the accurate measurement of projectile velocity;3. the measurement of the stress state within the spec-
imen; and4. the measurement of the particle velocities in the tar-
gets.
We do not discuss the first of these issues in any detail:such gun-launch facilities are typically extremely spe-cialized facilities made by a small number of companiesand national laboratories, and extraordinary precautionsmust be taken to ensure the safety of all laboratory per-sonnel. Most of these facilities are either gas guns, lightgas guns or powder guns, and for the higher velocitiesmultistage guns are typically required. Since kinetic en-ergy increases with the square of the velocity, reachinghigher velocities typically requires the use of lower-
Pressure
Particle velocityυ0
Flyer states(34)
Target states(33)
Fig. 33.20 Solving for the initial state in the symmetricimpact shockwave experiment
mass sabots and flyers. Velocities greater than 10 km/shave been achieved with ≈ 1 g flyers using multi-stageguns at some national laboratories [33.81]. The secondof these issues, the accurate measurement of projectilevelocities, has already been dealt with in the sectionon high-strain-rate pressure-shear plate impact. The lasttwo issues, the measurement of the stress state and themeasurement of the particle velocity at these very shorttime scales are discussed in this section.
There are several quantities that are of interest ina shock wave plate impact experiment. These are thenormal stress, the transverse stress, the shock speed,the particle velocity in the direction of wave propa-gation (not all other particle velocity components arezero), the pressure and the temperature. Of the nor-mal stress, the transverse stress and the pressure, onlytwo of these have to be measured independently. Notethat if the shock impedance of the material is known,then measurements of the particle velocity can be usedto infer at least one of the stresses. Thus one needsin general to measure two stresses, the shock speed,one particle velocity and the temperature. All of theseneed to be measured with nanosecond resolution overtime frames of several microseconds. The table below(adapted from [33.1]) lists some typical ways in whichthese quantities can be measured.
Excellent summaries of experimental techniques forthe measurement of these quantities are provided inthe recent review by Field et al. [33.1] and in a chap-ter by Meyers [33.68]. The installation of stress gaugeswithin specimens (stress gauges must of necessity beplaced within specimens rather than on free surfaces)is a difficult task to perform consistently, and individ-ual laboratories have developed specialized ways ofperforming these installations. Some of the difficultiesassociated with the use of stress gauges are describedby Gupta [33.82]. The use of lateral stress gauges tomeasure transverse stresses appears to be particularlydifficult, and remains uncommon. However, excellentmeasurements of strength have been obtained using thistechnique [33.83].
The stress gauges that are used are either of thepiezoresistive or piezoelectric types. Typical piezoresis-tive gages are manganin [33.84] or ytterbium [33.85]stress gauges. Manganin gauges are perhaps the mostcommonly used, being cheap and commercially avail-able for use up to 40 GPa. Typical piezoelectric stressgauges include quartz [33.86] and PVDF [33.87], al-though PZT and lithium niobate gauges are also used.PVDF gages are typically used for stress levels upto 1 GPa, while quartz gages may be used up to
PartD
33.2

High Strain Rate and Impact Experiments 33.4 Dynamic Failure Experiments 21
5 GPa. The particle velocity on the rear surface of thetarget is typically measured using laser interferome-try. The rear surface may be a free surface, or maybe interrogated through a transparent window mater-ial. The most common approach to performing suchinterferometry is using the velocity interferometer sys-tem for any reflector (VISAR) developed by Barkeret al. [33.88–90]. Versions of the system that usefiber optic probes, and versions that can provide datafrom multiple points (the so-called Line VISAR) havebeen developed; the latter can be used to look at het-
erogeneous wave structures [33.91]. Most shockwaveexperiments are designed to provide a one-dimensionalstrain state, so that single-point measurements shouldbe representative of the events. However, some of thephenomena that develop during shock wave propaga-tion lead to heterogeneous structures. These includethe development of failure waves and spallation. Insuch circumstances, it is a distinct advantage to beable to obtain full field information using high-speedphotography (this is most useful for transparent mater-ials) [33.92].
33.3 Taylor Impact Experiments
The most commonly used direct impact experimentis the Taylor impact experiment. The experiment in-volves the impact (at normal incidence) of a rod ontoa plate (assumed to be nearly rigid). Substantial dy-namic deformations are developed at the site of theimpact, leading to a local expansion of the rod andthe development of a final shape that depends on theimpact velocity and on the properties of the materialof the rod. An alternative version of the Taylor im-pact experiment involves a symmetric impact of tworods. The Taylor impact experiment has the advan-tage that it is extremely simple to perform. All thatis needed is a facility for launching the rod at the de-
sired velocity, and the ability to measure the deformedshape of the rod. However, the experiment has thedisadvantage that it essentially represents an inverseproblem: one must try to determine material propertieson the basis of the macroscopic measure of an inho-mogeneous deformation. Several improvements havebeen made to this experiment, including the use ofhigh-speed photography to measure the process of de-formation rather than simply the final deformation, andtechniques for measuring the internal hardness variationwithin sections of the deformed bar. An excellent reviewof the Taylor impact experiment is provided by Fieldet al. [33.1].
33.4 Dynamic Failure Experiments
One must distinguish between the kinds of experimentsneeded to understand the deformation of a material andthe kinds of experiments needed to understand a failureprocess within the material or structure. The former aremost easily studied with experimental techniques thatdevelop homogeneous stress fields, homogeneous strainfields and well-controlled loading. In such experiments,as in the high-strain-rate experiments described earlierin this chapter, as the deformation evolves, the stressfields and deformation fields remain nearly homoge-neous, and a small number of measurements (typicallysingle point or area averaged measurements) are suffi-cient to obtain information about the deformation andstress fields of interest. However, once a failure pro-cess begins in the material, the deformation field rapidlybecomes localized, and the experimental techniquesused to extract information using single-point or area-
averaged measurements no longer provide adequateinformation. Understanding the failure process typicallyrequires a different suite of experimental measurements,and often requires a completely different experimentaldesign.
A simple example of this can be seen in the caseof fracture: the uniaxial tension experiment is very welldeveloped for the measurement of material behavior un-der uniaxial tension, but the utility of this experiment todetermine the ability of the material to resist the propa-gation of cracks is minimal. Instead, specially designedfracture experiments are required. This is one reasonwhy, although material scientists have a great affectionfor the simple tension experiment, they find it difficult toextract useful information about the toughness of a ma-terial by examining the elongation of the specimen intension. A similar situation arises when understanding
PartD
33.4
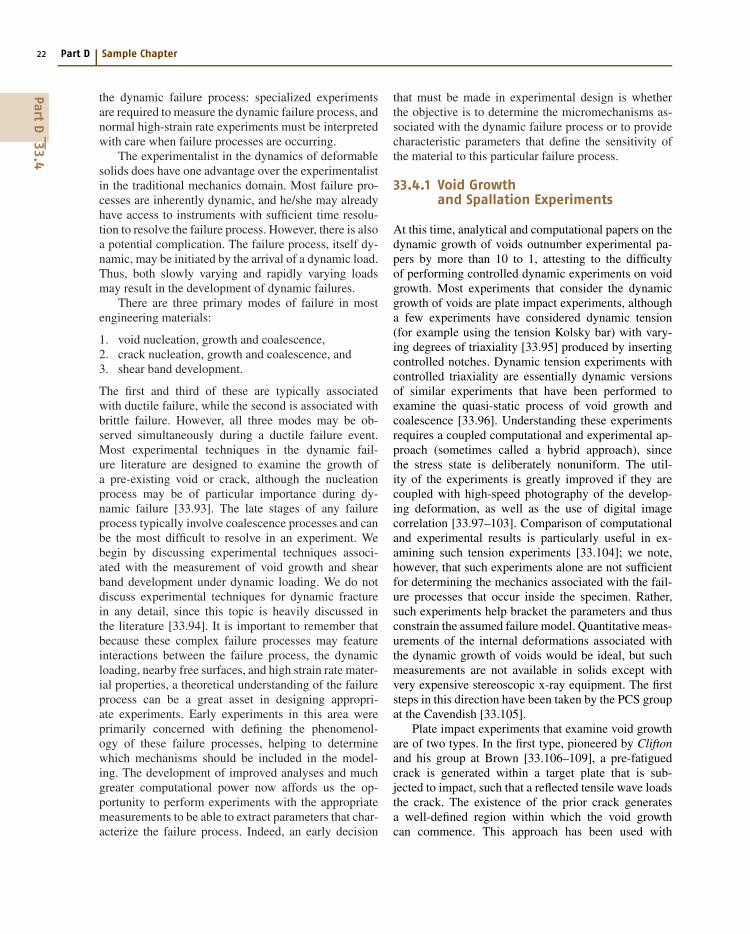
22 Part D Sample Chapter
the dynamic failure process: specialized experimentsare required to measure the dynamic failure process, andnormal high-strain rate experiments must be interpretedwith care when failure processes are occurring.
The experimentalist in the dynamics of deformablesolids does have one advantage over the experimentalistin the traditional mechanics domain. Most failure pro-cesses are inherently dynamic, and he/she may alreadyhave access to instruments with sufficient time resolu-tion to resolve the failure process. However, there is alsoa potential complication. The failure process, itself dy-namic, may be initiated by the arrival of a dynamic load.Thus, both slowly varying and rapidly varying loadsmay result in the development of dynamic failures.
There are three primary modes of failure in mostengineering materials:
1. void nucleation, growth and coalescence,2. crack nucleation, growth and coalescence, and3. shear band development.
The first and third of these are typically associatedwith ductile failure, while the second is associated withbrittle failure. However, all three modes may be ob-served simultaneously during a ductile failure event.Most experimental techniques in the dynamic fail-ure literature are designed to examine the growth ofa pre-existing void or crack, although the nucleationprocess may be of particular importance during dy-namic failure [33.93]. The late stages of any failureprocess typically involve coalescence processes and canbe the most difficult to resolve in an experiment. Webegin by discussing experimental techniques associ-ated with the measurement of void growth and shearband development under dynamic loading. We do notdiscuss experimental techniques for dynamic fracturein any detail, since this topic is heavily discussed inthe literature [33.94]. It is important to remember thatbecause these complex failure processes may featureinteractions between the failure process, the dynamicloading, nearby free surfaces, and high strain rate mater-ial properties, a theoretical understanding of the failureprocess can be a great asset in designing appropri-ate experiments. Early experiments in this area wereprimarily concerned with defining the phenomenol-ogy of these failure processes, helping to determinewhich mechanisms should be included in the model-ing. The development of improved analyses and muchgreater computational power now affords us the op-portunity to perform experiments with the appropriatemeasurements to be able to extract parameters that char-acterize the failure process. Indeed, an early decision
that must be made in experimental design is whetherthe objective is to determine the micromechanisms as-sociated with the dynamic failure process or to providecharacteristic parameters that define the sensitivity ofthe material to this particular failure process.
33.4.1 Void Growthand Spallation Experiments
At this time, analytical and computational papers on thedynamic growth of voids outnumber experimental pa-pers by more than 10 to 1, attesting to the difficultyof performing controlled dynamic experiments on voidgrowth. Most experiments that consider the dynamicgrowth of voids are plate impact experiments, althougha few experiments have considered dynamic tension(for example using the tension Kolsky bar) with vary-ing degrees of triaxiality [33.95] produced by insertingcontrolled notches. Dynamic tension experiments withcontrolled triaxiality are essentially dynamic versionsof similar experiments that have been performed toexamine the quasi-static process of void growth andcoalescence [33.96]. Understanding these experimentsrequires a coupled computational and experimental ap-proach (sometimes called a hybrid approach), sincethe stress state is deliberately nonuniform. The util-ity of the experiments is greatly improved if they arecoupled with high-speed photography of the develop-ing deformation, as well as the use of digital imagecorrelation [33.97–103]. Comparison of computationaland experimental results is particularly useful in ex-amining such tension experiments [33.104]; we note,however, that such experiments alone are not sufficientfor determining the mechanics associated with the fail-ure processes that occur inside the specimen. Rather,such experiments help bracket the parameters and thusconstrain the assumed failure model. Quantitative meas-urements of the internal deformations associated withthe dynamic growth of voids would be ideal, but suchmeasurements are not available in solids except withvery expensive stereoscopic x-ray equipment. The firststeps in this direction have been taken by the PCS groupat the Cavendish [33.105].
Plate impact experiments that examine void growthare of two types. In the first type, pioneered by Cliftonand his group at Brown [33.106–109], a pre-fatiguedcrack is generated within a target plate that is sub-jected to impact, such that a reflected tensile wave loadsthe crack. The existence of the prior crack generatesa well-defined region within which the void growthcan commence. This approach has been used with
PartD
33.4
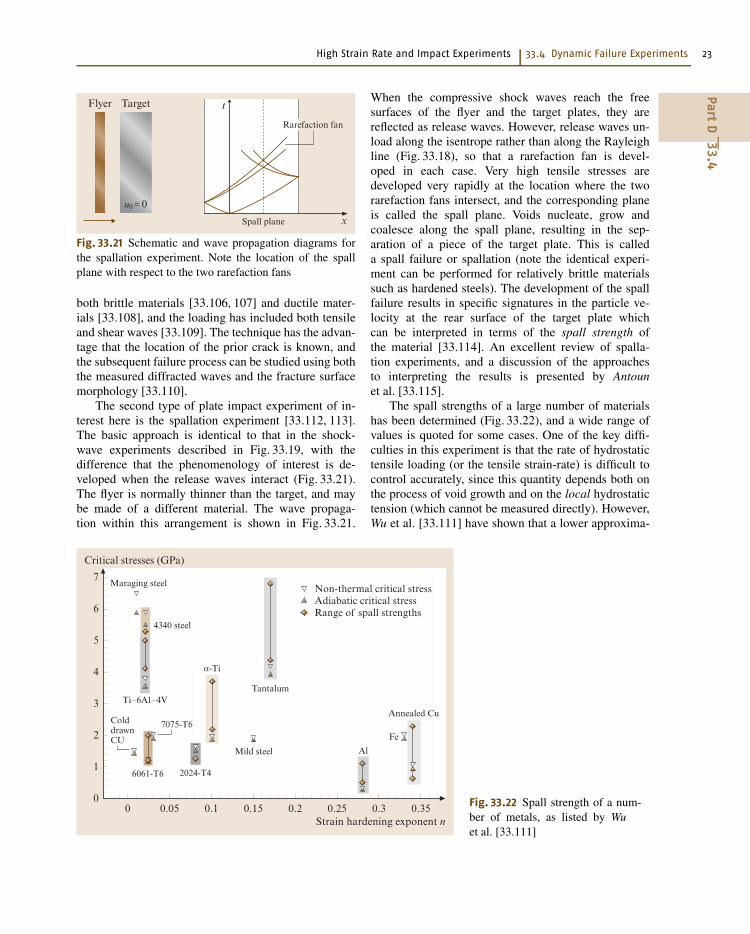
High Strain Rate and Impact Experiments 33.4 Dynamic Failure Experiments 23
Flyer Target
u0 = 0
x
t
Spall plane
Rarefaction fan
Fig. 33.21 Schematic and wave propagation diagrams forthe spallation experiment. Note the location of the spallplane with respect to the two rarefaction fans
both brittle materials [33.106, 107] and ductile mater-ials [33.108], and the loading has included both tensileand shear waves [33.109]. The technique has the advan-tage that the location of the prior crack is known, andthe subsequent failure process can be studied using boththe measured diffracted waves and the fracture surfacemorphology [33.110].
The second type of plate impact experiment of in-terest here is the spallation experiment [33.112, 113].The basic approach is identical to that in the shock-wave experiments described in Fig. 33.19, with thedifference that the phenomenology of interest is de-veloped when the release waves interact (Fig. 33.21).The flyer is normally thinner than the target, and maybe made of a different material. The wave propaga-tion within this arrangement is shown in Fig. 33.21.
0 0.05 0.1 0.15
Tantalum
Mild steel
Maraging steel
ColddrawnCU
7075-T6
4340 steel
2024-T46061-T6
Ti–6Al–4V
Al
α-Ti
Fe
Annealed Cu
0.2 0.25 0.3 0.35
Critical stresses (GPa)
Strain hardening exponent n
7
6
5
4
3
2
1
0
Non-thermal critical stressAdiabatic critical stressRange of spall strengths
Fig. 33.22 Spall strength of a num-ber of metals, as listed by Wuet al. [33.111]
When the compressive shock waves reach the freesurfaces of the flyer and the target plates, they arereflected as release waves. However, release waves un-load along the isentrope rather than along the Rayleighline (Fig. 33.18), so that a rarefaction fan is devel-oped in each case. Very high tensile stresses aredeveloped very rapidly at the location where the tworarefaction fans intersect, and the corresponding planeis called the spall plane. Voids nucleate, grow andcoalesce along the spall plane, resulting in the sep-aration of a piece of the target plate. This is calleda spall failure or spallation (note the identical experi-ment can be performed for relatively brittle materialssuch as hardened steels). The development of the spallfailure results in specific signatures in the particle ve-locity at the rear surface of the target plate whichcan be interpreted in terms of the spall strength ofthe material [33.114]. An excellent review of spalla-tion experiments, and a discussion of the approachesto interpreting the results is presented by Antounet al. [33.115].
The spall strengths of a large number of materialshas been determined (Fig. 33.22), and a wide range ofvalues is quoted for some cases. One of the key diffi-culties in this experiment is that the rate of hydrostatictensile loading (or the tensile strain-rate) is difficult tocontrol accurately, since this quantity depends both onthe process of void growth and on the local hydrostatictension (which cannot be measured directly). However,Wu et al. [33.111] have shown that a lower approxima-
PartD
33.4
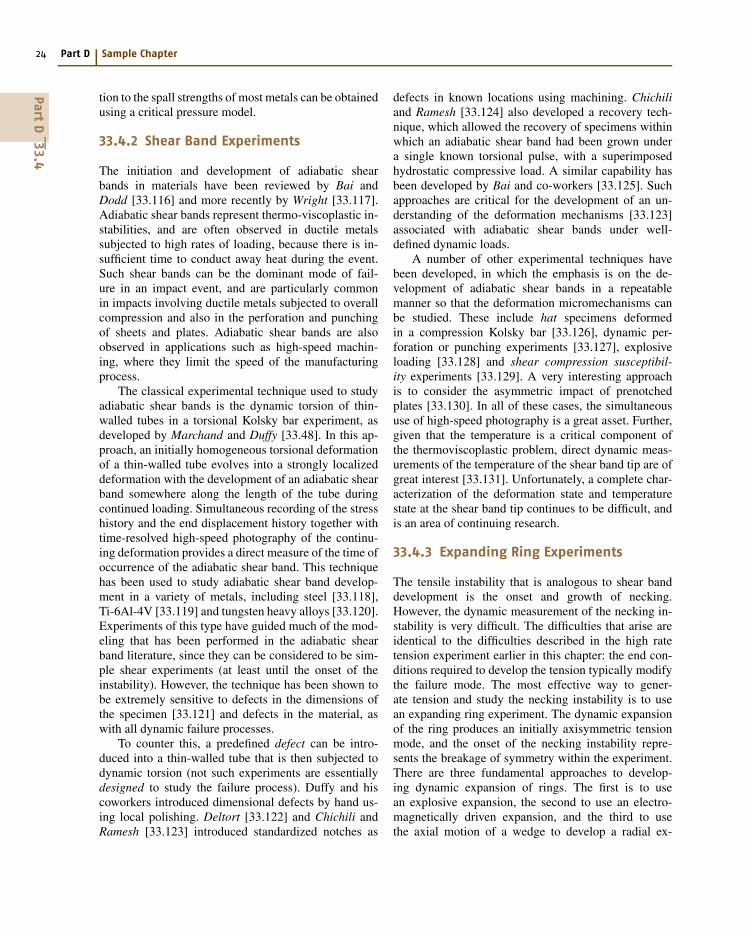
24 Part D Sample Chapter
tion to the spall strengths of most metals can be obtainedusing a critical pressure model.
33.4.2 Shear Band Experiments
The initiation and development of adiabatic shearbands in materials have been reviewed by Bai andDodd [33.116] and more recently by Wright [33.117].Adiabatic shear bands represent thermo-viscoplastic in-stabilities, and are often observed in ductile metalssubjected to high rates of loading, because there is in-sufficient time to conduct away heat during the event.Such shear bands can be the dominant mode of fail-ure in an impact event, and are particularly commonin impacts involving ductile metals subjected to overallcompression and also in the perforation and punchingof sheets and plates. Adiabatic shear bands are alsoobserved in applications such as high-speed machin-ing, where they limit the speed of the manufacturingprocess.
The classical experimental technique used to studyadiabatic shear bands is the dynamic torsion of thin-walled tubes in a torsional Kolsky bar experiment, asdeveloped by Marchand and Duffy [33.48]. In this ap-proach, an initially homogeneous torsional deformationof a thin-walled tube evolves into a strongly localizeddeformation with the development of an adiabatic shearband somewhere along the length of the tube duringcontinued loading. Simultaneous recording of the stresshistory and the end displacement history together withtime-resolved high-speed photography of the continu-ing deformation provides a direct measure of the time ofoccurrence of the adiabatic shear band. This techniquehas been used to study adiabatic shear band develop-ment in a variety of metals, including steel [33.118],Ti-6Al-4V [33.119] and tungsten heavy alloys [33.120].Experiments of this type have guided much of the mod-eling that has been performed in the adiabatic shearband literature, since they can be considered to be sim-ple shear experiments (at least until the onset of theinstability). However, the technique has been shown tobe extremely sensitive to defects in the dimensions ofthe specimen [33.121] and defects in the material, aswith all dynamic failure processes.
To counter this, a predefined defect can be intro-duced into a thin-walled tube that is then subjected todynamic torsion (not such experiments are essentiallydesigned to study the failure process). Duffy and hiscoworkers introduced dimensional defects by hand us-ing local polishing. Deltort [33.122] and Chichili andRamesh [33.123] introduced standardized notches as
defects in known locations using machining. Chichiliand Ramesh [33.124] also developed a recovery tech-nique, which allowed the recovery of specimens withinwhich an adiabatic shear band had been grown undera single known torsional pulse, with a superimposedhydrostatic compressive load. A similar capability hasbeen developed by Bai and co-workers [33.125]. Suchapproaches are critical for the development of an un-derstanding of the deformation mechanisms [33.123]associated with adiabatic shear bands under well-defined dynamic loads.
A number of other experimental techniques havebeen developed, in which the emphasis is on the de-velopment of adiabatic shear bands in a repeatablemanner so that the deformation micromechanisms canbe studied. These include hat specimens deformedin a compression Kolsky bar [33.126], dynamic per-foration or punching experiments [33.127], explosiveloading [33.128] and shear compression susceptibil-ity experiments [33.129]. A very interesting approachis to consider the asymmetric impact of prenotchedplates [33.130]. In all of these cases, the simultaneoususe of high-speed photography is a great asset. Further,given that the temperature is a critical component ofthe thermoviscoplastic problem, direct dynamic meas-urements of the temperature of the shear band tip are ofgreat interest [33.131]. Unfortunately, a complete char-acterization of the deformation state and temperaturestate at the shear band tip continues to be difficult, andis an area of continuing research.
33.4.3 Expanding Ring Experiments
The tensile instability that is analogous to shear banddevelopment is the onset and growth of necking.However, the dynamic measurement of the necking in-stability is very difficult. The difficulties that arise areidentical to the difficulties described in the high ratetension experiment earlier in this chapter: the end con-ditions required to develop the tension typically modifythe failure mode. The most effective way to gener-ate tension and study the necking instability is to usean expanding ring experiment. The dynamic expansionof the ring produces an initially axisymmetric tensionmode, and the onset of the necking instability repre-sents the breakage of symmetry within the experiment.There are three fundamental approaches to develop-ing dynamic expansion of rings. The first is to usean explosive expansion, the second to use an electro-magnetically driven expansion, and the third to usethe axial motion of a wedge to develop a radial ex-
PartD
33.4
High Strain Rate and Impact Experiments 33.5 Further Reading 25
pansion of an enclosing ring. In practice, the first andthird approaches are very difficult to control. Thus theprimary experimental method available for expandingrings is that of electromagnetic launch [33.132–137].This approach is often used to examine the develop-ment of tensile fragmentation in metallic systems, andhas recently been coupled with high-speed photogra-phy to provide unprecedented detail of the dynamicnecking process [33.138]. Although these experimentsare extremely difficult to perform, the analysis of suchexperiments is very attractive to the theoretician and hasthe benefit of providing a great deal of insight (a re-cent analysis is presented by Zhou et al. [33.139] forthe brittle case and by Guduru and Freund [33.140] forthe ductile case). Related experiments involve explosiveloading to generate expanding cylinders [33.141].
33.4.4 Dynamic Fracture Experiments
We do not discuss experimental techniques for dynamicfracture in any detail, since this topic is heavily dis-cussed in the literature [33.142–146] and there is a veryrecent book on the subject [33.94]. Unlike quasi staticfracture testing, dynamic fracture testing does not havean accepted set of testing standards. Thus there area wide variety of specimen geometries, constraints, andloading conditions in use [33.94]. Most of these havein common the generation of a pre-fatigued crack andan attempt to measure the K-dominated crack-tip stress,
strain or deformation fields, typically using optical diag-nostics and/or high-speed photography. The specimensare often impulsively loaded using a Kolsky bar typeconfiguration, or by direct impact in either 3-pointbend, 1-point bend or asymmetric impact configurations(the Kalthoff experiment [33.147]). Useful results canalso be obtained with crack opening measurements andproperly located strain gauges [33.148], but it can beextremely difficult to identify the onset of crack prop-agation from the signals. The more commonly usedoptical diagnostics include photoelasticity [33.149],caustics [33.150], dynamic moiré [33.151], and coher-ent gradient sensing [33.152].
33.4.5 Charpy Impact Testing
Relatively rapid measures of the dynamic toughness ofa material can be obtained using the ASTM standardCharpy impact test (ASTM E23-06). The techniqueessentially uses a notched bar for a specimen anda pendulum machine as an impacting device. Commer-cial pendulum machines are available to perform suchexperiments. There is also a NIST recommended guidefor maintaining Charpy impact machines, NIST Spe-cial Publication 960-4. Versions of these devices havebeen developed for subscale testing, as well as for thetesting of polymers. A recent reference book on pen-dulum impact machines has also been published byASTM [33.153].
33.5 Further Reading
• Antounauthor]Please check the authors name.,G.I. Kanel: Spall Fracture (Springer, New York2004)• Y.L. Bai, B. Dodd: Adiabatic Shear Localization:Occurrence, Theories and Applications (Pergamon,Oxford 1992)• D.S. Drumheller: Introduction to Wave Propagationin Nonlinear Fluids and Solids (Cambridge Univ.Press, Cambridge 1998)• J.E. Field, : Review of experimental techniques forhigh rate deformation and shock studies, Int. J. Imp.Eng. 30, 725–775 (2004)• G.T. Gray III: Classic Split-Hopkinson pressure bartesting. In: ASM Handbook, Vol. 8, ed. by H. Kuhn,D. Medlin, (ASM Int., Materials Park Ohio 2000)pp. 462–476• K.A. Hartley, J. Duffy, R.H. Hawley: The torsionalKolsky (Split-Hopkinson) bar. In: ASM Handbook,
Vol. 8, ed. by H. Kuhn, D. Medlin, (ASM Int., Ma-terials Park Ohio 1985) pp. 218–228• R.W. Klopp, R.J. Clifton: Pressure-shear plate im-pact testing. In: ASM Handbook, Vol. 8, ed. byH. Kuhn, D. Medlin, (ASM Int., Materials ParkOhio 1985) pp. 230–239• M.A. Meyers: Dynamic Behavior of Materials (Wi-ley Interscience, New York 1994)• T. Nicholas, A.M. Rajendran: Material characteri-zation at high strain-rates. In: High Velocity ImpactDynamics, ed. by J.A. Zukas 1990, (Wiley, NewYork 1990) pp. 127–296• K. Ravi-Chandar: Dynamic Fracture (Elsevier, Am-sterdam 2004)• T.W. Wright: The Mathematical Theory of Adia-batic Shear Bands (Cambridge Univ. Press, Cam-bridge 2002)
PartD
33.5
26 Part D Sample Chapter
References
33.1 J.E. Field, : Review of experimental techniques forhigh rate deformation and shock studies, Int. J.Imp. Eng. 30, 725–775 (2004)
33.2 C.S. Coffey, V.F. DeVost: Drop weight impactmachines: a review of recent progress, JANNAFPropulsion Systems Hazards Subcommittee MeetingCPIA Publ., 1(446), 527–531 (1986)
33.3 J.D. Winkel, D.F. Adams: Instrumented drop weightimpact testing of cross-ply and fabric composites,Composites 16(4), 268–278 (1985)
33.4 N. Banthia, : Impact testing of concrete using adrop-weight impact machine, Exp. Mech. 29(1),63–69 (1989)
33.5 P.R. Sreenivasan, : Determination of K(Id) at or be-low NDTT using instrumented drop-weight testing,Int. J. Fract. 55(3), 273–283 (1992)
33.6 C.S. Coffey, V.F. Devost: Impact testing of explosivesand propellants, Propellants Explosives Pyrotech-nics 20(3), 105–115 (1995)
33.7 H.M. Hsiao, I.M. Daniel, R.D. Cordes: Dynamic com-pressive behavior of thick composite materials,Exp. Mech. 38(3), 172–180 (1998)
33.8 T. Nicholas, A.M. Rajendran: Material characteriza-tion at high strain-rates. In: High Velocity ImpactDynamics, ed. by J.A. Zukas (Wiley, New York 1990)pp. 127–296
33.9 S.M. Walley, J.E. Field: Strain rate sensitivity ofpolymers in compression from low to high strainrates, DYMAT J. 1, 211–228 (1994)
33.10 G. Ravichandran, G. Subhash: A micromechanicalmodel for high strain rate behavior of ceramics,Int. J. Sol. Struct. 32, 2627–2646 (1995)
33.11 D. Jia, K.T. Ramesh, E. Ma: Effects of nanocrystallineand ultrafine grain sizes on constitutive behaviorand shear bands in iron, Acta Mater. 51(12), 3495–3509 (2003)
33.12 H. Kolsky: An investigation of the mechanical prop-erties of materials at very high rates of loading,Proceedings of the Physical Society, Vol. 62B (Lon-don, 1949) p. 676
33.13 G.T. Gray III: Classic split-Hopkinson pressure bartesting. In: ASM Handbook, Vol. 8, ed. by H. Kuhn,D. Medlin (ASM Int., Materials Park Ohio 2000)pp. 462–476
33.14 K.T. Ramesh, S. Narasimhan: Finite deformationsand the dynamic measurement of radial strainsin compression Kolsky bar experiments, Int. J. Sol.Struct. 33(20), 3723–3738 (1996)
33.15 T.S. Lok, : Testing and response of large diameterbrittle materials subjected to high strain rate, J.Mat. Civil Eng. 14(3), 262–269 (2002)
33.16 D. Jia, K.T. Ramesh: A rigorous assessment of thebenefits of miniaturization in the Kolsky bar sys-tem, Exp. Mech. 44(5), 445–454 (2004)
33.17 E.D.H. Davies, S.C. Hunter: The dynamic compres-sion testing of solids by the method of the splitHopkinson pressure bar (SHPB), J. Mech. Phys.Solids 11, 155–179 (1963)
33.18 J.F. Bell: An experimental diffraction grating studyof the quasi-static hypothesis of the SHPB experi-ment, J. Mech. Phys. Solids 14, 309–327 (1966)
33.19 L.D. Bertholf, C.H. Karnes: Two dimensional anal-ysis of the split Hopkinson pressure bar system, J.Mech. Phys. Solids 23, 1–19 (1975)
33.20 A.S.E., : Standard test method of compression test-ing of metallic at room temperature (pub]Pleaseadd the publisher., place]Please add the place ofpublishing. 1999)
33.21 F. Wang, J.G. Lenard: An experimental study ofinterfacial friction-hot ring compression, Trans.ASME: J. Eng. Mater. Technol. 114, 13–18 (1992)
33.22 R. Skalak: Longitudinal impact of a semi-infinitecircular elastic bar, J. Appl. Mech. 24, 59–64 (1957)
33.23 D.J. Frew, M.J. Forrestal, W. Chen: Pulse shapingtechniques for testing brittle materials with a splitHopkinson pressure bar, Exper. Mech. 42, 93–106(2002)
33.24 D.A. Gorham: Specimen inertia in high strain-ratecompression, J. Phys. D 22, 1888–1893 (1989)
33.25 J.Z. Malinowski, J.R. Klepaczko: A unified analyticand numerical approach to specimen behaviour inthe SHPB, Int. J. Mech. Sci. 28, 381–391 (1986)
33.26 G. Subhash, G. Ravichandran: Split-Hopkinson bartesting of ceramics. In: ASM Handbook, Vol. 8, ed.by H. Kuhn, D. Medlin, (ASM Int., Materials ParkOhio 2000) pp. 497–504
33.27 H. Wang, K.T. Ramesh: Dynamic strength and frag-mentation of hot-pressed silicon carbide underuniaxial compression, Acta mater. 52(2), 355–367(2004)
33.28 G. Subhash, G. Ravichandran: Mechanical be-haviour of a hot pressed aluminum nitride underuniaxial compression, J. Mater. Sci. 33, 1933–1939(1998)
33.29 G. Ravichandran, G. Subhash: Critical appraisal oflimiting strain rates for compression testing of ce-ramics in a split Hopkinson pressure bar, J. Amer.Ceram. Soc. 77, 263–267 (1994)
33.30 W. Chen, G. Subhash, G. Ravichandran: Evalua-tion of ceramic specimen geometries used in splitHopkinson pressure bar, DYMAT J. 1, 193–210 (1994)
33.31 W. Chen, : Dynamic compression testing of softmaterials, Trans. ASME: J. Appl. Mech. 69, 214–223(2002)
33.32 G.T. Gray III, W.R. Blumenthal: Split-Hopkinsonpressure bar testing of soft materials. In: ASMHandbook, Vol. 8, ed. by H. Kuhn, D. Medlin, (ASMInt., Materials Park Ohio 2000) pp. 462–476
PartD
33

High Strain Rate and Impact Experiments References 27
33.33 C.R. Siviour, : Are low impedance Hopkinson barsnecessary for stress equilibrium in soft materials?.In: New Experimental Methods in Material Dynam-ics and Impact, ed. by W.K. Nowacki, J.R. Klepaczko(Inst. Fund. Technol. Res., Warsaw 2001) pp. 421–427
33.34 W. Chen, F. Lu, B. Zhou: A quartz-crystal-embedded split Hopkinson pressure bar for softmaterials, Exper. Mech. 40, 1–6 (2000)
33.35 D.T. Casem, W. Fourney, P. Chang: Wave separa-tion in viscoelastic pressure bars using single-pointmeasurements of strain and velocity, Polymer Test-ing 22, 155–164 (2003)
33.36 J.L. Chiddister, L.E. Malvern: Compression-impacttesting of aluminum at elevated temperatures, Ex-per. Mech. 3, 81–90 (1963)
33.37 Z. Rosenberg, : A new technique for heating speci-mens in Split-Hopkinson-bar experiments usinginduction coil heaters, Exper. Mech. 26, 275–278(1986)
33.38 A. Gilat, X. Wu: Elevated temperature testing withthe torsional split Hopkinson bar, Exper. Mech. 34,166–170 (1994)
33.39 A.M. Lennon, K.T. Ramesh: A technique for meas-uring the dynamic behavior of materials at hightemperatures, Int. J. Plast. 14(12), 1279–1292 (1998)
33.40 S. Nemat-Nasser, J.B. Isaacs: Direct Measurementof Isothermal Flow Stress of Metals at ElevatedTemperature and High Strain Rates with Appli-cation to Ta and Ta-W Alloys, Acta Mater. 45(3),907–919 (1997)
33.41 D. Basak, : Temperature control of pulse heatedspecimens in a Kolsky bar apparatus usingmicrosecond time-resolved pyrometry, Int. J. Ther-mophys. 25(2), 561–574 (2004)
33.42 J. Harding, E.O. Wood, J.D. Campbell: Tensile test-ing of materials at impact rates of strain, J. Mech.Engng Sci. 2, 88–96 (1960)
33.43 S. Nemat-Nasser, J.B. Isaacs, J.E. Starrett: Hopkin-son techniques for dynamic recovery experiments,Proc. Royal Soc. London A20, 371–391 (1991)
33.44 G.H. Staab, A. Gilat: A direct-tension split Hop-kinson bar for high strain-rate testing, Exp. Mech.31(3), 232–235 (1991)
33.45 Y. Li, K.T. Ramesh, E.S.C. Chin: Comparison of theplastic deformation and failure of A359/SiC and6061-T6/Al2O3 metal matrix composites under dy-namic tension, Mat. Sci. Eng. A 371(1-2), 359–370(2004)
33.46 W.E. Baker, C.H. Yew: Strain-rate effects in thepropagation of torsional plastic waves, Trans.ASME: J. Appl. Mech. 33, 917–923 (1966)
33.47 K.A. Hartley, J. Duffy, R.H. Hawley: The torsionalKolsky (split-Hopkinson) bar. In: ASM Handbook,Vol. 8, ed. by H. Kuhn, D. Medlin, (ASM Int., Mater-ials Park Ohio 2000) pp. 218–228
33.48 A. Marchand, J. Duffy: An experimental study ofthe formation process of adiabatic shear bands in
a structural steel, J. Mech. Phys. Solids. 36(3), 251–283 (1988)
33.49 C.K.H. Dharan, F.E. Hauser: Determination ofstress-strain characteristics at very high strainrates, Exper. Mech. 10, 370–376 (1970)
33.50 G.L. Wulf, G.T. Richardson: The measurement ofdynamic stress-strain relationships at very highstrain rates, J. Phys. E 7, 167–169 (1974)
33.51 D.A. Gorham: Measurement of stress-strain prop-erties of strong metals at very high strain rates,Inst. Phys. Conf. Ser. 47, 16–24 (1980)
33.52 N.A. Safford: Materials testing up to 105s−1 using aminiaturised hopkinson bar with dispersion cor-rections, Proc. 2nd Intl. Symp. on Intense DynamicLoading and its Effects, ed. by G. Zhang, S. Huang(Sichuan Univ. Press, Chengdu 1992) pp. 378–383
33.53 D.A. Gorham, P.H. Pope, J.E. Field: An im-proved method for compressive stress-strainmeasurements at very high strain rates, Proc. R.Soc. Lond. A 438, 153–170 (1992)
33.54 J. Shioiri, K. Sakino, S. Santoh: Strain rate sensi-tivity of flow stress at very high rates of strain.In: Constitutive Relation in High/Very-High StrainRates, ed. by K. Kawata, J. Shioiri (Springer, BerlinHeidelberg 1995) pp. 49–58
33.55 F. Kamler, P. Niessen, R.J. Pick: Measurement ofthe behaviour of high-purity copper at very highrates of strain, Canad. J. Phys. 73, 295–303 (1995)
33.56 R.W. Klopp, R.J. Clifton: Pressure-shear plate im-pact testing. In: ASM Handbook, Vol. 8, ed. byH. Kuhn, D. Medlin, (ASM Int., Materials Park Ohio1985) pp. 230–239
33.57 K.J. Frutschy, R.J. Clifton: High-temperaturepressure-shear plate impact experiments on OFHCcopper, J. Mech. Phys. Sol. 46(10), 1723–1743 (1998)
33.58 K.T. Ramesh, N. Kelkar: Technique for the con-tinuous measurement of projectile velocities inplate impact experiments, Rev. Sci. Instrum. 66(4),3034–3036 (1995)
33.59 S. Yadav, D.R. Chichili, K.T. Ramesh: The mechan-ical response of a 6061-T6 Al/Al2O3 metal matrixcomposite at high rates of deformation, Acta met-all. mater. 43(12), 4453–4464 (1995)
33.60 D. Jia, A.M. Lennon, K.T. Ramesh: High-strain-rate pressure-shear recovery: a new experimentaltechnique, Int. J. Sol. Struc. 37(12), 1679–1699(2000)
33.61 A. Bekker : Impact induced propagation of phasetransformation in a shape memory alloy rod, Int.J. Plast. 18, 1447–1479 (2002)
33.62 J.U. Cazamias, : Bar impact tests on alumina(AD995). In: Shock Compression of Condensed Mat-ter - 2001, ed. by M.D. Furnish, N.N. Thadhani,Y. Horie (Am. Inst. Phys., Melville 2002) pp. 787–790
33.63 L.C. Chhabildas, : Impact of AD995 alumina rods.In: Shock Compression of Condensed Matter - 1997,ed. by S.C. Schmidt, D.P. Dandekar, J.W. Forbes(Am. Inst. Phys., Woodbury 1998) pp. 505–508
PartD
33
28 Part D Sample Chapter
33.64 F.G. Díaz-Rubio, J. Rodríguez Pérez, V. SánchezGálvez: The spalling of long bars as a reliablemethod of measuring the dynamic tensile strengthof ceramics, Int. J. Impact Eng. 27, 161–177 (2002)
33.65 K.G. Holland, : Experiments on CERCOM SiC rods un-der impact. In: Shock Compression of CondensedMatter - 1999, ed. by M.D. Furnish, L.C. Chhabil-das, R.S. Hixson (Am. Inst. Phys., Melville 2000)pp. 585–588
33.66 R. Russell, S.J. Bless, T. Beno: Impact induced fail-ure zones in Homalite bars:. In: Shock Compressionof Condensed Matter - 2001, ed. by M.D. Furnish,N.N. Thadhani, Y. Horie, (Am. Inst. Phys., Melville2002) pp. 811–814
33.67 D.S. Drumheller: Introduction to Wave Propagationin Nonlinear Fluids and Solids (Cambridge Univ.Press, Cambridge 1998)
33.68 M.A. Meyers: Dynamic Behavior of Materials (Wiley,New York 1994)
33.69 G.T. Gray III: Shock wave testing of ductile mater-ials. In: ASM Handbook, Vol. 8, ed. by H. Kuhn,D. Medlin, (ASM Int., Materials Park Ohio 2000)pp. 462–476
33.70 S.C. Schmidt, J.N. Johnson, L.W. Davidson: ShockCompression of Condensed Matter - 1989 (NorthHolland, Amsterdam 1990)
33.71 S.C. Schmidt, : Shock Compression of CondensedMatter - 1991 (Elsevier, Amsterdam 1992)
33.72 S.C. Schmidt, W.C. Tao: Shock Compression of Con-densed Matter - 1995 (Am. Inst. Phys., Woodbury1996)
33.73 S.C.D.P. Schmidt Dandekar, J.W. Forbes: ShockCompression of Condensed Matter - 1997 (Am. Inst.Phys., Woodbury 1998)
33.74 M.D. Furnish, L.C. Chhabildas, R.S. Hixson: ShockCompression of Condensed Matter - 1999 (Am. Inst.Phys., Melville 2000)
33.75 L. Davison, R.A. Graham: Shock compression ofsolids, Phys. Rep. 55, 255–379 (1979)
33.76 J.R. Asay, M. Shahinpoor: High-Pressure ShockCompression of Solids (Springer-Verlag, New York1993)
33.77 L. Davison, D.E. Grady, M. Shahinpoor: High-Pressure Shock Compression of Solids II: DynamicFracture and Fragmentation (Springer, New York1996)
33.78 L. Davison, Y. Horie, M. Shahinpoor: High-PressureShock Compression of Solids IV: Response of HighlyPorous Solids to Shock Compression (Springer, NewYork 1997)
33.79 L. Davison, M. Shahinpoor: High-Pressure ShockCompression of Solids III (Springer, New York 1998)
33.80 H. Czichos, T. Saito, L. Smith (Eds.): Springer Hand-book of Materials Measurement Methods (Springer,Berlin, Heidelberg 2006)
33.81 W.D. Reinhart, : Equation of state measurements ofmaterials using a three-stage gun to impact veloc-
ities of 11 km/s, Int. J. Imp. Eng. 26(1-10), 625–637(2001)
33.82 Y.M. Gupta: Use of piezoresistance gauges toquantify the stress state in a shocked solid. In:Experimental Techniques in the Dynamics of De-formable Solids, ed. by K.T. Ramesh (ASME, NewYork 1993) pp. 89–101
33.83 R. Feng, G.F. Raiser, Y.M. Gupta: Material strengthand inelastic deformation of silicon carbide undershock wave compression, J. Appl. Phys. 83(1), 79–86 (1998)
33.84 Z. Rosenberg, D. Yaziv, Y. Partom: Calibration offoil-like manganin gauges in planar shock-waveexperiments, J. Appl. Phys. 51(6), 3702–3705 (1980)
33.85 Y.M. Gupta: Analysis of manganin and ytterbiumgauge data under shock loading, J. Appl. Phys.54(9), 6094–6098 (1983)
33.86 R.A. Graham, F.W. Neilson, W.B. Benedick: Piezo-electric current from shock-loaded quartz -a submicrosecond stress gauge, J. Appl. Phys. 36(5),1775–00 (1965)
33.87 T. Obara, N.K. Bourne, Y. Mebar: The construc-tion and calibration of an inexpensive PVDF stressgauge for fast pressure measurements, Meas. Sci.Technol. 6(4), 345–348 (1995)
33.88 L.M. Barker: The accuracy of VISAR instrumentation.In: Shock Compression of Condensed Matter - 1997,ed. by S.C. Schmidt, D.P. Dandekar, J.W. Forbes(Am. Inst. Phys., Woodbury, 1998) pp. 833–836
33.89 L.M. Barker: The development of the VISAR andits use in shock compression science. In: ShockCompression of Condensed Matter - 1999, ed. byM.D. Furnish, L.C. Chhabildas, R.S. Hixson, (Am.Inst. Phys., Melville 2000) pp. 11–17
33.90 L.M. Barker, R.E. Hollenbach: Laser interferome-ter for measuring high velocities of any reflectingsurface, J. Appl. Phys. 43, 4669–4675 (1972)
33.91 J. Edwards, : Laser-driven plasma loader for shock-less compression and acceleration of samples inthe solid state, Phys. Rev. Let. 92(6), 000–000(2004)
33.92 N.K. Bourne, Z. Rosenberg, J.E. Field: High-speedphotography of compressive failure waves inglasses, J. Appl. Phys. 78, 3736–3739 (1995)
33.93 B. Paliwal, K.T. Ramesh, J.W. McCauley: Direct ob-servation of the dynamic compressive failure of atransparent polycrystalline ceramic (AlON), J. Am.Ceramic Soc. 89(6), 2128–2133 (2006)
33.94 K. Ravi-Chandar: Dynamic fracture (Wiley, NewYork 2005)
33.95 E. El-Magd, M. Brodmann: Influence of precipitateson ductile fracture of aluminium alloy AA7075 athigh strain rates, Mat. Sci. Eng. A. Struct. Mat. Prop.Microstruct. Proces. 307(1-2), 143–150 (2001)
33.96 D.M. Goto, D.A. Koss, V. Jablokov: The influence oftensile stress states on the failure of HY-100 steel,Metallurg. Mat. Trans. A 30(9), 2835–2842 (1999)
PartD
33

High Strain Rate and Impact Experiments References 29
33.97 J. Kang, : Microscopic strain mapping usingscanning electron microscopy topography imagecorrelation at large strain, J. Strain Anal. Eng. De-sign 40(5), 559–570 (2005)
33.98 W. Tong, : Deformation and fracture of miniaturetensile bars with resistance-spot-weld microstruc-tures, Metallurg. Mat. Trans. A 36A(10), 2651–2669(2005)
33.99 B. Wattrisse, : Kinematic manifestations of lo-calisation phenomena in steels by digital imagecorrelation, Europ. J. Mech. A 20(2), 189–211 (2001)
33.100 B. Wattrisse, : Analysis of strain localization dur-ing tensile tests by digital image correlation, Exp.Mech. 41(1), 29–39 (2001)
33.101 P.E. Magnusen, E.M. Dubensky, D.A. Koss: The ef-fect of void arrays on void linking during ductilefracture, Acta Metallurgica 36(5), 1503–1509 (1988)
33.102 E.M. Dubensky, D.A. Koss: Void pore distributionsand ductile fracture, Metallurg. Mat. Trans. A 18(9),1887–1895 (1987)
33.103 R.J. Bourcier, : The influence of porosity on the de-formation and fracture of alloys, Acta Metallurgica34(12), 2443–2453 (1986)
33.104 T. Pardoen, I. Doghri, F. Delannay: Experimentaland numerical comparison of void growth modelsand void coalescence criteria for the prediction ofductile fracture in copper bars, Acta Mater. 46(2),541–00 (1998)
33.105 W.G. Proud: X-ray. In: Shock Compression of Con-densed Matter, ed. by ed]Please add the editor.(AIP, Baltimore 2005)
33.106 G. Ravichandran, R.J. Clifton: Dynamic fracture un-der plane-wave loading, Int. J. Fract. 40(3), 157–201(1989)
33.107 V. Prakash, L.B. Freund, R.J. Clifton: Stress wave ra-diation from a crack tip during dynamic initiation,J. Appl. Mech.-Trans. ASME 59(2), 356–365 (1992)
33.108 M. Zhou, R.J. Clifton: Dynamic ductile rupture un-der conditions of plane strain, Int. J. Imp. Eng.19(3), 189–206 (1997)
33.109 Z. Zhang, R.J. Clifton: Shear band propagation froma crack tip, J. Mech. Phys Sol. 51(11-12), 1903–1922(2003)
33.110 R. Godse, G. Ravichandran, R.J. Clifton: Mi-cromechanisms of dynamic crack-propagation inan aisi-4340-steel, Mat. Sci. Eng. A 112, 79–88(1989)
33.111 X.Y. Wu, K.T. Ramesh, T.W. Wright: The effects ofthermal softening and heat conduction on the dy-namic growth of voids, Int. J. Sol. Struct. 40(13),4461–4478 (2003)
33.112 J.N. Johnson: Dynamic fracture and spallation inductile solids, J. Appl. Phys. 52(4), 2812–2825 (1981)
33.113 D.E. Grady: The spall strength of condensed matter,J. Mech. Phys Sol. 36(3), 353–00 (1988)
33.114 G.I. Kanel, : Dynamic yield and tensile strength ofaluminum single crystals at temperatures up to themelting point, J. Appl. Phys. 90(1), 136–143 (2001)
33.115 Antoun , G.I. Kanel: Spall Fracture (Springer, BerlinHeidelberg 2004)
33.116 Y.L. Bai, B. Dodd: Adiabatic Shear Localization:Occurrence, Theories and Applications (Pergamon,Oxford 1992)
33.117 T.W. Wright: The mathematical theory of adiabaticshear bands (Cambridge Univ. Press, Cambridge2002)
33.118 J.H. Giovanola: Observation of adiabatic shearbanding in simple torsion. In: Impact Loading andDynamic Behaviour of Materials, ed. by C.Y. Chiem,H.D. Kunze, L.W. Meyer (DGM Informationsge-sellschaft, Oberursel 1988) pp. 705–710
33.119 M.G. daSilva, K.T. Ramesh: The rate-dependentdeformation and localization of fully dense andporous Ti-6Al-4V, Mat. Sci. Eng. A 232(1-2), 11–22(1997)
33.120 K.T. Ramesh: On the localization of shearing defor-mations in a tungsten heavy alloy, Mech. Materials17, 165–173 (1994)
33.121 A. Molinari, R.J. Clifton: Analytical characterizationof shear localization in thermoviscoplastic mater-ials, J. Appl. Mech.-Trans. ASME 54(4), 806–812(1987)
33.122 B. Deltort: Experimental and numerical aspects ofadiabatic shear in a 4340 steel, J. Phys. IV FranceColloq. C8 (DYMAT 94) 4, 447–452 (1994)
33.123 D.R. Chichili, K.T. Ramesh, K.J. Hemker: Adiabaticshear localization in alpha-titanium: experiments,modeling and microstructural evolution, J. Mech.Phys Sol. 52(7), 1889–1909 (2004)
33.124 D.R. Chichili, K.T. Ramesh: Recovery experimentsfor adiabatic shear localization: A novel experi-mental technique, J. Appl. Mech.-Transact. ASME66(1), 10–20 (1999)
33.125 Q. Xue, L.T. Shen, T.L. Bai: Elimination of loadingreverberation in the split Hopkinson torsional bar,Rev. Sci. Instr. 66(9), 5298–5304 (1995)
33.126 M.A. Meyers, : Evolution of microstructure andshear-band formation in alpha-hcp titanium,Mech. Mat. 17(2-3), 175–193 (1994)
33.127 Z.Q. Duan, S.X. Li, D.W. Huang: Microstructures andadiabatic shear bands formed by ballistic impactin steels and tungsten alloy, Fat. Fract. Eng. Mat.Struct. 26(12), 1119–1126 (2003)
33.128 Q. Xue, M.A. Meyers, V.F. Nesterenko: Self-organization of shear bands in titanium andTi-6Al-4V alloy, Acta Mater. 50(3), 575–596 (2002)
33.129 D. Rittel, S. Lee, G. Ravichandran: A shear-compression specimen for large strain testing, Exp.Mech. 42(1), 58–64 (2002)
33.130 M. Zhou, A.J. Rosakis, G. Ravichandran: Dynam-ically propagating shear bands in impact-loadedprenotched plates. 1. Experimental investigationsof temperature signatures and propagation speed,J. Mech. Phys Sol. 44(5), 981–1006 (1996)
33.131 P.R. Guduru, A.J. Rosakis, G. Ravichandran: Dy-namic shear bands: an investigation using high
PartD
33

30 Part D Sample Chapter
speed optical and infrared diagnostics, Mech. Mat.33(6), 371–402 (2001)
33.132 D.E. Grady, D.A. Benson: Fragmentation of metalrings by electromagnetic loading, Exp. Mech. 23(4),393–400 (1983)
33.133 W.H. Gourdin: The expanding ring as a high-strainrate test, J. Met. 39(10), A65–A65 (1987)
33.134 S. Dujardin, G. Gazeaud, A. Lichtenberger: Dynamicbehavior of copper studied using the expandingring test, J. Physique 49(C-3), 55–62 (1988)
33.135 W.H. Gourdin: Analysis and assessment of elec-tromagnetic ring expansion as a high-strain-ratetest, J. Appl. Phys. 65(2), 411–422 (1989)
33.136 W.H. Gourdin: Constitutive properties of copperand tantalum at high-rates of tensile strain - ex-panding ring results, Inst. Phys. Conf. Ser. 102,221–226 (1989)
33.137 W.H. Gourdin, S.L. Weinland, R.M. Boling: De-velopment of the electromagnetically launchedexpanding ring as a high-strain-rate test tech-nique, Rev. Sci. Instr. 60(3), 427–432 (1989)
33.138 H. Zhang, K. Ravi-Chandar: Dynamic necking of6061-O Aluminum (, 2006), ed by K. T. Ramseh
33.139 F.H. Zhou, J.F. Molinari, K.T. Ramesh: Analysis ofthe brittle fragmentation of an expanding ring,Comp. Mat. Sci. 37(1-2), 74–85 (2006)
33.140 P.R. Guduru, L.B. Freund: The dynamics of multi-ple neck formation and fragmentation in high rateextension of ductile materials, Int. J. Sol. Struct.39(21-22), 5615–5632 (2002)
33.141 M.J. Forrestal, B.W. Duggin, R.I. Butler: Explosiveloading technique for the uniform expansion of304 stainless steel cylinders at high strain rates, J.Appl. Mech.-Transact. ASME 47(1), 17–20 (1980)
33.142 J.F. Kalthoff: On the measurement of dynamic frac-ture toughnesses - a review of recent work, Int. J.Fract. 27(3-4), 277–298 (1985)
33.143 R.A.W. Mines: Characterization and measurementof the mode 1-dynamic initiation of cracks in met-
als at intermediate strain rates - a review, Int. J.Imp. Eng. 9(4), 441–454 (1990)
33.144 A.J. Rosakis: Application of coherent gradient sens-ing (cgs) to the investigation of dynamic fractureproblems, Optics Lasers Eng. 19(1-3), 3–41 (1993)
33.145 K. Ravi-Chandar: Dynamic fracture of nominallybrittle materials, Int. J. Fract. 90(1-2), 83–102 (1998)
33.146 A. Shukla: High-speed fracture studies on bimate-rial interfaces using photoelasticity - a review, J.Strain Anal. Eng. Design 36(2), 119–142 (2001)
33.147 J.F. Kalthoff: Modes of dynamic shear failure insolids, Int. J. Fract. 101(1-2), 1–31 (2000)
33.148 D.D. Anderson, A. Rosakis: Comparison of three realtime techniques for the measurement of dynamicfracture initiation toughness in metals, Eng. Fract.Mech. 72(4), 535–555 (2005)
33.149 V. Parameswaran, A. Shukla: Dynamic fracture ofa functionally gradient material having discreteproperty variation, J. Mat. Sci. 33(10), 3303–331(1998)
33.150 A.J. Rosakis, A.T. Zehnder, R. Narasimhan: Causticsby reflection and their application to elastic-plastic and dynamic fracture-mechanics, Optic.Eng. 27(7), 596–610 (1988)
33.151 K. Arakawa, : Dynamic fracture-analysis by moireinterferometry, Exp. Mech. 31(4), 306–309 (1991)
33.152 H.V. Tippur, A.J. Rosakis: Quasi-static and dynamiccrack-growth along bimaterial interfaces - a noteon crack-tip field-measurements using coherentgradient sensing, Exp. Mech. 31(3), 243–251 (1991)
33.153 T.A. Siewert, M.P. Monahan: Pendulum ImpactTesting: A Century of Progress (ASTM, 2000)
ocite]This reference is not cited in the text.33.154 M.F. Gogulya, A.Y. Dolgoborodov, M.A. Brazhnikov:
Investigation of shock and detonation waves byoptical pyrometry, Int. J. Imp. Eng. 23(1), 283–293(1999)
33.155 G.I. Pangilinan, Y.M. Gupta: Time-resolved ramanmeasurements in nitromethane shocked to 140Kbar, J. Phys. Chem. 98(13), 4522–4529 (1994)
PartD
33

http://www.springer.com/978-0-387-26883-5
Related Documents


