High-Speed Deflagration and Detonation Fundamentals and Control Edited byr G. Roy-— S. FroloYj D. Netzpp/ A. Bonso$ ELEXVKM Publishers

Welcome message from author
This document is posted to help you gain knowledge. Please leave a comment to let me know what you think about it! Share it to your friends and learn new things together.
Transcript
High-Speed Deflagration and Detonation Fundamentals and Control
Edited byr G. Roy-— S. FroloYj D. Netzpp/ A. Bonso$ ELEXVKM Publishers

REPORT DOCUMENTATION PAGE Form Approved OMB No. 0704-0188
Public reporting burden for this collection of information is estimated to average 1 hour per response, including the time for reviewing instructions, searching existing data sources, gathering and maintaining the data needed, and completing and reviewing the collection of information. Send comments regarding this burden estimate or any other aspect of this collection of information, including suggestions for reducing this burden to Washington Headquarters Services, Directorate for Information Operations and Reports, 1215 Jefferson Davis Highway, Suite 1204, Arlington, VA 22202-4302, and to the Office of Management and Budget, Paperwork Reduction Project (0704-0188), Washington, DC 20503. 1. AGENCY USE ONLY (Leave blank) 2. REPORT DATE
June 2001
3. REPORT TYPE AND DATES COVERED 4-7 July 2000 Final Report
4. TITLE AND SUBTITLE High -Speed Deflagration and Detonation: Fundamentals and Control. International Colloquium on Control of Detonation Processes. Held in Moscow, Russia on July 4-7, 2000. 6. AUTHOR(S)
Gabriel D. Roy, Sergei M. Frolov; David W. Netzer, Anatolii A. Borisov, Editors
7. PERFORMING ORGANIZATION NAME(S) AND ADDRESS(ES) ELEX-KM Publishers Kashirskoe Shosse, 22-3 Moscow 115201/Russia
9. SPONSORING/MONITORING AGENCY NAME(S) AND ADDRESS(ES)
Office of Naval Research, European Office PSC 802 Box 39 FPO AE 09499-0039
5. FUNDING NUMBERS
N00014-99-1-077
8. PERFORMING ORGANIZATION REPORT NUMBER
ISBN 5-93815-003-5
10. SPONSORING/MONITORING AGENCY REPORT NUMBER
11. SUPPLEMENTARY NOTES This work relates to Department of the Navy Grant issued by the Office of Naval Research International Field Office. The United States has a royalty free license throughout the world in all copyrightable material contained herein.
12a. DISTRIBUTION/AVAILABILITY STATEMENT
Approved for Public Release; Distribution Unlimited. U.S. Government Rights License. All other rights reserved by the copyright holder.
12b. DISTRIBUTION CODE
12. ABSTRACT (Maximum 200 words) Twenty two papers on fundamentals of high-speed deflagrations and detonations written by international experts are assembled in this volume. The papers have been presented at the International Colloquium on Control of Detonation Processes held in Moscow, Russia on July 4-7, 2000. Various aspects of deflagration to detonation transition as well as direct detonation initiation in gaseous and heterogeneous media are discussed with the emphasis on control of the predetonation distance and parameters of transient high-speed combustion regimes. Applications of various explosion control techniques to pulsed detonation engines (PDE) are described.
13. SUBJECT TERMS EOARD, ONR, Foreign reports, Conference proceedings, Detonation, Deflagration, Engines
17. SECURITY CLASSIFICATION OF REPORT
UNCLASSIFIED
18. SECURITY CLASSIFICATION OF THIS PAGE
UNCLASSIFIED
19, SECURITY CLASSIFICATION OF ABSTRACT
UNCLASSIFIED
15. NUMBER OF PAGES
16. PRICE CODE
20. LIMITATION OF ABSTRACT
UL NSN 7540-01-280-5500 Standard Form 298 (Rev. 2-89)
Prescribed by ANSI Std. 239-18 298-102

HIGH-SPEED DEFLAGRATION AND DETONATION:
FUNDAMENTALS AND CONTROL
Edited by
Gabriel D. Roy Office of Naval Research
Arlington, VA, USA
Sergei M. Frolov N.N. Semenov Institute of Chemical Physics
Moscow, Russia
David W. Netzer Naval Postgraduate School
Monterey, CA, USA
Anatolii A. Borisov N.N. Semenov Institute of Chemical Physics
Moscow, Russia
ELEX-KM Publishers
Moscow 2001 20011130 075 Hlf ■ Goyemment Rights License
Srrk/elates t0 Department? «he Naw
/ >— ~ ««search (ONR) International Field Office

BBK 24.54
y.HK 621.43:662.612.3
High-Speed Deflagration and Detonation: Fundamentals and Control /
Jd38 [Edited by G.D. Roy, S.M. Frolov, D.W. Netzer, and A.A. Borisov]. —
Moscow: ELEX-KM Publishers, 2001. — 384 p. Tabl. 32, ill. 190.
ISBN 5-93815-003-5
Twenty two papers on fundamentals of high-speed deflagrations and detona- tions, written by international experts, are edited and assembled together in this volume. The papers have been presented at the International Colloquium on Control of detonation Processes held in Moscow, July 4-7, 2000. Various aspects of deflagration to detonation transition as well as direct detonation ini- tiation in gaseous and heterogeneous media are discussed with the emphasis on control of the predetonation distance and parameters of transient high-speed combustion regimes. Applications of various explosion control techniques to pulsed detonation engines (PDE) are described. The concepts of PDE using predetonators, 'rotating' detonations, repeated in situ mixing of fuels with dif- ferent detonability, periodically reinitiated detonations, jet-induced detonations in a resonator cavity, etc. are discussed in detail and are evaluated. The book, with numerous illustrations and an extensive list of up-to-date references, is a compilation of the most promising state-of-the-art research in this field that has attracted significant world-wide attention in the past several years. The volume is addressed to scientists and practicing research engineers working in the field of propulsion and power engineering. It will be useful as an advanced graduate level text for courses in deflagration, detonation, and propulsion.
BBK 24.54
ISBN 5-93815-003-5 © ELEX-KM Publ. Kashirskoe Shosse, 22-3 Moscow 115201 / Russia, 2001
Managing Editor O. Frolova Art Editors M. Sedakova Genera/ Editor T. Torzhkova A. Seyryugm Technical Editor L. Kokushkina Cover Design P. Chikm
Printed in Russian Federation
All rights reserved. No part of this book may be reproduced in any form by photostat, mi- crofilm, or any other means without permission from the publishers. This work relates to the US Department of the Navy Grant No. 00014-99-1-1077 issued by the Office of Naval Research International Field Office. The United States Government has a royalty-free license throughout
the world in all copyrightable material contained herein.

PREFACE
Research and development (R&D) efforts on pulsed detonation engines (PDEs) are continuously gaining momentum that is indicated by the increasing number of publications on the topic world-wide. The PDEs are attractive due to their apparent simplicity and operation on a more efficient nearly constant- volume thermodynamic cycle. It is anticipated that PDEs, when commercially available, will be able to compete with modern gas-turbine propulsion devices and solid propellant engines, particularly in unmanned single-use applications, aircraft afterburners and boosters. However, at this stage of our knowledge,' there are still a number of unsolved fundamental issues in pulsed detonation phenomena as applied to propulsion. The major issues are the reliable mixing of fuel with air in a frequently reverberating flow and repeated detonation initi- ation m liquid fuel sprays with relatively weak on-board ignition sources. Other issues deal with transient heat transfer, on-board energy recovery, controllability of the operating processes at variable flight conditions, integration of difmsers and nozzles, noise, emission, etc. This book is aimed at contributing towards better understanding of the physical and chemical phenomena that govern prop- agating high-speed deflagrations and detonations, in particular those in PDE demonstrators and in a PDE environment. Written by international experts, this book provides a whole spectrum of R&D approaches and achievements that can be utilized in future propulsion systems operating on high-speed deflagration and/or detonation modes.
This book contains selected contributions presented at the International Col- loquium on Control of Detonation Processes held in Moscow, Russia, July 4-7, 2000. The Colloquium was co-sponsored by the U.S. Office of Naval Research (ONR)*, the ONR International Field Office Europe*, European Research Of- fice of the U.S. Army*, Scientific Council on Combustion and Explosion of the Presidium of the Russian Academy of Sciences, and the Russian Foundation for Basic Research. The support of these agencies is acknowledged. The twenty
*The content of the information does not necessarily reflect the position of the United States Government and no official endorsement should be inferred.
HI

two selected papers included in the book were thoroughly revised and edited, and presented in a unified format as book chapters with the "flow" one expects in a textbook. With the extensive reviews and lists of references provided, the book will be useful for researchers and R&D engineers, as well as for faculty and graduate students, involved in this field of science and technology.
The excellent work of Ms. Olga Frolova, Ms. Tatiana Torzhkova, Ms. Lyud- mila Kokushkina, and Ms. Marina Sedakova of the ELEX-KM Publishers and their close cooperation with the editors during production of the book are grate- fully acknowledged. We are thankful to Academician A. G. Merzhanov, Academi- cian N.A. Plate, and Academician M.V. Alfimov, Prof. S.A. Tsyganov, Prof. N N. Smirnov and Prof. Yu.A. Gordopolov who helped in organizing and con- ducting the Colloquium. We thank the authors for their valuable contributions, and for their time and effort which made this volume possible.
Gabriel D. Roy
Sergei M. Frolov
David W. Netzer Anatolii A. Borisov
June 2001

CONTENTS
Contributors xni
Introduction XIX
High-Speed Deflagration: Fundamentals and Control xx Detonation: Fundamentals and Control xxi Pulsed Detonation Engines XXJJJ
Part One High-Speed Deflagration: Fundamentals and Control 1
CONTROL OF DETONATION ONSET IN COMBUSTIBLE GASES 3
N.N. Smirnov, V.F. Nikitin, M. V. Tyurnikov, A. P. Boichenko, J. C. Legros, and V. M. Shevisova
1 Introduction o 2 Mathematical Model A
3 Theoretical Investigations of the DDT Processes in Hydrocarbon-Air Mixtures 15
4 Experimental Investigations of the DDT in Tubes with Turbulizing Chambers 23
5 Concluding Remarks 27 Acknowledgments 28 References 2«
SOME GASDYNAMIC METHODS FOR CONTROL OF DETONATION INITIATION AND PROPAGATION 31 0. V. Achasov and 0. G. Penyazkov
1 Introduction 01 2 Results of Investigations 32

HIGH-SPEED DEFLAGRATION fc DETONATION: FUNDAMENTALS fc CONTROL
3 Concluding Remarks 43
Acknowledgments r> r ... 43 Reierences
SENSITIZATION OF FUEL-AIR MIXTURES FOR DEFLAGRATION-TO-DETONATION TRANSITION .... 45
A.J. Higgins, P. Pinard, A.C. Yoshinaka, and J.H.S. Lee 45 1 Introduction
2 Laminar to Turbulent Flame Transition: Role of Initiator 49 3 High-Speed Turbulent Flame Acceleration: Role of Obstacles 52 4 Onset of Detonation: Sensitivity of Mixture 54 5 Concluding Remarks Acknowledgments
59 References
n INITIATION OF COMBUSTION AND DETONATION IN H2 + O MIXTURES BY EXCITATION OF ELECTRONIC STATES OF OXYGEN MOLECULES A.M. Starik and N. S. Titova
1 Introduction 2 Kinetic Model 64
3 On Mechanisms of Low-Temperature Initiation of Combustion in II2 + 02 System
4 Initiation of Detonation Behind a Shock Wave in a Supersonic Flow
5 Concluding Remarks 77 Acknowledgments
References
Part Two Detonation: Fundamentals and Control
NUMERICAL INVESTIGATION OF TRANSIENT DETONATION
WAVES L. Hemeryck, M. H. Lefebvre, and P. J. Van Tiggelen
1 Introduction
63
63 64
68
71
77
79
81
81
2 Numerical and Physical Models 82
83 84
3 Mixtures and Cases Studied 4 Results and Discussions 5 Concluding Remarks References

CONTENTS
INFLUENCE OF TRANSPORT PROCESSES ON TWO-DIMENSIONAL STRUCTURE OF DETONATION ... 97 T. Fujiwara and K. Fukiba
1 Introduction 07 2 Physical and Computational Conditions 99 3 Execution of Numerical Analysis 100 4 Calculated Results and Cell Size 100 5 Concluding Remarks 106 References IQ~
CALCULATION OF TRAVELLING DETONATIONS BY THE SPACE-TIME CONSERVATION ELEMENT AND SOLUTION ELEMENT METHOD 107
S. T. J. Yu, S. J. Park, S.-C. Chang, and P. C. E. Jorgenson 1 Introduction 10?
2 The Space-Time CE/SE Method '.'.'.'. 109 3 Theoretical Model H3 4 Results and Discussions H4 5 Concluding Remarks 123 References 193
PHENOMENON OF NON-SELF-SIMILARITY IN UNSTEADY MACH REFLECTION OF DETONATION WAVES 125 A. V. Trotsyuk
1 Introduction i^r 2 Formulation of the Problem . . . . 127 3 Numerical Method log 4 Results of Computations 129 5 Concluding Remarks I35 Acknowledgments 13g References 100
THE ROLE OF ENERGY DISTRIBUTION ON THE TRANSMISSION OF DETONATION 139 S. B. Murray, P. A. Thibault, F. Zhang, D. Bjerketvedt, A. Sulmistras, G. O. Thomas, A. Jenssen, and I. O. Moen
1 Introduction I30
2 Proposed Geometries for Enhanced Transmission 142 3 Experimental Details and Results 149 4 Concluding Remarks I57 References 1 r o
Vll

HIGH-SPEED DEFLAGRATION fc DETONATION: FUNDAMENTALS fc CONTROL
NUMERICAL SIMULATION OF DETONATION CELL STRUCTURE IN HYDROGEN-AIR MIXTURE LOADED BY ALUMINUM PARTICLES 163
B.A. Khasainov, B. Veyssiere, and W. Ingignoli
1 Introduction 163
2 Description of the Problem 164
3 Results of Calculations 165
171 4 Discussion 5 Concluding Remarks *'3
Acknowledgments References
Part Three Pulsed Detonation Engines 175
PULSED DETONATION PROPULSION: KEY ISSUES 177
D. Desbordes, E. Daniau, and R. Zitoun 177 1 Introduction
2 Review of the Early Research 178
3 The PDE Basic Setup and Cycle I82
4 Single-Cycle Propulsive Performance I84
5 Multicycle Propulsion Performance Problems 187 6 Concluding Remarks 189
References 190
ON FACTORS CONTROLLING THE PERFORMANCE OF PULSED DETONATION ENGINES 193
K. Kailasanath, G. Patnaik, and C. Li
1 Introduction 193
2 Performance Estimates of a PDE l9j> 3 Estimating the "Plateau" Pressure Factor 197 4 The Numerical Model 199
5 Concluding Remarks Acknowledgments T, r ... 205 References
DETONATION OF A JP-10 AEROSOL FOR PULSE DETONATION APPLICATIONS 207 C. M. Brophy, D. W. Neizer, J. Sinibaldi, and R. Johnson
1 Introduction ^u' 919
2 Experimental Setup

CONTENTS
3 Results 2ic; 4 Concluding Remarks 221 Acknowledgments 221 References 291
A NEW APPROACH TO ORGANIZING OPERATION CYCLES IN PULSED DETONATION ENGINES 223 V.A. Levin, J.N. Nechaev, and A.I. Tarasov
1 Introduction 22S
2 Ideal Thermodynamic Cycle in PDE 224 3 A New Approach to PDE 227
4 Combustible Mixture Preparation in the Reactor 228 5 High-Frequency Detonative Combustion in the Resonator . . 229 6 Model Testing of PDE Thrust Devices 231 7 Physics of the Operation Process 234 8 Conditions and Areas of Application 236 9 Concluding Remarks 237 References 2Q7
PULSED DETONATION COMBUSTION CHAMBER FOR PDE 239 D. I. Baklanov, L. G. Gvozdeva, and N. B. Scherbak
1 Introduction 23Q
2 Detonative Combustion Chamber 239 3 Operation Principle of Gasdynamic Valves 241 4 Multistep Detonation Process 244 5 Concluding Remarks 248 Acknowledgments 249 References 24Q
EFFECTS OF NOZZLES OF DIFFERENT LENGTH AND SHAPE ON THE PROPULSION PERFORMANCE OF PULSED DETONATION ENGINES 251 E. Daniau, R. Zitoun, C. Couquet, and D. Desbordes
1 Introduction 251
2 Effect of a Diverging Nozzle — a Simple Analysis 253 3 Single-Pulse Setup and Experiments 255 4 Results and Discussion 256 5 Concluding Remarks 261 References 2fio
IX

HIGH-SPEED DEFLAGRATION fc DETONATION: FUNDAMENTALS fc CONTROL
FORCED NONUNIFORM PRESSURE OSCILLATIONS IN A TWO-DIMENSIONAL SUPERSONIC INLET 263
S. Mullagiri and C. Segal
1 Introduction 2 Experimental Setup
267 3 Results 271 4 Concluding Remarks 271 Acknowledgments
References
DIODE-LASER BASED SENSORS FOR PULSED DETONATION ENGINE FLOWS 273
T.P. Jenkins, S. T. Sanders, J. A. Baldwin, W. Fan, D.S. Bacr,
and R. K. Hanson 273 1 Introduction 974 2 Description of Techniques
3 JP-10/Oo Experiments at Naval Postgraduate School .... 279 4 C2H4/Air Experiments at Stanford University 281
5 Concluding Remarks Acknowledgments D , 287 References
ELECTROCHEMICAL PULSE DETONATION ENGINE 289
V.P. Korobeinikov, V. V. Markov, I. V. Semenov, P. D. Pedrow, and S. Wojcicki
1 Introduction 290 2 Governing Equations oqo
3 Results of Calculations 4 Experimental Studies 5 Concluding Remarks 300
302 Acknowledgments
References
ABOUT A DETONATION ENGINE WITH EXTERNAL
COMBUSTION 303
A.A. Vasil'ev
1 Introduction 2 Detonation Wave Diffraction Experiments and Results .... 305 3 Detonation Wave Rotation Experiments and Results 309

CONTENTS
4 Simple Estimates of Layer Sizes at Detonation Wave Diffraction oin
5 Criterion of Quasi-Stationary Detonation Wave Propagation Around the Curvilinear Surface 311
6 Simple Estimation of a Layer Size Within the Scheme of Reinitiation Centers. Mathematical Model and Its Corollary 3^2
7 Concluding Remarks 314 References 014
DUAL-FUEL CONCEPT FOR ADVANCED PROPULSION .... 315 S.M. Frolov, V. Ya. Basevich, and A. A. Vasil'ev
1 Introduction 3-^5
2 Kerosene-Hydrogen Peroxide Dual-Fuel System as a Propellant for Advanced Propulsion 316
3 Reactivity of Kerosene-Hydrogen Peroxide Blends 317 4 Sensitivity of Kerosene-Hydrogen Peroxide Blends
to Premature Ignition 3^9
5 Detonability of Kerosene-Hydrogen Peroxide Blends 320 6 Deflagration and Detonation Parameters of Heterogeneous
Dual-Fuel Systems 325
7 Detonability of a Dual-Fuel System Based on Aqueous Solutions of Hydrogen Peroxide 326
8 Effect of Fuel Blending on the Specific Impulse 329 9 Concluding Remarks 33Q Acknowledgments 33-^ References 009
MATHEMATICAL MODEL OF A SUPERSONIC PULSED DETONATION RAMJET ENGINE 333 V. G. Akxandrov, A.N. Kraiko, and K.S. Reent
1 Introduction 000
2 Brief Description of the Mathematical Models of SPDRE, SCRAMJET and RAMJET ' . . 335
3 Comparison of Thrust and Local Characteristics of SPDRE SCRAMJET and RAMJET ' . 336
4 Concluding Remarks 34O Acknowledgments 34I References 041
XI

HIGH-SPEED DEFLAGRATION fc DETONATION: FUNDAMENTALS fc CONTROL
Concluding Remarks 345
DETONATION RESEARCH IN THE NEW DECADE 347 G. D. Roy
Panel Discussion Concluding Remarks 353
References 355
Xll

O.V. ACHASOV
Heat & Mass Transfer Institute Belarus National Academy of Sciences 15, P. Brovka Str. Minsk 220072 Republic of Belarus
V. G. ALEXANDROV
P. I. Baranov Central Institute of Aviation Motors (CIAM) 2, Aviamotornaya Str. Moscow 111250, Russia
D.S. BAER
High Temperature Gasdynamics Laboratory, Department of Mechanical Engineering Stanford University Stanford, CA 94305, USA
D.I. BAKLANOV
United Institute of High Temperature Russian Academy of Sciences 13/19, Izhorskaya Str. Moscow 127412, Russia
J.A. BALDWIN
High Temperature Gasdynamics Laboratory Department of Mechanical Engineering Stanford University Stanford, CA 94305, USA
V.YA. BASEVICH
N.N. Semenov Institute of Chemical Physics Russian Academy of Sciences 4, Kosigin Str. Moscow 117977, Russia
D. BJERKETVEDT
Faculty of Technology Telemark University College 56, Kj0lnes Ring, N-3914 Porsgrunn, Norway
A. P. BOICHENKO
M.V. Lomonosov Moscow State University Moscow 119899, Russia

HIGH-SPEED DEFLAGRATION fc DETONATION: FUNDAMENTALS fc CONTROL
CM. BROPHY
Naval Postgraduate School 699 Dyer Road Monterey, CA 93943, USA
S.-C. CHANG
NASA Glenn Research Center 21000 Brookpark Rd. Cleveland, OH 44135, USA
C. COUQUET
Laboratoire de Combustion et de Detonique UPR 9028 DU CNRS ENSMA Universite de Poitiers 1, Avenue Clement Ader BP 40109, 86961 Futuroscope Cedex, France
E. DANIAU
Laboratoire de Combustion et de Detonique UPR 9028 DU CNRS ENSMA Universite de Poitiers 1, Avenue Clement Ader BP 40109, 86961 Futuroscope Cedex, France
D. DESBORDES
Laboratoire de Combustion et de Detonique UPR 9028 DU CNRS ENSMA Universite de Poitiers 1, Avenue Clement Ader BP 40109, 86961 Futuroscope Cedex, France
W. FAN
High Temperature Gasdynamics Laboratory Department of Mechanical Engineering Stanford University Stanford, CA 94305, USA
S.M. FROLOV
N.N. Semenov Institute of Chemical Physics Russian Academy of Sciences 4, Kosigin Str. Moscow 117977, Russia
T. FUJIWAR A
Department of Aerospace Engineering Nagoya University Heiwaga-oka, Meito-ku, No. 5-207-B105 Nagoya 464-8603, Japan
K. FUKIBA
Department of Aerospace Engineering Nagoya University Heiwaga-oka, Meito-ku, No. 5-207-B105 Nagoya 464-8603, Japan
L.G. GVOZDEVA
United Institute of High Temperature Russian Academy of Sciences 13/19, Izhorskaya Str. Moscow 127412, Russia
R.K. HANSON
High Temperature Gasdynamics Laboratory Department of Mechanical Engineering Stanford University Stanford, CA 94305, USA
L. HEMERYCK
Department of Chemistry Royal Military Academy 30, Av. de la Renaissance Brussels 1000, Belgium
A. J. HIGGINS
McGill University 817 Sherbrook St. W. Montreal, Quebec H3A2K6, Canada
xiv

CONTRIBUTORS
W. INGIGNOLI
Laboratoire de Combustion et de Detonique, UPR 9028 DU CNRS ENSMA, Poitiers, Site du Futuroscope BP 40109, 86960 Futuroscope Cedex, France
P.T. JENKINS
High Temperature Gasdynamics Laboratory Department of Mechanical Engineering Stanford University Stanford, CA 94305, USA
A. JENSSEN
Norwegian Defence Construction Service, Oslo, Norway
R. JOHNSON
Naval Postgraduate School 699 Dyer Road Monterey, CA 93943, USA
V. P. KOROBEINIKOV
Institute for Computer Aided Design Russian Academy of Sciences 19/18, 2nd Brestskaya Str. Moscow 123056, Russia
A.N. KRAIKO
P. I. Baranov Central Institute of Aviation Motors (CIAM) 2, Aviamotornaya Str. Moscow 111250, Russia
J.H.S. LEE
McGill University 817 Sherbrook St. W. Montreal, Quebec H3A2K6, Canada
M.H. LEFEBVRE
Department of Chemistry Royal Military Academy 30, Av. de la Renaissance Brussels 1000, Belgium
P.C.E. JORGENSON
NASA Glenn Research Center 21000 Brookpark Rd. Cleveland, OH 44135, USA
J.C. LEGROS
Free University of Brussels Brussels 1050, Belgium
K. KAILASANATH
Laboratory for Computational Physics and Fluid Dynamics US Naval Research Laboratory 4555 Overlook Av. Washington, DC 20375, USA
B.A. KHASAINOV
N. N. Semenov Institute of Chemical Physics Russian Academy of Sciences 4, Kosigin Str. Moscow 117977, Russia
V.A. LEVIN
Institute of Mechanics M.V. Lomonosov Moscow State University 1, Michurinskii Av. Moscow 119899, Russia
C. LI
Laboratory for Computational Physics and Fluid Dynamics US Naval Research Laboratory 4555 Overlook Av. Washington, DC 20375, USA

HIGH-SPEED DEFLAGRATION fc DETONATION: FUNDAMENTALS fc CONTROL
V.V. MARKOV
Institute for Computer Aided Design
Russian Academy of Sciences 19/18, 2nd Brestskaya Str.
Moscow 123056, Russia
I.O. MOEN
National Defence Headquarters
Ottawa, Canada
S. MULLAGIRI
Department of Aerospace
Engineering, Mechanics and Engineering Science
University of Florida
231 AER Gainesville, FL 32611, USA
S.B.MURRAY
Defence Research Establishment
Suffield, Station Main Box 4000, Medicine Hat 52
Canada
G. PATNAIK
Laboratory for Computational
Physics and Fluid Dynamics US Naval Research Laboratory
4555 Overlook Av. Washington, DC 20375, USA
P. D. PEDROW
Washington State University
Pullman, WA 99164-2752, USA
O.G. PENYAZKOV
Heat fe Mass Transfer Institute
Belarus National Academy
of Sciences 15, P. Brovka Str. Minsk 220072 Republic of Belarus
P. PINARD
McGill University
817 Sherbrook St. W. Montreal, Quebec H3A2K6, Canada
J.N. NECHAEV
K. E. Ziolkovskyi Russian Space
Academy, Russia
D.W. NETZER
Naval Postgraduate School
699 Dyer Road Monterey, CA 93943, USA
V.F. NIKITIN
M. V. Lomonosov Moscow State University Moscow 119899, Russia
S. J. PARK
Mechanical Engineering Department
Wayne State University
Detroit, MI, USA
K. S. REENT
P.I. Baranov Central Institute
of Aviation Motors (CIAM) 2, Aviamotornaya Str. Moscow 111250, Russia
G. D. ROY
US Office of Naval Research 800 North Quincy Str. Arlington, VA 22217, USA
S.T. SANDERS
High Temperature Gasdynamics Laboratory, Department of Mechanical
Engineering Stanford University Stanford, CA 94305, USA
xvi

CONTRIBUTORS
N. B. SCHERBAK
United Institute of High Temperature Russian Academy of Sciences 13/19, Izhorskaya Str. Moscow 127412, Russia
C. SEGAL
Department of Aerospace Engineering, Mechanics and Engineering Science University of Florida 231 AER Gainesville, FL 32611, USA
I.V. SEMENOV
Institute for Computer Aided Design Russian Academy of Sciences 19/18, 2nd Brestskaya Str. Moscow 123056, Russia
V. M. SHEVTSOVA
Free University of Brussels Brussels 1050, Belgium
J. SINIBALDI
Naval Postgraduate School 699 Dyer Road Monterey, CA 93943, USA
N.N. SMIRNOV
M. V. Lomonosov Moscow State University Moscow 119899, Russia
A. M. STARIK
P. I. Baranov Central Institute of Aviation Motors (CIAM) 2, Aviamotornaya Str. Moscow 111250, Russia
A. SULMISTRAS
CDL Systems Limited Calgary, Canada
A. I. TARASOV
Institute of Mechanics M. V. Lomonosov Moscow State University 1, Michurinskii Av. Moscow 119899, Russia
P.A. THIBAULT
Combustion Dynamics Limited Medicine Hat Canada
G.O. THOMAS
University of Aberystwyth Aberystwyth, Wales
N. S. TITOVA
P. I. Baranov Central Institute of Aviation Motors (CIAM) 2, Aviamotornaya Str. Moscow 111250, Russia
A.V. TROTSYUK
M. A. Lavrent'ev Institute of Hydrodynamics Siberian Branch of the Russian Academy of Sciences 15, Lavrent'ev Av. Novosibirsk 630090, Russia
M.V. TYURNIKOV
M. V. Lomonosov Moscow State University Moscow 119899, Russia
P.J. VAN TIGGELEN
Laboratoire de Phisico-Chemie de la Combustion Universite Catholique de Louvain 1, Place Louis Paster Louvain La Neuve B-1348 Belgium
xvu

HIGH-SPEED DEFLAGRATION fc DETONATION: FUNDAMENTALS fc CONTROL
A.A. VASIL'EV
M. A. Lavrent'ev Institute of Hydrodynamics Siberian Branch of the Russian Academy of Sciences 15, Lavrent'ev Av. Novosibirsk 630090, Russia
B. VEYSSIERE
Laboratoire de Combustion et de Detonique, UPR 9028 DU CNRS ENSMA, Poitiers, Site du Futuroscope BP 40109, 86960 Futuroscope Cedex, France
S. WOJCICKI
Washington State University, Pullman, WA 99164-2752, USA
A.C. YOSHINAKA
McGill University 817 Sherbrook St. W. Montreal, Quebec H3A2K6, Canada
S.T. J. YU
Mechanical Engineering Department Wayne State University 5050 Antonee Wayne Drive Detroit, MI, USA
F. ZHANG
Defence Research Establishment Sumeld, Station Main Box 4000, Medicine Hat 52 Canada
R. ZITOUN
Laboratoire de Combustion et de Detonique, UPR 9028 DU CNRS ENSMA Universite de Poitiers 1, Avenue Clement Ader BP 40109, 86961 Futuroscope Cedex, France
XVlll

Early attempts to utilize the power obtained from explosions for peaceful appli- cations date back to late 17th - early 18th centuries and the contributions of C. Huygens and J. Allen are noteworthy. In 1729, John Allen proposed a jet propelled ship [1] "whose operation is owing to the explosion of gunpowder" in a proper engine placed within a ship. Before this archival contribution, gun- powder was predominantly used in artillery for destructive purposes. Later on, S. Carnot (1796-1832) has formulated the main principles that govern the devel- opment of novel propulsion devices and provided guidance to the developers [2]; they remain valid so far:
"We should not expect ever to realize in practice all the motive power of combustibles. The attempts made to attain this result would be far more hurtful than useful if they caused other important considerations to be neglected. The economy of the combustible is only one of the conditions to be fulfilled in heat-engines. In many cases it is only secondary. It should often give precedence to safety, to strength, to the durability of the engine, to the small space which it must occupy, to the small cost of installation, etc. To know how to appreciate in each case, at their true value, the considerations of convenience and economy which may present themselves; to know how to discern the more important of those which are only secondary, in order to attain the best results by the simplest means: such should be the leading characteristics of the man called to direct, to co-ordinate the labors of his fellow men, to make them co-operate towards a useful end, whatsoever it may be."
By the end of the 20th century, it has been recognized that for a variety of applications with increasing demands, the existing propulsion tools exhibit limitations and disadvantages. The supreme dominance of gas-turbine engines lasted for several decades will continue to be so for many more years. How- ever, modern science and technology have already provided the seeds for the development of a novel propulsion device often referred to as a Pulse Detonation
xix

HIGH-SPEED DEFLAGRATION & DETONATION: FUNDAMENTALS fc CONTROL
Engine (PDE). The operational principle of a PDE is based on repeated conver- sion of the chemical energy of a combustible fuel in a propagating detonation (or high-speed deflagration) wave. Such a propulsion device is attractive because of its anticipated simplicity of design and operation and less fuel consumption compared to a gas-turbine engine generating similar power. As it is natural with new concepts for a more efficient power device, numerous variations and combinations of the PDE design have appeared, which need further testing and
evaluation. The International Colloquium on Control of Detonation Processes (Moscow,
Russia, July 4-7, 2000), organized, in a sense, to explore the principles elucidated by Carnot over a century ago, attracted the attention of many distinguished re- searchers working in the field of chemical propulsion, particularly of its rapidly progressing branch — 'Pulsed Detonation Propulsion.' One of the main objec- tives of the Colloquium has been to disseminate to the research community and practicing engineers the state-of-the-art in the fundamental knowledge of det- onations and high-speed deflagrations and their control, with the emphasis on application to advanced propulsion. To this end, the editors have tried to put together this volume of selected papers, which contain the essence of the cur- rent knowledge on the subject. The book is organized under the following three
parts:
Part 1: High-Speed Deflagration: Fundamentals and Control;
Part 2: Detonation: Fundamentals and Control;
Part 3: Pulsed Detonation Engines.
HIGH-SPEED DEFLAGRATION: FUNDAMENTALS AND CONTROL
Part 1 deals primarily with deflagration-to-detonation transition (DDT) and detonation initiation. The contributions pertaining to the fundamental aspects of transient high-speed deflagrations are presented.
Smirnov et al. contribute to the fundamental knowledge of DDT in gaseous hydrocarbon-air mixtures. Experimental and computational studies of DDT in a tube with several turbulizing elements in the form of connecting cham- bers have shown that there exists the optimum number of the elements en- suring the shortest predetonation distance and time. Also studied are the ef- fects of fuel-air ratio and initial temperature of the reactive mixture on the DDT in the tube with turbulizing elements. In particular, it has been proved
xx

INTRODUCTION
that the increase of initial temperature decreases the predetonation length and time.
Achasov & Penyazkov consider various gasdynamic methods for controlling DDT in gas-fueled systems. Extensive experimental data on the effect of shock wave focusing, collision of nonreacting supersonic jets, and interaction of flame jets are analyzed in terms of their potential in shortening the predetonation distance and time.
The effects of flame igniter type, turbulizing obstacles, and sensitizing agents (acetylene, N02, nitrates, etc.) are thoroughly discussed by Higgins et al. on the basis of experimental observations of high-speed deflagrations and DDT in gaseous mixtures. It has been found that different igniters (spark plugs and jet igniters) show different ability to promote a more rapid transition from laminar to turbulent flame, but do not significantly influence the predetonation distance. Only relatively large-scale jet igniters are capable of direct detonation initiation. Obstacles, when properly installed in the tube, can considerably decrease the predetonation distance by increasing the turbulent burning rate and the strength of compression waves ahead of the flame. Sensitizing agents become effective on the final stage of the DDT process, when chemical kinetics becomes a dominant factor. There is the implication that a promising way to dramatically reduce the DDT length is to preprocess a heavy hydrocarbon fuel via partial oxidation to more sensitive hydrocarbons and free radicals.
Starik & Titova analyze theoretically another possibility to sensitize the re- active mixture by means of preliminary excitation of molecular oxygen in an electric discharge. A detailed chemical kinetic model to describe reactivity of hydrogen-oxygen mixtures with due regard for preexcitation of 02 molecules has been developed and successfully applied to the problems of flame ignition and detonation initiation in a supersonic flow.
DETONATION: FUNDAMENTALS AND CONTROL
Part 2 contains contributions on fundamental properties of developed detonation waves.
Hemeryck et al. present the results of numerical simulation of transient behavior of gaseous detonations, in particular during transition from a reac- tive to a nonreactive medium followed by the reverse process. As this phe- nomenon is relevant to PDEs, of particular interest are the conditions and pa- rameters controlling the re-ignition process following the stage of detonation decay.
xxi

HIGH-SPEED DEFLAGRATION fc DETONATION: FUNDAMENTALS fc CONTROL
Fujiwara & Fukiba investigate computationally the effect of transport proc- esses (viscosity and thermal conductivity) on the structure of gaseous hydrogen- oxygen detonations. The analysis indicates that molecular viscosity stabilizes the shape of soot patterns, forms more regular cell geometry and affects the cell size so that the predicted cell size approaches experimentally observed val- ues. Of particular interest are the simulations for narrow detonation channels that can shed new light to the problem of detonability limits. It is implied that viscous boundary layer on the channel wall decreases the reflection coeffi- cient of detonation thus 'making' the triple point weaker after collision with the
wall. A new promising computational approach to simulate transient detonations
is reported by Yu et al. Utilizing this Space-Time Conservation Element and Solution Element (CE/SE) method, all features of detonation structure, includ- ing transverse waves, triple points, Mach stems, counter-rotating vortices, and unburned pockets are resolved. The advantage of the approach is that it requires much less CPU resources as compared to its counterparts, and therefore can be used for a more detailed insight into the detonation structure at reduced time
and cost. Trotsyuk's contribution is relevant to gaseous detonation propagation m chan-
nels of complex geometry, in particular those with variable cross-section. For the first time, in numerical simulation, the existence of a maximum height of the Mach stem during detonation propagation over the long wedge has been proved. The use of a special algorithm of computational grid remeshing and moving pro- vided high resolution of the flow both near the wedge surface and in the vicinity of the leading shock wave. This allows one to simulate reflection of an almost arbitrarily wide detonation wave.
Experimental and computational studies of detonation transmission from a readily detonable fuel-oxidizer mixture to a less sensitive fuel-air mixture are presented by Murray et al. The emphasis is made on the efficiency of detonation transmission in terms of the required volume of the readily detonable mixture. The investigation focuses on three transmission configurations: (1) circular tube terminating in an annular orifice, (2) circular tube containing a bundle of much smaller tubes at its outlet or a tube terminated by a plate with multiple orifices, and (3) circular tube connecting with a cylindrical chamber consisting of a pair of parallel plates oriented normal to the tube axis. The experimental results show that configurations (1) and (3), under certain conditions, can be extremely efficient in detonation transmission to an unconfined space. The results appear to be very useful for PDE schemes using predetonators.
For practical applications, multiphase rather than gaseous detonations are of primary importance. The topic of discussion by Khasainov et al. is the structure of detonation waves in two-phase media comprising a gaseous explosive mixture and suspended aluminum particles. A propagating detonation wave is described by a two-velocity, two-temperature, 2D mathematical model. It has
xxii

INTRODUCTION
been shown that detonation in such a medium exhibits a cellular structure quali- tatively similar to that inherent to gaseous explosives. The effect of aluminum particle size and loading ratio on detonation stability and structure is thoroughly investigated.
PULSED DETONATION ENGINES
Part 3 includes contributions on various aspects of PDE performance and evalu- ation, as well as various approaches in organizing the operational process. Des- bordes presents a review of the early research on PDE and the approach to evaluating the ideal detonation propulsion performance based on single-cycle and multicycle PDE operation. Following are the mentioned advantages of the detonation propulsion over the standard deflagration-based propulsion:
(t) energy release takes place in a relatively narrow region and is quasi- complete;
(ii) heat losses remain limited because of a very intense energy release;
(in) expansion of high-pressure detonation products exhibits higher energy con- version efficiency than does expansion of combustion products;
(iv) expansion of detonation products obeys self-similarity; and
(v) no moving parts (except maybe for a mechanical valve in the thrust wall) required.
It has been shown that the minimum cycle duration associated with a given length of the combustion chamber is a very important parameter that influences the PDE thrust potential.
Kailasanath et al. focus on computational investigations of factors that con- trol the PDE performance. Based on a ID numerical analysis of the pressure histories on the thrust wall, the importance of the pressure relaxation process at the end of the detonation tube is emphasized. According to the analysis, the overall performance of PDE can be controlled within a wide range by means of exhaust nozzles of different shapes and dimensions. The other result concerns the effect of fuel-air fill in the detonation chamber. PDE thrust can be controlled by varying the amount of the fill. The results of numerical simulations have been compared with available experimental findings and a good qualitative agreement was noticed.
Some results of practical implementation of a PDE with a predetonator are reported by Brophy et al. Detonation of a two-phase JP-10/air mixture has

HIGH-SPEED DEFLAGRATION fc DETONATION: FUNDAMENTALS fc CONTROL
been demonstrated on a continuous air-flow PDE for both fully and partially vaporized aerosols. For detonating the fuel-air mixture it is necessary to preheat the inlet air above 375 K and ensure that fuel droplets are very fine in size (Sauter Mean Diameter of 3 ^m and smaller).
An alternative resonance-based approach to practical PDEs is considered by Levin et al. The pulse process is initiated by generating high-frequency self- oscillations in a gasdynamic resonator. The concept implies that the resonator is periodically filled with a specially prepared, nonequilibrium, exothermically reacting fuel-air mixture and reaction heat is released in the shock-induced quasi- detonation wave. It is reported that a thrust of about 2000 N has been attained in a laboratory-scale device along with a 15%-20% gain in fuel consumption as compared to the corresponding turbo-jet engine.
Baklanov et al. describe the other approach to practical PDEs based on a detonation chamber of variable cross-section and employing the concept of gasdynamic valves. In the proposed PDE scheme, detonation is initiated in a predetonator via DDT. Before the detonation wave (transmitted to the main combustion chamber) issues into the ambient atmosphere, hot detonation prod- ucts are allowed to expand into the feed manifolds of fuel and oxidizer, thus avoiding a new portion of the fuel-air mixture to fill the device. Once the deto- nation wave is exhausted and the rarefaction wave reaches the feed lines, a new portion of fuel and oxidizer enters the predetonator and the main combustion chamber, and the process repeats. It has been demonstrated experimentally that the device can operate at a frequency of up to 3 Hz without cooling the feed manifolds. With forced cooling of the manifolds, a frequency of 92 Hz was attained. In addition to these tests, a new mode (based on pulse overdriven detonations) of device operation has been observed and studied.
Reported by Daniau et al. and Mullagiri & Segal are the experimental studies pertaining to PDE-nozzle and PDE-inlet integrations.
It has been demonstrated by Daniau et al. (in single-pulse experiments) that cylindrical and diverging nozzles can significantly affect the PDE performance.
The back-pressure oscillations induced by the detonation tubes valving sys- tem in a multitube PDE are expected to affect the inlet operation. If a common single inlet is used as a plenum for multiple tubes it is important to know the consequences of the spillage from a closing tube into an adjacent opening tube. These issues are addressed by Mullagiri & Segal.
Jenkins et al. demonstrate the capabilities of modern diagnostics and nonin- trusive measurements of the most important parameters in a PDE. Diode-laser sensors based on absorption spectroscopy have been developed and successfully applied for in situ measurements of gas temperature, water vapor and fuel con- centration, as well as soot temperature and soot volume fraction during operation of laboratory-scale gas- and liquid-fueled PDEs.
Several new PDE concepts are described with substantiating evaluations. Ko- robeinikov et al. consider an electrochemical PDE, where a strong flame-induced
xxiv

INTRODUCTION
electrical discharge is applied to produce an imploding shock wave, which, after reflections, initiates detonation. Parameters of the imploding shock wave and the detonation wave have been estimated analytically and the ensuing flow patterns in the detonation tube have been numerically simulated.
A detonation engine with 'external' combustion is considered by Vasil'ev. The design is based on experimental realization of detonation in an annular gaseous layer with a fuel-free ambient atmosphere (external 'boundary') and a solid cylindrical surface (internal 'boundary'). It has been demonstrated ex- perimentally that, under certain conditions, a detonation wave can circulate around the solid cylinder with a constant angular speed. A mechanism of the phenomenon has been suggested, and a simple mathematical model has been developed.
A dual-fuel concept of PDE is considered by Frolov et al. Here, the liquid- fueled air-breathing propulsion device operates on two liquid fuels that are deliv- ered to the combustion chamber by means of controlled distributed injection and in situ mixing with each other and with air. The fuels are supposed to exhibit essentially different detonability. As an example, kerosene and hydrogen perox- ide are considered as fuel candidates. This concept is treated as an alternative to PDEs with predetonators, as it contains only one combustion chamber and uses the advantage of a readily detonable fuel to detonate a fuel blend. The use of the dual-fuel concept has been shown to allow the efficient control of energy density of the burning material, specific impulse and detonability in terms of the detonation cell size and critical initiation energy.
Alexandrov et al. describe the concept of a supersonic pulsed detonation ramjet engine. The operation process is controlled by periodic changes in fuel supply into the supersonic flow. Once the fuel is supplied, the detonation wave propagates upstream. When fuel supply is terminated, the detonation wave decays to the shock wave and is convected downstream. The new cy- cle starts from supplying the next portion of fuel into the detonation cham- ber. The engine needs to be started only once. The performance of such a device has been compared with alternatives such as subsonic ramjet and scramjet.
"Detonation Research in the New Decade" is presented by Roy in his Con- cluding Remarks. In addition to the technical panel elaborations on the topic:
What should be done to detonate a liquid fuel-air mixture in a short tube with a weak initiator?
he provides his view to some of the questions raised by the panelists. The steps that need to be taken to bring the technology to fruition are outlined.
To date we face the challenge of creating a new generation of stationary and propulsion power plants. This effort is another step to accomplish this mission. It is hoped that this book will help those who are already involved in this endeavor,
XXV

HIGH-SPEED DEFLAGRATION fc DETONATION: FUNDAMENTALS fc CONTROL
and numerous others who are interested to be involved in this field of propulsion
science and technology.
REFERENCES
1. Lyle Cummins, C, Jr. 1976. Internal Fire. Lake Oswego, Oregon: Carnot Press.
2. Carnot, S. 1960. Reflexions sur la puissance motrice du feu. Ed. E. Mendoza. New
York.
Editors
XXVI

PART ONE
HIGH-SPEED DEFLAGRATION:
FUNDAMENTALS
AND CONTROL

CONTROL OF DETONATION ONSET IN COMBUSTIBLE GASES
N. N. Smirnov, V. F. Nikitin, M. V. Tyurnikov, A. P. Boichenko, J.C. Legros, and V.M. Shevtsova
Investigation of deflagration-to-detonation transition (DDT) in gases are relevant to both explosion safety issues and pulse detonation generating devices. For these applications, the control of detonation onset is of major importance, although for different purposes. In explosion safety issues, it is aimed at preventing the DDT, while in pulse detonation gen- erators the focus is in promoting the DDT and shortening the predeto- nation length. The paper presents the results of theoretical and experi- mental investigations of control of the DDT processes in hydrocarbon-air gaseous mixtures pertaining to propulsion applications. The influence of geometrical characteristics of the ignition chambers and flow turbuliza- tion on the onset of detonation, and the effect of temperature and fuel concentration is discussed.
1 INTRODUCTION
Since the time the two combustion modes — deflagration and detonation — were distinguished by Mallard and Le Chatelier [1], Bertelot and Vieille [2], and their theoretical explanations were found by Mikhelson [3], Chapman [4] and Jouguet [5], the transition processes between the two modes appeared to be the most intriguing. Investigations of DDT in hydrogen-oxygen mixtures [6-8] and later in hydrocarbon-air mixtures [9-11] showed the multiplicity of the DDT scenarios. The various modes of the detonation onset were shown to de- pend on a particular flow pattern created by the accelerating flame, thus mak- ing the transition process nonreproducible in terms of a detailed sequence of events.

HIGH-SPEED DEFLAGRATION & DETONATION
By now, there exist different points of view on the DDT mechanism: the "ex- plosion in explosion" mechanism by Oppenheim [7] and the gradient mechanism of "spontaneous flame" by Zel'dovich [12].
The later theoretical analysis showed that micro-scale nonuniformities (tem- perature and concentration gradients) arising in local exothermic centers ("hot spots") ahead of the flame zone could be sufficient for the onset of detonation or normal deflagration [10, 11, 13-18]. Analysis and comparison of theoreti- cal and experimental results showed that self-ignition in one or in a number of hot spots ahead of the accelerating flame followed by the onset of either detonation or deflagration waves brings to a multiplicity of transition scenar- ios [19]. The common feature of all those scenarios is the formation of local exothermic centers according to the stochastic Oppenheim mechanism followed by the onset of detonation at a micro-scale in one of the exothermic centers according to the spontaneous Zel'dovich mechanism [19]. Investigations of the reflected shock - laminar flame interactions bringing to the onset of detona- tion [20, 21] showed, as well, that the transition to detonation in a hot spot takes place through the gradient mechanism, while the shocks and flames inter- actions were important for creating the proper conditions for the hot spots to occur.
A new impetus to the interest in DDT processes has occurred due to the recent efforts in the development of pulse detonation devices. The probable application of these principles to create a new generation of engines has elevated the problem of DDT to the top of current research needs.
The present paper gives a brief summary of the effect of various factors con- trolling the DDT processes in gaseous mixtures from theoretical and experimen- tal investigations. The influence of the following factors was investigated:
(1) turbulization of the flow using different types of turbulizing elements;
(2) initial mixture temperature variations; and
(3) fuel concentration variations.
Theoretical modeling of the DDT process was performed using a three- equations turbulence model developed for this purpose.
2 MATHEMATICAL MODEL
2.1 Governing System of Equations
The system of equations describing turbulent gas flow was obtained by Favre averaging [22] of the equations for a multicomponent gas phase. The modified

HIGH-SPEED DEFLAGRATION: FUNDAMENTALS & CONTROL
k-e model is used to describe the behavior of the gas phase. The generalized model takes into account the influence of chaotic fluctuations of temperature on the rates of chemical reactions:
dtp + V-(pu) = 0 (!)
dt(pYk) + V • (PuYk) = -V • Ik + <jk (2)
dt(pu) + V-(pu®u) = pg- Vp+ V-r (3)
dt (pE) + V • (puE) =pu-g-V-pü-V-fg+V-(r-Ü) (4)
where p is the density; u is the gas velocity vector; Yk, Ik, and wk are the mass fraction, turbulent diffusive flux and specific mass flux due to chemical reactions for the fcth gas-phase component, respectively; g is the acceleration of gravity; p is the pressure; r is the turbulent viscosity tensor; E is the specific energy; and Iq is the turbulent energy flux.
Equations (1) to (4) describe the mass balance in the gas phase, mass bal- ance of the kth component, momentum and energy balance, respectively. The following relationships hold between the terms in Eqs. (1), (2):
£n = i, £/; = o, 5>fc = o * * k
The state equations for the gaseous mixture are the following:
k wk
it2 (5) E = J2Yk(cvkT+hok) + ^- + k
k 2.
where Rg is the universal gas constant, Wk is the molar mass of the fcth compo- nent, cvk is the specific heat at constant volume for the fcth component, and Ar is the turbulent kinetic energy.
The rate of production of the fcth component in chemical reactions, wk, is ac- tually the sum C:k = ]>>£, where wf is the production rate of the jfeth component
in the /?th reaction.
The term responsible for chemical transformations, dik is very sensitive to temperature variations, as it is usually the Arrhenius-type function. To take into account temperature variations, the source term ük in Eq. (2) was modeled using the Gaussian quadrature technique.
Considering temperature T as a stochastic function with the mean value T and the mean squared deviate 6 = TV, the mean value of any function having T as an independent variable is determined as follows:

HIGH-SPEED DEFLAGRATION k DETONATION
7(f) = J f(r + Cs/6)pd{Qd<;
where C is a random value with zero expectation and unit deviate; its proba- bility density function is Pd(C). To estimate the integral, the Gaussian quadra- ture technique [23] is applied. A detailed description of the procedure will be given in Section 1.3. In our case, /(T) is the Arrhenius function of tempera-
ture. The mean value of wk is found by using these definitions. As for the mass
fractions and density, their mean values were used in the Arrhenius law for wkt
as the functions wk(p) and wfc(Yjt) are not as strong as w*(T). The turbulent heat flux Iq in Eq. (4) is a sum of two terms:
Tt = j9 + Y,{cpkT + h0k)Tk (6)
k
where L is interpreted as the turbulent conductive heat flux, cpk is the specific heat at constant pressure, hDk is the specific enthalpy of the fcth component at
T = 0. The eddy kinematic viscosity vx is expressed according to the k-e model as
0.2 r°k
where C° is the model constant, e is the dissipation of the turbulent kinetic
cncrECY- Application of the standard k-e model to compressible flows [22] results in
the following relations for the turbulent fluxes:
T = (H + pvl) fvu + VuT - |V • uu) - ^pkU (7)
fk = -P(D+»Av-Yk (8)
'>-U + Ec^-Jv-T (9)
where U is the unit tensor; /x is the effective laminar viscosity; D is the overall laminar diffusion coefficient; ad and a% are the k-e model constants; A is the effective laminar thermal conductivity.
The closure relationships for the model are represented by the equations for
k,0, and e:
"1

HIGH-SPEED DEFLAGRATION: FUNDAMENTALS & CONTROL
dt (pk) + V • (puk) = V • ( (fi + Py\ Vkj +T* -Vu-pe (10)
9, (pe) + V • (pus) = V • ( ^ + p^j W) + Z- (C°er* ■ Vu - Clpe) (11)
dt(P6) + V-(pu0) = V- lU + J2cPkP~)^A+Pe + W9-De (12)
where Cfe, C§£, ak, and cr£ are the k-e model constants; r* is the Reynolds tensor term within the effective viscosity tensor r; the production terms Pe, Wa
and the dissipation term De are determined by the following formulae:
(13) W„ = -J2Z^Vhok, k
e De = CgpZcpkjc Qm_e
When deriving the production term We due to chemical reactions, the Arrhe- nius law for chemical transformations was assumed. It is discussed in Section 1.2. To calculate the correlation iokT', the Gaussian quadrature technique was applied similar to that used for calculating the mean Arrhenius terms (see Section 1.3). The dissipation term Ds was determined based on the assumption that the tem- perature dispersion cannot exceed its maximum possible value 6m (because the value of T = T + T' cannot be negative). However, the production terms do not grant the presence of such a constant. To grant it, the multiplier l/(0m - 9) is incorporated into the dissipation term (the other multipliers are standard [24]). In order to estimate the value of 6m, one can notice that the probability of the deviate to exceed twice the mean deviate is less than 1% for the normal deviate. Also, one can see that the mean temperature deviate in experiments reported in [24] did not exceed a half of the maximum mean temperature. With this, 6m is estimated as follows:
e™ = T (14)
The constants in Eqs. (10), (11) take the following standard values [22]:
Cß = 0.09, Cu = 1.45, C2t = 1.92, ad = 1, at = 0.9, ak = 1, <r£ = 1.3 (15)
The dissipation constant Cg in Eq. (15) is taken from the data of [24]:
Cg = 2.8

HIGH-SPEED DEFLAGRATION fa DETONATION
2.2 Chemical Interactions in the Gaseous Phase and Temperature
Deviate Production
The gaseous phase is supposed to contain the following set of species: 02, C„Hm,
CO, CO2, H2, H20, N2. The chemical potential of the hydrocarbon fuel, h°2, is considered to be a
problem parameter, along with its composition n and m. The potential depends not only on n and m but also on particular hydrocarbon fractions the fuel consists of. The number of species in the gaseous phase is denoted as A' (A = 7). The following overall reactions between the species listed above are considered:
^ntlm +
CO + 0.5O-2
CO2 + M
H2 + 0.5O2
H20 + M
ff-H20 + (l nCO
C02
■ CO + 0.5O2 + M
•H20
• H2 + 0.5O2 + M
■*>=*
Here, a is the share of water in hydrocarbon decomposition. This parameter depends on the particular fuel composition (similar to the hydrocarbon chemical potential). Denote the number of reactions as B = 5. The rates of species formation are supposed to yeild the Arrhenius law and the law of acting masses. With multiple reactions, the formation rates are split into elementary parts:
B
ß=l
where wf is the kth species formation rate per unit volume due to the /?th • 3
reaction. Assume the following formulae for uk :
W\ W2
ß = l
in m\ Wi ^ = {2+CTJ)W'2
ul = —n- Wr 3/,i
'3- -W2- (16)
^ = -(I-*)T m W5 .1
2 W2
w.
. 1 rn W& .,
K w\ = u>\ = 0

HIGH-SPEED DEFLAGRATION: FUNDAMENTALS fc CONTROL
ß = 2
*r Yl Y "I = -p2W3-±-±A2(T) = -pW3K2(p,Y,T)
Ulf lffi 1-.2
2W, -uii
■ 2 W4 . 2
(17)
Wa 3
, w| = w| = d>| = w? = 0
/? = 3
'«8 = ^*-U(:r)
'l 2W4
4
W4 PV -pW4«3(^y;T)
•3 W3.3 3 WA
4
(18)
ws : Uli ■ uii = uii
0 = 4: <
Yi Y "i = -P2W5-L-±A,(T) = -PW5K4(p,Y,T)
.4 1^1.4 W? = Ulf 2 W* 5
">4 _ ^6.4 W?
PF5 5
(19)
^2 = ^3 = ^4 = W? = 0
ß = 5
ü* = -P2W6^-~A5(T) = -pweK5(p,Y,T)
,',5 — 1 Wi. 2W6
W' • 5 W5 . 5 uii = u° 5 W6
6
Wo = Wo
(20)
: Ü\ = W3-
The Arrhenius term for the /?th reaction, ^(T), is assumed to have the following structure:
A KT) = ( K"*» {-¥) • T^ (21)
where /^ is the preexponential factor, Taß is the activation temperature, and Tmß is the minimum temperature. The notations Kß(p, Y, T) in Eqs. (16) to (20)

HIGH-SPEED DEFLAGRATION U DETONATION
are used for the sake of convenience. They can be referred to as the /3th reaction
rate per unit mole of fuel. For the turbulence model, the expressions for up
k must be averaged betöre substituting into the species balance equations. In the model under considera- tion, it means that the mean Arrhenius terms Aß(T) should be expressed via the mean temperature and its deviate T.
The temperature deviation production term for multiple species and reactions
is the following:
ß=l fc=l
The minus sign in Eq. (22) is due to the fact that the chemical energy release is negative with respect to the variation of the mixture chemical potential.
To find out how We is expressed for the set of species and chemical reactions under consideration, substitute Eqs. (16)-(20) into Eq. (22) taking into account that the chemical potentials for elementary components are zero.
J2Eh°"k = plWihK-Ki) + W3h°3(nKi - K2 + K3)
ß=lk=l
+ W4ä°(K2 - to) + w6h° (°"YKl + KA ~ K5)l
= p[Kl (nW3h°3 + a^Wehl - W,h°)
+ (K2 _ K3)(WAh\ - W3hl) + (K4 - iis)W6hl] (23)
Equation (23) indicates that in order to obtain the term We, one should find the values oiT'Aß(T) and then compose the corresponding linear combination
of them.
2.3 Averaging Nonlinear Functions
This section describes how to obtain the mean values of Aß(T) and T'Aß(T) in terms of the mean temperature and its deviate.
Consider a random variable £ distributed with the probability density func- tion (PDF) Pd{0- The main properties of £ and its PDF Pd(0 are determined by the following relationships:
/ Pd{x)dx = 1
J xPd(x)dx = £
f{x-1)2Pd(x)dx = W
10

HIGH-SPEED DEFLAGRATION: FUNDAMENTALS fc CONTROL
Now, the temperature T (or any other scalar function) can be expressed as a random variable decomposed into its mean value Tm — T and its mean deviate Td = VT'T'. The temperature deviate T" is itself a random variable with the mean value equal to zero and deviate equal to Td. The goal is to express f(T) and Tf(T) in terms of Tm and Td.
Assuming that the temperature deviate is distributed with the PDF Pd(x), one obtains:
f(T) = ff(Tm+x)Pd(x)dx (24)
T'f(T) = Jxf(Tm + x)Pd(x)dx
The integrals in Eqs. (24) are to be estimated using only one parameter Td
at infinite number of degrees of freedom. In this case, the Gaussian quadrature technique with a small number of terms (2 to 3) is the best choice. The Gaussian quadrature could be applied to a weighted function integration if the function and its weight are not oscillatory. The Arrhenius function yeilds this condition. It is assumed that the PDF also yeilds this condition.
The Gaussian quadrature then provides the following estimate:
/ f(x0 + x)Pd(x)dx
j- j+
= J2aJf(x° - xJ) + °o/(*o) + J2aff(x° + xl) (25) 3 = 1 3 = 1
where {xj} and {xf} are the positive monotonously increasing sequences. If so = xm is the mean value of variable x, x' is its deviate, and Pd(x) is the PDF of x1, then the coefficients of the quadrature yeild the following correlations:
J- _ j+
E°j + «o + E at - l 3 = 1 3 = 1 J- J+ £ ajxj = £ afxf (26)
3=1 3=1
E«7(*7)a+"£«i+(*/)a = «2 3=1 3=1
Equations (26) are derived from the normalization condition, from the fact that the mean of x' is zero, and from the definition of the mean squared deviate.
All the uncertainties in determining the coefficients by Eqs. (26) are due to an uncertain order of the quadrature and uncertain shape of Pd(x).
11

HIGH-SPEED DEFLAGRATION h DETONATION
Leaving only 3 terms for estimating the integrals (including the central term) and assuming that the PDF for the deviate is symmetric (even), one obtains that J+ = J- - 1 (order), xj = xf = Xj (symmetry), and:
a~[ + a0 + a\ - 1
a-, = a+ (27)
a~[x\ + a^xl — x~d
This enables one to express all the quadrature terms as:
+ - 1 aT — a, = —~
a0 = l-\ (28) X
»1 = Xxd
The value \ (of the order of 1) depends only on the shape of the PDF accepted for the model. It can be estimated using the fourth moment techniques.
Let the distribution Pd(x) has zero expectation and unit deviate. Also, let it be symmetric (even). Then, the third moment of Pd(x) (together with all odd moments) will be zero, and the fourth moment will be expressed using the Gaussian quadrature as follows:
h= [x4pd(x)dx = \x4 = r J X
(29)
Then, if the fourth moment 74 is known from the direct integration of a partic- ular assumed PDF, then x can be obtained from Eq. (29).
Table 1 presents the values of \ (hereinafter referenced to as a relative sample deviation) for different shapes of PDF with zero expectation and unit deviate acceptable for the case considered.
It can be seen from Table 1 that the value of \ is on the order of 1. The most suitable cases are Gaussian and triangular distributions.
To get the averaged terms A0(T) and T'Aß(T), the technique described above is used and the following expressions are obtained:
J_ 2X
2 MT) = 7T^Aß(T™-xTd)
+ (l-\)Aß(Tm)+^Aß(Tm+xTd) (30)
12

HIGH-SPEED DEFLAGRATION: FUNDAMENTALS & CONTROL
Table 1 Relative deviation values depending on the shape of PDF
PDF type PDF formula, Pd (*) X
uniform 1 -y, \x\<V3;
[ 0, otherwise
[W \Y « 2.3238
triangular
l 0, otherwise
6
VTE « 1.5492
normal (Gaussian) 1 ( X7\ V^Sft
_
2^°XP V 2 ) 1.7321
exponential -^exp(-V2|x|) Ve* 2.4495
T'MT) = -^ (-XÜ) 4, (Tm - *Td) + ~XTdAß (Tm + xTd) 2X2
T2 Aß(Tm + xTd) - Aß(Tm - xTd) (31)
Expression (31) indicates that the production of the squared temperature deviate 9 in chemical reactions is proportional to the squared deviate itself and the finite difference approximating the first derivative of the Arrhenius function at T = Tm (but not equal to the derivative).
The value of x to be substituted into Eqs. (30) and (31) can be taken from Table 1 for a chosen type of PDF. In the following, the value X = VS will be used that was obtained for the case of normal distribution.
2.4 Boundary Conditions
The boundary of the computational domain contains the outer walls and the axis of symmetry. The walls for the case of cylindrical symmetry could be a combination of coaxial cylindrical surfaces and rings or plates orthogonal to the axis.
The boundary conditions for the gas phase are set in accordance with the following considerations: the walls of the cylindrical domain are thermoinsulated
13

HIGH-SPEED DEFLAGRATION fc DETONATION
and noncatalytic, the velocity of gas is zero on the walls and the averaged gas motion is cylindrical^ symmetric. This leads to the von Neumann conditions for the temperature and species mass fractions at the cylinder walls (zero normal
derivatives):
n dT - n 9Yk - n
dT n 8Yk _ r = Ri, Xi<x<Xi, ux = ur = 0, öT > ~bV~
r = 0, 0<x<X, Wr = 0, -^ = 0, -^ = 0, -^-=0 (32)
The boundary conditions for turbulent parameters k, e, and 6 are set accord-
ing to the wall laws [19]:
Jfe = 0
I = ° <33> T- = ° On
where n is the normal vector to the wall. To take into account the wall damping effect, the coefficients of the original turbulence model are modified in accordance with the Lam-Bremhorst low Reynolds number models [22]:
Cu = Clh (34)
C2c = C2cfl
where fß, fi, and /2 are the positive functions: 0</M<1;/I>1;0</2<1-
2.5 Computational Techniques
The system of gasdynamic equations rewritten in a vector form [25] was split in three parts due to three different physical processes: source terms (including chemical) and generalized turbulence production terms formed the "local part of the equations; corrective terms formed the "hyperbolic part" of the equations; and diffusive, viscous and thermo-cunductive terms formed the "parabolic part
of the equations.
14

HIGH-SPEED DEFLAGRATION: FUNDAMENTALS & CONTROL
The local part was solved implicitly using an iterative algorithm indepen- dently for each grid node. The hyperbolic part was solved using the explicit FCT techniques [26]. The parabolic part was solved implicitly using 3-diagonal matrix solvers for linear equations [25]. The techniques removed viscosity from the time step criterion and reduced it to the Courant-Friedrichs-Lewy crite- rion.
To solve the system of equations, splitting by coordinates was used according to [27]. This splitting represents the general operator L(At) transferring the parameter vector to the next step, i.e., P"+1 = L(At)Pn, in the following form:
L(At) = Lx(Atx)Lr(Atr)Lr(Atr)Lx(Atx)
or
L{At) = Lr(Atr)Lx(Atx)Lx(Atx)Lr(Atr) (35)
The sequence of operators in Eq. (35) yields the condition of symmetry. To yield the condition of timesteps, which together with the condition of symmetry ensures the second order of approximation, it is necessary to have:
At = 2Atx - 2Atr
so that A^ = Atr = At/2. Both sequences of operators in Eq. (35) are able to represent the general operator L(At). To avoid the accumulation of disagree- ments, the sequences are changed at each time step.
Validation of the numerical scheme was performed by comparing the results of test runs with the exact gasdynamic solutions and with model experiments on turbulent flame propagation in confined volumes.
3 THEORETICAL INVESTIGATIONS OF THE DDT PROCESSES IN HYDRO CARBON-AIR MIXTURES
Theoretical and numerical investigations were aimed at distinguishing the factors having the strongest influence on the onset of detonation and thus determining the mechanisms for the control of the process.
It is well known that the presence of various turbulizing elements in the ini- tial sections of detonation tubes promotes DDT by shortening the predetonation length and time. Numerical experiments were undertaken for comparative stud- ies of the role of different turbulizing elements: Shchelkin spiral, orifice plates, turbulizing chambers of a wider cross-section. The results showed that the wider turbulizing chambers incorporated into the ignition sections of the tube promoted
15

HIGH-SPEED DEFLAGRATION fc DETONATION
the onset of detonation by shortening essentially the predetonation length for hy- drocarbon fuel-air mixtures.
The geometry of the test configuration is shown in Fig. 1. This contains a detonation tube with two chambers of a wider cross-section filled in with a combustible gaseous mixture at ambient pressure. Ignition of the mixture is performed by a concentrated energy release in the center of the first chamber. Five model reactions in the gas were taken into account: hydrocarbon decom- position, carbon monoxide oxidation, carbon dioxide decomposition, hydrogen oxidation, and water vapor decomposition. The kinetic parameters for the reac- tions were taken from [28]. The tube was 20 mm in diameter with two chambers 100 mm in diameter and 100 mm long incorporated in the ignition section. The connection between the two chambers was a tube 20 mm in diameter and 50 mm long. The values used for the parameters in the numerical experiments are given in Table 2 in SI units.
The fields of reaction intensity in the initiating section are shown in Fig. 1. The results are obtained for the fuel molar concentration of 0.015 ( the stoichio- metric concentration is 0.014).
Figure 2 illustrates the reaction intensity variations inside the tube after flame left the chambers. The figure shows the section of the tube 300 mm long, which begins 100 mm away from the end of the second chamber. The onset of the detonation wave takes place in this section for the present initial conditions. Figure 3 shows the evolution of gas pressure within the same section of the detonation tube.
The results indicate that on mixture ignition in the first chamber the process of flame propagation is rather slow and is determined mostly by initial turbuliza- tion of the mixture. The initially spherical flame changes its form to cylindrical on approaching the walls of the chamber. The flame accelerates and penetrates into the tube connecting the two chambers due to a gas flow caused by the expansion of reaction products. A high-speed jet penetrating into the second chamber brings to a very fast flame propagation both due to additional flow turbulization and the piston effect of the expanding reaction products supported by the continuing combustion in the first chamber. The line segments in Fig. 1 characterize the values of gas velocities.
Fast combustion in the second chamber results in a sharp pressure rise that pushes the flame further into the tube. A shock wave forms in the tube ahead of the flame zone. Pressure waves generated by continuing combustion in the chambers overtake the flame and cumulate with the leading shock wave. These processes cause the formation of nonuniformities in the combustion zone and give rise to transverse waves (Figs. 2a-2c; 3a, 36). At a certain place, the detonation arizes from a hot spot within the combustion zone.
For the present scenario of the process, the onset of detonation takes place at a distance of about 500 mm from the ignition section. Prior to the onset of detonation, hot spots appearing in the combustion zone produce compression
16

HIGH-SPEED DEFLAGRATION: FUNDAMENTALS & CONTROL
(Ä)
in (0 (/•)
iSw L? n6f Ctedm0!Uni(? w^e^emicaJ, reaCti°n ZOne for suc«ssive times after and (°) 4.5 Jns mS' (&) ' (°} ^ (d) ^ (e) 3"5' ^ 3'7' ^ 4-X> W 4'2' (0 4-4'
17

HIGH-SPEED DEFLAGRATION fc DETONATION
Table 2 Initial values for the governing parameters
Pressure (Pa) " ^13 " 10J
Temperature (K) 300
Temperature deviate (K) 1-° Turbulent kinetic energy (J/kg) 0-1 _3
Characteristic length of turbulence (m) 5 ■ 10 Volumetric share of 02 °-22
Volumetric share of CH4 °-22
Volumetric share of H2 °-° Volumetric share of H2O Volumetric share of CO2 "■" Volumetric share of CO °° Initial volumetric share of N2 °-78
Chemical potential of 02 (J/mol) 0.0 ^ Chemical potential of C„Hm (J/mol) -1-34 • 10 Chemical potential of H2 (J/mol) 0.0 ^ Chemical potential of H20 (J/mol) -2-395 • 10 Chemical potential of C02 (J/mol) -3-92 • 10 ^ Chemical potential of CO (J/mol) -1.105-10 Chemical potential of N2 (J/mol) 0.0 . Carbon in C„Hm
10
Hydrogen in CnHm
Water share in CnHm decomposition 0.2 ^ Preexponential factor: CH4 + 02 — CO + H2 110 Activation temperature (K): CH4 + 02 -* CO + H2 2.527 • 10 Minimum temperature (K): CH4 + 02 — CO + H2 500 ^ Preexponential factor: H2+ 02-+H20 7-10 Activation temperature (K): H2 + 02 - H20 1.0614 • 10 Minimum temperature (K): H2 + 02 — H20 600 ^ Preexponential factor: H20 — H2 + 02 8.7 • 10^ Activation temperature (K): H20 -► H2 + 02 3.5 ■ 10 Minimum temperature (K): H20 - H2 + 02 1000 ^ Preexponential factor: CO + 02 -> C02 5.89 • 10 Activation temperature (K): CO + 02 - C02 1.0614 • 10 Minimum temperature (K): CO + 02 -> C02 600 ?
Preexponential factor: C02 — CO + 02 2.75 • 10 Activation temperature (K): C02 - CO + 02 2.0418 • 10 Minimum temperature (K): C02 - CO + 02 1000 Total ignition energy (J) Ignition time (s) Ignition X position (m) Ignition ball radius (m)
2.0 l-io-4
5•10-2
1•10~2
18

HIGH-SPEED DEFLAGRATION: FUNDAMENTALS & CONTROL
(0
Figure 2 Predicted evolution of the chemical reaction zone in the detonation tube behind the ignition section for successive times after ignition: (a) 4.593 ms (b) 4 611 (c) 4.628, (d) 4.643, (e) 4.657, (/) 4.670, (g) 4.683, (h) 4.696, and (i) 4.709 ms
19

HIGH-SPEED DEFLAGRATION k DETONATION
Figure 3 Predicted evolution of pressure (in MPa) in the detonation tube in the transition zone for successive times: (a) 4.593 ms, (6) 4.611, (c) 4.628, (d) 4.643, (e) 4.657, (/) 4.683, (g) 4.696, and (h) 4.709 ins
20

HIGH-SPEED DEFLAGRATION: FUNDAMENTALS & CONTROL
waves irradiated from the reaction zone in all directions. Those waves support he eadmg shock as well as propagate backwards. As shown in Figs 3e to 3A
local explosion in one of hot spots gives birth to detonation and retonation wnvoc waves
The diagrams for axial pressure and mean cross-section pressure profiles for successive times are shown in Fig. 4. The vertical lines in Fig. 4 mark the location ot turbulizing chambers.
The decrease in the fuel molar concentration leads to formation of gallopping combust.on regimes. Those regimes are not caused by numerical instabilities as one cycle of the process develops within 150-200 time steps. The hot spots occur alternatively near the lateral walls (high pressure spikes) and in the tube center and bring to flame accelerations. The pressure profiles along the tube
TsnnU Ü miXtUre (fUel m0lal' concentration of 0.011, initial temperature ot 300 K) are shown m Fig. 5.
Figure 6 shows the corresponding reaction zone trajectories for rich (a) and ean (6) mixtures. Mean flame velocities are also marked for different parts of he trajectory It ,s seen that flame accelerates on entering the second chamber
then it slows down in rich mixtures (a). A high-speed combustion wave enters the detonation tube, where the DDT takes place. In lean mixtures (b) the gal-
fTnn <^bUS/tl0^egime pr°paSates with velocity oscillations within the range
of 400-800 m/s. The onset of detonation does not take place within the tube I m long.
Available data on the influence of the initial mixture temperature on the UÜ1 process in gases are contradictory. Numerical simulations of ignition and flame propagation in lean mixtures (fuel molar concentration of 0 011) at an elevated initial temperature (350 K) showed that the increase of initial tem- perature of the combustible mixture shortens the predetonation length and
Figure 7 shows the axial pressure profiles and Fig. 8 shows the flame tra- jectory. Comparing the results with respective curves in Figs. 5 and 66 one could see that the increase of initial temperature essentially promotes the DDT process m lean mixtures. Figure 7c illustrates the classical DDT scenario un- der which detonation occurs between the leading shock wave and the flame zone, overtakes the leading shock wave and, interacting with it, gives birth to an overdriven detonation wave that gradually slows down to a self-sustaining mode. Thus, the increase of mixture temperature promotes DDT in lean mix- tures.
Numerical modeling shows that the absence of turbulizing chambers results in an increase of the predetonation length and time. Further increase of the number of the chambers (more than two) does not bring to any essential variations of the predetonation length but increases the length of the initiating section Thus one or two chambers could be considered as an optimal configuration to promote the onset of detonation.
21

HIGH-SPEED DEFLAGRATION fc DETONATION
0.5
0.4
(2 0.3 2 a^O.2
0.1
0.0
Kl
- 2
I I I L 0.0 0.1 0.2 0.3 0.4 0.5
XI m
(a) 2.0
0.0 0.1 0.2 0.3 0.4 0.5 XI m
(c)
0 0 0.1 0.2 0.3 0.4 0.5 XI m
(b)
0.0 0.4 0.8 1.2 1.6 2.0 X/m
(d)
0 0 0.4 0.8 1.2 1.6 2.0 X/m
(e)
Figure 4 Predicted pressure profi,es along the tube «is for the fuel-air rnixture with fuel molar concentration of 0.015. (a) 1 - t - 1.8b ms J -^ , . _ 4 - 3.99 ms; (6): l-t = 4.21 ms and 2 - 4.31 ms; (c): 1 - t _ 4.45ms and 2 4.51 ms; (d): J - i = 4.59 ms and 2 - 4.63 ms; and (e): l-i = 4.70 ms, 2 4.9U,
and 3 — 5.23 ms
22

HIGH-SPEED DEFLAGRATION: FUNDAMENTALS & CONTROL
0.5
0.4
£ 0.3
<£ 0.2
0.1 h
0.0
l ■■■->••■ <"t |
f\ 1 [ 1
1
h V K/~
i 1 i i i
2.0
1.6
& 1.2 S <C 0.8
0.4
0.0 0.1 0.2 0.3 0.4 0.5 X/m
(a)
0.0 J L J 1 1 L 0.0 0.2 0.4 0.6 0.8 1.0
X/m (b)
Figure 5 Predicted pressure profiles along the tube axis in a galloping combustion mode for the fuel-air mixture with fuel molar concentration of 0.011. (a)- 1 — t = 3.79 ms, 2 — 5.05, 3 — 6.02, and 4 — 6.20 ms; (6): l—t = 6.20 ms, 2 — 6.63, 3 — 7.04, 4 — 7.27, 5 — 7.44, 6 — 7.67, and 7 — 7.96 ms; (c): 1 — t == 7.96 ms, 2 — 8.16, 3 — 8.28, 4 — 8.52, 5 — 8.67, 6 — 8.83, 7 — 9.00, and 8 — 9.27 ms
4 EXPERIMENTAL INVESTIGATIONS OF THE DDT IN TUBES WITH TURBULIZING CHAMBERS
To investigate experimentally the control of DDT process in tubes by using turbulizing chambers of a wider cross-section, the pulse detonation device was used allowing to vary the geometries of turbulizing chambers (Fig. 9). The
23

HIGH-SPEED DEFLAGRATION & DETONATION
^
2.0
1.6
1.2
0.8
0.4
0.0
-
- 1950//
-
11 260 4,6 I
15 Lc^U^l030
1
2.0
1.6
1.2 f-
^ 0.8
0.4
0 2 3 4 f/ms
(«)
0.0
-
min: 409 / / max: 802 / / aver: 761 / /
- 5
66 // 107 \J
—A—i—i—^ "i i i i i 0123456789 10
t/ms (f>)
Figure 6 Predicted trajectory of the reaction zone in a detonation tube with two chambers for fuel-rich (a — fuel molar concentration of 0.015) and fuel-lean (6 — fuel molar concentration of 0.011) mixtures at initial temperature of 300 K. Numbers show the mean propagation velocity in m/s
device was filled through valve 6 with a gaseous mixture of air with automo- bile gasoline vapors. The optimization of the size of turbulizing chambers was performed using the chambers of variable volume. The side walls of chambers 1 and 2 (Fig. 9) had a thread on the inner surface. This made it possible to screw the cylindrical plates 3 and 4 more or less deep into the chambers thus varying the volume. The mixture was ignited in chamber I by a spark plug 5. The gas flow induced by flame expansion was highly turbulized due to geometry of the vessel, a toroidal vortex appeared in chamber 2 causing rapid expansion of the flame area on entering the second chamber. To in- crease the pressure in both chambers, valve 6 was kept closed. Expansion of the reaction products into the narrow tube 7 produced an additional piston ef- fect thus increasing flame acceleration and promoting the DDT. The cylindrical plate 4 being moved down to the bottom of the chamber 2 made it possible to investigate the DDT process in a tube with only one turbulizing chamber 1. The investigations made it possible to determine the optimal structure of the initiating section to shorten the predetonation length in pulse detonation de-
vices. For the gaseous gasoline-air mixture, the predetonation length was shortened
to 1.5-2.0 m in tubes of diameter 22 mm. The Schlieren pictures illustrating the variety of scenarios of the DDT were published elsewhere [10, 11, 19].
Experimental investigations revealed, that the turbulizing chambers promote the onset of detonation and shorten the predetonation length due to their dual
24

HIGH-SPEED DEFLAGRATION: FUNDAMENTALS & CONTROL
0.5
0.4
£0.3
^0.2
0.1
0.0,
_
^
r^f
\
2
7*V] 4 ■pz>*°^<
1 1 1 1 1 1
0.0 0.1 0.2 0.3 0.4 0 5 XI m
(a)
0.0 0.2 0.4 0.6 0.8 1.0 XI m
(A)
0.0 0.4 0.8 1.2 1.6 2.0 XI m
(c)
air mixture I"?"6, ,Predlcted Pressure profiles along the tube axis for the fuel-^x lluilule with fuel molar concentration of 0.011 at the initial temperature of 350 K fa)- 1 — t = 2.52 ms, 2 - 3.19, 3 - 3.66, and 4 - 3.80 ms; (6): 1 - t = 3.80 ms, 2 — 4 23
» ~~ ML0, , '~e4-Jo9' S ~ 5-°6' and 6 - 5-29 ms; (°y- 1~t = 5-29 ms, 2 - S.'soi 3 — 5.54, 4 — 5.58, 5 — 5.62, 6 — 5.75, and 8 — 5.99 ms
impact. On the one hand, those chambers contribute to flow turbulization and flame acceleration in the initiating section. On the other hand, the piston effect of the expanding reaction products formed after burning out the mixture in the chambers provides additional pushes to the flame and causes the formation of additional shock waves ahead of the flame.
Interactions of those shocks increase the flow irregularity and create favorable conditions for the formation of hot spots. Variations of volume of the turbulizers makes it possible to control the predetonation length.
25

HIGH-SPEED DEFLAGRATION fc DETONATION
Available experimental data on the sensitivity of the DDT process to gas temperature were contradictory. Thus, special experimental investigations of the influence of the initial temperature on the predetonation length and time were undertaken for the pulse detona-
tion device shown in Fig. 9. To compare the predetonation
lengths and times for different tem- peratures, the experiments with fuel- rich mixtures were carried out. The onset of detonation was observed for both unheated and heated mixtures. The evolution of the process was char- acterized using 7 pressure transducers located in the transition section [9]. Three characteristic times tlnd were distinguished: the time of shock wave formation ahead of the flame (t\nd), the earliest time of the detonation on-
set in a hot spot (4nd), the time of detonation wave overtaking the leading shock and entering the undisturbed mixture as an overdriven detonation (Vg ).
Figure 10 illustrates the predetonation time (solid curves) and length (dashed
curves) variations with temperature. The plots (solid curves) show that within the temperature interval 290-350 K
all the induction times decrease with the initial mixture temperature. The cor- responding predetonation lengths (dashed curves in Fig. 10a) practically remain
constant though a slight decrease is also evident.
Figure 8 Predicted flame trajectory in a fuel-lean mixture with fuel molar concen- tration of 0.011 at the elevated tempera- ture (T = 350 K). Numbers show the mean propagation velocity in m/s
71
77" y
Figure 9 Schematic of a pulse detonation device with variable geometry of turbulizers
26

HIGH-SPEED DEFLAGRATION: FUNDAMENTALS & CONTROL
290 300 310 320 330 340 350
77K («)
Figure 10 Measured dependencies of the predetonation characteristics on the initial temperature: (a) predetonation time (solid curves) and length (dashed curves); I — ti , X\n , 2 — f£ i X™ ,3 — tf , X™d; (6) velocity of the leading disturbance vs. distance (curve 1 — gasoline A-72, T0 = 290 K; curve 2 — gasoline A-72, T0 = 350 K; curve 3 — gasoline A-92, T0 = 290 K)
Thus, variations of initial temperature of the combustible mixture can be used to control the onset of detonation. Figure 106 shows the velocity of the leading disturbance variation vs. tube length in DDT process. Curves 1 and 2 show the results of experiments for mixtures of air with gasoline A-72 (with the octane number of 72) for different initial temperatures. Curve 3 shows the results for the mixture of air with A-92 (octane number 92) gasoline. The increase of the octane number of gasoline from 72 to 92 brought to a 15%-20% increase in the predetonation length. For low temperatures, the DDT process was more stable for fuel-rich mixtures (0=1.1), while for T > 320 K the DDT in fuel-lean mixtures (<f> = 0.9) was also very stable.
5 CONCLUDING REMARKS
Theoretical and experimental investigations on control of DDT in gaseous hydrocarbon-air mixtures showed the following:
- turbulizing chambers incorporated into the ignition section promote the onset of DDT and shorten the predetonation length and time;
27

HIGH-SPEED DEFLAGRATION & DETONATION
- the increase of their number up to more than two does not provide further decrease in the predetonation length;
- the decrease of fuel molar concentration increases the predetonation length and can bring to establishing the galloping combustion modes instead of
the DDT;
- the increase of the initial temperature brings to a decrease in the predeto- nation length and time, in particular for fuel-lean mixtures.
The developed principles of controlling the DDT were implemented in a proto-
type of a pulse detonating device.
ACKNOWLEDGMENTS
The present investigation was supported in parts by the Russian Fondation for Basic Research, US Office of Naval Research, and INTAS-OPEN.
REFERENCES
1. Mallard, E., and H. Le Chatelier. 1881. Compt. Rend Acad. Sei. Paris. 93:145. Ann
des mines. Ser. 8 4:296.
2. Bertelot, M., et P. Vieille. 1881. Compt. Rend Acad. Sei. Paris. 93:18.
3. Mikhelson, V. A. 1893. On normal combustion velocity of explosive gaseous mix- tures. In: Scientific bulletin of imperial Moscow university. Physics and Mathemat-
ics ser. 10:1-92.
4. Chapman, D.L. 1899. On the role of explosion in gases. Phil. Mag. 47:90.
5. Jouget, E. J. 1905. Mathematics. 347.
6. Salamandra, G. D. 1959. On interaction of a flame with a shock wave. In: Physical
gasdynamics. USSR Acad. Sei. Publ.: 163-67.
7. Oppenheim, A.K., and P.A. Urtiew. 1966. Experimental observations of the tran- sition to detonation in an explosive gas. Proc. Royal Society London A295. 13.
8. Soloukhin, R. I. 1969. Methods of measure and main results of experiments in shock
tubes. Novosibirsk: Novosibirsk State University Publ.
9. Smirnov, N.N., and A. P. Boichenko. 1986. Deflagration to detonation transition in gasoline-air mixtures. Combustion Explosion Shock Waves 22(2):65-68.
28

HIGH-SPEED DEFLAGRATION: FUNDAMENTALS fc CONTROL
10. Smimov, N.N., and I.I. Panfilov. 1995. Deflagration to detonation transition in combustible gas mixtures. Combustion Flame 101:91-100.
11. Smirnov, N.N., and M.V. Tyurnikov 1995. Experimental investigation of defla- gration to detonation transition in hydrocarbon-air gaseous mixtures. Combustion Flame 100:661-68.
12. Zel'dovich, Ya.B., V. B. Librovich, G. M. Makhviladze, and G.I. Sivashinsky. 1970. On the onset of detonation in a nonuniformly preheated gas. Sov. J. Applied Me- chanics Technical Physics 2:76.
13. Merzhanov, A.G. 1966. Combustion Flame 10:341-48.
14. Borisov, A.A. 1974. Ada Astronautica 1:909-20.
15. Kailasanath, K, and E. S. Oran. 1983. Ignition of flamelets behind incident shock waves and the transition to detonation. Combustion Science Technology 34:345-62.
16. Smirnov, N.N., An.Yu. Demyanov, and I.I. Panfilov. 1989. Deflagration to deto- nation transition. In: Chemical physics of combustion and explosion: Detonation. Moscow: USSR Acad. Sei. Publ. 52-56.
17. Frolov, S. M. 1992. The effects of nonideality on the explosion origin and propaga- tion. Dr. Sei. Thesis. Moscow, N. N. Semenov Institute of Chemical Physics.
18. Smirnov, N.N., I.I. Panfilov, M.V. Tyurnikov, A.G. Berdyuguin, V.R. Dushin, and Yu. P. Presnyakov. 1997. Theoretical and experimental investigation of com- bustion to detonation transition in chemically active gas mixtures in closed vessels. J. Hazardous Materials 53:195-211.
19. Smirnov, N.N., V. F. Nikitin, A. P. Boichenko, M.V. Tyurnikov, and V. V. Baskakov. 1999. Deflagration to detonation transition in gases and its ap- plication to pulse detonation devices. In: Gaseous and heterogeneous detonations: Science to applications. Eds. G. Roy, S. Frolov, K. Kailasanath, and N. Smirnov Moscow: ENAS Publ. 65-91.
20. Brown, C. J., and G. O. Thomas. 1999. Experimental studies of shock-induced ig- nition and transition to detonation in ethylene and propane mixtures. Combustion Flame 117:861-70.
21. Khokhlov, A.M., and E. S. Oran. 1999. Numerical simulation of detonation initia- tion in a flame brush: The role of hot spots. Combustion Flame 119:400-16.
22. Pironeau, O., and B. Mohammad!. 1994. Analysis of the k-epsilon turbulence model. Paris: Masson Editeur.
23. Hamming, R. W. 1962. Numerical methods for scientists and engineers New York NY: McGraw-Hill Co., Inc.
24. Matthias, Ph. 1991. Experimentelle und theoretische Untersuchungen zum Sta- bilitätsverhalten von Drallflammen mit zentraler Rückströmzone. Dissertation. Karlsruhe University.
25. Smirnov, N.N., and V.F. Nikitin. 1997. Unsteady-state turbulent diffusive com- bustion in confined volumes. Combustion Flame 111:222-56.
29

HIGH-SPEED DEFLAGRATION Si DETONATION
26. Oran, E.S., J.P. Boris. 1987. Numerical simulation of reactive flow. New York,
NY: Elsevier. 27. Anderson, D.A., J.C. Tannehill, and R.H. Pletcher. 1984. Computational fluid
mechanics and heat transfer. Hemisphere Publ. Co.
28. Frolov, S.M., V.Ya. Basevich, M.G. Neuhaus, and R. Tatschl. 1997. A joint velocity-scalar pdf method for modeling premixed and nonpremixed combus- tion. In: Advanced computation and analysis of combustion. Eds. G.D. Roy,
S.M. Frolov, and P. Givi. Moscow: ENAS Publ. 537-61.
30

SOME GASDYNAMIC METHODS FOR CONTROL OF DETONATION INITIATION
AND PROPAGATION
O.V. Achasov and O.G. Penyazkov
Initiation of detonation in gaseous mixtures by shock waves and jets is studied experimentally and computationally. It is shown that turbulence-generating grids, shock focusing by reflection from concave surfaces, and interaction between supersonic jets promote the initia- tion process. The reactive gases are stoichiometric hydrogen-oxygen and acetylene-oxygen mixtures diluted with nitrogen. The use of a con- cave reflecting surface is shown to significantly reduce the ignition delay in a shock-compressed mixture. Interaction of opposed nonreactive and reactive supersonic jets in the half-closed concave cavity is shown to re- sult in a complex transient gasdynamic structure with colliding shock waves. When the shock waves reflect from a concave wall, regions with high pressure and temperature occur, promoting detonation initiation. Detonation initiation in a tube with a turbulizing grid is shown to be possible if the arising flame jet is supersonic. Critical conditions for detonation initiation are found.
1 INTRODUCTION
Detonation in a combustible gas mixture can be initiated in two ways: via di- rect impact or deflagration-to-detonation transition (DDT). The DDT process is of importance from both fundamental and practical points of view. The tran- sition length depends upon several parameters. Qualitatively, the influence of these parameters on the transition distance is quite well understood. They are generally considered to contribute to one or both of the two main flame accel- eration mechanisms: turbulence-flame and shock-flame interactions. In some cases, designing an apparatus that uses a detonative process makes it necessary
31

HIGH-SPEED DEFLAGRATION & DETONATION
to reduce the transition length. Particularly, it applies to transition to detona- tion in fuel-air mixtures, where the length of the predetonation region is of the order of 100 characteristic transverse channel dimensions [1]. A local increase in the gaseous mixture parameters within some region of the duct increases the energy release rate in this region and, consequently, can reduce the detonation onset time in the whole duct. It is well known [2] that, when a plane shock wave collides with a circular concave wall, the reflected shock wave forms a focus at which the pressure and temperature can be enhanced. It has been observed that the shock wave intensity required to initiate detonation can be substantially de- creased when the focusing phenomenon is used [3-7]. Interaction of supersonic jets can raise the pressure and temperature in the gas and, consequently, cause detonation initiation [8]. Numerous experiments [9-14] have shown that fast turbulent mixing of hot combustion products with reactants can also lead to detonation onset.
Investigated in the present work are some gasdynamic methods for initiation of gaseous detonation and for control of its propagation: shock wave focusing due to reflection from concave surfaces; interaction of supersonic jets of the combustible mixture; and fast turbulent mixing of hot combustion products with a combustible mixture (prechamber initiation). The experiments were carried out using both shock-tube technique and detonation-chamber models.
2 RESULTS OF INVESTIGATIONS
2.1 Detonation Initiation by Concave Reflector
A set of two coupled diaphragm-free shock tubes with an automatic synchroni- zation system was used to perform shock-tube experiments. The cross-section of the rectangular shock tube is 45 x 90 mm and the inner diameter of the circular tube is 76 mm. Pressure variation at different cross-sections was monitored with piezoelectric pressure gauges with a spatial resolution of 1 mm. Test sections were equipped with quartz windows allowing for direct photographic observa- tion of the initiation and propagation processes. The Schlieren device optically aligned with a high-speed (1.3 //s/frame) photographic camera was used to visu- alize the processes. A high-pressure valve with a forced electropneumatic start was used to synchronize the shock tubes start-up with the high-speed camera operation and also to eliminate the influence of a bursting diaphragm. Com- pressed helium was used as the driver gas. Experimental results were recorded and processed by an automatic data acquisition system comprising digital oscil- loscopes and a central computer. Rectangular and circular detonation chambers were used to carry out the prechamber initiation tests. The test mixtures were prepared by the method of partial pressures and were stored in a suitable mixing
32

HIGH-SPEED DEFLAGRATION: FUNDAMENTALS & CONTROL
vessel until required. The re- active gases were stoichio- metric hydrogen-oxygen, and acetylene-oxygen mixtures with different nitrogen dilu- tion.
For shock wave focusing, a semicylindrical concave wall model 45 mm in diameter was installed in the test section.
Ignition delay was meas- ured from OH radical emis- sion records, corresponding to transition 2£-2fl in the Figure 1 Ignition delay in a stoichiometric
hydrogen-oxygen mixture vs. shock wave Mach number: 1 — normal reflection; 2 — reflection from a hemicylindrical cavity. Pressure behind the reflected shock wave is 0.1 ± 0.01 MPa
bandwidth (0, 1). To fix the instant at which luminosity of the reacting gas mixture com- mences, the test volume was focused on a photomultiplier cathode. To eliminate the effect of light from easily excited impurities, a monochromatic interference filter with Amax = 348 nm and bandwidth of 16 nm was used to pass only the desired portion of the emission spectrum of the mixture. Concurrently with luminosity, the pressure was meas- ured both at the bottom of the concave cavity and at the lateral wall of the channel at a distance of 109.5 mm from the bottom.
As follows from the plot of ignition delay vs. incident shock wave Mach num- ber (Fig. 1), the reflecting concave surface reduces this delay significantly. If the incident shock wave is sufficiently strong, the complex reflections can result in gas mixture ignition in the focus area behind the reflected shock and in detonation initiation (Figs. 2 and 3). In these regimes, detonation wave originates behind the reflected shock front during interaction of slow combustion fronts. In addi- tion, gas volume in the cavity burns in vortex structures formed in the focusing region, which raises the temperature and pressure (see Fig. 3). The detonation wave thus generated moves from the cavity and propagates as a retonation wave in the opposite direction.
At higher intensities of the initial shock, the detonation regime can develop even from isolated hot spots. Depending on shock wave intensity, such spots can be located in different zones. For example, at the Mach number of 2.35-2.5, these spots are located on the walls of a half-closed cavity in the origin of the Mach stem. No combustion process has taken place yet near the cavity bottom (Figs. 4 and 5) and detonation waves start propagating from the initiation point in both directions with some delay. As a result of interaction of two converging detonation waves, a wave with a flat front forms in the constant cross-section duct. Interaction of two detonation waves at the cavity bottom considerably
33

HIGH-SPEED DEFLAGRATION fc DETONATION
150 ns 205 (as 225 ns
Figure 2 Schlieren images of shock-wave detonation initiation in a stoichiometric hydrogen-oxygen mixture at an incident shock wave Mach number M - 2.31
Figure 3 Pressure records for the case presented in Fig. 2 (M = 2.31)
increases the wave parame- ters, which is clearly seen from the recorded pressure- time history (Fig. 5).
Further increase in the detonation wave intensity (M > 2.5) gives rise to almost explosive (virtually without delay) initiation of detonation at the half-cylinder bottom (Figs. 6 and 7). In addition, the front of the formed wave becomes flat almost at the
cavity outlet.
2.2 Detonation Initiation by Supersonic Jets
Experiments with interacting supersonic jets have been performed in a 45 x 90 mm, 8 m long, helium-driven diaphragm-free shock tube. A reflected shock wave was used to produce the jets. The jet throat, d, varied from 1 to 4 mm. Pressure variation at different cross-sections (Fig. 8) was recorded with precah-
brated piezoelectric pressure gauges. Jet interactions in a half-closed cavity are of a complex gasdynamic struc-
ture in the intersection region. This process was simulated numerically by the Coarse Particle Method that provides high resolution without nonphysical oscil-
34

HIGH-SPEED DEFLAGRATION: FUNDAMENTALS & CONTROL
115 us
151ns
130 ns 145 ns
•"■»JarS»-.
Figure 4 The same as Fig. 2, at the incident shock wave Mach number M = 2.45
lations, especially at shock fronts. Two-dimensional prob- lems were solved using both the operator- and nonoperator- splitting techniques to highlight the significant differences be- tween these techniques when solving shock-wave problems.
Some results of the numeri- cal simulation for normally in- teracting air jets are shown in Fig. 9 in terms of the depend- encies Pm/P5(L/R) and Tm(L/R). Here, P5 is the stag- nation pressure in a jet reser- voir, Pm and Tm are the highest pressure and temperature at the cavity bottom, R and L are the cavity radius and depth, respectively. In the simulations, the following conditions were as- sumed: P5 = 0.4 MPa, Pi = 30 kPa (Pi is the initial pressure). When the depth of the cavity is smaller than its radius, the temperature and the pressure at the cavity bottom exceed their stagnation values. When incident jets are directed towards the concave wall, focusing is better.
To produce an inclined jet, an additional flat plate with a shaped side was used (see Fig. 86). As shown in Fig. 10, jet tilting causes a 20%-50% increase
f/us
Figure 5 Pressure records for the case presented in Fig. 4 (M = 2.45)
35

HIGH-SPEED DEFLAGRATION & DETONATION
90 us 96 |as 99 ns
Figure 6 The same as Fig. 2, at the incident shock wave Mach number M = 2.65
in Pm and Tm. In Fig. 10, 9 and h are the angle and the thickness of the additional fiat plate.
First, the interaction of non- reactive supersonic air jets in a half-closed concave cavity was studied. It has been found that interaction of two opposite gas jets injected from the lateral channel walls resulted in a com- plex gasdynamic structure (Fig. 11). A weak shock caused by the transient starting jet ex- iting from the opening is gener- ated. In the case of two jets, they can intersect as a result of head-on collisions.
First two fronts undergo a normal interaction along the centerline, producing a reflected shock. Next, quadruple shock intersections arise on both sides of the centerline. When the intersection angle attains a certain critical value, triple shock intersections set in. A turbulent vortex "bubble" heads the transient jet flow and most of the entrainment and mixing occurs in this region. When this complex gasdynamic structure impinges a circular concave wall, reflection from the concave wall produces a focus at which the pressure and temperature can
100 150 f/us
Figure 7 Pressure records for the case pre- sented in Fig. 6 (M = 2.65)
36

HIGH-SPEED DEFLAGRATION: FUNDAMENTALS h CONTROL
(«)
52
No.4
52 5.5
#=22.5
No.2 ^^
%
SfS^^ff ^jl^^Lm0dd' US6d t0 StU^ int—^ «rf-onnd (a) and inclined (6) jets. Dimensions in
Figure 9 Maximum pressure (a) and temperature (6) vs. the hemicylindrical cavity depth: 1 — d = 2 mm and 2 — 4 mm. Dimensions of R and A. »rP «>,n™„ ;„ i?;„ a„ Dimensions of £ and I are shown in Fig. 8 a
37

HIGH-SPEED DEFLAGRATION fc DETONATION
Figure 10 Maximum pressure (a) and temperature (6) vs. inclination angle: 1 — fc = 11.25 mm; 2 — 8; and 3 — 3.6 mm. The experimental setup corresponds to Fig. 86
be enhanced. It has been found that focusing is better when jets inclined with respect to the concave wall were used (Fig. 12).
Direct initiation of a detonation by means of jets was studied experimentally A stoichiometric hydrogen-oxygen mixture was used at an initial pressure of 20 kPa. Interaction of normal (0 = 90°) jets produced by reflection of a shock wave with a Mach number M > 2.0 resulted in detonation onset only in the jet reservoir, indicating that the pressure and temperature rise in the focus region is insufficiently high. On the contrary, tilted-jet (6 = 50°, h = 8 mm) interac- tion produced detonation in the concave cavity at M < 1.95, indicating better
focusing.
2.3 Detonation Initiation by Flame Jets
To carry out prechamber initiation experiments in a rectangular (10 x 10 mm) chamber, a 143 mm long channel was used. The observation zone with quartz side walls was located 10 mm away from the spark plug mounted at the channel end The ignition energy was E = 0.8 mJ. Stoichiometric C2H2-oxygen mixtures diluted with nitrogen were used. Mixture composition was varied to find a critical composition for detonation initiation in the observation region. In the main set experiments, the initial pressure was 0.1 MPa. The DDT process was photographed by a Schlieren streak-camera.
For flame jet initiation, a turbulence generating grid has been applied. The grid was made in the form of a perforated steel plate with 0.62-milhmeter di- ameter holes and an open area ratio of 0.077. The plate was 3 mm thick. It was mounted at a distance of 27 mm from the ignition spark. Thus, the test
38

HIGH-SPEED DEFLAGRATION: FUNDAMENTALS & CONTROL
70 (as 80 |as
90 us 110 us
(a) (b)
Figure 11 Shadowgraphs of the normal (a) and inclined (6) interaction of nonreacting air jets. Initial pressure is 0.03 MPa, shock wave Mach number is 2.37
channel was divided into two parts, namely, the precharnber and the combustion chamber.
Figure 13 (curve 1) shows the transition distance (/) vs. nitrogen concen- tration in the channel with no perforated plate. The transition distance is ex- pressed in terms of the specific length l/h, where h is the channel height. As follows from Fig. 13, dilution of a stoichiometric acetylene-oxygen mixture with nitrogen heavily affects the transition length when nitrogen concentration, £N2,
exceeds 18.5%. The onset of detonation at £N2 < 18.5% is observed at a dis- tance less than 17 mm from the ignition spark. As the nitrogen concentration increases, the transition length rises rapidly.
39

HIGH-SPEED DEFLAGRATION & DETONATION
1.0 f\
0.6 1 l AAANH"^
0.0 1—
V 1 1
50 150 f/|IS
250
Figure 12 Pressure records at the bottom wall of the concave hemicylindrical cav- ity (1), behind the reflected shock wave (2), and at 61.5 mm from the bottom (3) for normal (a) and inclined (b) interaction of nonreacting air jets. Initial pressure is 0.03 MPa, shock wave Mach number is 2.37
Figure 14 a shows a Schlieren streak-record of the experiment carried out in a free channel with £N2
= 22%. In this mixture, the onset of detonation is observed at a distance of 7.3 l/h (see Fig. 13) approximately in the middle of the test section (Fig. 14a). There- fore, the value £N2 = 22% was chosen as a reference in the subsequent exper-
iments. To reduce the predetonation
length in mixtures highly diluted with nitrogen, the perforated plate was utilized. Initially, the grid was placed at a distance of 27 mm from the igni- tion spark. As follows from Fig. 14b,
Figure 13 DDT distance vs. nitrogen dilution for stoichiometric acetylene- oxygen mixtures at initial pressure 0.1 MPa in the channel without (i) and with (2) a perforated plate
40

HIGH-SPEED DEFLAGRATION: FUNDAMENTALS h CONTROL
100 US
Figure 14 Schlieren streak images of the DDT process at initial pressure of 0 1 MPa in a free channel at ft,a = 22% (a); behind the perforated plate at &_ = 42% (b) and at £N|2 = 60% (c). Vertical scale is 10 mm
the perforated obstacle reduces the transition distance even at high nitrogen concentrations. A Schlieren streak photography of the DDT process for the crit- ical composition with £N2 = 60% (see Fig. 13, curve 2) is presented in Fig. 14c. In this case, the velocity of the leading shock wave was equal to 600 m/s. The speed of sound in the initiation region was calculated by the traces of compression waves and was found to be equal to 440 m/s. An explosion in the combustion chamber occurred 370 (is after ignition. This gave rise to a secondary shock wave propagating at the velocity of 1580 m/s. Amplification of this shock wave resulted in the onset of detonation at a distance of 2.8 l/h from the perforated plate.
41

HIGH-SPEED DEFLAGRATION fc DETONATION
100 US
Figure 15 Schlieren streak images of the DDT process behind a perforated plate at fr = 22% and initial pressure of 24 kPa (a) and 22.5 kPa (6). Vertical scale is 10 mm
At higher nitrogen dilution
(£N- > 60%), no detonation occured in the observation region. In this case, the turbulent flame velocity was less than the sound velocity in the combustion chamber (470 m/s). No primary shock wave corre- sponding to the supersonic initiation was observed in these mixtures. Schlieren photo graphs show that the subsonic flame jets produce no detonation downstream of the per-
forated plate.
To verify that the DDT process occurs in the combustion chamber
only due to supersonic flame jet initiation, additional tests have been carried out with a mixture containing 22% N2. The initial pressure was varied to pre- vent the detonation onset behind the perforated plate with a blockage ratio of 0.923. Figure 15 shows streak-records of transition processes at initial pressures of 24 and 22.5 kPa. As seen, detonation does not arise at a pressure of 22.5 kPa. For these two Schlieren pictures, the velocities of the primary compression waves
Figure 16 DDT distance vs. initial pres- sure at £N2 = 22%
42

HIGH-SPEED DEFLAGRATION: FUNDAMENTALS & CONTROL
are 400 and 420 m/s, respectively. The velocities of the secondary waves are 467 and 480 m/s, respectively. The leading shock wave velocities are equal to 610 and 590 m/s. Obviously, the detonation wave forms at higher shock inten- sity and flame jet velocity at an initial pressure of 24 kPa. A further increase in the initial pressure results in a higher shock intensity and reduces the transition distance (Fig. 16). A pressure decrease to 20 kPa causes combustion initiation by subsonic jets.
3 CONCLUDING REMARKS
Several different gasdynamic methods of gaseous detonation initiation have been studied including focusing of a plane shock wave due to its reflection from concave surfaces; interaction of supersonic jets of combustible mixtures in a channel with the concave end-wall; and fast turbulent mixing of hot combustion products with a combustible mixture. The conditions needed to initiate detonations by these methods have been determined.
ACKNOWLEDGMENTS
The authors greatefully acknowledge the Foundation for Fundamental Research of the Republic of Belarus for the partial financial support provided.
REFERENCES
1. Pawel, D., P. J. Van Tiggelen, et al. 1970. Initiation of detonation in various gas mixtures. Combustion Flame 15:173.
2. Takayama, K., ed. 1990. International Workshop on Shock Wave Focusing Pro- ceedings. Sendai.
3. Borisov, A.A., V.M. Zamanskii, et al. 1990. Ignition of gaseous combustible mix- ture in focused shock waves. In: Current topics in shock waves. AIP Conference Proceedings. Ed. Y. W. Kim. New York. 696.
4. Chan, C. K., D. Lau, et al. 1990. Ignition and detonation initiation by shock focus- ing. In: Current topics in shock waves. AIP Conference Proceedings. Ed. Y. W. Kim. New York, NY. 161.
5. Achasov, O.V., S.A. Labuda, et al. 1994. Initiation of detonation in reflection of a shock wave from a concave curvilinear surface. J. Engineering Physics and Thermophysics 67:66.
43

HIGH-SPEED DEFLAGRATION fc DETONATION
6. Achasov, O.V., S.A. Labuda, et al. 1995. Initiation of detonation by gasdynamic methods in a half-limited space. 20th Symposium (International) on Shock Waves
Proceedings. New York. 1131. 7. Gelfand, B.E., S.V. Khomik, et al. 1999. Detonation initiation at the focusing of
shock waves in combustible gaseous mixture. 17th ICDERS Proceedings. Heidel- berg, Germany. Paper 50.
8. Achasov, O.V., V.V. Kondrashov, and O.G. Penyazkov. 1997. Direct initiation of gaseous detonation by interacting supersonic jets. In: Combustion in supersonic flows. IUTAM Symposium Proceedings. Eds. M. Champion and B. Deshaies. Dor-
drecht. 359. 9. Carnasciali, F., J.H.S. Lee, and R. Knystautas. 1991. Turbulent jet initiation of
detonation. Combustion Flame 84:170. 10. Knystautas, R., J.H.S. Lee, et al. 1979. Direct initiation of spherical detonation
by a hot turbulent gas jet. 17th Symposium (International) on Combustion Pro- ceedings. Pittsburgh, PA: The Combustion Institute. 1235.
11. Schildknecht, M., W. Geiger, and M. Stock. 1984. Flame propagation and pressure buildup in a free gas-air mixture due to jet ignition. Prog. Astro. Aero. 94:474.
12. Moen, I.O., D. Bjerketvedt, et al. 1985. Transition to detonation in a flame jet. Combustion Flame 61:285.
13. Ungut, A., and P. J. Shuff. 1989. Initiation of unconfined gaseous detonation. Com- bustion Science Technology 63:75.
14. Thomas, G. O., and J. Jones. 2000. Some observation of the jet initiation of deto- nation. Combustion Flame 120:392.
44

SENSITIZATION OF FUEL-AIR MIXTURES FOR DEFLAGRATION-TO-DETONATION TRANSITION
A. J. Higgins, P. Pinard, A. C. Yoshinaka, and J. H. S. Lee
The mechanisms responsible for the acceleration of a laminar flame to a self-sustained detonation are discussed, and means to influence (either accelerate or retard) each mechanism are identified. The role of the ig- niter is to establish a laminar flame. While a very powerful igniter may be able to bypass the laminar to turbulent flame transition process it has little influence on the run-up distance to detonation, since the tur- bulent flame must still accelerate to velocities on the order of 1000 m/s before the onset of detonation can occur. Only a very large diameter (on the order of the critical tube diameter) flame jet may be able to bypass the turbulent flame acceleration process and directly initiate det- onation Usually, obstacles are used to effect a rapid acceleration of the turbulent flame. The greater intensity of turbulence and transverse shock waves created by obstacles permits a wide spectrum of turbu- lent flame velocities to be observed. In the final onset of detonation the mixture sensitivity (as determined by chemical kinetic rates) is the dom- inant factor governing initiation. A number of possible sensitizing agents (acetylene, N02, various nitrates) are considered, but thus far, only the cool flame" processing of hydrocarbon-air mixtures appears to have a
significant effect in reducing the length scales required for initiation of detonation.
1 INTRODUCTION
Deflagration-to-detonation transition (DDT) is the process by which an initially laminar flame undergoes a sequence of changes in propagation mechanism, ulti- mately resulting in a self-sustained supersonic detonation. While DDT is typi- cally thought of as an acceleration process (since the combustion wave velocity can span four orders of magnitude), it is more properly considered as a process
45

HIGH-SPEED DEFLAGRATION fc DETONATION
of altering the mechanism of wave propagation, with the propagation velocity reflecting the rate at which different mechanisms occur. Appreciating when these different mechanisms are at work lays a foundation for understanding and ultimately controlling DDT.
The initial stages of flame kernel formation and growth as a laminar flame are dominated by diffusion of heat and radicals to the unburned layer ahead of the flame. A whole host of natural instability mechanisms (e.g., Rayleigh- Taylor, Landau-Darrieus, Markstein, etc.) act to wrinkle the flame and increase the burning rate per unit volume and, consequently, increase the propagation
velocity. A more significant role is played by the flow created ahead of the flame due to
volumetric dilatation of the combustion products: in a confined geometry (i.e., a pipe), this flow becomes turbulent and a flame propagating into a turbulent flow field undergoes a dramatic increase in the burning rate. This transition to turbulence also sets the stage for feedback between the flow ahead of the flame and the flame itself. The feedback can occur via a fluid dynamic mechanism, whereby an increase in burning rate increases the flow velocity of the gas ahead of the flame, thus amplifying the intensity of turbulent flow into which the flame propagates. The unsteady flow ahead of the turbulent flame also allows for a gasdynamic feedback mechanism, provided the unsteady compression waves sent ahead of the flame increase the temperature sufficiently to produce an accelerat- ing effect on the reaction rates. A discussion of the relative significance of these various instability and feedback mechanisms can be found in [1,2].
Regardless of the particular mechanism, when the combustion wave reaches very high turbulent flame speeds (600-1000 m/s), it clearly becomes a mixing limited, rather than a diffusion controlled, process. The fact that high-velocity turbulent flames propagate with mixing rates apparently greater than those re- quired to quench the flame remains one of the unresolved issues in this poorly understood regime of combustion [2].
When the turbulent flame reaches velocities (~ 1000 m/s) where the com- pression waves pushed ahead of the flame coalesce into a shock generating suf- ficient adiabatic compression to initiate chemical reactions, the conditions for the final onset of detonation may be present. The final initiation of detonation is usually associated with the abrupt appearance of explosion centers or "hot spots" in the shock - turbulent flame complex (the so-called "explosion in the explosion") which rapidly accelerate in the shocked gas to merge with the initial
SHOCK
Moen et al. [3] have also identified another mode of DDT due to the pro- gressive amplification of pressure waves traversing the reaction zone at the fi- nal stages of initiation. It appears that the onset of detonation invariably in- volves a rapid wave amplification process. The result of this amplification proc- ess is an initially overdriven detonation, often with wave speeds exceeding the steady Chapman-Jouguet (CJ) wave speed by 50-100%, which quickly decays to
46

HIGH-SPEED DEFLAGRATION: FUNDAMENTALS & CONTROL
a steadily propagating detonation. The sequence of events outlined here is shown schematically in Fig. 1.
Note the presence of obstacles in Fig. 1; obstacles are present in all of the DDT experiments presented in this paper. While DDT does occur in tubes without obstacles, the run-up distance to detonation can be an order of mag- nitude larger and significantly more stochastic, due to increased sensitivity to the tube wall roughness, position of the igniter, etc. By using a series of reg- ularly spaced obstacles, the tube wall roughness is dominated by the obstacles and hence the results become largely independent of the other details of the apparatus. Extensive prior research at McGill University [4, 5] have identified an obstacle blockage ratio of ~ 40% and an obstacle spacing of roughly one tube diameter as being near the point of diminishing return in obstacle spacing and blockage. Thus, the results obtained with these obstacles are believed to be the near minimum length scales required for DDT, and further optimization of the obstacles would result in only minor changes in the length required for detonation formation.
Due to the abrupt appearance of detonation at the final stage of the flame acceleration process, initiation is traditionally considered as a unique and well- defined event. Recent research on quasi-detonation [6], however, suggests that in tubes with obstacles, the same mechanisms responsible for DDT (local explo- sion centers resulting from shock interactions with obstacles) may also permit steady propagation velocities as low as one half of the CJ velocity. Thus, a CJ detonation is merely the limiting case of a continuous spectrum of combustion wave velocities, and the division between detonation and highly turbulent flame becomes indistinct. If a combustion wave is "denied" the mechanisms of deto- native combustion, either by using a tube smaller than the characteristic cell size of the mixture or by using a tube with acoustic absorbing walls to dampen out cellular structure, then the wave will propagate at speeds of the order of one half the CJ detonation velocity [7, 8].
Recent attention has been focused on the DDT problem as a result of re- newed interest in pulsed detonation engines (PDE). The requirement of deto- nating fuels of practical interest for aerospace and defense applications (Jet A, JP-10, etc.) within the limited dimensions of an engine has stimulated research into schemes by which detonation can be promptly initiated in these mixtures without having to use a predetonator of gaseous fuel-oxygen mixture. Direct initiation (i.e., near-instantaneous deposition of energy into the gaseous mix- ture, generating a blast wave of sufficient strength and intensity to decay to a self-sustained detonation) would require charges on the order of ~ 100 g of high explosive for each cycle of initiation. Other initiation sources (sparks, lasers, etc.) cannot easily provide this amount of energy (~ 100-1000 kJ) on a cyclic basis. This leaves "self-initiation," or initiation using the chemical energy of the explosive medium itself, to create the conditions necessary for the onset of detonation.
47

HIGH-SPEED DEFLAGRATION & DETONATION
Weak ignition and slow flame propagation
Flame folding and onset of turbulence
U0 v U
n D
D □ □ U -U LT Obstacles
n n n^Vi Q.
~LT
XL
car1
Onset of detonation
Turbulent flame acceleration and shock formation
"a tx
n Q.
u
n
u u u
n n n
UJP$- ̂ u U
n
u
n
DDT or run-up distance
Propagation of detonation
Figure 1 Schematic illustrating the sequence of events for DDT in tube with obstacles
48

HIGH-SPEED DEFLAGRATION: FUNDAMENTALS fc CONTROL
The most recent estimates of the critical kernel size for planar initiation [9,10] suggest that the chemical energy available within one to two cell lengths of the explosive mixture is sufficient to initiate detonation in that mixture. The usual path of self-initiation, however, is DDT, and this typically requires an order of magnitude longer length scale before the onset of detonation occurs. For a higher hydrocarbon fuel in air (where the detonation cell size A « 5 cm), the tube diameter must be greater than A for self-sustained propagation, and typi- cally 10 tube diameters or more are required for DDT. Thus, for hydrocarbon-air mixtures, the length required for DDT approaches or even exceeds the length scales of interest for PDE applications. The fact that, in principle, there ex- ists sufficient chemical energy in the mixture to undergo self-initiation within one or two tube diameters suggests that a significant reduction in initiation length scales could be realized if the appropriate route to detonative combus- tion can be identified. Knowledge of the mechanisms responsible for DDT and the transition between those different mechanisms is not sufficient at present to identify a "soft" initiation scheme that uses the weak igniter of DDT yet initi- ates on the short length scales of direct initiation. Experiments with turbulent jet initiation (discussed in Section 2 below) suggest a direction that may prove fruitful.
This paper discusses the authors' current views on mechanisms responsible for DDT and some of the techniques to accelerate or bypass those mechanisms, using recent results from detonation research at McGill University to highlight certain points. This paper is not a comprehensive review, but rather suggests a course of action as to how best attack the DDT problem for PDE applica- tions.
2 LAMINAR TO TURBULENT FLAME TRANSITION- ROLE OF INITIATOR
The role of an igniter in DDT is to create an initial flame kernel that will grow as a laminar flame. In confined tubes with ignition occurring at a closed end, the laminar flame will quickly become turbulent due to the various instability mechanisms discussed in the Introduction. Since, for a fuel-air mixture, the laminar flame propagates at speeds of 30-50 cm/s, the time required for the flame to reach the tube wall and make the transition to a turbulent flame can comprise the majority of the time required for the entire DDT process. If a sufficiently powerful igniter is used, it may be possible to bypass the laminar to turbulent flame transition process entirely.
This is illustrated in Fig. 2a, where DDT in a propane-oxygen-nitrogen mixture at 1 bar initial pressure occurs in a 15-centimeter-diameter, 2.2-meter
49

HIGH-SPEED DEFLAGRATION fc DETONATION
(a)
2000
1500
1 £ 1000
500
0.5
spark
ignition chamber
C3H8+5(02+3N2)
i i i i i i i
1.0 1.5 x/m
(b)
2.0
Figure 2 Distance vs. time (a) and velocity vs. distance (6) data for a propane- oxygen-nitrogen mixture undergoing DDT in a 15-centimeter-diameter tube with reg- ularly spaced obstacles, as measured by ionization probes on the tube wall. iwo different igniters (spark plug and flame jet from precombustion chamber) are shown (initial pressure 1 bar)
50

HIGH-SPEED DEFLAGRATION: FUNDAMENTALS & CONTROL
long tube. If the typical spark plug igniter is replaced with a small precom- bustion chamber in which the combustion products jet outward, the time re- quired for DDT is reduced by a factor of more than two (see x-t diagram Fig. 2a).
Viewed as a velocity-distance (V-x) diagram (Fig. 2b), however, the results obtained with the two different igniters are indistinguishable. This is because, while the ignition chamber succeeds in creating a turbulent flame earlier, the turbulent flame must still propagate the same distance before reaching velocities sufficient for the onset of detonative combustion. This result is in sharp contrast to the often-repeated statement found in the PDE-related literature: that a powerful igniter is necessary for short DDT. While the laminar to turbulent flame transition comprises the majority of the time required for DDT, it is negligible in the length scale required for DDT.
While it may be argued that a very powerful igniter, or array of igniters, may be capable of near-direct initiation of detonation, studies of detonation initiation by turbulent flames emerging from obstacle-laden tubes [11] and packed beds of porous media [12] suggest that turbulent flame velocities in the 700-1000 m/s range are necessary for detonation initiation, with turbulent fluctuating velocities on the order of the sonic speed. This would necessitate an initiator of sonic or supersonic jets of hot gas (probably combustion products) over the entire tube area. Such an initiator would likely consist of a volume of combustible gas that must itself undergo transition to turbulent flame propagation anyway. Even if such an initiator can be realized, the length scale required for further acceleration and transition to detonation is still very large (approximately 1 m in Fig. 2). Thus, a powerful igniter can play an important role in rapid initiation techniques, but only as a means of initially creating a highly turbulent flame. The acceleration of that flame to detonation still consumes a considerable distance.
In the limit of a large diameter jet of combustion products, direct initiation of detonation is possible and has been demonstrated in unconfined environments for a variety of different experimental set ups [13-18]. These experiments usually involved using a precombustion chamber in which a highly turbulent flame was developed and then allowed to expand into the main chamber via an abrupt expansion or by passage through an orifice plate. Thus, these experiments are more properly thought of as separating the turbulent flame acceleration process from the final onset of detonation by a diaphragm or orifice plate. The jet diameter in these experiments needed to be much greater (typically a factor of 5 greater) than the critical tube diameter (dc = 13A) for successful initiation. Jet diameters of 40-100A were often required, thus making this type of initiation too large to be applied directly to PDE.
Results [15] and the more recent experiments [19], however, suggest that tur- bulent flames may be capable of direct initiation upon emerging from a tube diameter smaller than the critical diameter for detonation transmission. In ad- dition, the effect of tube confinement on this mode of initiation has not been
51

HIGH-SPEED DEFLAGRATION fc DETONATION
investigated and may permit direct initiation by turbulent flame jets to be real- ized in the length scales of interest to PDE's.
3 HIGH-SPEED TURBULENT FLAME ACCELERATION: ROLE OF OBSTACLES
Starting with the work of Laffite [20] and Chapman and Wheeler [21] in the 1920's, the role of obstacles and tube wall roughness on turbulent flame acceler- ation has been extensively studied and reported [4, 5, 22]. The current picture of the role of obstacles is to intensify the turbulent shear mixing by creating both vortices in the wake of the obstacles and transverse shock waves. Obstacles thus permit orders of magnitude reduction in the length scale required for DDT, and their presence allows turbulent flames to propagate at steady velocities of 1000 m/s, as opposed to the 100 m/s typically observed in smooth-walled tubes. The high intensity of turbulent mixing induced by obstacles and the hot spot formation mechanisms such as Mach reflections occurring off obstacles allows high-speed turbulent flames to mimic cellular detonative combustion and thus propagate at very high speeds. This blurring of distinction between detonations and very high-speed turbulent flames gives rise to the term "quasi-detonation."
The ability of obstacles to promote very high-speed turbulent flames is well illustrated in the results of Chao ei al. [23], in which a 30 x 30 cm tube with a staggered array of cylindrical obstacles giving an average blockage ratio of 40% is used to examine quasi-detonation propagation.
Shown in Fig. 3 is the trajectory of a flame in a stoichiometric methane-air mixture propagating down this tube. The flame accelerates within 3-4 m (10-12 tube diameters) to a velocity of 1000 m/s. This velocity is more than 200 m/s greater than the maximum turbulent flame velocity that was previously observed in a stoichiometric methane-air mixture in a similar diameter tube with orifice- plate obstacles [4]. Thus, the obstacle geometry can play a significant role in the acceleration and terminal velocity of a turbulent flame. The methane-air flame does not transit to detonation (VCj = 1.8 kra/s), however. Indeed, a methane-air mixture has never been shown to detonate under laboratory conditions, because it is an extremely insensitive mixture with a detonation cell size on the order of 30 cm. In order for a detonation to propagate, the tube diameter must typically be at least one cell width in diameter. In Fig. 3, the fact that the passage between obstacles is less than one cell width effectively "denies" the turbulent flame the ability to detonate. To make the final transition to detonation, the length scales of the tube must be consistent with the chemical length scales of the explosive mixture (induction length, cell size, etc.). This limit is not so easily overcome, and requires that the mixture be conditioned or sensitized in some way to reduce the relevant chemical length scale.
52

HIGH-SPEED DEFLAGRATION: FUNDAMENTALS & CONTROL
(b)
fiSr€;3 Time VS- diS\anCe ty and Velocity vs- distance (fc) dat* for turbulent flame
and stoichiornetnc methane-air mixture (initial pressure 1 bar)
53

HIGH-SPEED DEFLAGRATION fc DETONATION _
4 ONSET OF DETONATION: SENSITIVITY OF MIXTURE
While chemical kinetics plays a role in laminar and turbulent flame propagation, it is only with the shock-initiated reactions of the final onset of detonation that the exponential nature of kinetic rates dominates the propagation mechanism. Compared to laminar-turbulent flame transition and the acceleration of turbu- lent flames, chemical sensitization or desensitization of combustible gases for detonability has received comparatively little attention. The work that is avail- able suggests that halogenated compounds, typically thought of as inhibitors for flammability, may in fact act as sensitizers for detonation. Moen ei al. [24] and Vandermeiren and Van Tiggelen [25] both found that CF3Br had a slight sensitiz- ing effect on hydrocarbon-air detonations. Likewise, Egerton and Gates lib, l(\ found that lead tetraethyl (an antiknock agent) resulted in a reduced length for transition to detonation, despite the compound's expected role as a scavenger of free radicals. Later experiments by Shchelkin and Sokolik [28] with increased concentrations of lead tetraethyl did show an increase in the length required for
transition to detonation. Given the limited data available on sensitization of detonable mixtures
the most significant effect was demonstrated by the cool flame experiment of Shchelkin and Sokolik [29]. They injected a mixture of pentane and oxygen (250-370 Torr) into a heated tube (325-400 °C) and ignited the mixture at one end after a specified delay. If the delay was longer than the half-second period required for a cool flame oxidation process to be effected, a significant reduction in the length required for the mixture to detonate was observed (from 80 to 40 cm) Their conclusion was that the presence of relatively long-lived peroxide radicals in mixtures processed by cool flame-oxidation resulted in significantly increased kinetic rates and thus a reduction in the run-up distance to detona-
tion. In order to further investigate the role of free radicals on the length scales
required for DDT, Yoshinaka et al. [30, 31] have recently conducted an inves- tigation using a system of gaseous hydrogen and chlorine. This system per- mits the use of a UV light source to photochemically dissociate the molecular chlorine into chlorine radicals, thus uniformly presensitizmg a quiescent mix- ture The schematic of the experiment is shown in Fig. 4. For a mixture of 1 5H2 + Cl2 at 4.8 kPa, steady illumination from the UV light will result in the mixture undergoing autoignition after approximately 200 ms. If the mix- ture is ignited at one end via a weak spark prior to autoignition, the effect ol free radicals on the transition to detonation can be observed. Figure 5 shows the velocity of the combustion wave (as monitored by photodiodes mounted along the tube) for experiments with and without UV presensitization. Note that the envelopes shown enclose ten repeated experiments for both cases (with
54

HIGH-SPEED DEFLAGRATION: FUNDAMENTALS & CONTROL
spark igniter
fluorescent tube ballast and fixture
UV fluorescent tube
Pyrex glass tubes
mixture inlet port
Figure 4 Schematic of experiment to examine the effect on DDT of free radicals created in hydrogen-chlorine mixtures by UV light
and without UV irradiation) to incorporate the inherent scatter present in any DDT experiment. The flame trajectories agree for the two cases until the flame reaches approximately 1000 m/s, whereupon the UV-sensitized mixture promptly transitions to detonation with a significant overshoot of the CJ veloc- ity, while the unsensitized mixture takes approximately 20% longer to initiate and does so only after a period of nearly constant velocity flame propagation. This result reinforces the idea that the effect of chain-initiating chemical radi- cals, and therefore the role of kinetic rates in general, only becomes significant in the final stages of DDT when shock-initiated reactions are the propagation mechanism.
Other than the cool flame experiment of Shchelkin and Sokolik [29], a sim- ilar presensitization of hydrocarbon-air mixtures has not been demonstrated. For PDE applications, additives such as acetylene [32], nitrates such as iso- propyl nitrate [33, 34], and conventional fuel additives dimethyl ether (DME) and 2-ethylhexyl nitrate (2-EHN) [35] are currently being considered as sensitizers to reduce the length scales of hydrocarbon-air detonations.
Based on detonation cell size, acetylene is the most sensitive of any hydro- carbon fuel in air and thus is an obvious candidate as a sensitizing agent for fuel-air mixtures. Such a sensitization effect is observed in natural gas [36]. The addition of relatively small amounts (5%) of ethane to methane, such as found in natural gas, results in the induction time being reduced by a factor of two, thus rendering the mixture much more sensitive than pure methane. Recent results obtained at McGill University, however, suggest that acetylene's role as a sensitizer of hydrocarbon fuels is merely a linear interpolation between the unsensitized mixture and pure acetylene in air. Figure 6 shows results for a propane-acetylene-oxygen-nitrogen mixture where the oxygen-to-nitrogen ratio is fixed at ß = 3.0 (corresponding to oxygen-enriched air). As the percent- age of acetylene in the fuel (a) is changed, the oxygen concentration is varied
55

HIGH-SPEED DEFLAGRATION fc DETONATION
1
3000
2500
2000
1500
1000
500
0
_ 1 ! DDT - K
V n ' steady / !
! with UV presensitization
- \ \ /I j N,
-- \ \ / „...l.— .1— -U
-
i DDT alone
- ! (no UV presensitization)
-^^^s ■ J i ■1 III i _i—L_
0 200 400 600
x/mm
800 1000
Figure 5 Velocity vs. distance data demonstrating the effect of UV presensitization for 1.5H2 + Cl2 mixtures at initial pressure 4.8 kPa
a=0.5
(l-a)C3H8+aC2H2+5(l-a/2)(02+3N2)
1.0 x/m
Figure 6 Velocity vs. distance data showing the effect on DDT of adding acetylene to a nroDane-oxvRen-nitrogen mixture (constant stoichiometry, initial pressure 1 bar)
56

HIGH-SPEED DEFLAGRATION: FUNDAMENTALS & CONTROL
0.25 0.5 0.75 Concentration of acetylene, a
Figure 7 Reduction in run-up distance to detonation as a function of acetyle concentration
to maintain a stoichiometric fuel equivalence ratio. The velocity of the com- bustion wave as measured by ionization probes along the tube is plotted in Fig. 6 (the details of the apparatus are the same as for Fig. 2). The run-up distance to detonation as a function of a is plotted in Fig. 7, and the addi- tion of a small amount of acetylene is not seen to have the desired sensitization effect.
The addition of various nitrates (isopropyl nitrate, 2-ethylhexyl nitrate, etc.) to a hydrocarbon fuel is suggested to have an effect due to the formation of N02 by the decomposition of the nitrate, which reacts with methyl radicals to produce OH radicals [33]. Rather than investigate the effect of these various nitrates, which is complicated by their typically low vapor pressure at room tem- perature, a preliminary investigation of direct N02 addition to hydrocarbon-air mixtures has recently been done at McGill University. Again using propane in oxygen-enriched air as a baseline mixture, N02 was added to the mixture and the effect of different concentrations was observed. The baseline mixture was slightly propane-rich in oxygen-enriched air: mixture (a) C3H8 + 5(0.95O2 + 3N2) at initial pressure of 1 bar. The result of 10 repeated experiments in mixture (a) is shown as a shaded envelope in Fig. 8. Adding 0.5 Torr of N02 to mixture (a), representing ~ 1% addition to the fuel content, resulted in no noticeable change in the run-up distance to detonation. Increasing the N02 concentration to 4 Torr or ~ 10% addition to the fuel, resulted in a shortening of the run-up distance to detonation by 0.3 m (corresponding to
57

HIGH-SPEED DEFLAGRATION fc DETONATION
2500
2000
1500
1000
mixture (a) + 4TorrN02N
envelope of results mixture (b): C3H8+5(02+3N2)
mixture (a) + 0.5 Torr N02
envelope of results mixture (a): C3H8+5(0.95O2+3N2)
x/m
Figure 8 Velocity vs. distance data showing the effect on DDT of adding N02 to a propane-oxygen-nitrogen mixture (initial pressure 1 bar)
two tube diameters), but this same reduction in run-up length can also be ef- fected by increasing the oxygen partial pressure by 9 Torr, bringing the mix- ture to stoichiometric, (mixture (b)). Since the effect of N02 addition is com- parable to simply adding oxygen, it may merely result in an energetic effect rather than a chemical sensitization that significantly accelerates the kinetic rates*. These results suggest that N02 is not an effective sensitizer. Nitrates that decompose to form N02 do not appear to have a very significant sensi- tization effect either [33, 34]. An additive that plays a substantial role in ac- celerating the chain initiation and branching mechanisms has yet to be identi-
fied.
5 CONCLUDING REMARKS
As DDT is an extremely complex phenomenon, incorporating numerous differ- ent mechanisms and orders of magnitude variations in propagation velocity, it is essential that studies of DDT carefully isolate the effect being examined. The results reviewed in this paper showed that the effect of a spark igniter for fuel-air
»Note that N02 is partially polymerized to the dimer N204 at room temperature (30% N02, 70% N204 at 20 °C). Thus, the effect of adding N02/N204 should be compared to adding an equivalent number of oxygen atoms.
58

HIGH-SPEED DEFLAGRATION: FUNDAMENTALS & CONTROL
mixtures is confined to promoting a more rapid transition from laminar to tur- bulent flame and does not significantly influence the run-up distance required for detonation. Only with a turbulent jet igniter of very large diameter (d > 10A) can the intensities and scales of turbulence necessary for the direct onset of det- onation be realized. Obstacles on the tube wall can increase the intensity of turbulence in the flame and introduce transverse pressure fluctuations (shocks), and thus dramatically increase the burning rate and strength of compression waves sent ahead of the flame. This sets the stage for shock-induced combustion and the onset of detonation by the formation of explosion centers, but deto- nation will not occur if the tube is smaller than the characteristic detonation length scale (the cell size). It is in this final onset of detonation that kinetic rates dominate the transition mechanism and the presence of free radicals or other chemical sensitizers can have a pronounced effect. An efficacious sensitizer for hydrocarbon fuel-air mixtures has yet to be identified, but the cool-flame experiments of Shchelkin and Sokolik [29], in which a heavy hydrocarbon fuel is re-formed via a partial oxidation process to more sensitive hydrocarbons and free radicals, appears to be a promising way to dramatically reduce the transition length to detonation.
In light of the fact that DDT is an ensemble of various mechanisms, the results reported in this paper represent the same shortcomings as prior work in DDT: examining the run-up distance to detonation alone does not isolate the various mechanisms involved. Rather, future work on DDT should be focused on defining the basic scaling laws for DDT, and then relating these laws to more fundamental parameters, such as the ratio of mixture cell size to tube diameter.
ACKNOWLEDGMENTS
The authors are indebted to Max Romano, Jenny Chao, Max Kolbe, and Teresa Mihalik for their assistance in performing the experiments reported in this paper.
REFERENCES
1. Lee, J.H.S., and I. Moen. 1980. The mechanism of transition from deflagration to detonation in vapor cloud explosion. Progress Energy Combustion Science 6: 359-89.
2. Shepherd, J. E., and J. H.S. Lee. 1992. On the transition from deflagration to det- onation. In: Major research topics in combustion. Eds. M. Y. Hussaini, A. Kumar, and R. G. Voigt. ICASE/NASA LaRC ser. New York: Springer-Verlag. 439-90.
59

HIGH-SPEED DEFLAGRATION fc DETONATION
3. Moen, I.O., M. Donato, R. Knystautas, and J.H.S. Lee. 1980. Flame acceleration due to turbulence produced by obstacles. Combustion Flame 39:21-32.
4. Peraldi, O., R. Knystautas, and J.H.S. Lee. 1986. Criteria for transition to det- onation in tubes. 21st Symposium (International) on Combustion Proceedings. Pittsburgh, PA: The Combustion Institute: 1629-37.
5. Chue, R.S., J.H.S. Lee, T. Scarinci, A. Papyrin, and R. Knystautas. 1993. Tran- sition from fast deflagration to detonation under the influence of wall obstacles. In: Dynamic aspects of detonations. Progress in astronautics and aeronautics ser. Washington, DC: AIAA Inc. 153:270-82.
6. Teodorczyk, A., J.H.S. Lee, R. Knystautas. 1988. Propagation mechanisms of quasi-detonations. 22nd Symposium (International) on Combustion Proceedings. Pittsburgh, PA: The Combustion Institute. 1772-31.
7. Teodorczyk, A., and J.H.S. Lee. 1995. Detonation attenuation by foams and wire mesh lining the walls. Shock Waves 4:225-36.
8. Chue, R.S., J.F. Clarke, and J.H.S. Lee. 1998. Chapman-Jouguet deflagrations. Royal Society Proceedings A(441):607~23.
9. Vasil'ev, A.A., V. V. Mitrofanov, and M.E. Topchiyan. 1987. Detonation waves in gases. Combustion Explosion Shock Waves 23:109-31.
10. Radulescu, M.I. 1999. Experimental investigations of direct initiation of quasi- cylindrical detonations. M. Eng. Thesis, McGill University, Department of Me- chanical Engineering.
11. Knystautas, R., J.H.S. Lee, O. Peraldi, and C.K. Chan. 1986. Transmission of a flame from a rough to a smooth-walled tube. In: Dynamics of explosions. Progress in astronautics and aeronautics ser. Washington, DC: AIAA Inc. 106:37-52.
12. Higgins, A.J., R. Knystautas, J.H.S. Lee, and A. Yoshinaka. 1997. Re-initiation of a detonation wave downstream of a packed bed. 16th Colloquium (Inter- national) on the Dynamics of Explosions and Reactive Systems Proceedings. Cra-
cow, Poland.
13. Knystautas, R., J.H.S. Lee, I. Moen, and H.-Gg. Wagner. 1979. Direct initia- tion of spherical detonation by a hot turbulent gas jet. 17th Symposium (Inter- national) on Combustion Proceedings. Pittsburgh, PA: The Combustion Institute:
1235-45.
14. Mackay, D.J., S.B. Murray, I.O. Moen, and P.A. Thibault. 1988. Flame-jet ig- nition of large fuel-air clouds. 22nd Symposium (International) on Combustion Proceedings. Pittsburgh, PA: The Combustion Institute: 1339-53.
15. Ungut, A., and P.J. Shuff. 1989. Deflagration to detonation transition from a venting pipe. Combustion Science Technology 63:75-87.
16. Moen, I.O., D. Bjerketvedt, A. Jenssen, B. H. Hjertager, and J.R. Bakke. 1989. Transition to detonation in a flame jet. Combustion Flame 75:297-308.
60

HIGH-SPEED DEFLAGRATION: FUNDAMENTALS & CONTROL
17. Carnasciali, F., J. H.S. Lee, R. Knystautas, and F. Fineschi. 1991. Turbulent jet initiation of detonation. Combustion Flume 84:170-180.
18. Inada, M., J.H.S. Lee, and R. Knystautas. 1992. Photographic study of the direct initiation of detonation by a turbulent jet. In: Dynamic aspects of detonations. Progress in astronautics and aeronautics ser. Washington, DC: AIAA Inc. 153-253- 69.
19. Thomas, G. O., and A. Jones. 2000. Some observations on the jet initiation of detonation. Combustion Flame 120:392-8.
20. Laffitte, P. 1923. Sur la formation de l'onde explosive. Comptes Rendues 176- 1392-5.
21. Chapman, W.R., and R.V. Wheeler. The propagation of flame in mixtures of methane-air. J. Chemical Society: 2139.
22. Shchelkin, K.I. 1946. Effect of roughness of the surface in a tube on origination and propagation of detonation in gases. J. Experimental Theoretical Physics. 10.
23. Chao, J., M. Kolbe, and J. H. S. Lee. 1999. Influence of tube and obstacle geometry on turbulent flame acceleration and deflagration to detonation transition. 17th Colloquium (International) on the Dynamics of Explosions and Reactive Systems Proceedings. Heidelberg, Germany.
24. Moen, I.O., S.A. Ward, P.A. Thibault, J.H.S. Lee, R. Knystautas, T. Dean, and C. K. Westbrook. 1984. The influence of diluents and inhibitors on detonations. 20th Symposium (International) on Combustion Proceedings. Pittsburgh, PA: The Combustion Institute. 1717-25.
25. Vandermeiren, M., and P. J. Van Tiggelen. 1988. Role of an inhibitor on the onset of gas detonations in acetylene mixtures. In: Dynamics of explosions. Progress in astronautics and aeronautics ser. Washington, DC: AIAA Inc. 114:186-200.
26. Egerton, A., and S.F. Gates. 1926. On detonation of gaseous mixtures of acetylene and of pentane. Royal Society Proceedings A(114):137-51.
27. Egerton, A., and S. F. Gates. 1926. On detonation of gaseous mixtures at high initial pressures and temperatures. Royal Society Proceedings A(114):152-60.
28. Shchelkin, K., and A. Sokolik. 1937. The effect of lead tetraethyl on the formation of the detonation wave. Acta Physicochimica U.R.S.S. 7:581-8.
29. Shchelkin, K., and A. Sokolik. 1937. The influence of the "chemical presensi- tisation" on the initiation of the detonation wave. Acta Physicochimica U.R.S S 7- 589-96.
30. Yoshinaka, A., M. Romano, and J.H.S Lee. 1999. Effect of free radicals on the transition from deflagration to detonation. 17th Colloquium (International) on the Dynamics of Explosions and Reactive Systems Proceedings. Heidelberg, Germany.
31. Yoshinaka, A. 2000. The effect of free radicals on the transition from deflagration to detonation. M. Eng. Thesis. McGill University, Dept. of Mechanical Engineering.
32. Williams, F.A., R.K. Hanson, and C. Segal. 1999. Fundamental investigations of pulsed detonation phenomena. JANNAF 36th CS/APS/PSHS Joint Meeting Proceedings. Orlando, FL.
61

HIGH-SPEED DEFLAGRATION & DETONATION
33. Zhang, F., S. B. Murray, R. Akbar, and P.A. Thibault. 1999. Effects of ni- trates on hydrocarbon flames and detonations. 17th Colloquium (International) on the Dynamics of Explosions and Reactive Systems Proceedings. Heidelberg,
Germany. 34. Thibault, P., R. Akbar, and P. Harris. 2000. Detonation properties of unsensitized
and sensitized JP-10 and Jet-A fuels for pulse detonation engines. AIAA Paper No. 2000-3592. 36th AIAA/ASME/SAE/ASEE Joint Propulsion Conference and Exhibit Proceedings. Huntsville, AL. Davidson, D. F., D.C. Horning, R.K. Hanson, and B. Hitch 1999. Shock tube ignition time measurements for n-heptane/02/Ar with and without additives. 22nd Shock Wave Symposium (International) Proceedings. London, UK.
Westbrook, C.K., and L.C. Haselman. 1981. Chemical kinetics of LNG detona- tions. In: Gasdynamics of detonations and explosions. Progress in astronautics and aeronautics ser. New York, NY: AIAA Inc. 75:193-206.
35
36
62

INITIATION OF COMBUSTION AND DETONATION IN H2 + 02 MIXTURES
BY EXCITATION OF ELECTRONIC STATES OF OXYGEN MOLECULES
A. M. Starik and N. S. Titova
A kinetic model to describe combustion and detonation initiation in oxygen-hydrogen mixtures by activating molecular oxygen in electronic discharge has been developed. The mechanisms of combustion initiation in an adiabatic closed reactor and in a supersonic flow behind an oblique shock wave front by the excitation of oxygen molecules to the a1 A, electronic state and by activation of the molecules in electric discharge are analyzed. Abundance of electronically excited oxygen molecules in a reacting mixture is shown to result in a significant decrease of the self- lgmtion temperature as well as induction and combustion zone lengths in a supersonic flow behind the shock wave. Activation of oxygen molecules in electric discharge is much more efficient in promoting the combustion and detonation processes compared to the case when only 02(a1Aq) molecules are generated in the mixture.
1 INTRODUCTION
In recent publications, the possibility to efficiently control the initiation of det- onation and combustion processes by the excitation of the internal degrees of freedom of reactant molecules has been extensively discussed. Preliminary exci- tation of molecular vibrations of the reacting molecules was shown to result in a significant decrease of the induction and combustion times or induction and combustion zone lengths behind detonation waves in a supersonic flow [1-3].
Excitation of electronic molecular states can also affect the combustion and detonation kinetics [4]. The latter phenomenon has not been properly discussed m the literature, apparently because of considerable difficulties arising in the sim- ulation of kinetic processes involving electronically excited species. To create the
63

HIGH-SPEED DEFLAGRATION fc DETONATION
kinetic model including chemical reaction with electronically excited molecules, it is necessary to significantly increase the number of elementary stages. The ex- citation affects the rate constants of chemical reactions and, hence, the dynamic and thermodynamic characteristics of combustion and detonation. Electronic states of molecules can be efficiently excited in an electric discharge or by reso-
nant laser radiation. This paper discusses the kinetic processes of combustion and detonation ini-
tiation in an adiabatic closed reactor and in a supersonic flow behind a shock wave propagating in a H2 + 02 mixture with 02 molecules excited in electric
discharge.
2 KINETIC MODEL
One of the most important and complicated problems deals with constructing a set of elementary processes which would adequately predict the principal combus- tion characteristics. To obtain the general mechanisms of combustion initiation in H2 + 02 mixtures within a wide range of initial temperatures, a series of mod- eling calculations in an adiabatic closed reactor were carried out using several kinetic schemes. Within the approximation of an inviscid gas with zero thermal conductivity, the system of governing equations is similar to that presented in [2]. For combustion of H2 + 02 mixtures, a fairly complete description is provided by a 29-step chemical kinetic scheme involving the following species: H2, 02, H20, OH, O, H, H02, H202, and 03 [5]. The list of reactions with the appro- priate rate coefficients for forward k+q(T) and reverse k-q(T) reactions in the Arrhenius form kq(T) = AqT
n" exp(Eag/T) are given in Table 1 and numerated from 1 to 29. In the present analysis several kinetic schemes were considered:
(I) A scheme composed of reactions 1 to 9, involving H2, 02, H20, OH, 0, and H species;
(II) A scheme composed of reactions 1 to 23, involving H2, 02, H20, OH, 0, H, H02, and H202 species; and
(III) A complete scheme composed of reactions 1 to 29.
Table 2 shows the results of numerical calculations of the induction time r,-„, burning time rc and final temperature Tc for the oxygen-hydrogen mixture with H2/02 = 2/1 burning under adiabatic conditions at initial pressure P0 - 10 kPa and various values of the initial temperature T0 for the three kinetic schemes men- tioned above. In these calculations, it is assumed that vibrational, rotational and translational degrees of freedom of molecules are in thermodynamic equilibrium. The results show that at T0 > 800 K all the kinetic schemes give close values for
64

HIGH-SPEED DEFLAGRATION: FUNDAMENTALS & CONTROL
Table 1 Chemical reactions taken into account in kinetic modeling of combustion of H2 + 02 mixture and the corresponding reaction rate coefficients
No Reaction k+q, (cma/mol)"' k-q, (cnrVmol)"-
M 1 H20 + M = OH + H + 2 H2 + M = 2H + M 3 C-2 + M = 20 + M 4 0H + M = 0 + H + M 5 H2 + O = OH + H 6 02 + H = OH + O 7H20 + 0 = 20H 8 H20 + H = OH + H2
9 H2 + 02 = 20H 10 H02 +M = H + 02+M 11 H2 + 02 = H + H02
12 H20 + 0 = H + H02
13 H20 + 02 = OH + H02
14 H20 + OH = H2 + H02
15 20H = H + H02
16 0H + 02 =0 + H02
17 H202+M = 20H + M 18 H + H202 = H2 + H02
19 H + H202 =H20 + OH 20 2H02=H202 + 02
21 H02 + H20 = H202 + OH 22 OH + H02 = H202 + O 23 H20 + 02=H202 + 0 24 03 + M = 02 + O + M 25 03 + H = OH + 02
26 03 + O = 202
27 03 + OH = H02 + 02
28 03 + H2 = OH + H02
29 03 + H02 = OH + 202
Aq nq Eaq Aq nq
-2 Eaq
1(24) -2.2 -59000 2.2(22) 0 2.2(14) 0 -48300 9(17) -1 0 2.6(18) 0 -59580 1.1(14) -1 900 8.5(18) -1 -50830 7.1(18) -1 0 1.8(10) 1 -4480 8.3(9) 1 -3500 2.2(14) 0 -8455 1.3(13) 0 -350 5.8(13) 0 -9059 5.3(12) 0 -503 8.4(13) 0 -10116 2(13) 0 -2600 1.7(15) 0 -24200 1.7(13) 0 -24100
gx- 2.1(15) 0 -23000 1.5(15) 0 500 1.9(13) 0 -24100 1.3(13) 0 0
4.76(11) 0.372 -28743 1(13) 0 -540 1.5(15) 0.5 -36600 3(14) 0 0 7.2(9) 0.43 -36100 6.5(11) 0 -9400
1.2(13) 0 -20200 2.5(14) 0 -950 1.3(13) 0 -28200 5(13) 0 -500 1.2(17) 0 -22900 9.1(14) 0 2650 1.7(12) 0 -1900 6(11) 0 -9300 5(14) 0 -5000 2.4(14) 0 -40500
qx- 1.8(13) 0 -500 3(13) 0 -21600 1.8(13) 0 -15100 1(13) 0 -910 5.2(10) 0.5 -10600 2(13) 0 -2950 3.4(15) 0.5 -44800 qx •8.4(11) 0 -2130
qx ■ 4(14) 0 -11400 6.9(12) 0 1050 2.3(11) 0.75 0 4.4(7) 1.44 -38600 1.1(13) 0 -2300 1.2(13) 0 -50500
qx- 9.6(11) 0 -1000 9(8) 0 0 6(10) 0 -10000
qx ■ 2(10) 0 -1000
Continued
Tin and rc. However at T0 < 800 K, the corresponding values of rin, TC, and Tc
significantly differ. Schemes I and II do not provide the accurate values of r,-„, rc, and Te. Thus, in order to analyze the mechanisms of combustion initiation in a H2 + 02 system, one has to use the complete kinetic scheme III involving 29 reactions.
Under preexcitation of 02 molecules in the a1 A, electronic state, the ki- netic scheme III has to be supplemented with processes including excited oxygen
65

HIGH-SPEED DEFLAGRATION fc DETONATION
Table 1 Chemical reactions taken into account in kinetic modeling of combustion of H2 + 02 mixture and the corresponding reaction rate coefficients (Continued)
No Reactions fc+„ (cmö/mol)'1
A„
-1-1
Ean
fc_„, (cmVmol)"-^-1
Ar Eaq
Qa
30 O + O + M = 02(a1Ag) + M
31 H02 + M = 02(0^^ +H + M
32 2H02 =H202+02(a1A9) 33 03 + O = 02 + OzCo1 As) 34 H + 03 = OH+ 03(0^9) 35 03 + OH = H02 +02(0.^9) 36 03+H02 =
OH+ 02+02(0^9) 37 O3+M =
0 + 02(a1Ag)+M 38 H+ 03(0^9) = OH+ 0 39 H2 + 02(o1As) = 20H 40 H2 + 02(a
1A9) = H + H02
41 H20 + OjfV Ag) = OH + H02
42 0H + 02(o1A9) = 0 + H02
43H20 + 02(o1Afl) = H202 + 0
44 03 + O^a1 A9) = 02 + 02 + O 45 02{a1Ag) + M = Oi + M
M = 0,H M = 03
M = 02
M = H2
M = H20,OH,H02,H202
Remark: A(m) corresponds to A ■ 10"\
Reactions with 02(a Ag)
■ 2.1(15) •1.8(13)
9.6(11)
qa -2(10) 0
<7a-4(14) 1.1(14) 1.7(15) 2.1(13) 1.5(15) 0.5 1.3(13) 0
0 0 0 0
-23000 -500
-1000
-1000
-11400 -3188
-17080 -18216 -25521 -17007
3.12(13) 0 -2840
4.2(8) 2.4(9)
1.02(6) 2.7(6)
3.36(6)
2.6(18) 0 -48188
1.5(15) 0 500
1.2(13) 0 -39604 4.4(7) 1.44 -27225
6.9(12) 0 1050 5.8(12) 0 -6224
6(12) 0 -1518
ga -8.4(11) 0 -2130
0 0 0 0 0
molecules. These processes are listed in Table 1 with numbers from 30 to 45. Consider briefly the problems arising in determining the reaction rates for these processes. Excitation of vibrational or electronic states of the reactant molecules is known to reduce the barriers of endoergic reactions. According to [7], the rate coefficient of reactions involving excited molecules may be written in the
form
Kexq — siq exp I Egg — Otqbexq
T (1)
66

HIGH-SPEED DEFLAGRATION: FUNDAMENTALS & CONTROL
Table 2 Calculated values of rin, TC (in s), and Tc (in K) for combustion of the oxygen-hydrogen mixture with H2/02 = 2/1 under various initial temperatures with using different kinetic schemes
1 2 3 % Tin Tc Tc Tin Tc Tc Tin Tc Tc 550 3.15(-1) 3.15(-1) 2845 2.22(6) 2.22(6) 2673 2.35 2.35 2673 600 8.77(-2) 8.8(-2) 2836 8.25(4) 8.25(4) 2666 9.37(-l) 9.37(-l) 2666 800 2.80(-3) 3.26(-3) 2810 3.21(-1) 3.58(-3) 2644 3.16(-3) 3.5(-3) 2644
1000 4.02(-4) 1.04(-3) 2792 3.88(-4) 8.88(-4) 2631 3.88(-4) 8.88(-4) 2631 1200 1.22(-4) 8.51(-4) 2779 1.22(-4) 7.72(-4) 2622 1.22(-4) 7.72(-4) 2622 Remark: A(m) corresponds to A ■ 10
where Aq is the preexponential factor of the rate coefficient for nonexcited species; Eaq is the activation energy of an endoergic reaction; Eexq is the energy of an excited state of a reacting molecule; T is the translational temperature; aq is the coefficient of utilization of the electronic or vibrational energy. At EeXq < Eaq, the magnitude of aq can be represented in the first approximation by the equation [7]:
E+
^aq + &aq
where E+q is the activation energy of the 5th chemical reaction in the direc- tion of destruction of an excited molecule, and E~q is the activation energy for formation of that molecule. For excited 02 molecules in axAg electronic state, Eex = 11172 K. Using Eqs. (1) and (2), the rate coefficients for reverse reac- tions 30, 33, and 34 and forward reactions 39, 41, and 42 were estimated. In the case of a vanishing energetic barrier for a chemical reaction (recombination reac- tions), the reaction products can be formed in electronic excited states 02(a1Ag) and 02(b1'Sg). For these cases, it was assumed that the probability of produc- tion of 02 molecules in different electronic states, qe, is derived in accordance with its degeneration multiplicity ge. For the ground 02(X
3E~) state, qx = 0.5; for Oa^A,,) — qa = 0.33; and for 02(61E+) — qb = 0.17. In this study, the processes involving 02(6^+) molecules were disregarded. It was supposed that for 02(a1Ag) production channels qe = 0.33 + 0.17 = 0.5. In this way, the rate coefficients were calculated for forward reactions 31, 32, 35, 36, and 37 and for reverse reaction 43. The rate coefficients for barrier (forward reactions 30, 33, and 34 and reverse reactions 39, 41, and 42) as well as for nonbarrier processes (reverse reactions 32, 35, and 36 and forward reaction 43) were evaluated using the equation of detailed equilibrium. The temperature dependencies of the rate coefficients for exchange reactions 38 and 40 in forward and reverse directions
67

HIGH-SPEED DEFLAGRATION fc DETONATION
were taken from [4] and for reaction 44 — from [8]. The rate coefficients for electron-translational relaxation processes involving 02(a1Ag) were selected in conformity to the recommendation [9]. When considerating combustion pro- cesses involving reactions 1 to 29 without participation of02(a1Ag) molecules,
it was assumed that qx = 1.
ON MECHANISMS OF LOW-TEMPERATURE INITIATION OF COMBUSTION IN H2 + 02 SYSTEM
1100
Figure 1 Predicted dependencies T§{TO) (dotted curve) and Tin(To) for the oxygen- hydrogen mixture with H2/O2 = 2/1 at Po — 10 kPa without preexcitation of 02 molecules (solid curve) and with preexcitation of O2 molecules (dashed curves 1-4 correspond to
First the effect of preexcitation of oxygen molecules to electronic state a1 A,, on self-ignition of H2 + O2 mixture in a closed adi- abatic reactor of radius Ra is con- sidered. It is known that H2 + O2 combustion is initiated by build- up of OH radicals, 0 and H atoms. Formation of the active radicals is limited by the characteristic chemical reaction time T[
H, that
determines the induction time TJ„.
Active-radical transport from the reaction zone is due to diffusion with a characteristic time r; = min{r^}, where r° = R2JDik
and Dik is the coefficient of mul- ticomponent diffusion. The mix- ture self-ignites, if rfh ~ TJ„ <
(702(alA3)/702 = 10 3, 10 respectively)
,5-10" tidO.l, rf. In H2 + O2 mixtures rf cor- responds to the diffusion time of H atoms (rß).
Figure 1 shows the rß(T0) and Tin(T0) dependencies calculated for the oxygen-hydrogen mixture with H2/02 = 2/1 at P0 = 10 kPa without and with preexcitation of 02 molecules to the a1 A,, electronic state. It is seen that excitation of 02 molecules reduces the self-ignition temperature (self-ignition temperature is calculated from the condition rtn = r#). Without preexcitation, the mixture self-ignites at T0 = 580 K. Upon a fairly weak preexcitation of 02
molecules (mole fraction of 02(a1Ag) molecules 7o2(aiAg)/7o2 = 10-3), it self- ignites at To « 500 K. Moreover, at high degree of excitation of 02 molecules
(jo2{a1Ag)/l02 = 0.1), the self-ignition temperature drops to 300 K.
68

HIGH-SPEED DEFLAGRATION: FUNDAMENTALS fc CONTROL
To explain this phenomenon, consider the mechanisms of combustion initia- tion in the case without and with preexcitation. Without preexcitation, the main reaction that initiates active-radical formation at low and high temperatures is H2 + 02 = 20H. Formation of OH radicals leads to generation of H atoms by reaction 8 in reverse direction (the numbers of reactions correspond to numer- ation in Table 1). H atoms participate in two different processes. One of them produces O atoms in reaction 6 and triggers the chain combustion mechanism. The other results in destruction of H atoms and production of H02 radicals (reverse reaction 10). At T > 800 K, the rate of the first process is greater than that of the second. However at 300 K < T < 600 K the situation re- verses. In this temperature range, an additional source of O atoms is the re- action of ozone dissociation 24. Ozone is formed by reaction of H02 radicals with 02 molecules (reverse reaction 27). At T < 600 K, the dissociation rate of ozone is close to the formation rate of O atoms by the reaction initiating the chain mechanism (reaction 6). The chain mechanism is completed by reac- tion 5.
Preexcitation of 02 molecules to the alAg electronic state brings about a new additional channel of OH radical formation (reactions 38, 39), which en- hances the chain combustion mechanism. These processes with participation of 02(a
1A3) molecules proceed much faster than the appropriate processes in- volving oxygen molecules in the ground electronic state 02(X
3Ej) (reactions 9 and 6). At low initial temperatures (T0 < 550 K), reaction 44 with participation of 03 and 02(a1Ag) molecules begins to play a significant role in production of O atoms. Promotion of formation of OH radicals and O atoms intensifies the chain mechanism of combustion and reduces the induction period and self- ignition temperature.
These processes are illustrated in Fig. 2 which shows time histories of the rates Siq of reactions producing H, O, and OH during combustion of the oxygen- hydrogen mixture with H2/02 = 2/1 under preexcitation of 02 molecules in the a Ag electronic state (jo2(a^Ag)/jo2 = 0.1).
Rates Siq are specified by the equations:
Siq = ^<l[Rl_^h ^(-) = k+(_)qnft Na«->t N = £Nt i=i »=i
where at and ajq are the stoichiometric coefficients of the ?th reaction yield-
ing the tth component; n^(_) is the number of components involved in the direct and reverse reactions; My is the number of atomic and molecular compo- nents in the mixture; N{ is the number density of molecules (atoms) of the ith sort.
Transformation of concentration histories with preexcitation of 02 molecules in the alAg electronic state (7o2(a>Ag) = 0.1) as compared to the case with
69

HIGH-SPEED DEFLAGRATION fc DETONATION
10
IO1
- IO-
W
■5" '■ 63 -10""
-10
-10"
5 y
^\^40 6
/ \
1 1
-6 -5 -4 lgr/s
-3-6
7,72/
38^.—-y>a
1 1
-5 -4
lg'/s
-3 -6
1
io"3 i'
-6 6 ji 10 5 Yi io"9 r «. V i
en
»3~ -9 -10
70 38 / "** -10 37 \
-io"3
.1
\ i i
-4 -2 Igt/a
(«)
0 -6
Ȁ27 5 /
- " 8' -.. \
1 1
4 -2 0 -6 -4 -2
lgr/s lgr/s
(^ (c)
Figure 2 Histories of production (+) and destruction (-) rates Siq for H (a), 0(6), and OH (c) species during combustion of the oxygen-hydrogen mixture with^/Oj - 2/1 at Po = 10 kPa with preexcitation of 02 molecules (7o2(aiA,)/To2 - 0.1) at To = 800 K (solid curves) and 400 K (dashed curves). Numbers denote the reaction numbers in Table 1
no preexcitation is shown in Fig. 3. The. results indicate that build-up of excited oxygen molecules C^A,) in a H2 + 02 mixture significantly alters the kinetic processes and enhances the chain combustion mechanism. Oxygen molecules can be efficiently excited to singlet states a1 A, and 6XE+ by electric
discharge [10].
70

HIGH-SPEED DEFLAGRATION: FUNDAMENTALS & CONTROL
02(aAg)
H w Ki
-' / $ \
-;;V^--' Ao2(a Ag)
H202
lgf/s
Figure 3 Predicted histories of species concentrations during combustion of the oxygen-hydrogen mixture with H2/O2 = 2/1 at Po = 10 kPa and To = 800 K with preexcitation of O2 molecules (7o2(a1A )/702 = 0.1), (solid curves), and without preex- citation (dashed curves)
4 INITIATION OF DETONATION BEHIND A SHOCK WAVE IN A SUPERSONIC FLOW
The following analysis is performed for a flow scheme discussed in [11]. Premixed gas flowing with the velocity «o interacts with a shock wave. The shock wave front is inclined to the angle ß < 90° with respect to the direction of vector «o- At the shock front, only the normal velocity component, un, changes, and the tangential component, uT, remains invariable, i.e., u\T = woT, «OT = uocos/3. Here, zero subscript refers to parameters of the unperturbed flow and the unity subscript refers to parameters behind the shock wave front.
It is further assumed that the vibrational, rotational and translational degrees of freedom of molecules are in thermodynamic equilibrium for all representative scales present in the gasdynamic problem. In this case, the gasdynamic param- eters behind the shock front (Ti, P\, u{) are found by solving the equations presented in [3]. Of interest is the evolution of the parameters and chemical composition of the reacting gas in the relaxation zone behind the shock wave along the streamline, whose direction coincides with that of vector u\.
71

HIGH-SPEED DEFLAGRATION & DETONATION
M
Z3UU
2000 :': ■ I I 1500 // : :
1000 4U J I
1 1
12 3 4 lg x I cm
Figure 4 Evolution of the temperature be- hind the shock wave (ß = 30°, Mo = 6) at dif- ferent values of Ö2(a1 Ag) concentration in re- acting H2/O2 = 2/1 mixtures at To = 300 K, To — 133 Pa (dotted curves 1-4 correspond to 7o2(aiAg)/7o2 = IO-3; 10-2; 0.05; 0.1 and solid curve corresponds to 7o3(a1Ag) — 0)
Consider first the effect of abun- dance of excited oxygen molecules Ö2(a1Ag) in a H2 + O2 mixture on the induction (Lj„) and com- bustion (Lc) zone lengths.
Figure 4 depicts the tempera- ture evolution behind an oblique shock wave in a mixture with H2/O2 = 2/1 at different preexci- tation degrees of O2 molecules in the a1 Ag electronic state. One can see that an increase in the Ö2(alAg) abundance in the initial mixture changes the temperature evolution in the reaction zone be- hind the shock front and signifi- cantly reduces L,-„ and Lc values.
Figure 5 shows the Li„/L°n =
/(Mo) and Le/L°e = /(M0) de- pendencies calculated for different degrees of abundance of Ö2(a1Ag) in a mixture with H2/O2 = 2/1 at P0 = 133 Pa, To = 300 K, and
Figure 5 Induction (a) and combustion (6) zone lengths as functions of the flow Mach number in front of an oblique shock wave with preexcitation of O2 molecules to the a1 Ag electronic state (curves 1-J, correspond to Ioi(al&g)ho2 = 10" , 10_ , 0.05, and 0.1, respectively)
72

HIGH-SPEED DEFLAGRATION: FUNDAMENTALS & CONTROL
ß = 30°. Here, L?n and L°c represent the case with no preexcitation of 02
molecules (7o2(aiAg) = 0) and M0 is the Mach number of the unperturbed flow in front of the shock wave. The ratios Lin/L°in and Le/L°e are seen to heavily depend on the Mach number of the flow in front of the shock wave and on the concentration of electronically excited O^Ag) molecules. At M0 < 6, the combustion zone length in mixtures containing 02 molecules preexcited to axAg
electronic states may be reduced by a factor of 5 to 20. Combustion behind a shock wave in a supersonic flow is intensified similar to combustion in a closed adiabatic reactor due to an increase in the 0, H, and OH formation rates and en- hancement of the branched chain mechanism in mixtures with excited molecules 02(a1Ag). Moreover, preexcitation of 02 molecules to the axAff electronic state may lead to initiation of detonation at low temperatures behind a shock front (Ti < 600 K).
This fact is illustrated by the values of Lin and Lc as well as the final values of temperature Tc and Mach number Mc of the combustion products calculated for different concentrations of 02(a1Ag) molecules at M0 = 5 and 6 and ß = 20°
Table 3 Variation of Lin, Lc, Tc, and Mc values under different degrees of preexcitation of 02 molecules in a1 As electronic state (To = 300 K, P0 = 133 Pa)
Mo /?,deg ft, K 7o,raiA.)/7Q2 Lin, 20 439
20 517
30 635
30 791
0 0.001 0.01 0.05 0.1 0 0.001 0.01 0.05 0.1 0 0.001 0.01 0.05 0.1 0 0.001 0.01 0.05 0.1
Remark: A(m) corresponds to A ■ 10"
>1(6 > 1(6 3.1(5
9.27(4 5.83(4
>1(6 >1(6 6.64(4 2.08(4 1.29(4 1.26(5 3.97(4 8.85(3 2.81(3 1.67(3 6.76(3 4.7(3
1.93(3 7.28(2 4.49(2
3.15(5) 9.69(4) 6.23(4)
7.08(4) 2.51(4) 1.72(4) 1.28(5) 4.11(4) 1.02(4) 4.12(3) 2.92(3)
Tc K Mc
2402 2405 2408 2460 2460 2461 2465 2470
8.63(3) 6.57(3) 3.79(3) 2.52(3) 2.16(3)
2450 2450 2450 2453 2457
2396 1.36 2399 1.35 2403 1.34
1.87 1.87 1.86 1.081 1.081 1.078 1.064 1.045 1.68 1.68 1.67 1.67 1.66
73

HIGH-SPEED DEFLAGRATION h DETONATION
and 30° and listed in Table 3. It is seen that detonation can be initiated in mixtures with excited 02 molecules in the a1 A«, electronic state at 7\ = 439 K
and 7o2(aiAg)/7o2 = 10~2- As mentioned above, 02 molecules can be excited to the a Ag electronic
state in an electric discharge. However, apart from 02(alAg), 03 molecules and
0 atoms may also be generated in the electric discharge zone [10]. The question arises: How the abundance of 0, 03 and 02{a1Ag) in molecular oxygen activated by electric discharge can change the impact on the combustion characteristics behind the shock wave front? In accord with data [12], the concentrations of 0 atoms, 03 and 02{a1Ag) molecules behind the electric discharge zone jit To = 300 K, Pa = 1316 Pa can reach the following values: 70 = 7.1 ■ 10 ; 7o3 = 0.0165; and 7o2(a'Ag) = 0.0145. Modeling shows that abundance (in trace amounts) of O and 03 species apart from Oafa1 A,) molecules in the initial mixture significantly alters the reaction kinetics in detonation waves propagating in a H2 + 02 mixture as compared to the case when only 02{axAg) molecules are present in the mixture.
Figure 6 shows concentration histories in the combustion zone behind the shock front in the mixture where 02(a
1AJ), oxygen atoms, and ozone molecules
are present (l02(x^7) = °-*2> ^ = °-668; ^(a'A.) = 4.84 • 10 ; 70 = 2.35 • 10-3; 7o3 = 5-49 • 10-3) and where only Oo^A,,) molecules are abun- dant in the initial mixture (7o2(a'Ag) = 4.97 • 10~3; 7o2(A'3£g-) = °-328;
7H2 = 0.667). . One can see that abundance of O and 03 species in addition to excited
oxygen molecules promotes combustion and essentially reduces the induction and combustion zone lengths. This phenomenon is due to intensification of O atoms production and enhancement of the chain combustion mechanism.
This is clearly seen from a comparison of the profiles of principal produc- tion (destruction) rates Siq(x) for O, H, and OH species displayed in Fig. 7 for the case of abundance of 02(a1Ag), O, and 03 in the initial mixture and when only 02(a1Ag) molecules are present. The presence of O3 molecules gives rise to new channels of O atoms formation. This is the dissociation of 03 molecules (reactions 24 and 37) and interaction between 03 and 02(a
1Ap)
(reaction 44). Thus, activation of 02 molecules by electric discharge when 02(a
1As), O and O3 are abundant in the initial mixture (variant 1) is much more efficient in intensifying combustion in a supersonic flow behind the shock wave front in com- parison with the case when only 02{a1Ag) molecules are abundant (variant 2).
This is illustrated by the results of simulation of combustion initiation behind the shock front at different M0 and ß summarized in Table 4. One can see^that activation of molecular oxygen in electric discharge when O, O3 and 02(a Ag) are abundant in the initial mixture, is very effective for initiation of combustion in a supersonic flow at low temperatures behind the shock front (7\ < 600 K).
74

HIGH-SPEED DEFLAGRATION: FUNDAMENTALS & CONTROL
0
-1
-2
-3
"" -4
-5
-6
-7
-2
-02 —/ ——« H2 t
-
-0 H^/_Vj/
XyoH \ 1
/H2O / 1 I
i
f
H202
1 1
-/ /HO, / X /i / i \
0 1 2 lg x / cm
(a)
4000
3000
- 2000
1000
4000
3000
2000
1000
Figure 6 Evolution of species concentrations (solid curves) and temperature (dotted curves) in burning H2/02 = 2/1 mixture behind the shock front (Mo = 6, ß = 30°, To = 300 K, Po = 1316 Pa) for two variants of 02 activation: (a) variant 1; (6) variant 2 (see text)
75

HIGH-SPEED DEFLAGRATION h DETONATION
^-IO"3
-iog 2-10123
lg x I cm
10J
101
, 10"3
--^ ^-lO"3
-10'
-10
8. ;::? ?"" y 40
6-10 31 :>% 15 SI III!
-2-10123-2
lg x I cm
(«)
Figure 7 Variation of principal production (+) and destruction ( —) rates S,q for H (a), O (6), and OH (c) in combustion of H2/02 = 2/1 mixture behind the shock front (Mo = 6, ß = 30°, % = 300 K, P0 = 1316 Pa) for two variants of 02 activation: solid curves — variant 1; dotted curves — variant 2 (see text)
In this case, the combustion zone length can be reduced by a factor of up to 103 in comparison with the case when only (^(G^A^) is abundant in the initial
mixture.
5 CONCLUDING REMARKS
The presence of electronic excited molecules in a reacting H2 + O2 mixture opens a new additional channel of OH radical formation and enhances the chain mech- anism of combustion. As a result, the presence of 02(a1Aff) molecules in the
76

HIGH-SPEED DEFLAGRATION: FUNDAMENTALS & CONTROL
Table 4 Calculated values of Z,-„ and Lc for two variants of molecular oxygen activation (see text) under combustion of H2/O2 = 2/1 mixture behind inclined shock wave at P0 = 1316 Pa, To = 300 K
Mo ß, deg Ti,K Variant of O2
activation Li„, cm ic, cm
5 20 439 1 2
3.81(5) 5.82(2)
3.81(5) 6.25(2)
6 20 517 1 2
7.38(3) 2.53(2)
7.43(3) 3.06(2)
7 20 605 1 2
1.47(3) 1.28(2)
1.53(3) 1.56(2)
6 30 791 1 2
1.33(2) 26.5
1.55(2) 48.1
Remark: A(m) corresponds to A ■ 10"
initial mixture leads to a reduction of the self-ignition temperature and induc- tion time. Combustion of the H2 + 02 system may be initiated at relatively weak preexcitation of 02 molecules to the alkg electronic state (7o,r0iA )/7o2 = 0.1) at To = 300 K.
In a supersonic flow behind an oblique shock wave front, the abundance of O atoms and 03 molecules, besides 02(a1Ag) molecules, in the initial mixture (this situation in realized by activation of 02 in an electric discharge) results in a significant reduction (by a factor of about 102-103) of the induction and com- bustion zone lengths in comparison with the case when only 02(a
JA3) molecules are abundant. Activation of oxygen molecules by electric discharge can initiate combustion in a supersonic flow at very low temperatures behind the shock wave front (< 500 K) and allows to reduce the combustion zone length to 1 m and less.
ACKNOWLEDGMENTS
This study was supported by the Russian Foundation for Basic Research (grants 99-01-01165 and 99-02-18494).
REFERENCES
1. Brown, R. O. 1985. A theoretical study of vibrationally induced reactions in com- bustion precesses. Combustion Flame 1:1-12.
77

HIGH-SPEED DEFLAGRATION h DETONATION
2. Starik, A. M., and N. G. Dautov. 1994. On a possibility of promotion of combustion for H2-O2 mixture by excitation of molecules. Physics Doclady 39(6):424-29.
3. Starik, A.M., and N.S. Titova. 1999. Initiation of detonation in a supersonic flow behind a shock wave under nonequilibrium excitation of vibrational degrees of freedom of molecules. In: Gaseous and heterogeneous detonations: Science to ap- plications. Eds. G. Roy, S. Frolov, K. Kailasanath, and N. Smirnov. Moscow: ENAS
Publ. 225-40. 4. Basevich, V.Ya., and A.A. Belyaev. 1989. Calculation of increase of hydrogen-
oxygen flame velocity with singlet oxygen. Rus. J. Chemical Physics Reports 8(8):1124-27.
5. Dougherty, E. P., and H.J. Rabitz. 1980. Computational kinetics and sensitivity analysis of hydrogen-oxygen combustion. J. Chemical Physics 72(12):6571-86.
6. Gardiner, W. C, ed. 1984. Combustion chemistry. New York: Spinger-Verlag Inc.
7. Rusanov, V.D., and A.A. Fridman. 1984. Physics of chemically active plasma.
Moscow: Nauka. 8. Baulch, D.L., R. A. Cox, P. J. Crutzen et al. 1982. Evaluation kinetic and pho-
tochemical data for atmospheric chemistry: Supplement I. J. Physical Chemistry Reference Data 8(2):327-496.
9. Kulagin, Yu.A., L.A. Shelepin, and V.l. Yarygina. 1994. Kinetics of processes in gaseous media containing metastable oxygen. Transactions of the P. N. Lebedev Physical Institute of the Russian Academy of Sciences 228:166-227.
10. Zakharov, A. I., K.S. Klopovskii, A. P. Osipov et al 1988. Kinetics of processes excited by self-maintained glow discharge in oxygen. Piasma Physics Reports 14(3):327-33.
11. Yip, T. 1989. Ignition delay and characteristic reaction length in shock wave in- duced supersonic combustion. AIAA Paper No. 89-2567.
12. Klopovskii, K.S., A.S. Kovalev, D.V. Lopaev et al 1995. Novel mechanism of singlet oxygen formation in the processes with participation of electron- and vi- brational exited ozone molecules. J. Experimental Theoretical Physics 107(4):
1080-99.
78

PART TWO
DETONATION: FUNDAMENTALS
AND CONTROL

NUMERICAL INVESTIGATION OF TRANSIENT DETONATION WAVES
L. Hemeryck, M. H. Lefebvre, and P. J. Van Tiggelen
Numerical computations using the Flux-Corrected-Transport (FCT) algorithm are carried out to simulate two-dimensional, nonsteady gaseous detonations in H2-02 mixtures diluted with argon or helium. A short investigation of the initial perturbation technique is performed in order to control its influence on the asymptotic numerical solution. The influence of physical parameters like the diluent (argon or helium) and the rate of heat release is studied. The study focuses particularly on the detonation structure. The simulations with different diluents are compared to experimental evidences and show fairly good agreement with respect to the detonation velocity, and only a rather mixed agree- ment with respect to the detonation structure. The regularity of the detonation structure appears to be sensitive to the rate of heat release. Comparisons between one- and two-dimensional calculations enable one to correlate the irregularity of the two-dimensional detonation structure with the instabilities of the average detonation velocity. The last con- ducted calculation shows the extinction and reignition characteristics of the detonating mixture.
1 INTRODUCTION
Smoked foil measurements have been used by Strehlow et al. to investigate the transient behavior of detonation waves [1]. By modifying the composition in the detonation tube, they succeeded to observe the relaxation process from one detonation structure to another, as for instance
- the decay of a detonation wave from a reactive mixture (H^/C^/He) to a nonreactive mixture (Ar/He), and
- the transition from a detonation propagating in a mode 2* into a mode 4 and reverse.
*The mode number is equivalent to the number of heads or triple points on the detonation front.
81
HIGH-SPEED DEFLAGRATION & DETONATION
These experiments have shown the complex process for spontaneous forma- tion of new waves and the relatively slow natural decay of transverse waves in inert conditions. Moreover, investigations on the regularity of the shock struc- ture and discussions on the formation of new triple points based on numeri- cal simulations have been reported [2-4]. These numerical studies show that temperature-dependent quantities, namely, specific heat, specific heat ratio and reduced activation energy, strongly influence the regularity of the detonation wave structure.
The aim of this paper is to present numerical computations simulating the transient behavior of detonation waves. The material presented here is limited to a study of ignition models in argon- and helium-diluted systems, and to a comparison with a transition from a reactive to a nonreactive medium followed by the reverse process.
2 NUMERICAL AND PHYSICAL MODELS
The numerical technique used is the FCT-algorithm developed by Boris and Book [5]. The set of equations implemented in the code is the two-dimensional (2D) Euler equations for an inviscid flow, applied to Cartesian grid coordinates. The reactive gas is considered as ideal and both the specific heat ratio and the mean molecular weight are assumed constant. The exothermic reaction is modeled with a two-step parameter model in which the steps correspond to the chemical induction period and the heat-release period [6].
The induction time is temperature- and pressure-dependent and calculated for the local conditions of temperature and pressure. A detailed description of the induction period model has been reported by Oran et al. [7].
The heat release period corresponds to the exothermic chemical reaction and includes appropriate conversion of internal energy of formation to sensible heat. The heat is released at a constant rate rreact up to a given maximum heat re- lease Qmax (J/kg). The heat release model is thus characterized by the time to maximum heat release <react (s) that is equal to Qmax/"rreact- Lefebvre and Oran reported a detailed description of the heat release model [6].
The 2D computation is initialized with the solution for a planar, steady propagating detonation wave [3]. The 2D structure of the wave is produced when a rectangular pocket of hot unburned gas, located behind the detonation front starts to burn. As the unburned material reacts (explodes), it sends out pressure disturbances which interact with the front and result in the formation of triple points and transverse waves. A part of the present work is to investigate the influence of this perturbation model on further development of the detonation structure and, therefore, the location of the perturbation is chosen as shown in
Fig. 1.
82

DETONATION: FUNDAMENTALS & CONTROL
ID detonation wave
Central symmetrical perturbation
ID detonation wave
Lateral perturbation
ID detonation wave
Lateral perturbation
Figure 1 Schematic drawing of the perturbation techniques used to trigger two- dimensional detonation waves. The perturbation consists of one or two high tempera- ture zones of unburned reactive material
3 MIXTURES AND CASES STUDIED
The basic computation (benchmark calculation or case 1) simulates a detonation propagating in a stoichiometric hydrogen-oxygen mixture diluted with 70% ar- gon. The initial pressure is equal to 6.67 kPa. The heat release time, ireact, and the energy release Qmax, are equal to 20 (is and 820 kJ/kg, respectively. The selection of these values has been tested extensively and results in a detonation wave showing steady characteristics close to the Chapman-Jouguet ones. The channel width is 4.68 cm.
A series of simulations has been carried out and compared with this bench- mark calculation. Table 1 gives an overall view of the performed computations.
First, the influence of the perturbation model is investigated (case 2): a detonation propagating in the benchmark composition is modeled using both types of perturbation (see Section 2 and Fig. 1).
In a second run of computations, a composition with a different speed of sound is studied by modifying the molecular mass of the diluent. Helium is
Table 1 Description of the cases studied at an initial pressure of 6.67 kPa
Case Reactive
composition Heat release
time, freact (ßs)
Type of perturbation
Transition
1 H2-02-Ar / 2-1-7 20 central no 2 H2-02-Ar / 2-1-7 20 lateral no 3 H2-02-He / 2-1-7 20 central no 4 H2-02-He / 2-1-7 20 lateral no 5 H2-02-Ar / 2-1-7 5 central no 6 H2-02-Ar / 2-1-7 20 central from
inert, reactive to to reactive
composition
83

HIGH-SPEED DEFLAGRATION & DETONATION
used instead of argon (mass ratio 10) and the maximum heat release Qmax is modified consequently yielding 4049 kJ/kg instead of 820 kJ/kg. Moreover, both types of perturbation have been used for mixtures diluted with helium (cases 3 and 4).
A third computation examines the influence of the reaction time. In this case (case 5), the induction time model remains unchanged and the heat release time ^react is simply shortened down to 5 /is.
The last set of calculations studies the decay of the detonation wave by turn- ing off the energy release process, simulating the transition from a reactive to an inert composition. A reignition process of the shock wave is then observed and analyzed by turning on the chemical reaction after two cycles of the nonre- active cellular structure, i.e., after 17.3 cm of propagation into the inert material (case 6). During the whole transient stage, all other physical properties of the composition (specific heat ratio, molecular mass, initial pressure) remain un- changed.
4 RESULTS AND DISCUSSIONS
Computation of case 1 gives the evolution of the detonation structure and of the detonation velocity along the centerline of the tube (Fig. 2). The typical cellular structure is a plot of the distribution of the heat release density vs. distance [6]. The horizontal scales of both drawings are consistent in time and distance. The mode of the detonation structure is defined as the number of triple points per cross-section. The central perturbation causes a rapid appearance of the 2D structure that seems to stabilize in a mode 4. Nevertheless, after 250 ßs, a rapid transition to a mode-2 structure occurs. This mode remains stable for about 500 fj.s, i.e., about 13 cells. From 800 /JS on, it evolves eventually to a structure hesitating between mode 1 and 2. One should note that, from the beginning on, the average detonation velocity remains constant irrespective of the mode. It is assumed that the early 4-mode structure corresponds to a transient state leading to the characteristic regime, in the given tube geometry, for the studied mixture composition.
4.1 Initial Perturbation Technique
The transi ;nt behavior of the detonation structure is sensitive to the way the initial perturbation is applied. Figure 3 gives imprints of the cellular struc- tures for cases 1 and 2. The transient states are, indeed, much shorter when the lateral perturbation is used (case 2) than with the central perturbation
84

DETONATION: FUNDAMENTALS & CONTROL
a o u a
324 374
Q
150 200 Time / us
424 474 524 Time / \xs
574
760 Time / (is
Figure 2 Simulated detonation imprints and evolution of the detonation velocity for a wave propagating in a hydrogen-oxygen-argon mixture (case 1 in Table 1). The channel width is 4.68 cm
(Continued)
85

HIGH-SPEED DEFLAGRATION fc DETONATION
1059 Time / us
1500 1550 1600 1650 Time / ps
700 1750
Figure 2 Simulated detonation imprints and evolution of the detonation velocity for a wave propagating in a hydrogen-oxygen-argon mixture (case 1 in Table 1). The channel width is 4.68 cm (Continued)
86

DETONATION: FUNDAMENTALS & CONTROL
From 0 to 324 us
7 From 324 to 652 us
z
(«)
From 0 to 329 us
From 329 to 656 us
7 X
\/\ From 656 to 1017 us rx n TK -r
7X7^7-
(b)
Figure 3 Simulated detonation imprints in a wave propagating in a hydrogen-oxygen- argon mixture perturbed by (a) one central unburned gas pocket (case 1 in Table 1) and (6) two lateral unburned gas pockets (case 2 in Table 1)
(case 1): the mode 2 is reached after about 150 ps and remains quasi-stable for a long period (1000 /xs or 23 cells). Unfortunately, further calculation is not available but one may speculate that the structure will eventually evolve into a mode 1 or at least into an oscillating mode 1-2 as observed in case 1. Note that Kalaisanath et al. [2] have reported already about symmetric and asymmet- ric initiations and resulted in a detonation structure independent of the initial perturbation.
The comparison between the two types of initiation is also possible using the detonation velocity (Fig. 4). The frequency typical for the mode-2 propagation
87

HIGH-SPEED DEFLAGRATION & DETONATION
0 100 200 300 400 500 600 Time / us
(a)
700 800 1000 1100
500 600 Time / us
(b)
800 900 1000 1100
Figure 4 Evolution of detonation velocity for a wave propagating in a hydrogen- oxygen-argon mixture perturbed by (a) one central unburned gas pocket (case 1 in Table 1) and (b) two lateral unburned gas pockets (case 2 in Table 1)
appears as early as at 150 /is in case of lateral perturbation. Both cases ex- hibit equal average detonation velocity (1601 and 1595 m/s for cases 1 and 2, respectively). This observation supports the fact that the wave velocity is not
influenced by its structural density or its mode.
4.2 Diluent
By modifying the molecular mass (M) of the diluent (4 as for helium instead of 40 as for argon), one modifies the sound velocity in the reactive mixture by a factor equal to the square root of 1/M. Because the detonation velocity increases
88

DETONATION: FUNDAMENTALS k CONTROL
From 0 to 139 jxs
■ ^.K^yy-yX^-t^s,^/ \/v\ From 139 to 284 us
7T? ^y^y^w^sg? From 284 to 432 us
From 432 to 580 (xs
SXXWXVA^ From 580 to 751 (xs
7
From 0 to 140 \i&
From 140 to 288 us
From 288 to 436 |is
From 583 to 666 (is ~7 \ V \
JvZ (*)
Figure 5 Simulated detonation imprints in a wave propagating in a hydrogen-oxygen- helium mixture perturbed by (a) one central unburned gas pocket (case 3 in Table 1) and (6) two lateral unburned gas pockets (case 4 in Table 1)
89

HIGH-SPEED DEFLAGRATION & DETONATION
100 200 300 400 500 Time / |is
600 700 800
Figure 6 Detonation velocities for a wave propagating in (a) a hydrogen-oxygen- argon mixture (case 1 in Table 1) (6) a hydrogen-oxygen-helium mixture (case 3 in Table 1)
by the same factor, the Mach number of the detonation remains constant, as well as the temperature behind the shock. Consequently the induction time does not vary and the induction length increases. As a result, when helium is used instead of argon, the detonation cell size must increase. Experimental evidences have corroborated this argument [8]. Results of computations intended to illustrate this effect are presented in Figs. 3 and 5.
Both types of perturbation (central and lateral) have been tested also for helium. As discussed in Section 4.1, the type of perturbation plays a major role in the stabilization of the detonation structure. The lateral disturbance evolves to a more regular pattern. Therefore, the laterally perturbed simulations are considered and the results of the argon- and helium-diluted mixtures are compared in Figs. U and 56, respectively. Analysis of those figures leads to the conclusion that there is a slight difference in the mode: the mode of the helium- diluted mixture converges rapidly to 1, but seems to oscillate eventually between modes 1 and 2. The calculation does not highlight convincingly the influence of the molecular mass on the computed structure. To reach a definite conclusion, further computations at higher modes are needed.
The time history of the velocity of the detonation waves is shown in Fig. 6. The velocity in the helium-diluted mixture is 3598 m/s, and is consistent with Chapman-Jouguet calculation and with experimental evidences.
90

DETONATION: FUNDAMENTALS & CONTROL
4.3 Heat Release Time
The effects of other physical parameters as specific heat or induction time have been considered in previous one-dimensional (ID) and 2D simulations [3]. In case 5, the influence of the heat release time on the 2D structure was studied. Figures la and 76 show the comparison between the imprints resulting from calculations using ireact equal to 20 and 5 (is, respectively. Notice that the average detonation velocities are almost equal (1601 vs. 1596 m/s). However, one observes that short reaction time results in an irregular structure and that the detonation structure never stabilizes into a given mode, not even for a short period of time.
To further investigate this peculiar behavior, ID simulations with the ini- tial conditions of cases 1 and 5 were performed, and recorded (1) the average velocity, the position of (2) the induction and (3) reaction zones, and (4) the position of the sonic plane behind the leading shock (Fig. 8). When the heat release time is short, the sonic plane is way back behind the end of the re- action and this may well be the reason for flow instabilities. Extending this consideration to the 2D computation, one may speculate that, in this case, me- chanical effects are responsible for the irregular pattern of the detonation struc- ture.
4.4 Reignition case
The case of a reignition has been studied. In case 6, the same detonation calcu- lation as in case 1 has been conducted during the first 283 /is. At this time, the first quasi-stable detonation cell in mode 2 is achieved. The chemical reaction is then turned off throughout the system. The detonation wave then evolves into a nonreactive shock. The transient cellular structure does not appear clearly on the energy release pattern of Fig. 9 a. However the location of the triple points can be traced by analyzing the pressure contours (not shown) and the frequency of the 2D structure can be observed from the velocity profile (from 283 to 423 /is in Fig. 96). Two more cells are developed before the reaction mechanism is resumed numerically. The distance covered by the nonreactive wave is 173 mm in 140 fxs. The first nonreactive cell stretches over 89 mm and the second one over 94 mm. That is to be compared with the typical 58 mm length of the reactive detonation cell. Since the reactive mechanism is turned on at the end of a cell, i.e., when the transverse waves collide, a rapid restart of the heat release process is observed, leading to a fast coupling be- tween the shock wave and the reaction zone. After an unsteady regime, a mode-4 structure occurs and eventually it evolves into a mode 2. During the cut-off time, the shock velocity drops to about 1000 m/s (Fig. 96). After reig-
91

HIGH-SPEED DEFLAGRATION & DETONATION
From 0 to 324 |is
From 324 to 652 |is
V X 7 \
From 652 to 981 |is
From 981 to 1143 (as X
_^i
(«)
From 0 to 323 (is
From 323 to 652 \xs
, ^»;>Mv>)C^^vy?
From 652 to 979 us
XXöXMö&t From 979 to 1142 jas
(b)
Figure 7 Simulated detonation imprints in a wave propagating in a hydrogen-oxygen- argon mixture with a heat release time equal to (a) 20 ßs (case 1 in Table 1) and (6) 5 ßs (case 5 in Table 1)
92

DETONATION: FUNDAMENTALS & CONTROL
30
u 20 u
.7 •if:
— 1 --3 .... 2
'-/"- ■»• — ■. ** -^ ». /> -» l' ^ '»,
300
300
Figure 8 One-dimensional simulation of a reactive wave propagating in a hydrogen- oxygen-argon mixture with a heat release time of (a) 20 ßs (case 1 in Table 1) and (6) 5 ßS (case 5 in Table 1). (a), (6) Evolution of the location of the inductionzone (J) heat-release zone (2) and the sonic plane (3) with respect to the shock, (c) Evolution ot the detonation velocity: 1 — case 1; 2 — case 5
93

HIGH-SPEED DEFLAGRATION fc DETONATION
From 244 to 520 |is —j 7T\
X -Reaction stopped
From 520 to 802 \xs
-Reaction started
300 400 500 Time / |is
(*)
Fisure 9 Two-dimensional simulation of a reactive wave propagating in a hydrogen- oxygen-argon mixture. The chemical reaction has been cut off at 283 »s and reigmted after 140 ßs (case 7 in Table 1). (a) Detonation imprints for a wave. (6) Evolution ot the detonation velocity
Table 2 Summary of the main characteristics of the studied detonation structures
Case Evolution of the mode number " 4-2-l-2-(l or 2)
4-2-(l or 2) 4-2-3 or 4 (irregular)-2-l or 2
or 3 (irregular)-2-(l or 2) 4-2-1-2- (1 or 2) variable ranging
from 5 to 2 - irregular structure 2-inert-4-2
1 2
3
4
5
Average detonation velocity (m/s) 1601 1595
3618
3598
1596
1601-(1000)-1601
94

DETONATION: FUNDAMENTALS & CONTROL
nition, the velocity comes back to the previous average detonation velocity i e 1601 m/s.
Further studies must be performed to investigate the parameters controlling the reignition process, namely the relative position of the leading shock and the number of nonreactive cells.
Table 2 summarizes the overall characteristics of the detonation structure and the average detonation velocity for the different cases studied.
5 CONCLUDING REMARKS
The set of calculations reported in this work has demonstrated the major role of the initial perturbation technique on the transient stage of 2D detonation waves. The numerical investigation of long transient regimes is CPU-time consuming and difficult to grasp. Moreover, apparently steady structures do not guarantee a constant mode number. Indeed, changes of mode were observed even after long periods of regular structures. Furthermore, it was noticed that the aver- age velocity of the detonation wave is not related to the number of detonation heads. Changing the nature of the diluent barely modifies the overall character- istics of the structure, but the detonation velocity varies consistently with the Chapman-Jouguet theory. A major influence on the structure is noticed when the heat release time is shortened, although the latter parameter has no influence on the average velocity. The reignition case has shown interesting features and it is worthy to be further investigated.
REFERENCES
1. Strehlow, R.A., A.A. Adamczyk, and R. J. Stiles. 1972. Transient study of deto- nation waves. Ada Astronautics. 17:509-27.
2. Kailasanath, K., E.S. Oran, J.R Boris, and T. R. Young. 1985. Determination of detonation cell size and the role of transverse wave in two-dimensional detonation. Combustion Flame 61:199-209.
3. Lefebvre, M.H., E.S. Oran, K. Kailasanath, and P. J. Van Tiggelen. 1993. The influence of the heat capacity and diluent on detonation structure. Combustion Flame 95:206-18.
4. Oran, E.S., J.W. Weber, J. Eliza, E.I. Stefaniw, M. H. Lefebvre, and J.D. Ander- son, Jr. 1998. A numerical study of a two-dimensional H2-02-Ar detonation using a detailed chemical reaction model. Combustion Flame 113:147-63.
5. Boris, J. P., and D. L. Book. 1976. Solution of the continuity equation by the method of flux-corrected transport. Methods Computational Physics 16:85-129.
95

HIGH-SPEED DEFLAGRATION & DETONATION
6. Lefebvre, M. H., and E. S. Oran. 1995. Analysis of the shock structures in a regular detonation. Shock Waves 4:277-83.
7. Oran, E. S., T. R. Young, J. P. Boris, and A. Cohen. 1982. Weak and strong ignition. I. Numerical simulations of shock tube experiments. Combustion Flame 48:135.
8. Libouton, J.-CL, and P.J. Van Tiggelen. 1976. Influence de la composition du melange gazeux sur la structure des ondes de detonation. Ada Astronautica 3:
759-69.
96

INFLUENCE OF TRANSPORT PROCESSES ON TWO-DIMENSIONAL STRUCTURE
OF DETONATION
T. Fujiwara and K. Fukiba
The influence of transport processes (mainly viscosity) on detonation structure is studied by two-dimensional computation of detonations in oxygen-hydrogen mixtures, using a two-step chemical reaction model containing two dimensionless progress variables. The basic Navier- Stokes equations are integrated by a TVD-MacCormack scheme of second-order-accuracy both in time and space. The analysis has con- firmed that (1) the effect of viscosity stabilizes the shape of soot patterns forms more regular cell geometry and reduces the size of cell, and (2) a higher-resolution calculation, viz. more accurate inclusion of transport properties, reduces the cell number. This moves the calculated cell size to approach the experimentaly observed value.
1 INTRODUCTION
The size, structure and shape of a detonation cell have been studied from the viewpoint of extinction and reestablishment of detonation, and the relation with chemical reaction rate or induction distance, by the accumulation of experimen- tal data base and by the development of high-activation-energy mathematical theory.
Nevertheless, one of the unsolved problems on detonation cell is the discrep- ancy between the experimentally-measured and numerically-computed cell sizes. The choice of chemical model utilized in numerical computations, i.e., a set of elementary reactions and their rate constants, is considered to be sufficient. The adequacy of available chemical models is justified by application to other com- bustion problems. The utilized numerical schemes have already been validated by applying them to numerous reacting gasdynamics and real-gas hypersonic flows. Even by using such existing knowledge, it turns out that the computed
97

HIGH-SPEED DEFLAGRATION fc DETONATION
cell size is usually about one-order-of-magnitude smaller than the experimental values for oxygen-hydrogen detonations.
To explain this gap, one can point out that the following three physical mechanisms are not accounted for in the currently available numerical analyses:
(1) The chemical models are still not appropriate, in terms of the pressure and temperature range of application, and of nonequilibrium rate constants like multitemperature models.
(2) The influence of turbulence is not considered; it would exist in the shear layers behind triple points with their complicated mutual collisions.
(3) Since the fundamental equations are Eulerian, the influence of transport properties like viscosity and thermal conductivity is not taken into account. The unsteadiness inherent to multidimensional detonation makes it extremely difficult to use Navier-Stokes equations, because of a number of unsteady shear layers existing not only on the tube walls but also down- stream of curved and intersecting shock waves. Generation of high-accuracy solution-adaptive grids resolving all such highly-unsteady shear layers is im- possible within the present computational capabilities.
Although it is impossible to correctly evaluate the entire effect of transport properties, as mentioned in (3), the influence of tube wall boundary layer at least may modestly be quantified, by using a combination of Navier-Stokes equations and grids as fine as possible. The purpose of the present paper is to focus on this "partial" effect of transport properties. The above-mentioned mechanisms (1) and (2) are not discussed here. Instead of adapting a grid to a highly-unsteady complicated flow, the idea of adaptation is totally abandoned by introducing simple constant-mesh fine grids.
In order to resolve all the existing shear layers, it turns out that the mesh size of this constant-mesh grid must be 1 /xm, which necessitates 100,000 x 200,000 = 2 X 10¹⁰ grid points for a two-dimensional domain 10 x 20 cm which is impossible. Since the mesh sizes in the present analysis are about one-order-of-magnitude greater than the above value of 1 /im, the present Navier-Stokes calculation can resolve at most the tube wall boundary layer, not the existing gradients steeper than that, even though all the nonhomogeneities are automatically con-
sidered. The partial effect of transport properties was studied by Goto [1], who con-
firmed tha' inclusion of molecular diffusion gave a shorter distance for DDT. However, the conclusion seems to be insufficient from the viewpoint of quan- titative accuracy, and furthermore both viscosity and thermal conductivity are
neglected.
98
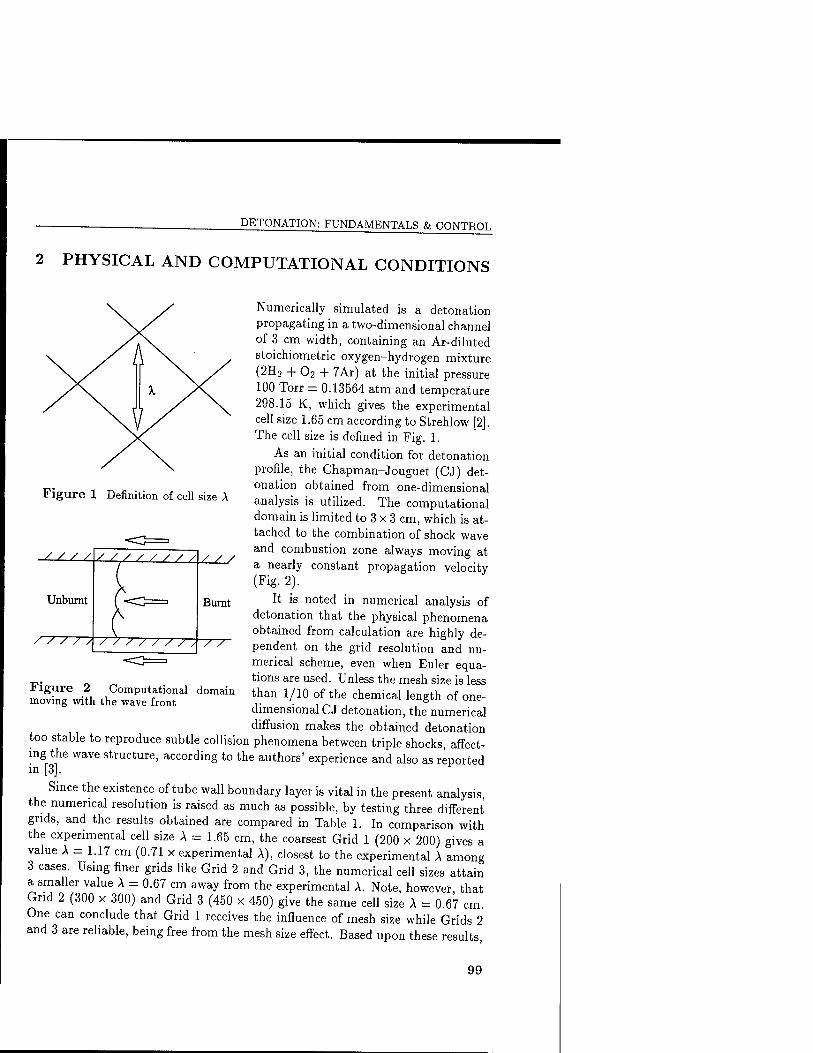
DETONATION: FUNDAMENTALS & CONTROL
2 PHYSICAL AND COMPUTATIONAL CONDITIONS
Figure 1 Definition of cell size A
Numerically simulated is a detonation propagating in a two-dimensional channel of 3 cm width, containing an Ar-diluted stoichiometric oxygen-hydrogen mixture (2H2 + 02 + 7Ar) at the initial pressure 100 Torr = 0.13564 atm and temperature 298.15 K, which gives the experimental cell size 1.65 cm according to Strehlow [2]. The cell size is defined in Fig. 1.
As an initial condition for detonation profile, the Chapman-Jouguet (CJ) det- onation obtained from one-dimensional analysis is utilized. The computational domain is limited to 3 x 3 cm, which is at- tached to the combination of shock wave and combustion zone always moving at a nearly constant propagation velocity (Fig. 2).
It is noted in numerical analysis of detonation that the physical phenomena obtained from calculation are highly de- pendent on the grid resolution and nu- merical scheme, even when Euler equa- tions are used. Unless the mesh size is less than 1/10 of the chemical length of one- dimensional CJ detonation, the numerical diffusion makes the obtained detonation
too stable to reproduce subtle collision phenomena between triple shocks, affect- ing the wave structure, according to the authors' experience and also as reported in [3].
Since the existence of tube wall boundary layer is vital in the present analysis, the numerical resolution is raised as much as possible, by testing three different grids, and the results obtained are compared in Table 1. In comparison with the experimental cell size A = 1.65 cm, the coarsest Grid 1 (200 x 200) gives a value A = 1.17 cm (0.71 x experimental A), closest to the experimental A among 3 cases. Using finer grids like Grid 2 and Grid 3, the numerical cell sizes attain a smaller value A = 0.67 cm away from the experimental A. Note, however that Grid 2 (300 x 300) and Grid 3 (450 x 450) give the same cell size A = 0.67 cm. One can conclude that Grid 1 receives the influence of mesh size while Grids 2 and 3 are reliable, being free from the mesh size effect. Based upon these results,
Figure 2 Computational domain moving with the wave front
99

HIGH-SPEED DEFLAGRATION fc DETONATION
Table 1 Effect of grid resolution on the the present calculation is proceeded calculated cell size by using Grid 2 (300 X 300) toward _ changing the wall boundary condi-
Grids Mesh size, mm ^J^' tions, because Grid 3 needs a long £-r= time for computation.
200x200 0.15 1.17 300 x 300 0.1 0.67 Later, the final check of resolution 450x450 0.066 0.67 will be done by applying Grid 4 (300 x
300) to a channel of half-width 1.5 cm (mesh size 50 /im), increasing the grid resolution two-fold. The purpose is to reproduce the influence of a very thin wall boundary layer immediately behind the detonation front as much as possible.
3 EXECUTION OF NUMERICAL ANALYSIS
The fundamental equations are Navier-Stokes equations containing the mass conservation equations for the two progress variables a (induction reaction) and ß (exothermic reaction) [4]. As the reaction rate constants, the original values fitting to an Ar-diluted stoichiometric oxygen-hydrogen detonation are used. The influence of transport properties is examined by artificially changing the wall boundary conditions, even though the basic Navier-Stokes equations include viscosity, thermal conductivity and molecular diffusion. The utilized numerical scheme is a MacCormack-TVD scheme, which exhibits sufficient but not-too-
strong stability. . In order to generate a two-dimensional detonation, one-dimensional LJ det-
onation is disturbed by placing unburnt mixture pockets of size 0.2 mm in the region 1 X 1 mm over the channel wall immediately behind the shock wave front, which are acting like a Shchelkin wire. The numerical soot traces are the trajec- tories of maximum pressure in the shock wave front. The numerical simulation is continued until a recurrent propagation is established.
4 CALCULATED RESULTS AND CELL SIZE
4.1 Influence of Transport Properties
In the present analysis, the attention is paid to the three transport phenom- ena viz viscosity, thermal conductivity and molecular diffusion. By artificially changing the wall boundary condition essentially only for velocity (neither for temperature or species concentration), the 4 cases shown in Table 2 are calculated
100

DETONATION: FUNDAMENTALS & CONTROL
Table 2 Boundary conditions and basic equations for 4 cases
Case Viscosity
1 2 3 4
exists exists
neglected neglected
Heat conductivity
exists exists exists
neglected
Velocity on wall nonslip
slip slip slip
Equations
Navier-Stokes Navier-Stokes partially Navier-Stokes Euler
and compared. Note that the influence of thermal conductivity and molecular diffusion would not play important roles, because their associated wall boundary conditions are adiabatic and noncatalytic.
Case 1 is considered to be a Benchmark which gives the most accurate solu- tion in the sense that the most realistic wall boundary conditions are imposed on the Navier-Stokes equations. Thus, all the other cases are compared with Case 1 hereafter.
Attention is paid to the soot pattern variation for Case 1, which is ac- quired during 60 cm travelling of detonation after ignition (Fig. 3). The det- onation proceeds leftward from the 0 cm position in Fig. 3 a. The transient pressure disturbances generated by the explosion near the channel wall gradu- ally attenuate to restore the initial one-dimensional structure, until a multidi- mensional structure emerges again at the 20 cm position. An explosion much stronger than the other ones occurs at 23 cm, generating two primary triple points which have swallowed the previous fine multiple-triple-point structure existing on the shock front. The fine structure has not disappeared but has been overwhelmed. When the shock front reaches 35 cm, the primary triple points have already attenuated where the existing weak triple points reemerge. Eventually, the triple points equal to their eigen number, which is determined by the channel width, pressure, exothermicity and reaction rate, can only sur- vive. A cell pattern inscribed by such triple points systematically starts ap- pearing from the 35 cm position. As seen at 40 cm, the cell size is smaller at the initial period of appearence; for example, 7 cells exist in the channel width, giving the cell size A = 3 cm/7 = 0.43 cm. However, certain cells are combined by collision processes to reduce the cell number down to its eigen value; the cell number decreases down to 5 at 50 cm, and to 4 at 80 cm, and stays at 4 even at 150 cm (limit of calculation). Thus, this number 4 is specified as the eigen value in the present analysis, giving the eigen cell size A = 3 cm/4 = 0.75 cm.
Distribution of the shear stress ryx (= rxy) near the shock front 565 fis after ignition is shown in Fig. 4. High shear stress is seen only at the wall boundary layer, triple shock region, and its trailing transverse shock wave; limited within the near-wall and shock front regions. The ratio of viscous shear stress term
101

HIGH-SPEED DEFLAGRATION fc DETONATION
Detonation propagation
15 T 10
(«)
-■"'i*?ül-J *$«
15
(6)
;<>**:
35 30
(c)
Figure 3 Soot pattern for Case 1 in Table 2 (dimensions in cm). Detonation wave propagates leftward, (a) 0 to 15 cm, (6) 15 to 30 cm, (c) 30 to 45 cm, and (d) 45 to propagates 60 cm
102

DETONATION: FUNDAMENTALS & CONTROL
0-62.5
(N/m2)
Figure 4 Distribution of shear stress Tyx{= rxy) 565 ßs after ignition for Case 1 in Table 2. Dimensions in cm
dryx/dy to the entire momentum flux gets to less than 5%-15% everywhere except in the wall boundary layer.
Results of the other cases (Cases 2-4) give more or less the same global structure of detonation, even by the use of the Euler equations (Case 4). In Fig. 5, the calculated soot pattern for Case 4 is shown. The explosive disturbance right after ignition is nearly identical to Case 1 (Fig. 3). However, the cell structure appears at the 32 cm location, slightly earlier than 35 cm in Case 1. If one focuses attention to the cell size, the cell shape in Case 4 is considerably distorted, making size definition hard. At 50-60 cm, diamond- and parallelogram-shape cells coexist. The observed cell number oscillates from 4.5 at 45 cm to 4 at 50 cm, and has never settled down to a steady value thereafter, even if the calculation is continued up to 150 cm propagation. Thus, the cell size for Case 4 becomes A = 0.67-0.75 cm.
103

HIGH-SPEED DEFLAGRATION & DETONATION
■»■fr; s;" -!; mwäg, w :■ ; i ,• i>t | ■
Figure 5 Soot pattern for Case 4 in Table 2 (dimensions in cm). Detonation prop- agates leftward: (a) 0 to 15 cm, (fc) 15 to 30 cm, (c) 30 to 45 cm, and (d) 45 to 60 cm
The results of the calculations for all 4 cases are summarized in Table 3. With regard to the cell size, Benchmark Case 1 gives the maximum value of 0.75 cm, while inviscid Cases 3 and 4 provide oscillating values of 0.67-0.75. It is a clear evidence of viscous effect to stabilize detonation propagation, by
104

DETONATION: FUNDAMENTALS & CONTROL
Table 3 Calculated cell size, cell number and propa- gation velocity for 4 cases
Case ^e^ S*Ze' ^e" Propagation velocity, cm number m/s
1 075 I 1880 2 0.67 4.5 1894 3 0.67-0.75 4-4.5 1886 4 0.67-0.75 4-4.5 1886
dissipating energy on the wall and, as a result, generating regular triple shock structures and increasing cell size. Comparison between the two sets (Cases 1, 2) and (Cases 3, 4) also proves that viscosity plays a stabilizing role in detonation propagation. The calculated propagation velocities seem to be free from viscosity effect, since the obtained differences are less than 1%.
4.2 High-Resolution Viscous Calculation for Narrow Channel
In addition to the previous 4 cases, another Case 5 is calculated; it is identical to Case 1 (Navier-Stokes, nonslip wall), except for the channel width 1.5 cm (halved) and the use of a high-resolution Grid 4 (300 x 300).
Figure 6 gives a steady soot pattern for Case 5, where the steady propagation (from left to right) and cell shape regularity have already been established. There are altogether four triple points in the channel exchanging their characters by alternating their strength; after collision with wall a triple point trace changes from strong to weak at one time and vice versa at a different time. Depending upon how the cell number is counted, it varies; it is 2 when a baby triple point is taken into account, while it is 1.5 when the baby triple point is neglected. Thus, the cell number is 1.5-2; in comparison with the cell number 4 for Case 1 (channel width 3 cm), the cell number is decreased by the effect of wall boundary layer
Figure 6 Soot pattern for Case 5 that is similar to Case 1 in Table 2 except for the channel width (1.5 instead of 3 cm) (dimensions in cm). Detonation propagates rightward
105

HIGH-SPEED DEFLAGRATION & DETONATION
or maybe it is due to the higher-resolution calculation. When the cell number 1.5 is chosen for Case 5, the cell size A = 1.0 cm, which becomes closer to an
experimentally observed value A = 1.65 cm. As seen from the above comparisons between viscous and invicsid calcula-
tions, where the role of channel wall is also examined by changing the width, a macroscopic parameter like cell size is visibly influenced by transport phenom- ena. Phenomenologically speaking, viscous boundary layer on wall decreases the reflection coefficient of detonation, viz. a triple point becomes generally weaker after collision with "fluffy" wall, as is easily expected.
5 CONCLUDING REMARKS
The present analysis has revealed the effect of transport properties as follows:
(1) In low-pressure oxygen-hydrogen detonations, the transport properties affect the near-wall and frontal structure of detonation to the extent of a maximum
of 20%.
(2) Transport properties are effective to stabilize and decrease the eigen cell number due to the action of wall boundary layer; the calculated cell size
getting closer to an experimental value A = 1.65 cm.
(3) The propagation velocity of detonation is not altered by inclusion of trans-
port properties.
(4) In order to acquire better quantitative agreement between calculated and measured cell sizes, it may be necessary to bring in the effect of turbulence and thermally nonequilibrium characteristics of reaction rate constants like
Park's models.
REFERENCES
1. Goto, E. 1994. Simulation of two-dimensional detonation propagation. M. Sc. Thesis. Toyohashi University of Science and Technology.
2. Strehlow, R. A. 1968. Gas phase detonations: Recent developments. Combustion
Flame 12:81-101. 3. Oran, E.S., J.W. Weber, J. Eliza, E.I. Stefaniw, M.H. Lefebvre, and J.D. Ander-
son, Jr. 1998. A numerical study of a two-dimensional H2-02-Ar detonation using a detailed chemical reaction model. Combustion Flame 113:147-63.
4. Korobeinikov, V., V. A. Levin, V. V. Markov, and G.G. Chernyi. 1972. Propagation of blast waves in a combustible gas. Ada Astronautica 17:529-37.
106

CALCULATION OF TRAVELLING DETONATIONS BY THE SPACE-TIME CONSERVATION ELEMENT
AND SOLUTION ELEMENT METHOD
S.T.J. Yu, S. J. Park, S.-C. Chang, and P. C. E. Jorgenson
The computations of propagating detonations by using the Space-Time Conservation Element and Solution Element method, or the CE/SE method for short are reported in this paper. The Euler equations in conjunction with a species equation are solved for time-accurate solu- tions. A one-step irreversible finite rate model to simulate chemical reactions is used. The stiff source term is treated by a volumetric inte- gration over the space-time conservation elements. Contrast to modern upwind methods, the CE/SE method does not use a Riemann solver, a reconstruction method, or directional splitting as the building blocks. Moreover, no carbuncle effect near the shock front was observed and thus adaptive refinement or other remedy is not needed. As a result, the logic and operational counts of the CE/SE method are significantly sim- pler. Numerical examples reported here include one and two-dimensional propagating detonations. Special flow features of detonations are crisply resolved, including cellular structure, triple points, unburned pockets, and transverse waves. It was found that only five to six mesh nodes are needed for accurate resolution of a half reaction zone in the streamwise direction behind the inert shock. The present space-time method is a viable approach for solving unsteady detonation waves.
1 INTRODUCTION
Recent interests in advanced propulsion concepts have rekindled the research activities in detonation waves. Air-breathing as well as rocket-based Pulsed Det- onation Engines (PDEs) have received significant attention. In the combustion chamber of a PDE, detonation waves propagate through a premixed fuel-air mix- ture and produce large chamber pressures for propulsion. Because of travelling detonations, nearly constant-volume combustion (i.e., the detonation branch of
107

HIGH-SPEED DEFLAGRATION & DETONATION
the Rankine-Hugoniot curve) with high operational frequencies can be achieved. The PDEs could be a promising high-performance propulsion device.
In the development of air-breathing hypersonic propulsion vehicles, oblique detonation waves have been proposed to be used to enhance mixing in the super- sonic combustion inside a scramjet engine. Combustion takes place in the lee of overdriven oblique detonation waves, which are usually attached to a wedge-like surface. The characteristics of the overdriven detonation waves are of concern for the performance of the propulsion devices. Zel'dovich, von Neumann, and Döring pioneered the theoretical analyses of detonation waves. Without solving the reacting flow equations, their ZND model postulates a steadily propagating detonation wave, which was illustrated as an inert shock followed by a finite-rate reaction zone. This insight provided the preliminary knowledge of detonations. Further experiments, however, showed that detonation waves are often unstable with transverse wave structure, and the measured pressures of the von Neumann spikes were usually significantly higher than that predicted by the ZND model. For further development of the above-mentioned propulsion concepts, it is im- perative to accurately calculate stable and unstable propagating detonations. In the past, many attempts were made by applying CFD methods to directly cal- culate the detonations. Some of the important progresses are discussed in the following paragraphs.
Fickett and Wood [1] pioneered the direct numerical calculations of detona- tions. They solved the one-dimensional reacting flow equations with simplified combustion model by using the method of characteristics in conjunction with a shock fitting procedure. Longitudinal instability waves were simulated in detail.
Taki and Fujiwara [2, 3] applied the upwind method to calculate two- dimensional travelling detonation waves. They solved the Euler equations cou- pled with two species equations. They used a two-step finite-rate model to simulate the chemical reactions of hydrogen and air. As part of the initial condi- tions, they perturbed the shock front to trigger transverse instabilities and triple points.
Oran, Kailasanath, and coworkers [4-6] at the US Naval Research Laboratory applied the Flux-Corrected Transport (FCT) method to calculate detonations. The FCT approach is the most popular method in calculating detonations. The software has been widely used for one-, two-, and three-dimensional calcula- tions.
Bourlioux et al. [7, 8] developed an advanced numerical method, composed of a high-order upwind scheme, a front tracking method, and an adaptive refine- ment algorithm, for direct calculations of detonations. They presented detailed comparisons between the theoretical solution and their numerical solution. Some of their results are used as a guideline in the development of the present CE/SE method for detonations.
Quirk [9] addressed the particular deficiency of the Godunov-type upwind schemes when solving complex flows such as detonations, and developed a strat-
108

DETONATION: FUNDAMENTALS & CONTROL
egy to overcome the weakness. By using his modified upwind method, he suc- cessfully simulated the galloping one- and two-dimensional detonations.
Yungster and Radhakrishnan [10] developed a fully implicit, time-accurate upwind method for supersonic combustion. An efficient Successive Gauss-Seidel iteration method was used to invert the matrix. They have reported numerical results related to a projectile moving in a hydrogen-air mixture.
Papalexandris [11] developed an unsplit upwind method for hyperbolic con- servation laws with a stiff source term. The method is based on integrating the flow equations along the characteristic manifolds in space-time. In the present investigation one of his test cases will be revisited. So far, it is well recognized that a good scheme for the reactive flow must be able to capture correct shock speed, resolve wave structures in multidimensional case, and present the correct period of the possible unsteady oscillation in the wave.
The objective of the present work is to apply the Space-Time CE/SE method, originally developed>by Chang and coworkers [12-16], to calculate the travelling detonation waves. In order to assess the numerical accuracy, detailed compar- isons between the theoretical solution and the numerical results were conducted. In particular, the number of mesh nodes required for an accurate resolution of the reaction zone following the shock front are identified.
The rest of this paper is organized as follows. In Section 2, a brief description of the CE/SE method is provided. The numerical treatment for the stiff source terms associated with the finite-rate chemistry is discussed. In Section 3, the theoretical model of the simulated detonations is presented. In Section 4, the numerical solutions by the CE/SE method for steady and unsteady detonations will be reported, followed by concluding remarks.
2 THE SPACE-TIME CE/SE METHOD
The details of the Space-Time CE/SE method have been extensively illustrated in the cited references [12-14]. Here, a brief discussion of the essential steps is provided. The underlying tenet of the CE/SE method is an equal footing treatment of space and time, and calculations of the flow variables are based on local and global space-time flux balance. The resultant formulation allows flexible geometry of space-time conservation elements, over which the space-time flux is enforced. In the CE/SE method, the space-time conservation elements were constructed such that flow solutions at neighboring locations leapfrog each other in time marching. As a result, the Riemann problem was avoided in calculating the flux. Moreover, the spatial gradients of the flow variables are treated as the unknowns and they march in time hand in hand with the flow variables. Thus no reconstruction step is used. In the following, the basic concept
109

HIGH-SPEED DEFLAGRATION fc DETONATION
of the space-time CE/SE method is illustrated. The treatment of the source term
will also be discussed.
2.1 The Space-Time Integration
A two-dimensional scalar convection equation is used to illustrate the CE/SE method. Consider an initial-value problem governed by the equation
du du du . . /n
dt dx dy
where ax and ay are constants and the source term r(u) is a function of u. Let Xl = x, x2 = y,a.ndx3 = t be the coordinates of a three-dimensional Euclidean space E3. Thus the left hand side of Eq. (1) becomes a divergence operation
V ■ h = T(U) (2)
where the current density vector h = {axu, ayu, u). By using Gauss divergence theorem in E3, one obtains the integral equation
I h-ds= [ r{u)dR (3)
S{R) R
where S{R) is the boundary of an arbitrary space-time region R in E3, ds = dan with da and n, respectively, being the area and the outward unit normal of a surface element on S(R), and dR is a differential space-time volume in S(R). Note that h ■ ds is the space-time flux of h leaving the region R through the surface element ds. Treating E3 as a three-dimensional Euclidean space, we can carry out all mathematical operations. Here, space and time are treated as one entity, and there is no restriction on the space-time geometry of the conservation elements, over which the space-time flux is imposed.
Let Q denote the set of all staggered space-time mesh nodes (j, k, n) in E3 with n being the time step number, and j and k being the spatial indices. For each (j, *, n) £ ft, let the solution element SE(j, k, n) be the interior of the space-time region bounded by dashed lines depicted in Fig. 1. In this case, point a is the mesh node of concern. It includes a forked line segment and its immediate neighborhood. For the discussions given in this paper, the exact size of this neighborhood does not matter. For any {x,y,t) € SE(j,k,n), let u(x,y,t) and h(x,y,t), respectively, be approximated by u*(x,y:t;j,k,n) and h*(x,y,t]j,k,n). Let
u*(x,y,t;j,k,n)
no

DETONATION: FUNDAMENTALS & CONTROL
y n
#
-• e • a
* / • o
Figure 1 The mesh stencil of the CE/SE method for two-dimensional analysis
where (i) ujik, («*)",*., (%)£* and (ut)]>k are constants in SE(j, k, n), and (n) (XJ, yk, t
n) are the coordinates of the mesh point (j, k, n). As will be ex- plained later, it will be assumed that
Combining Eqs. (4) and (5), one has
(5)
u*(x,y,t;j,k,n)
= «",* + («*)",* [(* ~ xj) ~ ax(t - tn)} + {uy)lk [(y - yk) - ay(t - tn)] (6)
where (ar, y, t) 6 SE(j, k, n). Note that the source term effect is neglected in calculating the time derivative term in Eq. (5). To justify Eq. (5), assume that the value of u on a macro scale, i.e., the value of u obtained from an averaging process involving a few neighboring CEs, does not vary significantly as a result of redistributing the source term r over the neighboring CEs while keeping the total source term effect constant. Thus, one can take the liberty to redistribute the source term such that there is no source present in each SE. Equation (6) is the result of substituting Eq. (5) into Eq. (4).
As a result, there are three independent marching variables u"k, (ux)"k
and (%)"]jfc associated with the node (j,k,n). Furthermore,' because h = (axu, ayu, u), one defines
h*(x,y,t;j,k,n)
= (axu*(x,y,t;j,k,n),ayu*(x,y,t;j,k,n),u*(x,y,t;j,k,n)) (7)
111

HIGH-SPEED DEFLAGRATION & DETONATION
Let E3 be divided into nonoverlapping hexagonal-based columns referred to as conservation elements (CEs), shown in Fig. 1. The CE with the midpoint of its top face being any mesh point (j, k, n) is denoted by CE(j, k, n). The discrete approximation of Eq. (3) is
I h-ds = r(uj?t) x CE(j, jfc, n) (8)
S(CE(i,fc,n))
where T(UJ k) is assumed to be the average value of T(U) in CE(j, k, n). Equa- tion (8) states that the total space-time flux of h* leaving the boundary of any CE is equal to the integration of the source term over the CE.
Because the boundary of CE(j, k, n) is a subset of the union of SE(a), SE(c), and SE(e) (refer to Fig. 1), Eqs. (8) imply that
J<k 2 r(ulk) = /1(«"-1/2(a),«r1/2(«)><-1/2(«))
+ /2(«n-i/2(C),«r1/2(c),«ri/2(c))
+ /3(«n-i/2(e),tiri/2(e).«r1/2(e)) w
where ft, i = 1, 2, and 3, are the space-time fluxes calculated by using Eqs. (6) and (8). Refer to the CE/SE references [12-16] for details. Given the values of the marching variables at the (n - l/2)th time level, u"k is determined by solving Eq. (9) with the aid of Newton iteration method for the source term. The initial condition of u for Newton iterations is specified by Eq. (9) without the source term. After u£fc is calculated, (ux)^k and (uy)"ik are evaulated using a central difference type procedure, which was described fully in [12-16].
To proceed, let (j, k, n) G fi. With the aid of Eq. (5), one can perform Taylor expansion in time from the center of the SE(j, k, n - 1/2) to the top vertex of the same SE:
<^<* + Y«:1/2 (io)
This calculation is done for the variables at points a, c, and e of the previous time step, surrounding the point g, to the new time step. Refer again to Fig. 1. Combined with u at point g at the new time step, four u values at the new time level are available to construct ux and uy at g. A central differencing procedure is used to calculate ux and uy. Although not shown, ux and uy
calculated by this procedure imply the addition of an artificial damping with e = 0.5 in the a-e scheme, which is a part of the CE/SE method for nonlinear equations [12, 13]. If shock capturing is of interest, additional treatment is needed to surpress parasitic oscillations associated with contact discontinuities.
112

DETONATION: FUNDAMENTALS & CONTROL
Usually, a reweighting function is used [12, 13]. Limitors used in the upwind schemes could also serve the purpose. Details of these treatments can be found in the original reports for the CE/SE method.
3 THEORETICAL MODEL
The two-dimensional detonations can be formulated by the Euler equations cou- pled with a species equation:
dQ ÖE , OF dt + dx dy (11)
where Q is the unknown vector, E and F are the flux vectors, and S is the source term:
Q =
/ P \ pu pv pE
\PY I
E
/
V
pu pv? + p
puv (pE + p)u
puY
\
1
/
F =
pv puv
pv2 + p (pE + p)v
pvY
\
S =
/ 0 \ 0 0 0
V w )
(12)
The above five equations are the continuity, two momentum, energy, and species equations, respectively. In the equation set, p is density, u and v are velocity, p is pressure, Y is the mass fraction of the reactant, and E = e + Yq + (u2 + v2)/2 is the total energy with e as the internal energy and q as the chemical heat release. In the species equation, a source term exists due to the one-step, irreversible chemical reaction, modeled by finite-rate kinetics. The source term can be expressed as
-K exp ( — E+_ RT PY (13)
where K is the preexponential factor of the Arrhenius kinetics, E+ is the acti- vation energy, and R is the universal gas constant. The above equations are nondimensionalized based on the density, velocity, and pressure of the unburned reactant, i.e., p0, u0, and p0. To keep the equation system consistent, the total energy, the internal energy, and the kinetic energy are nondimensionalized by EQ, eo, U$, and RT0. In addition, the steady half-reaction zone length is used as the characteristic length scale /0, and the time scale r0 = l0/u0. Previously, a comprehensive chemical reaction model for H2-air reactions with nine species and eighteen reaction steps has been implemented into the CE/SE method [17]. The comprehensive chemistry model, however, is out of the scope of the present paper.
113

HIGH-SPEED DEFLAGRATION fc DETONATION
reaction shock zone front
unburned reactants
IW///////////^^^
Figure 2 Schematic of a detonation wave
4 RESULTS AND DISCUSSIONS
Figure 2 is a schematic of detonation waves. A piston-supported detonation is travelling from left to right and the flow field is composed of: (i) the quiescent state of the reactant before the shock, (n) a von Neumann spike with a finite rate reaction, and (in) the equilibrium state between the piston and the spike.
4.1 One-Dimensional Solutions
Two types of detonation calculations are of concern:
(1) the piston problems, in which the detonation waves are initialized by a moving
piston into the reactant, and
114

DETONATION: FUNDAMENTALS & CONTROL
u .a 6
10 20 30 40 50
Figure 3 Simulated shock propagation as compared to the analytical solution- 1 ZND profile; 2 — CE/SE results
(2) the instability problems, in which a steady state ZND analytical solution is used as the initial condition with the chosen flow parameters such that the flow field is unstable.
In both cases, detailed comparisons between the analytical solutions and numer- ical solutions are conducted to assess the numerical accuracy of the space-time CE/SE method.
The initial condition of the piston problem is a long tube filled with reactant with a piston on one end moving at a constant speed into the quiescent reactant. The piston face is used as the origin of the coordinate system. According to this coordinate frame, reactant is charged into a closed-end tube at a constant speed. Thus, a shock wave is reflected on the closed end to ignite the reactant.
The parameters of the flow field in the present calculation are set as q = 50, E+ = 50, 7 = 1.2, and the overdrive coefficient equal to 1.8. According to the classical theory for detonation instability, a transient but stable detonation wave should be obtained with these parameters. In this calculation, 10 mesh nodes are used in the half-reaction zone. Figure 3 shows the density distribution at t = 100. The numerical result shows a correct shock location as compared to the analytical solution. For the same calculation, Fig. 4 shows detailed comparisons of pressure, density, and reactant mass fraction profiles of the von Neumann spike. Good agreement is obtained between the analytical solution and the numerical solution by the CE/SE method.
To further investigate the accuracy of the CE/SE method, the comparison between the numerical solution and the theoretical solution in the classical p-v diagram is shown in Fig. 5. The initial condition is p = v = 1 at the lower right
115

HIGH-SPEED DEFLAGRATION & DETONATION
Figure 4 Detailed structure of the von Neumann spike: 1 — ZND profile; 2 — CE/SE results
corner of the plot. Note that the x and y axes are in different scales. Across the shock, the flow solution jumps to the intersection of the Hugoniot curve (q = 0) and the Ra/leigh line. In the figure, the theoretical shock path (denoted by small circular symbols) is calculated by solving one-dimensional compressible Navier- Stokes equations. Remark that the artificial damping (the a-e-a scheme) was added to the numerical scheme to control the intermediate flow solution inside
116

DETONATION: FUNDAMENTALS & CONTROL
100
0.2 0.4 0.6 0.8 Normalized specific volume
1.0
Figure 5 Thep-v diagram of a steady detonation: 1 — Hugoniot curve; 2 — CE/SE results; 3 — shock path '
the shock. Nevertheless, the numerical solution of p and v by the space-time CE/SE method is quite close to the theoretical shock path. In the reaction zone following the shock front, the numerical solution coincides with the Rayleigh line In the equilibrium region, where the reaction is complete, the numerical solution converges to intersection of the Rayleigh line and the Hugoniot curve (q = 50) Because of the overdrive factor (/ =1.8), the p-v values in the reaction zone are much higher than the CJ point, which is denoted by a square symbol in Fig 5 This figure demonstrates that the quality of the numerical result is comparable to that of the analytical solution.
If one lowers the overdrive factor to 1.6, the detonation wave becomes unsta- ble and a longitudinal Wave bouncing between the piston and the shock front can be observed. In Fig. 6, the temporal evolution of the pressure level at the shock front is shown. In this calculation, only 5 mesh nodes are used in a half-reaction zone. The start-up process of the pushing piston causes the first pressure peak in Fig. 6. After that, the flow field settles down and the instability waves gradually built up. After t > 30, a remarkable instability wave occurs. In about 50 time units, there are about 8 pressure peaks. This numerical solution is in excellent agreement with the results [1].
117

HIGH-SPEED DEFLAGRATION fc DETONATION
Figure 6 The instability of the shock front in a piston problem
In addition to the piston problems, a mesh refinement study for the numer- ical resolution of the longitudinal instabilities of the detonation waves was also conducted. To avoid the complexity of the start-up process of the pushing pis- ton the analytical solution of a stationary ZND detonation is used as the initial condition. In this case, the spatial coordinate is chosen such that the x coordi- nate of the shock front is zero. The parameters of the flow field m the present calculation are q = 50, E+ = 50, 7 = 1-2, and the overdrive coefficient equal to 1 6 Figures la to 7c show the temporal evolution of the pressure level oi the shock front using 5, 10, and 20 grid nodes per half-reaction zone, respectively.
The wavelength of the oscillating pressure of the unstable shock front com- puted by the CE/SE method agrees very well with that obtained by Bourhoux [2\. Figure 8 shows the peak pressures obtained by various upwind schemes and the present method. In Fig. 8, a relative mesh spacing of w, corresponding to 10/u; points per half-reaction zone, is used as the i-axis. Fickett and Wood [1] es- tablished that for the above mentioned flow parameters the peak pressure is about 98.6. When fine meshes are used, all methods considered converge to that
value.
4.2 Two-Dimensional Solution
The detonation instability problem in the one-dimensional calculations was also studied for the two-dimensional case. The calculation was started with the steady ZND analytical solution. The periodic boundary condition was applied along the two lateral sides of the computational domain. The parameters of the flow field in the present calculation were set as q = 50, E+ = 50, 7 = 1-2, and the overdrive
coefficient / equal to 1.6.
118

DETONATION: FUNDAMENTALS & CONTROL
Figure 7 Mesh refinement study of detonation: (a) 5 grid nodes per half-reaction zone; (6) 10; and (c) 20
Figure 9 is a sequence of ten snapshots for the pressure contours that show the transverse wave structure of the detonation front at every half a time unit. The fresh reactant moves in the top down direction and is consumed by the flame front. The mesh resolution is about 10 mesh nodes per half-reaction zone in the one-dimensional sense. From this sequence one can confirm that the transverse wave system behind the detonation is essential in sustaining propagation.
119

HIGH-SPEED DEFLAGRATION & DETONATION
104 ,'*X Ns
102 •
•
•
X-2 — e'
g 100 1
- *e s
•— --•♦ '' s
a;
u OH ~"~-~^ 4
X ~~-e> 96
-
\ \
"\ 5 94 N
1 1 i i
0.0 0.4 0.8 1.2 Relative mesh spacing
1.6 2.0
Figure 8 Peak pressures predicted by different schemes with mesh refinement: 1 — CE/SE; 2 — [7]; 3 — [9], superbee limiter; 4 — [11], unsplit scheme; and 5 — [9], minmod limiter
The life cycle of the detonation waves can be clearly seen — growth, decay and re-initiation of the detonation. From this sequence, one can confirm the classical picture of "explosion within explosion," sustained by the propagation of the transverse cells in the detonation front. At each collision of triple points, a pair of vortices with opposite signs is created and propagates downstream. Due to these vortices, some unburned reactant is engulfed into the flame zone and the unburned pockets behind the flame zone are created.
Figure 10 shows the peak pressure history for two-dimensional detonation waves and comparisons with one-dimensional and classical ZND detonations. The numerical result shows that the period of galloping peak pressures of two- dimensional detonation is much shorter than that in one-dimensional case due to the transverse waves. Besides the pressure peaks of unstable detonations are much higher than the von Neumann pressure peak predicted by the classical ZND model. Similar to that in the one-dimensional detonations, the flow field is composed of: (i) the quiescent state of the reactant before the shock, (n) a von Neumann spike with finite-rate chemical reaction, and (in) the equilibrium
state after the reaction zone.
However, due to the two-dimensional cellular structure of the detonation (shown in Fig. 11), the flow field is much more complex. The shock front is char- acterized by mushroom-shaped incident shocks interacting with a Mach stem. The width of the Mach stem changes in a periodic fashion and tremendous vor-
120

DETONATION: FUNDAMENTALS & CONTROL
Figure 9 Sequence of ten snapshots of pressure (increasing time from top left to bottom right, shock moves upwards); / = 1.6; width 7.5 (shown twice)
121

HIGH-SPEED DEFLAGRATION fc DETONATION
^ P ;. ZND
11 i 1—— 1 ' 10 20 30 40 50
Time
Figure 10 Pressure peak histories of travelling detonation
Time
Figure 11 Cellular structure of travelling detonation
122

DETONATION: FUNDAMENTALS & CONTROL
tices are created during the process. The continuous burning of the unburned pockets behind the flame zone greatly extends the effective flame zone. In gen- eral, the flow features shown here are consistent with previous reported numerical and experimental results.
5 CONCLUDING REMARKS
The space-time CE/SE method was conceived from a perspective of faithfully enforcing the space-time flux conservation in a space-time domain. The method was designed to avoid the limitation of traditional methods. It was built from a foundation, which is solid in physics and yet mathematically simple, that one can build from it a coherent, robust, and accurate CFD framework for complex flow fields.
In the present paper, the space-time CE/SE method has been extended to solve two-dimensional detonations. All special features of this complex flow are crisply resolved, including transverse wave structure, triple points, Mach stem, counter-rotating vortices, and unburned pockets. The result obtained is consistent with the previous experimental and numerical results.
REFERENCES
1. Fickett, W., and W. W. Wood. 1966. Flow calculations for pulsating one- dimensional detonations. Physics Fluids 9(3):903-16.
2. Taki, S., and T. Fujiwara. 1978. Numerical analysis of two-dimensional nonsteady detonations. AIAA J. 16:1.
3. Taki, S., and T. Fujiwara. 1981. Numerical simulation of triple shock behavior of gaseous detonation. 18th Symposium (International) on Combustion Proceedings. Pittsburg, PA: The Combustion Institute. 1671-81.
4. Gamezo, V.N., D. Desbordes, and E. S. Oran. 1999. Formation and evolution of two-dimensional cellular detonations. Combustion Flame 116:154-65.
5. Kailasanath, K., E.S. Oran, J.P. Boris, and T. R. Young. 1985. Determination of detonation cell size and the role of transverse waves in two-dimensional detonations. Combustion Flame 61:199-209.
6. Williams, D. N., L. Bauwens, and E.S. Oran. 1996. Detailed structure and propa- gation of three-dimensional detonations. 26th Symposium (International) on Com- bustion Proceedings. Pittsburg, PA: The Combustion Institute. 2991-98.
7. Bourlioux, A. J. Majda, and V. Roytburd. 1991. Theoretical and numerical struc- ture for unstable one-dimensional detonations. SIAM J. Applied Mathematics 51:303-43.
123

HIGH-SPEED DEFLAGRATION & DETONATION
8. Bourlioux, and A. J. Majda. 1995. Theoretical and numerical structure of unstable detonations. Philos. Trans. Royal Society London, Series A 350:29-68.
9. Quirk, J.J. Godunov-type schemes applied to detonation flows. ICASE Report No. 93-15. (Also NASA Contractor Report 191447.)
10. Yungster, S., and K. Radhakrishnan. 1994. A fully implicit time accurate method for hypersonic combustion: application to shock induced combustion instabilities. NASA Technical Memorandum 106707. (Also AIAA Paper No. 94-2965. 30th Joint Propulsion Conference Proceedings. Indianapolis, IN.)
11. Papalexandris, M.V. 1997. Unsplit numerical schemes for hyperbolic systems of conservation laws with source terms. Ph. D. Thesis, California Institute of Tech- nology.
12. Chang, S. C. 1995. The method of space-time conservation element and solution element — a new approach for solving the Navier-Stokes and Euler equations. J. Comput. Physics 119:295-324.
13. Chang, S. C, X. Y. Wang, and C. Y. Chow. 1994. New developments in the method of space-time conservation element and solution element: Applications to two- dimensional time-marching problems. NASA Technical Memorandum 106758.
14. Yu, S.T., and S. C. Chang. 1997. Treatments of stiff source terms in conservation laws by the method of space-time conservation element and solution element. AIAA Paper No. 7-0435. 35th AIAA Aerospace Sciences Meeting Proceedings. Reno, NV.
15. Yu, S.T., and S. C. Chang. 1997. Applications of the space-time conservation el- ement and solution element method to unsteady chemically reactive flows. AIAA Paper No. 97-2007. In: Collection of Technical Papers, 13th AIAA CFD Conference Proceedings. Snowmass, CO.
16. The web page of the CE/SE Working Group at NASA Glenn: http:// www.grc.nasa.gov/WWW/microbus/index.html
17. Yu, S.T., S.C. Chang, and P.C. E. Jorgenson. 1999. Direct calculation of detona- tion with multi-step finite-rate chemistry by the space-time conservation element and solution element method. 30th Fluid Dynamics Conference and Exhibit Pro- ceedings. Norfolk, VA.
124

PHENOMENON OF NON-SELF-SIMILARITY IN UNSTEADY MACH REFLECTION
OF DETONATION WAVES
A. V. Trotsyuk
Reflection of the unsteady rnultifront two-dimensional gas detonation waves on the wedge has been numerically simulated for stoichiometric hydrogen-oxygen mixtures. The critical wedge angle, at which the tran- sition from regular to Mach reflection occurs, is determined for the initial pressure of p0 = 0.2 bar. In the case of Mach reflection, it is established for various wedge angles that the growth of the Mach stem is not self- similar, i.e., the triple point trajectory is not a straight line. This fact was previously recognized experimentally. In complete agreement with experimental data, the numerical analysis shows that the ultimate height of the Mach stem depends on the wedge angle. The influence of the det- onation cell size and gradients of parameters in the incident detonation wave on the regularities of the Mach stem growth and on the value of the critical wedge angle is studied.
1 INTRODUCTION
Many researchers have conducted experimental, analytical, and numerical inves- tigations of the reflection of a self-sustained unsteady detonation wave (DW) on a wedge [1-9]. Rather complete reviews of the related papers can be found in [1, 10]. The main goal of studying the DW diffraction has been to determine the critical wedge angle, at which the transition from regular to Mach reflection occurs, and to describe the triple point trajectory.
Experimental studies have been performed with stoichiometric mixtures 2H2 + 02 without Ar dilution [1, 3, 4, 6] and with Ar dilution [2], C2H2 +2.502
without Ar dilution [3, 4] and with Ar dilution [2]. The values of initial pressure m the mixtures, p0, were 0.2 [1, 2], 0.2-0.4 [6], 0.05-1 bar [3, 4]. The values of the
125

HIGH-SPEED DEFLAGRATION fc DETONATION
critical wedge angle obtained experimentally in these studies, as well as available theoretical results, were compared in [6, 9]. Gavrilenko and Prokhorov [3, 4] ob- tained experimentally the triple point trajectory at a large distance L « 100a0
travelled by the Mach stem (MS) along the wedge from its apex, where a0 is the transverse size of the cell of the incident DW. It was found that the triple point motion is not self-similar (i.e., its trajectory is not a straight line), and there ex- ists an ultimate MS height which depends on the wedge angle. Being plotted in coordinates normalized by a0f the triple point trajectories for different mixtures and initial pressures coincide with the accuracy of the order of fluctuations in
the MS height. Analytical consideration [1, 2, 5, 9] of DW diffraction on a wedge (for which
it was sometimes necessary to calculate numerically the oblique detonation po- lars) was performed similar to standard inviscid two- and three-shock models for nonreacting gas dynamics [11]. A single-front DW model with an instantaneous chemical reaction, that immediately transformed the gas mixture from its initial state to the chemically equilibrium Chapman-Jouguet (CJ) state, was assumed implicitly or explicitly. In this analysis, the multifront (cellular) structure of the DW, gradients of the parameters both in the induction zone and in the heat re- lease zone, and, finally, the Taylor wave adjacent, to the CJ point at the rear were ignored. As a matter of fact, reflection of a planar steady wave with CJ param- eters and infinitesimal flow gradients behind it were studied. This consideration made it possible to use the results of nonreacting gasdynamics.
Numerical simulation of formation and propagation of an overdriven DW in conically converging channels [8] was performed within the framework of the single-front model, but taking into account the gradients of parameters in detonation products behind the DW front. The time-dependent equations of gas dynamics were solved in an axisymmetric formulation for a stoichiometnc C2H2 + 2.502 mixture at p0 = 1 bar. It was found that as the flow gradients increase, the critical cone angle decreases from 42° at a zero gradient to 36° at an infinitely large gradient of parameters (extrapolation of numerical data). No triple point trajectories were presented in the paper, only a smooth curvature of the Mach stem at the point of its junction with the incident DW front was
noted. Reflection of a two-dimensional multifront unsteady DW from a wedge was
numerically studied in [6, 7]. To simulate the front structure, the authors used a two-step model of chemical reactions (the induction parameter model). The ratio of specific heats 7 is taken as a function of the burnt fraction according to [6], or assumed constant 7 = const as in [7]. The calculated size of the detonation cell a0 = 0.6 cm for a 2H2 + 02 mixture at an initial pressure p0 = 0.2 bar is in good agreement with the experimental data (see Fig. 10 in [12, 13], where the results and models of a multifront DW proposed by other researchers were also analyzed). Calculations demonstrate the formation of an overdriven multifront MS. However, the triple point trajectory was traced only up toiw 5o0.
126

DETONATION: FUNDAMENTALS & CONTROL
In the present paper, reflection of a two-dimensional multifront DW from a wedge is studied numerically to find the critical wedge angle, escertain the behavior of the triple point trajectory at large L/a0 values and determine the effect of the incident-wave structure (detonation cell size and the flow gradi- ents) on Mach reflection. Simulation was performed for a 2H2 + 02 mixture at Po = 0.2 bar and T0 = 298.15 K.
2 FORMULATION OF THE PROBLEM
A plane rectangular channel filled with an explosive mixture is considered. The DW is initiated in the vicinity of the left closed end of the channel. The wedge, which is a continuation of the channel bottom, was located at a certain distance from this end to ensure onset of a self-sustaining multifront DW.
The coordinate origin is chosen in lower left corner of the channel. The «-axis was directed along the bottom wall of the channel towards DW propagation. The y-axis is normal to the z-axis.
In this study, the flow of a chemically reacting gaseous mixture is described by the time-dependent 2D system of conservation laws for mass, momentum, and energy (Euler equations). Viscosity, molecular diffusion, and thermal fluxes are ignored, i.e.
where
q = (p, pu, pv, pE, p/j, pY)T
F(q) = (pu, pu2 + p, puv, u(pE + p), p/xu, pYu)T
G(q) = (pv,puv,pv2+p,v(pE + p),pnv,pYv)T
W = (0,0,0,0, PWß,pWY)T
E = U+l-(u2 + v2)
Reflection boundary condition is imposed at the surface of the wedge and the top, bottom, and left-hand walls of the channel. At the right-hand boundary, the unperturbed initial state of the gas was specified.
Chemical transformation in the gaseous mixture was described by the follow- ing two-step kinetic model [14]:
127

HIGH-SPEED DEFLAGRATION fc DETONATION
at 0 < Y < 1
and at Y = 0
= 1
Wy TindiP, T)
wß = 0
u = Jo-Ip V^o
1
Wy — 0
w. = Wß(T, p, p)
u = t/(T, /*)
The following notations are used hereafter: p is the density; u and v are the fluid velocities in the x and y directions, respectively; E and U are the total energy and internal energy per unit mass, respectively; ED is the mean energy of dissociation of the reaction products; Y is the induction parameter such that Y = 1 at the beginning of the induction zone and Y - 0 at the end; \i is the mean molar mass of the mixture; fia, ftm\n, and //max are the molar masses of the mixture in the atomic, extremely dissociated and extremely recombined states, respectively; p is the pressure; T is the temperature; R is the universal gas constant; 7 = cp/cv is the ratio of specific heats; Wß and Wy are the rates of change in /z and Y, respectively; rind(p,T) is the induction period of the gas mixture at constant p and T; subscript 0 denotes quantities in the initial state and, for a detonation cell — quantities in the CJ detonation regime; and the superscript T denotes the transpose.
The first, induction step, was simulated in accordance with the empirical data [15]. The heat-release step was described with the use of an approximate model of chemical reactions at high temperatures [16-18] and the caloric equa- tion of state [19]. Equation p/p = RT/p for a thermally perfect gas was used as the thermal equation of state. Implementation of these kinetic models is de- scribed in more details in [12, 13]. Note that the proposed approach makes it possible to take into account substantial variations in the values of the mean molar mass of the mixture, heat release, specific heats, and their ratio during chemical transformation.
3 NUMERICAL METHOD
The hyperbolic system of equations (1) was solved numerically. The follow- ing space discretization was performed. A one-dimensional adaptive moving
128

DETONATION: FUNDAMENTALS & CONTROL
grid [12, 13] was used in the ^-direction. A part of the grid with a uniform distribution of nodes formed a zone (reffered to as the uniform-grid zone) with small cells that covered the flow region near the DW front with large gradients of the parameters. The remaining cells with a nonuniform distribution of nodes occupied the region (reffered to as the nonuniform-grid zone) from the closed left-hand end of the channel to the beginning of the uniform-grid zone.
In each vertical section of the channel, the nodes along the y-axis were ar- ranged to provide formation of a zone of uniform small cells near the bottom wall of the channel and wedge surface, and allowed periodic coalescence of these cells. In this case, the conservative variables were reordered to a new grid, and the flow region was simultaneously expanded in the ^-direction exactly by the detonation cell size a0. Owing to the conservative character of this procedure and applied numerical schemes, the order of accuracy was preserved after such reordering.
For each angle of the wedge, the channel width was chosen to ensure the conditions for the upper cell a0 of the incident DW, which corresponded to undisturbed DW propagation in a channel of width H = a0 [12, 13]. During expansion of the flow region, an exact copy of the upper cell a0 formed a new upper detonation cell. For a limited number of cells along y, this technique made it possible to obtain a high resolution near the wedge surface, and simultaneously to simulate the reflection of an almost arbitrarily wide DW front. The latter allowed to obtain the triple point trajectory at large L/a0 values in the numerical simulation of Mach reflection.
Intersections of the lines of two families formed quadrilateral cells, i.e., control volumes. The first family of vertical lines was constructed on the basis of grid nodes on the z-axis. The second family consisted of the lines connecting the nodes with identical numbers on the y-axis located on lines of the first family.
The system of governing equations was solved employing MUSCL TVD schemes. The fourth-order scheme [20, 21] was used to calculate the fluxes along the »-axis m the uniform-grid zone, and the third-order scheme [22, 23] was used in the nonuniform-grid zone. The fluxes along the y-axis were calculated by the scheme [20, 21]. The details on the numerical method, Riemann solvers, and time integration can be found in [12, 13].
4 RESULTS OF COMPUTATIONS
Figure 1 shows a regular reflection of the DW for a 2H2 + 02 mixture at Po = 0.2 bar and a wedge angle of 60°. The detonation cell size for this mix- ture was a0 = 0.6 cm [12, 13]. The intersection point of the DW front with the wedge surface (denoted by R in Fig. 1) travelled the distance L = 12a0
along the surface from the wedge apex. This and other figures show the density
129

HIGH-SPEED DEFLAGRATION fc DETONATION
12 On
x/cm
Figure 1 Regular reflection of the multifront detonation wave for p0
To = 298.15 K, wedge angle of CO0, and L = 12«o
= 0.2 bar,
isolines p/p0 = 1, 1.5, 1.5 • 1.1, 1.5 ■ l.l2. The scales of the x- and y-axes are
equal. Figure 2 shows Mach reflection of the DW from a wedge with an angle of
30° at L = 4a0, 42a0) and 64a0. Here, the point at which the MS adjoins the incident DW front is denoted by S. The results of numerical simulation allow one to study the MS structure and the specific features of its growth. Although the MS is an overdriven DW, the use of high-order schemes made it possible to resolve its multifront structure. At the initial stage of MS formation, where the MS height h is smaller than a0, it is an unsteady overdriven section of the cellular DW front. This part of the DW front is not normal to the wedge surface. As the MS grows, its own system of transverse DWs is developed on it, thus producing a multiheaded overdriven detonation front. The surface of this front is rough. Nevertheless, in the vicinity of the wedge surface the front, on average, is normal to it. Although the front surface is uneven, one can see that the front as a whole is not straight: it adjoins the incident DW front in quite a smooth manner (see Figs. 26 and 2c). The results obtained agree qualitatively with the data of [6-8]. Thus, Fig. 2 shows how a cellular steady (on average) MS is formed from the initially unsteady MS. This problem was studied experimentally in [6].
In experiments, the triple point trajectory is determined from soot imprints. For adequate comparison of numerical simulation with the experimental data the MS height h is defined here as the distance normal to the wedge surface from the inflection point of the DW front (points S in corresponding plots) to the wedge. Figure 3 shows a triple point trajectory in coordinates normalized to the detonation cell width a0 for the wedge angle of 30°, curve I. It is clearly seen that the triple point motion has a fluctuating character due to the action of transverse
130

DETONATION: FUNDAMENTALS & CONTROL
Figure 2 Mach reflection of a multifront DW for p0 = 0.2 bar, To = 298.15 K, and wedge angle of 30°; L = 4a0 (a), 42o0 (6), and 64a0 (c)
DWs, coming from the side of the incident front, and MS own transverse waves. The same behavior of the triple point was observed in [3, 4]. Curve 2 in Fig. 3 shows the experimen- tal results of these investi- gations at a wedge angle of 30°. Unfortunately, this result was averaged by the authors over many experiments, dif- ferent mixtures, and different initial pressures. Further re- search is needed to explain the quantitative difference; how- ever, the qualitative behavior of curves 1 and 2 shows that the triple point motion is not self-similar.
Numerical simulations of a two-dimensional DW [12, 13] have revealed that initial trans- verse disturbances are needed to form a multifront structure of the wave during its initi- ation. Without these distur- bances, a planar, steadily prop- agating DW is formed.
To clarify the influence of the detonation cell on Mach reflection, the reflection of a planar wave was simulated. Curve 3 in Fig. 3 is the triple point trajectory for this case, the wedge angle is 30°. Fairly good quantitative agreement of the trajectories is seen for the cases of multifront and planar DW reflection.
Figure 4 shows the struc- ture of Mach reflection of a pla- nar DW at L = 4a0 and 42a0. One can see that a system of
131

HIGH-SPEED DEFLAGRATION fc DETONATION
L/a„
Figure 3 Triple point trajectories for p0 = 0.2 bar, To = 298.15 K, and wedge angle of 30°: curve 1 refers to the multifront DW, 2 to the experimental data [3, 4], 3 to the planar DW, 7 to the planar DW in the model mixture, 8 to the multifront DW in the model mixture, and 9 to the multifront DW with a small parameter gradient in the rarefaction wave; for a wedge angle of 50°: curve 4 refers to the multifront DW, 5 to the planar DW, and 6 to the nonreacting shock wave with CJ detonation velocity
transverse waves is again developed on the MS, under the action of these waves
the triple point motion has also a pulsating character. Curves 4 and 5 in Fig. 3 are triple point trajectories for the reflection of cel-
lular and planar DWs, respectively, from the wedge with an angle of 50°. These curves clearly demonstrate the existence of the ultimate MS height. Comparing curves 1 and 3 with 4 and 5 one concludes that this ultimate height depends on the wedge angle. This is in line with the experimental data [3, 4].
To be sure that the non-self-similarity of the triple point motion is not a result of some specific features of the numerical method used, a control calculation was performed. A pseudosteady Mach reflection [11] of a nonreacting planar shock wave in a 2H2 + 02 mixture at p0 = 0.2 bar with zero gradients of the parameters behind the front was simulated. The shock wave velocity was equal to the CJ detonation velocity of this mixture. The wedge angle was 50°. The straight line 6 in Fig. 3 clearly shows the self-similar MS behavior.
Figure 5 illustrates the flow patterns at different time instants for the reflec- tion of a multifront DW from a wedge with a critical angle of 52°. The triple point trajectories tracing out the detonation cell are displayed at the top. These time instants correspond to those in Fig. 2<z from [13], where the entire cycle of motion of the transverse waves from their collision on the detonation cell axis to the next collision in the freely propagating DW is traced. The compari- son shows that, within this section of the front, propagation conditions without
132

DETONATION: FUNDAMENTALS & CONTROL
perturbations caused by the wedge are provided. In the crit- ical regime of reflection, a pe- riodic appearance and disap- pearance of the MS is seen at the lower part of the DW front. This is caused by the transverse waves coming from the unper- turbed incident DW front and by a change in the curvature of the front section impinging the wedge. At angles close to the critical angle, a similar be- havior of the MS was observed in [3, 4]. The wedge angle is assumed to be critical if, after reflection from this wedge, the MS persists during the half- period of motion of the trans- verse waves within the detona- tion cell.
The critical wedge angle in the case of a planar DW lies be- tween 50° and 51°. It is worth noting that the flow analysis by the shock polar method [11] of nonreacting shock wave (curve 6 in Fig. 3) yields the critical wedge angle of 50° 17'.
For the same mixture at the same pressure p0, the numeri- cal simulation [7] yields a crit- ical angle equal to 50°; the experimental values of the critical angle are 45° [6] 40° ± 1° [3, 4], 48° ± 2° [2], and 40°-45° [1]. The data presented demonstrate good quantitative agreement between the numerical simulations and experimen- tal results. The scatter in available experimental data and their difference from the numerical data call for further experimental and theoretical investi- gations.
The effect of parameter gradients in the heat release zone on the Mach reflec- tion of the DW was also studied. DW diffraction on the wedge was numerically simulated for a 2H2 + 02 model mixture. The rate of chemical reactions in the model was reduced three-fold. For this purpose, the constants A2 and K+ in the equation for Wß [19] were reduced three times. The detonation velocity and
Figure 4 Mach reflection of the planar DW for pa = 0.2 bar, To = 298.15 K, and wedge angle of 30°. L = 4a0 (a) and 42o0 (6)
133

HIGH-SPEED DEFLAGRATION fc DETONATION
13fln
13.3 14.5 9«„
x/cm
Figure 5 Critical reflection regime of the multifront DW for po - 0.2 bar, To - 298.15 K, and wedge angle of 52°
parameters at the CJ point remained, naturally, the same. If one defines the length of the main heat release zone as a distance at which the flow parameters change their values from those in the induction zone to those at the CJ point, the three-fold reduction in the constants increased the length of this region ap- proximately 2.5 times. Thus, the gradients of parameters behind the induction zone decreased. Curve 7 in Fig. 3 is the triple point trajectory evaluated for the reflection of a planar DW in this model mixture from the wedge with an angle of 30°. A significant increase in the MS height h is seen. The value of h has not yet reached its ultimate value at L/a0 K 60. For this wave, the critical angle lies
between 49° and 50°. Interestingly, the detonation cell size a0 evaluated for the model mixture is
the same as for the normal mixture (Fig. 2a [13]), i.e., aQ = 0.6 cm. Curve 8 in Fig. 3 is the triple point trajectory for the reflection of a cellular DW from the wedge with an angle of 30° in the model mixture. Similarly to curves 1 and 3, 4 and 5, curves 8 and 7 show (with the accuracy of the order of pulsation in h) that the cellular structure of the front does not affect the Mach reflection
of DW.
134
DETONATION: FUNDAMENTALS & CONTROL
The numerical experiments were performed for the case where the wedge was located 8.90 cm away from the left-hand closed end of the channel. To study a possible effect of the parameter gradients in the rarefaction wave be- hind the heat release zone on the behavior of the MS, the reflection of a mul- tifront DW in the normal mixture at the 30°-wedge, located 29.815 cm away from the left-hand end of the channel, was simulated. Curve 9 in Fig. 3 is the triple point trajectory for this case. Comparison of curves 1 and 9 shows that the parameter gradients in the rarefaction wave do not affect the MS growth.
5 CONCLUDING REMARKS
Presumably, for the first time, the non-self-similar motion of the triple point, the existence of the ultimate height of the Mach stem, and the dependence of this height on the wedge angle have been demonstrated by numerical simulation of the DW reflection. These results are in line with the experimental data reported in [3, 4]. The calculations have revealed that the detonation cell size does not affect the triple point trajectory and affects only slightly the critical wedge angle. This agrees with the experimental data of [6]. The effect of the parameter gradients in the incident DW on Mach reflection has already been studied in [8] within the framework of a simpler DW model. The present study reveals a strong dependence of the Mach stem height on the parameter gradients in the heat release zone (on the length of the heat release zone). The effect of this parameter on the critical wedge angle has been found to be weak. It is shown that the parameter gradients in the rarefaction wave do not affect the Mach stem behavior.
As is well known from the theory of dynamic similarity and dimensional anal- ysis [24], the problem of a gas flow is not self-similar if it involves two governing parameters with the dimensions of length and time or these parameters can be combined from other quantitites of different dimensions. The role of this length scale can be played by either the transverse size of the detonation cell a0 or the length of the DW heat release zone. The present study has indicated that this dimensional parameter is the length of the heat release zone.
The DW reflection is a complex physico-chemical process. Its treatment as the reflection of a chemically equilibrium shock wave with Chapman-Jouguet parameters at the front and zero parameter gradients behind it is, in author's opinion, an impermissible simplification. Within the framework of this approach, analytical models [1, 5, 9] yield almost identical values of the critical angle, 34° ± 0.4°, which is significantly lower than the experimental data.
The critical angle determined in this study is 52°. The difference between this value and that obtained by simulation [7] (critical angle of 50°) can be related to
135

HIGH-SPEED DEFLAGRATION fc DETONATION
the chosen kinetics models of chemical reactions [12, 13]. All the available exper- imental data [1-4, 6] yield a lower critical angle than the numerical simulations of [7] and the present study, but never larger. This can be explained as follows. As is known, the critical angle of the wedge is determined in experiments as the instant when the triple point trajectory vanishes in the soot imprints. The track method was improved to provide a resolution of up to 2 • 10~2 mm at the center of the sooted plate (see, e.g., [25]). This resolution is unlikely to be the same at the plate edge. In the numerical simulation of the reflection from a wedge with the critical angle (see Fig. 5), the maximum height of the periodically appearing and disappearing Mach stem was found to be approximately 0.7 mm. If this value is not recorded in the experiment, one can conclude that the DW reflec- tion from this wedge is regular. In this case, the smallest angle at which the Mach stem height exceeds the resolution of the soot track method in the specific experiment will be used as a critical angle. This is a reason of poor accuracy in determining the critical angle value and of a large scatter in the experimental
data [1-4, 6].
ACKNOWLEDGMENTS
The author is grateful to Dr. A.N. Kudryavtsev for his attention to this work
and very useful discussions. This work was supported by the Russian Foundation for Basic Research.
REFERENCES
1. Meltzer, J., J. E. Shepherd, R. Akbar, and A. Sabet. 1993. Mach reflection of det- onation waves. In: Dynamic aspects of detonations. Eds. A. L. Kühl, J.-C. Leyer, A. A. Borisov, and W. A. Sirignano. Progress in astronautics and aeronautics ser. Washington, DC: AIAA Inc. 153:78-94.
2. Edwards, D.H., J.R. Walker, and M.A. Nettleton. 1984. On the propagation of detonation waves along wedges. Archivum Combustionis 4(3):197-209.
3. Gavrilenko, T. P., and E.S. Prokhorov. 1982. Overdriven detonation wave in a real gas. Combustion Explosion Shock Waves 17(6):689-92.
4. Gavrilenko, T.P., and E.S. Prokhorov. 1983. Overdriven gaseous detonations. In: Shock waves, explosion and detonations. Eds. J.R. Bowen, N. Manson, A.K. Op- penheim, and R.I. Soloukhin. Progress in astronautics and aeronautics ser. New York, NY: AIAA Inc. 87:244-50.
5. Gavrilenko, T. P., Yu.A. Nikolaev, and M.E. Topchiyan. 1980. Superoverdriven detonation waves. Combustion Explosion Shock Waves 15(5):659-63.
136

DETONATION: FUNDAMENTALS & CONTROL
6. Yu, Q., K. Ishii, and H. Grönig. 1996. On the Mach reflection of detonation wave. 12th International Mach Reflection Symposium Proceedings. Republic of South Africa. 36-53.
7. Yu, Q., and H. Grönig. 1995. Numerical simulation of the reflection of detona- tion waves. 20th Symposium (International) on Shock Waves Proceedings World Scientific 2: 1143-48.
8. Zhdan, S.A., and E.S. Prokhorov. 1995. Formation and propagation of overdriven gas detonation waves in conically converging channels. Combustion Explosion Shock Waves 31(5):92-100.
9. Li, H., G. Ben-Dor, and H. Grönig. 1997. Analytical study of the oblique reflection of detonation waves. AIAA J. 35(ll):1712-20.
10. Gelfand, B.E., S. M. Frolov, and M.A. Nettleton. 1991. Gaseous detonation - a selective review. Progress Energy Combustion Science 17:327-71.
11. Hornung, H. 1986. Regular and Mach reflection of shock waves. Annual Review Fluid Mechanics 18:33-58.
12. Trotsyuk, A.V. 1999. Numerical simulation of the structure of two-dimensional detonations in H2-02-Ar. In: Gaseous and heterogeneous detonations: Science to applications. Eds. G. Roy, S. Frolov, K. Kailasanath, and N. Smirnov. Moscow ENAS Publ. 163-78.
13. Trotsyuk, A. V. 1999. Numerical simulation of the structure of two-dimensional gaseous detonation of an H2-02-Ar mixture. Combustion Explosion Shock Waves 35(5):549-58.
14. Korobeinikov, V. P., V.A. Levin, V.V. Markov, and G.G. Chernyi. 1972. Propa- gation of blast waves in a combustible gas. Acta Astronautica 17:529-37.
15. White, D. R. 1966. Density induction times in very lean mixtures of D2, H2, C2H2, and C2H4 with 02. 11th Symposium (International) on Combustion Proceedings Berkeley. 147-54. '
16. Nikolaev, Yu. A. 1978. Model of chemical reactions at high temperatures. Combus- tion Explosion Shock Waves 14(4):73-76.
17. Nikolaev, Yu. A., and P. A. Fomin. 1982. Analysis of equilibrium flows of chemically reacting gases. Combustion Explosion Shock Waves 18(l):53-58.
18. Nikolaev, Yu. A., and P.A. Fomin. 1983. Approximate equation of kinetics in het- erogeneous systems of the gas-condensed-phase type. Combustion Explosion Shock Waves 19(6):737-45.
19. Nikolaev, Yu.A., and D.V. Zak. 1988. The agreement of models of chemical re- actions in gases with the second law of thermodynamics. Combustion Explosion Shock Waves 24(4):87-90.
20. Yamamoto, S., and H. Daiguji. 1993. Higher-order-accurate upwind schemes for solving the compressible Euler and Navier-Stokes equations. Comput. Fluids 22(2/3):259-70.
21. Daiguji, H., X. Yuan, and S. Yamamoto. 1997. Stabilization of higher-order high- resolution schemes for the compressible Navier-Stokes equations. Int. J. Numerical Methods Heat Fluid Flow 7(2/3):250-74.
137

HIGH-SPEED DEFLAGRATION fc DETONATION
22. Lin, S.-Y., and Y.-S. Chin. 1995. Comparison of higher resolution Euler schemes for aeroacoustic computations. AIAA J. 33(2):237-45.
23 Chakravarthy, S. R., and S. Osher. 1985. A new class of high accuracy TVD schemes for hyperbolic conservation laws. AIAA Paper No. 85-0363. AIAA 23rd Aerospace
Sciences Meeting Proceedings. Reno, NV.
24. Zel'dovich, Ya.B., and Yu.P. Raizer. 1967. Physics of shock waves and high- temperature hydrodynamic phenomena. New York: Academic Press.
25. Manzhalei, V.l., V. V. Mitrofanov, and V. A. Subbotin. 1974. Measurements of the detonation front perturbations in the gaseous mixture at high initial pressures. Combustion Explosion Shock Wave 10(1):102-10.
138

THE ROLE OF ENERGY DISTRIBUTION ON THE TRANSMISSION OF DETONATION
S.B. Murray, P.A. Thibault, F. Zhang, D. Bjerketvedt, A. Sulmistras, G. O. Thomas,
A. Jenssen, and I. O. Moen
Recently, there has been intense interest in pulse detonation engines (PDEs). Although it is highly desirable that PDEs use combustible fuels which have already been approved by the aviation industry, the resulting fuel-air mixtures are difficult to detonate. One means of ini- tiating these mixtures is via the use of a "predetonator" or "driver" tube which is filled with highly detonable fuel-oxygen mixture. Spark ignition of this mixture leads to a detonation wave which can then be used to initiate the fuel-air detonation in the main combustion chamber. It is desirable to keep the size of the driver to a minimum for reasons of safety and performance, so the efficiency of transmission from the driver to the combustion chamber is extremely important. This paper examines the efficiency of detonation transmission from a tube to an unconfined region when a circular orifice plate or a tube bundle are lo- cated in the tube exit. Transmission from a tube to a cylindrical gap is also investigated. In all cases, the test volume contains a uniform com- bustible mixture. Numerical calculations, together with experimental results, show that transmission is greatly enhanced in some geometries due to local regions of very high energy density created by shock re- flections or implosions. The critical conditions for the above-described geometries are determined in field experiments using fuel-air mixtures and laboratory experiments using fuel-oxygen mixtures. The results in- dicate that transmission through an annular orifice or to a cylindrical gap is extremely efficient. The critical diameter, D0, required for trans- mission can be as much as 2.2 to 2.4 times smaller than the critical tube diameter, dc for a given mixture. The lessons learned from this study should be useful in the design of initiation schemes for PDEs.
1 INTRODUCTION
There has recently been intense interest in pulse detonation engines (PDEs) which generate thrust via a cyclical detonation process. From a practical per-
139

HIGH-SPEED DEFLAGRATION & DETONATION
spective, it is highly desirable that PDEs use combustible fuels which have al- ready gained acceptance by the aviation industry (e.g., JP-10 or Jet-A). One problem with these fuels is that the corresponding fuel-air mixtures are rela- tively insensitive to detonation.
The relative detonation sensitivity of a combustible mixture can be character- ized by "macroscopic" detonation parameters such as the critical energy, Ec, for direct initiation of detonation in a particular geometry, the critical tube diame- ter, dc, for the transmission of detonation from a tube to an unconfined space, or the run-up distance, ZDDT, at which a weakly-ignited deflagration in a particu- lar tube transits to detonation. Alternatively, the detonability can be expressed in terms of "microscopic" detonation parameters including the induction-zone length, A, or the cell size, A, characteristic of the transient, three-dimensional detonation front.
Direct initiation of detonation by a powerful electrical igniter would be im- practical for a PDE employing aviation fuels. Akbar et al. [1] have recently reported that the detonation cell size for stoichiometric JP-10 vapour and air at atmospheric pressure and a temperature of 135 °C is about 5 cm. This cell size indicates that JP-10-air mixture is approximately equal in sensitivity to propane-air mixture [2] which has a critical charge mass for spherical initia- tion of about 50 grams of tetryl [3]. Weak ignition followed by deflagration- to-detonation transition (DDT) would not appear to be a practical option for JP-10-air mixture either. The recent work of Higgins et al. [4], for example, has shown that the transition distance for stoichiometric propane-air mixture in a 15-centimeter diameter closed tube, fitted the full length with DDT-enhancing obstacles, is on the order of a few meters.
These investigators also demonstrated that the transition distance can be re- duced by either elevating the initial pressure, enriching the mixture with oxygen, or replacing a significant amount of the propane fuel with acetylene. However, ZDDT was found to be greater than 1.5 m in every case. Significant run-up dis- tances have been the cause of poor performance in several PDE investigations employing fuel-oxygen [5-12] and fuel-air [5, 13, 14] mixtures. It is possible to sensitize liquid fuels by adding nitrates [15] or peroxides [16], or by saturating the fuel with detonable gases such as acetylene or ethylene [17]. It has also been shown that combustible mixtures, once formed, can be further sensitized by in- jecting halogens [18] or hot free radicals [19-21]. However, considerable work would have to be done before these methods could be implemented in a practical PDE.
One initiation scheme receiving considerable attention within the PDE com- munity involves the use of a "predetonator" or "driver" tube [6, 7, 22-36]. In this concept, a detonation is first formed in a sensitive fuel-oxygen mixture by spark ignition followed by rapid DDT. The established wave is then used to initiate the less sensitive fuel-air mixture contained in the main combustion chamber. Ting et al. [24] have reported that DDT in propane-oxygen occurs within a few
140

DETONATION; FUNDAMENTALS & CONTROL
centimeters in a 15-centimeter diameter tube and that the resulting detonation is capable of promptly initiating in a propane-air detonation mixture separated by a Mylar diaphragm in the same diameter of tube, although the precise distance required for the propane-air detonation to establish is not given. This result suggests that a predetonator approach could be successfully implemented in a JP-10 fuelled engine, depending on the operating pressure and temperature and the size of the combustion chamber.
It is desirable from both a safety and performance point of view to keep the volume of the predetonator as small as possible. A recent performance anal- ysis by Bussing and co-workers [26, 27] has shown that a fuel-oxygen driver accounting for only 1% of the total combustion chamber volume will result in a 22% reduction in specific impulse due to the mass of the additional hardware and oxidizer, and the short-duration thrust profile resulting from the higher temperature detonation products. Accordingly, the diameter of any practical predetonator will have to be considerably smaller than that of the main combus- tion chamber. Thus, the efficiency of transmission from the driver tube to the chamber will be an important issue. Very little attention has been paid to this aspect of PDE design. Most previous transmission studies have been conducted by the hazard prevention or defence preparedness communities where the focus is on preventing the transmission of detonation.
One means of promoting transmission is to increase the power of the driver. The recent critical transmission experiments at atmospheric pressure by Schultz and Shepherd [37] have shown that initiation of a nitrogen-diluted fuel-oxygen mixture in a large vessel is more readily accomplished by a driver containing undi- luted fuel-oxygen mixture rather than the same diluted test gas. In the case of propane fuel, for example, the critical ß0 for transmission from a 38-millimeter tube containing propane-oxygen mixture to a mixture of C3H8 + 5(02 + /?oN2) was 0.74, where ß0 = [N2]/[02]. Critical conditions were given by ß0 = 0.58 when the tube and chamber were filled with the same nitrogen-diluted mix- ture. The corresponding critical values of D/A were approximately 12 and 21, respectively, where A is the cell size for the mixture being initiated. Thus, the fuel-oxygen driver was capable of initiating a considerably less sensitive mix- ture. Helman et al. [6], who were the first to demonstrate the predetonator con- cept using an ethylene-oxygen mixture to initiate ethylene-air mixture, noted that "overfilling" the driver (i.e., so that ethylene-oxygen issued from the tube into the surrounding ethylene-air mixture) was a means of further improving performance. However, the extent to which the tube was overfilled was not revealed.
A second means of promoting transmission is to temper the severity of the gasdynamic expansion. Murray and Moen [38], for example, have shown that a detonation wave in a channel can more easily transmit to a large chamber through a mildly diverging transition section rather than an abrupt area change. Gubin et al. [39] conducted similar experiments and reported that transmission
141

HIGH-SPEED DEFLAGRATION fc DETONATION
can occur in a continuous fashion or by way of detonation failure followed by reinitiation.
Shock reflection and focusing techniques provide a third means of enhancing transmission. Liu et al. [40] investigated transmission through a variety of orifice shapes including circular, ellipsoidal, triangular, and rectangular. However, only minor differences were identified due to the fact that the blast waves generated through these orifices are quite similar in that they expand and decay without generating strong reflected shocks or implosions. In contrast, Vasil'ev [41] studied transmission from parallel channels and from three or six equally spaced orifice holes arranged on a pitch circle. It was found that shock collisions lengthened the overall energy liberation time, resulting in the distributed initiation source being much more effective than a single orifice for the same overall exit area. The importance of shock focusing on ignition and initiation has been emphasized by several Russian [42-44] and Canadian [45, 46] studies in which shock waves were reflected from two-dimensional corners or from spherical, cylindrical, or conical end plates. Cylindrically- and spherically-imploding detonation waves have also been investigated [47, 48], but these have yet to be assessed for their utility as an initiation source for less sensitive combustible mixtures.
In the present paper, alternate transmission geometries in which reflection and implosion processes dominate the gasdynamic flow downstream of the driver tube exit are considered. The energy distribution associated with these geome- tries is highly nonuniform due to local regions of high energy density created by shock collisions. The aim of this study is to determine the role played by these local "hot spots" on the overall efficiency of transmission, and to quantify the degree of enhancement possible in the various geometries.
2 PROPOSED GEOMETRIES FOR ENHANCED TRANSMISSION
Three geometric configurations believed to be effective at promoting detonation transmission are shown schematically in Fig. 1. The driver tube is of circular cross-section in all cases. A circular orifice plate and a tube bundle are placed flush with the exit of the tube in Figs, la and 16, respectively. Transmission to a cylindrical gap is shown in Fig. lc. These geometries were selected for study because they promote strong shock reflections.
Numerical simulations have been carried out to illustrate the salient features of the shock reflection and reinitiation processes in the various geometries. All calculations were two-dimensional, axisymmetric in nature and were performed using a second-order Godunov-type explicit scheme implemented in the IFSAS code [49]. A simple, one-step, Arrhenius reaction scheme was employed with proper values of the preexponential factor k and activation energy E. The com-
142

DETONATION: FUNDAMENTALS & CONTROL
(«0
(fi)
Figure 1 Transmission geometries investigated in the present study: (a) annular orifice, (6) tube bundle, and (c) cylindrical gap
putations were performed assuming a constant specific heat ratio j = 1.4, con- stant molecular mass Mw = 28.8 g/mole, and a heat release Q corresponding to a Mach number MCj = 5, which is typical for fuel-air mixtures. Detonation was initiated at the beginning of the driver tube which was open to avoid reflected shocks.
It should be noted that all numerical calculations described below remain strictly qualitative in nature due to the assumptions involved in the reaction model. This is particularly true considering that the grid resolution is insuf- ficiently fine to properly resolve the ZND structure of the detonation front or the finer details of the shock reflection processes. Furthermore, it is far too coarse to take into account the cellular structure of the detonation or many of the high-frequency instabilities which can play an important role in the onset of detonation. Indeed, owing to the three-dimensionality of the cellular detonation front, a complete and exact modeling of the transmission process remains very difficult at the present time. Consequently, any quantitative evaluation of the critical conditions must be done experimentally.
143

HIGH-SPEED DEFLAGRATION fc DETONATION
2.1 Annular Orifice
The propagation of detonation through an annular orifice (Fig. la) results in the transmission of an expanding toroidal wave which eventually implodes along the axis of symmetry. Figure 2 shows the computed results for an annular orifice having an open area ratio a = 1 - (d/D0)
2 = 0.44, where d is the diameter of the central blockage and D0 is the diameter of the tube. Both pressure and temperature plots have been included to illustrate the decoupling between the shock and reaction zone during diffraction and the subsequent re- coupling which takes place in the event of successful reinitiation. If D0 is too small or, equivalent^, if the rate of reaction of the mixture is too low, the detonation fails to transmit as illustrated in Fig. 2a. In this case, an expanding toroidal wave is formed (frame No. 1) which implodes downstream to create a reacting hot spot at the implosion site and a circular Mach stem further downstream (frame No.2). The latter evolves into a fully reacting bubble (frame No. 3) which expands ahead of the neighbouring incident wave which, by this time, has completely decoupled itself from the trailing reac- tion zone. Owing to the small diameter of the tube and the given open area ratio, the volume and lifetime of the regions of high energy density associ- ated with the implosion and Mach stem are too small to allow sufficient en- ergy release to maintain the strength of the reacting bubble. As shown in Fig. 26, if the rate of reaction is increased, the degree of reaction behind the expanding bubble is higher and a well-supported detonation bubble develops (frame No. 2) which eventually evolves into a self-sustained detonation wave
(frame No. 3). The above-described calculations clearly illustrate the important role played
by the implosion and the Mach stem in the distribution of energy and heat release during the transmission process. The role of the orifice is to determine, for a given mixture, the relative volume of these regions of high energy density which control the degree of reaction within the expanding bubble.
2.2 Tube Bundle
The tube bundle shown in Fig. 16 is characterized by two parameters; the ratio d/D0 between the tube diameter and the bundle diameter, and the overall open area ratio which depends on d/D0 and the number of tubes, N, in the bundle
(i.e., a = N(d/D0)2).
In the limit of very small open area ratio, the transmission process is con- trolled by the gasdynamic expansion associated with individual tubes. In this case, interaction between the waves emerging from the tubes is minimal prior to the onset of detonation and successful transmission from the bundle occurs if
144

DETONATION: FUNDAMENTALS k CONTROL
Figure 2 Pressure and temperature profiles from numerical computations showing detonation transmission and failure to transmit through an annular orifice. D0 = 6 cm, a = 0.44, 7 = 1.4, Mw = 28.8 g/mole, Q = 1.445 MJ/kg, E = 4.30 MJ/kg, computational cell = 1x1 mm. (a) k = 6 x 10⁸ s_1 (failure). (6) k = 3 x 10⁹ s_1
(successful transmission). (Refer color plate.)
145

HIGH-SPEED DEFLAGRATION fc DETONATION
the diameter of individual tubes is larger than the critical tube diameter for the combustible mixture. With increasing open area ratio, the interaction between the blast waves becomes significant and eventually contributes to the overall transmission process.
A qualitative description of the transmission process, based partly on the re- sults for the annular orifice, can be offered. Firstly, one might expect that wave collisions and the subsequent formation of Mach stems will result in local regions of high energy density which, in turn, can lead to centers of rapid exothermic reaction. The reacting bubbles emanating from these centers will themselves mutually interact to form a very nonuniform reactive flow field. If, near critical conditions, the overall degree of reaction in this flow field is sufficiently high, one might then expect that detonation transmission from the tube bundle will be controlled by the large-scale expansion associated with the bundle diameter rather than that of the individual tubes. In this case, successful transmission will occur when the bundle diameter is comparable in magnitude to the criti- cal tube diameter for the mixture. It is therefore possible to obtain detonation transmission although the tubes themselves are much smaller than dc. Natu- rally, if d/D0 becomes too small, detonation failure may occur inside the tubes due either to boundary layer effects [50] or the fact that the tubes are too small to accommodate single-head spin [51, 52]. If this happens, the onset of detona- tion in the unconfined region is unlikely unless DDT occurs downstream of the bundle.
Although the complex three-dimensional and collective nature of these inter- actions makes a full numerical simulation of the problem virtually impossible, the essential features of the transmission process can be appreciated from the results of the corresponding two-dimensional computations employing equally- spaced, concentric, annular slits, rather than tubes. Typical results are shown in Fig. 3 for an open area ratio a = 0.57 and an annular slit size d/D0 = 0.067. Again, both pressure and temperature contour plots are included. In the case of failure of transmission from the simulated bundle (Fig. 3a), the shock collisions between neighbouring blast waves are simply too weak to reinitiate the failed wavelets from the individual slits. However, when the mixture reaction rate is increased for the same geometric conditions, as shown in Fig. 36, these shock collisions lead to reinitiation sites which grow into self-sustained reacting bub- bles (frame No. 1). These bubbles collide as they expand and eventually lead to a coherent detonation front (frame No. 3).
2.3 Cylindrical Gap
The process of detonation wave transmitting from a tube to a cylindrical gap defined by two parallel plates (Fig. lc) begins with the wave diffracting around a
146

DETONATION: FUNDAMENTALS & CONTROL
5.591425e+01
150
2.987893e+01
1.127610(H-01
4.831535et01
4.735705e-01 60-
T 150
3.979991e+03
2.863195e+01
2.188460e+01
(a) (b)
Figure 3 Pressure and temperature profiles from numerical computations showing detonation transmission and failure to transmit through a two-dimensional tube bundle. D0 = 6 cm, a = 0.57, 7 = 1.4, Mw = 28.8 g/mole, Q = 1.445 MJ/kg, E = 4.30 MJ/kg, computational cell = 1x1 mm. (a) k = 6 x 10⁸ s_1 (failure). (6) k = 3 x 10⁹ s_1
(successful transmission). (Refer color plate.)
147

HIGH-SPEED DEFLAGRATION & DETONATION
3.2323lle+00
6.589524e+00
4.507712e+00
3.671181e+00
(«)
(*)
3.288806e-01
2.663054e-01
3.086644e-01
2.633035e-01
Figure 4 Density profiles from numerical computations showing detonation trans- mission ant. failure to transmit to a cylindrical gap. £>o = 4 cm, w/Do = 0.6, 7 = 1.4, Mw = 28.8 g/mole, Q = 1.445 MJ/kg, E = 4.30 MJ/kg, computational cell = 1x1 mm. (a) k = 8 x 10⁸ s_1 (failure); (6) k = 5 x 10⁹ s_1 (successful transmission). (Refer color plate.)
148

DETONATION: FUNDAMENTALS & CONTROL
sharp 90° corner. As it emerges from the tube, the wave is initially threatened by the inward propagating rarefaction wave originating at the area change. When the gap width, w, is large in comparison with the tube diameter, D0, reini- tiation is characterized by the formation of one or more explosion nuclei well before the wave interacts with the wall opposite the tube exit. Subsequently, detonation bubbles evolving from these nuclei propagate both ahead into the unburned gas and transversely through the compression-heated gas bounded by the diffracted shock and decoupled reaction zone. This "spontaneous" form of reinitiation during transmission to an unconfined region is well documented in the literature [53-55].
As the gap width is reduced for the same mixture sensitivity, a point will be reached where insufficient time is available for these explosion nuclei to form. Alternatively, this spontaneous form of reinitiation may not occur if the mix- ture sensitivity is reduced. Under either set of conditions, the diffracted wave will reflect from the wall opposite the tube exit. The results of numerical cal- culations illustrating this transmission phenomenon are presented in the form of density contour plots in Fig. 4. It can be seen in Fig. 4a that a cylindrical detonation bubble propagates radially outward along the wall following the re- flection (frame No. 2). If the gap is too small or, equivalently, if the mixture is too insensitive, this bubble will be unable to sustain itself in the presence of the gasdynamic expansion. The reaction zone will eventually decouple from the cylindrical shock (frame No. 3) and transmission will fail. If the mixture sensitiv- ity is increased for the same geometric configuration, the cylindrically expanding bubble is able to cope with the expansion and it evolves into a self-sustained deto- native Mach stem, as shown in frame No. 2 of Fig. 46. The expanding wave, a portion of which propagates transversely through the shock-heated gas bounded by the diffracted shock and trailing reaction zone, subsequently reflects from the opposite wall leading to an overdriven detonative Mach stem (frame No. 3). Eventually, the reflected waves dampen and the cylindrical detonation settles down to its Chapman-Jouguet state.
In the case of detonation transmission through an annular orifice, the region of high energy density was created by the implosion of the toroidal wave on the tube axis. In this geometry, it is the reflection of the diffracted wave from a wall that creates the region of high energy density.
3 EXPERIMENTAL DETAILS AND RESULTS
3.1 Annular Orifice
Critical conditions for transmission of fuel-air detonations through an annular orifice were determined using a large facility located at Raufoss in Norway. The
149

HIGH-SPEED DEFLAGRATION k DETONATION
apparatus consisted of a series of tubes of 15-meter overall length and having a final exit diameter of 0.64 m, connected to a large plastic bag 2 m in diam- eter. Circular plates of various diameters were inserted at the exit of the tube to form annular orifices with open area ratios ranging from 0.15 to 0.70. The majority of experiments employed C2H2-air mixtures prepared using a recircu- lation system. The fuel concentration was monitored by a precalibrated infrared gas analyzer. Selected trials were conducted with C2H4-air mixtures to deter- mine the sensitivity of the results to fuel type. Critical conditions for a given orifice were identified by varying the fuel concentration from test to test. The outcome of an experiment was deduced by piezoelectric pressure transducers, located both upstream and downstream of the orifice, and two high-speed cam- eras. A Hycam (8,000-15,000 half-frames per second) was positioned looking normal to the direction of propagation, while a Fastax (3,000 full frames per sec- ond) was used to view the transmitted wave head-on from the end of the plastic
bag. Small-scale experiments were also performed with stoichiometric C2H2-02
mixtures, with and without argon dilution, and with stoichiometric C3H8-02
mixtures, all at subatmospheric pressure. The laboratory apparatus consisted of a circular tube, 5.2 cm in diameter, attached to a large chamber measur- ing 30 cm in diameter. In this case, the mixtures were prepared in a large gas cylinder, using the method of partial pressures, and then injected into the ap- paratus. Critical conditions for a given orifice were obtained by varying the initial mixture pressure. Each trial was monitored using six pressure transduc- ers; four in the tube, one at the end of the chamber, and one in the middle of the orifice plate. The latter gauge was useful in assessing the strength of the implosion.
Successful transmission in the large-scale experiments could be determined by examining the high-speed films. Figure 5 illustrates the implosion process for a = 0.15. In this case, the initial toroidal expansion of the wave (frames No. 1 and No. 2) is followed by an implosion near the centre of the orifice plate (frame No. 3) and the rapid formation of a self-sustained detonation bubble (frames No. 4 and No. 5) which eventually engulfs the entife mixture (frames No. 6 through No. 8). The photographic records were also extremely useful in studying the transmission phenomenon near criticality. A very interesting case of marginal transmission failure (not shown) was observed for a = 0.45. The implosion process can be seen in early frames of film records leading to intense reaction in two distinct regions. The first region, nearest to the tube exit, corresponded to the initial implosion, while the second region further downstream was part of a reacting bubble generated by the Mach stem. This picture is consistent with the numerical simulations in Fig. 2a for a nearly identical open area ratio. In both cases, there appears to exist a region of low reactivity behind the ex- panding bubble which is undoubtedly responsible for the eventual failure of the
150

DETONATION: FUNDAMENTALS & CONTROL
/ = 0
f=0.17
?=0.78
/=0.34
f=0.86
:J$Wm**W**3"'*[S«*S'S:*
?=0.43
*=0.60
Figure 5 Selected frames from a high-speed cinematographic record showing suc- cessful transmission from a 0.64-meter tube through an annular orifice for an open area ratio or = 0.15. The mixture is lean acetylene-air. Time in milliseconds. (Refer color plate.)
151

HIGH-SPEED DEFLAGRATION fc DETONATION
0,64- m tube C2H2/Air ▼ No go A Go ♦ Critical go
0.4 0.5 0.6
Open area ratio a
Figure 6 Annular orifice transmissibility ß as a function of open area ratio a for fuel-air and fuel-oxygen mixtures.
Having obtained the critical mixture composition for transmission through a given orifice, the corresponding critical tube diameter, dc, was determined for that mixture using the critical tube data and correlations reported earlier by Moen et al. [56]. The detonation "transmissibility" for a given orifice can then be characterized by the parameter ß = dc/D0, where D0 is the outer diameter of the orifice. When ß > 1, the annular orifice enhances detonation transmission, whereas transmission is impeded when ß < 1. Figure 6 shows ß as a function of a for C2H2-air mixtures.
The error bars are based on neighbouring cases of successful transmission ("go") and failure to transmit ("no go"). The results indicate that transmission is clearly enhanced for a > 0.2 with a ß of approximately 2.2 for a = 0.3. Trans- mission is impeded for a < 0.2. A single experiment with C2H4-air suggests that transmission enhancement for this system is similar. The data from the small-scale experiments using stoichiometric C2H2-02 and C3H8-02 mixtures at subatmospheric pressures show the same qualitative trend, but with signifi- cantly reduced enhancement. The enhancement is reduced even further when the regularity of the cellular structure is increased by diluting C2H2-02 with argon. An explanation for this is offered in [51].
152

3.003779e+0I
100 150
mmamtZ 3.473992e+03
5.117356e-01 BMI ■Buns",' '■^z-: ': 2.914668e+01
p, bar ::::t=^Q. 40- h~ '.-■. ■ ■
20- / -' - •
mi J C 50
m
100 150
I 3.396984e+03 2.979853e+02^B
60-
40-H '* m ■ 20- tr- 1 I
1 L 100
■ C 50 150
(a) (b)
Figure 2 Pressure and temperature profiles from numerical computations showing
detonation transmission and failure to transmit through an annular orifice. D0=6 cm, a=0.44,
Y=1.4, Mw = 28.8 g/mole, g=1.445 MJ/kg, E = 4.30 MJ/kg, computational cell = lxl mm.
(a) k= 6xl08 s"1 (failure), (b) k= 3xl09 s"1 (successful transmission). (Refer p. 145)

2.979853c+02|
60
40 T.K ^
20 - gäpüS
(«) (b)
Figure 3 Pressure and temperature profiles from numerical computations showing detonation
transmission and failure to transmit through a two-dimensional tube bundle. DQ=6 cm, a=0.57,
f=1.4, Mw = 28.8 g/mole, g= 1.445 MJ/kg, E = 4.30 MJ/kg, computational cell = lxl mm.
(a) k= 6xl08 s"1 (failure). (/)) k= 3xl09 s_i (successful transmission). (Refer p. 147)

2.556479e-01 i
4.291924e-01
t=0
t=35 |is
2.074860e-01 t=65 |XS
3.2323 lle+OO
6.589524e+00
ES 4.507712e+00
as 3.671181e+00
3.288806e-01
2.663054e-01
3.086644e-01
2.63'3035e-01
t=25 |AS
/=50p.s
t=65 |is
2.873772e+00
BS 6.023117e+00
si 6.915739e+00
m 3.320493e+00
Figure 4 Density profiles from numerical computations showing detonation transmission and
failure to transmit to a cylindrical gap. D0=4 cm, w/£>0=0.6 cm, y=lA, Mw = 28.8 g/mble,
ß=1.445 MJ/kg, E = 4.30 MJ/kg, computational cell = lxl mm. (a) k= 8xl08 s"1 (failure);
(b) k= 5xl09 s"1 (successful transmission). (Refer p. 148)

Figure 5 Selected frames from a high-speed cinematographic record showing successful transmission from a 0.64-meter tube through an annular orifice for an open area ratio a=0.15. The mixture is lean acetylene-air. Time in milliseconds. (Refer p. 151)

DETONATION: FUNDAMENTALS & CONTROL
In summary, both the experimental and numerical investigations suggest that transmission of detonation through an annular orifice is governed by two compet- ing processes. Firstly, there is an overall gasdynamic expansion due to the wave transmitting from planar to spherical geometry. This effect, which weakens the transmitted wave and impedes transmission, may be expected to increase as the open area (or the net flow of energy) decreases for a given orifice diameter and mixture. Secondly, there exists an energy focusing effect due to the implosion and Mach stem which enhances transmission. The results suggest that the latter effect becomes dominant for intermediate open area ratios, typically between 0.3 and 0.7. Hence, although the presence of a central blockage reduces the flow of energy through the orifice, it can nevertheless increase the overall detonation transmissibility.
3.2 Tube Bundle
Experiments with tube bundles were performed on a large scale using fuel-air mixtures and on a small scale using fuel-oxygen mixtures at subatmospheric pressures. The large-scale apparatus and procedures were similar to those used for the orifice experiments except that a 3-meter long tube bundle was now inserted at the exit of the tube and the overall tube length was increased to 18 m. Trials were performed with C2H2-air mixtures using two tube bundle arrangements: one consisting of 94 tubes 50 mm in diameter (d/D0 = 0.079) with a = 0.49, and the other consisting of 448 tubes, 15 mm in diameter (d/D0 = 0.0234) with a = 0.25. In both cases, four pressure transducers were installed in one of the tubes to detect possible detonation failure.
Small-scale experiments were carried out using an apparatus consisting of a circular tube, 4 m in length and 76 mm in diameter, connected to a tube bundle, 50 cm in length and 63 mm in diameter. The tube bundle protruded into a large cylindrical vessel. The bundle consisted of 74 closely packed tubes 4.7 mm in diameter, giving d/D0 = 0.075 and a = 0.41. This apparatus was approximately a l/10th scale version of the large-scale tube bundle employing 50-millimeter tubes. Three stoichiometric mixtures were employed, including C2H2-O2, C2H2-O2 with 70% argon dilution, and C2H6-02. Critical conditions were again determined by varying the initial mixture pressure. Diagnostic probes included an ionization gauge just prior to the tube bundle and a piezoelectric pressure gauge in the large vessel. The vessel was also fitted with a window to al- low spark Schlieren photography. "Go" and "no go" conditions were determined from the difference in times of arrival at the ionization and pressure gauges. By combining these data with distance-time plots constructed from photographic records, average wave velocities within the tube bundle could also be inferred. These velocities permitted the fate of the detonations inside the tubes to be established.
153

HIGH-SPEED DEFLAGRATION fc DETONATION
0.4 0.5 0.6
Open area ratio a
Figure 7 Tube bundle transmissibility ß as a function of open area ratio a for fuel-air and fuel-oxygen mixtures. Small-scale (1) and large-scale (2) annular orifice results of Fig. 6 are included for comparison
Proceeding in a manner similar to that for the annular orifice, the results for the tube bundle can be summarized in terms of the transmissibility param- eter ß, as shown in Fig. 7. It can be seen that the transmissibilities are of the order of unity for the large-scale tube bundle with a = 0.49 and its small-scale counterpart. This would suggest that, due to a high degree of reaction via shock collision, the transmission process is controlled by the expansion associated with the bundle diameter rather than that of the individual tubes. In the particu- lar cases of the C2H2-air and C2H6-02 trials, the presence of the tube bundle seems to have enhanced transmission slightly. With the possible exception of the small-scale C2H2-02 results, where detonation failure may have occurred inside the tube bundle near criticality, the critical "no go" conditions can be clearly attributed to transmission failure rather than propagation failure inside the tubes. For the case of the smaller open area ratio, a = 0.25, detonation transmission is substantially inhibited. Even in this case, however, the critical tube diameter corresponding to the critical mixture is more than 7 times that of the individual tubes, indicating that a significant level of shock interaction must
still have taken place.
154

3.3 Cylindrical Gap
DETONATION: FUNDAMENTALS & CONTROL
Experiments were performed using equimolar C2H2-02 mixtures at sub- atmospheric pressure. The apparatus consisted of a round tube 1.83 m long and 63.2 mm in diameter connected to a cylindrical chamber consisting of two circular plates separated by an annular spacer. The chamber was oriented with its axis coincident with the longitudinal axis of the tube. The cylindrical gap width, w, was varied by installing annular spacers of various thicknesses. Gap widths of 6.3, 12.1, 24.7, 48.5, and 70.8 mm were possible, corresponding to w/Do ratios of 0.099, 0.191, 0.391, 0.767, and 1.12, respectively. The tube could also be connected to a large cylindrical vessel to investigate transmission to an unconfined region. Three pressure transducers were installed in the tube just before the exit to the chamber. A fourth transducer at the edge of the chamber was used to determine whether or not transmission had occurred. The structure of the detonation wave and the details of the transmission process were recorded using smoked Mylar films. Open-shutter photography was used in trials where the gap width was on the order of the detonation cell size. The metal plate was replaced by a transparent plastic plate in these experiments and the camera was positioned on the tube axis looking normal to the direction of propagation in the cylindrical gap.
Figure 8 shows two pairs of smoke records from experiments with w/D0 = 0.391. The records on the left (Fig. 8a) are from the wall surrounding the tube exit, while those on the right (Fig. 86) are from the wall opposite the tube exit. The smoke records at the top indicate that transmission of deto- nation was successful. The dark annular ring apparent in the top left smoke record shows the locations of the diffracted shock wave and trailing reaction zone at the instant the reinitiated wave arrives at the wall surrounding the tube exit. The symmetry of the ring is due to the fact that reinitiation is governed by the strong reflection process. The top right smoke record shows a core of "end-wall" writing surrounded by "side-wall" writing. The smoke records at the bottom show failure to transmit. Only a vague and ragged outline of the ring is present on the smoke record to the left. The corresponding smoke record from the opposite wall shows a core of end-wall cellular structure surrounded by "side-wall" writing which grows rapidly in scale with increasing radius and terminates abruptly. In this test, the decay of the cylindrical Mach stem was too rapid for chemical reactions to remain coupled with the shock. The ra- tios of D0/X for these two experiments are approximately 34 and 11, respec- tively.
Within the bounds of experimental error, the plate spacing is seen to be a constant multiple of the cell size under critical conditions. Specifically, the com- puted values of w/X for w/D0 ratios of 0.099, 0.191, 0.391, 0.767, and 1.12, are 5.2, 5.6, 5.4, 6.1, and 6.2, respectively. That is, w/X = 5.7 ± 0.5 (i.e., ±9%)
155

HIGH-SPEED DEFLAGRATION & DETONATION
Figure 8 Smoke records from the walls surrounding (a) and opposite (6) the tube exit in the cylindrical gap showing successful transmission (top: D/A = 34) and failure to transmit (bottom: D/X = 11)
for all gap widths. The transmissibility ß is plotted against w/D0 in Fig. 9. The correlation for critical tube diameter as a function of initial pressure re- ported by Matsui and Lee [57] has been used to calculate dc. It can be seen that transmission is inhibited for w/D0 < 0.42 and enhanced for w/D0 > 0.42. The transmissibility increases to nearly 2.4 for the largest plate spacing investigated. Unfortunately, the limiting plate spacing was not determined in the present ex- periments. However, in the limit of large w/D0, the transmissibility must, by definition, tend back to unity.
Once again, it can be seen that transmission is the result of two compet- ing processes. The rapid expansion at the area change tends to inhibit trans- mission, while the shock reflection process tends to enhance transmission. It is evident that the latter factor dominates for w/D0 > 0.42 up to some lim- iting plate spacing where the diffracted shock exiting the tube is simply too weak to reinitiate the failed wave. The higher values of transmissibility can be
156

DETONATION: FUNDAMENTALS & CONTROL
attributed, in part, to the expan- sion being cylindrical versus pseu- dospherical in the case of the annu- lar orifice. If the wave in the cylin- drical gap is ultimately allowed to transmit into an unconfined space, it would be subjected to yet a sec- ond cylindrical expansion at the exit of the gap. In essence, this geometry allows the wave to trans- mit to free space more readily by subjecting it to a pair of succes- sive cylindrical expansions rather than a single severe spherical ex- pansion.
It was seen in the annular ori- fice experiments that the maxi- mum transmissibility for fuel-air mixtures was considerably higher than that for fuel-oxygen mixtures
0.2 0.4 0.6 0.8 1.0 Normalized gap width w/D0
1.2
Figure 9 Cylindrical gap transmissibility ß as a function of normalized gap width w/Do from small-scale fuel-oxygen experiments
(2.2 vs. 1.8). Given the similarities between the transmission processes in the two geometries, a similar improvement in transmissibility is anticipated if fuel-air mixtures are tested in a cylindrical gap configuration.
4 CONCLUDING REMARKS
The present study has demonstrated that transmission from a tube can be sig- nificantly enhanced by tailoring the geometry in the vicinity of the tube exit so that strong shock reflections or implosions are generated as the wave exits the tube. The regions of high energy density created by these shock collisions lead to centres of exothermic reaction which are instrumental in sustaining the evolving detonation bubble until it exceeds some critical size necessary for its survival. In essence, these shock collisions behave like "miniexplosions" capable of overdriving the wave until the gasdynamic expansion becomes mild enough for the wave to cope with it.
The detonation "transmissibility" has been found to be a useful parameter for characterizing the efficiency with which a detonation wave transmits from a tube to a given receptor geometry. This parameter is defined by ß = dc/D0, where dc
is the critical tube diameter for the mixture being tested and D0 is the actual tube diameter. Defined in this manner, values of ß greater than unity indicate that transmission is enhanced relative to that from a simple tube, while values
157

HIGH-SPEED DEFLAGRATION fc DETONATION
less than unity signify that transmission is inhibited. In the present annular orifice experiments, a maximum value of ß = 2.2 was observed in acetylene-air mixtures. This means that a driver tube 2.2 times smaller than the critical tube diameter can be used to initiate detonation in the unconfined region outside of the tube when the appropriate orifice plate is present at the exit. The optimum transmissibility was somewhat lower (/? = 1.8) for the corresponding fuel-oxygen mixtures. In contrast, tube bundles were found to be relatively ineffective at
promoting transmission. In the case of transmission to a cylindrical gap, the transmissibility is a
function of w/D0, where w is the gap width and D0 is the tube diameter. Ex- periments employing acetylene-oxygen mixtures have shown that ß - 2.4 for the largest gap width used in the present study (w/D0 = 1.12). Given the im- proved performance of the annular orifice when fuel-air rather than fuel-oxygen mixtures were used, it is recommended that additional tests be conducted using fuel-air mixtures in combination with the cylindrical gap configuration. It is also recommended that the gap width be further increased to identify the maximum
possible transmissibility. Finally, since the purpose of this study was to identify various means of
improving fuel-oxygen predetonator tubes used in PDEs, it is recommended that field experiments be conducted in which the tube is filled with fuel-oxygen mixture and the receptor volume contains fuel-air mixture.
REFERENCES
1. Akbar, R., P.A. Thibault, P.O. Harris, L.-S. Lussier, F. Zhang, and S.B. Murray. 2000 Detonation properties of unsensitized and sensitized JP-10 and Jet-A fuels in air for pulse detonation engines. 36th A1AA/ASME/SAE/ASEE Joint Propulsion Conference and Exhibit Proceedings. Huntsville, AL.
2. Tieszen, S. R., D.W. Stamps, C.K. Westbrook, W.J. and Pitz. 1991. Gaseous hydrocarbon-air detonations. Combustion Flame 84:376-90.
3. Bull, D. C, J. E. Elsworth, G. Hooper, and C. P. Quinn. 1978. Initiation of spherical detonation in hydrocarbon/air mixtures. Acta Astronautica 5:997.
4. Higgins, A. J., P. Pinard, P., A. Yoshinaka, and J.H.S. Lee. 2001. Sensitization of fuel-air mixtures for deflagration to detonation transition. In: High-speed defla- gration and detonation: Fundamentals and control. Eds. G. D. Roy, S.M. Frolov, D.W. Netzer, and A.A. Borisov. Moscow: ELEX-KM Publ. 45-62.
5. Nicholls, J. A., H.R. Wilkinson, and R.B. Morrison. 1957. Intermittent detonation as a thrust-producing mechanism. Jet Propulsion 27:534-41.
6. Helman, D., R. P. Shreeve, and S. Eidelman. 1986. Detonation pulse engine. AIAA Paper No. 86-1683. 22nd AIAA/ASME/SAE/ASEE Joint Propulsion Conference
Proceedings. Huntsville, AL.
158

DETONATION: FUNDAMENTALS & CONTROL
7. Stanley, S., K. Bürge, and D. R. Wilson. 1995. Experimental wave phe- nomenon as related to propulsion application. AIAA Paper No. 95-2580. 31st AIAA/ASME/SAE/ASEE Joint Propulsion Conference and Exhibit Proceedings. San Diego, CA.
8. Stanley, S. B., W. S. Stuessy, and D. R. Wilson. 1995. Experimental investigation of pulse detonation wave phenomenon. AIAA Paper No. 95-2197. 26th AIAA Fluid Dynamics Conference Proceedings. San Diego, CA.
9. Hinkey, J.B., T. R. A. Bussing, and L. Kaye. 1995. Shock tube experiments for the development of a hydrogen-fuelled pulse detonation engine. AIAA Paper No. 95- 2578. 31st AIAA/ASME/SAE/ASEE Joint Propulsion Conference and Exhibit Proceedings. San Diego, CA.
10. Stuessy, W. S., and D. R. Wilson. 1996. Experimental investigation of a multicycle pulsed detonation wave engine. AIAA Paper No. 96-0346. 34th AIAA Aerospace Sciences Meeting Proceedings. Reno, NV.
11. Sterling, J., K. Ghorbanian, and T. Sobota. 1996. Enhanced combustion pulse- jet engines for Mach 0 to 3 applications. AIAA Paper No. 96-2540. 32nd AIAA/ASME/SAE/ASEE Joint Propulsion Conference Proceedings. Lake Buena Vista, FL.
12. Stuessy, W. S., and D.R. Wilson. 1997. Experimental investigation of an annular multi-cycle pulsed detonation wave engine. AIAA Paper No. 97-0808. 35th AIAA Aerospace Sciences Meeting Proceedings. Reno, NV.
13. Krzycki, L. J. 1962. Performance characteristics of an intermittent detonation de- vice. Navweps Report 7655, US Naval Ordnance Test Station. China Lake, CA.
14. Brophy, CM., D. Netzer, and D. Forster. 1998. Detonation studies of JP-10 with oxygen and air for pulse detonation engine development. AIAA Paper No. 98-4003. 34th AIAA/ASME/SAE/ASEE Joint Propulsion Conference and Exhibit Proceed- ings. Cleveland, OH.
15. Zhang, F., R. Akhar, P.A. Thibault, and S.B. Murray. 1999. Effects of nitrates on hydrocarbon flames and detonations. 17th Colloquium (International) on the Dynamics of Explosions and Reactive Systems Proceedings. Heidelberg, Germany. Accepted for publication in Shock Waves.
16. Frolov, S. M., V. Ya. Basevich, and A. A. Belyaev. 1999. The use of fuel blends and distributed injection for active detonability control in a PDE. 17th Colloquium (International) on the Dynamics of Explosions and Reactive Systems Proceedings. Heidelberg, Germany.
17. Williams, F. A. 1999. Fundamental investigations of pulse-detonation phenomena. 49th JANNAF Propulsion Meeting Proceedings. Tucson, AZ.
18. Murray, S. B., I.O. Moen, P.A. Thibault, R. Knystautas, J.H.S. Lee, and A. Sul- mistras. 1991. Initiation of hydrogen-air detonations by turbulent fluorine-air jets. In: Dynamics of detonations and explosions: Detonations. Eds. A. L. Kuhl, J.-C. Leyer, A. A. Borisov, and W. A. Sirignano. Progress in astronautics and aero- nautics ser. Washington, DC: AIAA Inc. 133:91-117.
19. Knystautas, R., J.H.S. Lee, I.O. Moen, and H.-Gg. Wagner. 1979. Direct initia- tion of detonation by a hot turbulent gas jet. 17th Symposium (International) on Combustion Proceedings. Pittsburgh, PA: The Combustion Institute. 1235.
159

HIGH-SPEED DEFLAGRATION & DETONATION
20. Mackay, D. J., S. B. Murray, I. O. Moen, and P. Thibault. 1988. Flame-jet ignition of large fuel-air clouds. 22nd Symposium (International) on Combustion Proceedings. Pittsburgh, PA: The Combustion Institute. 1339-53.
21. Moen, I.O., D. Bjerketvedt, T. Engebretson, A. Jenssen, B.H. Hjertager, and J.R. Bakke. 1989. Transition to detonation in a flame jet. Combustion Flame 75(3-4):297-308.
22. Bussing, T.R.A., J.B. Hinkey, and L. Kaye. 1994. Pulse detonation engine preliminary design considerations. AIAA Paper No. 94-3220. 30th AIAA/ASME/SAE/ASEE Joint Propulsion Conference Proceedings. Indianapo- lis, IN.
23. Bussing, T., and G. Pappas. 1994. An introduction to pulse detonation engines. AIAA Paper No. 94-0263. 32nd Aerospace Sciences Meeting and Exhibit Proceed- ings. Reno, NV.
24. Ting, J.M., T. R. A. Bussing, and J.B. Hinkey. 1995. Experimental characteri- zation of the detonation properties of hydrocarbon fuels for the development of a pulse detonation engine. AIAA Paper No. 95-3154. 31st AIAA/ASME/SAE/ASEE Joint Propulsion Conference Proceedings. San Diego, CA.
25. Bussing, T. R. A. 1995. A Rotary valved multiple pulse detonation engine. AIAA Paper No. 95-2577. 31st AIAA/ASME/SAE/ASEE Joint Propulsion Conference and Exhibit Proceedings. San Diego, CA.
26. Aarnio, M. J., J.B. Hinkey, and T.R.A. Bussing. 1996. Multiple cycle detonation experiments during the development of a pulse detonation engine. AIAA Paper No. 96-3263. 32nd AIAA/ASME/SAE/ASEE Joint Propulsion Conference Pro- ceedings. Lake Buena Vista, FL.
27. Bussing, T.R.A., J.B. Bratkovich, and J.B. Hinkey. 1997. Practical im- plementation of pulse detonation engines. AIAA Paper No. 97-2748. 33rd AIAA/ASME/SAE/ASEE Joint Propulsion Conference and Exhibit Proceedings.
Seattle, WA. 28. Hinkey, J.B., J.T. Williams, S. E. Henderson, and T.R.A. Bussing. 1997. Rotary-
valved, multiple-cycle, pulse detonation engine experimental demonstration. AIAA Paper No. 97-2746. 33rd AIAA/ASME/SAE/ASEE Joint Propulsion Conference and Exhibit Proceedings. Seattle, WA.
29. Hinkey, J.B., S. E. Henderson, and T.R.A. Bussing. 1998. Operation of a flight- scale rotary-valved, multiple-combustor detonation engine (RVMPDE). AIAA Pa- per No. 98-3881. 34th AIAA/ASME/SAE/ASEE Joint Propulsion Conference and Exhibit Proceedings. Cleveland, OH.
30. Bussing, T.R.A., and T. E. Bratkovich. 1999. Pulsed detonation rocket engine. US Patent No. 5,873,240.
31. Bussing, T.R.A., and T. E. Bratkovich. 1999. Liquid fuelled pulse detonation en- gine with controller and inlet and outlet valves. US Patent No. 5,901,550.
32. Brophy, CM., and D.W. Netzer. 1999. Effects of head-end geometry and ignition location on the operation of a JP-10/O2 fuelled pulse detonation engine. 17th International Colloquium on the Dynamics of Explosions and Reactive Systems Proceedings. Heidelberg, Germany.
160

DETONATION: FUNDAMENTALS & CONTROL
33. Brophy, CM., and D.W. Netzer. 1999. Effects of ignition characteristics and ge- ometry on the performance of a JP-10/O2 fuelled pulse detonation engine. AIAA Paper No. 99-2635. 35th AIAA/ASME/SAE/ASEE Joint Propulsion Conference and Exhibit Proceedings. Los Angeles, CA.
34. Winfree, D.D., and L.G. Hunter. 1999. Pulse detonation igniter for pulse detona- tion chambers. US Patent No. 5,937,635.
35. Katta, V.R., F. Chin, and F. Schauer. 1999. Numerical studies on cellular detona- tion wave subjected to sudden expansion. 17th Colloquium (International) on the Dynamics of Explosions and Reactive Systems Proceedings. Heidelberg, Germany.
36. Bouchard, D., B. Forrat, D. Piton, and P. Yvart. 1999. AEROSPATIALE and CELERG investigations on pulse detonation propulsion. AIAA Paper No. 99-2658. 35th AIAA/ASME/SAE/ASEE Joint Propulsion Conference and Exhibit Proceed- ings. Los Angeles, CA.
37. Schultz, E., and J. Shepherd. 2000. Detonation diffraction through a mixture gra- dient. Explosion Dynamics Laboratory Report FMOO-1, Pasadena, CA: Institute of Technology.
38. Murray, S. B., and I. O. Moen. 1987. The influence of confinement on the structure and behaviour of gaseous detonation waves. 16th Symposium (International) on Shock Waves Proceedings. Aachen, West Germany.
39. Gubin, S.A., S.M. Kogarko, and V.N. Mikhalkin. 1981. Experimental study of gas detonation in conical tubes. Combustion Explosion Shock Waves 18(5):592-6.
40. Liu, Y. K., J.H. Lee, and R. Knystautas. 1984. Effect of geometry on the trans- mission of detonation through an orifice. Combustion Flame 56:215.
41. VasiTev, A.A. 1988. Initiation of gas detonation with a spatial source distribution. Combustion Explosion Shock Waves 24(2):118-24.
42. Borisov, A.A., B. E. Gelfand, G.I. Skachkov, et al. 1988. Selfignition of gaseous mixtures by focusing of reflected shock waves. Chemical Physics Reports 7(12):1387.
43. Borisov, A.A., V.M. Zamanskii, V.V. Kosenkov, et al. 1990. Ignition of gaseous combustible mixtures in focused shock waves. Current Topics in Shock Waves. 17th Symposium (International) on Shock Waves and Shock Tubes. AIP Conference Proceedings. 208:696-701.
44. Medvedev, S. P., S.V. Khomik, B. E. Gelfand, and H.O. Grönig. 1999. Experi- mental evidence for detonation of lean hydrogen-air mixtures. 17th Colloquium (International) on the Dynamics of Explosions and Reactive Systems Proceedings. Heidelberg, Germany.
45. Chan, C.K., D. Lau, P.A. Thibault, and J.D. Penrose. 1990. Ignition and detona- tion initiation by shock focussing. Current Topics in Shock Waves. 17th Interna- tional Symposium on Shock Waves and Shock Tubes. AIP Conference Proceedings. 208:161-66.
46. Chan, C. K. 1994. Initiation of detonation induced by a focused shock wave. 15th Colloquium (International) on the Dynamics of Explosions and Reactive Systems Proceedings. Boulder, CO.
161

HIGH-SPEED DEFLAGRATION & DETONATION
47. Lee, J. H., and B. H. K. Lee. 1965. On cylindrical imploding shock waves. 5th Shock Tube Symposium (International) Proceedings. White Oak, Silver Spring, MD. 501-20.
48. Terao, K., and H.-G. Wagner. 1991. Experimental study on spherically imploding detonation waves. Shock Waves 1:27-34.
49. Zhang, F., D. Tran, P.A. and Thibault. 1996. Multiphase models for detonations and explosions in a dusty or porous medium. Combustion Canada'96 Proceedings. Ottawa, Canada.
50. Murray, S.B., and J.H. Lee. 1985. The influence of physical boundaries on gaseous detonation waves. In: Dynamics of explosions. Eds. J.R. Bowen, J.-C. Leyer, and R.I. Soloukhin. Progress in astronautics and aeronautics ser. Washington, DC: AIAA Inc. 106:329-55.
51. Moen, I. O., G. O. Thomas, A. Sulmistras, D. Bjerketvedt, and P. A. Thibault. 1985. Influence of cellular regularity on the behavior of gaseous detonations. In: Dynam- ics of explosions. Eds. J.R. Bowen, J.-C. Leyer, and R.I. Soloukhin. Progress in astronautics and aeronautics ser. Washington, DC: AIAA Inc. 106:220-43.
52. Moen, I.O., M. Donato, R. Knystautas, and J.H. Lee. 1981. The influence of con- finement on the propagation of detonations near the detonability limits. 8th Sympo- sium (International) on Combustion Proceedings. Pittsburgh, PA: The Combustion Institute. 1615-22.
53. Moen, I. O., S. B. Murray, D. Bjerketvedt, A. Rinnan, R. Knystautas, and J. H. Lee. 1981. Diffraction of detonation from tubes into a large fuel-air explosive cloud. 19th Symposium (International) on Combustion Proceedings. Pittsburgh, PA: The Combustion Institute. 635-44.
54. Mitrofanov, V. V., and R.I. Soloukin. 1965. The diffraction of multifront detonation waves. Soviet Physics-Doklady 9(12):1055-8.
55. Edwards, D.H., G. O. Thomas, and M.A. Nettleton. 1979. The diffraction of a planar detonation wave at an abrupt area change. J. Fluid Mechanics 95 (Part I): 79-96.
56. Moen, I. O., J. W. Funk, S. A. Ward, G. Rude, and P. A. Thibault. 1985. Detonation length scales for fuel-air explosions. In: Dynamics of shock waves, explosions, and detonations. Eds. J.R. Bowen, N. Manson, A.K. Oppenheim, and R.I. Soloukhin. Progress in astronautics and aeronautics ser. New York, NY: AIAA Inc. 94:55-79.
57. Matsui, H., and J.H. Lee. 1979. On the measure of the relative detonation haz- ards of gaseous fuel-oxygen and air mixtures. 7th Symposium (International) on Combustion Proceedings. Pittsburgh, PA: The Combustion Institute. 1269.
162

NUMERICAL SIMULATION OF DETONATION CELL STRUCTURE IN HYDROGEN-AIR MIXTURE
LOADED BY ALUMINUM PARTICLES
B. A. Khasainov, B. Veyssiere, and W. Ingignoli
Results of numerical simulation of the 2D detonation structure in hy- brid mixtures containing suspended aluminum particles, hydrogen and gaseous oxidant are presented. The mathematical model incorporates two-temperature, two-velocity formulation of conservation equations. It has been shown computationally that the detonation wave exhibits a cellular structure with average cell size exceeding a few times the ex- perimental values. The predicted cell size grows with aluminum particle concentration. The regularity of the cell structure is shown to depend on the detonation velocity.
1 INTRODUCTION
Recently [1], the authors have measured the detonation cell structure in hydrogen-air mixtures of various fuel-rich composition with suspended aluminum particles, flaked and atomised to 3.5- and 13-micrometer particles. Depending on condensed-phase concentration, these particles can provide up to 3% increase in the detonation velocity. In mixtures with coarse 13-micrometer particles, the detonation velocity can be 10% lower than in a pure gaseous mixture (equal to about 2000 m/s for the studied gaseous mixtures [1]). Besides, aluminum parti- cle size and concentration affect the detonation cell structure. Particularly, the cell structure becomes more regular and cell size diminishes in comparison with that of a pure gaseous mixture due to aluminum particles enhancing the deto- nation performance. Larger particles result in larger and less regular cells. It was found that relative cell size A/A0 correlates reasonably well with the relative detonation velocity D/D0 via the expression derived by the analogy with the correlation obtained by Desbordes [2] for overdriven gaseous detonations:
163

HIGH-SPEED DEFLAGRATION k DETONATION
(1) A-R. { E
A0 D0 y äTZND £'-' where A0 and D0 are, respectively, the cell size and the detonation velocity in the pure gaseous mixture, E is the activation energy and TZND is the temperature at the shock front of the detonation wave in the pure gaseous mixture. However, some of the present results correspond to D < D0 though such regimes cannot propagate steadily in homogeneous gaseous mixtures. Apart from that, extension of this correlation for D > Do to two-phase hybrid mixtures is not so evident. Besides, it would be interesting to investigate numerically the detonation cell structure corresponding to double-front detonations observed in the considered hybrid mixtures with suspended aluminum particles [3, 1].
Presented here are first results of a numerical study of the detonation cell structure in suspensions of aluminum particles in a hydrogen-based gaseous mix- ture, obtained by the use of the two-temperature, two-velocity detonation that was previously developed and tested for the one-dimensional case [4].
2 DESCRIPTION OF THE PROBLEM
In the considered hybrid mixtures, two different reactions can occur behind an initiating shock wave. First, rapid gaseous reaction takes place releasing H20 and CO2 (O2 can be available in lean gaseous explosives). Oxidation of suspended aluminum particles by these species begins after particle temperature exceeds some threshold (ignition) temperature. Both reactions are exothermic and thus can support detonation wave propagation. However, the nonmonotonous charac- ter of heat release in hybrid mixtures can result in different modes of detonation wave propagation [4].
For simplicity, in the considered two-dimensional case a one-step Arrhenius kinetics for gas reaction (E = 17200 cal/mol [5] with the preexponential factor selected from numerical considerations to be 5 ■ 106 s_1) is used. It is assumed that burning of aluminum does not affect the specific heat ratio of the gaseous phase which thus remains constant (7 = 1.4). Then Zel'dovich-von Neumann- Döring (ZND) temperature TZND = 2041 K and the Chapman-Jouquet (CJ) detonation velocity in pure gas D0 = 1909 m/s.
Burning time of aluminum particles is assumed to be proportional to the square of initial particle diameter and l/4>09, where <f> is the volume fraction of oxidizing species in products of gaseous reaction (<f>a = 0.21). For the ignition temperature of aluminum the value Tign = 1350 K was used. It was also assumed that particles are sufficiently fine so that temperature distribution inside particles can be considered uniform.
164

DETONATION: FUNDAMENTALS & CONTROL
To solve the system of two-phase 2D governing equations in planar geometry the LCP FCT technique [6] was used. Besides, a special grid adaptation proce- dure along the longitudinal coordinate was performed every time the shock front arrived sufficiently close to the right boundary of the computational domain. In this case, the leading half of the mesh is not modified but the grid size is in- creased monotonously from the central to the leftmost mesh with the progression factor slowly increasing during the run from the initial value of about 1.005 to about 1.03-1.15 at the end of the run. Thus, numerical resolution in the leading portion of the detonation wave is maintained at the initially selected level and the overall number of meshes along the longitudinal axis is kept constant due to renumeration of gridded values of flow parameters after every adaptation. The final length of the leftmost mesh in the rest zone can significantly exceed the initial mesh size. The final longitudinal length of the computational domain can also be significantly larger than its initial size. The supersonic character of deto- nation propagation ensures that adaptation procedure does not practically affect the accuracy of the solution. All the 2D results shown below are obtained using a 375 x 300 grid (0.25 x 0.2 m). With this resolution (Ax = Ay = 0.6667 mm), there are about 25 meshes inside the ZND induction zone of the steady CJ det- onation in a homogeneous gas.
The flow was initiated by a jump in an initial longitudinal distribution of pressure and temperature near the left closed wall of the channel (distribution of flow parameters across the channel was uniform). In all cases, pressure and temperature behind this ID jump were 200 bar and 900 K, respectively. Longi- tudinal thickness of the driver section was 1 cm. This initiation was quite strong for pure gas and allowed one to initiate the detonation in two-phase mixtures with different particle size ("fine" 3.5 /mi and "coarse" 13 pm) and particle con- centration up to 400 g/m3 and to avoid difficulties with ignition of aluminum particles. Difference in size of fine and coarse particles provides nearly 14-fold difference in the burning time of considered particles.
3 RESULTS OF CALCULATIONS
Figure 1 shows calculated pressure "soot" traces recorded in the case of coarse 13-micrometer aluminum particles at particle concentration of 300 g/m3 (this concentration is close to the stoichiometric value). On the first plate one can see how the initially plane flow is transformed into two-dimensional one as a result of formation of hot spots. At first, detonation cells have quite small sizes since detonation is overdriven. Then, the cell size increases with time as the detonation velocity drops and approaches its quasi-steady value (1784 m/s). Finally, after a few meters of detonation propagation, the cell pattern becomes weakly regular and the average pressure becomes higher than at the first plate
165
1

HIGH-SPEED D
1200 A7mm
imnirnü P, bar. 10 18 26 34 42 50 58
1850 1900 1950 X/mm
(b)
Figure 3 Maximum pressure tracks (a) and pressure distribution at t = 1 ms (b) for
fine 3.5-micrometer particles (<r = 300 g/m )
I 168

DETONATION: FUNDAMENTALS & CONTROL
An opposite case is observed for fine 3.5-micrometer particles shown in Fig. 3. Here, one can see that the cell pattern is more regular and the cell size is sig- nificantly (2-3 times) smaller than with coarse 13-micrometer particles Final detonation velocity D = 2155 m/s in this run is higher than D0. However, as soon as the secondary reaction catches up with the leading gaseous reaction re- sulting in the formation of the quasi-steady single-front detonation (SFD), the cell structure degenerates. This feature can be attributed to very low temper- ature sensitivity of aluminum ignition and burning model in comparison with high temperature sensitivity of Arrhenius gaseous reaction.
Figure 4 shows, for the sake of comparison, the traces of maximum pressure for a pure gaseous explosive mixture with no particles. One can see that the presence of particles of any size accelerates formation of the detonation cell structure. Apart from that, the cell pattern becomes more irregular in the case of coarse particles.
Table 1 summarises particle concentrations and sizes for which similar calcu- lations were performed along with resulting cell sizes and detonation velocities.
Figure 5 a presents the dependence of the final detonation velocity at the end of the runs on particle concentration and size. One can see that coarse particles decrease the detonation velocity while fine particles increase it in agreement with earlier ID predictions [4]. Average cell sizes are a few times larger than the experimental values.
Figure 5b shows that the detonation cell size grows with aluminum particle concentration in the case of coarse particles and drops if particles are fine enough. The lower is the detonation velocity, the more irregular is the cell pattern.
Table 1 Calculated effect of particle concentration and size on the detonation velocity D and detonation cell size A
Particle Particle Number Cell size size cone, er, of cells across \ D
m/s Comment ^m g/m3 the channel mm
1 — 0 7.5- -9.0 22.2- -26.7 1912.2 Pure gas 2 13 100 6.0- -8.0 25.0- -33.3 1864.0 3 13 200 6.0- -7.5 26.7- -33.3 1826.6 4 13 300 4.5- -6.0 33.3- -44.4 1784.0 4a 13 300 4.0- -6.5 30.8- -50.0 1783.4 Inert metal 5 3.5 50 11.5- -13.0 15.4- -17.4 1987.5 6 3.5 100 12.0- -13.0 15.4- -16.7 2049.8 V 3.5 200 12.5- -13.5 14.8- -16.0 2116.4 8 3.5 300 13.0- -14.0 14.3- -15.4 2155.8 Cell structure
at x > 1.1 m degenerates
169

HIGH-SPEED DEFLAGRATION fc DETONATION
P, bar: 10 14 18 22 26 30
1750 1800 1850 1900 //mm
(b)
950 3700 3750 3800 A7mm
(c)
3850
Figure 4 Tracks of maximum pressure (same pressure scales as in Fig. 1) (a) and pressure distribution in pure gaseous mixture at t = 1 ms (b) and < - 2 ms (c)
170

DETONATION: FUNDAMENTALS & CONTROL
0 50 100 150 200 250 300 Particle concentration / g/m
(«)
50 100 150 200 250 300 Particle concentration / g/m
(b)
Figure 5 Effect of particle concentration and size on quasi-steady detonation velocity D (a) and detonation cell size A (6): J! — fine particles; 2 — coarse particles
4 DISCUSSION
To explain the results of aforementioned calculations, it is useful to analyze ID profiles of pressure P and flow Mach number (relative to the shock front, i.e., M = (D - u)/c), where c is the local sound velocity corresponding to the cases considered above.
Figure 6 demonstrates the effect of particle size and concentration calcu- lated for the same conditions as above but in ID case. Here, thick solid lines show P and M profiles in the pure gas at t = 1 and 2 ms. Thin solid lines correspond to coarse 13-micrometer particles at a = 300 g/m3 at t = 1 and 2 ms. Hence, addition of coarse particles results in a decrease in the propa- gation velocity of the leading detonation front and formation of a secondary shock caused by burning of aluminum particles far behind the leading detona- tion zone, which corresponds to M < 1 region just behind the leading front (in the laboratory frame of reference this zone is supersonic). Though the secondary shock at t = 2 ms is more smeared than at t = 1 ms due to the adaptation procedure, one can see that the flow behind the secondary shock becomes again subsonic, like in the case of the double-front detonation. The amplitude of the secondary shock is significantly lower than that of the leading wave and this shock does not produce any important tracks on traces of maxi- mum pressure presented in Fig. 1. With coarse but inert particles (dashed lines in Fig. 6), no secondary shock is formed behind the leading wave and detona- tion velocities for reactive and inert coarse particles are very close to each other. One can also see that transition time and run distance to quasi-steady deto- nation with coarse aluminum particles is quite large in agreement with earlier results [4].
171

HIGH-SPEED DEFLAGRATION & DETONATION
0 500 1000 1500 2000 2500 3000 3500 4000
A7mm
500 1000 1500 2000 2500 3000 3500 4000 I/mm
(b)
Figure 6 Profiles of pressure (a) and Mach number (6) at t = 1 and 2 ms for a = 300 g/m3: 1 — pure gas with no particles; 2 — coarse 13-micrometer aluminum particles; 3 — coarse 13-micrometer inert particles; 4 — fine 3.5-micrometer particles
172

DETONATION: FUNDAMENTALS h CONTROL
Dot-dashed curves in Fig. 6 correspond to fine 3.5-micrometer particles at <T = 300 g/m3. These particles burn 14 times faster than 13-micrometer parti- cles and secondary reaction quickly catches up with the leading reaction resulting in the increase of detonation velocity and pressure. At the same time, the det- onation zone (M < 1) also becomes much thicker, which means that the global reaction becomes very slow. Hence, one could expect that the corresponding cell size would become quite large. This, probably, is another reason why the deto- nation cell structure presented in Fig. 3 for fine particles at nearly stoichiometric concentration finally degenerates (at smaller concentrations of fine particles and at a = 400 g/m3, with the present model no degeneration of 2D detonation structure up to detonation run distances of about 2-3 m was observed). How- ever, experiments [1] show that with flake aluminum particles of very small mean size, a quite regular cell structure is observed for a very wide range of aluminum concentrations up to a = 450 g/m3. This contradiction between calculations and experimental data in the case of fine aluminum particles calls for improving the model of alu- minum ignition and burning.
Finally, Fig. 7 shows the depend- ence provided by Eq. (1) along with the results of 2D calculations listed in Table 1. Here, solid and open symbols show the maximum and minimum cell size, respectively. One can see that the agreement between 2D calculations and a simple correlation (1) is quite reasonable as one could anticipate based on earlier interpretation of the experimental results [1].
Figure 7 Comparison of 2D calculations of cell sizes with the dependence of dimen- sionless cell size versus relative detonation velocity represented by Eq. (1)
5 CONCLUDING REMARKS
Though the proposed model provides a semiquantitative agreement with prac- tically all of the observed trends [1] and improves the existing knowledge on detonations of hybrid mixtures with aluminum, further modeling and numerical studies are needed in the case of fine and especially flake aluminum particles since the simple model in hand predicts degeneration of detonation cell struc- ture near the stoichiometric concentration of aluminum particles in contrast to experimental observations.
173

HIGH-SPEED DEFLAGRATION fc DETONATION
ACKNOWLEDGMENTS
This work was supported by the INTAS (project INTAS-OPEN-97-2027).
REFERENCES
1. Ingignoli W., B. Veyssiere, and B.A. Khasainov. 1999 (in press). Detonation of hydrogen-based gaseous mixtures with suspended aluminum particles. Int. J. Shock Waves.
2 Desbordes, D. 1988. Transmission of overdriven plane detonations: Critical di- ameter as a function of cell regularity and size. In: Dynamics of explosions. Eds. A.L. Kuhl, J.R. Bowen, J.-C. Leyer, and A.A. Borisov. Progress in astronau- tics and aeronautics ser. Washington, DC: AIAA Inc. 114:170-85.
3. Veyssiere, B. 1986. Structure of the detonations in gaseous mixtures containing aluminum particles in suspension. In: Dynamics of explosions. Eds. J.R. Bowen, J.-C. Leyer, and R.I. Soloukhin. Progress in astronautics and aeronautics ser. Washington, DC: AIAA Inc. 106:131-85.
4. Khasainov, B. A., and B. Veyssiere. 1996. Initiation of detonation regimes in hybrid two-phase mixtures. Int. J. Shock Waves 6:9-15.
5 White, D. R., and G. E. Moore. 1965. Structure of gaseous detonations. IV. Induc- tion zones studies in H2-02 and CO-02 mixtures. 10th Symposium (International) on Combustion Proceedings. Pittsburgh, PA: The Combustion Institute. 785-95.
6. Oran, E. S., and J. P. Boris. 1987. Numerical simulation of reactive üow. New York - Amsterdam - London: Elsevier.
174

PART THREE
PULSED DETONATION ENGINES

PULSED DETONATION PROPULSION: KEY ISSUES
D. Desbordes, E. Daniau, and R. Zitoun
A review of the early research on pulsed detonation engines (PDE), ideal detonation propulsion performances given by one detonation cycle anal- ysis and multicycle operation of pulsed detonation are presented. Some key issues that determine propulsion performance of a realistic PDE are investigated.
1 INTRODUCTION
During the last ten years, there has been a renewal of interest in propulsion by detonation besides conventional propulsion systems; e.g., (i) steady propul- sion as in gas turbines and ramjets and (it) alternative propulsion as in piston engines.
The detonation regime of combustion offers a net advantage over classical combustion of very rapid energy releases (two or three orders of magnitude faster than deflagrations). This combustion regime can support very high mass flow rate and therefore appears as a promising combustion mode for propulsion, com- petitive to classical nondetonative propulsion systems in terms of efficiency and simplicity.
Depending on the flight velocity, detonation can be used both in steady propulsive mode and in unsteady alternative propulsive mode. Two concepts of detonation propulsion engines can be distinguished:
1. The detonation scramjet or ODWE (oblique detonation wave engine) where the flight Mach number is higher than the normal Chapman-Jouguet (CJ) Mach number of the detonative mixture used for propulsion [1, 2]. In that case, detonation is stabilized as a CJ standing oblique detonation wave which adjusts its inclination angle to the upstream Mach number. This engine is based on the very-high-intensity steady combustion mode with mass flow rate entering the engine higher than the normal detonation consumption mass flow rate (mCj), and is therefore highly hypersonic.
177

HIGH-SPEED DEFLAGRATION fc DETONATION
2. The pulsed detonation engine, or PDE, where the periodic ignition of det- onation takes place [3, 4]. The fresh mass flow rate (m) is at least one or two orders of magnitude lower than the normal detonation consumption mass flow rate (mCj). This mode of propulsion has the capability to work from zero Mach number to supersonic flight [5].
Obvious advantages of detonation over classical combustion mode are the following :
(i) energy release takes place in a narrow region and is quasicomplete;
(ii) because of a very rapid energy release, heat losses remain limited;
(iii) the expansion of the high-pressure detonation products into the atmosphere shows a larger conversion efficiency than constant-pressure combustion;
(iv) this expansion obeys self-similarity when the CJ detonation cell structure has a size well below the characteristic size of the detonation chamber, that is validated with experiments performed in intermediate scale (i.e., laboratory experiments);
(v) no moving part of precompression and no mechanism of recovery exist in the engine, except for the end thrust wall and nozzle.
In this paper, after the presentation of a brief review on the early research and the principle of PDE and its basic setup, the current key issues concerning the PDE operation are examined. Some guidelines suggested by previous com- putational and experimental research for further development of PDE are also presented.
2 REVIEW OF THE EARLY RESEARCH
The pioneering work on pulsed detonation engines (PDE) is attributed to Hoff- mann in 1940 [6]. Experiments were performed in a long narrow tube using acety- lene and benzene (liquid) oxygen mixtures. Detonation initiation was achieved by a spark plug and transition from deflagration to detonation. Only a narrow range of ignition frequencies governed by characteristic times of the phenomena was found, irrespective of the higher spark frequencies.
More than a decade later, the university of Michigan group headed by Nicholls started both single-cycle and multicycle PDE operation studies [3]. Fuel mixtures of hydrogen and acetylene with oxygen and air were tested. These constituted the two fuel-air mixtures which are most detonable. Oxidizer and fuel were continuously injected at the closed end of a detonation tube, open at the other
178

PULSED DETONATION ENGINES
Figure 1 Hydrogen-air intermittent detonation tube [4]
end (cf. Fig. 1). Ignition was achieved by spark plug at some distance from the injection plane.
In addition to flow rates and the inner wall temperatures, thrust was meas- ured (by a pendulum device) for varying frequency of ignition. The most in- teresting result was obtained for H2-air mixtures where a specific impulse of Isp = 2100 s was reached, at a maximum frequency of about 35 Hz. The inner wall temperature did not exceed 425 °C (800 °F). Attempts to obtain detonation initiation at the open end of detonation tube failed. A similar setup was used later by Krzycki [7], who performed experiments with propane-air mixtures up to 60 Hz. The predicted pressure history at the closed end of the tube indicated that detonation was probably not achieved in this setup. This led Krzycki to conclude that an intermittent detonation device was not a promising technique for propulsion.
A number of Russian works also occurred in that period on the use of pulsed detonation reactors devoted either to rock crushing or to metal oxides coat- ing [8, 9]. Reliable commercial devices based on intermittent detonation were then constructed. In 1986, Helman et al. [4] built a PDE demonstrator (Fig. 2) using a large tube containing C2H4-air mixture, where intermittent detonations were ignited by the detonation created by a spark plug in small diameter tube containing a rich C2H4-02 mixture. Periodically injected fuel mixed with self- aspirated air was detonated in the larger tube at a frequency of 25 Hz, limited by the fuel injection solenoid valve. This paper demonstrated particularly:
(i) the efficiency of fuel-oxygen predetonation to induce detonation in fuel-air mixtures in large volumes, and
(ii) the overexpansion following detonation product exhaust that can be used for air self-aspiration.
179

HIGH-SPEED DEFLAGRATION & DETONATION
Figure 2 PDE device [8]
Interest in these results was limited by the fact that, in fuel-air mixture, full detonation was not really achieved. Nevertheless, the measured specific impulse ranged from 1000 to 1400 s.
Numerical simulations on PDE ideal performances also began in this period. H2-air mixture pulsed detonations were simulated, with a detonation ignited at the closed end of a tube followed by a diverging nozzle. A potential specific impulse of 6500 s and operating frequency of 667 Hz were deduced [10].
A number of significant CFD analyses of PDE were performed by Eidelman and collaborators. They investigated numerically the interaction between the flow inside the cylindrical chamber and that of surrounding outside. It was indicated that properly configured PDEs (cylindrical chamber with air inlet) could provide fuel-efficient propulsion for large vehicles in the Mach 0.2-3 flight regimes [11, 5]. Since the fresh charge for the generic engine was supplied from the external flow field, the efficiency of the engine depended on the interaction of the surrounding flow with the internal flow dynamics. Planar detonation was assumed to be ignited at the open end and traveled towards the thrust wall (Fig. 3).
Eidelman attributed a higher propulsive efficiency, due to reflection of this detonation on the thrust wall, to that obtained if detonation was ignited at the thrust <vall. Moreover, in this configuration, the system could operate in a self-aspirating mode, air being entrained into the chamber by air inlets near the thrust wall. Based on similarity, it was predicted that thrust was scaled linearly with detonation chamber volume and operating frequency. It was also shown
180

PULSED DETONATION ENGINES
aerodynamic vehicle body
fuel and control systems
■ air inlet
thrust wail' fuel injectors
detonation chamber
• detonation shock wave
.primary detonation tube
Figure 3 PDE device [13]
that, because of the very short duration of the shock - thrust wall interaction, the presence of open air inlet would not decrease the thrust level.
Bussing and Pappas presented the basic operation of an ideal PDE (both in rocket and air-breathing engines) where initiation takes place at the thrust wall [12]. Eidelman extended the analysis to the nonideal detonation (transient detonation, nonplanar detonation) and concluded that differences of average value of thrust from ideal detonation remain small [13], which demonstrated clearly the robustness of the PDE concept. In that period, many contribu- tions about PDEs were presented at the annual AIAA/ASME/SAE/ASEE joint propulsion conferences.
Basic studies concerning DDT (Deflagration-to-Detonation Transition) and DDT enhanced by turbulence devices such as the classical Schelkin spiral have been performed and presented [14]. It was evidenced that a fully developed detonation wave was difficult to obtain in a short distance. The use of a very detonable mixture in small quantity in order to ignite detonation in fuel-air mixtures in PDE air-breathing engines (applied for the first time by Helmann et al.) was one of the main ways used to overcome the problem of detonability of fuel-air mixtures. Recent experimental research has been essentially devoted to demonstrate the feasibility of about 100 Hz fuel (C2H4-H2)-oxygen pulsed detonation (Sterling et al. [15], Bratkovich et al. [16]). Special interesting tech- niques were developed in the field of PDE's, as for instance the use of a rotary valve mechanism [17] on inlets for a two-tube combustor, allowing the function- ing with C2H4-air mixtures at a frequency of 40 Hz for each tube [18]. More recently, a valveless PDE rocket engine was operated at 100 Hz with C2H4-02
mixtures [19]. At the same time, the effect of nozzles of different shape were addressed computationally by Cambier and Tegner [20] and by Eidelman and Yang [21] who concluded that nozzles can drastically increase the propulsive efficiency of PDE.
181

HIGH-SPEED DEFLAGRATION fc DETONATION
3 THE PDE BASIC SETUP AND CYCLE
The PDE basic setup is a cylindrical combustion chamber (CC) of length L and inner diameter d, closed at one end by the thrust wall (TW) and open into the atmosphere (p = p0) at the other end (cf. Fig. 4). This chamber is associated with an aerodynamic vehicle situated ahead. On this chamber air inlets are con- sidered. The chamber may be filled completely or partially by a reactive mixture from the thrust wall. In the latter case, the part of the chamber unoccupied by the reactive mixture acts like a nozzle. Air inlets serve for PDE air-breathing engines. PDEs can be used also as a rocket engine. The flow inside the chamber is inherently unsteady and can be described by the PDE cycle as follows.
air inlet detonation front
\
detonation products
reactive charge
) \
\ thrust wall
(«)
/
air inlet detonation front
/ 1/
>
D 1 1 detonation
reactive charge I products
> K 1 \ thrust wall
w
Figure 4 Schematic of the PDE basic setup: (a) detonation initiation at the thrust wall; (b) detonation initiation at the open end
182

PULSED DETONATION ENGINES
The PDE cycle starts by filling the detonation chamber with a detonable mixture. The detonation is initiated in the chamber in differ- ent possible locations, summarized by generic location at the TW and at the open end (cf. Figs. 4a, 4b), providing detonations propagating in opposite directions. The thrust is produced by the action of the det- onation products in both cases on the TW. Examples of dimensionless overpressure AP measured at the TW (AP = Ap/pcj) vs. dimen- sionless time T (T = t/tcj, where *CJ = L/DCJ, -DCJ is the CJ deto- nation velocity; thus tcj is the det- onation propagation characteristic time inside the CC generally used as the scaling time) for the TW and open-end ignition are displayed in Fig. 5. The thrust T produced by the detonation can be obtained by different means:
(1) direct integration of the pressure over the projection of the engine surfaces on the plane normal to the flight direction,
Figure 5 Dimensionless overpressure vs. di- mensionless time for different positions of det- onation initiation: 1 — at the thrust wall; 2 — at the open end
no jm dS
(2) calculations of the unsteady thrust by integration at the nozzle exit (index e):
T(t) = meUe + (pe -pa)Se
(3) the global thrust measured on the engine by the ballistic pendulum method or other techniques (strength gages).
Mixture specific impulse Isp may be deduced from the average thrust T, obtained on each cycle:
■*sp — ==—
mg
where rh is the average mass flow rate during a cycle and g the gravity acceler- ation.
183

HIGH-SPEED DEFLAGRATION & DETONATION
4 SINGLE-CYCLE PROPULSIVE PERFORMANCE
Ideal propulsive performances (7sp, T) can be deduced from computa- tion and laboratory experiments on one PDE cycle at Mach number M = 0 [3, 22]. In small-scale ex- periments of characteristic size of 0.1 m, very stable direct quasi-CJ detonations can be obtained using readily detonable mixtures. The de- parture from the plane ideal det- onation due to wall reflections of a point-ignited detonation vanishes rapidly.
Based on the self-similarity of the expansion of the detonation products, ideal thrust and specific impulse for completely filled constant-section detonation cham- bers can be expressed in terms of
the CJ characteristics of the mixture used [23]. So thrust can be predicted by a simple scaling law based on chamber volume and frequency [5]. 7sp is nearly independent of the direction of propagation of the detonation as shown in Fig. 6 and is given by the following relationship:
Figure 6 Dimensionless impulse vs. dimen- sionless time for different positions of detona- tion initiation: 1 — at the open end; 2 — at the thrust wall
K *sp
gpoDcj PCJ
7+n 27 J
27/(7-1)
■Po
Here K is a constant of about 5.15, for conventional hydrocarbons and hydrogen- oxygen or air mixtures [24]. Application time of overpressure t+ on the TW is about 10<cJ and the negative pressure phase that follows, corresponding to overexpansion of the detonation products, ends at about 18-20<cJ- The neg- ative pressure phase serves to refill the chamber with fresh mixture by di- rect injection of fuel and oxidizer contained in pressurized tanks or with at- mospheric air by self-aspiration. The total dimensional time ttot, i.e., roughly 2CKCJ, that includes detonation propagation, exhaust of detonation products and aspiration of fresh gases, can be considered as the minimum PDE's cycle duration which depends linearly upon the characteristic length of the detona- tion chamber. Maximum detonation cycling frequency may then be defined on the basis of /max = 1/itot- It corresponds to maximum possible mass flow
184

PULSED DETONATION ENGINES
rate mmax. For a 1-meter detonation chamber length, the maximum allow- able frequency has been estimated at about 100 Hz for a DCi ~ 2 km/s deto- native wave [23]. In a general way, the filling time is much longer than the detonation products expansion time t+ and is therefore the limiting time of the phenomenon. Nevertheless, the thrust T being expressed by T ~ mlsp
or ~ flsp, high thrust needs high Jsp and also high mass flow rate (m) and for a chamber of fixed volume, a high cycling frequency /. Then, the min- imum cycle duration t+ associated to a given CC becomes a very important parameter (of the same order as the filling time) that influences drastically the PDE's thrust potential performance and has to be investigated systemat- ically.
For C2H4-O2 stoichiometric mixtures, Jsp is 200 s, if all the mass of the mix- ture is considered as in the rocket engine, and about 2270 s for C2H4-air mixtures in air-breathing engine configurations. H2-air presents very high specific impulse of about 4900 s.
Ejection of detonation products into the atmosphere from a completely filled cylindrical detonation chamber is sonic during a large part of the outer expansion of the detonation products [25]. Accordingly, an additional diverging nozzle of length / (with ß = l/L) may increase Isp by achieving supersonic ejection and a possible optimum expansion at the nozzle exit e', i.e., p' = pa.
Nevertheless this nozzle generally affects the time required for the pressure in the CC to drop to the atmospheric pressure at which time a fresh mixture can be injected. Indeed, the cycling time will be larger if the tube is long and if slow expansion takes place at the exit. Partially filled combustion cham- bers from the TW side, contributes to increase Isp by increasing the length of the nozzle of constant section [26, 27]. For example, if a cylinder of four times the CC length and of the same cross-section is placed after the chamber (ß = 4), Isp is increased by a factor of about 2. Nevertheless this contributes to lengthen t+ and then itot and the cycle duration and in the same way to reduce the maximum allowable cycling frequency by a factor larger than 2 [25]. In other respects, addition of a diverg- ing nozzle of a certain shape instead of a cylindrical nozzle permits a larger gain in Isp without modifying the maximum allowable cycling frequency of the CC alone [25]. This is an important re- sult concerning the use of diverging noz- zles.
The existence of air inlets for air- breathing engine modifies very little the computed propulsive performance of
air inlet , combustion chamber
i\ m z thrust wall exhaust surface
Figure 7 Schematic of the combustion chamber with air inlet
185

HIGH-SPEED DEFLAGRATION fc DETONATION
Figure 8 Dimensionless thrust-wall overpressure vs. dimensionless time without inlet (a = 0), and with inlet (a = 1). Detonation is initiated at the thrust wall (a) and at the open end (6)
Figure 9 Dimensionless impulse vs. dimensionless time without inlet (o - 0) and with inlet (a = 1). Detonation is initiated at the thrust wall (a) and at the open end (6)
the engine if the ratio of their area to the normal section of the detonation cham- ber (a) are below 20% [5]. This tendency has been observed experimentally. A decrease of only 25% on 7sp have been measured for an area ratio of 0.5, detonation initiation being achieved at the thrust wall or at the open end (cf.
Figs. 7 to 9) [28].
186

PULSED DETONATION ENGINES
5 MULTICYCLE PROPULSION PERFORMANCE PROBLEMS
For the reason of scarce experiments performed in the pulsed mode, in fuel- oxygen and less in fuel-air mixtures, many aspects of pulsed detonation propul- sion remain poorly understood or completely unsolved. An example of some re- sults obtained with a short detonation tube (L = 0.1 m, d = 0.05 m) show that pulsed operation of detonation engine at several hertz lowers slightly (20%-30% of loss) the performance if compared to the ideal engine. This is due essentially to a low value of L/d that induces an imperfect filling of the CC with fresh mixture (cf. Figs. 10a and 106).
A nonexhaustive list of several important issues which control the PDE per- formance can be established:
- the efficiency of self-aspiration at different flight regimes,
- the optimization of air inlets in subsonic and supersonic flights,
- the fuel-air (oxygen) mixing, correlated with the problem of fuel injection,
- the low energy fuel-air detonation initiation and fuel system,
- the thermal loading,
- the surrounding noise and vibrations.
Figure 10 Dimensionless trust-wall overpressure (a) and dimensionless impulse (6) vs. dimensionless time for different PDE operating frequencies: 1 — / = 0 Hz (single cycle); 2 — / = 2; and 3 — / = 5 Hz
187

HIGH-SPEED DEFLAGRATION & DETONATION
100
50
20
10
u g 1 Q
Q
0.5
0.2
'> 1) II
r v / z .it / / 0
im V / 0
- T '1 // V / mw a / o 7 H V / o / n A A/o / U \ A /O /
xu V . /o / x 1 XM \ A XO / o 2
x\\^/ • 5 \ X A 4
x\ o 5 x\ X X
v 6 \ X x ▼ 7 Vx x / + 5
O 9
0 12 3
Equivalence ratio, <j)
Figure 11 Variation of detonation cell size vs. equivalence ratio for different fuel- air compositions [29]: 1 — C2H2, 2, 3 — H2, 4 — C2H4, 5 — C2H6, 6, 7 — C3H8, 8 — C4H10, 9 — CH4 (open symbols cor- respond to smoked foil measurements, filled symbols — to pressure oscillation measure- ments). Solid curves correspond to the model X = Al (I is the induction length of the CJ detonation)
The majority of these issues have not been addressed systematically in the literature, and studies are yet to be developed. We particularly focus our attention on the detona- tion initiation which is a major is- sue for the practical PDE func- tioning.
For propulsion application of air-breathing PDEs, liquid fuel is required for weight and volume ef- ficiency reasons. The feasibility of this PDE powered by liquid fuel, owing the difficulties encountered by Brophy et al. [29] to detonate JP-10-air mixtures, has to be dem- onstrated. Clearly, heavy hydrocar- bon (i) gas as straight-chain alkanes and (ii) liquid or spray as hexane, heptane, octane, decane, JP-4 va- por and benzene for which the va- por pressure is sufficiently high at normal conditions to form with air explosive mixtures, are very diffi- cult to detonate. The detonabil- ity scaling factor depends on the CJ detonation cell size ACJ of the mix- ture which is typically 40-60 mm [30] to [32] (cf. Fig. 11). Then the ratio of the detonation chamber characteristic length (diameter) to the cell size does not exceed 4 to 10. The direct initiation of such mix-
tures requires an initiating source of very high energy (or explosion length), out of the scope of the PDE, the critical energy being estimated by Ec ~ APODQJXQJ [33]. DDT lengths for the same mixtures are at least few meters. For instance, 3 m of flame propagation in a tube of inner diameter d — 0.15 m filled with periodic obstacles of blockage ratio BR = 0.49 are needed for DDT in C3H8- and CeH6-air stoichiometric mixtures [16].
At least, one initiation scheme can overcome the hydrocarbon-air detona- tion initiation energy requirements. It is based on a two-step initiation process, namely the use of an additional fuel-oxygen mixture contained in a tube of small diameter and initiated by a source of very low energy (repetitive sparks used in
188

PULSED DETONATION ENGINES
motor car technology) which can detonate by the DDT mechanism with a short DDT length using periodic obstacles such as Schelkin spiral [34]. The DDT intro- duces a delay which is "acceptable" only in fuel-oxygen mixtures and probably not even in very sensitive fuel-air detonation systems (as H2-air, for instance). Once the detonation is produced in the small tube, the successful transmission of this detonation into the larger volume containing the less energetic and less detonable fuel-air mixture is possible.
Detonation transmission from the small tube to the chamber is easier if used alone or combined with:
(1) local focalization devices,
(2) multiple transmission points with focalization,
(3) a special design which ensures smooth transition.
The basic ideas that support these techniques are the following:
(1) overdriven detonations are known to be transmitted with reduced critical tube diameter [35],
(2) transmission of detonation from a tube into larger volume is enhanced by placing a central circular blockage (blockage ratio of 50%) which creates implosion followed by an intense explosion [36],
(3) an adapted diverging cylinder reducing expansion between the two media helps to obtain successful transmission [37].
Presence of composition gradient in the sense of more energetic to less energetic mixture can help detonation initiation and transmission [38]. It requires tailored injection. These points have not been addressed systematically.
The problem of liquid fuel detonation with air in CC is not yet solved. Up to now, it seems, mixtures with air of available fuels only cannot provide solution to this problem. An approach there is to use fuel blends [39], and the addition of a detonation promotor (mixed in the chamber with the main fuel and air, before detonation).
6 CONCLUDING REMARKS
Many investigations have been devoted to PDEs as they represent future propul- sion devices based on the intrinsic advantage of detonation over deflagration combustion. This devices represent one of the natural extensions of many fun- damental studies of detonation over the two recent past decades into practice. Although the energetics of detonation products may be easily predicted, con-
189

HIGH-SPEED DEFLAGRATION & DETONATION
ditions of repetitive detonations in liquid fuel-air systems represent a challenge up to now. Both carefully integrated computations and benchmark experiments can help to define the contour of PDE's application field.
REFERENCES
1. Pratt, D.T., J.W. Humphrey, and D.E. Glenn. 1987. Morphology of a standing oblique detonation wave. AIAA Paper No. 87-1785.
2. Adelman, H.G., J.L. Cambier, G. P. Menees, and J.F. Balboni. 1988. Analytical and experimental validation of the oblique detonation wave engine concept. AIAA Paper No. 88-0097.
3. Nicholls, J.A., H.P. Wilkinson, and R. B. Morrison. 1957. Intermittent detonation as a thrust-producing mechanism. Jet Propulsion 27(5):534-41.
4. Helman, D., R. P. Shreeve, and S. Eidelman. 1986. Pulsed detonation engine. AIAA Paper No. 86-1683.
5. Eidelman, S., and W. Grossmann. 1992. Pulsed detonation engine: Experimental and theoretical review. AIAA Paper No. 92-3168.
6. Hoffman, H. 1940. Reaction propulsion by intermittent detonative combustion. Ministry of Supply, Volkenrode Translation.
7. Krzycki, L. J. 1962. Performance characteristics of an intermittent-detonation de- vice. NAVWEPS Report 7655.
8. Smirnov, N.N., and A. P. Boichenko. 1986. Deflagration-to-detonation transition in gasoline-air mixtures. Combustion Explosion Shock Waves 22(2):65-67.
9. Klimenko, V.S., V.G. Skadin, and A.L. Borisova. 1979. A method of monitoring the detonation deposition of coating. Sov. J. Powder Metallurgy 196(4):72-73.
10. Cambier, J. L., and H. G. Adelman. 1988. Preliminary numerical simulation of a pulsed detonation wave engine. AIAA Paper No. 88-2960.
11. Eidelman, S., W. Grossmann, and I. Lottati. 1990. Air-breathing pulsed detonation engine concept: A numerical study. AIAA Paper No. 90-2420.
12. Bussing, T.R. A., and G. Pappas. 1994. An introduction to pulse detonation en- gines. AIAA Paper No. 94-0263.
13. Eidelman, S., X. Yang, and Z. Lottati. 1995. Pulsed detonation engine: Key Issues. AIAA Paper No. 95-2754.
14. Hinkey, J.B., T.R. A. Bussing, and I. Kaye. 1995. Shock tube experiments for the development of a hydrogen-fueled pulse detonation engine. AIAA Paper No. 95-
2578. 15. Sterling, J., K. Ghorbanian, and T. Sobota. 1996. Enchanced combustion pulsejet
engines for Mach 0 to 3 applications. AIAA Paper No. 96-2687. 16. Bratkovich, T.E., M.J. Aamio, J.T. Williams, and T.R. A. Bussing. 1997. An
introdution to pulse detonation rocket engines (PDREs). AIAA Paper No. 97-2742.
17. Bussing, T.R. A. 1995. A rotary-valve multiple pulse detonation engine. AIAA Paper No. 95-2577.
190

PULSED DETONATION ENGINES
18. Hinkey, J.B., S.E. Henderson, and T.R. A. Bussing. 1998. Operation of a flight- scale rotary-valve, multiple combustor, pulse detonation engine (RVMPDE). AIAA Paper No. 98-3881.
19. Zitoun, R. and D. Desbordes. 1999. Private communications.
20. Cambier, J.-L., and J.E. Tegner. 1998. Strategies for pulsed detonation engine performance optimization. J. Propulsion Power 14(4):489-98.
21. Eidelman, S., and X. Yang. 1998. Analysis of the pulse detonation engine efficiency. AIAA Paper No. 98-3877.
22. Zitoun, R., V. Gamezo, C. Guerraud, and D. Desbordes. 1997. Experimental study on the propulsive efficiency of pulsed detonation engine. 21st Symposium (Inter- national) on Shock Waves 1:421-25.
23. Zitoun, R., and D. Desbordes. 1999. Propulsive performances of pulsed detonations. Combustion Science Technology 144:93-114.
24. Zitoun, R., E. Daniau, and D. Desbordes. 2001 (in press). Shock Waves. (Presented at 17th ICDERS. 1999.)
25. Daniau, E., R. Zitoun, C. Couquet, and D. Desbordes. 2001. Effects of nozzles of different length and shape on the propulsion performance of pulsed detonation engines. In: High-speed deflagration and detonation: Fundamentals and control. Eds. G. D. Roy, S. M. Frolov, D. W. Netzer, and A. A. Borisov. Moscow: ELEX-KM Publ. 251-62.
26. Zhdan, S.A., V. V. Mitrofanov, and A.I. Sychev. 1994. Reactive impulse from the explosion of a gas mixture in a semi-infinite space. Combustion Explosion Shock Waves 30(5):657-63.
27. Zitoun, R., and D. Desbordes. 1998. Effect of a nozzle on PDE performances. 27th Symposium (International) on Combustion Proceedings. Boulder, CO.
28. Zitoun, R., C. Guerraud, and D. Desbordes. 1996. Rapport de Synthese du contract 95/057, DGA/LCD.
29. Brophy, C, D. Netzer, and D. Forster. 1998. Detonation studies of a JP-10 with oxygen and air for pulse detonation engine development. AIAA Paper No. 98-4003.
30. Tieszen, S.R., D.W. Stamps, O.K. Westbrook, and W. J. Pitz. 1991. Gaseous hydrocarbon-air detonations. Combustion Flame 84:376.
31. Knystautas, R., C. Guirao, J. H. S. Lee, and A. Sulmistras. 1984. Measurement of cell size in hydrocarbon-air mixtures and prediction of critical tube dimeter, critical initiation energy and detonability limits. In: Dynamics of shock waves, explosions, and detonations. Eds. J.R. Bowen, N. Manson, A.K. Oppenheim, and R. I. Soloukhin. Progress in astronautics and aeronautics ser. New York, NY: AIAA Inc. 94:23-37.
32. Knystautas, R., J. H. S. Lee, J. E. Shepherd, and A. Teodorczyk. 1998. Flame accel- eration and transition to detonation in benzene-air mixtures. Combustion Flame 115:424-36.
33. Benedick, W. K., C. Guirao, R. Knystautas, and J.H.S. Lee. 1986. Critical charge for the direct initiation of detonation in gaseous fuel-air mixture. In: Dynam- ics of explosions. Eds. J.R. Bowen, J.-C. Leyer, and R.I. Soloukhin. Progress in astronautics and aeronautics ser. Washington, DC: AIAA Inc. 106:181-202.
191

HIGH-SPEED DEFLAGRATION fc DETONATION
34. Lee, J.H.S. 1986. On the transition from deflagration to detonation. In: Dynam- ics of explosions. Eds. J.R. Bowen, J.-C. Leyer, and R.I. Soloukhin. Progress in astronautics and aeronautics ser. Washington, DC: AIAA Inc. 106:3-18.
35. Desbordes, D., and M. Vachon. 1986. Critical diameter of diffraction for strong- plane detonation. In: Dynamics of explosions. Eds. J.R. Bowen, J.-C. Leyer, and R.I. Soloukhin. Progress in astronautics and aeronautics ser. Washington, DC: AIAA Inc. 106:131-43.
36. Moen, I. O., A. Sulmistras, G. O. Thomas, D. Bjerketvedt, and P. A. Thibault. 1986. Influence of cellular regularity on the behavior of gaseous detonation. In: Dynam- ics of explosions. Eds. J.R. Bowen, J.-C. Leyer, and R.I. Soloukhin. Progress in astronautics and aeronautics ser. Washington, DC: AIAA Inc. 106:120-43.
37. Thomas, CO., D.H. Edwards, J.H. Lee, R. Knystautas, I.O. Moen, and Y. M. Wei. 1986. Detonation diffraction by divergent channels. In: Dynamics of Explosions. Eds. J.R. Bowen, J.-C. Leyer, and R.I. Soloukhin. Progress in astro- nautics and aeronautics ser. Washington, DC: AIAA Inc. 106:144-54.
38. Desbordes, D., and A. Lannoy. 1989. Effects of a negative step of fuel concentration on critical diameter of diffraction of a detonation. In: Dynamics of detonations and explosions: Detonations. Eds. A.L. Kuhl, J.-C. Leyer, A.A. Borisov, and W. A. Sirignano. Progress in astronautics and aeronautics ser. Washington, DC: AIAA Inc. 133:170-86.
39. Frolov, S.M., V.Ya. Basevich, A.A. Belyaev, and M.G. Neuhaus. 1999. Applica- tion of fuel blends for controlling detonability in pulsed detonation engines. In: Gaseous and heterogeneous detonations: Science to applications. Eds. G. D. Roy, S.M. Frolov, K. Kailasanath, and N.N. Smirnov. Moscow: ENAS Publ. 313-30.
192

ON FACTORS CONTROLLING THE PERFORMANCE
OF PULSED DETONATION ENGINES
K. Kailasanath, G. Patnaik, and C. Li
The pressure history at the head end of an idealized pulsed detonation engine that is a tube closed at one end and open at the other is used to identify various factors that control the performance of the engine Three major stages have been identified in the time history of the pressure The first stage is dominated by the method used to initiate the detonation and could vary significantly from one experimental setup to another or from simulation to simulation. The second stage is primarily controlled by the detonation parameters of the mixture considered and is therefore insensitive to variations in methodology. The third stage mainly depends on the relaxation process at the end of the detonation tube. It has been shown that by suitably tailoring the relaxation process, significant gains can be obtained m the overall performance.
1 INTRODUCTION
Pulsed detonation engines (PDEs) have received considerable attention dur- ing the past decade and significant progress has been made in their develop- ment [1, 2]. The basic operation of the PDE and the history of its development have been covered in these review articles as well as other papers and will not be discussed here. The focus of this paper is on the performance of PDEs. This is also a topic that has received some attention from the early days since the ad- vantages claimed for the PDE for various applications depend on the estimated performance.
In one of the earliest studies of the pulsed detonation engine concept, Nicholls et al. [3], presented an analytical model for the performance and used it to es- timate the specific impulse (7sp) of acetylene and hydrogen fueled detonation
193

HIGH-SPEED DEFLAGRATION fc DETONATION
engines. They also conducted preliminary experiments that produced specific impulses of over 2100 s for a hydrogen-air mixture and noted that the experi- mental results were "in good agreement with the predicted performance." Since then, there have been several studies on the performance of PDEs [4-11], but the performance estimates have tended to vary from 1100 s to 8000 s for a stoi- chiometric hydrogen-air mixture.
Bratkovich and Bussing [4], revisited the analytical model of Nicholls et at. [6] and proposed a new model. Their model predicted an impulse that was about 40% larger than that predicted and measured earlier. Again, it was noted that the new predictions were in good agreement (±3%) with their experimental
data [4]. In an unrelated work, Zhdan et al. [5, 6], measured the impulse produced by
a gas detonation in a cylindrical chamber and compared it to results of their two- dimensional numerical simulations. They noted that the calculated thrusts and specific impulses were nonmonotonic functions and the minimum and maximum impulses differed by as much as 13%. More notably, the mean of the calculated values was lower than the experimentally measured values by 15%-25%. A limiting (maximum) specific impulse value of 689 s was also calculated for a stoichiometric acetylene-oxygen mixture.
A similar experimental setup was built by Zitoun et al. [7] who also extended previous analytical approaches to develop a simple theoretical model to account for their experimental observations. The observation that the predicted and measured performances agree reasonably well but appear to be different in dif- ferent studies suggests that some underlying factors that control the performance may be different in the various studies.
There have also been a number of purely computational studies of the per- formance of idealized PDEs, closed at one end and open at the other [8-11J. A review [10] of these computational studies shows that there is a wide varia- tion in the predicted performance with estimates ranging from 3000 to 8000 s for the specific impulse of even a stoichiometric hydrogen-air system. In that work, detailed numerical simulations were used to provide an explanation for the differences in the performances predicted using one-dimensional numerical simulations. The explanation dealt with the specific choice of the numerical boundary condition used at the exit plane in one-dimensional simulations of the PDE The physical impact of the different boundary conditions used is to change the rate of relaxation of the pressure at the exit of the PDE tube. This in turn changes the time history of the pressure at the head-end of the tube and hence the thrust and other performance measures. Therefore, the rate of relaxation of the pressure near the exhaust end of the PDE can be identified as one of the factors tha', control the performance.
The objective of this paper is to discuss this and other factors that may control the performance of PDEs and than present the results of a computational study on the effect of some of these factors on the performance.
194

PULSED DETONATION ENGINES
2 PERFORMANCE ESTIMATES OF A PDE
1000
A fundamental reason for investigating PDEs is the higher thermodynamic ef- ficiency of a detonation cycle when compared to the constant pressure and the constant volume cycles. The higher efficiency is primarily due to the higher pressures attained during the detonation cycle. The pressure at the Chapman- Jouguet (CJ) point is a characteristic parameter of any self-sustained detonation and would appear to be an important parameter in determining the performance. However, consider first the time history of the pressure at a cou- ple of locations from the numeri- cal simulation of an idealized PDE that is a 20 cm long tube closed at one end and open to the atmo- sphere at the other. The tube is initially filled with a premixed stoi- chiometric hydrogen-air mixture and a detonation is initiated near the closed end (head-end) of the tube. More details of the numerical simulation will be discussed later. Figure 1 shows the pressure history at a location 10 cm from the closed end. The pressure is constant at 1 atm (the initial condition) un- til the detonation which was ini- tiated near the closed end arrives at this location around 48 ^s (from the start of the calculation). It abruptly increases to the value behind the det- onation front and then decreases rapidly to a relatively constant value between 5 and 6 atm. This value is reached around 140 /zs and lasts until about 220 fis when the expansion waves from the open end of the tube arrive at this loca- tion and begin to decrease the pressure. By 700 fis, the pressure at this lo- cation has gone below the initial value of 1 atm. From this figure, clearly it is difficult to pick a single value for the effective detonation pressure and time duration.
Since the thrust and other performance measures are usually calculated from the history of the pressure at the head-end of the tube, this parameter is shown in Fig. 2. The initial high pressure depends on the method used to initiate the detonation. Here, a high-pressure and high-temperature driver is used. When the calculation is initiated, a shock moves towards the open end and expansion waves move toward the closed end. Energy release behind the shock quickly catches up with the shock forming a detonation. The transient effects of the
Figure 1 Pressure history at a location 10 cm from the head-end (closed end) of a 20 cm long PDE operating on a stoichiometric hydrogen-air mixture
195

HIGH-SPEED DEFLAGRATION & DETONATION
1000 1500 2000
f/us
Figure 2 Pressure history at the head- Figure 3 Time history of the impulse end of a 20 cm long PDE operating on a (per unit area) from the simulation of a stoichiometric hydrogen-air mixture 20 cm long PDE operating on a stoichio-
metric hydrogen-air mixture
initiation and the transition to detonation are seen to last nearly 100 fis when the pressure at the head-end settles to a value nearly steady at 5.8 atm. This "plateau" in the pressure history lasts until about 330 /is when the expansion waves from the open end of the tube arrive at the head-end and begin to decrease the pressure. The pressure falls below the 1-atmosphere level around 630 ßs.
Since these results were obtained from one-dimensional simulations, the dif- ference between the head-end pressure and the ambient pressure gives the thrust per unit area and the time integral of this quantity will give the impulse. This calculation has been done and the results are shown in Fig. 3. Note that the impulse rapidly rises to a value of about 60 N-s/m2 in the first 10 //s. This is a direct consequence of the high-pressure driver used to initiate detonations in the simulations. The impulse reaches a value of about 90 N-s/m2 by about 100 (is and then increases nearly linearly to about 200 N-s/m2 by 330 /is. The first peak of 245 N-s/m2 is reached at 630 /is, when as noted earlier, the head-end pressure reaches the 1-atmosphere mark. Then, the impulse decreases because the pressure at the head end of the tube goes below the ambient value and at- tains a minimum of about 225 N-s/m2 before increasing again. It increases again because when the pressure within the tube goes below the ambient value, the gases outside are at a higher pressure and rush into the tube creating new com- pression waves which increase the pressure. In some cases (as shown in Fig. 4), a secondary shock is created by these incoming gases. The presence of a maximum and minimum value for the impulse has been noted earlier by Zhdan et al. [5]. More recently, others have also observed this behavior in both experiments and calculations.
196

PULSED DETONATION ENGINES
Based on the above discussion and a closer look at the history of the head-end pressure one can di- vide the time history into three dis- tinct stages or regions: initiation, plateau and relaxation. The first stage is dominated by the method used to initiate the detonations and to some extent the details of the transition process. Therefore, it is problem dependent and depends on the details of the particular ex- perimental or numerical set-up and the specific test conditions. The ef- fects of the initial conditions used in the numerical simulations can be reduced by considering longer sys- tems using the same initiator as well as lower initiation energies. Attention is usually focused on the second, the plateau region or stage. For the case discussed above, the contribution to the impulse from the plateau region (from about 100 to 330 //s) is the largest (45%). The third stage describes the relaxation of the plateau pressure to the ambient value and is one of the key factors focused in this pa- per. It again depends on the details of the experimental or numerical system configuration.
If the contributions from the initiation and relaxation stages are neglected, we can estimate the performance using just the plateau pressure. For example', Nicholls et al. [3] assumed that the pressure at the head-end went instantaneously to the ambient value once the rarefaction waves reached the head-end. Con- verting the impulse obtained during the plateau region in the case discussed above, into fuel-based Isp gives an 7sp increase of about 2000 s from the plateau region, a value close to that predicted by Nicholls et al. [3]. But this clearly results in significantly underestimating the performance.
2000
Figure 4 Time history of the head-end pres- sure for three different exit boundary condi- tions: 1 — very gradual pressure relaxation, 3 — abrupt relaxation to constant pressure at tube exit, and 2 — intermediate relaxation rate. For all cases, a 20 cm long PDE tube filled with a stoichiometric hydrogen-air mix- ture was simulated
3 ESTIMATING THE "PLATEAU" PRESSURE FACTOR
From the above discussion it is clear that the near constant pressure (referred to here as the "plateau" pressure) and its duration are important factors determin-
197

HIGH-SPEED DEFLAGRATION fe DETONATION
ing the performance. The plateau pressure is also referred to as the P3 pressure, where Pi would correspond to the ambient pressure ahead of the detonation and P2 would correspond to the pressure at the CJ plane. Using this nomenclature and following the derivation given by Nicholls et al. [3] for estimating the pa- rameters of a detonation wave travelling in a long tube, the P3 pressure can be
written as:
Pz = Pi i T 272/(72-1)
72 — l- !_I£_lM
where P2 is the CJ detonation pressure, M2 is the Mach number of the burned products in the laboratory frame of reference, and 72 is the ratio of specific heats at the CJ conditions. Several simplifying assumptions have been made in arriving at this expression, including a two-7 formulation and that the detonation products are frozen in composition and expand isentropically to rest at the closed end of the tube. Using the parameters from a CJ detonation calculation for a stoichiometric hydrogen-air mixture, the value of 5.93 atm is obtained which is close to the value obtained in the detailed numerical simulations, considering the simplifying assumptions made in the above derivation.
Estimating the time over which the pressure is constant is a little more diffi- cult since it would depend on system parameters such as the length of the tube, the mixture properties and indirectly the effect of the initiator. Certain limiting values can be estimated. For example, if the detonation were initiated instanta- neously and the pressure at the wall were to go to the plateau value immediately, then the effective time, <eff would be given by:
tefi = ID + is
where tD is the time it takes the detonation to travel to the end of the tube {LIDa) and t, is the time it takes the front of the expansion fan to come back to the head end of the tube (L/as), L is the length of the tube, and Da and a, are the detonation velocity and the sound speed in the burned mixture. Calculating this effective time for the case discussed above gives a value of 285 fts. Arriving at a lower limit is more difficult without further assumptions. Rather than being instantaneous, if the initiation process was slow (e.g., in a DDT process) and a detonation was to form only by the end of the tube with the pressure at the head- end reaching the plateau value only at the time the detonation front reached the end of the tube, then the effective time would be given by:
teft — is
For the specific case discussed above, this corresponds to a value of 183 /is. Because a finite time was needed to form a detonation and establish the
plateau pressure, in the actual simulations discussed before, the effective time was about 230 fis, a value between the two limits calculated above.
198

PULSED DETONATION ENGINES
Another key factor in the previous discussion was the rate at which the pressure relaxes towards the ambient value. The effect of this factor can be un- derstood by considering a series of one-dimensional numerical simulations where the pressure at the exit plane of the tube is prescribed to relax to the ambient value at different rates. Before further discussion of this factor, it is instructive to first briefly discuss the computational approach.
4 THE NUMERICAL MODEL
The computational approach adopted is to solve the compressible, time- dependent, reactive flow conservation equations for the density, momentum, total energy and the number densities of individual species. The terms in the con- servation equations representing the different physical and chemical processes are solved separately and coupled using timestep splitting techniques [12] This procedure allows the individual processes to be integrated by appropriate and efficient techniques, and also permits the easy substitution and elimination of different submodels for the individual processes, as needed for specific applica- tions. For the short duration, single-cycle simulations discussed in this paper the diffusive and thermal processes will have a negligible effect and hence only the convective flow with chemistry is considered.
For the high-speed reactive flows that are typical of detonations, an explicit algorithm such as the Flux-Corrected Transport (FCT) [13] is very efficient and accurate for integrating the fluid convection. FCT is a conservative, monotonic algorithm with fourth-order phase accuracy. With various initial and boundary conditions, this algorithm has been used previously to solve a wide variety of problems involving detonations.
Results from both one-dimensional and two-dimensional simulations are presented m this paper. For the one-dimensional simulations, a comprehen- sive model for hydrogen combustion with 8 species and 48 reactions is used The reaction set is solved at each timestep with CHEMEQ, an integrator for stiff ordinary differential equations [14]. For the two-dimensional simulations, a two-step global reaction model and domain decomposition methods are used [15].
In order to ensure adequate numerical resolution in the one-dimensional simulations, initially a computational grid size of 0.002 cm was used result- ing m 10,000 computational cells for a 20 cm long tube. After the passage of the detonation from the tube, the grid size was gradually increased. As men- tioned earlier, the detonation was initiated by using a high-pressure and high- temperature driver section. The effect of the initial conditions will be discussed later. First attention is focused on the open boundary conditions at the exit of the tube.
199

HIGH-SPEED DEFLAGRATION h DETONATION
4.1 Open Boundary Conditions
Boundary conditions at open boundaries are a challenging problem in numer- ical simulations when the flow is subsonic because physically, the flow inside the domain can respond to changes outside. There is no general solution to this problem since it depends on the specific experimental configuration and the physical conditions one is attempting to mimic. Experiments show that there are differences depending on whether a detonation tube is connected to a larger diameter tube or a large dump tank [16]. Numerically, for the ideal- ized straight-tube PDE, this reduces to the specification of the location at which the pressure becomes atmospheric. Therefore, several choices for the boundary condition have been tried and their effect on the flow field and performance
evaluated. , , For the cases discussed here, a boundary condition implementation based
on the method of characteristics is used. This ensures that no constraints are imposed on the flow quantities when the outflow is supersonic and enforces the required constraints when the flow becomes subsonic. Even in this formulation, there is a free parameter in the subsonic case that needs to be specified. Various choices for this parameter result in different rates of relaxation for the pressure at the open boundary. One limit is for the pressure to abruptly go to the ambient value at the exit plane. This was the choice used in the simulations discussed earlier and shown in Figs. 1-3. Other choices for this parameter that result in a more gradual relaxation of the pressure to the ambient value will be discussed
next.
4.2 Effects of pressure relaxation
The pressure history at the head-end for three cases (including the one already discussed) are shown in Fig. 4. The time evolution of the pressures for the three cases are identical until about 330 fis because the detonation initiation parameters and mixture conditions are identical for the three cases. They be- gin to differ only when the expansion waves from the open end of the tube reach the head-end. The strength of the expansion waves is different because of the differences in the relaxation process at the open end of the tube. For the slow relaxation process (which has an effectively long relaxation length), the pressure reaches the 1-atmosphere mark only by about 2 ms while for the fast relaxation process it reaches that mark by about 630 /is. Clearly, this could have a significant impact on the thrust and impulse since these param- eters depend directly on the difference between the head-end pressure and the ambient pressure. As seen in Fig. 5, the impulses for the three cases are iden- tical until the effects of the relaxation process at the open end are felt at the
head-end.
200

PULSED DETONATION ENGINES
Then, the impulse histories are very different, attaining a maxi- mum value of about 390 N-s/m2
for the slow relaxation condition at about 2 ms. This peak value is 60% larger than for the fast relax- ation condition and translates into a similar increase in the fuel-based 7sp. These results, along with those presented earlier [10] clearly indi- cate that the pressure relaxation process at the exhaust end of the PDE tube is an important factor in determining the performance. In practice, different relaxation rates may be attained by suitably tailor- ing the nozzle shape. Next the ef- fect of initial conditions on the per- formance are discussed.
Figure 5 Time history of the impulse (per unit area) for three different exit boundary conditions. See the caption for Fig. 4 for de- tails
4.3 Detonation Initiation
The manner in which the detona- tion is initiated will affect the head- end pressure history and hence the performance. If a DDT process is involved, the head-end pressure will be low initially and than rise gradually to the P3 value. However, if direct initiation using a high- pressure driver is used, the head- end pressure is significantly larger than the P3 value initially and then drops down to this value after go- ing through a transition during which it could go below the P3
value as seen in Fig. 2 and 4. The impact of using the high-pressure driver (which is typically used in numerical simulations) has been further highlighted in Fig. 6, where
3
I
*fUU
2,'"
300 / 3
200 /
1 / 1 /
100 1 r* l
n /, . . i ■ , 0 75 150 225 300
t/\xs
Figure 6 Effects of initial conditions high- lighted using the impulse histories from (i) a simulation with no chemical reactions and (2) a simulation with chemical reactions. The dif- ference between the impulse values for the two cases is shown as (3)
201

HIGH-SPEED DEFLAGRATION fc DETONATION
the calculated impulse from two simulations and their difference are shown. Both simulations are for a slow relaxation process at the exit end of the PDE but in one of them, the chemical reactions and energy release are suppressed (nonreactive). Thus, the impulse from the blow down process due to the high- pressure driver is calculated in this case. This impulse is a significant fraction (27%) of the total impulse from the PDE using this initiator. The initiator used for this simulation is by no means an optimal one and the effect of the initiator will decrease when longer systems or lower-energy initiators are con-
sidered.
200 300 t/\is
500
4.4 Effects of Partial Fill
As discussed earlier, the plateau pressure can be estimated from the CJ detonation parameters . of the specific mixture and ini- tial conditions. Therefore, an- other technique for modifying the time evolution of the pres- sure would be to vary the mix- ture along the length of the tube. A special case of this tech- nique would be to partially fill the tube with the fuel-air mix- ture and fill the rest of the tube with an inert gas such as air.
A series of two-dimensional simulations [15] have been con- ducted in which a 50 cm long tube is filled with a stoichiomet- ric ethylene-air mixture to var- ious fill lengths. Figure 7 shows the time history of the impulse
for various cases. An interesting observation is that the impulse is not propor- tional to the amount of fuel fill. When the degree of fill is decreased from 100% to 20%, the peak impulse decreases from 604 to 381 N-s/m2. That is a decrease of only 37%. Detailed analysis of these multidimensional simulations, discussed by Li et al. [15], shows that the reason for this result is due to the presence of two different sets of expansion waves, one from the fuel-air interface and the other from the exit-end of the tube. When these different sets of expansion waves reach the thrust wall, the pressure decays at different rates because the strength
of these expansion waves is different.
Figure 7 Effects of partial filling on the impulse histories from a series of two-dimensional simula- tions of a 50 cm long PDE exhausting into a very large chamber. The section of the PDE filled with a premixed ethylene-air mixture was varied from: 1 — 10 cm, 2 — 20, 3 — 30, 4 — 40, and 5 — 50 cm
202

PULSED DETONATION ENGINES
1000 2000 3000 f/us
Figure 8 Effects of partial filling on the time history of the head-end pressure. See the caption for Fig. 7 for details
The time evolution of the pressure for the various cases is shown in Fig. 8. The two differ- ent rates of relaxation are clearly evident in this figure. This result has several implications. It pro- vides a means of controlling the thrust by controlling the amount of fuel-air fill in the detonation chamber. Furthermore, it sug- gests that a significant perform- ance drop may not occur if dur- ing multicycle operations, the tube is not filled completely.
There is also the intriguing possibility of enhancing the per- formance by using by-pass air during the flight. One can envi- sion a situation where the tube is filled only partially with the fuel- air mixture and by-pass air from the outside is used to fill the rest of the tube. When the detona- tion reaches the air in the tube, it will degenerate into a shock wave but compression of the air by this shock wave will provide addi- tional thrust and impulse (as dis- cussed above). This enhanced performance has been attained without any additional fuel. Of course, there is a cost for intro- ducing the by-pass air into the tube that must be taken into ac- count.
These simulations can also be viewed as a special method for tailoring the pressure relaxation process at the end of the fuel-air zone. To illustrate this point, the time histories of the head-end pressure from two simulations are shown in Fig. 9. In both simulations, the width of the 2D channel and the length of the fuel-air mixture zone are the same. The only difference is the length of the tubes which is increased from 20 to 50 cm for one
200
Figure 9 Comparison of the head-end pressure histories from the simulations of: (J) a 50 cm long PDE filled with a 20 cm long section of ethylene-air mixture and (2) a 20 cm long PDE filled completely with the same ethylene-air mix- ture
203

HIGH-SPEED DEFLAGRATION & DETONATION
of the simulations. The extension length, effectively resulting in a "straight" nozzle, increases the impulse and Isp by about 37%.
The improved performance due to partially filling the tube has been experi- mentally demonstrated by Zhdan et al. [5, 6] and more recently by Hanson et al. [17]. Numerical simulations have also shown similar results although the explanations presented are different [9, 11]. It must be noted that the improved performance is attained because the two systems are considered for air-breathing operation. If the total amount of fuel and air mixtures in the two tubes are taken into account, the shorter tube does have a significantly better mixture-based Jsp
than the longer tube that is partially filled with air.
5 CONCLUDING REMARKS
In this paper, a new perspective on factors that control the performance of PDEs was obtained by taking a closer look at the history of the pressure at the head- end of a straight PDE tube. Three major stages have been identified in the pressure history.
The first stage is dominated by the method used to initiate the detonation and could vary significantly from one experimental setup to another or from one simulation to another.
The second stage is primarily controlled by the detonation parameters of the mixture considered and is therefore insensitive to variations in methodology. By reducing the influence of the first stage (for example, using easily detona- ble mixtures and longer systems), more general performance estimates may be obtained.
The third stage is the most intriguing and appears to have received less emphasis in the past. This is the relaxation process at the end of the detonation tube.
It has been shown that by suitably tailoring the relaxation process, significant gains can be obtained in the overall performance. Some previous studies on exhaust nozzle shapes [8, 9] have indeed shown that system performance depends on the specific choice of the nozzle. However, the reported gains are not as large as shown possible here and therefore further investigations of this factor, especially experimental are warranted.
ACKNOWLEDGMENTS
This work has been sponsored by the Office of Naval Research through the Mechanics and Energy Conversion Division and the Naval Research Laboratory.
204

PULSED DETONATION ENGINES
Computer time was provided by the DoD HPCMO through the DoD Shared Resource Centers.
REFERENCES
1. Eidelman, S., W. Grossmann, and I. Lottati. 1991. Review of propulsion applica- tions and numerical simulations of the pulse detonation engine concept. J. Propul- sion Power 7(6):857-65.
2. Kailasanath, K. 1999. Applications of detonations to propulsion: A review AIAA Paper No. 99-1067. 37th AIAA Aerospace Sciences Meeting and Exhibit Proceed- ings. (Also see 2000. AIAA J. 38(9)).
3. Nicholls, J.A., H.R. Wilkinson, and R. B. Morrison. 1957. Intermittent detonation as a thrust-producing mechanism. Jet Propulsion 27(5):534-41.
4. Bratkovich, T.E., and T.R.A. Bussing. 1995. A pulse detonation performance model. AIAA Paper No. 95-3155.
5. Zhdan, S.A., V.V. Mitrofanov, and A.I. Sychev. 1994. Impulse produced by gas detonation in open chamber. In: Combustion, detonation, shock waves. Zel'dovich Memorial Proceedings. Ed. S. M. Frolov. Moscow: Russian Section of The Com- bustion Institute 2:422-25.
6. Zhdan, S.A., V.V. Mitrofanov, and A.I. Sychev. 1994. Reactive impulse from the explosion of a gas mixture in a semiinfinite space. Combustion Explosion Shock Waves 30(5):657-63.
7. Zitoun, R., V. Gamezo, Guerraud, D. Desbordes. 1997. Experimental study on the propulsive efficiency of pulsed detonation. Paper 8292. 21st Symposium (Interna- tional) on Shock Waves Proceedings. Great Keppel Island, Australia.
8. Cambier, J.L., and J.K. Tegner. 1997. Strategies for PDE performance optimi- zation. AIAA Paper No. 97-2743.
9. Eidelman, S., and X. Yang. 1998. Analysis of the pulse detonation engine efficiency AIAA Paper No. 98-3877.
10. Kailasanath, K., G. Patnaik, and C. Li. 1999. Computational studies of pulse detonation engines: A status report. AIAA Paper No. 99-2634.
11. Mohanraj, R., and C. L. Merkle. 2000. A numerical study of pulse detonation engine performance. AIAA Paper No. 2000-0315.
12. Oran, E. S., and J. P. Boris. 1987. JVumericai simulation of reactive How New York NY: Elsevier. '
13. Boris, J.P., and D.L. Book. 1973. Flux corrected transport I: SHASTA, a fluid transport algorithm that works. J. Computational Physics ll(l):38-69.
14. Young, T.R., and J.P Boris. 1977. J. Physical Chemistry 81:2424-27.
15. Li, C, K. Kailasanath, and G. Patnaik. 2000. A numerical study of flow field evolution in a pulse detonation engine. AIAA Paper No. 2000-0314.
205

HIGH-SPEED DEFLAGRATION fc DETONATION
16. Hinkey, J.B., T.R. A. Busing, and L. Kaye. 1995. Shock tube experiments for the development of a hydrogen-fueled pulse detonation engine. AIAA Paper No. 95-
2578. 17. Hanson, R., and T. Jenkins. 2000. Private communications. Stanford Univer-
sity.
206

DETONATION OF A JP-10 AEROSOL FOR PULSE DETONATION APPLICATIONS
C. M. Brophy, D. W. Netzer, J. Sinibaldi, and R. Johnson
Detonation experiments have been performed to determine the detona- bility limits of a JP-10-air aerosol in a pulse detonation combustor which utilizes a JP-10-oxygen predetonator unit as the intiator. A continuous air-flow Pulse Detonation Engine (PDE) geometry was used to evaluate the effects of the aerosol Sauter Mean Diameter (SMD) on these lim- its. Initial tests involved the detonation of ethylene and air in the main combustor in order to demonstrate that the geometry chosen was appro- priate for this testing. The ethylene-air tests proved that the geometry could reliably detonate the mixture in the main combustion chamber. Preliminary results indicate that for a JP-10-air aerosol to successfully detonate, a Sauter Mean Diameter below approximately 3 microns is required and/or a large fraction of fuel vapor must be present. The minimum SMD value agrees well with earlier modeling results, but may actually be more a function of the vapor pressure present rather than the spray SMD. Although reliable detonations of the JP-10-air mixture were difficult to obtain, it was demonstrated to be possible for extremely small SMD values. Efforts are continuing to improve fuel injection methods and geometry characteristics to enhance the transmission of the detona- tion waves into the JP-10-air mixtures.
1 INTRODUCTION
The recent interest in Pulse Detonation Engine (PDE) technology has resulted in the initiation of numerous international research efforts. Most of these efforts have focused on the detonation of gaseous reactants and continue to produce references for the detonation of fuels such as ethylene and propane [1-4]. Some of those efforts include rotary valve injection designs, multiple detonation tubes,
207

HIGH-SPEED DEFLAGRATION & DETONATION
nozzle shaping effects on pulse detonation engine performance, and pulse deto- nation rocket engines [5]. For tactical missile applications, liquid fuels are more desirable than compressed gases because of their higher energy density and con- siderably better storage properties. In particular, JP-10 is being tested because of its current application in military weapons and existing approval for shipboard use. Achieving a detonation in a very short length, however, is difficult when using a liquid fuel because of the atomization requirements, mixing timescales, and vaporization of the fuel. Using air as the oxidizer in the main combustor minimizes the need to carry additional oxidizers, thereby leading to a higher specific impulse and greater flexibility in the propulsion system design. The possible increase in performance of PDE systems originates from the increased thermodynamic efficiencies which exist for a detonation process. A comparion of a constant pressure (Brayton cycle) vs. a Chapman-Jouguet (CJ) detonation cycle demonstrates this increase in efficiency. This analysis will describe the benefit of the detonation versus deflagration combustion process, not the over- all efficiencies of a true cyclic system. Since the cyclic nature of a PDE engine has been thoroughly described in previous articles [3], it is not described in this article.
1.1 Thermodynamic Analysis
Most current chemical propulsion systems are based on constant-pressure (CP) combustion processes. This becomes a standard with which to compare the PDE, which, using a CJ detonation, is closer to a constant-volume combustion process. The two key differences are the amount of heat addition (based on differences in the method of combustion) and whether that heat is added along an isobar or a Rayleigh line.
The two cycles are compared for a stoichiometric mixture of JP-10 and air (Fig. 1). As a basis for comparison, state 0 was taken to be 0.1 atmo- spheres (representing ambient pressure under potential flight conditions). Isen- tropic compression to 1.0 atmosphere and 300 K yielded chamber conditions at state 1 for both cycles. The Thermochemical Equilibrium Program (TEP) [6] was used to determine the conditions at state 2 based on the respective cycle. The expansion process from state 2 to state 4 was taken to be a fixed-property isentropic expansion and the ideal gas law was assumed to hold throughout. The parameters from TEP were the frozen equilibrium values with the recombination of radical species ignored.
The thermodynamic properties at each state for both cycles are given in Table 1. Figure 1 highlights the dramatic difference between the two cycles. Temperature is somewhat higher for the detonation (the rise is actually mitigated by the formation of additional radical species) but the real differences are in the
208

PULSED DETONATION ENGINES
Table 1 State thermodynamic properties for constant- pressure and CJ cycles (CP/CJ)
State Pressure (atm)
0.1/0.1 1.0/1.0 1.0/18.46 0.1/0.1
Temperature
(K) 165/165 300/300
2293/2851 1444/996
Specific Volume (m3/kg)
4.447/4.447 0.809/0.809 6.536/0.446
41.100/28.791
Specific volume / m /kg
buiftk,nec1cleCOnStant"PreSSUre (SOUd CUrVeS) and CJ detonation (dashed curves) com-
pressure and specific volume. The detonation pressure at state 2 is a factor of almost 18.5 greater. In addition, while the constant-pressure (deflagration) process increased the specific volume by eight times, the detonation reduced it almost in half. The much larger enclosed area for the CJ detonation indicates a significant advantage in net cycle work.
The heat released in a constant-pressure combustion process (with negligible change in velocity) is simply the difference in enthalpy between the states or:
q = h2~h1 = cp2T2 - CpiTi (1)
where q is the chemical energy released, h is the enthalpy, and cpl and cp2 are the corresponding specific heats at constant pressure. The values at state 2 were obtained by using TEP (cp of 1.4315 kJ/(kg-K) at 2293 K). The initial specific heat (1.0397 kJ/(kg-K)) was calculated as the mass-weighted average of JP-10 (1.60 kJ/(kg-K)), and air (1.000 kJ/(kg-K)) at 300 K [6]. The resulting heat release was 2970.5 kJ/kg.
Since the compression and expansion were assumed to be isentropic, the net work path integral is easily solved:
209

HIGH-SPEED DEFLAGRATION fc DETONATION
■/ P^ - P0V° + Kvn ~ «0 + P<V* " ^ + ^(«0 - «4) (2)
1 — 7i 1 - 72
where wcp is the net work of the cycle. Using the values in Table 1, the result is v0 = 1078.1 kJ/kg. The thermal efficiency for the cycle is the ratio of net work
out to heat added, or r,t = ^ (3)
Qin
where r)t is the thermal efficiency. For a constant-pressure combustion process under these conditions, the result is 36.3%.
The CJ detonation process inherently involves significant kinetic energy so more terms are required for the energy balance:
9 = cp2T2 + | - cplTl - Ul (4)
where m and u2 are the corresponding velocities relative to the detonation front. Since the reactants are stationary, the relative velocity at state 1 is simply the detonation wave velocity (1786.6 m/s). Other state 1 parameters are the same as above. The values from TEP at state 2 for specific heat and temperature were 1.4532 kJ/(kg-K) and 2851 K, respectively. The combustion products flow toward the detonation front at sonic velocity (985.5 m/s) but the detonation, in this case, is travelling at 1786.6 m/s. The relative velocity at state 2, then, is the difference between these. The resulting total chemical energy release is 2556.2 kJ/kg, which is less than the constant-pressure process.
The net work is calculated the same as above except the CJ detonation cycle follows a Rayleigh line from state 1 to 2 instead of an isobar. Thus, the first, third, and fourth terms in Eq. (2) remain the same, or:
WCJ = wcp- P2(v2-vi)
+ lE^?L{v2_vl)+(p2-.Pl^V2)(v2-v1) (5)
Canceling like terms yields
■*« = .. + ^«-»-(^ «)(■>-> (6)
Substituting the values from Table 1 into Eqs. (2) and (6) gives a net cycle work of 1441.2 kJ/kg. Then, using Eq. (3), the thermal efficiency is 56.4%.
This impressive potential performance gain generates the interest in PDEs. Even with lower heat release, the CJ detonation process is able to perform more
210

PULSED DETONATION ENGINES
net work each cycle for the same fuel consumed. The substantially higher thermal efficiency of the CJ detonation cycle, compared to that of the Bray ton cycle used in current aircraft and missile applications, could lead to dramatic reductions in specific fuel consumption. Ultimate PDE performance will depend upon the ability to couple this increase in thermal efficiency with a reasonable propulsive efficiency in a practical engine.
1.2 Combustor Design Issues
The use of a JP-10-oxygen predetonator unit rapidly generates a detonation wave in a smaller combustor which contains a more easily detonable mixture [7, 8]. The exiting detonation wave from the predetonator may then transition into the fuel-air mixture of the main combustor. Typically a predetonator is sig- nificantly smaller than the main combustor (< 1% by volume) and needs to transition from a small combustor diameter to that of the main chamber. Ac- cepted empirical laws determine how large the diameter of the predetonator must be in order to successfully transition the detonation wave if an infinite jump in diameter exists [9]. If the geometry change is sufficently gradual, the wave leaving the small combustor will successfully navigate the transition and continue propagating. Borisov et al. [10] demonstrated with hydrogen-air det- onations that diffraction into cones with the apex angle less than 60° caused reignition at the boundary and a successful transition. This allows the use of predetonators with diameters smaller than the required critical diameter if a cone is used to assist in the transition to the main combustor. The actual lim- iting cone total angle will likely be a function of the particular chemistry of the reactants and may need to be experimentally determined for specific fuel compositions.
Another approach to aid in transition is to employ a compositional discon- tinuity. Desbordes and Lannoy [11] examined detonation propagation with a step-drop in fuel concentration from a fuel-rich mixture (B) to a leaner (i.e., less reactive) mixture (A). Since the CJ pressure, detonation velocity, etc., are lower in the second mixture (B), a detonation propagating at CJ conditions in the initial mixture (A) enters mixture B overdriven. This results in a smaller initial cell size in mixture B, thereby reducing the required critical tube diameter. As the detonation propagates through B, cell size grows monotonically until the CJ conditions for mixture B are reached [11]. Shchelkin [10] proposed that if the chemical induction time increases by an amount on the order of itself, the peri- odic cellular mechanism will break down and the required coupling of chemical and gas dynamic processes will not resume. This theory is supported by Murray and Lee observations of cell size approximately doubling prior to recovery from near-critical perturbations [12].
211

HIGH-SPEED DEFLAGRATION & DETONATION
1.3 Aerosol Requirements in Two-Phase Applications
Gaseous systems possess an inherent simplicity since all of the fuel is already in a vapor state and is therefore more likely to react rapidly with the oxidizer, which is required in a detonation wave. Generally, the energy release must oc- cur within 1 cm of the detonation leading shock. If the heat release occurs too late, the reaction zone decouples from the shock and the detonation will likely fail [12]. In a two-phase condition, such as a JP-10-air aerosol, the fuel must be significantly vaporized before a substantial reaction can occur [13]. In the present investigation, calculations were made which assumed monomodal droplet diameter distributions for both JP-10-oxygen and JP-10-air mixtures under the required steady-state detonation conditions. The steady-state propagation con- ditions were determined from TEP for both mixtures and the corresponding normal shock strength was then used to determine the jump in pressure and temperature experienced by the aerosol in the analysis. Droplet heating and va- porization were calculated using the well known d2-law and the thermodynamic properties of JP-10 [14] and the gases involved:
di = dl- ßvt (7)
where d0 is the original drop diameter, and d the drop diameter after time t. The evaporation coefficient ßv is an empirically determined term and is function of pressure.
Two limiting cases were determined for the aerosols. The upper limit as- sumed an infinite acceleration of the fuel droplets which allowed the droplets to follow the flow behind the wave. This assumption would obviously break down as the droplet diameters and associated inertia increase. The lower limit then assumed no acceleration and maintained a stationary droplet field and allowed the detonation wave to pass with no resulting droplet motion. The results of both analyses are discussed in Section 3.
2 EXPERIMENTAL SETUP
The experimental setup used for this work included a direct-connect air facility, the actual pulse detonation engine, particle sizing equipment, and assorted diag- nostic equipment. The direct-connect facility was operated at air flow rates of up to 1.3 kg/s and provided the engine with air inlet temperatures of up to 425 K. The air was heated by a hydrogen vitiator with make-up oxygen and a maximum outlet temperature of 725 K. The vitiator outlet was connected to the engine in- let through a 6.35-centimeter diameter flex hose. The engine was mounted on two slide rails to allow for future thrust measurments. The experimental layout is shown schematically in Fig. 2 and an actual photo in Fig. 3.
212

PULSED DETONATION ENGINES
main combustor inlet manifold
Figure 2 Experimental layout
Figure 3 Test cell view of experimental setup
213

HIGH-SPEED DEFLAGRATION k DETONATION
fuel injectors
inlet choke
fuel/air predetonator arms
sgy^ main combustor I
Figure 4 Pulsed detonation engine geometry
2.1 Engine Geometry
The engine geometry is shown in Fig. 4 with exploded views of selected ar- eas The engine inlet choke isolated the vitiator from pressure oscillations m the main combustor and allowed for redundant metering of the vitiated air flow. Fuel was injected by four BETE PR-200 air-blast injectors [15] just after the inlet choke and was allowed to mix completely with the air while flowing through 3 81-centimeter diameter inlet arms with lengths of 45 cm. The inlet arms dis- charged into a plenum region where the mixture was directed to flow through a perforated cone segment in order to provide increased turbulence, mixing and partial acoustic isolation. The porosity of the cone was varied between 15/o and 40% The predetonator was composed of a head-end cavity region to aid in con- finement and utilized a rearward-stepped diffusion ramp to increase turbulence levels and prevent fuel adhesion to the walls. This geometry was previously de- termined to provide the most rapid and reliable generation of a detonation wave in a JP-10-oxygen aerosol [8]. Although a length of only 17 cm is required for the detonation to form, a total length of 25 cm was used to allow the wave to reach a steady propagation velocity and the corresponding detonation wave strength to be measured. Direct transition of the detonation wave into the fuel-air mixtures
was generally observed.
2.2 Particle Sizing
Particle sizing was performed for both cold-flow and hot-flow conditions. The cold-flow atomizer characterization was performed using an Aerometncs Phase
214

PULSED DETONATION ENGINES
Doppler Particle Analyzer (PDPA) system configured for measuring particle sizes from 0.50 to 155 ^m and injection velocities from 5 to 500 m/s. Sauter Mean Diameters (d32), volumetric mean diameters, and other spatial statistics were obtained for the atomization system operating at the expected pressure ranges and room temperature. The tip of the atomizer was placed 7 cm upstream from the sample.
A determination of the particle size distribution entering the main combus- tion tube was performed using a Mähern Mastersizer system placed approxi- mately 5 cm from the exit of the four main air inlet arms. The Mähern Master- sizer measurement allowed particle diameter measurements from 0.5 to 148 /mi and provided aerosol properties of the flow entering the main combustor over the selected air inlet temperature range.
2.3 Additional Instrumentation
Kistler 603B1 transducers and 5010B dual mode amplifiers with 540 kHz notch filters were used in varying locations along the predetonation tube and the main combustion tube to monitor the pressure time traces. The signals from the amplifiers were sampled by National Instruments High Speed Data Acquisition boards using a sample rate of 500,000 samples per second. A variable 70 mJ to 2 J Unison Industries ignition system was used as the ignition source for the predetonator combustor.
3 RESULTS
3.1 Atomizer Results
The BETE atomizers produced sprays with low SMD values (7 to 10 ^m) over a wide range of flow rates, thereby allowing the spray SMD to be approximately constant through a wide range of equivalence ratios. SMD values of the aerosol exiting the inlet arms were measured for conditions ranging from a temperature of 285 to 435 K and air flow rates of 0.07 to 0.30 kg/s. The particle sizing measurements also allowed for transmission measurements to be made and the percent of the fuel vaporized to be estimatedby using Bouger's law, Eq. (8), and assuming an average extinction coefficient, Q = 2 for the aerosol:
: exp oC^O^i/
2d. ;32 (8)
where T is the transmission, L is the transmission path length. By knowing the fuel flow rate, the transmission, and calculating the volume concentration, Cv,
215

HIGH-SPEED DEFLAGRATION fc DETONATION
14
12
10
|8
01— 250
Detonations observed
300 350 400 Temperature / K
100
80
60 | •c o 8*
40 > ■«3 3
20
450
Weber number 500 1000 1500 2000
100 200 300 Distance /mm
400
Figure 5 Sauter mean diameter 1 and percent of fuel vaporized 2 as functions of PDE inlet temperature. JP-10-air mix- ture, air flow rate 0.20 kg/s, fuel pressure 45 psig, air pressure 75 psig
Figure 6 Aerosol SMD vs. distance be- hind the detonation wave for complete va- porization. JP-10-air mixture of equiva- lence ratio 1.0. 1 — no acceleration; 2 — Weber number; 3 — infinite acceleration
of the aerosol, the amount of fuel which was vaporized could be estimated. The results for an air flow rate of 0.20 kg/s and overall equivalence ratio of 1.5 for the JP-10-air mixture is shown in Fig. 5 for varying engine inlet temperatures. Det- onations were only observed for inlet temperature above approximately 375 K. Thus, the corresponding aerosols (detonated) had SMD values below approxi- mately 3 /mi and an estimated fuel vapor content above 70%. The detonations
observed will be discussed later in this paper.
It was interesting to compare the experimental results to previous modeling efforts and predictions. By modeling the droplet heating and vaporization as described earlier for a range of droplet diameters, the distances behind the deto- nation wave were determined where 99% of the fuel droplets would be vaporized. The analysis assumed a singular droplet diameter distribution for ease of calcu- lation, whereas in a real spray a finite distribution exists. If one assumes that instantaneous combustion occurs once a particle is completely vaporized, a lim- iting droplet diameter can be determined for the reaction to occur within 1 cm of the leading shock wave of the detonation. Figure 6 shows the modeling results for a JP-10-air aerosol at an assumed equivalence ratio of 1.0 and assuming no vaporization ahead of the leading shock. It can be seen that if the droplet needs to be completely vaporized within 1 cm of the detonation wave and it is assumed to follow the flow field behind the detonation front, a droplet diameter of less
216

PULSED DETONATION ENGINES
than 5 ^m would be required. This analysis ignored radiative heating of the fuel droplets which would increase the minimum diameter slightly. Finite-rate chemical kinetics would obviously tend to reduce the required minimum diameter since it was assumed in this analysis that "vaporized-was-burned."
3.2 Ethylene-Air Mixture
The first series of tests were performed using ethylene and air in order to ver- ify the geometry required to reliably detonate a fuel-air mixture in the main combustor. This was performed for air mass flow rates from 0.07 to 0.3 kg/s and at a constant engine inlet temperature of 315 K. Reliable detonations were observed over an equivalence ratio range of 0.85 to 1.6. A thorough detonabil- ity range was not determined since this portion of the testing was only used to evaluate the geometry. A sample pressure trace can be seen in Fig. 7 for the ethylene-air mixture at an equivalence ratio of 1.25. The predetonator pressure
500
0.186 0.187 t/s
0.188
Figure 7 Pressure-time traces for ethylene-air detonation in main combustor. Air flow 0.140 kg/s; equivalence ratio <f> = 1.25; predetonation wave velocity 1850 m/s- primary wave velocity 1800 m/s. 1 — predetonator No. 2; 2 — main tube No 1- 3 — main tube No. 2; 4 — predetonator No. 1 '
217

HIGH-SPEED DEFLAGRATION fc DETONATION
transducers were located 5.08 and 2.54 cm from the end of the predetonator, therefore resulting in a distance of 2.54 cm between the two in order to allow characterization of the initiation strength of the exiting predetonator wave. The first transducer in the main combustor was placed just after the 10-degree di- verging ramp and the second transducer reported in this paper was located at a distance of 40 cm further down the combustor axis. Measured wave speeds indicated direct transmission of the exiting predetonator detonation wave into
the ethylene-air mixture. A performance parameter of interest is the resulting head-end pressure, p3,
which is commonly reported for PDE systems. The difference between conven- tional valved systems and the geometry used in this study, is that a certain amount of "relief" exists at the interface between the inlet manifold and the main combustor. This changes the no-flow boundary condition commonly found in air-valved systems with one that allows additional flow expansion towards the engine inlet. In order to compare the measured p3 for this system with an expected closed-end tube scenario, the following expansion relationship may be used which predicts the effective p3 on the head wall of a closed-end combustor:
P3 = P2 1 72 - 1
M- 272/(72-1)
(9)
where 72 is the postcombustion specific heat ratio and p2 is the postdetona- tion pressure before any expansion occurs behind the wave. The p3 measured for the ethylene-air mixture in Fig. 7 was found to be approximately 60 psig
(413,550 Pa). The corresponding
i20 2000
Figure 8 mixture: 1 ratio; 3
1 2 Equivalence ratio
Detonation properties of JP-10-air — detonation velocity; 2 — pressure temperature ratio; 4 — head-end
pressure ratio (fixed 7 assumed at cf> = 1.0)
P3 for a closed head-end combus- tor with the same predetonation conditions would be 93 psig (643,244 Pa). The reduction in effective p3 is approximately 35%. The pressure traces in Fig. 7 were for an air mass flow rate of 0.14 kg/s and the 20%-porosity inlet can was installed. Although a reduction in the effective head- end pressure is viewed as a neg- ative effect, the gained simplicity in operation of a valveless design could prove more valuable. Com- pared to a closed head-end sys- tem, the observed blow down pro- cess appears to be slightly longer in duration due to the expansion
218

PULSED DETONATION ENGINES
Figure 9 Pressure-time traces for a JP-10-air detonation in main combustor. Air flow 0.30 kg/s; equivalence ratio <j> = 1.5; predetonator wave velocity 1925 m/s; primary wave velocity 1890 m/s. J — predetonator No. 2; 2 — main tube No. 1; 3 — main tube No. 2; 4 — predetonator No. 1
of pressure towards the inlet manifold. It may be possible to take advantage of this effect to provide additional thrust.
The detonation properties for JP-10 and air are shown in Fig. 8. The prop- erties presented in Fig. 8 were obtained using TEP which does not account for finite-rate chemical kinetics and assumes that all of the fuel is in a vaporized state. The expected head-end pressure for a closed-end combustor is also pre- sented, but a gamma which occurs at an equivalence ratio of one was used for simplicity to calculate the head-end pressure for the range of equivalence ratios plotted.
The detonation behavior of the JP-10-air composition proved to be more complex than that of the ethylene-air mixture. As the engine inlet temperature and the percent of fuel vaporized increased, the observed detonations increased. A sample trace of a JP-10-air detonation is shown in Fig. 9 for an engine inlet temperature of 425 K.
For this case, the fuel was completely vaporized before initiation. The pressure-time traces can be seen to be well-behaved and resemble that for the
219

HIGH-SPEED DEFLAGRATION & DETONATION
Figure 10 Pressure-time traces for a JP-10-air aerosol detonation at two combustor ■locations. Air flow 0.30 kg/s; inlet temperature 380 K; equivalence ratio (f> = 1.5; predetonator wave velocity 2010 m/s; primary wave velocity 1800 m/s. 1 — mam tube No. 1; 2 — main tube No. 2
gaseous ethylene-air runs. As the engine inlet temperature decreased, the in- jected fuel did not completely vaporize before initiation and therefore a two-phase condition was present at initiation. The pressure traces in the main combustor for this condition are shown in Fig. 10 and reveal a high degree of random noise existing at the first transducer in the main combustor. This type of pressure trace has previously been observed with transitioning detonation waves and it can be seen that by the next transducer the wave has apparently reached a steady-state condition exhibiting much more regular structure behind the wave. This in- let temperature was the lower limit for successful detonations. Detonations for JP-10-air mixtures were not observed below engine inlet temperatures of around 375 K, possibly due to an insufficient amount of fuel vapor present to support the wave. Of the successful detonations that were observed, the detonation wave speeds were generally within 2% of the expected Chapman-Jouguet values. This result appears to indicate that although a portion of the fuel was in a liquid state, enough fuel vapor was present to initiate a reaction and result in rapid heating, vaporization, and reaction rates behind the shock wave to produce near
Chapman-Jouguet velocities.
220

PULSED DETONATION ENGINES
4 CONCLUDING REMARKS
The detonation of a two-phase JP-10-air mixture has been demonstrated on a continuous air-flow geometry for fully vaporized and partially vaporized aerosols possessing SMD values below 3 /wn and a fuel vaporization value of at least 70%. Although the governing property of the mixture has not yet been determined (i.e., vapor content or SMD), it is believed that the vaporized component is the major property which allows the successful propagation of the two-phase detonation waves.
The observed head-end pressures for the continuous air-flow geometry appear to be approximately 30%-35% below a comparable closed head-end system. The slightly longer blow down process after a cycle may be exploited in a future system to provide additional thrust.
Current work involves the imaging of JP-10-air detonation waves propagat- ing through conditions similar to those described in this paper. Framing rates as 136,000 frames per second will be utilized for both Schlieren and fluorescent imaging of the wave propagation in these mixtures. Efforts are also underway which will evaluate alternative predetonator designs as well as additional tran- sition geometries from the predetonator unit to the main combustor to promote more reliable JP-10-air detonations. Replacement of the fuel injectors is also planned which will allow more accurate metering of the fuel flow over a wider operational temperature range.
ACKNOWLEDGMENTS
The authors would like to acknowledge the support of this research by Dr. Gabriel Roy of the Office of Naval Research and the assistance of Harry Conner of the Rocket and Combustion Laboratory in running these tests.
REFERENCES
1. Bauer, P., E. Dabora, and N. Manson. 1989. Chronology of early research on detonation wave. In: Dynamics of detonations and explosions: Detonations. Eds. A.L. Kuhl, J.-C. Leyer, A.A. Borisov, and W.A. Sirignano. Progress in astronautics and aeronautics ser. Washington, DC: AIAA Inc. 133:3-18.
2. Manson, N., and E. Dabora. 1993. Chronology of research on detonation waves: 1920-1950. In: Dynamic aspects of detonations. Eds. A.L. Kuhl, J.-C. Leyer, A. A. Borisov, and W. A. Sirignano. Progress in astronautics and aeronautics ser. Washington, DC: AIAA Inc. 153:3-42.
221

HIGH-SPEED DEFLAGRATION fc DETONATION
3. Kailasanath, K. 1999. Applications of detonations to propulsion: A review. AIAA Paper No. 99-1067. (Presented at 37th AIAA Aerospace Sciences Meeting & Ex-
hibit. 1999. Reno, NV.) 4 Eidelman, S., and W. Grossmann. 1992. Pulsed detonation engine experimental
and theoretical review. AIAA Paper No. 92-3168. 28th AIAA/SAE/ASME/ASEE Joint Propulsion Conference and Exhibit Proceedings. Nashville, TN.
5. Bussing, T., and G. Pappas. 1996. Pulse detonation engine theory and concepts. In: Development in high-speed-vehicle propulsion systems. Progress in astronautics and aeronautics ser. Washington, DC: AIAA Inc. 165:421-72.
6. Thermochemical equilibrium program (TEP). Software and Engineering Asso-
ciates, Inc. Carson City, NV. 7. Brophy, C, D. Netzer, and D. Forster. 1998. Detonation studies of JP-10 with air
and oxygen for pulse detonation engine development. AIAA Paper No. 98-4003.
8. Brophy, C, and D. Netzer. 1999. Operation, performance, and characteristics of a JP-10/C-2 fueled pulse detonation engine. XIV ISABE Symposium Proceedings.
Florence, Italy. 9. Knystautas, R., C. Guirao, J.H. Lee, and A. Suirnistras. 1984. Measurements of
cell size in hydrocarbon-air mixtures and predictions of critical tube diameter, critical initiation energy, and detonability limits. In: Dynamics of shock waves, explosions and detonations. Eds. J.R. Bowen, N. Manson, A.K. Oppenheim, and R.I. Soloukhin. Progress in astronautics and aeronautics ser. New York, NY: AIAA
Inc. 94:23-37. 10. Borisov, A., S. Khomik, V. Mikhalkin, and E. Saneev. 1989. Critical energy of direct
detonation initiation in gaseous mixtures. In: Dynamics of detonations and explo- sions: Detonations. Eds. A.L. Kuhl, J.-C. Leyer, A.A. Borisov, and W.A. Sirig- nano. Progress in astronautics and aeronautics ser. Washington, DC: AIAA Inc.
133:142-55. 11. Desbordes, D., and A. Lannoy. 1989. Effects of a negative step of fuel concentration
on critical diameter of diffraction of a detonation. In: Dynamics of detonations and explosions: Detonations. Eds. A.L. Kuhl, J.-C. Leyer, A.A. Borisov, and W.A. Sirignano. Progress in astronautics and aeronautics ser. Washington, DC:
AIAA Inc. 133:170-86. 12. Murray, S., and J. Lee. 1984. The influence of yielding confinement on large-scale
ethylene-air detonations. In: Dynamics of shock waves, explosions, and deto- nations. Eds. J.R. Bowen, N. Manson, A.K. Oppenheim, and R.I. Soloukhin. Progress in astronautics and aeronautics ser. New York, NY: AIAA Inc. 94:80-103.
13. Beeson, H., R. McClenagan, C. Bishop, F. Benz, W. Pitz, C. Westbrook, and J. Lee. 1989. Detonability of hydrocarbon fuels in air. In: Dynamics of detonations and explosions: Detonations. Eds. A.L. Kuhl, J.-C. Leyer, A.A. Borisov, and W.A. Sirignano. Progress in astronautics and aeronautics ser. Washington, DC:
AIAA Inc. 133:19-36. 14. 1988. Handbook of aviation fuel properties. Coordinating Research Council.
15. Most frequently asked questions about XA series nozzles. BETE Fog Nozzle Inc.
Greenfield, MA.
222

A NEW APPROACH TO ORGANIZING OPERATION CYCLES
IN PULSED DETONATION ENGINES
V. A. Levin, J.N. Nechaev, and A.L Tarasov
A new approach to solving the problem of pulsed detonation engines (PDE) has been proposed. The approach is distinguished by total ab- sence of mechanical valves and special ignition systems. The pulsation process in such an engine is initiated by generating high-frequency self- oscillations in a gas-dynamic resonator. The resonator is periodically filled with a specially prepared, nonequilibrium, exothermically reacting fuel-air mixture. The heat enhancing the oscillation amplitude is re- leased in the course of detonation-like combustion. The results of model experiments are reported.
1 INTRODUCTION
Transition from the thermodynamic cycle with heat deposition under the con- stant pressure (p = const) to the cycle with heat deposition under the constant volume (v = const) is one of possible ways to improve the efficiency of aircraft engines. Theoretical studies have proved that this would result in achieving the increase of the cycle efficiency by the factor of 1.3 to 1.5. For several decades, the attempts were made to implement the theory of the pulsed engines (based on the v = const concept) into practice, but they did not succeed so far. This is attributed to the complexity of the design, inertia and low passing capability of mechanical valves in these engines, as well as to low combustion velocities attained. The above turned to be the main reasons for low impulse frequencies, high thermal and vibration loads, elevated noise level, and finally the unsatis- factory engine performance as a whole.
Nowadays, the interest in engines with periodic fuel combustion has been increased in view of a prospective to apply the detonation mode of combus-
223

HIGH-SPEED DEFLAGRATION & DETONATION
tion. Recent studies of pulsed detonation engines (PDE) resulted in a number of patents. The common feature of existing engine concepts is the use of detonation tubes and suction valves [1]. These design components do not allow to increase the impulse frequency beyond a certain limit, and hence may not be right solu- tions for overcoming a number of disadvantages typical for conventional pulsed engines. A new approach to arrange the operation process in a PDE is presented here. To the best of authors' knowledge, this does not have any similarity with other available designs.
2 IDEAL THERMODYNAMIC CYCLE IN PDE
The ideal thermodynamic cycle of the engine with the pulsed fuel com- bustion (EPFC) is not identical to v — const cycle. Figure 1 is the p-v- diagram of p = const (1-2-3-4), v = const (l-2-3'-4'), as well as the ideal PDE (1-2-3"-4") cycles. The ini- tial compression (adiabate 1-2) is as- sumed similar for all the cycles un- der consideration. Processes 2-3, 2-3' and 2-3" pertain to the heat de- position stage: qi for isobaric, q[ for isochoric, and q'{ for detonation proc- esses. Irrespectively of the process, the values of q\ are determined by the formula q\ — Hu/aL0, where Hu
is the fuel combustion heat, a is the air-fuel ratio, and La is the stoichi- ometric coefficient. The actual ef- fectiveness of the amount of thermal energy converted during the cycles,
lc, is characterized by the cycle areas in the p-v-diagram, while the efficiency is treated in terms of the thermal efficiency ratio nt = lc/qi-
Tables 1 to 3 present the computational results for the cycles. It allows to compare the cycles by the values of lc and nt. Maximum values of pres- sure and temperature are also presented in Tables 1 to 3. The computations were performed for the initial compression ratio 7r = pijvi equal to 5, 15, and 30. The estimations were made for the kerosene-air mixture with Hu - 43,000 kJ/kg, L0 = 14.8, and a = 1 as the reactive medium. In this case,
Pi1 J 3"
\ \
Pi
\ \
1 I
\3' /q"
1 /<?>'
Pi
I \
2 V/1
\4 - ^^——
; \4" \4' V, v,=v,
Figure 1 Thermodynamic p-v coordinates
cycles in
224

PULSED DETONATION ENGINES
Table 1 Parameters of the Brayton cycle
P2/P1 T3, K pa, kPa r«, K /„ MJ/kg Vt
5 2720 500 1880 0.89 0.31 15 2840 1520 1510 1.33 0.46 30 2940 3040 1340 1.56 0.54
Table 2 Parameters of the Humphrey cycle
P2/P1 P3/P1 n,K Pa, kPa T4',K 1450 1220 1100
l'c, MJ/kg Vt 5
15 30
40 100 170
3440 3530 3630
4944 11250 19000
1.42 1.7 1.85
0.50 0.59 0.64
Table 3 Parameters of the PDE cycle
P2/P1 n\ K p'L kPa T4", K l'c, MJ/kg V't'
0.53 0.62 0.67
M2
5.23 4.65 4.32
D2, m/s 2060 2080 2100
5 15 30
3860 3990 4100
9670 21820 36640
1400 1190 1070
1.48 1.75 1.89
9i - 9i - 9i - Hu/L0. The ratio of specific heats k was assumed constant and equal to 1.3. Conditions for point 1 in Fig. 1 are standard: T, = 288 K Pi = 101,325 Pa.
The computations for the Brayton (p = const) and Humphrey (v = const) cycles were performed applying the well-known thermodynamic relationships. For the cycle v = const, the pressure ratio p'3/Pl attains the value of 40-170 depending on jr, and the gas temperature T^ reaches 3400-3600 K. This is about 700 K higher than that for the p = const cycle. At elevated v, the gains in nt are slightly reduced: from 60% at w = 5 to 30% at TT = 15, and about 20% at TT = 30. This comparison demonstrates a potential for a considerable improvement of the engine efficiency by using the v = const cycle.
Available studies of processes in engines with detonative combustion of fuel are far from being complete. The analyses are usually based on the classical det- onation theory, where detonation is treated as a complex structure comprising a thin shock wave followed by the exothermic reaction front with the instant com- bustion process. As a result, a shock-induced combustion process is considered, which is accompanied with a significant increase in pressure and temperature! The detonation waves propagate in combustible mixtures at supersonic speeds of 1500-2000 m/s or more.
225

HIGH-SPEED DEFLAGRATION fc DETONATION
The method of heat deposition makes the difference between the PDE and v = const cycles. In the PDE case, the heat deposition is guided by the shock adiabate (Hugoniot curve) 2-3".* The compression process results in the pres- sure increase by Ap = p" - p2 and the reduction of the specific volume by Av = v2 - v'i (Fig. 1). Thus, Ap/Av = p\D\, where D2 is the speed of the detonation wave in the combustible mixture that depends on the parameters of the mixture at the beginning of the process (state 2), and the heat release due to fuel combustion, gi. Table 3 shows the corresponding values of D2 and M2 = D2/a2 = D2l^jtWT~2, where M2 is the Mach number, a is the speed of
sound. It follows from Table 3 that the PDE cycle is characterized with higher values
of pressure and temperature at point 3" than the v = const cycle. The p'^/pi ra- tio can attain the values of 80-330. This allows to achieve a significant expansion of the combustion products that is impossible for traditional cycles. It should be pointed out that the predicted values of temperature T% are within 3800-4000 K range, i.e., even higher than in the v = const cycle, while the exhaust gas tem- perature T{' is significantly lower. This proves that the heat of combustion can be used more effectively. To summarize the analysis, the detonation combustion has more advantages as compared to combustion at constant volume.
In the available literature, there are studies of another way of arranging engine operation with detonative combustion, known as "inverted" [3]. The impingement of shock waves with the obstacle generates a substantial additional pressure increase that can serve as a basis for detonation onset. The head- end surface of the combustion chamber is an obstacle reflecting the wave, so that the detonation arises at a sufficient distance from this surface near the outer boundary of the filled volume. In this case, the detonation wave initially moves in the direction of the reflecting surface, where the fuel combustion occurs. Upon reflection from the surface (in the form of a shock wave) it transfers an additional pressure pulse to this surface (thrust wall). The gain in the thermal efficiency is obtained due to the additional pressure increase that might reach
3% to 4%. Figure 2 presents the comparison of the ideal thermodynamic cycles, in terms
of the thermal efficiencies at a - 1. The thermodynamic superiority of the Humphrey cycle and particularly the PDE cycle over the Brayton cycle is quite obvious. The highest gain in nt is achieved at low values of TT. For example, at 7T = 5 the transition from the Brayton cycle to the PDE cycle under the adopted conditions improves the efficiency by 70%, while at TT = 30 the gain reduces to 30%. Another important conclusion can be drawn on the basis of a comparison of the thermodynamic cycles. A fairly low TT value is required for the cycles v ith detonation combustion to achieve nt values typical for modern gas turbine engines. The thermal efficiency equal to 0.54, for example, in the
»Actually, heat deposition occurs along the correspondingReyleigh line. {Editors' remark.)
226

PULSED DETONATION ENGINES
Figure 2 Comparison of cycle thermal efficiencies: 1 — Brayton cycle, 2 — Humphrey cycle, 3 — PDE cycle (direct), 4 — PDE cycle (inverted)
Brayton cycle is achieved at n = 30, while in the PDE cycle the same value % is reached at 7r = 5. This will allow high-pressure compressors to be eliminated in PDE, thus the engine weight would be reduced and the engine design would be simpler.
3 A NEW APPROACH TO PDE
The design implementation of the thermodynamic PDE cycle concept faces dif- ficulties because of the necessity of providing the appropriate process physics. The new approach to PDE development is patented [2, 9] and verified by model tests [7]. It differs from other designs by the absence of any mechanical valves and any impetuous ignition devices. The pulsed operation is achieved due to excita- tion of resonant high-frequency autooscillations in the gasdynamic resonator. It is periodically filled with an active exothermic fuel-air mixture (FAM). The heat, released in the course of detonative mixture burning induced by shock waves travelling in the resonator cavity, increases the amplitude of the oscillations.
Long-term study preceeded the development of PDE thrust models. A great number of gasdynamic resonators were studied along with the methods to excite the detonative combustion and to prepare exothermic reactive mixture. Devel- opment of PDE model thrust devices (TD) was based on the following:
227

HIGH-SPEED DEFLAGRATION & DETONATION
- well-known theoretical concepts of the pulse processes,
- achievements in the thermoacoustics in semiclosed volumes,
- study of the thrust wall effects under the conditions of external combustion, and
- data on the detonation of fuel-air mixtures and gasdynamic processes of nozzle flows [3-5].
The developed design successfully implements the above concepts and prin- ciples. Manufactured high-frequency resonance detonation devices were tested.
Theoretical studies and the experience gained in the PDE thrust model de- velopment and testing led to improved understanding of engine operation, devel- oping general requirements to arranging the processes and, in particular, FAM preparation in the reactor, and the high-frequency detonative combustion in the resonator [8].
COMBUSTIBLE MIXTURE PREPARATION IN THE REACTOR
The combustible mixture was prepared to combustion in the reactor by its acti- vation to decompose its molecules into chemically active components. In the case of hydrocarbon fuels, these can be molecular or atomic fragments. The induc- tion time (delay of heat release) and the relaxation time (heat release duration) of excited molecules and active radicals are much shorter than the appropriate time inherent in the initial (nontreated) mixture. Such FAM can be prepared by arranging the combustion process in two stages [7], the first (preliminary) stage is performed in the reactor. It encounters initiation of the preflame processes characterized by a low heat release due to burning of highly-rich FAM (a < 0.3- 0.5) in the reactor. Due to oxidant deficiency and a short residence time of the mixture in the first-stage combustion zone, combustion is incomplete. Af- ter air is added to it (to a desired FAM composition), the mixture enters the resonator in an excited state and the second-stage — detonative combustion — starts.
Fuel treatment is important and is achieved by its preheating, mixture enrich- ment and thermal decomposition (thermal degradation of fuel in special heat- exchangers or jackets used to cool the engine). Preheating up to high temper- atures can also assist to decompose fuel into active components. However the preheating temperature of hydrocarbon fuels is limited by onset of their coking (for kerosene, this temperature is approximately 700 °C).
228

PULSED DETONATION ENGINES
It is important to save the active energy carriers or "to freeze" the ener- getic species while the activated FAM travels from the reactor to the detonative combustion zone. The latter zone should be short in length and in time. "Freez- ing" of the species can be achieved under the negative temperature gradient (for example, in an accelerating flow).
Fuel and FAM can be affected by magnetic, electric, plasma-chemical, acous- tic and other factors in addition to thermal ones at the stage of their preparation for high-frequency combustion. Chemical effects (introduction of active additives and catalysts) can be used as well. This is the subject of future study. It should be noted that FAM activation by partial fuel combustion in the reactor requires supply of some heat under p = const. Hence this approach is less beneficial compared to other methods, because the heat amount delivered to the FAM is reduced during the second-stage process — detonative combustion.
5 HIGH-FREQUENCY DETONATIVE COMBUSTION IN THE RESONATOR
High-frequency resonant detonative combustion chamber — resonator cavity — is another very important component of the PDE. It is possible to outline five critical conditions to be met when arranging the operation process in the res- onator cavity of the PDE model considered.
1. The existence of the semiclosed cavity. It is periodically isolated from the outer space by the jet curtain, thus protecting the internal cavity space from the outer impacts, retaining the gas pressure above the atmospheric. The curtain (gasdynamic lock) that replaces a valve device can be ar- ranged by directing supersonic jet flows (for example, via nozzles) so that they periodically block the outer cross-section of the cavity [9]. Such a gasdynamic device (as the studies demonstrate) excites high-frequency gas resonant oscillations even with no combustion (Hartmann-Shprenger ef- fect). The frequency of these oscillations depends on the geometry of the cavity and the thermodynamic gas parameters within its volume. The gas autooscillation frequency increases as the cavity size decreases and the temperature increases.
2. Periodic supply of FAM charges (prepared in advance in the reactor) into the semiclosed cavity. This requires either a separate mixture delivery device into the cavity space or the arrangement of jets in such a way that they form a curtain locking the semiclosed cavity. In the latter case, filling of the resonator cavity with FAM gives rise to shock-wave phenomena that precompress the mixture in the cavity intended to be filled in.
229

HIGH-SPEED DEFLAGRATION fc DETONATION
3. Initiation of the deionative combustion process is achieved by shock waves reflection from the resonator thrust wall at the outer boundary of the filled cavity [4, 5]. In this case, the detonation wave forms at the "focus," travels through the combustible mixture in the direction of the operation surface and impinge this surface (inverce model). The detonation process, besides its capability of self-igniting the mixture (shock-wave impact), is characterized by the capability of self-exciting the components by thermal, chemical or electrical sources.
The dimensions of the detonative combustion chamber are controlled in the first place by the requirement of FAM detonation stability in the mode of autooscillation within a period of time sufficient to implement a single cycle of a required duration. The smaller the combustion chamber the higher the oscillation frequency. Intervals between the subsequent cycles decrease with the reduction of the contact time between FAM and the combustion products of the previous cycle (thus FAM is ignited right in time); the noise level reduces as well. A small size of the combustion chamber exerts a positive effect on the resistance of device materials to thermal and vibration loads when operating at high pressures and temperatures and under cyclic loads. In particular, the combination of high-frequency pulses and small dimensions is the main advantage and the characteristic feature of the thrust devices of the present design to be used in PDE.
4. Provision of further filling of the resonator cavity with a new portion of FAM. In the inverce device, the reflected shock wave (after the reflec- tion from the operation surface) destroys the gas curtain and exhausts the combustion products into the ambient atmosphere. The velocity of the gas flow behind the shock wave front is somewhat lower than the velocity of the shock wave itself (for example, if Ms = 5, Mps = 4.8). This is what provides the supersonic flow of the combustion products from the resonator in spite of the fact that no conventional Laval nozzle is used. The shock wave is followed by an expansion wave. This latter wave passes through the nozzle devices that produce the gas curtain and creates conditions for the next FAM suction. The mixture fills the cavity and forms a new gas curtain as well.
The mixture expands at the resonator exit to a pressure lower than the atmospheric one. This can result in suction of some amount of atmospheric air inside the cavity. The added outer air is not allowed to reach the cavity space of filling and to affect the combustion process.
5. Providing the process repeatition (cyclic nature). The sequence of stages is as follows: filling the cavity space (suction), mixture precompression by the waves, its ignition in the proper time and detonative combustion with an
230

PULSED DETONATION ENGINES
instantaneous pressure and temperature increase, exhaust into the outer space, and then preparation and supply of a new mixture portion.
The aforesaid can be implemented in practice under the condition that all of the above processes are combined with the resonant autooscillation process that occurs in the resonator cavity.
6 MODEL TESTING OF PDE THRUST DEVICES
The design of the PDE thrust device (TD) incorporated the principles presented in Fig. 3 and specified in [2, 9]. During model testing, compressed air was supplied to reactor 3 at a required pressure from the compressed air source — gas generator (GG). Resonator I is a spherical semiclosed cavity with a cut in the vicinity of which the annular nozzle 2 is installed. Homogeneous exother- mically active FAM is prepared in the reactor. Its required composition is achieved by adding the proper amount of air to the products of partial com- bustion.
1 2
Figure 3 General schematic of the PDE TD: 1 — resonator cavity; 2 — annular nozzle; 3 — reactor
Though there are no reliable theoretical methods for assessing the efficiency of the TD, experimental study proves to be the best method for its estima- tion. Tests were run on special test benches at the Institute of Mechanics of the Moscow State University, the Institute of Thermo-Nuclear Development in Troitsk (Moscow Region), and the Institute of Mass and Heat Transfer in
231

HIGH-SPEED DEFLAGRATION & DETONATION
y///////////////////y////////////////////.
Minsk (Republic of Belarus). Test benches were instrumented to mea- sure and visualize pulse gasdynamic processes supplemented by thrust measuring devices.
To preclude impacts of oncom- ing pulses on the thrust measure- ment, the air was supplied to the re- actor perpendicular to the TD sym- metry axis. Two methods were used for thrust measurements: strain gauges and differential devices (comparing the measured thrust with the thrust of a calibrated Laval nozzle). The results of both meth- ods turned to be identical.
The geometry and parameters of GG were partially optimized in the course of testing to provide stable resonance pulses and effective det- onative combustion. Kerosene and acetylene were used in the experi- ments as fuels. The nozzle throat cross-section area, FAM pressure pm at the reactor exit and the air- fuel ratio a were varied.
Some of the data of the model PDE GG testing are shown below.
The model test was run on the pulse test benches of the Institute of Mechanics, the Moscow State University, with acetylene used as a fuel.
Figure 4 presents the design of the test bench. The device is designed to directly preactivate FAM. The closed cavity 1 serves as a reactor filled with an acetylene-air mixture of the required composition before the start. The di- aphragm separates it from the annular nozzle 2 and resonator cavity 3. The dia- phragm is burst upon mixture ignition by an electrical igniter due to the pressure increase in cavity 1. The products of partial combustion are released via the an- nular nozzle and enter the resonator cavity. Here, under favourable conditions, the high-frequency fuel detonative combustion might be accomplished if pressure pm (within a range from ~ 0.2 to 2 MPa) drops within a certain period of time. Pressure chamber 5 serves as a cavity for the combustion products, pressure PH
corresponds to the pressure at a given altitude. The following parameters are monitored: pressure pm in front of the annular
nozzle as a function of time, pressure pc in the reactor cavity, thrust P and
Figure 4 General schematic of the impulse test bench: J — reactor, 2 — annular nozzle, 3 — resonator cavity, 4 — diaphragm, 5 — thermal pressure chamber, 6 — brackets, 7 — thrust gauges
232

PULSED DETONATION ENGINES
static pressure distribution along the resonator surface (not shown in Fig. 4).
Figure 5 presents time histories of pressures pm and pc (a) and thrust P (b) which were observed during the model tests. The di- ameter of the resonator cavity out- let cross-section is 70 mm, q = Fc/Ft,s = 4 (Fc and Ft,s are the outlet areas of the resonator and the area of the throat cross-section of the annular nozzle), and a = 1. Pressure pc increases as pressure pm reduces. Instantaneous pc/pm
values attain 6-10 and more, while the thrust attains the values of about 2000 N.
Figure 6 presents data on the reduced thrust P/Fcpm averaged over the number of starts as a func- tion of pressure pm at various a and q. Under these combustion conditions, close to detonation, the highest thrust values were ob- served at a = 1 and q = 4. Fur- thermore, it is obvious that the process effectiveness improves as pressure pm decreases. These data partially published in [7] serve as a confirmation of efficiency of the PDE TD model considered. The preliminary thrust data present the best results of measurements (including the effects of GG drive) and prove to be higher than for a stoichiometric turbojet engine, the development of which requires much more efforts. Oscillation fre- quency measured in the resonator cavity was 24-25 kHz. This cor- responds to the acoustic range for the designed cavity geometry and
2.4-
1.6-
0.8-
3000
2000
Z a.
1000-
,'.«,'• Ill I .-,
#?■*;• ;-:."-v-i / ^>Cv/. v.
_, j
4 8 12 t/ms
'"'■'■ ■
(f>)
Figure 5 Measured time histories of sures pm and pc (a) and thrust P (b)
pres-
233

HIGH-SPEED DEFLAGRATION fe DETONATION
0.6 1.0 1.4 /,m/MPa
(b)
Figure 6 Reduced thrust P/Fcpm at various a at q = 4 (a) and various g at a = 1 (fe) as a function of the instantaneous pressure pm
the temperature of the combustion products of 2500-2600 K [7]. Cold tests of the models under the same pressure at the inlet were accompanied with high- frequency autooscillations, however their frequency was about 7.5 kHz.
The lack of a direct gas flow metering equipment is a weak point of the pulse test bench. Estimation of device design requires the knowledge of temperature at the annular nozzle throat which has not been measured. (It depends on the amount of heat released within the first stage of combustion. This presents a difficulty in estimating the specific thrust at the pulse test bench.)
7 PHYSICS OF THE OPERATION PROCESS
The operation process is schematically depicted in Fig. 7. It is based on the "cold" (without fuel supply) and "hot" model tests, pulse flow parameter meas- urements, visualization of the gasdynamic patterns and an analysis of the shad- owgraphs taken on flat and axisymmetrical models, all recorded by a high-speed
camera (Fig. 7).
234

PULSED DETONATION ENGINES
Suction Compression Ignition and Operating
Compression Outflow and Suction
Supersonic Jet Shock Wave Focus Detonation Expansion Reflection Wave Wave Shock Wave
(a) (b) (c) (d) (e)
Figure 7 Schematic presentation of the operation process physics occurring in a PDE resonator cavity
Chemically active FAM, prepared in the reactor enters the annular nozzle 2 (Fig. 3), where its flow "is being frozen," produces the gas curtain and supplies the combustible mixture into the resonator cavity. While the resonator cavity 1 is being filled with the combustible mixture (the suction process, Fig. 7a) due to a supercritical pressure drop in the annular nozzle 2, the axisymmetrical supersonic jet moves in the direction towards the resonator axis. At the instant wnen it reaches the resonator axis area (at the complete blockage of the cavity volume 1 by the supersonic flow) a complicated shock wave pattern forms. For simplicity, in Fig. 76 it is presented in the form of a single shock wave (SW). The combustible mixture is compressed twice by this shock wave and by the reflected wave afterwards (Fig. 7 c) (the compression process is accomplished).
The shock wave reflected from the resonator spherical surface is focused in some area (named "Focus" in Fig. 7c) at the outer boundary of the cav- ity which is filled with FAM. The pressure and temperature in this area rise to values sufficient to ignite the combustible mixture and produce the flame ball. The reaction zone moves towards the thrust wall as a detonation wave (Fig. Id).
The detonative combustion process proceeds at high supersonic velocities. This explains why the cycle takes an extremely short period of time (20-40 ps). In other words, the detonation wave, which moves through the combustible mix- ture towards the resonator bottom, acts as an aerodynamic piston increasing the temperature and pressure of the mixture due to almost instantaneous fuel combustion. If compared to a piston engine, this thermodynamic cycle phase is an equivalent of the "operation stroke."
235

HIGH-SPEED DEFLAGRATION & DETONATION
The detonation wave interacts with the resonator thrust wall surface as an obstacle and produces an impulse of excess pressure forces. Then, simultane- ously with the shock wave reflection (Fig. It), the jet curtain is broken and the flow of the combustion products starts. Shock wave reflection is followed by the expansion wave (Fig. It). It provides suction of a new portion of the com- bustible mixture when departing from the annular nozzle. Then the entire cycle is repeated.
8 CONDITIONS AND AREAS OF APPLICATION
Effect of flight conditions on the stability of PDE GG operation calls for fur- ther studies. However it has been noticed during the tests that under the pm - const (Fig. 3) condition, decreasing the pH pressure in a thermal pres- sure chamber (flight conditions simulation) considerably changed the GG per- formance; whereas changes in the pm pressure affected the combustion stability. Hence it was inferred that the considered GG can retain its performance under various flight conditions at pm = const. The thrust, the airflow and all specific parameters of GG will remain unchanged in this case [8].
A special turbo-compressor unit in GG function is needed to provide the required volume of air to the TD at the required pressure level if planned to be installed in an aircraft. To comply with the p,„ = const condition under various flight conditions, the power unit with PDE is to be designed with several GG units, each of them is intended to operate several TD. The thrust control of the power unit under flight conditions is achieved by shutting an appropriate TD (and, if possible, appropriate GG) provided the operation modes of the rest of TD remain invariable. Shutting down of appropriate TD groups is required first of all under the cruise aircraft mode as the required cruise thrust is much smaller than the take-off thrust. The total number of GG and TD must be sufficient to provide the required thrust under all flight conditions by their starting and shutting-down.
Meeting of the p,„ - const condition during operation of PDE TD under different flight conditions should be treated as an extreme requirement. It is to be considered in the case of TD operation failure under transient pressures at the inlet. An appropriate solution to be found for the thrust control of specific TD when the fuel supply is changed. The requirement to meet the pm = const condition presents two difficulties:
- first, thrust measurement under the flight conditions is required only when a specific TD is shut-down and, as a result, will be discrete;
- second, to ensure TD operability under pm = const conditions, the pressure rise ratio of the air supplied from GG, IT*, should be changed within a wide
236

PULSED DETONATION ENGINES
range which, at the designed pressure pm, depends on the flight speed and altitude. Currently existing gas turbine engines of most of aircraft models fail to provide the needed w* change.
Thus, GG models of a completely different design are required. One of such potential GG designs (with an air bypass) was presented in [8].
Though the model testing proved to be quite successful, the development of PDE power units is associated with a substantial technical risk at present. This stems from an extreme complexity operation of these engines and the difficulty of its study by conventional methods of mathematical and physical modeling. However, the anticipated benefits of application of these engines in aviation are so promising that appropriate investments in their further development and labor efforts will pay back.
9 CONCLUDING REMARKS
1. The thermodynamic analysis demonstrates that transfer from p = const cycle to mixture detonation increases the thermal engine efficiency aver- age by a factor of more than 30%-50%, depending on the preliminary air compression ratio.
2. The new approach to arranging the operation process of high-frequency resonance pulsed detonation engines is described that has been verified by model test results. A study of patents and relevant previous activities proved that the approach has no analogs.
3. The physical model of operation of a single thrust module of a high- frequency pulsed detonation engine, developed on the basis of model test results, adapted to the conditions of resonance high-frequency oscillations and the specifics of the detonation processes is quite trustworthy and can be used to formulate mathematical models.
REFERENCES
1. Pegg, R. J., B. D. Couch, and L.G. Hunter. 1996. Pulse detonation engine air in- duction system analysis. A1AA Paper No. 96-2918.
2. Antonenko, V.F., R. M. Pushkin, A.I. Tarasov, et al. Thrust generation method and a device to achieve it. Patent of Russian Federation No. 2034996 dated 10.05.95, with a priority dated 11.10.93.
237

HIGH-SPEED DEFLAGRATION fc DETONATION
3. Achasov, O. V., V.V. Kondrashov, and S.I. Shabunya. 1994. An analysis o{ the det- onation process as applied to the engine operation process. Preprint No. 4. Minsk, Belorussia: The Academy of Sciences.
4. Achasov, O.V., R. M. Pushkin, A.I. Tarasov, et al. 1993. Focussing of the shock waves reflected from concave nonlinear surfaces. J. Engineering Physics 65(5):
548-52. 5. Achasov, O.V., R.M. Pushkin, A.I. Tarasov, et al. 1994. Detonation initiation
by a shock wave reflected from concave nonlinear surfaces. J. Engineering Physics
67(l-2):66-72. 6. Doudov, V.G., and V.P. Maksirnov. 1986. Thermal acoustics of the semiclosed
volumes. Preprint No. 28-86. Institute of Theoretical and Applied Mechanics, The Siberian Division of the USSR Academy of Sciences.
7. Levin, V. A., G. D. Smekhov, A.I. Tarasov, et al. 1998. Analytical and experimental study of a pulse detonation engine model. Preprint No. 42-98. Moscow: Institute of Mechanics, Moscow State University.
8. Nechaev, J.N., and A.I. Tarasov. 1999. The pulse detonation engine — a new engine model for aircraft. Rus. J. Flight 4.
9. Pushkin, R.M., and A.I. Tarasov. Thrust generation method and a device to achieve it. USSR patent No. 1672933 dated 22.04.1991, priority dated 30.11.89.
238

PULSED DETONATION COMBUSTION CHAMBER FOR PDE
D. I. Baklanov, L. G. Gvozdeva, and N. B. Scherbak
The detonation in a gas-fueled chamber of variable cross-section op- erating in a periodic mode is described. The frequency performances for stoichiometric propane-oxygen, methane-oxygen, hydrogen-oxygen, and hydrogen-air mixtures are estimated. The ways to increase the repetition frequency of detonation waves are analyzed. Operation of the detonation chamber of variable cross-section using methane-oxygen mixture at frequencies from 0.5 to 2 Hz is discussed.
1 INTRODUCTION
Detonative mode of combustion provides energy release at faster rates, and is extensively investigated for propulsion in recent years world-wide [1, 2]. The realization of a detonative combustion for practical purposes is possible by us- ing a detonative combustion chamber operating in a pulsed mode. For practi- cal applications, pulsed detonation appears to be the preferred mode of opera- tion [3].
In the present work, the results of investigations of different regimes of a detonative combustion chamber (DCC) are reported.
2 DETONATIVE COMBUSTION CHAMBER
The design of the combustion chamber depends on the particular application considered. Two basic types of chambers were used:
239

HIGH-SPEED DEFLAGRATION & DETONATION
5 6
Figure 1 Detonative combustion chamber of variable cross-section. 1 — spark plug, 2 — detonation formation section, 3 — expanding cone, 4 — main chamber, 5 — converging cone, 6 — working section; a~k — locations of pressure gauges and photo diodes
(1) a chamber with constant cross-section, and
(2) a chamber with variable cross-section.
The chamber with variable cross-section is shown in Fig. 1. Oxidizer and fuel are supplied separately into a long and narrow tube 2, where mixing and transition from deflagration to detonation occur. Rotameters were used to measure the mass flow rates of gases in the feed manifold. For igniting the combustible mixture and controlling the frequency of detonation waves, a spe- cial ignition unit I was used. It included a spark plug and an electronic ig- nition system, similar to that applied in automobile internal combustion en-
gines.
The tube 2 has a diverging part 3 for transmitting detonation to the main chamber 4. In order to obtain a slightly overdriven detonation, a convergent section 5 is added to the main chamber. Pressure transducers and photodiodes were mounted at sections a, b, c, d, e, /, g, h, and k shown in Fig. 1. The chamber has the following dimensions: a tube 2 is 16 mm in diameter and 3 m long, the main chamber 4 is 65 mm in diameter and 1 m long, the angle of a diverging part is 16°, the angle of a converging part is 40°. In the experiments, propane-oxygen and methane-oxygen mixtures were used. The chamber is ca- pable of operating in a periodic mode. After ignition of the entering mixture by a spark, detonation forms in a prechamber 2, and passes to the main cham- ber 4 causing expansion of the combustion products. Then the chamber is filled again and the cycle repeats. The fact that the chamber operates in a detonation mode has been confirmed by pressure measurements. The arising pressure wave was the Chapman-Jouguet (CJ) detonation that was slightly overdriven at the
exit.
240

PULSED DETONATION ENGINES
With forced cooling, a frequency of / = 92 ± 1 Hz was obtained by using the above described DCC. Without cooling, it was possible to attain stable operation of DCC at frequencies up to 2 Hz. The stable operation of the chamber in a periodic mode was obtained by using a unique feed system for fuel and oxygen.
3 OPERATION PRINCIPLE OF GASDYNAMIC VALVES
A unique feature of the DCC is that it does not contain mechanical valves, rather the so-called gasdynamic valves are used.
The gasdynamic valves in fuel and oxidizer feed lines are the basic elements providing DCC operation in a pulse mode [4]. The valves overlap with a desired frequency and prevent uncontrolled ignition of fresh portions of the combustible mixture by the combustion products of the previous cycle. This is achieved by cooling the combustion products in the feed lines to the temperature, at which the explosion induction period of a new portion of combustible mixture exceeds the time of contact with cooled combustion products. A failure of the above requirement leads to ignition of the combustible mixture by the combustion products of the previous cycle rather than by an external source. In this case, it is not possible to obtain controlled, periodic, detonative combustion, and DCC operates in a conventional combustion mode.
The operation principle of gasdynamic valves is illustrated in Fig. 2. The essence of this principle is in creating the separating gas volume between the fresh combustible mixture 3 and hot detonation products 5. The DCC oper- ation cycle starts from filling the chamber with fuel and oxidizer I (Fig. 2a). Ignition of the mixture by an electric spark 2 results in combustion followed by transition to detonation, which propagates towards the DCC open end (Fig. 26). The pressure inside the combustion chamber increases above the pressure in- side the fuel and oxidizer feed manifolds. Combustion products penetrate into the feed lines and interrupt the flow of fuel and oxidizer to the DCC (aero- dynamic valves are closed). After the detonation wave reaches the DCC open end, the rarefaction wave propagates into the detonation products. At a certain time, this rarefaction wave reaches the contact boundary between the combus- tion products and fuel and oxidizer inside the corresponding feed manifolds and terminates the expansion of the combustion products into the feed manifolds (Fig. 2c) (aerodynamic valves are open). After this moment all gases propagate towards the DCC open end. Uncontrolled ignition of the combustible mixture is prevented by the combustion products 6 cooled in the feed lines (Fig. 2a"). Thereafter, the DCC is filled with combustible mixture again and the cycle is repeated.
241

HIGH-SPEED DEFLAGRATION & DETONATION
Figure 2 Operation cycle of a detonative combustion chamber: 1 — fuel and oxi- dizer feed manifolds, 2 — spark plug, 3 — fresh combustible mixture, 4 — explosion chamber, 5 — hot combustion products, and 6 — cold combustion products
After ignition of the combustible mixture, the following characteristic times of processes contribute to the cycle duration:
U
period of detonation formation; period of detonation propagation inside the DCC; period of adiabatic expansion of combustion products from DCC; period of outflow of combustion products from the fuel and oxidizer feed manifolds; period of DCC filling with the combustible mixture.
242

PULSED DETONATION ENGINES
Table 1 Influence of pressure inside feed manifolds, Pf, on the characteristic times determining the PDE cycle frequency
Pf, kPa ii, ms *2, ms tz, ms <4, ms is, ms m<i, ms /, Hz 2.5
294 1.1 1.1
0.3 0.3
1.42 1.42
132 3.33
91.2 4.66
226 10.86
4.25 92
Thus, the frequency of DCC operation depends on the following basic param- eters: combustion chamber length LCc, its diameter dec, length lj of the fuel and oxidizer feed manifolds, their diameter df, pressure Pf inside them, the type of fuel and oxidizer and oxidizer-to-fuel ratio ß. One can estimate the limiting frequency of DCC operation.
For a propane-oxygen mixture in a DCC of constant cross-section with LCc = 1 m, dec = 16 mm, six (6) feed tubes for fuel and oxidizer with dj = 6 mm and l/=6m, the estimated values of characteristic times are listed in Table 1, where / is the limiting frequency.
For the DCC with a variable cross-section, 1.71 m3 in volume, with a diameter of the outlet opening 16 and 25 mm, the characteristic times of the cycle and pulse frequency are presented in Table 2. The stoichiometric mixtures CH4+202, 2H2 + 02, and H2 + air were considered. The pressure in manifolds was equal to 0.3 MPa.
It follows from Table 2 that characteristic times t3,U, and t5 are the longest. They comprise 98.8% of the total cycle duration at low frequencies (< 4 Hz) and 74% at 92 Hz. Thus, reduction of these characteristic times is expected to be the most promising approaches in increasing /. The maximum operation
Table 2 Estimated characteristic times and pulse frequencies for several PDE con- figurations
dec = 16 mm
Mixture h, s
0.001 0.001 0.001
<2, S <3, s U, s h, s £*i> S /, Hz CH4 + 202
2H2 + 02
H2 + air
0.00125 0.00107 0.00155
0.0066 0.0053 0.008
0.0094 0.0075 0.0092
0.0169 0.0113 0.0149
0.035 0.0265 0.035
28.6 37.74 28.6
h, s <2, s
dec = 25 mm
Mixture <3, s h, s h, s X>> s /,Hz CH4 + 202
2H2 + 02
H2 + air
0.001 0.001 0.001
0.00125 0.00107 0.00155
0.0027 0.0022 0.0033
0.0047 0.0038 0.00465
0.0069 0.0046 0.0061
0.02 0.013 0.017
50 76.72 58.82
243

HIGH-SPEED DEFLAGRATION fc DETONATION
frequency of a DCC of constant geometric dimensions and combustible mixture composition, can be increased by increasing the total cross-section area of the fuel and oxidizer feed manifolds and by increasing the pressure inside the manifolds. However, it is impractical to increase / significantly by this means because the volume of cooled combustion products decreases and their temperature increases, which may lead to ignition of the combustible mixture by the detonation products of the previous cycle.
For the DCC of variable cross-section, the time of the adiabatic expansion of combustion products, ta, becomes important as its value decreases with an increase in the output diameter dCc- However the output diameter cannot be more than half the diameter of the main chamber (see Section 4).
Heating of DCC walls by detonation products is another factor limiting the operation frequency. During operation, there was an intense heat flux from the combustion products to the chamber wall. The flux depends mostly on the temperature of the products and detonation frequency. Depending on the cooling and operating conditions, the temperature of DCC walls changes and can become higher than the self-ignition temperature of the mixture. The latter can result in transition of detonative combustion to the conventional deflagration mode. Thus, in the case of DCC with d = 16 mm, the heat loss to the wall is about 40% of the chemical energy released at / = 1 Hz and up to 28% at a few dozens of hertz. The end section of the combustion chamber exhibits a 1.5-fold more stressed thermal state than the head section. At frequencies above 3 Hz the wall temperature of a DCC with natural cooling reaches the self-ignition temperature of the combustible mixture (stoichiometric methane- oxygen mixture) and uncontrolled spontaneous ignition takes place. In this case, DCC walls must be cooled.
4 MULTISTEP DETONATION PROCESS
In [5-9], a new mode of combustion, termed multistep detonation (MSD), was detected. In this mode, a high-speed flow with parameters higher than those behind a stationary detonation wave is produced. This mode was observed in the chamber of variable cross-section. It arises when the detonation wave is decoupled in the expanding cone 3 (see Fig. 1), and then recovered in the con- verging cone 5. Experimental studies of the MSD mode were conducted with the methane-oxygen mixture at initial pressure Px = 100 kPa and tempera- ture Ti - TOO K. Diameter of the DCC prechamber 2 was 16 mm. The main chamber 4 was 65 mm in diameter and 1 m long. The expansion angle of the transition section was 16°.
The MSD process can be explained as follows.
244

PULSED DETONATION ENGINES
Figure 3 Hugoniots for different initial states of a combustible gas
In the normal detonation process (see Fig. 3) gas is compressed by the shock wave to the pressure in the Hugoniot H1 and then ignition oc- curs, followed by an increase in tem- perature and decrease in pressure. Complete combustion is represented by point C\ on the detonation Hugo- niot Ji corresponding to the CJ pa- rameters for a steady detonation. If however the initial shock wave is not sufficiently strong as to cause igni- tion, a second shock wave can be in- troduced in the compressed but non- ignited gas behind the first shock wave. This second shock is repre- sented by shock Hugoniot H2. It will produce ignition and the system will pass to the higher detonation Hugo- niot J2 which corresponds to higher initial parameters (point A2). The final state C2 for this multistep detonation will clearly lie above the final state Q for a single stationary detonation.
Such a MSD mode can arise incidentally and uncontrollably both in a short detonation tube (near the end of the tube behind the reflected shock), or in a long tube (via deflagration-to-detonation transition). It has been shown that the MSD mode can reproducibly be localized by introducing a variable cross-section tube in a longer tube of a constant cross-section.
Figure 4 shows a schematic of the variable cross-section DCC and the proc- esses relevant to the MSD mode. The components of the combustible mixture are separately introduced and mixed in a transition section. Diameter and length of the transition sections are selected so that a stationary detonation forms in it. The additional requirement to the diameter is that the detonation wave, as it passes through the expanding cone and enters the main section of the DCC, decouples into a shock wave and flame front. As the decoupled wave system propagates towards the cylindrical section, separation between the shock and flame front increases.
In the converging cone, the shock wave undergoes Mach reflection and the gas is compressed to a state at which ignition occurs. As the wave system enters the narrower channel, it gives rise to a multistep detonation with the products having parameters higher than those of the CJ parameters in the initial detonation wave. In earlier publications [5-8] the MSD mode was referred to as a mode of Double Nonstationary Discontinuity. The new name appears to be physically more appropriate.
245

HIGH-SPEED DEFLAGRATION fc DETONATION
(A)
(*)
Figure 4 Schematic of the detonation chamber (a) and the distance-time diagram of The MSD mode: 1-2 - shock wave, 1-2' - combustion front, A, is the distance between the shock wave and flame front, 1-2-3-5-7 - shock wave, 1-2-9 - flame {rontj g'.g _ retonation wave, 4-6-7-8 — secondary detonation wave, 7-8 — multi-
step detonation
The MSD mode was studied experimentally with methane-oxygen mixtures. The MSD concentration limits were found to be narrower than for the CJ deto-
nation under identical initial conditions. Depending on mixture composition, detonation in the main chamber occurs
either in the CJ or in MSD mode. For methane-oxygen mixtures with ß < 1.2, detonation propagated in the last section of the main chamber at the average velocity D = 2300 ± 20 m/s (at ß = 1) and D = 2280 ± 30 m/s (at ß = 1.2). The range of ß from 1.2 to 1.4 appeared to be relevant to transient processes.
246

PULSED DETONATION ENGINES
In most cases, at ß = 1.2, the detonation wave passed into the main chamber without decay. However, sometimes the shock and ignition fronts decoupled and the MSD mode was observed in the main chamber. At ß > 1.4, the MSD mode was observed along the entire length of the main chamber, and this fact was a requisite condition for its origination. At ß > 1.8, a nonstationary shock - combustion front complex occurred in the main chamber, and no MSD mode was observed. In this case, the pressure in the shock wave was less than 1.0 MPa and the average wave propagation velocity from the inlet to the converging cone was Wg < 800 m/s. Thus, the concentration limit of the MSD mode in the DCC of variable cross-section was in the range of 1.4 < ß < 1.8 for methane-oxygen mixtures.
The detaled analysis of the processes involved in the MSD has been reported in [8].
The analysis was conducted based on measurements of pressure and lumi- nosity along the DCC (see Fig. 1). Figure 5a shows the signals from a pressure gauge and photodiode, mounted at section d, indicating detonation onset in the main chamber. In this case, the pressure gauge and photodiode simultaneously react to the detonation wave D. The photodiode detects three reflected waves B, C, and H resulting from Mach reflection. Figure 56 illustrates the MSD mode: a shock wave is followed by the flame front in the main chamber. In this case, only pressure gauge reacts to a shock wave W arriving at section d. The photodiode sensitivity is insufficient to record radiation from the gas behind the shock wave propagating in the initial gas mixture. The photodiode reacts only to the flame front F entering this section with some delay. In this way, separation
Figure 5 Pressure (lower curves) and luminosity (upper curves) in DCC recorded when detonation wave (a) and complex 'shock wave - combustion zone' (6) pass the gauges
247

HIGH-SPEED DEFLAGRATION & DETONATION
120 160 200 240 280 320 //nun
Figure 6 Detonation wave velocity in a cylindrical channel at sections f-h: 1 detonation, 2 — multistep detonation, 3 — Chapman-Jouguet velocity
of the flame front from the shock wave is determined. Later on, arrival of the reflected wave B and the retonation wave H, are recorded. These waves result from detonation formation in the converging cone.
Different modes of DCC operation are compared in Fig. 6. Both modes studied herein are unsteady. In both modes, the wave velocity at the outlet decreases to the CJ detonation velocity. However, initially, the MSD mode exhibits higher velocity values and greater flow parameters.
When using the DCC as a pulse detonation engine, efficiency of energy trans- formation will be better if higher gas parameters are attained behind the detona- tion wave. As the experiments show, the gas parameters in the DCC operating in the MSD mode are higher. Thus, this mode can be useful in designing new types of PDE.
5 CONCLUDING REMARKS
1. A detonation combustion chamber operating in a pulse mode has been cre- ated. The chamber can operate at a frequency of 3 Hz without forced cooling. With forced cooling, a frequency of 92 Hz was reached. For supplying fuel and oxidizer, a system of gasdynamic valves was used without mechanical parts.
248

PULSED DETONATION ENGINES
2. Operation frequency ranges for devices fed with different gaseous mixtures have been estimated. The limiting factors were found and discussed.
3. The new mode of combustion termed Multistep Detonation has been revealed. Physical explanation of the mode was suggested, and the conditions of its realization were established. For a given initial state, it has been shown that it is possible to produce flow parameters higher than those behind a stationary detonation wave. The Multistep Detonation mode can be arranged by proper variation of chamber cross-section.
4. Experimental studies of the pulsed detonation device operating on CH4+2/?02
mixture were performed at a pulse frequency of 0.5-2 Hz. The concentra- tion limits of the Multistep Detonation mode were found to be narrower (1.4 < ß < 1.8) than those of a single-step mode.
ACKNOWLEDGMENTS
This work was done in the frame of ONR propulsion program, headed by G. D. Roy, to whom authors express their gratitude.
REFERENCES
1. Eidelman, S., and X. Yang. 1998. Analysis of the pulse detonation engine efficiency. AIAA Paper No. 98-3877.
2. Roy, G.D. 1999. Pulsed detonation phenomenon for air breathing propulsion. ISABE 99-71.
3. Baklanov, D.I., et al. 1986. About some engineering aspects of detonation com- bustion regime using. Combustion Explosion Shock Waves 2:65.
4. Baklanov, D. I., L. G. Gvozdeva, and N. B. Scherbak. 2000. Estimation of frequency characteristics of pulsed detonation engine. 13th ONR Propulsion Meeting Proceed- ings. Minneapolis, MN: University of Minnesota. 233-38.
5. Baklanov, D.I., and L.G. Gvozdeva. 1995. Nonstationary processes during propa- gation of detonation waves in channels of variable cross-section. High Temperature 33(6):958-60.
6. Baklanov, D.I., and L.G. Gvozdeva. 1996. The effect of additional ignition on the stability of emergence of the mode of double nonstationary discontinuity in combustors. High Temperature 34(2):299-302.
7. Baklanov, D.I., L.G. Gvozdeva, and N.B. Scherbak. 1998. The formation of high pressure gas flow in frequency mode during nonstationary propagation of detona- tion. AIAA Paper. No. 98-2562.
249

HIGH-SPEED DEFLAGRATION fc DETONATION
8. Baklanov, D.I., L.G. Gvozdeva, and N.B. Scherbak. 1999. Formation of high- speed gas flow at combustion in the regime of multistep detonation. In: Gaseous and heterogeneous detonations: Science to applications. Eds. G. D. Roy, S. M. Frolov, K. Kailasanath, and N.N. Smirnov. Moscow: Enas Publ. 141-52.
9. Baklanov, D.I., L.G. Gvozdeva, N.B. Scherbak. 1999. Multistep detonation mode and its application. 17th ICDERS Proceedings. University of Heidelberg, Ger-
many.
250

EFFECTS OF NOZZLES OF DIFFERENT LENGTH AND SHAPE ON THE PROPULSION
PERFORMANCE OF PULSED DETONATION ENGINES
E. Daniau, R. Zitoun, C. Couquet, and D. Desbordes i
The influence of the addition of a nozzle to a cylindrical detonation chamber on the performance of a pulsed detonation engine (PDE) is examined through single-pulse experiments. Detonation is initiated at the closed end (called the thrust wall, TW) of the combustion cham- ber. Nozzles of different shape and length are tested: (i) cylindrical ones of the same diameter as the detonation chamber and (it) diverging ones. Measured parameters include thrust wall pressure histories and impulses. Experiments show that the presence of a nozzle greatly affects the performances of a PDE. Efficiency in terms of gain in 7sp is — in all tests — considerably increased by the presence of a nozzle. Nevertheless, it is further shown that the duration of the action of the cycle overpres- sure on the thrust wall is lengthened by using cylindrical nozzles, i.e., the delay for refueling the chamber with fresh mixture is increased, so is the cycling time. On the contrary, diverging nozzles of the same length exhibit shorter thrust wall overpressure duration and for a few of them, the same thrust wall overpressure history as without a nozzle. For these nozzles, if the maximum propulsive potential in terms of mass flow rate and cycling frequency are preserved, then the thrust may increase as Jsp.
1 INTRODUCTION
Since the historical pioneering works [1] and [2], PDEs have been extensively studied over the last decade [3-5]. They are currently the subject of increas- ing interest involving many analytical and experimental investigations. These engines belong to the class of alternative unsteady flow devices associated with high energy conversion efficiency. Because of nonsteady dynamics, analysis of such engines is more complex than that of steady engines.
251

HIGH-SPEED DEFLAGRATION fc DETONATION
It was already shown [6] that:
(1) The detonation of a stoichiometric C2H4-02 reactive mixture that filled completely a cylindrical chamber, closed at one end by the TW and directly open to the atmosphere for the exhaust of the detonation products, provides a specific impulse 7sp of 200 s. This result was comparable with what has been found elsewhere [7].
(2) 7sp does not depend on the location of the detonation ignition point [8]. Based on self-similarity of the expansion of detonation products, 7sp for mixtures of different Chapman-Jouguet (CJ) pressure (pCj) and velocity (DCJ) can be expressed by the formula
27/(7-1)
PCJ I -hi— ) ~ Po m JSP-
A' gp0Dcl
with a factor K of about 5.15 that allows all the results obtained in the range of pCJ (17-54 bar), DCJ (1300-3000 m/s) to match [9].
(3) The duration of overpressure on the TW is 8-10fcj, where tCj is the det- onation propagation time inside the combustion chamber (CC) used as the scaling time. The subsequent negative overpressure phase (due to the over- expansion of the detonation products) ends at about 20tCj- Negative over- pressure phase serves to refill the chamber with fresh mixture by direct injection of fuel and oxidizer contained in pressurized tanks or with atmo- spheric air by self-aspiration. The total dimensional time itot, i.e., 20<CJ,
that includes detonation propagation, exhaust of detonation products and aspiration of fresh gases, can be considered as the minimum PDE cycle du- ration which depends linearly upon the characteristic size of the detonation chamber. Maximum detonation frequency may then be defined on the basis
of/max = (itot)-1=(20<cJ)-1.
So, 7sp represents the propulsion efficiency of the detonative mode of transfor- mation of a unit of mass of the fresh reactive mixture. The thrust T is expressed by T ~ mlsp or /7sp. High thrust needs high mass flow rate m and for a chamber of fixed volume — a high cycle frequency /. Then, the minimum cycle dura- tion associated with a given CC is a very important parameter that influences considerably the PDE potential performance and has to be investigated.
Attempts to increase efficiency (7sp) rely essentially on adding a diverging nozzle after PDE's CC. Two aspects have been considered recently:
(i) the nozzle is filled with the reactive mixture, and
(ii) the nozzle serves only as an exhaust for the detonation products.
252

PULSED DETONATION ENGINES
The first point was studied computationally by Cambier and Tegner [10], and by Eidelman and Yang [11]. Their conclusion was that nozzles can drastically increase the efficiency of PDEs.
The second point was experimentally studied by Back and Varsi [12] with high explosives for propulsion in dense or high-pressure atmosphere of certain planets of the solar system. A gaseous C2H2-02 mixture was experimented by Zhdan et al. [7] in a partially filled cylindrical tube closed at one end. High specific impulses of 200-250 s and more were observed when long nozzles were added.
The aim of this study was to obtain a better understanding of the effects of nozzles on the PDE propulsive performance. The above-mentioned second con- figuration using cylindrical and diverging nozzles is addressed in this paper. At the exit of the CC there is a large expansion potential of high-pressure detonation products, which is lost (for propulsion) into the outer atmosphere. Controlled expansion of these gases through a nozzle permits the recovery of nonnegligible thrust. Nevertheless, a nozzle may affect the time required for the pressure in the CC to drop to a specific value (for instance, p = 1 atm) when a fresh mixture can be injected. Indeed, the cycling time will be faster if the tube is short and if rapid expansion takes place at the exit. These two aspects of the addition of a nozzle are studied here. For such a study, a small-scale test bed is useful and allows one to obtain information on the setups of larger scale because, as is well known, the flow of the CJ detonation products is self-similar.
2 EFFECT OF A DIVERGING NOZZLE — A SIMPLE ANALYSIS
When considering energies, an approximate analysis can be performed in the case of direct initiation of detonation at the open end of a completely filled cylindrical detonation chamber. In this configuration, one-dimensional (ID) steady condi- tions of ejection of detonation products at the exit section (where pe > pa) of the theoretically plane CJ detonation wave can be shown (Fig. 1). Using the plane self-similar solution of the isentropic expansion field behind the detona- tion wave (DW) propagating inside the tube with free rear expansion [13, 14], exhaust conditions (subscript e) are set by the approximate relations:
Pe = PCJ72T/(1
~7)
Te = TCJ1-2
Pe = /JCJ77/(1~7)
«e = IUCJI = ae
253

HIGH-SPEED DEFLAGRATION fc DETONATION
where p, T, p, u, a, and 7 are, respectively, the pressure, temperature, density, particle velocity, speed of sound, and isentropic expo- nent of detonation products which is assumed
constant. Thus, the flow is sonic at the exit sec-
tion (ue = ae) — the exhausting flow veloc- ity being in the opposite direction of the CJ detonation wave propagation — and remains sonic during the entire detonation propaga- tion and up to the backward motion of the shock wave produced by the reflection of the detonation wave on the TW. So, in the case of free expansion of detonation products into the atmosphere, the exit section constitutes a sonic throat. In this area, the pressure pe is generally higher than the ambient pres-
sure pa (since for 7 = 1.15, pe = 0.117pcj, so for the stoichiometric C„Hm-air mixture pe = 2.2 bar and for stoichiometric CnHm-02
mixtures pe - 4 bar at ambient conditions). If initiation of detonation is achieved at the thrust wall, a great part of the exhaust of detonation prod- ucts is also at sonic velocity at the exit section. Accordingly, an additional diverging nozzle may increase the thrust (and the specific impulse) by achieving supersonic ejection and a possible optimum expansion at the nozzle exit e', i.e.,
Pe = Pa- Steady isentropic expansion of detonation products beyond the throat (loca-
tion of ignition) into a nozzle, up to optimum expansion allows one to obtain the ratio of ejection area A'e to the throat area Ath by the following relationship (established for approximate ID steady conditions):
Figure 1 Flow velocity in the combustion chamber with ignition of detonation at the open end
Ath Mi 7+1 l + ^M'e
2 (7+l)/(2(7-l))
where M' is the ejection Mach number (M'e > 1) given by
K = =} = 7 a'e 7-I
PCJ\
Pa )
(7-l)/7 7 + 1 - 1
When applied to the C2H4-02 mixture, assuming 7 = 1.15 and pcj/Pa = 34, one obtains M'e = 2.264 and A'JAth = 2.71. The diameter of the exit section e' of the nozzle required for maximum expansion is then d'e - 1.645d(h. In the case
studied herein, d'e equals 82.3 mm.
254

PULSED DETONATION ENGINES
The above consideration brings some tools to understand the effect of nozzles in PDE propulsion, but does not take into account the unsteady part of the exhaust of detonation products into the atmosphere. Moreover, optimization with respect to the cycling time is not addressed in this analysis.
3 SINGLE-PULSE SETUP AND EXPERIMENTS
The basic experimental setup and procedure have already been described in a previous pa- per [9]. Nozzles of different shapes adapt to the CC. This CC consists of a cylinder 50 mm in internal diameter and of length Lcc closed by a mylar film 12 //m thick. The nozzle sec- tion length INZ is variable and ß is defined Figure 2 Schematic of the cylin- as the ratio L^z/Lcc, with LQC representing drical nozzle after the combustion the unit of length. Two series of experiments chamber for ß = 2
were conducted:
CC
(1) A first set with LCc = 65 mm and a cylindrical nozzle of the same internal diameter as the combustion chamber with different length, ß ranging from 0 to 5.7 (Fig. 2).
(2) A second set, with diverging nozzle ß = I, after the combustion chamber of Lcc = 100 mm, of different shapes displayed in Fig. 3: straight conical noz- zles, negative curvature (bell-shaped) nozzles, and composite nozzles, called A, B, and C, respectively. The exit cross-section has a diameter of 110 mm in all the experiments (i.e., the exit cross-section is larger than the theoretical optimum-expansion cross-section) except for one straight conical nozzle for which the angle of divergence a was chosen to be 5° with the correspond- ing diameter of 66 mm (lower than the optimum expansion diameter). For ß = 2, the nozzles consist of a combination of a cylinder of 100 mm length and one of the diverging nozzles described above (referred to as nozzles 2A, 2B, and 2C). An example of such a configuration (i.e., nozzle 2C) is shown in Fig. 4. For ß = 2, the effect of a straight diverging nozzle of the same exit diameter was also studied.
In all the experiments, a C2H4-02 stoichiometric mixture at p0 = 1 bar, T0 = 293 K is used. This mixture is characterized by a very small CJ det- onation cell size (A < 0.5 mm) and therefore the detonation regime is very easily obtained by either (?) DDT in a small tube of 12 mm inner diameter and 100 mm length (6% of the detonation chamber volume) with a Shchelkin spiral
255

HIGH-SPEED DEFLAGRATION & DETONATION
Figure 3 Shapes and sizes of the selected diverging nozzles for ß = 1: (a) schematic of L100 CC + L100 18° diverging nozzle (noz- zle A); (6) schematic of LI00 CC + L100 bell nozzle (nozzle B); and (c) schematic of L100 CC + L100 composite nozzle (nozzle C)
CC j
- 1 ..* ■«— 1
—»■
\ *—L- —►■
Figure 4 Schematic of L100 CC + L100 cylinder + L100 composite nozzle (nozzle 2C)
followed by the diffraction of the detonation wave into the larger volume of the combus- tion chamber, or (ii) by direct initiation of detonation by an exploding wire source that delivers roughly 30 J of energy.
Direct point ignition of detonation is achieved in both cases in the center of the TW, with a critical detonation curvature ra- dius (Rc) that does not exceed 10 mm.
Thrust effects resulting from the ignition device have been measured and are estimated to be negligible in comparison to the thrust obtained with mixture detonation in the main chamber.
To measure the thrust, a ballistic pendu- lum device is used. This device is described in detail in [8], and provides results with an accuracy of 5%. Detonation pressure profiles are measured by Kistler 603B pressure gages along the chamber and at the TW with the characteristic rise time of 1 fis.
4 RESULTS AND DISCUSSION
Because CJ detonations are obtained almost instantaneously, the pressure-time variations and impulse measured with ballistic pendu- lum are very reproducible.
Typical TW pressure-time profiles and impulse histories (obtained by the integra- tion of the overpressure signal over time) are displayed in dimensionless variables: 7r =
Ap/pcJ, T = t/tCj, and J = firdr, where
<CJ = LcclDa- In the case of diverging nozzles, the maximum impulse given is the one measured with the ballistic pendulum, because the pressure signal at the TW does not integrate the overall effects of the thrust that is applied on the PDE.
256

PULSED DETONATION ENGINES
Figure 5 Measured dimensionless Figure 6 Dimensionless impulse vs overpressure-time signal at the thrust wall time signal for 8 = 0 for ß = 0 of
4.1 Experiments Without Nozzle
Typical TW pressure-time records and impulse obtained in a CC without noz- zle are given in Figs. 5 and 6. In the following, this signal will serve as the reference.
After the quasi-CJ peak, pressure drops respectively to a plateau value over r - 6.2 (large pressure oscillations around the plateau value are observed due to successive reflections of hemispherical detonation on the tube walls) before decreasing until r = 10. In the following, this time will be referred to as rTW P - 0). The negative overpressure phase is smooth, with a minimum absolute pressure of p = 0.8 bar, and a duration rfw(/? = 0) of roughly 10 corresponding to an overall time rtot = r+w + r^w ~ 20 of TW pressure vari- ation during a cycle, in agreement with previous results. The specific impulse hP measures 200 s, m accordance with the results obtained using the ballistic pendulum method which integrates the whole unsteady effects of the exhaust detonation products.
4.2 Experiments with Cylindrical Nozzles
Concerning cylindrical nozzles, experiments performed previously and summa- rized m [15] are reported. Typical pressure-time records for different ß are shown in Fig. 7. Because the cylindrical nozzle controls and limits the expansion of detonation products in comparison to free direct expansion into the atmo- sphere, thrust diverges from the reference case (/? = 0) beginning at r ~ 5 and decreases slowly (with associated oscillation due to tube walls reflections) in the same way, up to a time r increasing with /?, before decreasing more rapidly to zero. As m the reference case (/? = 0), a shockless negative overpressure phase
257

HIGH-SPEED DEFLAGRATION fc DETONATION
exists when ß increases and serves self-aspiration. Specific impulse
Isp(ß) as well as 4w(ß) and
Ttot(ß) are given in Figs. 8 and 9. 7sp can be obtained either by the TW pressure signal integration or by ballistic pendulum and increases
linearly with ß. In summary, for the same vol-
ume of the detonable mixture, 7sp
is increased by the addition of a straight cylindrical nozzle, but the minimum cycling time is increased too, and hence the maximum op- erating frequency of the PDE de- creases. So, thrust increases in the same proportion as 7sp as long as the limiting time during the cycle remains, by far the time needed to
refill the fresh mixture. At a maximum operating frequency, for ß = 0, the time of exhausting detonation products r+w(/? = 0) = 10, and is of the same order as the filling time r^. When ß = 4, 7sp is two-fold 7sp(/? = 0) (m the vxcimty of 400 s), but time r+w(/? = 4) (where Ap = 0 on the TW) is 40, and rtot ~ 60 Then, in that case, /max(/J = 4) ~ (1/3)W0 = 0), and the maximum thrust that can be produced by a such system is more limited than without nozzle, the
gain of 7sp being counterbalanced by the decrease of /max or mmax.
Figure 7 Thrust wall dimensionless overpressure-time records obtained with cylindrical nozzles of different ß: 1-/3 = 0; 2 — 0.69; 3 — 1.8; and 4 — 5.7
Figure 8 Specific impulse 7sp vs. ß when using cylindrical nozzles: 1 — authors' re- sults, 2 — Russian results [7], 3 — fit 1, 4 —fit 2
Figure 9 r^w and r,„t vs. ß when using cylindrical nozzles: 1 — rtot, 2
+ , 3 — fit (r.ot), 4 — fit (r+w) 'TW
258

PULSED DETONATION ENGINES
4.3 Experiments with Diverging Nozzles
The main features concerning results obtained with diverging nozzles can be summarized as follows:
- for the same value of ß, the specific impulse is higher than in the previous case and can only be provided by ballistic pendulum method because inte- gration over time of the TW overpressure signal yields only a part of the total impulse (the part obtained by the diverging nozzle is missing);
- the overpressure duration on the TW, r+w(ß), is less than in the previous case and may be reduced to T$w(ß = 0) for several nozzle configurations.
For the straight conical nozzle a (cone half-angle) varies from 0° decreases (Fig. 10). A gain of 36% in nozzle with a time r,fw matching the reference one.
As a increases, r-jtw tends to- wards T^(ß = 0). For a = 5°, the effect of the nozzle can be clearly seen for r > 6 with an overpressure higher than in the reference case and an increase of T£W up to 13. For a = 18° (corresponding to an exit cross-section larger than that calculated for the optimum expan- sion), r£w(ß = 1) = T+W(ß = 0), the only difference on the TW pressure signal is the presence of a weak shock wave that occurs in the negative overpressure phase. This shock wave may be due to the over- expansion in the nozzle.
experiments with ß = 1, 7sp increases as to 18° (Table 1), and time r^w (or Ap) isp is observed with a = 18° straight conical
Figure 10 Thrust wall dimensionless overpressure-time records obtained with straight conical nozzles for ß = 1: 1 — a = 180° (reference signal); 2 — 0°; 3 — 5°; and 4 — 18°
Table 1 Specific impulse for diverging nozzles with a = 0°, 5°, 18°; a = 180° represents the reference case
a I (N-s) J.P (s) Gain TTW 180° (reference) 0.475 200 — 10
0° 0.586 247 +23.5% 16 5° 0.609 257 +28.5% 12
18° 0.649 273 +36.5% 10
259

HIGH-SPEED DEFLAGRATION fc DETONATION
Table 2 Impulse and Iap obtained with diverging nozzles for ß = 1
Type (ß = 1)
Straight diverging 18° (A) Bell (B) Composite (C)
I (N-s) 7äp (s) Gain r+w
0.649 0.774 0.787
273 302 311
+36.5% 10 +51.0% 10 +55.0% 10
0.8
0.6
J0.4 <
0 5 10 15 20 25 30 35 40 T
Figure 11 Thrust wall dimensionless overpressure-time records obtained with diverging nozzles for ß = 1: R — refer- ence case (ß = 0); A — straight diverging nozzle; B — bell-shaped nozzle; and C — composite nozzle
0.2
0.0'
-
-
2C ii / /2B 11 / / ,2A
tm / / / ,A \\ / / / / /R
■
i.i.i .i—i—,—i—.—i
0 10 15 20 25 30 35
Figure 12 Thrust wall dimensionless overpressure-time records obtained with diverging nozzles for ß = 2: R — refer- ence case (/? = 0); A — straight diverg- ing nozzle; 2A — cylinder + 18° diverg- ing nozzle; 2B — cylinder + bell-shaped nozzle; and 2C — cylinder + composite nozzle
Table 3 Impulse and 7äp obtained with diverging nozzles for ß = 2
Type (ß = 2) I (N-s) Jsp (s) Gain T£W
Cylinder + 18° (2A) 0.705 279 +39.5% 16
Cylinder + bell (2B) 0.794 314 +57.0% lb
Cylinder + composite (2C) 0.796 315 +57.5% lb
Straight diverging (A) 0.859 340 +70.0% 1U
The other nozzles of negative curvature with ß - 1 provide very interesting results. As 7sp is larger than Isp(ß = 0), the TW overpressure+signals are very similar to the reference one (in particular, T£W(/? = 1) = rTW(/? = 0)), the only difference is that the return to the atmospheric pressure at the end of
260

PULSED DETONATION ENGINES
the negative overpressure phase is pretty abrupt and denotes the presence of a weak shock wave as observed in the previous case for a = 18°.
The bell-shaped and composite nozzles are especially efficient, as is high- lighted by the results displayed in Fig. 11 and Table 2. A gain of more than 50% of Isp is obtained without modifying r,+w and hence the maximum possible frequency.
As ß increases to 2, the possibility to obtain higher impulse is augmented. Certain nozzle configurations, as for instance a cylinder of constant section fol- lowed by a diverging nozzle, i.e., 2A, 2B and 2C does not bring anymore impulse than the simple diverging section, when the TW overpressure time r^m increases (Fig. 12 and Table 3).
It can be pointed out that a rapid increase of section just after the CC (remind that this plane is sonic for a great part of the exhaust of detonation products) promotes a gain in impulse without changing r^w. On the opposite, a slow increase of nozzle section after the combustion chamber gives a smaller gain in Isp, while increasing r^w. This configuration is obviously less efficient than the first one.
5 CONCLUDING REMARKS
The influence of cylindrical and diverging nozzles of different shapes and lengths on the propulsion efficiency of PDE has been investigated in a single-cycle ex- periment using the same fuel-oxygen detonative mixture (C2H4 + 302 at nor- mal conditions) contained in a cylindrical chamber. Without nozzle, detona- tion being initiated at the closed end of the cylinder, 7sp is measured at 200 s and the TW positive overpressure duration is maintained during r^w = 10 (t = lOfcj). With cylindrical nozzles, as ß (nozzle length over combustion chamber length) increases, Itp is increased as r+w does. Obtaining JBp as high as 400 s (~ 2Isp(ß = 0)) is easy but at the cost of the loss of maximum PDE cycling frequency (or maximum mass flow rate).
The addition of the diverging nozzle contributes to increase in Isp more sig- nificantly than cylindrical nozzles and reduces r^w(/?) for the same ß. For several configurations, r+w(/3) = r+w(/? = 0), i.e., the maximum cycling fre- quency may be maintained at the value provided by the detonation chamber alone. So, a gain in thrust may be effective in that case even at the lim- iting frequency. The main shortcoming associated with the addition of di- verging nozzles is that normally a PDE section is larger, increasing drag and then reducing overall performance in the case of a PDE used in ambient atmo- sphere.
261

HIGH-SPEED DEFLAGRATION fc DETONATION
REFERENCES
I. Nicholls, J.A., H.R. Wilkinson, and R.B. J. Morrison. 1957. Intermittent detona- tion as a thrust producing mechanism. J. Propulsion 27:534-41.
2 Helman D., R. P. Shreeve, and S. Eidelman. 1986. Detonation pulse engine. AIAA Paper No. 86-1683. 22nd AIAA/ASME/SAE/ASEE Joint Propulsion Conference
Proceedings. Huntsville, AL. 3 Eidelman S., and W. Grossmann. 1992. Pulsed detonation engine experimental
and theoretical review. AIAA Paper No. 92-3168. 28th A1AA/SAE/ASME/ASEE Joint Propulsion Conference and Exhibit Proceedings. Nashville, TN.
4. Sterling, J-, K. Ghorbanian, J. Humphrey, T. Sobota, and D. Pratt. 1995. Numeri- cal investigations of pulse detonation wave engine. 31st AIAA/ASME/SAE/ASEE Joint Propulsion Conference and Exhibit Proceedings. San Diego, CA.
5. Hinkey, J.B., S. E. Henderson, and T. R. A. Bussing. 1998. Operation of a flight- scale rotary-valve, multiple combustor, pulse detonation engine (RVMPDE). AIAA Paper No. 98-3881.
6. Zitoun.R., and D. Desbordes. 1999. Propulsive performances of pulsed detonations. Combustion Science Technology 144:93-114.
7. Zhdan, S.A., V.V. Mitrofanov, and A.I. Sychev. 1994. Reactive impulse from the explosion of a gas mixture in a semi-infinite space. Combustion Explosion Shock
Waves 30(5):633-57. 8. Zitoun, R., V. Gamezo, C. Guerraud, and D. Desbordes. 1997. Experimental study
of the propulsion efficiency of pulsed detonation engine. 21st Symposium (Interna-
tional) on Shock Waves. 1:421-25. 9. Zitoun, R., E. Daniau, and D. Desbordes. 2001 (in press). Thrust, impulse and
specific impulse for different reactive mixtures in detonation regime. Shock Waves.
10. Cambier, J.-L., and J.K. Tegner. 1998. Strategies for pulsed detonation engine performance optimization. J. Propulsion Power 14(4):489-98.
II. Eidelman, S., X. Yang, and Z. Lottati. 1995. Pulsed detonation engine: Key issues.
AIAA Paper No. 98-3877. 12. Back, L.H., and G. Varsi. 1974. Detonation propulsion for high pressure environ-
ment's. AIAA Paper No. 74-1223. 13. Stanyukovich, K. P. 1960. Unsteady motion of continuous media. Pergamon Press.
14. Gruschka, H.D., and F. Wecken. 1971. Gasdynamic theory of detonation. Gordon and Breach. ASIN 0677033702 (out of print).
15 Zitoun, R., and D. Desbordes. 1996. Effect of a nozzle on PDE performances 28th Symposium (International) on Combustion Proceedings. (Work in progress.) Pittsburg, PA: The Combustion Institute. 173.
262

FORCED NONUNIFORM PRESSURE OSCILLATIONS IN A TWO-DIMENSIONAL
SUPERSONIC INLET
S. Mullagiri and C. Segal
An external-internal compression, two-dimensional inlet has been tested at flow Mach number 2.5 with a sinusoidal excitation of the back pres- sure, both in time and in the spanwise direction, simulating the condi- tions in an inlet of a pulsed detonation engine (PDE). The shock oscilla- tions arising from the fluctuating back pressure were confined within the diffuser section of the inlet and no observable instabilities propagated upstream of the throat.
1 INTRODUCTION
Among the proposed PDE configurations that have been considered are multi- tube detonation devices connected to a common inlet. These designs allow for the generation of continuous thrust by initiating the detonation and recharging the detonation ducts at controlled frequencies [1-4]. Such configurations raise the issues of inlet - combustion chamber interactions resulting in unsteady inlet flow fields. The inlet exit plane experiences nonuniform pressure fields arising from the operation of the PDE detonation tube valves.
Severe effects on the back pressure, induced by the valving system of the detonation tubes, will affect the operation of the inlet including the potential of hammershock and unstarting of the inlet. If a single inlet is used as a plenum for multiple detonation tubes, the back pressure is then expected to have a reduced effect on the inlet flowfield. However, the spillage from a closing valve into an adjacent opening one may affect the combustion chamber operation by affecting the fuel-air mixture ratio.
The unsteady interactions between the combustion chamber and supercrit- ical inlets have been studied by various researchers to understand the effect of
263

HIGH-SPEED DEFLAGRATION & DETONATION
combustion instabilities on the diffusers as well as the effect of natural oscilla- tions on the combustion chambers. These studies have been mainly conducted on ramjets and in most of them, the exit plane pressure has been simulated by uniform pressure oscillating only in time.
Previous theoretical studies [5] indicate that during the transient flow at the inlet exit produced by the valving system of a stack of detonation tubes, the time available for the transfer of air between adjacent tubes is O(10 //s), which is significantly shorter than the time required to form the hammershock, 0(10 ms). Thus, the concept of a plenum inlet supplying air to multiple tubes has the potential to become a practical solution for the inlet of PDE.
Studies on forcibly excited transonic and low supersonic inlets [6] indicate that the shock displacement amplitudes are inversely dependent on the back pressure excitation frequency. These results agree with the findings of the present work.
The current experiment simulates the operation of a PDE inlet, wherein the exit is nonuniformly excited in a sinusoidal manner both in space (spanwise di- rection) and in time. The amplitudes of the pressure excitation were also varied. This was achieved by blocking the exit with four plunging pistons mounted on a camshaft having a phase difference of 90° between two adjacent cams. Each set of pistons offered a different blockage at the exit, thus varying the amplitude of excitation. In a previous study [6], partial blockage has been applied over 30% of the inlet, effectively simulating a 70% bypass. In the present work, blockages of 32%, 40%, 67%, 75%, and 83% have been used with the excitation frequencies from 15 to 50 Hz. Bierdon and Adamson [7] found in an analytical study that for large amplitude oscillations, the overall tendency for the mean shock position is to move upstream of the diffuser and the shock eventually gets pushed out. They also determined that low frequencies had the same effect as high amplitude oscillations. At higher excitation frequencies, the shock train was predicted to be stable. This study was performed with only 3% excitation of the back pres- sure, significantly lower than expected values for PDE operation. Despite the large blockage in the present work, the inlet started and remained started for all test conditions. The degree of pressure oscillations increased with increasing blockage and decreased with increasing excitation frequency.
2 EXPERIMENTAL SETUP
Figure 1 shows the two-dimensional model inlet. It has a 10° and 12-centimeter long ramp designed for operation at Mach number 2, and a throat height, h, of 1.2 cm with a short throat length followed by a 7.5/i diffuser with 2-degree expansion on the lower wall and 1-degree expansion on the upper wall. The inlet is installed at the University of Florida — Mach-4 wind tunnel facility, that has
264

PULSED DETONATION ENGINES
fumberV A 10"de§ree' 12-cent™eter long ramp designed for operation at Mach
a 15 x 15 cm test section. The Mach number of the facility can be continuously varied from 1.2 to 3.8.
Static pressure in the inlet was acquired simultaneously from thirteen (13) static pressure ports located along the flow direction connected to a Pressure Systems PSI-9010 pressure scanner.
Figure 2 shows the sketch of the model and the location of the 13 static pressure ports distributed on the lower and upper walls of the inlet. Table 1 indicates the location of the static pressure ports. The exit plane of the inlet is a 1.54 x 5 cm rectangle. The aim of this work is to study the effect of a row of four ad- jacent detonation tubes of the PDE, operating at the exit of the inlet, on the sta- bility of the flowfield in the inlet. The opening and clos- ing of the intake valves on the detonation tubes is modeled by a set of four plunging pis- _. tons distributed uniformly * 1?-"re Inkt schematic and the location of 13 „„„„ t, ,,, . , , J statlc pressure ports on the bottom and top walls, across the span of the inlet as The exit is 1.54 cm high and 5 cm wide
265

HIGH-SPEED DEFLAGRATION fc DETONATION
Table 1 Locations of the pres- sure ports normalized by the throat height and referenced to
the throat location
described in the introduction. The blockage ratios offered by these pistons were defined in this work as the ratio of the total face area of the pistons to the exit plane area. However, since the pistons are operating out of phase with each other, the effective blockage offered is less than the designated value. Four dy- namic pressure transducers at the duct exit measured the forced pressure fluctuations in
the spanwise direction. Figure 3 shows the back pressure excita-
tion mechanism used to simulate the pres- ence of the combustion tubes valving system. Individual cams operating at cycle frequen-
cies modulated by an external electrical motor move the pistons simulating op- eration of the valves. The electrical motor allows for excitation up to 50 Hz if
the required torque does not exceed the limit. The cams can be positioned at different phases with respect to each other
allowing different opening sequences for adjacent valves. Thus, the extent of the effects of spillage from adjacent tubes on deterring the formation of hammer- shock can be evaluated by simultaneously closing two, three or all four channels. Similarly, cam profiles can be modified to investigate the effects of fast and slow
Port x/h Port x/h
1 -0.193 8 0.031
2 0.315 9 0.883
3 0.890 10 1.171
4 2.896 11 2.034
5 5.197 12 4.046
6 -2.126 13 6.347
7 0.021
Figure 3 Back pressure excitation mechanism. Four pistons simulate the presence of PDE tube valves with actuating cams at different phases. Individual piston cycle is a function of the cam profile and driving frequency
266

PULSED DETONATION ENGINES
opening with the goal to ensure rapid tube air filling and to allow sufficient time for propellant refill and detonation. The current cams are designed based on estimates that indicate that approximately equal times for the propellant refill and evacuation are required for efficient PDE operation [5]. However, other cam profiles would model different cycle sequencing.
The experiments discussed in this paper are confined to tests with Mach number 2.5. Five different sets of piston faces affecting the blockage ratio at the exit were used to get different excitation pressure amplitudes. Both low (15 and 20 Hz) and high frequency (exceeding 40 Hz) excitation were attempted. The excitation frequency could be maintained in almost all the cases and the highest frequency attained at different blockage ratios was limited by the power of the motor. The blockage ratios offered by the piston faces ranged from 32% to 83%.
Data acquisition of the axial pressures was limited by the PSI-9010 pressure scanner, which could be read at a maximum frequency of 25 Hz. However, the exit-plane pressures were measured by Omega PX303 transducers at 3 kHz at four locations across the duct. Though the frequency information about the shock oscillation cannot be obtained due to the limitation of the data acquisition, certain trends are clearly identifiable and are described below.
3 RESULTS
Figure 4 shows the wall pressures normalized by the stagnation pressure trace for the case with no pistons installed. This test serves as a base line to compare the results from all other exper- iments.
The pressure field is constant in the duct except at the loca- tion where x/h = 5.2. The low- frequency oscillation settles down after some time. The loca- tion x/h = —2.1 corresponds to the first port on the ramp. The inlet remained started on all the tests conducted at Mach num- ber 2.5 and the pressures at x/h = —2.1 confirmed this.
0.14
0.12
0.10
I 0.08
0.06
0.04 4 6 Time/s
10
Figure 4 Normalized wall static pressure dis- tribution without forced back pressure excitation (Po is the stagnation pressure): 1 —- x/h = 5.2; 2 — 6.3; 3 2.1; 4 — 4.0; and 5 — 2.9
267

HIGH-SPEED DEFLAGRATION Sz DETONATION
Figure 5 shows the time trace of the normalized pressures for various blockage ratios and at an excitation frequency of 20 Hz.
With the ratio of the total face area of the pistons, Ap, to the exit plane area Ae, Ap/Ae = 0.32 (Fig. 5a), no rapid fluctuation in the normalized pres- sure distribution was observed. The flow remained supersonic to about 70% of the diffuser length. The mean pressure profile seems to change at a very low frequency. When'-4p/j4e was increased to 0.4, the disturbances propagated upstream to about half of the diffuser length. Comparing the pressure profiles with no blockage, all the pressures upstream ofx/h - 4.0 remained undisturbed. Further increase in the blockage ratio resulted in the disturbances to propagate further upstream. The pressure profiles at x/h = 0.2 and 0.9 indicate that the shock structure near the throat has been slightly shifted, but remained stable. The pressure at x/h = 2.0 strongly suggests that the pressure disturbances are located downstream from that port.
The plots in Figs. 56 to 5e show an increase in the frequency of pressure perturbation at certain locations. This is only indicative and the limitation of the scanner readout speed prevents deducing any frequency information. Fu- ture experiments with a fast data acquisition in the axial direction will provide this information. The results from tests conducted at 15 Hz and the maximum attainable frequencies show similar trends.
Figure 6 (left column) shows the effect of blockage and frequency on the mean pressure distribution. The mean pressure increases with the blockage at all frequencies. It can also be noted that for each blockage ratio, the mean pressure distribution remains almost the same at all frequencies. The pressures at locations upstream of x/h = 0.3 indicate that the inlet remains started at all blockage ratios and at all frequencies.
The pressure perturbations in Fig. 6 (right column) show that most of the fluctuation is confined within two-thirds length of the diffuser from the exit plane. The pressure perturbation amplitude can be expected to grow with the blockage ratio. However, in Figs. 6a and 66 (right column), the maximum amplitude occurs at Ap/Ae = 0.75. The reason for this could be that the mean shock position is in close vicinity of the pressure port. Also, from Fig. 6c (right column) it can be observed that higher frequencies of excitation result in lower pressure fluctuations.
Figure 7 shows a cross-spectrum between two adjacent high speed transduc- ers placed in the transverse direction at the exit plane. A butter-worth bandpass filter with the low and high cut-off frequencies of 2 Hz and 300 Hz was applied to the data. The absence of any significant peaks other than those at the excitation frequencies and their harmonics at the exit suggests that the external excitation does not induce any other modes of lateral pressure oscillations with large am- plitudes. Most of the experiments gave similar results, however the data from some of the experiments were inconclusive and a more detailed analysis would have to be carried out.
268

PULSED DETONATION ENGINES
Time / s
Figure 5 Effect of blockage on the static pressure profile showing the upst] propagation of the disturbance: (a) Ap/Ae = 0.32; (6) 0.4; (c) 0.67; (d) 0.75; ant 0.83. l—x/h = 2.9; 2 - 5.2; 3 - 0.2; 4 - 0.9; 5 - 2.0; 6 - 4.0; and 7-63
269

HIGH-SPEED DEFLAGRATION & DETONATION
30
25-
20
a, 10
- ♦ / o 2 A3
' v 4 O 5
- D 6
!
__ 4J
a.
30
25
-♦ 7 o 5 A 9
' vlO Oil
20
15
10 I 2£><3k
5 v\t&& ^§^ i ™ * ,JL_JL3L u
-2
(c)
2 JC/Ä
Figure 6 Effect of blockage ratio on the dimensionless, time averaged, static pressure distribution (left column) and on the pressure oscillation amplitude P' = Pmax - Pmin (rieht column): (a) excitation frequency 15 Hz; (6) 20 Hz; and (c) maximum fre- quency. 1 - Blockage 0%; 2 - 32%; 3 - 40%; 4 - 67%; 5 - 75%; 6 - 83%; 7 - blockage/frequency: 0%/none; 8 - 32%/47 Hz; 9 - 40%/46 Hz; 10 - 67%/43 Hz; jfl — 75%/39 Hz
270

PULSED DETONATION ENGINES
-60
9
Am
plitu
de /
o
o
: pi fH -90
.mo —i—i—11111ii—i ii i i
10" 10' 10' Frequency / Hz
Figure 7 Cross-spectrum between two adjacent pressure ports located at the exit. The excitation frequency is 48 Hz
4 CONCLUDING REMARKS
A supersonic inlet with back pressure excitation to simulate the flow field ex- perienced by the inlet of a PDE has been tested at Mach number 2.5. The excitation frequency was varied from 20 to 50 Hz and the amplitude was varied by increasing the exit blockage from 32% to 83%. The results indicated the following:
- the pressure oscillations inside the inlet were confined to downstream of the throat and no adverse effects were observed on the flow field upstream of the throat, i.e., the inlet remained started for all the test conditions;
- the effect of increasing the excitation frequency was a decrease in the am- plitude of the pressure perturbations;
- the effect of increasing the amplitude of the excitation was an increase in the mean pressure field inside the diffuser; and
- the cross spectrum between two adjacent pressure measurements at the exit plane does not show peaks other than the excitation frequencies suggesting no significant modes of lateral pressure oscillations are introduced.
ACKNOWLEDGMENTS
This work has been supported by the US Office of Naval Research through the Mechanics and Energy Conversion Division.
271

HIGH-SPEED DEFLAGRATION fc DETONATION
REFERENCES
1. Bussing, T., and G. Pappas. 1994. An introduction to pulse detonation engines. AIAA Paper No. 94-0263.
2. Cambier, J. L., and J. K. Tegner. 1997. Strategies for PDE performance optimization. AIAA Paper No. 97-2743.
3. Eidelman, S. 1997. Pulse detonation engine: A status review and technology devel- opment road map. AIAA Paper No. 97-2740.
4. Eidelman, S., and X. Yang. 1998. Analysis of the pulse detonation engine efficiency. AIAA Paper No. 98-3877.
5. Pegg, R. J., B. D. Couch, and L. G. Hunter. 1996. Pulse detonation engine air induc- tion system analysis. AIAA Paper No. 96-2918.
6. Sajben, M., T. J. Bogar, and J.C. Kroutil. 1984. Forced oscillations in supercritical diffuser flows. AIAA J. 22(4):465-74.
7. Biedron, B. T., and T. C. Adamson. 1988. Unsteady flow in a supercritical supersonic diffuser. AIAA J. 26(ll):1336-45.
272

DIODE-LASER BASED SENSORS FOR PULSED DETONATION ENGINE FLOWS
T. P. Jenkins, S. T. Sanders, J. A. Baldwin, W. Fan, D. S. Baer, and R. K. Hanson
Newly-developed diode-laser absorption techniques for in situ measure- ments of flow properties have been adapted to pulsed detonation en- gines (PDEs). Three diagnostic concepts that have been demonstrated are presented: a sensor employing five multiplexed diode lasers operat- ing in the 1300-1800 nm spectral region for monitoring gas temperature and steam concentration, a two-wavelength modulated diode-laser di- agnostics for sensing soot temperature and soot volume fraction, and an absorption diagnostic for ethylene (fuel) concentration. Temperature of the postdetonation gases is determined from the ratio of water va- por absorbances at different resonant wavelengths, while species mole fractions are determined from the measured gas temperature and ab- sorbances at a selected resonant wavelength. Soot volume fraction is obtained from measured absorbances at nonresonant wavelengths, and alternatively from two-color emission pyrometry, which also yields soot temperature. The sensors' fast time response and nonintrusive nature make them suitable for measurements in the hostile environments gen- erated by PDEs. Ethylene concentration prior to detonation is moni- tored using absorption of a He-Ne (3.39 /im) laser. Measurements are presented for liquid-fueled (JP-10) and gaseous-fueled (ethylene) PDEs. The success of these measurements demonstrates the potential of diode- laser sensors for PDE model validation and possible use for on-board sensing and control systems.
1 INTRODUCTION
Pulsed detonation engines offer several potential advantages over conventional propulsion concepts [1-4]. However, a number of issues need to be resolved to help bring about practical propulsion solutions involving detonations. For exam- ple, there is a need for capability to predict detonation to deflagration transition
273

HIGH-SPEED DEFLAGRATION fc DETONATION
(DDT) lengths, detonability limits, and combustion stability. Better under- standing of these phenomena in the near future seems likely, owing particularly to improvements in chemistry models and increasing computational power [5-7]. However, traditional experimental techniques used to investigate detonations, which have involved measurements of pressure and qualitative imaging, are not able to provide the full spectrum of data needed to validate advanced computer models. Newly developed diode laser based absorption techniques offer practical solutions to the measurement of species, temperature, velocity, soot concentra- tion, and spray characterization in detonation experiments. When coupled with fiber optics, the compactness and ruggedness of diode lasers may also permit their use as on-board sensors for active control.
Previous work on line-of-sight absorption diagnostics at Stanford University has lead to the development of techniques involving rapid-scanning tunable diode lasers (TDLs) operating at visible and near-IR wavelengths (650 nm - 2.3 /im). These lasers are attractive sources for spectroscopic probing of species owing to their low cost, ruggedness, and compatibility with fiber optics. These charac- teristics, combined with the relative simplicity of absorption diagnostics, offer large potential benefits for applications in the hostile environments associated with PDE testing and development. The simplicity of the Beer-Lambert law of absorption enables straightforward reduction of absorption data as long as properties are relatively uniform along the line-of-sight of the absorption meas- urement and the necessary spectroscopic parameters are known.
Progress in three diagnostics concepts that have been demonstrated and im- plemented in both gas- and liquid-fueled PDEs are summarized in the present paper. These include: a five-wavelength line-of-sight diode laser absorption tech- nique which yields H20 mole fraction and gas temperature, a two-wavelength soot diagnostic based on combined emission and modulated diode laser extinc- tion for soot volume fraction and temperature, and a technique for monitoring C2H4 fuel vapor based on 3.39 /im He-Ne absorption.
2 DESCRIPTION OF TECHNIQUES
2.1 H2O Absorption
The theoretical basis for determining gas temperature and species concentra- tion in combustion flows from measured molecular absorbance at multiple wave- lengths has been described previously [8]. In brief, the Beer-Lambert rela- tion [9] is used to determine gas temperature from the ratio of measured H20 absorbances at multiple wavelengths. Using an independent measurement of pressure, the water mole fraction is then determined from the measured absorp-
274

PULSED DETONATION ENGINES
Ge detectors
Grating
Diode Lasers
X.nrl=1290 nm (nonresonant) Xi=1343.297 nm (H20) >»2=1391.673nm(H20) ^3=1799.180 nm(H20) _
Xnr2=l 650 nm (nonresonant) ffl Fiber with
multiplexed beam
Figure 1 Five-wavelength tunable diode laser absorption diagnostics for measuring gas temperature and H2O mole fraction
tion at a selected wavelength using the known absorption line strength at the measured temperature.
Figure 1 shows the layout for the technique using five wavelengths. Based on simulated spectra, H20-resonant wavelengths of Ai = 1343.297 nm, A2 = 1391.673 nm, and A3 = 1799.180 nm were chosen for maximum sensitivity to temperature over the 900-3300 K range. The spectroscopic parameters for the transitions have been detailed [10] and verified [8] previously. Nonresonant wavelengths Anri = 1290 nm and Xnr2 - 1650 nm were chosen to account for any contributions to the measured transmission that were not due to H20 va- por. Such contributions can include extinction from soot as well as changes in the transmission of the windows associated with heating by the combustion gases. Figure 2 depicts how the measured transmission consists of nonreso- nant and resonant components. Subtraction of the nonresonant component, obtained using nonresonant beams, yields the correct resonant absorption meas- urement.
275

HIGH-SPEED DEFLAGRATION & DETONATION
'L Detonation wave arrives
Attenuation from soot & thermal effects on windows
Resonant H20 absorption
0 Time
Figure 2 Depiction of transmission (I/Io) of a resonant beam during the passage of a detonation wave. Measured attenuation is composed of resonant and nonresonant contributions
As shown in Fig. 1, each of five DFB-type diode lasers send light via standard communications grade optical fiber (50 /im core) to the detonation experiment. All lasers except the laser at A2 are operated at fixed wavelength; A2 is tuned at 30 kHz over the target H20 absorption feature. The light passes through a depolarizer to mitigate the effects of stress-induced birefringence at the sapphire windows. The beam traverses the path through the experiment and is demul- tiplexed (into its component wavelengths) by a diffraction grating (830 g/mm, Aj = 1.2 //m). In addition to demultiplexing the wavelengths, the grating rejects flowfield emission. The transmitted light is monitored by germanium detectors (2 MHz bandwidth, 3 mm in diameter). The detector voltages are digitized using a 12-bit analog to digital (A/D) card installed in a personal computer.
The grating and lenses in the transmitted-beam collection path have been arranged for minimum sensitivity to flow-induced beamsteering. By simulating beam steering using wedge windows, this collection system was found to be insensitive (to within 0.1%) to angular beam deflections of up to 2.6°. The duration of nonnegligible beamsteering associated with the passage of a typical detonation wave was found to be less than 4 //s.
2.2 Soot Diagnostics
Two-color pyrometry is a commonly used method for measuring soot temper- ature and volume fraction for studies in laboratory flames [11] and diesel en-
276

PULSED DETONATION ENGINES
Detectors,
Detonation tube
Diode lasers Detonation
wave
Figure 3 Emission and diode laser extinction diagnostics for measuring soot temper- ature and volume fraction
gines [12]. Laser extinction offers an alternative and also widely used method for measuring soot volume fraction [13]. For characterizing soot in PDE studies, a diagnostics employing simultaneous emission and laser extinction at each of two wavelengths has been developed [14]. For certain conditions, the combination of emission and extinction measurements permits improvements in the accuracy of soot temperature measurements over conventional two-color pyrometry. How- ever, for conditions at which there is not enough soot, or when strong thermal heating of the windows is present, the diagnostic still allows temperatures and soot volume fractions to be obtained by conventional two-color emission pyrom- etry.
Figure 3 shows the arrangement of components of the combined emission/ absorption soot diagnostics. Emission from the detonation region is collected along a path and focused into a fiber. Light exiting the fiber at the other end is collimated by a lens and separated into two beams by a beam splitter. One of the beams is directed through an 830 nm filter (with a 40 nm bandwidth) onto a Si photodiode detector. The other beam is directed through a 1300 nm filter (75 nm bandwidth) onto an InGaAs photodiode detector. Signals from the detectors are digitized with 12-bit resolution at a rate of 5 MHz using a computer-based oscilloscope.
The same detection system used for monitoring flame emission is used for monitoring transmitted laser light. Beams from two diode lasers, one at 830 nm
277

HIGH-SPEED DEFLAGRATION fc DETONATION
and the other at 1300 nm, are combined into a fiber, as shown in Fig. 3. Each beam is passed through an acousto-optic modulator which modulates the inten- sity in a sine wave pattern at 530 kHz. Where the beams exit the fiber, they are collimated by a lens and propagate through the detonation tube, co-hnearly with the path of collected emission. With this arrangement, the transmitted laser intensities at 830 nm and 1300 nm are combined with measurements of flame emission at essentially the same two wavelengths. Transmission measure- ments are obtained for each wavelength by lock-in amplification, while emission measurements are obtained by subtracting the lock-in signal from the low-pass filtered signal (100 kHz). The system of collection optics was calibrated for ra- diant emission with a tungsten filament lamp. A Minolta/Land Cyclops 152 optical pyrometer was used as a standard to measure the temperature of the
tungsten filament.
2.3 Fuel Vapor Absorption
A technique to monitor the concentration of C2H4 fuel has been developed to study fuel distributions during the filling cycle in PDE experiments. Figure 4 shows a schematic of the technique. A 3.39 jim He-Ne laser beam is passed through the detonation tube using sapphire windows for optical access. The transmitted light is focused onto an InSb detector cooled with liquid nitrogen.
Experiments were conducted in a static cell to determine the relationship between the measured He-Ne laser beam absorption and the C2H4 concentration in the detonation tube. The static cell was filled with C2H4/N2 at several mixture ratios but with the total pressure Pt held constant at 1 atm, to simulate the
IR detector
He-Ne 3.39 nm laser
Figure 4 Absorption diagnostics for monitoring C2II4 concentration
278

PULSED DETONATION ENGINES
environment expected in the detonation tube during the fuel fill and extract the proper relationship between Xc2u4 and absorbance at 3.39 /im. Broadening of the individual C2H4 lines near 3.39 /im by N2 was assumed to be negligibly different from broadening by O2 for the purposes of the measurement.
In the configuration shown in Fig. 4, the C2H4 sensor's performance is com- promised if other sources of He-Ne laser extinction are present (i.e., residual soot remaining in the tube between multiple pulses). This problem was avoided in the present single-shot measurements by purging the tube with O2 between tests. In future tests with a rapid pulse rate, the purge may be insufficient to clear residual soot from the tube. In these cases, emission from a nonresonant (2.8 /mi) LED may be multiplexed with the He-Ne beam and detected separately to allow correction for interfering extinction effects.
3 JP-10/O2 EXPERIMENTS AT NAVAL POSTGRADUATE SCHOOL
The H20 and soot sensors were demonstrated [15] in the 3.8-centimeter diam- eter pulsed detonation-initiation tube at the Naval Postgraduate School (NPS) in Monterey, CA, shown schematically in Fig. 5a, along with a timing diagram (Fig. 56). This PDE and the detonation pressure histories developed in it have been previously characterized [16]. Each cycle begins with an oxygen purge injected through the head-end atomizer that lasts approximately 20 ms. Subse- quently, a liquid JP-10/oxygen aerosol is injected by the atomizer for ~ 20 ms. After a delay of ~ 20 ms, the mixture is ignited by a capacitive discharge igniter 7 cm from the head-end wall. The detonation wave builds and travels toward the tail end at approximately 2 km/s.
Calculated Chapman-Jouguet (CJ) detonation properties for a stoichiometric JP-10/oxygen detonation are TCj = 3900 K, PC] = 40 atm, and XH2O, CJ = 0.12. High-pressure gases exist at the test plane for approximately 500 /is following each detonation. High-temperature H20 typically remains at the test plane for a much longer time (> 100 ms), due to combustion occurring in the blow- down following each detonation. Because blowdown combustion interferes with a subsequent pulse's aerosol loading, the maximum pulse rate for this PDE is approximately 10 Hz. When the temperature drops below 900 K or the water mole fraction below 0.01, results become inaccurate and are not presented. The uncertainty in all measurements reported here is estimated at ±10%, typically limited by the variation in optical fiber transmission as it vibrates in the acoustic output of the PDE.
Properties measured during the first pulse in a series during a multicycle ex- periment are presented in Fig. 6. Gas temperature remains near 2500 K (64% of 7CJ) as the pressure decreases to near atmospheric. The temperature de-
279

HIGH-SPEED DEFLAGRATION & DETONATION
Igniter
JP-10 + O, t ri'i i .*•
-i-H
Soot lasers J
TDLs
32
to
02 purge O2/JP-10
aerosol fill ignition detonation
wave exits cycle
repeats
-60 -40 -20 0
Typical timing / ms
to
0.5 -/h 200
Figure 5 Experimental arrangement (dimensions in cm) (a) and timing diagram (6) of JP-IO/O2 experiments at NPS
creases rapidly to near 1000 K approximately 650 fis after the detonation wave passes the test plane. This is very near the calculated time of 600 /xs required for the detonation wave to exit the tube and allow a rarefaction wave to propagate back to the test plane against the output flow; this rarefaction wave is likely to be responsible for the rapid gas cooling. In situ two-color emission pyrometry results recorded at the same test plane agree well with the sensor's record of gas temperature. Soot volume fraction (/„) and H20 concentration results indicate the presence of combustion products within 4 ps of wave passage.
These measurements of temperature, H20 concentration, and soot volume fraction helped to identify a problem with fuel loading. Although the PDE was loaded with an overall equivalence ratio near 1.0 for the detonation shown in Fig. 6, the engine was inadvertently loaded rich at the head-end and very lean at the tail end, due to the nature of the spray injection system. As a result, the measured T and XH2O were much lower than expected (based on CJ values for <f> = 1.0), thereby providing the first evidence of nonideal fuel loading. The
280

PULSED DETONATION ENGINES
76.4 76.6 76.8 77.0
Time / ms
77.2
Figure 6 Measurements of pressure, gas and soot temperatures, soot volume fraction and H20 mole fraction from JP-10/O2 experiments at NPS
success of this first-generation sensor system suggests that it may become an important tool in future studies of PDEs.
4 C2H4/AIR EXPERIMENTS AT STANFORD UNIVERSITY
Since the results from the NPS PDE indicated that fuel distribution was im- portant, some controlled fueling experiments were designed to test effects of partial tube fills. A facility was constructed at Stanford University for investigat- ing gaseous-fueled PDE phenomena using diode laser diagnostics. A schematic of the facility with diagnostics is shown in Fig. 7. The facility consists of a 3.8-centimeter diameter tube, 1.35 m in length, closed on one end and open to a dump tank at atmospheric pressure on the other end. The tube is outfitted with ports for pressure transducers and optical access at several locations along
281

HIGH-SPEED DEFLAGRATION k DETONATION
Ge detectors > Mirror
C2H4l
Igniter
, InGaAs ' detector
immtmsmmmmttt
+y Pressure transducer
Shchelkin spiral
He-Ne laser (3.39 urn)
Diode lasers
A,nr,=1290 nm (nonres) ^=1343.3 nm (H20) X2=1391.7nm(H20) X3=1799.2 nm (H20)
XBr2=1650 nm (nonres)
s— QB—
OOII
-U>.nr3=1300nm(soot)
-HXBr4=830 nm (soot)
Fiber with "multiplexed beam
Figure 7 Arrangement of experiments conducted at the Stanford PDE facility show- ing diagnostics for detection of C2H4, H20, and soot (tube dimensions in cm)
its length. Gaseous fuel (C2H4) and oxidizer (either air or 02), each controlled by a solenoid valve, are injected into the tube near the head-end by impinging jets. A capacitive discharge ignition system of variable energy up to 2 J provides a spark to ignite the mixture. Timing of the valves and the spark is controlled using a series of gate and delay generators. To promote transition to detonation, a spiral coil (Shchelkin spiral [17]) made from 3/16-inch copper tubing with a pitch of 4 cm was fixed inside the tube from about x = 0.1L to about x = 0.7L, where x is the axial coordinate and L is the tube length.
The operating cycle is similar to that of the NPS PDE. First, a fresh charge of fuel and oxidizer is injected. Next, a spark ignites the mixture, producing a deflagration that develops into a detonation. The Shchelkin spiral was necessary for a detonation to develop in C2H4/air, but not necessary for C2H4/02; it
282

PULSED DETONATION ENGINES
was removed for the latter cases. After the detonation wave leaves the tube, rarefaction waves enter from the open end, exhausting the burnt gases. The injection timing sequences used were similar to those for the NPS PDE, but with longer times (on the order of a few hundred milliseconds) needed to fill the tube. Although the system is designed for multicycle operation, all of the results presented here are for single-cycle experiments.
Measurements of C2H4 mole fraction (-XC2H4) via absorption were made pos- sible using the instrumentation shown in Fig. 4, described above. A time-history of absorption at a given axial station was recorded during filling for a given injection timing sequence. Reproducibility of the results was good, so that a series of experiments in which the diagnostics was sequentially applied at four axial stations provided a crude axial distribution. From the timing of the rise in XC2H4 from one axial location to another, the filling velocity was obtained. The rise in XC2H4 tended to approximate a step function, with XC2H4 rising from 0 to the stoichiometric value within a time that was short compared to the total fill time. Rise times were found to vary by less than 10% between 0.3L and 0.8L from the head-end, so that it was possible to infer a detailed axial distribution by deconvolving the time-history from one of the axial locations. The decon- volution process consisted of assuming that XC2H4 was a function of (x - vt), where x is the axial location, v is the measured fill velocity, and t is time. At a selected axial location, XC2H4(*) was recast as XC2H4(Z - vt). Then X-C3nt(x) was obtained for t corresponding to the time of ignition.
A series of experiments were conducted in which a fraction of the tube was filled with a stoichiometric mixture of C2H4/O2. The tube was first purged with 02 before injecting the mixture. Experiments were conducted for fills of 25%, 50%, 75%, and 100% of the tube length. The C2H4 absorption diag- nostics was used to monitor the distribution of fuel, and thus equivalence ra- tio, </>, knowing that the remaining volume fraction was 02. Figure 8 shows a diagram depicting the four cases along with the distributions obtained from absorption measurements at four locations, using the deconvolution technique described above. Time-histories of head-end pressure for the four cases, meas- ured with a piezoelectric pressure transducer, are shown in Fig. 96. The results from a numerical simulation performed at the Naval Research Laboratory [5] are shown in Fig. 9a.* Although there were differences in the conditions between the two cases, the qualitative agreement between experiment and model is good. This agreement shows that controlled detonations at various tube fills, that be- have qualitatively according to modeling predictions, are obtainable with the facility.
As shown in Fig. 7, diode laser based sensors for H20 and soot were positioned for measurements at 23 cm from the exit of the tube, 0.86L from the head-end. Figure 10 shows results from measurements during a single-cycle experiment for
*See also Fig. 8 and relevant text on p. 203 of this book. (Editors' remark.)
283

HIGH-SPEED DEFLAGRATION & DETONATION
25% i i i i
50% msm o?
75% ff^ffl^N&SLi. -•' 02
100% **£-„**:.: i-S*^.-x>■■•!»*..* t'i,•»-■- -v« 4t; a,*».. ;Vl:iJ
TTTT 0.31 0.6L
0.5Z, 0.81
1.0 0.5 0.0 1.0 0.5 0.0 1.0 0.5 0.0
1.0 0.5 0.0
0.0 0.5
xlL
1.0
Figure 8 Measured fuel distributions in the Stanford University PDE, inferred from 3.39 [im absorption measurements at four locations
1 2 Time after ignition / ms
0 1 2 3 4 5 6 Time after ignition / ms
Figure 9 Comparison of simulated [5] and measured head-end pressures, (a) NRL simulation, C2H4/air, L = 0.5 m: 1 — 50 cm fill; 2 — 40; 3 — 30; 4 — 20, and 5 — 10 cm fill. (6) Stanford experiments, C2H4/02, L = 1.35 m: 1 — 100% fill; 2 — 75%; 3 — 50%; and 4 — 25% fill
C2H4/air mixture at cj> = 1.52. The results shown are of pressure (P) from a piezoelectric transducer, gas temperature (T) and H20 mole fraction (A'H2O)
from multiline H20 absorption, and soot temperature and volume fraction (/„), both from two-color emission pyrometry. It can be noted that the temperatures obtained from H20 absorption and soot pyrometry are in agreement to within
284

PULSED DETONATION ENGINES
4.0 4.5 Time after spark / ms
5.0
Figure 10 Measurements during a single-cycle pulsed detonation engine experiment in the Stanford facility: CJ = Chapman-Jouguet conditions, C2H4/air, <j> = 1.52, detonation velocity 1.1DCJ. All measurements were made at 0.861 from the head-end
the combined uncertainties of about 200 K. An energy balance analysis between radiation and convection for a soot particle suspended in gas at these conditions suggested that only small differences exist between the gas and soot tempera- tures, neglecting surface reactions. Thus, the soot temperature can be assumed equal to the gas temperature for present purposes.
At the top of Fig. 10 the pressure trace shows a spike at 3.76 ms after ignition corresponding to the pressure rise associated with the normal shock at the front of the detonation wave (von Neumann spike). The detonation wave velocity, obtained from two pressure transducers located 3.8 mm apart near the measure- ment location, was 2100 m/s, or about 1.1 times the CJ detonation velocity. This corresponds to a Mach number of about 6.0, and a von Neumann spike of about 42 atm, while the observed pressure spike in Fig. 9 is only 18 atm. Capturing
285

HIGH-SPEED DEFLAGRATION fc DETONATION
accurate pressure measurements during the von Neumann spike is difficult, since the duration of this spike is likely to be on the order of one microsecond [18], and the shock thickness on the order of 2 mm. The rise time of the pressure transducer used here is one microsecond, and the diameter is 5.5 mm, so one cannot expect to resolve the von Neumann pressure spike this way.
Figure 10 shows the pressure falling gradually with time from the CJ value as the gases expand behind the wave, in qualitative agreement with the pressure decay behind a detonation wave from numerical simulations [6, 19]. Large fluctu- ations in the pressure can be seen that can perhaps be attributed to the cellular structures known to exist in the gases following a detonation wave [20]. From studies at these conditions in which pressure was measured at several locations along the tube, it was noted that the detonation wave develops at about 0.5L to 0.61. The formation of a detonation wave begins with the overdriven detonation moving faster than the CJ velocity, which then subsequently slows down to the CJ velocity [18]. Apparently, by the measurement station of 0.86L the wave is still overdriven, moving at 1.1 times the CJ velocity, DCJ-
Based on the measured velocity, the wave should exit the tube about 110 (is after its arrival at the measurement location. Rarefaction waves then originate at the exit and travel into the tube. Assuming that the rarefaction waves travel at the speed of sound of the combustion gases [21], they would be expected to arrive at the measurement location about 350 /zs later. Consequently, about 450 to 500 /is after the wave arrival, or about 4.4 ms after the spark, the pressure and temperature traces in Fig. 10 both show decreases, apparently correspond- ing to the arrival of rarefaction waves. The maximum measured gas and soot temperatures shown in Fig. 10 are both about 2700 K, or 93% of the CJ temper- ature: in good agreement considering that heat loss to the walls should reduce the temperature somewhat.
The water mole fraction measurements are also in agreement with the CJ the- ory, remaining within about 10% of the equilibrium concentration of 0.12. The trace shows a slight increase in XH2O as the rarefaction waves arrive, tentatively due to the increase in equilibrium concentration with decreasing temperature. The soot volume fraction is on the order of 0.1 ppm during most of the time that soot is present, and goes to zero rather rapidly as it is oxidized after long burning times. Although it is difficult to predict soot concentrations a priori, they might be compared to premixed C2H4/air flat flames, which at this equivalence ratio show no detectable soot at levels above 0.01 ppm.
5 CONCLUDING REMARKS
Diode-laser sensors offer promising solutions to measurements of properties in PDE flows. Diagnostics for gas temperature, H20 mole fraction, soot volume
286

PULSED DETONATION ENGINES
fraction, and fuel concentration have been successfully demonstrated, both in a liquid-fueled PDE experiment and in the more controlled environment of a gaseous-fueled PDE experiment. Because diode lasers are rugged and compact, the possibility exists for on-board control systems based on diode-laser sensing of flow properties. In addition, properties measured with diode-laser diagnostics may be used for validation of computer models.
ACKNOWLEDGMENTS
This work was sponsored by ONR, with Dr. Gabriel Roy as technical monitor, under the ONR MURI on PDEs. The authors gratefully acknowledge Professors CM. Brophy and D.W. Netzer at the Naval Postgraduate School, Monterey, CA, for valuable discussions on PDE performance and for hosting our visit to demonstrate this sensor in the Rocket Propulsion and Combustion Laboratory. The authors also wish to thank Dr. K. Kailasanath and Dr. C. Li of the Naval Research Laboratory in Washington D.C. for providing model predictions and valuable technical discussions.
REFERENCES
1. Eidelman, S. 1997. Pulse detonation engine: A status review and technology devel- opment road. AIAA Paper No. 97-2740.
2. Eidelman, S., and X. Yang. 1998. Analysis of the pulse detonation engine efficiency. AIAA Paper No. 98-3877.
3. Bratkovich, T.E., M. J. Aarnio, J.T. Williams, and T. R.A. Bussing. 1997. An introduction to pulse detonation rocket engines (PDREs). AIAA Paper No. 97- 2742.
4. Bussing, T., and G. Pappas. 1994. An introduction to pulse detonation engines. AIAA Paper No. 94-0263.
5. Li, C, K. Kailasanath, and G. Patnaik. 2000. A numerical study of flow field evolution in a pulsed detonation engine. AIAA Paper No. 2000-0314.
6. Sekar, B. 1998. A numerical study of the pulse detonation wave engine with hy- drocarbon fuels. AIAA Paper No. 98-3880.
7. Kailasanath, K. 1999. Applications of detonations to propulsion: A review. AIAA Paper No. 99-1067.
8. Baer, D.S., V. Nagali, E. R. Furlong, R.K. Hanson, and M.E. Newfield. 1996. Scanned- and fixed-wavelength absorption diagnostics for combustion measure- ments using multiplexed diode lasers. AIAA J. 34:489-93.
287

HIGH-SPEED DEFLAGRATION & DETONATION
9. Arroyo, M. P., and R. K. Hanson. 1993. Absorption measurements of water-vapor concentration, temperature, and line-shape parameters using a tunable InGaAsP diode laser. Applied Optics 32(30):6104-16.
10. Toth, R. A. 1994. Extensive measurements of H20 line frequencies and strengths: 5750 to 7965 cm-1. Applied Optics 33:4851-67.
11. Choi, M.Y., A. Hamins, G.W. Mulholland, and T. Kashiwagi. 1994. Simultaneous optical measurement of soot volume fraction and temperature in premixed flames. Combustion Flame 99:174-86.
12. Arcoumanis, C, C. Bae, A. Nagvvaney, and J. H. Whitelaw. 1995. Effect of EGR on combustion development in a 1.9L DI diesel optical engine. SAE Paper No. 950850.
13. Sivathanu, Y. R., J.P. Gore, J.M. Janssen, and D.W. Senser. 1993. A study of in situ specific absorption coefficients of soot particles in laminar flat flames. J. Heat Transfer 115:653-58.
14. Jenkins, T.P., and R. K. Hanson. 2000. A soot temperature diagnostic combining flame emission and modulated laser absorption. AIAA Paper No. 2000-0953.
15. Sanders, S.T., T. J. Jenkins, J.A. Baldwin, D.S. Baer, and R.K. Hanson. 2000. Diode-laser absorption sensor for measurements in pulse detonation engines. AIAA Paper No. 2000-0358.
16. Brophy, CM., and D.W. Netzer. 1999. Effects of ignition characteristics and ge- ometry on the performance of a JP-10/O2 fueled pulse detonation engine. AIAA Paper No. 99-2635.
17. Lee, J.H.S., R. Knystautas, and A. Freiman. 1984. High speed turbulent defla- grations and transition to detonation in H2-air mixtures. Combustion Flame 56: 227-39.
18. Oppenheim, A. K.; N. Manson, and H. G. Wagner. 1963. Recent progress in deto- nation research. AIAA J. 1:2243-52.
19. Kailasanath, K., G. Patnaik, and C. Li. 1999. Computational studies of pulse det- onation engines: A status report. AIAA Paper No. 99-2634.
20. Kuo, K.K. 1986. Principles of combustion. 1st ed. New-York: John Wiley & Sons.
21. Nicholls, J.A., H.R. Wilkinson, and R. B. Morrison. 1957. Intermittent detonation as a thrust-producing mechanism. Jet Propulsion 27:534-41.
288

ELECTROCHEMICAL PULSE DETONATION ENGINE
V. P. Korobeinikov, V. V. Markov, I. V. Semenov, P. D. Pedrow, and S. Wojcicki
Studied in the paper is a new concept of an internal combustion engine comprising the electrochemical pulse jet with combustion, implosion det- onation, and intense spark channels to initiate the implosion in the com- bustion chamber. The scheme of thrust generation includes the electric discharge in the combustion chamber that is triggered when the flame front passes by special electrodes. The ring-type discharge is recom- mended to produce converging shock waves in the combustible mixture leading to a fast burning process with a detonation stage. Reflection of shock waves from the central part of the chamber and their interac- tion with the walls lead to fast and complete mixture burning during the pulse. Parameters of the converging shock and detonation waves have been estimated analytically. A two-dimensional combustible gas flow in the chamber and engine tubes has been simulated numerically. Impulse and thrust as well as the efficiency of the engine system have been estimated. Experimental results are also discussed.
1 INTRODUCTION
Designing of new types of internal combustion engines is of significant interest both for theory and practice. One of relatively new concepts is based on the elec- trochemical pulse jet. The engine design was previously studied by Wojcicki [1]. To achieve the efficient conversion of the thermal energy into the mechanical energy by increasing the compression ratio, one can use an electric discharge in the combustion chamber. By this way one can convert combustion into deto- nation and use these processes to generate high pressure, increase the engine thrust and attain a high efficiency of the engine system. The new scheme of thrust production encounters the electric discharge in the combustion chamber that is triggered when the flame front passes by special electrodes [2]. A "collar"
289

HIGH-SPEED DEFLAGRATION & DETONATION
(ring-type) discharge is recommended to generate a converging shock in the com- bustion mixture, which leads to a fast burning process with a detonation stage. Reflections in the central part of the chamber and interaction of the shocks with chamber walls result in fast and complete mixture burning during the pulse. The combustion energy within one pulse has to be much higher than the electric discharge energy. Parameters of the converging shocks and detonation waves can be evaluated analytically. The combustible gas flow in the chamber and engine tubes can be simulated by using a two-dimensional approximation with chemical kinetics, wall friction and heat loss taken into account. In this paper, the Godunov finite difference method has been applied to numerically solve the governing equations. The calculations were performed for several sets of initial data, parameters and mixture composition. The impulse and thrust values and efficiency of the engine system were estimated.
The analytical results of [3-5] have been also used. In addition, some exper- imental results are reported.
2 GOVERNING EQUATIONS
2.1 Quasi-One-Dimensional Approach
The model is based on the equations for a quasi-one-dimensional (ID) unsteady flow of a gas mixture in a tube of variable cross-section. The combustion process, wall friction and heat loss are approximately taken into account. The following governing equations are used.
1. Gas motion:
d(pA) _ d(puA)
dt ~ dx d(puA) d(puuA+pA) dA
d(pEA)=_d(puEA + puA)+pA{q_+q) (1)
dt dx uu 4/ uu u
T' F=T = A'_(T_-T) (heat loss)
p uu 4/ uu u . . , pRT, e=^T + T, ^=TTR (fnction)
290

PULSED DETONATION ENGINES
2. Combustion:
q = Qß* (heat release rate)
— = -K(p, p) exp ( -E' - 1 (induction period, 0 < c < 1) dt
— = K*(p, p, ß) exp ( -E* - j (burning after the induction period) (2)
d{Aß) dAß t . , Aör = -u-^- + Aa(X,t) + Aß*
_ d (pAD dß/dx) dx (approximation of diffusion)
In the above equations, t is time, x is the coordinate, p is the density, p is the pressure, u is the flow velocity, T is the temperature, e is the total internal energy, 7 is the specific heat ratio, L is the tube diameter, g_ is the heat loss, A = A(x) is the cross-section area, Q is the combustion heat, E' and E* are the constants, K(p,p) and K*(p,p,ß) are the known functions, D is the turbulent diffusion coefficient, /f_ is the heat transfer coefficient, 7!_ is the ambient temperature, / is the friction coefficient, a(x,t) is the source of the matter, and ß is the combustible mixture concentration.
2.2 Two-Dimensional Model
The model is based on the gasdynamic equations written for a two-dimensional (2D) nonsteady flow of a gas mixture in a tube of variable cross-section. The combustion process, wall friction and heat loss are taken into account. The following equations were used.
1. Gas motion: da db dc
~di+~di + !fr
P pu
J- =
pu
pv puv 3 =
= —3- r + 3
+ puv , c-
pv puv
0 -PF -PG
p(q* + i- + q)
(3)
291

HIGH-SPEED DEFLAGRATION & DETONATION
2. Combustion:
( VV\ p = (7-l)ep, s = cT, e = p[e + —j
F = 2fW± G = 2fVV^
Similar to Eqs. (2).
In these equations, the same notations as in Eqs. (1), (2) are adopted. Ad- ditional notations are as follows: u and v are the components of the velocity vector V, e is the internal energy, c is the specific heat, / is the friction coeffi- cient (/ > 0 only near the chamber walls), and q* is the electric discharge energy. The method of integral relation and Godunov finite difference method were used to numerically solve the problem. Nonuniform computational grids were used. A special procedure was worked out to integrate the combustion kinetic equation and to determine the concentration /?.
The engine of interest includes four major parts (see Fig. 1): inlet 1, com- bustion chamber 2, electric discharge 3, and outlet 4. Simple models of these operation units are considered below.
3 RESULTS OF CALCULATIONS
3.1 Combustible Gas Flow in a Combustion Chamber and Engine Tubes
The flow pattern in the combustion chamber is shown schematically in Fig. la. Here BM denotes the combustible mixture, CP the combustion products, F the flame, ED the location of the electric discharge. Numbers in Fig. 16 in- dicate dimensions in mm for the computational example. The ID numerical solution has been obtained for C2H2- and C3H8-air mixtures for the follow- ing set of data: pulse frequencies of 200, 148, 139, and 167 Hz; mass flow rate of the combustion mixture 15.4 g/s; mean rate of the combustion heat release q = 26-10 J/s; / = 0.01, A'_ = 5-10 W/(m2K), electric discharge energy of 30 J/cycle.
The results of computation are shown in Figs. 2 and 3. Figure 3 pertains to the propane-air mixture with the mean temperature T = 2000 K, pulse frequency 167 Hz, with electric discharges. The results of Figs. 2 and 3 were computed by using the Godunov method in the ID approach.
The experimental results are presented in Fig. 4 for the same chamber con- figuration. The theoretical results are qualitatively close to the experiment.
Efficiency estimations revealed the following:
292

PULSED DETONATION ENGINES
D 3 ~7^ V
-BM -CP
to
IS
215 140 60
s $ ' ' ' i
250
900 i
(b)
Figure 1 Schematic of the pulse detonation engine (a): 1 — inlet; 2 — combustion chamber; 3 — discharge; 4 — outlet. (6) The model for experiment and calculation (dimensions in mm)
(a) The mean mechanical thrust of the engine is 40% higher when an additional energy in amount of about 23% is deposited by the discharges. The ratio of the kinetic energy generated by the engine to the energy input (thermal energy plus electrical energy) may increase by 5% for the case of the electric discharge. These estimate depends on the wall loss.
(6) The point of operation of the electrochemical pulse jet engine at a maxi- mum efficiency does not coincide with the maximum specific thrust point (the thrust per cross-section area of the engine). Varying the operation conditions (e.g., electric discharge, heat conduction, combustible mixture, etc.) makes it possible to achieve an engine performance close to that of supersonic ramjet air-breathing aircraft engines.
Note that the inlet problems were studied in [7-9].
3.2 Pulse Detonation Engine
Consider now a 2D flow pattern when the discharge electrodes are mounted along the axis of the combustion chamber (i.e., explosion of a cylindrical shell is considered). The length of the energy release zone is equal to nAx, where Ax is the computational cell size. The discharge energy is 30 J/cycle, as adopted above.
293

HIGH-SPEED DEFLAGRATION fc DETONATION
4000 4000
•S 2000
E
S3
1 id
1.64
2.0
1.5 w \J \) \f \ 1.0
1 1 1
1.65 r/s
1.66
to (ft)
Figure 2 Predicted performance of the pulse engine operating on the acetylene-air mixture with frequency 167 Hz: (a) operation without discharge, thrust is 1.385 N; (6) operation with electric discharge, thrust is 1.936 N
294

PULSED DETONATION ENGINES
The results of 2D unsteady cal- culations made by A.N. Gavrilov in 1993 are shown in Fig. 5. Af- ter reflection of the initial detona- tion wave from the chamber wall the stage of the implosion gas flow begins. The converging shock im- plodes in the center of the cham- ber in about 15 /is after the instant of discharge. In the high-pressure region near the chamber center, a complex flow arises which promotes fast burning of the propane-air com- bustible mixture.
The velocity at the tube exit is increased by 20% as compared to that obtained with an ordinary dis- charge. The flow velocity field inside the chamber is shown in Fig. 6. This suggests a special type of electric discharge to produce an imploding wave and a new type of a pulse det- onation engine, considered below.
A concept of the pulse engine can be suggested using a detonation process in the combustion chamber. The "collar" ring-type discharge is used to generate a converging shock in the combustible mixture with a detonation stage of the burning pro- cess (see Fig. 7). After discharge, a cylindrical gas shell with high tem- perature and pressure arises and the implosion process starts.
The specific energy of the shell explosion is
4000
E" = E~+E' 2irhlr
Ui
•a 2000
f
3 o
where r = R — h, R is the chamber radius, / is the axial dimension of the area occupied by electrodes, h is the
Figure 3 Predicted performance of the pulse engine operating with electric discharge on the propane-air mixture with frequency 167 Hz. Thrust is 2.058 N
295

HIGH-SPEED DEFLAGRATION & DETONATION
Time
(fl)
Time
(b)
Figure 4 Measured pressure histories at the center of the combustion chamber: operation without (a) and with (6) electrical discharge with frequency 148 Hz
height of electrodes, E~ is the discharge energy, £" is the energy released in the
shell due to combustion.
The converging overdriven detonation propagates towards the center of the chamber. The pressure in converging shock and detonation waves can be evalu- ated using the approximate analytical formula presented in [5, 11, 12] with the asymptote at the center, P ~ l/r0A. Figure 8 shows the predicted pressure variation obtained numerically [11]. According to the estimates, the pressure will increase 17-fold in the vicinity of the center after shock reflection.
This concept can be applied not only to internal combustion engines, but also for accelerating projectiles in tubes, i.e., in RAM accelerators.
The general schematic of the accelerator is not considered here. The results of Hertzberg (see, for example, [3, 4, 14, 15]) indicate that the projectile velocity of about 3 km/s can be readily attained in RAM accelerators. According to [13], the accelerators can be equipped with additional devices allowing for the pulse modes for increasing the projectile velocity, for example, by using electric or laser spark ignition near the projectile rear wall or pulse detonation combustion
inside the projectile.
296

PULSED DETONATION ENGINES
7.14
5.14
3.14
1.14
5.11
3.11
1.11
Figure 5 Predicted temporal development of pressure distribution in the combustion chamber: (a t = U + 4 ps; (6) * = t„ + 10 ^ (c) t = td + 12 ps; (d) t = td + 20 ßS; td is the discharge time, r and x are the cylindrical coordinates
(Continued)
297

HIGH-SPEED DEFLAGRATION fc DETONATION
5.14
3.14
1.14
5.13
3.13
1.13
Figure 5 Predicted temporal development of pressure distribution in the combustion chamber: (o) t = U + 4 ^s; (6) t = U + 10 /is; (c) < = td + 12 Ms; (rf) t = td + 20 ps; U is the discharge time, r and z are the cylindrical coordinates (Continued)
298

PULSED DETONATION ENGINES
W 30 m/s
M M * * » + *
Q>)
Figure 6 Predicted velocity fields inside the chamber: (a) t = h + 0.2tc; (6) t tb + 0.5fc; tb is the time of cycle beginning and tc is the cycle duration
inlet
JL
\H
A
\S I outlet
A-A
Figure 7 Schematic of the implosion process in the combustion chamber. S is the electrode surface. A-A is the chamber sectional view; e is the electrode, h is the hight of electrodes (h « 0.1Ä); H is the high-pressure zone due to implosion
4 EXPERIMENTAL STUDIES
The interaction between the spark and the flame was studied experimentally in the engine prototype. This interaction includes two important issues: (1) dielec- tric breakdown in the interelectrode region, and (2) influence of the arc channel on the surrounding gases. Digital oscilloscopes, pressure transducers, and ion Langmuir probes were used to study these phenomena. The sparking voltage for a gas residing in a uniform field between two electrodes was described by
299

HIGH-SPEED DEFLAGRATION & DETONATION
lnP,/P„
Paschen curve for the gas. The uni- form field was obtained by fabricating the electrodes with a Rogowski profile which precludes field enhancement at the gap edges. The finite element elec- tromagnetics software package ANSOFT was used to analyze the elec- tric field in the electrode gap. Briefly, the engine operation is as follows: (1) a flow of the fresh combustible mixture, coming from the inlet tube, enters the combustion chamber and encounters (in the vicinity of the electrodes) a stream of the combustion products coming back from the exhaust tube, (2) interaction of these two flows pro-
duces a flame front that in turn triggers the intense electrical discharge, and (3) the plasma channel of the electrical discharge generates a pressure wave which is followed by combustion. Combustion takes place at an elevated pres- sure, and both the amplitude of pulsations and the efficiency of the engine are increased. The general view of the experimental device and the corresponding pressure records in a twin engine are presented in Fig. 9.
Figure 8 Estimated shock pressure dur- ing cylindrical implosion near the center of symmetry (APS/P0 ~ r7°'394_): 1 — 7 = 1.4, 2 — 7 = 2, 7 is the specific heat ratio
5 CONCLUDING REMARKS
Reported herein are the preliminary results on the electrochemical pulse jet engine. Experiments with acetylene-air and propane-air mixtures showed a thrust increase. The results of quasi-one-dimensional modeling fit the experiment quite well. The model predicts a significant thrust increase due to the use of electric discharges. Two-dimensional modeling has also been implemented for central electrodes mounted along the cylindrical chamber. Flow fields of the implosion stage in this configuration were studied.
Further comparison between experiments and predictions has to be made. It is intended to develop a detailed model of this new type of engine. Such a model could be used to design large-scale engines. Detailed modeling of the combustion process will help to design large-scale engines that exhibit smaller amounts of pollutants in exhaust gases. The results of this paper can be applied to design jet engines for hypersonic airplanes to improve their operation in high-speed regimes, and for small submarines. Some other preliminary results have been reported in the references cited below.
300

PULSED DETONATION ENGINES
(«)
Figure 9 A general view of the twin engine system (a) and pressure histories measured in the combustors with a shifted phase of the cycles (6)
301

HIGH-SPEED DEFLAGRATION k DETONATION
ACKNOWLEDGMENTS
The support of the Department of Mechanical and Material Engineering of the Washington State University was important for the authors. The authors ex- press their gratitude to A.N. Gavrilov for taking part in the calculations and discussions.
REFERENCES
1. Ponizy, D., and S. Wojcicki. 1984. On modeling of pulse combustor. Archivum Combustionis 4(3/4):161-70.
2. Korobeinikov, V. P., A.N. Gavrilov, and S. Wojcicki. 1991. Theoretical analysis of combustion and detonation wave propagation in pulse engine. 13th Colloquium (In- ternational) on Dynamics of Explosions and Reactive Systems Proceedings. Book of abstracts. Nagoya, Japan. 53.
3. Bruckner, A. P., O. Knowlen, A. Hertzberg, and D.W. Bogdanoff. 1991. Opera- tion characteristics of the thermally choked Ram Accelerator. J. Propulsion Power 7(5):828-36.
4. Hertzberg, A., A. P. Bruckner, and O. Knowlen. 1991. Experimental investigation of RAM accelerator propulsion modes. Shock Waves 1:17-25.
5. Korobeinikov, V.P. 1991. Problems of point, blast theory. New York: AIP Publ. 6. Godunov, S.K. 1959. Finite-difference method of the numerical integration of dis-
continuous gasdynamic equations. Sov. J. Matem. Sbornik 47(3):271-80. 7. Zakharov, W.S., and V.P. Korobeinikov. 1979. Similarity motion of a gas in the
case of local supply of mass and energy in a fuel mixture. Sov. J. Izv. Acad. Sei. USSR. Ser. Fluid Mechanics 4:70-77.
8. Gavrilov, A.N., and V.P. Korobeinikov 1992. Motion of two-phase media in tubes of variable cross-section at a localized deposition of mass and energy. Sov. J. Appl. Mech. Techn. Phys. 2:89-94.
9. Dwyer, H., et dl. 1991. On modeling of pulse combustors. In: Numerical approach to combustion modeling. Eds. E. Oran and J. Boris. 693-701.
10. Baum, F. A., et öl. 1975. Physics of Explosions. Moscow: Nauka. 11. Korobeinikov, V.P., V.V. Markov, and B.V. Putjatin. 1978. On the calculations
of converging gas flows. In: Dynamics of continua in space and on Earth. Moscow: Acad. Nauk USSR. 87-94.
12. Cheret, R. 1992. Detonation of condensed explosives. Hong Kong: Springer-Verlag. 13. Korobeinikov, V.P., and S. Wojcicki. 1995. Theoretical modeling of detonation
pulse engine with application to RAM accelerator. 2nd Workshop (International) on Ram Accelerators, RAMAC II Proceedings. Seattle, WA, USA: University of Washington.
14. Eidelman, S., W. Grossman, and I. Lottati. 1991. A propulsion device driven by reflected shook waves. Preprint. Sei. Appl. Internal. Corporation, Me Lean, USA.
15. Brode, H.L. 1970. Theoretical description of the perfomance of the UTIAS hyper- velocity launcher. RAND Corporation, RM-6298 PR.
302

ABOUT A DETONATION ENGINE WITH EXTERNAL COMBUSTION
A. A. Vasil'ev
Schematic of a detonation engine with external combustion is discussed. The design is based on the experimental realization of a detonation regime in a gaseous layer of finite width adjacent to a cylindrical outer surface with a free external gaseous boundary. New reinitiation centers have been found to develop periodically at some distance away from the inner boundary within the gas layer. Microcenters located at some distance from the internal curvilinear boundary, turn the detonation wave toward the inside and support its propagation along the curvilin- ear boundary. Simple models for estimating the critical radius and width of the gaseous layer are proposed.
1 INTRODUCTION
It is known that in a circular tube of constant cross-section, at a low pressure the detonation wave (DW) can propagate in a mode with a single transverse wave, i.e., in the mode of spinning detonation (see, for example, [1, 2]). In this case, the transverse wave (TW) rotates along the inner concave tube surface, which is an external boundary for the gaseous explosive mixture. The solid tube wall plays a major role in the TW rotation and in producing a constant velocity of propagation along the axis.
In the frame of reference attached to the detonation front, the TW is con- tinuously rotating along the inner periphery of the tube. From the propulsion point of view, this flow pattern can be considered, as an engine schematic with the internal rotating DW in a supersonic flow.
The limiting condition of detonation wave propagation in a tube with rigid walls is normally characterized by the limiting diameter dym. At d < düm, propagation of the DW along the tube axis is impossible at any power of the initiation charge (see, for example, [3, 4]).
303

HIGH-SPEED DEFLAGRATION & DETONATION
In curved tubes, the concave solid wall plays also a governing role in inclina- tion and rotation of the DW front — due to regular and irregular DW reflection and flow compression near the concave solid wall. A typical case is the incli- nation and rotation of the DW in a curvilinear tube connecting two rectilinear segments of a detonation tube (see, for example, [5]). Inclination and rotation of the DW may be treated as its diffraction on a concave boundary.
So far, no spinning detonation was observed in wall-free rectilinear gaseous charges, e.g., in axially symmetric long unconfined gaseous jets. Without sup- port of a solid wall, the TW is not capable of rotating, therefore self-sustaining propagation of the spinning DW along the jet axis is impossible [6]. In rectilin- ear free gaseous charges (FGC), a multifront detonation regime with many TW rather than the spinning DW with a single TW has been observed [6, 7].
Under conditions of stationary DW propagation, the FGC diameter is referred to as the critical diameter d,. At d < d,, no self-sustaining DW propagation along the charge axis has been observed [8]. This definition of the critical di- ameter applies to charges without confining walls and to FGC in the form of explosive mixture jets. It is evident, that the limiting propagation regimes in a tube and jet differ considerably, and dVm < d». A curved semi-free or entirely free layer of gaseous explosive mixture without an external supporting solid wall can be realized, for example, when a combustible mixture is injected (axially, radially, or at some angle to the flight trajectory) into a flow, as shown in Fig. 1. In this case, the layer is characterized by an internal and external radii, or by a thickness.
The idealized schematic of external combustion in a ring-shaped layer with a curvilinear free boundary is shown in Fig. 2. This device can be reffered to as the engine with external combustion.
A possibility of realizing a DW, that rotates as it propagates along a curved layer of gaseous explosive mixture, without an external supporting solid wall is not readily evident. At least three issues should be addressed when considering such a flow configuration:
(1) the physical mechanism of DW rotation;
(2) the minimum curvature radius of a ring-shaped gaseous layer required for such a configuration; and
(3) the minimum thickness of a ring-shaped mixture layer, required for quasi- stationary DW propagation.
In terms of the classical theory, propagation of the DW with a smooth radially oriented front (normal to the boundaries as in Fig. 2) along a ring-shaped charge is impossible. In this case, the velocity of DW propagation near the external boundary of the ring-shaped charge must exceed the DW velocity near the inner boundary despite the constancy of the chemical energy release. This can be achieved using a radially stratified mixture with a carefully adjusted distribution
304

PULSED DETONATION ENGINES
+ Figure 1 Schematic of generation of a free annular gaseous explosive layer with axial or radial injection
Figure 2 Schematic of external com- bustion in a ring-shaped gas layer behind a rotating DW
of the fuel-oxidizer ratio along the radius of a ring-shaped charge. Moreover, in a rectilinear FGC, sta- tionary propagation of a multifront DW is possible only in the case, when the thickness of the explosive gas layer exceeds a critical value, h > h*. This also applies to the unconfined jet case, when the charge diameter must exceed a crit- ical value, d > d*.
This paper is primarily con- cerned with the elucidation of the physical mechanism of DW rota- tion as it propagates along a curved gaseous layer, with a cylindrical sur- face of radius R0 serving as the in- ternal boundary. In other words, the object of the study is DW propaga- tion along the outer gaseous layer around a cylinder. The paper also attempts to answer the above-listed problems as applied to FGC with a curved free boundary.
So far, DW propagation along a convex curved boundary has been properly analyzed neither numeri- cally nor experimentally. The in- terest to this problem has increased sharply in connection with the de- velopment of detonation engines.
2 DETONATION WAVE DIFFRACTION EXPERIMENTS AND RESULTS
Consider classical experiments (e.g., [9-12]) on two-dimensional diffraction of multifront DW on rectilinear and curvilinear (on a convex segment of radius R0) boundaries. In Fig. 3, the rectilinear boundary is presented by line OP and the convex boundary is shown by a circle of radius HO. Experiments were carried out in flat channels of a constant depth 8. From a channel of a constant width /, the DW entered an expanding channel with an inclination angle a (boundary
305

HIGH-SPEED DEFLAGRATION & DETONATION
OF in Fig. 3), or with broadening via a segment arc of a constant radius of curvature Äo (circular arcs of radius GO or HO in Fig. 3). Line BAC in Fig. 3 is the channel axis. The width of the flat channel /, the expansion angle a for the rectilinear boundary or the curvature radius R0, were varied in the experiments. In addition, the characteristic cell size a of the multifront DW was varied with changing the initial pressure, P0, of the mixture. The channel half-width, 1/2, in the diffraction scheme of Fig. 3 is qualitatively equivalent to the layer thickness,
h, in the scheme of Fig. 2. At a fixed geometry and channel size (R0,1, 8), DW destruction with transfor-
mation into a regime of high-speed turbulent combustion was observed after DW entered the expanding channel at P0 < -P;,; at P0 > Ph the DW was reinitiated. Here, Pit and Pj* are certain critical pressures, at which the failure and reiniti- ation of the DW occur at fixed R0, I, and 8. In general, Pit = f(Ro,l, 8) ^ Pj*. Typical self-luminosity photographs of DW diffraction in a C2H2+2.502 mixture are demonstrated in Fig. 4. The DW propagates from left to right. In Fig. 4a, the DW decays (P < Pi») while in Fig. 46 the DW is reinitiated (P > Pj*). In Fig. 46, new reinitiation centers are observed in the expanding channel as starting points of the divergent flow with small cell sizes (much lower than the
normal size). Figures 5 and 6 display experimental data on DW reinitiation (filled symbols)
and failure (open symbols) in the mixture C2H2 + 2.502 for DW diffraction on rectilinear (Fig. 5) and curvilinear (Fig. 6) boundaries at different initial pressure P0. The results of diffraction on a rectilinear boundary (as OP or OF in Fig. 3) with variable angle a are as follows: among all Pit there is a critical value P. so that at any P > P* the DW reinitiation process is observed for any a
Figure 3 Schematic of experiments on two-dimensional DW diffraction on rectilinear (line OP or OF) or curvilinear (radius HO or GO) expanding boundaries
306

PULSED DETONATION ENGINES
Figure 4 Self-luminosity photographs of DW attenuation (a) and reinitiation (6) under diffraction on a curved boundary of radius R0: (a) channel 30 x 1.5 mm, R0 — 120 mm, P < Pit; (b) channel 15 x 1.5 mm, R0 = 60 mm, P > Pi,
(domain II in Fig. 5). Furthermore, there is a limiting angle a* such that at any a > a* the DW reinitiation and DW failure depend on a single parameter — the critical mixture pressure, which is the same as P,\ at P < P* only DW failure is observed (domain II), at P > P, DW is reinitiated (domain I). At a > a, the critical pressure for the reinitiation and failure processes, P0 = P,. At a < a,,
307

HIGH-SPEED DEFLAGRATION & DETONATION
80 ■
- □ 2
B —■— i 1 1 1 1
d» 1
60 -
40 - I
oyi
1 □ 1.
1
|
//
20 - D s* III
1 1 |
0 p ' limits
Mil WT1 1 1 1 1 1 1 1 1 1 MI ,,1,1,, 1 1 1 1 M
0.02 0.04 0.06 P0/bar
0.08 0.10
PS
. 1 o 2
0.1 0.02
limit ,,,, , , I , i , , , i i i il i i i i
//
P. ' i ' I , ' , , , ' ' ' i
0.04 0.06 i'o/bar
0.08 0.10
Figure 5 Summarized data on detona- Figure 6 Summarized data on det- tion wave diffraction on rectilinear bound- onation wave diffraction on curvilin- aries in C2H2 + 2.5O2 mixture: 1 — reini- ear boundaries in C2H2 + 2.5C>2 mixture: tiation, 2 — failure 1 — reinitiation, 2 — failure
the concept of the critical pressure P. degenerates: the DW failure domain can be reduced and the DW reinitiation domain can be expanded accordingly on the value of domain III, where reinitiation processes depend not only on the initial pressure, but also on the expansion angle. It should be mentioned that the reinitiation processes at a - a» and a > a» are similar and isotropic with
respect to the angle. Local spots (single or several) of spontaneous or forced mixture ignition are
responsible for DW reinitiation (as a result of induction period termination, collisions of weak disturbances, etc.). These hot spots should arise not later than the time t0 taken for the rarefaction waves to travel from the charge periphery to its axis (from point O to point C in Fig. 3) with t0 = 0.5//(Z)tan ip), where D is the average DW velocity (along the channel axis) and <p is the average angle between the TW trajectories and channel axis.
For DW diffraction on a convex circular boundary with variable segment radius R0 and channel width /, the ratio l/R0 plays the role of a dimension- less parameter equivalent to the expansion angle a for the rectilinear boundary (Fig. 6), i.e., the P0(a) dependence is similar to the P0(l/R0) dependence. At R0 » /, the reinitiation is observed at P > P\\m\t- As R0 decreases, the crit- ical pressure of DW reinitiation increases, P|imit < P0 < P* (domain III). At Ro < (Ro) nin, Po = const = P» (domain I). The pressure Pnmit in Figs. 5 and 6 is the limiting pressure for stationary DW propagation in a channel of cross- section 1x5 [4]. Logarithmic scale is chosen on the Y-axis of Fig. 6 for better
clarity.
308

PULSED DETONATION ENGINES
3 DETONATION WAVE ROTATION EXPERIMENTS AND RESULTS
Experiments on direct initiation of DW near the inner boundary and quasi-stationary propagation of a multifront DW along a curvi- linear gas layer around a cylin- drical surface (see Fig. 7) were conducted. Radius R0 of the in- ner boundary of the curvilinear gaseous layer and cell size a were varied. The effect of the outer boundary is insignificant if the characteristic period of wave travelling from the inner to the outer boundary and backward is shorter than any characteristic time of the reinitiation processes.
Quasi-stationary propagation of a multifront DW around a cy- lindrical surface in a circular gas- eous layer is the principle of a detonation engine with external combustion.
In a circular channel of a constant cross-section, the following combustion and detonation modes are observed depending on the initial pressure P0:
(i) mixture ignition near the electrode, subsequent complete detonation failure, and deflagration at some distance from the electrode at low P0;
(ii) DW initiation near the electrode, subsequent DW failure at some distance away from the electrode and mixture combustion in the rest part of the gaseous layer;
(m) galloping detonation in the circular channel with an outer curvilinear wall when the typical "DW-excitation - DW-attenuation" process repeats peri- odically: after DW departs from the electrode and then is transformed in turbulent burning, new DW is formed in some area of the channel near the outer boundary as a result of a microexplosion;
(iv) regime of DW initiation at one, two, etc. points A some distance away from the turning boundary at a pressure above some value P** (depending on a curvature radius, mixture composition, channel depth, etc.) is observed,
Figure 7 A photograph of DW rotation (clock- wise) around a cylindrical surface of radius R0 = 40 mm in C2H2 + 2.502 mixture. Points A are the reinitiation centers of DW
309

HIGH-SPEED DEFLAGRATION fc DETONATION
which can be referred to as quasi-stationary DW propagation in a circular channel as in Fig. 7. Points A indicate the extremal locations corresponding to reinitiation centers. The number of reinitiation spots increases with P0.
Figure 7 illustrates an opportunity of realizing external combustion in a det- onation mode around a cylindrical surface. It is evident from the photograph of Fig. 7 that a continuously operating detonation engine with external combustion can actually be implemented.
Moreover, Fig. 7 demonstrates the basic mechanism of rotation and quasi- stationary propagation of a multifront DW in a ring-shaped gaseous charge: for this purpose it is necessary, that new reinitiation centers appear periodically m the attenuated wave at some distance from the turning surface. In a gaseous charge with a free boundary, the propagation of a multifront DW appears to be possible if the width of the gaseous layer around a turning surface is sufficient for continuous DW reinitiation due to microexplosions.
4 SIMPLE ESTIMATES OF LAYER SIZES AT DETONATION WAVE DIFFRACTION
The above findings offer a simple procedure for estimating the magnitudes of the critical curvature radii and minimum widths of a ring-shaped charge layer. Referring to Fig. 3, at any form of DW expansion, the rarefaction wave (RW) arises at point O. Line OC is the trajectory of the RW front as it travels along the DW front. At point C (on the charge axis), the RW suppresses completely the chemical reaction behind the DW front. Thus, point C on the channel axis is the site of the latest reinitiation center under DW diffraction. If no new reinitiation centers arise till this point, the detonation regime is destroyed and transformed into turbulent combustion.
In the case of a rectilinear boundary with a critical expansion angle a,, the straight lines AC and AE play the role of the sector boundaries, in which a new DW must be reinitiated no further than point C (the choice of a» is dictated by the isotropy condition of a sector-circle system). Therefore, the segment AC = AE can be identified with the reinitiation radius R* (thus, the DW front KEFC is normal to the sector boundaries):
R„ - -(cot a» + cotyp)
Here / is the width of the channel, <p is the average angle of the RW trajectory as it propagates along the DW front, practically conterminous with the average
an gle of TW trajectories at stationary propagation of a multifront DW.
310

PULSED DETONATION ENGINES
The equations for the radius of the turning circle Ro (for example, GO) and the reinitiation radius Rt are readily derived from Fig. 3:
x2 + (y-Ro)2 = R%
I \2 ( P2
z+-cota, 1 + h/+- I =Ri
At the intersection point F of the curvilinear boundary and the reinitiation ra- dius, the equivalent expansion angle a in the area x > 0 and y > 0 is comparable with that for the rectilinear boundary OF: a = f{xp,yF)- The second point of intersection at x < 0, y > 0 has no physical meaning.
Point E of intersection of the reinitiation radius R* with line y = x tan a» corresponds to R0 ~ 1/2. Thus, points F lie inside the critical sector EAC at fio > //2 and beyond it at R0 < 1/2. Experimental data at R0 > 1/2 must belong to domains I and III, and at R0 < 1/2 — to domains I and II.
The unique solution — point K — is realized at some minimum radius of the turning boundary (Ä0)min = HO = HK. Using the data of Fig. 5 (cot a» = 1.0 and tamp = 0.55), one arrives at the following relation: (iZo)min > 0.4/.
Thus, a necessary width of a gaseous layer with the reinitiation center at point C (on the outer charge boundary) satisfies the condition AR = (HC - HO) > 0.9/.
The above two relations for (-Ro)min and AR can be recommended for prac- tical estimations.
Parameter l/R0 in the case of a convex boundary plays the role of an ex- pansion angle a for a flat wall, and (//J?0)min = 2 is equivalent to the critical angle a*. At R0 < (i?o)min, the reinitiation process is independent of the initial pressure, and DW has no contacts with the boundary (cellular DW structure is observed only at some distance from the boundary).
When point E lies both on the circle and line OP, radius R — 0.5/ and mixture layer thickness is 0.84/.
5 CRITERION OF QUASI-STATIONARY DETONATION WAVE PROPAGATION AROUND THE CURVILINEAR SURFACE
For quasi-stationary propagation of a multifront detonation wave along a curvi- linear convex surface it is necessary, that in the weakened wave new reinitiation centers arise periodically at some distance from the diffracted surface (within the limits of the gas layer thickness). Being located at some distance from the curvilinear boundary, these reinitiation centers turn DW to the inner wall.
311

HIGH-SPEED DEFLAGRATION & DETONATION
SIMPLE ESTIMATION OF A LAYER SIZE WITHIN THE SCHEME OF REINITIATION CENTERS. MATHEMATICAL MODEL AND ITS COROLLARY
A simple mathematical model for estimating the minimum thickness of a gaseous layer /* through geometrical parameters of the curvilinear surface and physico-chemical parameters of the combustible mixture is pro- posed below.
Points G, C, and H in Fig. 8 are neighboring reinitiation cen- ters; AB (and EF) is the front of a DW emanating from the G- and C-centers at the instant when rarefaction waves arise; AC (and EH) is the trajectory of the RW front which termin- ates the chemical reaction in the DW, ip = ZCOE, V = ^AOC; X = <p + V" = 27r/n, where n is the total number of the reinitia- tion centers in the circle.
Figure 8 Schematic of quasi-stationary deto- nation wave propagation in an annular gaseous layer
With this simple geometrical scheme, one can obtain the following relations:
COSy? : •Ro ~R
Ro
~R cos a = cos(a + ip)
and then — the relation between the angles:
cos a — cos(a + x) tany? =
sin(a + x)
(1)
(2)
(3)
Using Eqs. (l)-(3) yields a relation between the radii of the inner R0 and outer R gaseous layer boundaries as a function of angle x between the neighboring reinitiation centers:
R(x) = Ro y/l + cos2 a — 2 cos a ■ cos(a + x)
sin(a -I- x) (4)
312

PULSED DETONATION ENGINES
On the one hand, because R(X)/RQ > 1, the inequality cos a > cos(a + x) must hold, so that 0 < x < (f - <*)•
On the other hand, it is easy to derive the following relations:
AC =
R
L 2 sin a
AC cos a sin(x — <p)
where /** is the critical channel width for DW diffraction, formulas one obtains:
R(x,<p) = 0.5/,» cot a
sin(x - <p)
The critical channel width can be expressed as
/. ka
(5)
(6)
From the latter
(7)
(8)
where a is the detonation cell size, k is a coefficient depending on mixture com- position, channel size, etc.
Equations (4), (7), and (3) can be transformed to a nonlinear equation
f(U,Ro,a,x) = f(a,k,R0,a,x) 0 (9)
At fixed values of R0 and P0 (and so at known a, k, a), Eq. (9) has a solution X = X* = X*(0.5/»,/i?o). The solution of Eq. (9) is demonstrated in Fig. 9 as the dependence of angle x between the neigh- boring reinitiation centers on the ratio of the critical width of a diffraction chan- nel 0.5/** to the internal boundary radius Ro- Known the x value, the minimum layer width AR = [R(x*) - Ro] can be also evaluated.
The main corollary of Eq. (9) is as follows:
Figure 9 Predicted dependence of the angle between the neighbouring reiniti- ation centers on the ratio of layer geo- metrical sizes
at fixed RQ, an increase of chemical activity of a mixture or increase in the initial pressure P0 diminishes the necessary thickness of a gaseous layer;
at the same time, a decrease in R0 at a fixed P0 entails an increase in the thickness of a gaseous layer required for quasi-stationary propagation of a DW.
313

HIGH-SPEED DEFLAGRATION k DETONATION
7 CONCLUDING REMARKS
The significant results of the investigation are as follows: (i) quasi-stationary regimes of multifront DW rotation around a convex curvi-
linear surface have been realized experimentally;
(ii) it has been established that stationary DW propagation along a curvilin- ear convex surface is possible due to periodic formation of DW-reinitiation centers at some distance from the rotation boundary;
(iii) a mathematical model has been suggested that allows one to estimate the minimum thickness of a gaseous layer required for quasi-stationary rotation of a multifront detonation in a free annular gaseous layer;
(iv) the results of calculations have been shown to be consistent with experi- mental observations;
(v) operation of a detonation engine with external combustion has been shown to be quite feasible.
REFERENCES
1. Shchelkin, K.I., and Ya.K. Troshin. 1963. Gasdynamics of combustion. Moscow: USSR Acad. Sei. Publ.
2. Voitsekhovskii, B. V., V. V. Mitrofanov, and M.E. Topchiyan. 1963. The structure of a detonation front in gases. Novosibirsk: Siberian Division USSR Acad. Sei. Publ.
3. Gelfand, B. E., S. M. Frolov, and M.A. Nettleton. 1991. Gaseous detonation — a selective review. Progress Energy Combustion Science 17:327-71.
4. Vasil'ev, A.A. 1991. The limits of stationary propagation of gaseous detonation. In: Dynamic structure of detonation in gaseous and dispersed media. Ed. A. A. Borisov. Fluid mechanics and its applications ser. Dordrecht-Boston-London: Kluwer Aca- demic Publ. 5:27-49.
5. Nettleton, M. A. 1989. Detonation in gases. Moscow: Mir. 6. Vasil'ev, A.A., and D. V. Zak. 1986. Detonation in mixture jet. Combustion Ex-
plosion Shock Waves 22(4):82-8. 7. Vasil'ev, A.A. 1995. Near-critical regimes of gaseous detonation. Novosibirsk. 8. Hariton, Yu.B. 1947. About detonability of explosives. In: Problems of explosives
theory. Moscow-Leningrad: USSR Academy Sei. Publ 1:7-28. 9. Zel'dovich, Ya.B., S.M. Kogarko, and N.N. Simonov. 1956. Experimental investi-
gation of spherical gaseous detonation. Sov. J. Technical Physics 26:1744. 10. Mitrofanov, V. V., and R.I. Soloukhin. 1964. About diffraction of multifront deto-
nation waves. USSR Acad. Sei. Reports 159(5). 11. Bazhenova, T.V., and L. G. Gvozdeva, et dl. 1968. Shock waves in real gases.
Moscow: Nauka. 12. Knystautas, R., J.H. Lee, and CM. Guirao. 1982. The critical tube diameter for
detonation failure in hydrocarbon-air mixtures. Combustion Flame 48:63-83.
314
DUAL-FUEL CONCEPT FOR ADVANCED PROPULSION
S.M. Frolov, V.Ya. Basevich, and A.A. Vasil'ev
A dual-fuel concept for advanced combustors operating in deflagration or detonation mode has been theoretically evaluated. The concept implies that the liquid-fueled air-breathing propulsion device operates on two liquid fuels that are delivered to the combustion chamber by means of controlled distributed injection and in situ mixing with each other and with air. The fuels are supposed to exhibit essentially different reactivi- ty in terms of ignition delays, burning rates and sensitivity to detona- tion. Jet propulsion kerosene and hydrogen peroxide were found to be promising components of a dual-fuel system for applications in advanced propulsion engines. The use of the dual-fuel concept was shown to allow the efficient control of energy density of the burning material, specific impulse, reactivity (in terms of ignition delays and burning rates), resist- ance to premature ignition, and detonability (in terms of the detonation cell size and critical initiation energy).
1 INTRODUCTION
Several configurations of advanced chemical propulsion systems that will operate in the detonative combustion mode are possible. One applies a concept of fuel combustion in a stabilized detonation front [1]. This concept implies that the approach stream velocity is very high (about the Chapman-Jouguet (CJ) deto- nation velocity 1600-1800 m/s). The other applies a concept of fuel combustion in repeatedly generated detonation waves traversing the combustion chamber [2]. In this concept, there are no principal limitations on the approach stream ve- locity. The thermal efficiency of the ramjet cycle with such a repeated (pulsed) process will evidently depend on the frequency of generation of detonation waves. By increasing the frequency, the thrust generated by such a device can attain the value relevant to continuous detonation combustion in the ramjet. This device, referred to as a pulsed detonation engine (PDE), is the primary focus of the paper.
315

HIGH-SPEED DEFLAGRATION & DETONATION
The operational ability of an air-breathing PDE, to a large extent, is de- pendent on the fuel used. Various requirements of a PDE fuel include: fast evaporation of liquid fuel and mixing with air, reliable detonation initiation in the fuel-air mixture (FAM) at relatively short distances (1-2 m), preventing pre- mature ignition of FAM at hot surfaces and uncontrolled auto-ignition of FAM due to mixing with residual combustion products, and ensuring performance stability under variation of the flight Mach number and altitude. It is hardly possible that a single conventional fuel could meet the above requirements within a wide range of PDE operation conditions without undertaking special measures.
Following the ideas of [3, 4], the dual-fuel concept is evaluated herein. The concept implies that the liquid-fueled air-breathing propulsion device operates on two liquid fuels that are delivered to the combustion chamber by means of controlled distributed injection and in situ mixing with each other and with air. The fuels are supposed to exhibit essentially different reactivity in terms of ignition delays, burning rates and sensitivity to detonation. The dual-fuel concept can be considered as the alternative to the PDE with a predetonator, as it contains one combustion chamber and does not require a strong initiator. As an example of the dual-fuel system, conventional jet propulsion (JP) kerosene and hydrogen peroxide (HP) are considered.
2 KEROSENE-HYDROGEN PEROXIDE DUAL-FUEL SYSTEM AS A PROPELLANT FOR ADVANCED PROPULSION
Jet propulsion kerosene and hydrogen peroxide, H202, are the conventional liquid fuels in aerospace applications. General information on physical and chemical properties of JP fuels is available elsewhere [5, 6]. Detailed description of HP applications in various types of propulsion devices can be found, e.g., in [7-9]. Given below is the brief description of properties of these two substances.
As is known, JP kerosene can be considered to be made up of approximately 79% high n-alkanes, 10% cycloalkanes an 11% aromatics [6]. Thus, JP kerosenes can be approximately modeled by a mixture of high n-alkanes. Density of JP kerosenes varies from 760 to 810 kg/m3 at normal atmospheric conditions. JP kerosenes usually exhibit high boiling temperature (above 450-500 K) and there- fore have low vapor pressure; heat of combustion is about 43-44 MJ/kg.
At normal conditions, HP is a liquid with density 1440 kg/m3 and boiling temperature of 423.3 K. In pure HP, 47% by weight of the substance is available as oxygen. This oxygen can be used for enhancing combustion of JP kerosene in air. In addition, HP is the exothermically decomposing compound with a substantial heat release (about 5.4 MJ/kg) in the course of its decomposition to
316

PULSED DETONATION ENGINES
water and oxygen. HP is usually applied in the form of concentrated aqueous so- lutions. In the absence of contaminating catalysts and in clean containers made of noncatalytic materials, HP is known to be a stable substance. However, the intrinsic stability of HP is affected by various impurities. In practice, decom- position of HP is minimized during storage or use by the addition of stabilizers counteracting the effect of catalytic impurities or container surfaces. Highly concentrated aqueous solutions of HP are stabilized by sodium stannate, oxine, phosphates, etc. [7-9]. The required amount of stabilizers is very small (fractions or units of ppm). Containers for storage and transportation of concentrated HP are usually made of high-purity aluminum, Teflon, or Pyrex glass.
HP solutions with the percentage of H202 less than 95%-96% do not sup- port a propagating condensed-phase detonation at normal conditions, even with powerful initiation and strong confinement. The condensed-phase detonation ve- locity in aqueous solutions containing 96 to 100% H202 is about 6500 m/s [8]. At atmospheric pressure, vapors containing 26% vol. or more HP can be exploded by a spark, by contact with catalytically active materials initially at room tem- perature, or by noncatalytic materials (like aluminum) that are at temperatures of about 420 K and higher [8].
3 REACTIVITY OF KEROSENE-HYDROGEN PEROXIDE BLENDS
The objective of this particular study was to reveal the specific features of the laminar flame in heterogeneous mixtures: drops of hydrocarbon fuel (n-heptane) + HP (vapor) + air by applying the spray flame model [10] with the overall kinetic mechanism presented in Table 1. According to [10], the rate of fuel consumption is governed by the relationship
_ rp
Wd = --pdNM-^DdK (1)
where pd is the density of liquid fuel, Dd is the fuel drop diameter, Nd = Nd0T0/T is the number of drops per unit volume (at constant pressure), T is the temper- ature, K is the drop gasification constant in the D2-law, index 0 denotes initial conditions. Relationship (1) is assumed to represent the rate of reaction 1 in Table 1. The rates of gas-phase reactions 2 to 7 in Table 1 are found as
w =&n^ (2)
where k = ATm exp(-E/RT) is the reaction rate constant, ATm is the pre- exponential factor, m is the temperature exponent, E is the activation energy,
317

HIGH-SPEED DEFLAGRATION & DETONATION
Table 1 Overall reaction mechanism for n-heptane (drops) (vapor) - air mixture
hydrogen peroxide
Forward Reverse
No. Reaction Q A kcal/mol mol, 1, s
m E A kcal/mol mol, 1, s
614 Equation (1)
114 7.0-1013 0.0 21.0
1 C7H16 + IIO2 = 7CO + 8H20
2 H2 + H2 + O2 = H20 + H20
3 CO + CO + O2 = C02 + C02
4 H20 + CO = H2 + C02
5 R + R + M = H20 + M 6 R + H2 + H2 + 02
= R + R + R + H20 7 H2O2=R + R + 0.5O2
Remark: Reaction 6 is treated as trimolecular, i.e., we = k6nRnu2no7
m E kcal/mol
134 8.5 1012 0.0 21.0 10 1.0 1012 0.0 41.5 3.1- 1013 0.0 49.1
109 9.5 1012 -1.0 0.0 2.8- 1017 -2.0 120.0
-4 4.5 1014 0.0 16.4 -92 1.0 1016 0.0 50.0
Table 2 Predicted laminar flame velocities in a hybrid mixture containing n-heptane drops (50 ßm in diameter), HP vapor and air. Initial conditions: To = 293 K, po = 1 bar
Initial content of H202,% vol. 0 1 2 5 10 20 35 50 Initial content of 02,% vol. 20.6 20.4 20.2 19.6 18.5 16.5 13.4 10.3 Laminar flame velocity, cm/s 19.2 19.7 19.8 21.4 23.7 28.5 47.0 83.2
rij is the molar concentration of the jth species and R is the gas constant; Q in Table 1 denotes the heat effect of the corresponding reaction.
In the calculations, the mixtures with a different volumetric content of HP vapor were used, namely, 1%, 2%, 5%, 10%, 20%, 35%, and 50%. Stoichiomet- ric n-heptane (drops) - air mixture was taken as a reference mixture. In the triple mixtures with HP vapor, HP was assumed to replace a part of air. All calculations were made for n-heptane drops 50//m in diameter at p0 = 1 bar and
To = 293 K. Table 2 presents the predicted values of the laminar flame velocity in n-
heptane sprays with additives of HP vapor. The flame velocity increases with the concentration of HP vapor in the mixture, in spite of the fact that the initial
concentration of oxygen in the mixture decreases. At initial concentrations of HP vapor exceeding 20%, the concentration of
oxygen behind the HP decomposition front becomes higher than in the unburned mixture. This implies a possibility to burn excessively fuel-rich mixtures and
increase the energy density of the burning material.
318
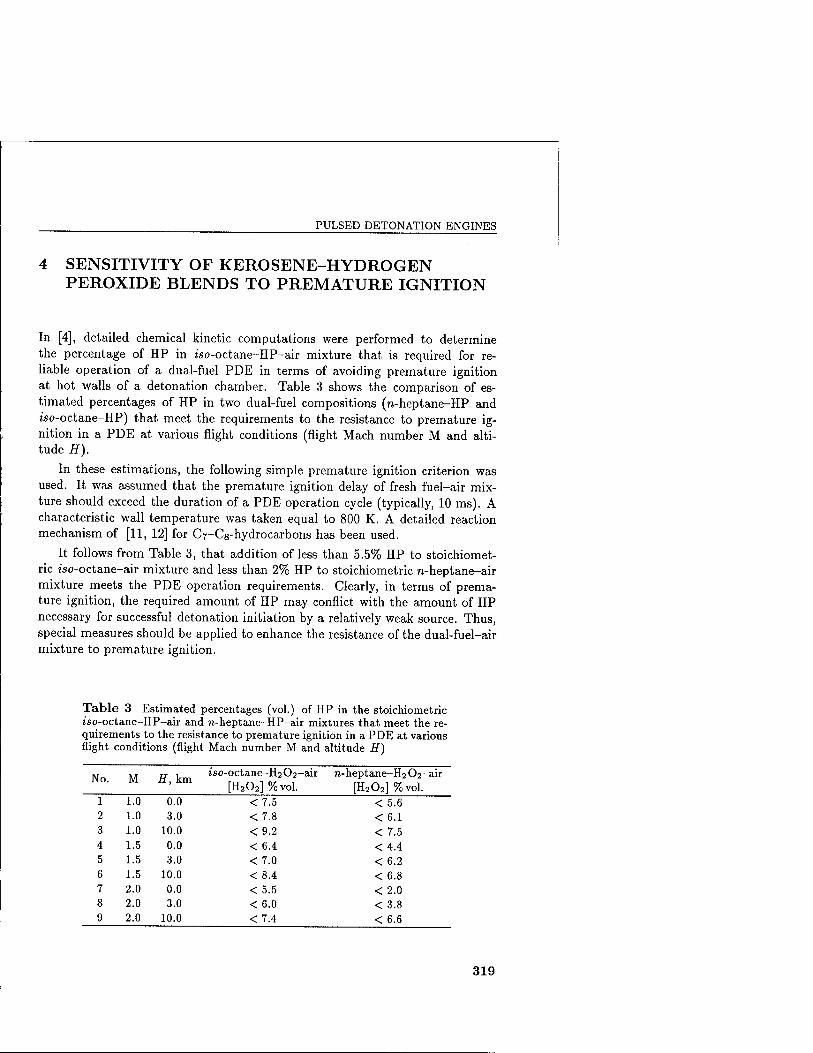
PULSED DETONATION ENGINES
SENSITIVITY OF KEROSENE-HYDROGEN PEROXIDE BLENDS TO PREMATURE IGNITION
In [4], detailed chemical kinetic computations were performed to determine the percentage of HP in ?'so-octane-HP-air mixture that is required for re- liable operation of a dual-fuel PDE in terms of avoiding premature ignition at hot walls of a detonation chamber. Table 3 shows the comparison of es- timated percentages of HP in two dual-fuel compositions (n-heptane-HP and iso-octane-HP) that meet the requirements to the resistance to premature ig- nition in a PDE at various flight conditions (flight Mach number M and alti- tude H).
In these estimations, the following simple premature ignition criterion was used. It was assumed that the premature ignition delay of fresh fuel-air mix- ture should exceed the duration of a PDE operation cycle (typically, 10 ms). A characteristic wall temperature was taken equal to 800 K. A detailed reaction mechanism of [11, 12] for C7-C8-hydrocarbons has been used.
It follows from Table 3, that addition of less than 5.5% HP to stoichiomet- ric iso-octane-air mixture and less than 2% HP to stoichiometric n-heptane-air mixture meets the PDE operation requirements. Clearly, in terms of prema- ture ignition, the required amount of HP may conflict with the amount of HP necessary for successful detonation initiation by a relatively weak source. Thus, special measures should be applied to enhance the resistance of the dual-fuel-air mixture to premature ignition.
Table 3 Estimated percentages (vol.) of HP in the stoichiometric iso-octane-HP-air and re-heptane-HP-air mixtures that meet the re- quirements to the resistance to premature ignition in a PDE at various flight conditions (flight Mach number M and altitude H)
No M H km *s°-°ctane-H202-air n-heptane-H2 02-air ' ' [H2O2] %vol. [H2O2] %vol.
<5.6 <6.1 < 7.5 <4.4 < 6.2 < 6.8 < 2.0 < 3.8 < 6.6
319
1 1.0 0.0 <7.5 2 1.0 3.0 <7.8 3 1.0 10.0 <9.2 4 1.5 0.0 < 6.4 5 1.5 3.0 <7.0 6 1.5 10.0 <8.4 7 2.0 0.0 <5.5 8 2.0 3.0 <6.0 9 2.0 10.0 <7.4

HIGH-SPEED DEFLAGRATION & DETONATION
5 DETONABILITY OF KEROSENE-HYDROGEN PEROXIDE BLENDS
The detonation wave propagating in the premixed reactive gas is a complex multifront gasdynamic structure comprising shock and rarefaction waves, con- tact discontinuities and localized reaction zones. The governing role in initiating and propagation of the detonation wave belongs to transverse waves. The mo- tion of transverse waves is periodic and results in the ordered structure with a characteristic length scale a usually referred to as the cell size.
When the cell size a is available, one can estimate the most important pa- rameters of the multifront detonation wave, namely, the critical diameter of detonation transition from a tube into an unconfmed volume, d»», limiting tube diameter, ds, etc.
In addition, if the cell size a and the energy E0l/ accumulated by the gas in the vicinity of the triple point (point of collision of transverse waves) are known, it is possible to estimate the critical initiation energies Etu for planar (v = 1), cylindrical (v = 2), and spherical (y = 3) detonation. Besides, based on the cell size a one can estimate the overall kinetic data for the heat release reaction in the detonation front, namely, the effective activation energy, preexponential factor and the effective reaction order.
Detonability of JP kerosene-HP blends and the corresponding detonation parameters were evaluated by means of a thermochemical code [13], based on the thermochemical data of the substances and the kinetic mechanisms of their oxidation in air. JP kerosene was approximately represented as a blend of iso- octane and n-heptane. Prior to the calculations, ignition delay of the dual-fuel JP kerosene-HP system was approximated by the formula
_ Aexp(E/RT) . .
where np, no, and n\ are the molar concentrations of fuel (F), oxidizer (O), and inert additive (I), respectively, and ki are the coefficients (i = 1,2,3).
The coefficients A, E, kx, k2, k3 in Eq. (3) for ignition delay of a dual-fuel JP kerosene-HP system were obtained by processing the adiabatic ignition delay calculations based on the reaction mechanism of Cy-Cs-hydrocarbons [11, 12]. The reaction mechanism was designed for temperatures exceeding 550 K and less than 1250 K. To apply the mechanism for the conditions relevant to von Neumann spike in the detonation waves, it was properly modified and validated against experimental data for auto-ignition of pure compounds (iso-octane, n- heptane and HP) in oxygen and air. The ignition delay was simply defined as the time taken for the temperature to rise from the initial temperature to 2000 K. Other definitions of ignition delay provided the values of r that were very close to the values given by such a definition.
320

PULSED DETONATION ENGINES
As a result, the following correlations for r were obtained that are applicable to the conditions of von Neumann spike in fuel-air detonations:
(1) for iso-octane-air and n-heptane-air mixtures, as well as for n-heptane-iso- octane-air mixtures, the following values of coefficients A, E, ki,k2, k3 were used in Eq. (3):
A = 5.4-10-11s-mol/l
£=17.3kcal/mol
*i = 1.0
k2 = k3 = 0.0
(2) for HP-air mixtures:
A = 3.4-10-ns-mol/l
E- 18.6kcal/mol
*i = 1.0
k2 = k3 = 0.0
(3) for «so-octane-HP-air and n-heptane-HP-air mixtures with the overall re- action formula
/3iFi+/?2F2 + 0 = P
the alternative relationship for the ignition delay has been used:
r_ Aexp(E/RT)
(nFl + nr,)*1 n*-»n*» ^ '
where Fi denotes n-alkane fuel, F2 denotes HP, and P denotes reaction products. The values of coefficients A, E, klt k2t k3 are the combinations of those listed above. Thus, for the preexponential factor A and the activation energy E in Eq. (4), the following formulae have been used:
A _ Aßi/(ßi+ß2)Aßa/(.ßi+ß3)
= Eißj + E2ß2
where values Ax, E\ correspond to Fi and values A2, E2 correspond to F2.
Figures 1 and 2 show the predicted dependencies of the most important det- onation parameters of dual-fuel n-heptane-HP-air and z'so-octane-HP-air deto- nations on the molar fraction of HP. In all the cases, stoichiometric n-alkane-air mixtures are considered, i.e., addition of HP does not violate the stoichiometry
321

HIGH-SPEED DEFLAGRATION & DETONATION
Figure 1 Predicted dependencies of the detonation velocity (a), the temperature of detonation products (6), the dimensionless pressure of detonation products (c), and the detonation cell size (d) on the molar fraction of HP at normal conditions for the dual- fuel iso-octane-HP-air mixture (solid curve) and n-heptane-HP-air mixture (dashed curve)
of the n-alkane-air mixture. In general, the behavior of n-heptane-based and iso-octane-based mixtures is very similar. It follows from Figs. 1 and 2 that increase of HP molar fraction from 0 to 50% results in
- insignificant increase (2%-3%) in the detonation velocity of the dual-fuel
system (Fig. la);
322

PULSED DETONATION ENGINES
— nonmonotonous variation of the temperature of detonation products (Fig. 16) with the maximum decrease by 7%;
— increase in the pressure of detonation products by 13% (Fig. lc);
— 11% decrease in the molecular mass of detonation products;
— considerable decreasing of the detonation cell size (Fig. Id) and critical ini- tiation energy of planar, cylindrical and spherical detonation (Fig. 2).
According to Fig. 2, dual- fuel n-alkane - 5% HP - air and n-alkane - 20% HP - air mixtures are equivalent to the stoichiometric ethylene-air and hydrogen-air mixtures, respec- tively, in terms of the criti- cal initiation energy [14]. In view of it, it is instructive to consider such compositions in more detail. As an example, Figs. 3 and 4 show the corre- sponding dependencies of the most important detonation pa- rameters on the initial temper- ature and pressure for the iso- octane - 20% HP - air mixture. Variation of initial temperature from 225 K to 525 K and pressure from 0.25 to 10 bar results in the following findings:
— detonation velocity of the dual-fuel system is nearly insensitive to initial temperature and pressure, being approximately equal to 1800-1850 m/s (Fig. 3a);
— temperature of detonation products increases with the initial temperature by no more than 5% and with initial pressure by no more than 8%, being approximately equal to 2750-2850 K (Fig. 36);
— pressure of detonation products is insensitive to the initial pressure but decreases significantly (by a factor of 2.5) with the initial temperature Fig. 3c);
0.25 c(H202)
Figure 2 Predicted dependencies of the crit- ical initiation energies for planar (Ei), cylin- drical (-E2), and spherical (E3) detonation ini- tiation on the molar fraction of HP at normal conditions for the dual-fuel iso-octane-HP-air mixture (solid curve) and n-heptane-HP-air mixture (dashed curve)
323

HIGH-SPEED DEFLAGRATION & DETONATION
1875 3000
2900-
'—.
2800
2700 225
(b) 27.0
~ ~ - ~ ~ - - 26.8 "---» " ~~""~—~"~"~~"---_ 6
1 26.6
""^^T^^ a. 26.4 ^^^^^Tr~~^
^~^~^-i 26.2
i i i
225 325 425 525
id)
Figure 3 Predicted dependencies of the detonation velocity (a), temperature (6), dimensionless pressure (c), and molecular mass (d) of detonation products on the initial temperature To for the dual-fuel iso-octane - 20% vol. HP - air mixture: 1 — Po = 0.25 bar; 2 — 0.5; 3 — 1.0; 4 — 2.0; 5 — 5.0; and 6 — 10.0 bar
- molecular mass of detonation products is nearly insensitive to the initial temperature and pressure (Fig. 3d);
- detonation cell size is nearly insensitive to the initial temperature, but considerably varies with the initial pressure (Fig. 4a); critical initiation energies are insensitive to the initial temperature, but very sensitive to initial pressure (Fig. 46).
324

PULSED DETONATION ENGINES
(«) (A)
Figure 4 Predicted dependencies of the detonation cell size (a) and critical initiation energies (6) on the initial pressure P0 at initial temperature To = 298 K for the dual- fuel iso-octane - 20% vol. HP - air mixture. Ei — planar, E2 — cylindrical, and E3 — spherical detonation initiation
6 DEFLAGRATION AND DETONATION PARAMETERS OF HETEROGENEOUS DUAL-FUEL SYSTEMS
Table 4 shows the predicted detonation parameters for gaseous and heteroge- neous detonations at normal initial conditions. Column 1 corresponds to det- onation of pure HP vapor. Column 2 shows the corresponding parameters for detonation of fine suspension of liquid HP. (Term 'fine' is attributed to droplets of size that makes possible the equilibrium thermodynamic analysis.) Column 3 is relevant to gaseous detonation of the stoichiometric iso-octane-air mixture. Column 4 shows the detonation parameters for fine stoichiometric suspension of iso-octane droplets in air. Column 5 corresponds to the parameters of gaseous detonation of dual-fuel iso-octane - 10% HP - air mixture, while column 6 cor- responds to the case when HP is present in the form of fine droplets. Columns 7 and 8 correspond to the detonation of equimolar gaseous mixture of HP with air and equimolar suspension of fine HP droplets in air, respectively.
Thermochemical calculations indicate that the phase state of fuel is important for systems with high fuel concentration c, for example, for pure HP (columns 1 and 2, c = 1). At smaller fuel concentrations, the difference in the parameters of gaseous and heterogeneous detonations becomes less pronounced (columns 5 and 6, c = 0.5). For the stoichiometric iso-octane-air mixture with C « 0.09 the difference in the fuel phase state has almost no effect (columns 3 and 4) on the
325

HIGH-SPEED DEFLAGRATION & DETONATION
Table 4 Parameters of detonation waves in gaseous and heterogeneous mixtures at normal conditions. Column 1: gaseous detonation of pure (100%) HP. Column 2: det- onation of fine suspension of liquid HP. Column 3: gaseous detonation of the stoichio- metric iso-octane-air mixture. Column 4: detonation of fine stoichiometric suspension of iso-octane droplets in air. Column 5: gaseous detonation of dual-fuel z'so-octane - 10% HP - air mixture. Column 6: same as Column 5 but HP is present in the form of fine droplets. Column 7: detonation of equimolar gaseous mixture of HP with air. Column 8: detonation of equimolar suspension of HP droplets in air
1 2 3 4 5 6 7 8
Do, m/s 1904 1533 1796 1791 1572 1249 1816 1784
P 23.4 14.9 18.6 18.5 14.5 9.2 19.3 18.6
(i, g/mol 22.5 22.7 27.9 28 25.1 25.2 27.3 27.4
T, K 2539 1685 2830 2817 1969 1283 2827 2744
Qs, J/s 172 183 132 133 97 99 140 145
V2 45.9 29.5 34.5 34.2 28 17.5 36 34.7
T2,K 1340 1007 1540 1542 1159 862 1521 1489
a, mm 1.3 14.4 156 158 15.3 257 17.6 20.5
r, ßs 0.09 1 15.3 15.3 1.2 23.6 1.6 1.9
Ei, J/cm2 1.6 10 130 129 16 165 16 17
£7, J/cm 1 67 9460 9240 110 17,700 130 165
E3, J 11 7320 1.2 • 107 1.2-107 21,400 5.4- 107 20,500 27,500
Dj, m/s 45.5 — 54.1 — 62.5 — 52.9 —
Remark: Do is the Chapman-Jouguet detonation velocity, p = Pd/Po is the dimensionless pressure: Mo is the detonation wave Mach number, ß is the molecular mass of combustion products, X is the temperature of detonation products, Qg is the specific heat release in the detonation wave, p2 is the dimensionless pressure in the von Neumann spike, T2 is the temperaturein the von Neumann spike, a is the detonation cell size, T is the ignition delay in the detonation front, £1 is the critical initiation energy of planar detonation, E2 is the critical initiation energy of cylindrical detonation, E3 is the critical initiation energy of spherical detonation, Dj is the Chapman-Jouguet deflagration velocity.
detonation parameters. Nevertheless, with the addition of 10% HP the effect of heterogeneity increases (compare columns 7 and 8). It is anticipated that further increase in the content of HP will make more pronounced a difference between
gaseous and heterogeneous detonation parameters.
7 DETONABILITY OF A DUAL-FUEL SYSTEM BASED ON AQUEOUS SOLUTIONS OF HYDROGEN PEROXIDE
In this section, further evaluations are performed dealing with the use of aqueous solutions of HP rather than pure HP in the dual-fuel system under consideration.
326

PULSED DETONATION ENGINES
The motivation for such a study is based on the fact that HP is commercially available in the form of concentrated aqueous solutions. Moreover, as a fuel (or oxidizer) HP is more attractive as the aqueous solution due to a lower freezing point as compared to the pure HP.
Detonability in air of two dual-fuel systems: iso-octane - 20% HP,
80%(0.08iso-C8H18 + O2 + 3.76N2) + 20%(V'H2O + (l-V)H2O2) (5)
and iso-octane - 60% HP,
40%(0.08iso-C8Hi8 + 02 + 3.76N2) + 60%(V>H2O + (1 - V))H202) (6)
containing fso-octane and HP (as aqueous solution) has been estimated by ap- plying the thermochemical code [13]. In Eqs. (5) and (6), ip is the molar fraction of water in the aqueous solution of HP. Detonability of dual-fuel compositions of Eqs. (5) and (6) was estimated at normal ambient conditions, i.e., P0 = 1 bar and To = 298 K. The results of calculations are shown in Figs. 5 to 7.
The use of aqueous solutions of HP (ip > 0) results in decrease of the detona- tion velocity (Fig. 5a), temperature and pressure of detonation products (Figs. 56 and 5c), molecular mass of the initial mixture and detonation products (Fig.öa"), chemical energy release, temperature and pressure in the induction zone of the detonation wave as compared with the case of tj) = 0. As a consequence, the detonation cell size (Fig. 6 a) and critical initiation energy (Fig. 65) increase with ip. Addition of water does not considerably affect the detonation parameters if the dual-fuel system with low percentage of HP is used.
Solution of HP with water can entirely eliminate the advantages of the dual- fuel concept if the amount of water is rather large. For example, the use of 10% aqueous solutions of HP (i.e., 10% HP + 90% water) in the dual-fuel sys- tem iso-octane - 20% HP results in the critical initiation energy exceeding the value characteristic for the stoichiometric iso-octane-air mixture (compare the corresponding curve in Fig. 66 with the dashed line '0% H202'). Dashed lines '20% H202' and '60% H202' in Fig. 6 refer to the detonation cell size and critical initiation energy for the corresponding dual-fuel systems containing no water.
Clearly, the sensitivity of the dual-fuel system to water content in terms of all detonation parameters (detonation velocity, temperature and pressure, cell size, critical initiation energy, etc.) is less for systems with lower amount of HP (compare the slopes of curves in Figs. 5 and 6 for systems zso-octane - 20% HP and iso-octane - 60% HP).
The search of the most promising compositions of the fuel system JP kero- sene - aqueous solution of HP should be based on considering a whole set of requirements. For example, the requirement to the lowest freezing point of the
327

HIGH-SPEED DEFLAGRATION & DETONATION
1900
1800-
1700
1600
1500
2800
2400-
2000
1600 0.0 0.2 0.4 0.6 0.8 1.0
(«)
0.0 0.2 0.4 0.6 0.8 1.0
(b) 27
0.0 0.2 0.4 0.6 0.8 1.0 V
(c)
0.0 0.2 0.4 0.6 0.8 1.0
(«0
Figure 5 Detonation velocity (a), temperature (6), pressure (c), and molecular mass (d) of detonation products as a function of the molar fraction of water f in the aqueous solution of HP for dual-fuel systems iso-octane - 20% HP (curve 1) and iso-octane - 60% HP (curve 2)
fuel implies the use of aqueous solutions of HP containing 38%-55% (wt.) wa- ter [8]. Under these conditions, the freezing temperature of the solution is as low as about - 55 °C. At water content 20%, the freezing temperature increases to about - 25 °C. Thus, a compromise between the requirements to fuel detona- bility and freezing point should be found. The requirement of high detonability implies the use of very concentrated solutions of HP, e.g., 90%-95%.
328

PULSED DETONATION ENGINES
Figure 6 Detonation cell size (a) and critical initiation energy for spherical detona- tions (6) as a function of molar fraction of water f in the aqueous solution of HP for dual-iuel systems «so-octane - 20% HP (curves I) and iso-octane - 60% HP (curves 2) Horizontal dashed lines «0% H202,' '20% H202,> and '60% H202' correspond to the, cell sizes (a) and to E3 (6) in the corresponding systems with i[> = 0
8 EFFECT OF FUEL BLENDING ON THE SPECIFIC IMPULSE
The specific impulse is one of the most important parameters in the performance analysis of propellants. For an ideal stationary rocket engine, it is defined as rsp = Ueff/g, where g is the acceleration of gravity and weff is the effective exit velocity; for the adapted nozzle
«eff = 2T RQT
7-1 n 1- |^
Pr
(7-l)/T' 1/2
where 7 is the ratio of specific heats, R0 is the universal gas constant, T is the combustion temperature, fi is the molecular mass of exhaust gases, Pa is the ambient pressure, and Pc is the pressure in the combustion chamber. Thus, the specific impulse of propellant for an adapted nozzle can be evaluated by' the formula:
*sp 27 RQT
7-1 H
p \ (T-l)/7
P
1/2
(7)
329

HIGH-SPEED DEFLAGRATION fc DETONATION
1050
1000
1 950
w ,.^-v-v--v--v-v-v-^-
iya-a- D-o-n-o-n-oa-o- r D
900
850
jr^-A^A-A-^ •iAi-fri- _ A
0.0 0.1 c(H202)
0.2
Figure 7 The predicted dependence of the speed of sound in the combustion products on the molar fraction of HP in n-heptane-HP- air (shown by curves) and iso-octane-HP-air (shown by symbols) mixtures for four different combustion modes: (1) constant-volume com- bustion (Vo = const), (2) constant-pressure combustion (Po = Pa = const), (3) CJ def- lagration, and (4) CJ detonation
(3) CJ deflagration, and (4)
detonation. Figure 7 shows the results of calculations for the iso-octane-HP blends (shown by curves) and n-heptane-HP blends (shown by symbols), de- pending on the molar fraction of HP in the blend, cHao3. In terms of cj, the highest specific impulse is attained when the blends are detonated. Deflagration provides Isp that is about 15% less than that provided by detonation. Constant- volume and constant-pressure combustion provide 7sp that are somewhat be- tween those provided by detonation and deflagration. A positive effect of HP
addition on Isp becomes apparent at cH2o2 exceeding 0.1.
The specific impulse is directly proportional to the square root of the chamber temperature and in- versely proportional to the square root of the mean molecular mass of the combustion products, so that the parameter (T//i)1/2 is a good characteristics for comparing different propellants. This param- eter is proportional to the speed of sound in the combustion products, cj. Another consequence of Eq. (7) is that 7sp is higher for higher com-
bustion pressure Pc. In view of the importance of Isp
for the performance of propulsion devices, a set of thermodynamic calculations was made to evaluate Jsp for various fuel blends at different combustion modes. Four characteristic combustion modes were considered, namely, (1) constant-volume combustion (Vo = const), (2) constant-pressure
combustion (P0 - Pa - const), CJ
9 CONCLUDING REMARKS
Jet propulsion kerosene and hydrogen peroxide were found to be promising com- pounds for applications in advanced propulsion systems such as PDE. This con-
clusion is based on the following findings:
330

PULSED DETONATION ENGINES
(1) The laminar flame velocity in suspensions of n-heptane droplets in air with addition of HP vapor increases with the concentration of HP vapor in the mixture. Addition of HP vapor to kerosene-air mixture allows one to signifi- cantly increase the energy density of the burning material due to increase of the amount of kerosene required for complete burnout in the unit volume.
(2) In terms of premature ignition, the required amount of HP in a fuel blend may conflict with the amount of HP necessary for successful detonation initiation by a relatively weak source. Therefore special measures should be forseen to enhance the resistance of the fuel blend to premature ignition.
(3) Detonability of blends of JP kerosene with pure HP increases significantly with the content of HP. In terms of the critical initiation energy, the kerosene-air mixtures with 5% and 20% of HP were shown to be equiva- lent to stoichiometric ethylene-air and hydrogen-air mixtures, respectively.
(4) Detonation parameters (propagation velocity, pressure and temperature of detonation products, etc.) in the dual-fuel system have been shown to be nearly insensitive to the molar fraction of HP in the fuel blend.
(5) Dynamic parameters (cell size, critical initiation energy, etc.) of detonations in the dual-fuel system have been shown to be nearly insensitive to the initial temperature and highly sensitive to the initial pressure.
(6) Phase state of fuel (gaseous or liquid) is important at relatively high fuel concentrations in the dual-fuel system. Detonation cell size and critical ini- tiation energy in the stoichiometric liquid-fueled system containing 10% HP exceed the corresponding values for the gas-fueled system by about 16% and 34%, respectively.
(7) The fuel system kerosene - aqueous solution of HP can also be considered as a promising dual-fuel system for PDE applications. Detonability of the system increases when "stronger" aqueous solutions of HP are applied and larger contents of HP in the dual-fuel system are used. The sensitivity of detonation parameters to water content is less for fuel compositions with low amount of HP (less than about 20% vol.).
(8) Addition of HP vapor to the hydrocarbon-air mixture results in increase of the specific impulse Isp. This effect becomes apparent at molar concentra- tions of HP exceeding 10%.
ACKNOWLEDGMENTS
This work was partially supported by RFBR, INTAS, and ONR.
331

HIGH-SPEED DEFLAGRATION & DETONATION
REFERENCES
1. Nicholls, J.A., and E.K. Dabora. 1962. Recent results on standing detonation waves. 8th Symposium (International) on Combustion Proceedings. Pittsburgh, PA: The Combustion Institute. 644-55.
2. Roy, G. D. 1999. Pulsed detonation phenomena for air-breathing propulsion. AIAA Paper No. A99-34128.
3. Frolov, S.M., V.Ya. Basevich, A.A. Belyaev, and M.G. Neuhaus. 1999. Applica- tion of fuel blends for controlling detonability in pulsed detonation engines. In: Gaseous and heterogeneous detonations: Science to applications. Eds. G. D. Roy, S. M. Frolov, K. Kailasanath, and N.N. Smirnov. Moscow: ENAS Publ. 313-30.
4. Frolov, S.M., and V.Ya. Basevich. 1999. Application of fuel blends for active det- onation control in a pulsed detonation engine. AIAA Paper No. A99-34130.
5. Goodger, E. M. 1975. Hydrocarbon fuels. London: Macmillan.
6. Gueret, C., M. Cathonnet, J.C. Boettner, and F. Gaillard. 1990. Experimental study and modeling of kerosene oxidation in a jet-stirred flow reactor. 23rd Sympo- sium (International) on Combustion Proceedings. Pittsburgh, PA: The Combustion Institute. 211.
7. Seryshev, G. A. 1984. Chemistry and technology of hydrogen peroxide. Leningrad: Chemistry Publ.
8. Schumb, W.C., C.N. Satterfield, and R. L. Wentworth. 1955. Hydrogen peroxide. New York: Reinhold Publ. Corp., London: Chapman fc Hall.
9. Cheung, W.S. , and J.R. Tilston. 1999. Hydrogen peroxide based propulsion sys- tem for micro air vehicle applications. ISABE Paper-99-7278. Presented at the 14th ISOABE. Florence, Italy.
10. Basevich, V.Ya., A.A. Belyaev, and S.M. Frolov. 2000. Modeling of propagating two-phase laminar and turbulent flames. CJiemica7 Physics Reports 10:89-97.
11. Basevich, V.Ya., and S.M. Frolov. 1994. Reduced kinetic scheme for modeling auto-ignition of iso-octane and n-heptane-air mixtures during the induction period for application to internal combustion engines. ChemicaJ Physics Reports 13(8-9): 146-56.
12. Basevich, V.Ya., A.A. Belyaev, W. Brandstaetter, M.G. Neuhaus, R. Tatshl, and S.M. Frolov. 1994. Modeling of auto-ignition of iso-octane and n-heptane in condi- tions relevant to internal combustion engines. Combustion Explosion Shock Waves
30(6):15-25. 13. Vasil'ev, A.A., A.I. Valishev, V. A. Vasil'ev, L. V. Panfilova, and M. V. Topchiyan.
1997. Chemical Physics Reports 16(9):1659-66. 14. Borisov, A.A. 1999. Initiation of detonation in gaseous and two-phase mixtures. In:
Gaseous and heterogeneous detonations: Science to applications. Eds. G. D. Roy, S.M. Frolov, K. Kailasanath, and N.N. Smirnov. Moscow: ENAS Publ. 3.
332

MATHEMATICAL MODEL OF A SUPERSONIC PULSED DETONATION RAMJET ENGINE
V. G. Alexandrov, A. N. Kraiko, and K. S. Reent
A mathematical model of a new-type supersonic pulsed detonation- ramjet engine (SPDRE) is suggested. This design differs fromTfie pulsed detonation engines considered earlier, particularly, in that it has no pe- riodically operating ignition source. The engine needs to be started only once. In addition, the detonation wave in SPDRE propagates in a supersonic flow rather than in a quiescent gas or subsonic flow. The pulsed detonation process in it is initiated by periodical changes in fuel supply. For comparison reasons, stationary alternatives of SPDRE with subsonic (RAMJET) and supersonic (SCRAMJET) burning were calcu- lated within the framework of models of the same degree of idealization. In typical examples, their specific impulses are slightly greater than the specific impulse of SPDRE, but the local characteristics should be taken into account. In spite of virtually equal stagnation temperatures, the flow density, and therefore heat flux to the walls in SCRAMJET and RAMJET are much higher than in SPDRE. The flow deceleration de- gree through the engine length also differs significantly. In a typical example, the pressure from the entrance to the combustion chamber in- let increases by a factor of 40 in SPDRE, 160 in SCRAMJET and 1500 in RAMJET. Thus, because of the negative influence of viscosity, which has not been taken into account in all mathematical models, the ac- tual specific impulse should decrease to a greater extent in the case of SCRAMJET and RAMJET, than in the case of SPDRE.
1 INTRODUCTION
Since the end of the 80's in different countries, basically in USA, large attention is paid to theoretical and experimental exploration of a possibility to construct a ramjet engine with burning a fuel-air mixture in propagating detonation waves. Papers [1-13] and surveys [14, 15] provide quite complete information on the obtained results and available designs of pulsed detonation engines (PDE).
333

HIGH-SPEED DEFLAGRATION fc DETONATION
In general, there exist the valved and valveless types of PDE engine designs. In a valveless PDE [3], special attention is given to the investigation of gasdy- namic processes governing its operation cycle. These are: filling of detonation chamber with air and fuel, their mixing, detonation initiation by periodically triggered external ignition, propagation of the detonation wave through a nonuni- form gas mixture, propagation of the shock wave reflected from the "thrust wall" through combustion products, and finally exhaust of the combustion products from the detonation chamber.
A six-chamber valved PDE is considered in [11]. Its operating principle is based on periodic opening and closing of chambers two at a time. The process undergoes the following phases: filling the chambers with air and fuel, mixing, initiation of detonation by energy deposition near one of the chamber ends that is currently closed, spreading of the detonation wave to the left or to the right, its reflection (when initiated near the right-hand end), exit from the chamber, and exhaust of the combustion products followed by pressure release. When the entrance valve opens, the pressure in the left-hand part of the chamber should be low enough to provide the beginning of a new cycle. All the chambers are fed with air through a common inlet and the combustion products exhaust through a common nozzle. The greater the number of chambers in such a PDE the lower is the level of disturbances in its inlet and nozzle. Such a PDE is capable of starting to operate at a zero flight speed.
Theoretical predictions of the performance of such engines, e.g., specific im- pulse 7sp, inevitably rest on various simplifying assumptions because of com- plexity of relevant gasdynamic processes. Thus, in [13], a numerical simulation of the nonstationary process in a single detonation chamber of a valved PDE with an attached nozzle assumes, that the fuel and air mix ideally and instan- taneously, and the detonation initiation is simulated by setting high values of pressure and temperature in some part of the chamber. These assumptions cannot be ignored when estimating the validity of the obtained 7sp values of 3500-4000 s. Furthermore, the flow inside the PDE chamber and nozzle are con- sidered in [13] without regard for its deceleration in the inlet to deep subsonic velocities.
At supersonic flight velocities of the PDE-based aircraft, the entropy rise (drop of the total pressure) in a shock wave alone (i.e., without taking into account other less essential losses related to the boundary layer and its sepa- ration in the course of supersonic flow deceleration) will significantly decrease the predicted Jsp value. This decrease progresses as the flight Mach number M0
increases. Thus, contrary to the SPDRE scheme, the PDE schemes of [1-15] require the detonation wave to propagate either through a virtually stagnant mixture, as in valved engines, or through a mixture flowing at a subsonic or nearly sonic velocity, as in valveless engines. In a valveless engine, even if gas accelerates to a supersonic velocity in some engine section, the average Mach number in the chamber is much lower than Mo-
334

PULSED DETONATION ENGINES
2 BRIEF DESCRIPTION OF THE MATHEMATICAL MODELS OF SPDRE, SCRAMJET AND RAMJET
The mathematical model of SPDRE includes (1) the ideal (2D) inlet with two shock waves of equal intensity emanating from the central-body wedges and a shock wave resulting from reflection of the first two shock waves from the cowl — the wall element parallel to the oncoming flow, (2) mixing chamber, and (3) combustion chamber. Additional deceleration of the gas to a preset Mach number M5 > 1 is caused by wedge-pylons used for fuel supply. Mixture param- eters at the exit from the mixing chamber are calculated using the conservation laws of mass, momentum and energy and experimental data on the base press- ure [16-18].
The unsteady flow in the combustion chamber and nozzle is calculated by means of numerical integration of one-dimensional nonstationary gasdynamic equations with explicitly tracked discontinuities — detonation waves and con- tact discontinuities separating the zones of combustion products of fuel-rich and fuel-lean mixtures. The tracking procedures are based on the preliminarily cal- culated detonation Hugoniot and on the conservation of mixture composition downstream of the detonation wave in Lagrangian coordinates. The computa- tions were carried out using a monotonous conservative finite-difference scheme of the second order accuracy. This scheme is further improvement of the orig- inal scheme proposed by Godunov [19]. The second order accuracy is achieved by using a special reconstruction procedure based on the principle of the mini- mum derivative or increment [20-23] and by splitting the integration step into "predictor" and "corrector" [24, 25].
Calculations of hydrogen-air SPDRE were carried out with the aid of the thermodynamic model [26] previously used to study a flow in SCRAMJET with stationary supersonic combustion [27-29]. According to this model, the chemical composition of combustion products depends on the water-determined combus- tion efficiency 77 and equivalence ratio a. In SPDRE, coefficient rj is derived from the detonation Hugoniot corresponding to complete thermodynamic equilibrium. The value of 77 is assumed to be frozen downstream of the detonation wave. The concentrations of other chemical components in the flow were calculated by using the equilibrium relationships.
The mathematical models used to calculate the flow in stationary alternatives of SPDRE (RAMJET with subsonic burning and SCRAMJET with supersonic burning) were of the same order of idealization as the model used in SPDRE calculations. In the SCRAMJET model, the flows in inlet, pylons and mixing chamber were calculated in the same way as in SPDRE. The total deceleration degree was determined from the condition of spontaneous ignition of premixed fuel and air. For hydrogen-air mixtures, the static temperature of 1100 K re-
335

HIGH-SPEED DEFLAGRATION & DETONATION
quired for autoignition (according to [30-34]) was adopted. The initial portion of the combustion chamber (up to section with M = 1) was assumed to be cylindrical and the remaining part was sonic with M = 1.
In the RAMJET model, the supersonic flow initially decelerates to a preset Mach number M3 = 2.5 in the inlet with three shock waves of equal intensity (in terms of pressure). Then the flow decelerates isentropically (and slightly ac- celerates) in the channel of variable cross-section area to the other preset Mach number M4 = 1.4. Thereafter, the flow decelerates from M4 to M5 < 1 in the terminal normal shock wave and, finally, decelerates isentropically to M6 = 0.2 in the expanding channel at the entrance to the combustion chamber. Flow calculations in SCRAMJET and RAMJET combustion chambers (in RAMJET, a combustion chamber of constant cross-section was assumed) were performed using the mass, momentum and energy conservation equations within the frame- work of the same thermodynamic model for combustion products. These equa- tions were used in calculating the detonation Hugoniot. The stationary flow in nozzles of SCRAMJET and RAMJET was modeled using a specially calculated isentrope of partially frozen equilibrium combustion products (frozen only in terms of rj) [35].
COMPARISON OF THRUST AND LOCAL CHARACTERISTICS OF SPDRE, SCRAMJET AND RAMJET
Some of the results of one SPDRE flow calculation are presented in Table 1 and Fig. 1. These results pertain to a SPDRE operation in flight at altitude H = 25 km and Mach number M0 = 6.5. In this example, the fuel-rich mixture was represented by the stochiometric composition (a = 1) and fuel-lean mixture — by pure air (a = 00). Table 1 shows how the periodic engine operation sets in.
The first column represents the number of periods including the first period after the start. The second and third columns show the total nondimensional cycle time, r, between subsequent ini- tiations of detonation waves and nondimensional fuel supply time, TJ, during the same cycle, respec- tively. The forth column rep- resents the specific impulse of the engine, 7sp, and the fifth —
Table 1 Onset of the periodic regime of SPDRE operation
Period T Tf isp, s Tign, K
1 3.770 2.971 2956 1212
2 3.605 2.727 3049 1315
3 3.575 2.698 3051 1331
4 3.560 2.682 3051 1334
5 3.565 2.687 3051 1334
6 3.573 2.691 3051 1334
336

PULSED DETONATION ENGINES
static ignition temperature, 7]gn, behind the shock wave directly before it enters the next mixture portion. According to [31-34], the calculated Tign is capable of igniting a stochiometric hydrogen-air mixture.
The specific impulse was determined from the nozzle thrust R. The nozzle thrust is taken equal to the average, over the period r, integral of pressure force acting on the nozzle walls parallel to the oncoming flow velocity vector. The following formula has been used for thrust calculation:
R=-Jdtjp(x,t)F'dx-(Fj-F0)p0
4.5-
a. 3.0-
1.5-
0
15
10
where t is the time elapsed from the beginning of the period; x is the coordinate directed along the oncoming flow velocity vector, subscripts 0, i, and / denote the inlet entrance, and the nozzle entrance and exit, respectively; F = F(x) is the nozzle cross-section area; F' = dF/dx; and p(x,t) is the static pressure in the nozzle. During the calculations, the optimum nozzle expansion ratio and the nozzle exit coordinate were assessed. In the examples given below, the cross- section area F(x) increased linearly with x, Fj was as- 6.0 sumed large, and the thrust was determined for F vary- ing within the interval [Fi,Ff]. The value of F pro- viding the maximum value of R was taken as the nozzle exit cross-section area. In this example, Fj w 30.
Figure 1 displays the pre- dicted static pressure distri- butions (solid curves) along the detonation chamber and nozzle at four time instants during one period of engine operation. The time in Fig. 1 is normalized by r. Condition t = 0 corresponds to the time instant when the detonation wave goes out. To normalize a distance, the total length of the com- bustion chamber and nozzle was taken as a length scale. The pressure distribu- tion relevant to t = 0 corresponds to the detonation wave directly before it goes out (instantaneous within the used model). Two subsequent curves (t = 0.07 and 0.26) correspond to flow with a shock wave. Pressure distribution at t = 0.52
st=0 L 0.52
\o.07, PxT0-26
"
1 s 1 •• 1 S 1 s*
1 •» \ S
\±1 1 \ .
0.25 0.50 x
0.75 0
1.00
Figure 1 Predicted evolution of static pressure distribution (solid curves) in the SPDRE detonation chamber and nozzle. Dashed curve shows variation of the cross-section area F = F(x)
337

HIGH-SPEED DEFLAGRATION k. DETONATION
pertains to the detonation wave propagation along the detonation chamber. In addition, Fig. 1 shows the assumed variation of the cross-section area, F = F(x) (dashed curve). Except shortly after the engine start, the detonation wave profile corresponds to the Chapman-Jouguet regime, with the rarefaction wave attached to the detonation front.
For the sake of comparison, parameters of hydrogen-air SCRAMJET and RAMJET were calculated for the same values of H and M0 by using the mathe- matical models described above. The specific impulses obtained for these engines were equal to 3278 and 3570 s, respectively. These values exceed the predicted specific impulse of SPDRE equal to 3051 s. Moreover, SPDRE is inferior to SCRAMJET and RAMJET in terms of the specific thrust Rsp. Specific thrust is the thrust normalized by the air mass flow rate. For the above-listed engines the values of Rsp are as follows: 66.6, 92.4, and 104 s. However, when compar- ing different types of a ramjet engine, not only specific impulse and thrust are important, but also local characteristics.
Some of the local characteristics calculated for SPDRE are listed in Table 2. Numbers from 1 to 5(m) in the first column of Table 2 correspond to different engine sections upstream of the detonation chamber, with 5, 5(f), 5(a), and 5(m) denoting air parameters between pylons, fuel parameters at the exit of
fuel nozzles, air (in the absence of fuel) and mixture at the exit cross-
Table 2 Distribution of parameters along section of the mixing chamber, re- SPDRE path length spectively.
Pylons occupy approximately 0.129 of the chamber cross-section area at section number 5. Num- bers 6(si) and 6(se) label air pa- rameters behind the shock wave in air just before it enters and ig- nites the mixture and in the air behind the shock wave produced by the detonation wave that just has gone out. Finally, numbers 6(wi) and 6(we) mark the param- eters of combustion products be- hind the detonation wave just af- ter it has been initiated and just after it has gone out, respectively. The last column of Table 2 lists
the mass flow rate pV for the stationary flow (first nine rows) and nonstationary flow (last four rows). The mass flow rate essentially determines heat fluxes from gas to the engine walls and other elements. In SPDRE, the greatest mass flow rate is attained not behind the detonation wave in the fuel-rich mixture, i.e.,
338
No. V T, K M pV
0 0.0169 222 6.50 1.00
1 0.0456 302 5.45 1.93
2 0.1231 409 4.55 3.74
3 0.5089 632 3.40 9.26
4 0.5656 650 3.33 9.90
5 0.6274 669 3.26 10.6
5(f) 1.0178 690 1.50 2.07
5(a) 0.5395 662 3.29 9.23
5(m) 0.8471 732 2.66 9.50
6(si) 4.1383 1329 1.32 19.7
6(se) 4.0367 1311 1.08 15.9
6(wi) 5.0745 2925 0.82 8.70
6 (we) 5.2906 2939 0.78 8.63

PULSED DETONATION ENGINES
in the zone with the highest temperature, but behind the wave in the fuel-lean mixture (in the given example — in pure air), where temperature is relatively low. Behind the wave in the fuel-rich mixture, the mass flow rate is even lower than in the major engine part. In addition to local parameters listed in Table 2, the values of combustion efficiency 77 behind the detonation wave are also im- portant. At time when the detonation wave is just initiated and at time when it goes out, the predicted values of t] are rji = 0.822 and rje = 0.818, respectively.
Local characteristics of SCRAM JET and RAMJET are summarized in Ta- bles 3 and 4 that are arranged similar to Table 2. The numbers from 0 to 5(m) listed in the first column of Table 3 have the same meaning as in Ta- ble 2. The only difference consists in the absence of number 5(a) because fuel is supplied continuously. It can be seen from Table 3, that the static pressure in SCRAMJET is several times higher than in SPDRE along the entire inlet path. At the same time, the maximum static pressure in the combustion cham- ber of SCRAMJET exceeds the maximum static pressure in SPDRE (behind the detonation wave) only by a factor of 1.3. The pylon cross-section area in section 5 is 0.057 of the cylindrical chamber cross-section. The combustion ef- ficiency at the exit from the initial cylindrical part of the combustion chamber is only rj = 0.137, while at the exit from the combustion chamber (isobaric part) it attains the value of t] = rj7 = 0.871. At the same time, the mass flow rates in SCRAMJET are significantly higher than in SPDRE along the en- gine path length. For example, at the exit from the combustion chamber of SCRAMJET, the mass flow rate is 1.8 times higher than behind the detonation wave in SPDRE with nearly identical stagnation temperatures of combustion products.
Table 3 Distribution of parameters along the SCRAMJET path length
Table 4 Distribution of parameters along the RAMJET path length
No. P r, K M pV No.
0
P
0.0169
T, K
222
M
6.50
pV
0 0.0169 222 6.50 1.00 1.00 1 0.0816 384 4.73 2.66 1 0.0749 369 4.84 2.56 2 0.3938 635 3.39 7.10 2 0.3320 592 3.56 6.53 3 2.4162 1100 2.00 19.23 3 1.4073 871 2.56 16.22 4 2.5469 1114 1.96 19.74 4 9.028 1383 1.40 44.60 5 2.6831 1129 1.93 20.33 5 18.958 1664 0.74 44.60 5(f) 4.8322 690 1.50 9.83 6(a) 25.897 1787 0.20 15.99 5(m) 3.5794 1100 1.62 19.74 6(f) 25.897 1000 — — 6 7.0105 1601 1.00 19.74 7 25.480 1573 0.23 16.47 7 5.3325 2805 1.00 11.56 8 24.044 3065 0.33 16.47 8 0.0169 824 4.53 0.321 9 0.0169 629 5.28 0.43
339

HIGH-SPEED DEFLAGRATION & DETONATION
Mass flow rates in RAMJET (see Table 4) are also higher. In the row 6(f) representing the parameters at the exit from the fuel pylons, the Mach number is omitted due to its small value. The hydrogen stagnation temperature was taken equal to 1000 K (the same for all the considered engines). The combustion efficiency at the exit from the combustion chamber of RAMJET was r) = rjs = 0.847. The maximum temperature at the exit from the cylindrical combustion chamber of RAMJET exceeds the maximum temperature in SPDRE only by 127 K, and in SCRAMJET — 260 K. The stagnation temperature in RAMJET is slightly lower and the flow density in the combustion chamber is almost the same as in SCRAMJET. The ratio of the path length to the pV maximum value in RAMJET to the appropriate parameter in SPDRE equals to 2.3. In SPDRE, this mass flow rate is attained behind the shock wave for the time less than 0.2 of the period at a distance less than 0.25 of the total length of the detonation chamber and nozzle.
When comparing specific impulses and thrusts of SPDRE and its station- ary alternatives, one should take into account the essentially different degree of flow deceleration in the engines. Whereas in SPDRE the air flow ahead of the combustion chamber is decelerated to a Mach number M5 = 3.26 and the pressure ratio ps/po = 37, in the case of SCRAMJET the appropriate values are equal to 1.93 and 159, and in the case of RAMJET — 0.2 and 1533. Clearly, in SCRAMJET and RAMJET, the negative influence of the air viscosity and heat conductivity, which has not been taken into account in the present math- ematical models, will be greater than in SPDRE. Due to the same reason it is impossible to achieve the total pressure recovery coefficient a = p„e/p*o — 0.42 obtained for the RAMJET. Thus, although all the present models overestimate the Isp and Rsp values, one should expect a greater reduction of their ideal values for SCRAMJET and RAMJET than for SPDRE. For example, decreas- ing twice the above a value reduces 7sp and Rsp of RAMJET to 3316 s and 96.3 s.
4 CONCLUDING REMARKS
A mathematical model of a new scheme of Supersonic Pulsed Detonation Ramjet Engine has been developed. The pulsating nonstationary operation process in such an engine is initiated by a periodic variation of the fuel supply regime, and a special ignition source is needed only to start the engine. The nonstationary flow in a cylindrical detonation chamber and nozzle is calculated by integrating one-dimenFional nonstationary gasdynamic equations employing a monotonous finite-difference scheme of the second order accuracy with detonation waves and contact discontinuities tracked explicitly. Mathematical models of RAMJET and SCRAMJET with the same level of idealization were developed to directly com-
340

PULSED DETONATION ENGINES
pare the characteristics of SPDRE and its stationary alternatives with subsonic and supersonic combustion.
The calculations for hydrogen-air ramjet engines demonstrate the advan- tages of using SPDRE in aircrafts flying at Mach numbers M0 = 4.5-7. In spite of comparatively lower values of specific impulse and thrust SPDRE operation is significantly facilitated by a smaller degree of supersonic flow deceleration, and, as a consequence, by smaller heat fluxes to the walls and smaller losses connected with gas nonideality (not taken into account in the present mod- els).
The use of fuel-lean mixtures with finite a in SPDRE makes it possible to reduce the needed level of preliminary air deceleration and to further diminish heat fluxes and effects of flow nonideality.
The SPDRE scheme and the art of SPDRE operation described above have been patented [36].
ACKNOWLEDGMENTS
The authors respectfully remember the late Victor T. Green, who brought the authors' attention to this research. They would like to thank G.G. Chernyi, V. A. Sosunov and Y. M. Shihrnan for their useful discussions.
The work was performed under the financial support of the Russian Foun- dation for Basic Research (projects 99-01-1211, 96-15-96158, and 00-15-99039).
REFERENCES
1. Helman, D., R. P. Shreeve, and S. Eidelman. 1986. Detonation pulse engine. AIAA Paper No. 86-1683. 23.
2. Eidelman, S., I. Lottari, and W. Grossman. 1992. A parametric study of the air- breathing pulsed detonation engine. AIAA Paper No. 92-0392. 12.
3. Eidelman, S., and W. Grossman. 1992. Pulsed detonation engine experimental and theoretical review. AIAA Paper No. 92-3168. 17.
4. Cambier, J-L., H.G. Adelman, and G.P. Menees. 1993. Numerical simulations of a pulsed detonation wave augmentation device. AIAA Paper No. 93-1985. 18.
5. Bussing, T., and G. Pappas. 1994. An introduction to pulse detonation engines. AIAA Paper No. 94-0263. 14.
341

HIGH-SPEED DEFLAGRATION & DETONATION
6. Bussing, T.R. A., J.B. Hinkey, and L. Kaye. 1994. Pulse detonation engine prelim-
inary design considerations. AIAA Paper No. 94-3220. 8.
7. Lynch, E. D., and R. B Edelman. 1994. Analisis of flow processes in the pulse det-
onation wave engine. AIAA Paper No. 94-3222. 13.
8. Bussing, T.R. A. 1995. A rotary valve multiple pulse detonation engine
(RVMPDE). AIAA Paper No. 95-2577. 14.
9. Hinkey, J.B., T.R. A. Bussing, ang L. Kaye. 1995. Shock tube experiments for the development of a hydrogen-fueled pulse detonation engine. AIAA Paper No. 95-
2578. 18.
10. Ting, J.M., T.R. A. Bussing, and J.B. Hinkey. 1995. Experimental characteriza- tion of the detonation properties of hydrocarbon fuels for the development of a
pulse detonation engine. AIAA Paper No. 95-3154. 15.
11. Bratkovich, T.E., and T.R. A. Bussing. 1995. A pulse detonation engine perfor-
mance model. AIAA Paper No. 95-3155. 15.
12. Pegg, R. J., B.D. Couch, and L. G. Hunter. 1996. Pulse detonation engine air in-
duction system analysis. AIAA Paper No. 96-2918. 16.
13. Cambier, J.-L., and J.K. Tegner. 1998. Strategies for pulsed detonation engine performance optimization. J. Propulsion Power 14(4):489-98.
14. Bussing, T., and G. Pappas. 1996. Pulse detonation engine theory and concepts. In: Development in high-speed-vehicle propulsion systems. Progress in astronautics and aeronautics ser. Washington, DC: AIAA Inc. 165:421-72.
15. Lynch, E.D., and R. B. Edelman. 1996. Analysis of the pulse detonation wave engine. In: Development in high-speed-vehicle propulsion systems. Progress in as- tronautics and aeronautics ser. Washington, DC: AIAA Inc. 165:473-516.
16. Korst, H. H. 1956. A theory for base pressures in transonic and supersonic flow.
J. Applied Mechanics 23(4):593-600.
17. Tagirov, R. K. 1996. The influence of the initial part of a boundary layer on the base pressure. Rus. J. Izv. Rus. Acad. Sei.: Fluid Mechanics 2:145-48.
18. Tagirov, R. K. 1972. The calculation of base pressure and separation flow param- eters behind the flat ledge with sonic or supersonic oncoming flow. Trudy CIAM
(Transactions of CIAM). Moscow 538:14.
19. Godunov, S. K., A.V. Zabrodin, M.Y. Ivanov, et ah 1976. Numerical solution of
multidimensional gasdynamic problems. Moscow: Nauka. 400.
20. Kolgan, V. P. 1972. Application of the minimum derivative value principle to development of finite-difference schemes for calculating discontinuous solutions of gasdynamics. Uchenye zapiski TsAGI (TsAGI Transactions). Moscow 3(6):
68-77. 21. Kolgan, V. P. 1975. The finite-difference scheme for calculation of 2D discontinuous
solutions of nonstationary gasdynamics. Uchenye zapiski TsAGI (TsAGI Transac-
tions). Moscow 6(1):9—14.
342

PULSED DETONATION ENGINES
22. Tillyaeva, N.I. 1986. Generalization of the modified Godunov scheme on arbitrary irregular grids. Uchenye zapiski TsAGI (TsAGI Transactions). Moscow 17(2): 18-26.
23. Gangelo, A.N., A.N. Kraiko, V.E. Makarov, and N.I. Tillyaeva. 1987. On im- proving the accuracy of solution of gasdynamic problems. In: Modern problems of aerodynamics. Moscow: Mashinistroenie. 87-102.
24. Rodionov, A. V. 1987. Monotonous second order accuracy scheme for through cal- culations of disbalanced flows. Sov. J. Computational Mathematics Mathematical Physics 27(4):585-93.
25. Rodionov, A. V. 1987. The increase of the Godunov scheme approximation level. Sov. J. Computational Mathematics Mathematical Physics 27(120):1853-60.
26. Kraiko, A. N., and V. E. Makarov. 1997. One-dimensional mathematical model of a combustion chamber of hydrogen-air hypersonic ramjet. Rus. Izv. Rus. Acad. Sei: Fluid Mechanics 1:146-54.
27. Baftalovskiy, S.V., A.N. Kraiko, V.E. Makarov, and N.I. Tillyaeva. 1997. Opti- mization of a power plant of hypersonic aircraft with ramjet. Aus. J. Izv. Rus. Acad. Sei.: Fluid Mechanics 4:126-35.
28. Kraiko, A.N., V.E. Makarov, and N.I. Tillyayeva. 1997. The method of a super- sonic combustion chamber and a fixed length nozzle conjoint design. Aviation- 2000. Prospects. International Symposium Proceedings. Zhukovsky, Russia. 719-23.
29. Kraiko, A.N., V.E. Makarov, and N.I. Tillyaeva. 1998. Profiling of a supersonic combustion chamber and nozzle with restrictions on their total length. Rus. J. Izv. Rus. Acad. Sei.: Fluid Mechanics 5:3-12.
30. Soloukhin, R. I. 1963. Shock waves and detonation in gases. Moscow: Fizmatgiz. 175.
31. Urtiew, P.A., and A. K. Oppenheim. 1967. Detonative ignition induced by shock merging. 11th Symposium (International) on Combustion Proceedings. Pittsburgh, PA: The Combustion Institute. 665-70.
32. Lewis, B., and G. Elbe. 1968. Combustion, uame and explosion in gases. Moscow: Mir. 592.
33. Meyer, J. W., and A.K. Oppenheim. 1971. On the shock-induced ignition of ex- plosive gases. 13th Symposium (International) on Combustion Proceedings. Pitts- burgh, PA: The Combustion Institute. 1153-63.
34. Baev, V.K., B.V. Boshenyatov, Y.A. Pronin, and V.V. Shumskiy. 1979. Ex- perimental investigation of ignition of hydrogen injected into supersonic flow of hot air. In: Gasdynamics of combustion in supersonic Row. Novosibirsk: In- stitute of Theoretical and Applied Mechanics, Siberian Div. Acad. Sei. USSR. 53-64.
343

HIGH-SPEED DEFLAGRATION & DETONATION
35. Kraiko, A.N., and N.N. Slavyanov. 1995. The isentrope catching for calculating equilibrium air flows. Rus. J. Thermal Physics High Temperatures 33(1 ):158-61.
36. Alexandrov, V. G., G. G. Chernyi, A. N. Kraiko, et al. Supersonic pulsed detonation ramjet engine (SPDRE) and art of SPDRE operation. Patent of Russian Federation for an invention No. 2157909. Priority of filing from 26.05.1999.
344

CONCLUDING REMARKS

DETONATION RESEARCH IN THE NEW DECADE
G. D. Roy
The Otto cycle, invented by Nicolas Otto in 1861, has been utilized in engines since 1886. He built the first practical internal combustion engine based on a four stroke (piston) cycle. The Brayton cycle invented by George Baily Brayton in 1872, however, found its application in a gas turbine engine only in 1930 by a RAF engineer named Frank Whittle. It is evident that the utilization of a thermodynamic cycle or a process into a practical application does not necessarily follow the invention. Confined detonation waves have been observed experimentally over a century ago (Bertelot and Vieille in 1881). A unified theory of this supersonic combustion wave was formulated by Chapman and Jouguet (in 1899/1905) giving rise to the CJ velocity (detonation velocity). However, application of this mode of combustion (rather than deflagrative combustion) to engines has not occurred even in the next century. Following the Chapman- Jouguet theory, numerous research papers have been published on detonation waves, and their initiation and propagation. In the 1990s several research and development efforts focused on the application of detonation phenomena in a repetitive (pulsed) mode operating on a constant-volume Humphrey cycle to propulsion engines [1].
The International Colloquium on Advances in Experimentation and Compu- tation of Detonations, held in St. Petersburg, Russia, in 1998, was probably the first active step taken to promote and disseminate the awareness of the practi- cal applications of the detonation phenomena, particularly for propulsion. The contributions of scientists from all over the world in the form of a Book of Ab- stracts [2], and the publication of selected papers [3] constitute a summary of the state-of-the-art in detonation science and applications. The colloquium not only served as a podium to bring these scientists together, but also triggered in- ternational collaborations. The world-wide interest in pulse detonation engines and the cooperative efforts followed bear testimony to the contribution made by the colloquium.
The International Colloquium on Control of Detonation Processes is a natu- ral follow-up of the above-mentioned endeavor [4]. During the two years elapsed
347

HIGH-SPEED DEFLAGRATION fc DETONATION: FUNDAMENTALS fc CONTROL
between these colloquia, significant accomplishments have been made in the con- trol of the detonation process tailored for practical applications such as engines in propulsion devices. The chapters contained in this volume indicate the major steps taken in this direction.
PANEL DISCUSSION
In order to capitalize on the collective expertise of the participants and to explore the potential science issues in realizing a PDE a panel discussion was held. It has been shown that it is difficult to detonate a gaseous fuel with air as opposed to with oxygen [5]. The problem of direct initiation of detonation becomes even more difficult where liquid hydrocarbons are used. With fuels of choice such as kerosene, JP-10, etc., a predetonation chamber has been used [6]. However, for a PDE to compete with turbojets or other propulsion engines, the advan- tages claimed (viz, simplicity and compactness) should be realized. This calls for avoiding predetonation chambers (or at least use a short chamber) and the ability to directly induce detonation. Further, the energy expended to initiate detonation should be minimal in order to achieve the higher efficiency claimed in PDE using the Humphrey constant-volume cycle. Hence the key topic chosen for the panel discussion was, "What should be done to detonate a liquid fuel - air mixture in a short tube with a weak initiator?"
Relevant details of the panel and the discussions that ensued are given below. Roy, G.D. (Office of Naval Research, Arlington, VA, USA), and Tsyga-
nov, S.A. (Russian Foundation for Basic Research, Moscow, Russia) served as panel moderators.
The panel consisted of Borisov, A.A. (N.N. Semenov Insititute of Chemical Physics, Moscow, Russia), Levin, V.A. (Institute of Mechanics, Moscow State University, Russia), Mitrofanov, V. V. (M.A. Lavrent'ev Institute of Hydrody- namics, Novosibirsk, Russia), Smirnov, N. N. (Moscow State University, Moscow, Russia), Netzer, D.W. (Naval Postgraduate School, Monterey, CA, USA), Fuji- wara, T. (Nagoya University, Nagoya, Japan), Hayashi, K. A. (Aoyama Gakuin University, Tokyo, Japan), Murray, S. (Defense Research Establishment, Mon- treal, Canada) and Desbordes, D. (University of Poitiers, France).
After Roy's introductory notes regarding the significance of the topic to be discussed by the panel, the panel deliberations followed. The discussions arc presented in the order they occurred by the speakers for the reader to have a "feel" about the discussions.*
"The author has tried to illustrate the panel proceedings, as occurred, to his best from notes hand-written at the meeting.
348

CONCLUDING REMARKS
Borisov: The main issue in the PDE technology is the way in which det- onation is initiated. Since the use of high-explosive charges is not feasible, one has to look for efficient approaches to reduce the DDT length and time. One of the key examples of short-length-scale detonation onset is the 'knock- ing' phenomenon in internal combustion engines. Numerous observations in engines indicate that detonation can arise spontaneously in a preconditioned portion of the fuel-air mixture at the final stage of the combustion process. Detonation runaway starts from 'hot spots', that are intrinsically inherent to reactive systems, and an established detonation wave occurs at distances of several centimeters. The question arises how one can purposefully precondi- tion the reactive mixture to detonate it reliably and repeatedly at short dis- tances?
Three approaches are possible to control the predetonation distance and time: chemical, physical, or a combination of the two. Our experience shows that the use of purely chemical forcing, e.g., ignition-promoting additives, is not very efficient in this respect. An example of a purely physical approach is the ap- plication of the confinement with shock-focusing elements that provide multiple reflections of shock waves. From my point of view, the most promising approach is associated with the use of combined forcing, in particular by means of flame jets. Our recent findings demonstrate that high-speed injection of a burning fuel-rich material with dispersed energetic additives into the tube filled with air can be extremely effective in obtaining fuel-air detonations at relatively short distances of the order of 1 m.
Fujiwara: There exist several approaches to shorten the DDT distance and time. These are: (1) Shchelkin spiral, (2) collision between hot jets, (3) injection of active radicals, (4) predetonators, (5) use of several fuels with different deto- nability, as shown by Frolov et al. [7]. All of these approaches were demonstrated in presentations at this Colloquium [4].
Smirnov: To initiate detonation in an explosive mixture we know only two possible scenarios: strong and mild initiation. Characteristic for strong initia- tion is a short detonation run-up distance and very high initiation energy. A considerable part of the energy is consumed by auxiliary phenomena such as: heat-up of explosion products, droplet breakup and acceleration. Mild initia- tion is the deflagration to detonation transition. Characteristic for this process are relatively long detonation run-up distances but much smaller energy require- ments as compared to those typical for strong initiation. Since mild initiation is the only feasible way for PDE applications, one has to search for ways of DDT enhancement.
In my presentation at the Colloquium I have demonstrated [8] the significant effect of turbulizing elements on the reduction of the DDT length. The elements
349

HIGH-SPEED DEFLAGRATION fc DETONATION: FUNDAMENTALS fc CONTROL
comprise several expanding-contract.ing chambers mounted on the path of the accelerating flame. The arising flame-jets promote fast nearly constant-volume explosions in the chambers and contribute to a DDT process. The other DDT enhancing approach is to preheat the reactive mixture. Our experiments demon- strate that both the predetonation time and the length decrease with increase in the initial temperature.
Another promising approach in minimizing the initiation energy and the det- onation run-up distance is that presented at this Colloquium by Frolov et al [7]. Their concept relies on the use of several fuels with different detonability rather than a single fuel. Distributed injection of these fuels in the air-breathing PDE allows one to initiate detonation in the readily detonable fuel and use the result- ing detonation wave for detonating the marginally detonable fuel. The principal difference of this concept from the predetonator concept is that detonation is initiated in a main PDE chamber and propagates through the stratified charge of the composite fuel-air mixture. Also important is that the fuel candidates can be conventional fuels in aerospace applications.
Murray: One of the readily available solutions for shortening the DDT length is the use of predetonators. A detonation wave initiated in the predetonator should be transmitted to the main (confined) chamber via a transmission el- ement. In view of it, several issues arise dealing with the evaluation of the critical dimensions of the transmission element (diameter and length), as well as with understanding and quantifying the effect of main chamber dimensions. Our recent experiments indicate that the shortest predetonators operating with stoi- chiometric acetylene-air and acetylene - oxygen-enriched air premixtures require lengths of 1 and 0.75 m, respectively. Ethylene-air and propane-air predetona- tors require the lengths of 2 m and longer, respectively.
To reduce the DDT length, it is advisable to use the engine heat to precon- dition (reform) the fuel along with applying flame jets and chemical additives (fluorine, nitrates, etc.) for detonation initiation.
Hayashi: One important element in DDT studies is fuel. The DDT length and time are known to be fuel dependent, therefore it is instructive to have as much information as possible on the relation between fuel and DDT. This will allow one to optimize the selection of fuel. Due to the requirement of high en- ergy density, the prospective PDE fuels are liquid compounds (JP-10, alcohol, heptane, gasoline, etc.). As JP-10 is frequently considered as the most desirable fuel for PDEs, it is necessary to perform a comprehensive study on JP-10 deto- nability (DDT distance, critical initiation energy, etc.). Fundamental studies are needed to reveal a possibility of fast prevaporization of fuel to improve mixing with oxidizer. The other important factor in PDE studies is the ignition system. The most convenient method would be to apply conventional spark plugs for
350

CONCLUDING REMARKS
detonation initiation. In view of it, further studies are required on the effect of the controlled ignition energy deposition.
Netzer: To shorten the DDT distance in actual PDE combustors, there are two principal possibilities. The first relates to fuel preconditioning, and the sec- ond to the ignition source. Fuel preconditioning can be performed by partial or complete fuel prevaporization or pyrolysis. The former can be implemented by recuperating heat from the combustor. The latter can be performed, for example, in fuel-rich preburners. The other aspect of fuel preconditioning is superfine atomization of fuel sprays to obtain droplets 1 to 5 /mi in diameter. The approaches mentioned above can be combined with the application of var- ious fuel additives providing droplet microexplosion (e.g., high-energy strained hydrocarbons, nitrates, etc.) and enhancing the reactivity of the composite fuel. In addition, catalytic decomposition of fuel can also be considered as a pos- sible approach for fuel preconditioning. When applying various means of fuel preconditioning, one has to keep in mind that there exists a set of strict re- quirements: processing procedures independent of flight conditions; safety, cost, shelf life, and material compatibility; limited on-board energy, size constraints, and reliability; effectiveness of catalysts; low sooting, fine atomization and stable performance.
As for choosing the ignition source for the shortest DDT, one has to properly combine all the known factors leading to DDT enhancement: converging flow, shock wave reflections and focusing, colliding supersonic jets, preburners and predetonators.
Mitrofanov: The fastest way to initiate detonation is to generate a shock wave with the Mach number close to the Chapman-Jouguet Mach number MCJ.
To initiate such a shock wave, one needs a large amount of energy that will hardly be available on-board of the future PDE-based vehicle. On the other hand, to decrease the amount of required initiation energy, one has to start the initiation process from combustion and force the DDT. The minimum required volume to start the combustion in a gaseous reactive mixture is the detonation cell size, whereas in a fuel droplet suspension, the minimum required size is the droplet size. Initially, constant-volume combustion should be started in a single or several ignition sites. The DDT process can be facilitated by using a tube of a minimum possible size (close to the limiting tube diameter d*) and by increasing the detonability of the reactive mixture (e.g., by means of various chemical additives). Application of ionizing radiation and active radicals can contribute to shortening the DDT. It is also to be no.ted that the DDT process itself and the mechanisms of DDT enhancement are not adequately understood so far.
351

HIGH-SPEED DEFLAGRATION fc DETONATION: FUNDAMENTALS fc CONTROL
Levin: The DDT length is directly related to the ignition induction length k or the ignition delay r,- of the reactive mixture. Thus one has to work on reducing the ignition delay r,-. One possibility not mentioned by other panelists, is the preliminary excitation of oxygen to different electronic or vibrational states. As shown in the presentation by Starik et al. [9] the value of n can be reduced by orders of magnitude. This seems to be a promising approach for PDE propulsion. Unfortunately, no experimental validation of this approach has been done.
Korobeinikov: There is another promising approach applicable to prospec- tive PDEs. I mean the use of implosions rather than explosions for detonation initiation. In my presentation [10], I have demonstrated that a strong ring- shaped discharge produces an imploding shock wave that is capable of initiating a detonation wave in the reactive gas.
EYolov: There is one evident limitation in our discussion. For some reason, we always talk about creating detonation by means of a single-shot triggering by an external energy source: either the high-explosive charge in the case of strong initiation, or a spark plug in the case of weak initiation via DDT.
I want to attract the attention of the audience to one important issue in the detonation phenomenon. In the developed detonation wave, the chemical en- ergy deposition is strongly coupled with the leading shock wave structure. This coupling ensures stable (on the average) propagation of the detonation. The intensity of the leading shock wave is such that it induces chemical energy depo- sition at a certain distance that is appropriate for self-sustaining propagation of the wave. Thus, the standard detonation initiation procedure is aimed at creat- ing the shock wave of the intensity sufficient for thermal initiation of activated explosive reactions with proper induction times.
Why should we initiate the chemical activity in the mixture by the shock wave? Instead, we can use distributed external ignition sources to couple en- ergy deposition to an arbitrarily weak propagating shock wave and amplify it to the condition, when further external ignition is no longer required. If we suc- ceed with ignition timing, it seems to be the shortest possible way to initiate detonation by relatively weak igniters. This implication means that we have to treat detonation as a resonant phenomenon, similar to many other phenomena in mechanics.
VasiPev: I would like to inform you that it is possible to design DDT accelera- tors allowing for a considerable decrease in the DDT distance. In the Lavrcnt'ev Institute of Hydrodynamics, we have developed the DDT accelerator based on a tube 10 cm in diameter and a standard automobile spark plug as the igniter. It was possible to initiate detonation of methane-air mixture in this device at
352

CONCLUDING REMARKS
a distance less that 2.5 m (20-25 tube diameters). There are some grounds to believe that this distance can be decreased even more.
Higgins: I want to add laser-induced detonation to the list of possible detona- tion initiation techniques. May I ask the audience a question? Why do we need pulsed detonations for attaining better performance?
Cicarelly: I think, we do not need detonation at all. We have to accelerate the flame to such velocities that the ensuing overpressure will provide the elevated thrust.
Borisov: My opinion is that transient processes can be much more efficient in terms of thrust than the Chapman-Jouguet detonation.
Roy: At this stage of PDE research there is no evident reason to speak in favor of the Chapman-Jouguet detonation only. The CJ detonation is just a good research instrument for evaluating the concept. Most probably, due to various factors, the prospective PDE could operate in a mode between CJ detonations and high-speed deflagrations.
Kopchenov: I would like to say that the Colloquium was very interesting from a scientific point of view. We have learned about many new concepts of PDEs. At the same time, there were only a few presentations on the technical demon- stration of the concepts. I mean the presentations by Segal et al. (inlet-PDE in- tegration) [11] and Desbordes et al. (rocket PDE; PDE-nozzle integration) [12]. I think, before further development of these concepts, the unambiguous evidences of the advantages and drawbacks of PDEs in terms of performance should be obtained with demonstrators.
CONCLUDING REMARKS
As can be seen from the above-mentioned discussions, the topic selected has created a significant exchange of ideas among the research community. Certain questions raised in the discussions warrant some further clarifications and follow- up. Let me give my opinion to these questions, not necessarily in the order they have been raised.
Higgins raised a question, "Why do we need pulsed detonation for attaining better performance?" The choice of pulse detonation engines as a topic for further research and the advantages of PDE over other conventional propulsion devices presently used are given in [1]. For supersonic propulsion, PDE seems
353

HIGH-SPEED DEFLAGRATION fc DETONATION: FUNDAMENTALS fc CONTROL
to be a logical choice to start from subsonic to supersonic and cruising speeds, without any ejecting boosters as in competing scramjet engines (to bring them to ram speed). Better system performance, though not demonstrated, is possible from various aspects. It has been shown that PDE has a moderately constant Isp as compared to turbojets [13]. Further, the thrust vectoring without external fins (that has been proposed and publicized by the author) can be applied for multicycle, multitube PDE using both the frequency and order of firing the tubes as two parameters for control. This will greatly reduce drag, which is almost a showstopper at increasing Mach numbers (as well as solve the survivability problems of external fins).
It has been shown earlier [1], with regard to Cicarelly's question, that the attainment of CJ pressures in a PDE does not bring any appreciable improvement in efficiency as compared to constant-volume (Humphrey) cycle pressure. CJ velocities may not be required, and a high-speed deflagration process can also perform well.
A focused research that addresses all the issues of PDE the author is aware of is the one sponsored by the US Office of Naval Research (ONR). There are several industry-university-government joint development efforts in place. Some 'technical demonstrations' (Kopchenov's comment) that have been made, are not published in open literature due to the proprietary information contained. How- ever, research is focusing on applications of the science to technology. Projects like Segal's, Netzer's, and Hanson's [11, 14, 15] will provide information on the design, operation, and parametric measurement of PDE systems.
The performance advantages (Kopchenov's comment) without ambiguity is also, in the author's opinion, a victim of proprietary information protection. Ev- ery industry trying to develop or sell the PDE technology has used their own codes with a multiplicity of initial and boundary conditions and assumptions to calculate performance, and to some extent, present their best scenario. From a simple change in how the detonation products are relaxed at the exit plane, one can get very different performance factors [16]. Indeed an unambiguous evidence of the advantages and drawbacks should be obtained with verifiable demonstrations. ONR program with international participants, addresses per- formance evaluation with various computational approaches [16, 17] and bench- mark experiments [14, 18].
The fuel of choice in several applications is liquid hydrocarbons, JP-10 in particular. Indeed there is a lack of information on chemical kinetic properties and their detonation characteristics (Hayashi's comment). Steps are taken to furnish this important data through this research program [19, 20], to those who perform component and system analysis. Then only an unambiguous, verifiable systems peiformance will be available, and prudent defense of the superiority of PDE for appropriate applications will be possible. Alternate ignition method- ologies are equally important. To this end, utilization of laser-based ignition, manipulation of the vibrational and translational modes, ionization, and appli-
354

CONCLUDING REMARKS
cation of nonthermal plasma initiation [21] are to be further investigated. May be this partially answers Mitrofanov's comment.
In conclusion, the (Second) International Colloquium on Control of Deto- nations, and this volume are giant steps in disseminating the advances made in scientific research in detonation towards the realization of pulse detonation engines. As for PDE's promise for future propulsion systems (not as a replace- ment of present engine concepts, but as an alternate candidate, and may be a preferred one for certain applications), the world-wide interest in research and development of PDE and the increasing number of sessions on PDE in technical conferences, and the international collaborations, are true testimonies. When the question, "How successful can the PDE effort be?" was asked, the answer given by the author (at the ICDERS meeting, Heidelberg, Germany, 1999) sums it all!
Detonations...
If detonation is our present quest's ultimate destination, I may say, with some confidence, we have seen the horizon. But if detonations are to drive a new generation of engines, I have indeed miles and miles of waters to sail across.
But the deep water seems to be calmer than I envisioned; Yes, the tides are high and unpredictable, but I am not afraid. The best sailors, trained in turbulent waters, are on board; Yet, I look for more to help me further along the road.
Detonation is a new frontier to me, but I have the will to steer, And if you have the willingness, strength and desire — Together we can conquer, capture and control this frontier, And look above to see detonation-driven engines flying in the air!
REFERENCES
1. Roy, G.D. 1999. Pulsed detonation phenomena for air-breathing propulsion. 14th ISABE Conference Proceedings. ISABE 99-7127. Florence, Italy, AIAA.
2. Roy, G., S. Frolov, K. Kailasanath, and N. Smirnov, eds. 1998. Advances in exper- imentation and computation of detonations. Moscow, Russia: ENAS Publishers.
3. Roy, G. D., S. Frolov, K. Kailasanath, and N. Smirnov, eds. 1999. Gaseous and heterogeneous detonations: Science to applications. Moscow, Russia: ENAS Pub- lishers.
355

HIGH-SPEED DEFLAGRATION fc DETONATION: FUNDAMENTALS fc CONTROL
4. Roy, G. D., S. Frolov, D. Netzer, and A. Borisov, eds. 2000. Control of detonation processes. Moscow, Russia: ELEX-KM Publishers.
5. Li, C, and K. Kailasanatli. 2000. Detonation diffraction in pulse detonation en- gines. AIAA Paper No. 2000-3470.
6. Brophy, C. M., D. W. Netzer, and J. Sinibaldi. 2000. Operation of a JP-10-air pulse detonation engine. AIAA Paper No. 2000-3591.
7. Frolov, S.M., V.Ya. Basevich, and A.A. VasiPev. 2001. Dual-fuel concept for ad- vanced propulsion. In: High-speed deflagration and detonation: Fundamentals and control. Eds. G.D. Roy, S. M. Frolov, D.W. Netzer, and A.A. Borisov. Moscow: ELEX-KM Publ. 315-32.
8. Smirnov, N. N., V. F. Nikitin, A. P. Boichenko, M. V. Tyurnikov, and A. V. Kulchit- sky. 2001. Control of detonation onset in combustible gases. In: High-speed defla- gration and detonation: Fundamentals and control. Eds. G.D. Roy, S. M. Frolov, D.W. Netzer, and A.A. Borisov. Moscow: ELEX-KM Publ. 3-30.
9. Starik, A.M., and N. S. Titova. 2001. Initiation of combustion and detonation in H2 + O2 mixtures by excitation of electronic states of oxygen molecules. In: High- speed deflagration and detonation: Fundamentals and control. Eds. G. D. Roy, S.M. Frolov, D.W. Netzer, and A.A. Borisov. Moscow: ELEX-KM Publ. 63-78.
10. Korobeinikov, V. P., I.V. Semenov, R. Klemens, P. Wolanski, P. Kosinski, V. V. Markov, I. S. and Men'shov. 2001. Electrochemical pulse detonation en- gine. In: High-speed deflagration and detonation: Fundamentals and control. Eds. G.D. Roy, S.M. Frolov, D.W. Netzer, and A.A. Borisov. Moscow: ELEX-KM Publ. 289-302.
11. Mullagiri, S. and C. Segal. 2001. Forced nonuniform pressure oscillations in a two- dimentional supersonic inlet. In: High-speed deflagration and detonation: Funda- mentals and control. Eds. G. D. Roy, S. M. Frolov, D. W. Netzer, and A. A. Borisov. Moscow: ELEX-KM Publ. 263-72.
12. Desbordes, D., E. Daniau, and R. Zitoun. 2001. Pulsed detonation propulsion: Key issues. In: High-speed deflagration and detonation: Fundamentals and control. Eds. G. D. Roy, S. M. Frolov, D. W. Netzer, and A. A. Borisov. Moscow: ELEX-KM Publ. 177-92.
13. Bussing, T.R. A., T. E. Bratkovitch, and J.E. Hinky, Jr. 1997. Practical imple- mentation of pulsed detonation engines. AIAA Paper No. 97-2748.
14. Brophy, CM., D.W. Netzer, J. Sinibaldi, and R. Johnson. 2001. Detonation of a JP-10-aerosol for pulse detonation application. In: High-speed deflagration and detonation: Fundamentals and control. Eds. G. D. Roy, S. M. Frolov, D. W. Netzer, and A. A. Borisov. Moscow: ELEX-KM Publ. 207-22.
15. Jenkins, T.P., S.T. Sanders, J.A. Baldwin, W. Fan, D.S. Baer, and R. K. Han- son. 2001. Diode-laser based sensors for pulse detonation engine flows. In: High- speed deflagration and detonation: Fundamentals and control. Eds. G.D. Roy, S.M. Frolov, D.W. Netzer, and A.A. Borisov. Moscow: ELEX-KM Publ. 273-88.
16. Kailasanatli, K. 2001. A review of PDE research-performance estimates. AIAA Paper No. 2001-0474.
17. Cambier, J.L., and R. M. Amin. 2000. Software development for automated para- metric study and performance optimization of pulse detonation engines. 13th ONR
356

CONCLUDING REMARKS
Propulsion Meeting Proceedings. Eds. G. D. Roy and P. J. Strykowski. Minneapolis, MN. 245-50.
18. Santoro, R. J., and V. Yang. 1999. Multidisciplinary study of pulse detonation engine propulsion. JANNAF 24th Air-Breathing Propulsion Subcommitte and 36th Combustion Subcommitte Joint Meeting Proceedings. CPIA Publ. 692(1): 141-50.
19. Williams, F.A., J.C. Lasheras, T. R. Bewly, R, J. Cattolica, M. Krstic, and S. Sarkar. 1999. Tailored-injection, variable-frequency pulse-detonation phenom- ena for propulsion: UCSD. Proceedings of the 12th ONR Propulsion Program Review. Eds. G. D. Roy and S.L. Anderson. Salt Lake City, UT. 119-23.
20. Li, Z., R. J. Green, and S.L. Anderson. 1999. Stability and reactivity of strained fuels by flow tube mass spectrometry. Proceedings of the 12th ONR Propulsion Program Review. Eds. G. D. Roy and S.L. Anderson. Salt Lake City, UT. 170-75.
21. Liu, J.B., J. Yampolsky, P. Ronney, D. Erwin, and M.A. Gundersen. 2000. Plasma-enhanced combustion for reduction of rocket plume soot. Proceedings of the 13th ONR Propulsion Program Meeting. Eds. G. D. Roy and P. J. Strykowski. Minneapolis, MN. 116-21.
357

Hayraoe M3flanHe
High-Speed Deflagration and Detonation: Fundamentals and Control Edited by G. D. Roy, S. M. Frolov, D.W. Netzer, and A.A. Borisov
3aB. peflaKaneft: 0. <Ppojioea
THTynbHMM pe^aKTop: T. TopoKKoea
TexHHiiecKHH pezxaKTop: JI. KotcywKuna XyÄOxcecTBeHiibie peflaKTopu: M. CedaKoea, A. Ceepwzun
flM3aifH O6JIO>KKH: II. ^UKUH
H/K
JlHueusH« Hfl j^ 00463 OT 23.11.99
H3flaTenbCTBO «3JIEKC-KM» 115201 MocKBa, KauiwpcKoe iu., R. 22, Kopn. 3
Cnano B Ha6op 01.08.00. IIoflniicaHO B neiaTb 09.06.01. <SopMaT 70 x 100/16. Byiuara ocpceTHas. Ile^iaTt o<pceraaji.
YcJi.-neM. Ji. 24. YH.-HSA. JI. 26,4. Tiipa* 500 3K3.
3aKas N> 797
O-rneMaTaHO B MOCKOBCKOH TimorpacpHH J^ 6 MMHHCTepcTBa P$ no aenaM neiaTH, TenepaAHOBemamisi
H CpeflCTB MaCCOBMX KOMMyHHKaWIH c roTOBoro opHriraaJi-MaKeTa
109088, MocKBa, IOacHonopTOBaa yn., «. 24

ABOUT THE BOOK This book is a unique collection of articles on fundamentals and control of high-speed deflagrations and detonations written by international experts, and comprises of the following three parts:
(1) High-Speed Deflagration: Fundamentals & Control, (2) Detonation: Fundamentals & Control, and (3) Pulsed Detonation Engines.
The first part deals mainly with various aspects of deflagration to detonation transition in gaseous media and describes high-speed transient regimes of turbulent combustion that are intermediate between detonation and slow deflagration. The emphasis is made on control of the predetonation distance under confined and partially confined configurations by means of obstructions, chemical sensitizers, etc. The second part includes contributions on control of direct detonation initiation and propagation in channels of constant or variable cross-section. The third part describes applications of various explosion control techniques to pulsed detonation engines (PDE). New concepts ofPDE dealing with 'rotating" detonations, repeated in situ mixing of fuels with different detonability, periodically reinitiated detonations, jet-induced detonations in a resonator cavity, etc. are discussed in detail and are evaluated. Comparative studies of combustion efficiency in various types of thrusters and propulsion power plants are also reported empha- sizing the performance of PDE. The book, with numerous illustrations and an extensive list of up-to-date references, is a compilation of the most promising state-of-the-art research in this field that has attracted significant world-wide attention in the past several years. The volume is addressed to scientists and practicing research engineers working in the field of propulsion and power engineering. It will be useful as an advanced graduate level text for courses in deflagration, detonation, and propulsion.
ABOUT THE EDITORS Gabriel D. Roy, Ph.D., manages the Energy Conversion - Propulsion Program for the US Navy at the Office of Naval Research. He managed R&D programs in industry, and was a Professor in Mechanical Engineering. He is a recognized world leader in magnetohydrodynamics, propulsion, and fuels. He has edited several books, authored a number of articles, and has received patents and awards ih the corner bustion discipline. Dr. Roy is a Fellow of AIM, and served as associate editor of AIM Journal'ot'Prppuf- s/on and Power. ^ * j^v - - • tJ, Sergei M. Frolov, Ph.D., D.Sc., is the Chief Scientist at the Semenov Institute of Chemical Physics,
|§nj[Professor at the Moscow Physical Engineering Institute. He is the Executive Secretary of /Chemical m^csReports, arid a merrjber of Editorial Advisory Boards of several journals. He is the recipient of "^awards in science and technology, the author of numerous articles on detonation, shock waves, and ^combustion, and the editor of books on combustion and detonation topics.
Jmvid W. Netzer, Ph.D., is a Distinguished Professor of Aeronautics and Astronautics and the Associ- ate Provost and Dean of Research at the Naval Postgraduate School, Monterey, California. He is a senior member of AIAÄ and has been an active participant in the JANNAF Combustion, Exhaust Plume» Technol- |||fjj|d Ajrbreathing Propulsion Subcommittees. He is the recipient of several awards in science, tech- ppfegy7ähd teaching. His laboratory has demonstrated the first successful firing of a cold JP~ß aerosol /
|p^§sepus oxygen pulse detonation engine in a multicycle mode. - ■ ? . '^f&y^it * , j.. i ,»!VM , „~ * -. " i *?&'- ^^pilolil A. Borisov, Ph.D., D.Sc, is the Director of Laboratory at the Semenov Institute of Chemical " rtwJy®"1*» Professor at the Moscow Physical Engineering and Physico-Te^hnicai Institutes, äntf Deputy
^^Mte|rto-Chief of CheirucälPhysics Reports. He is recognized world-wide as a specialist in tijgh- ^l^jperature chemical kinetics, combustiqn and[detonation of gaseous[and multiphase midia;lhdshock 2' ,rwaves. He has edited a number of books on combustion''and explosion, arid is the recipient of several
^|Mrhätional arid domestic scientific awards in science and technology.
ISBN 5-93815-003-5 .-*---* - X* ' * . * *7i '
785938l'150034
... ■::.'.■• ,. \ ■;"•'■ ••■'• •..-..■/. -i ■• * Twin njijiiip'im/nitti M . %nri«'iVi !%■ «in ■ udtftf I...M.II1I.M TIMI.
mm:
Related Documents