High Schools That Work: Program Description, Literature Review, and Research Findings John W. Young Frederick Cline Teresa C. King Avis D. Jackson Allison Timberlake August 2011 Research Report ETS RR–11-33

Welcome message from author
This document is posted to help you gain knowledge. Please leave a comment to let me know what you think about it! Share it to your friends and learn new things together.
Transcript

High Schools That Work: Program Description, Literature Review, and Research Findings
John W. Young
Frederick Cline
Teresa C. King
Avis D. Jackson
Allison Timberlake
August 2011
Research Report ETS RR–11-33

August 2011
High Schools That Work: Program Description, Literature Review, and Research Findings
John W. Young, Frederick Cline, and Teresa C. King
ETS, Princeton, New Jersey
Avis D. Jackson
Morgan State University, Baltimore, Maryland
Allison Timberlake
Southern Regional Education Board, Atlanta, Georgia

Technical Review Editor: Daniel Eignor
Technical Reviewers: Donald Powers and Seth Weiner
Copyright © 2011 by Educational Testing Service. All rights reserved.
ETS, the ETS logo, and LISTENING. LEARNING. LEADING. are registered trademarks of Educational Testing
Service (ETS).
As part of its nonprofit mission, ETS conducts and disseminates the results of research to advance
quality and equity in education and assessment for the benefit of ETS’s constituents and the field.
To obtain a PDF or a print copy of a report, please visit:
http://www.ets.org/research/contact.html
i
Abstract
Interest in setting high educational standards is at the forefront of many school reform programs
in the United States. States’ pursuit of high standards can be advanced through implementation
of programs such as High Schools That Work (HSTW), which emphasizes high expectations and
rigorous academics for all students, including Career and Technical Education students. High
Schools That Work is the largest comprehensive school reform program for high schools in the
United States, with over 1,000 schools in more than 30 states currently participating. This report
describes the program, previous research, and recent research studies conducted by ETS to
ensure validity for the HSTW program.
Key words: High Schools That Work; HSTW; comprehensive school reform; high school reform;
career and technical education; Southern Regional Education Board

i
Table of Contents
What Is HSTW? ........................................................................................................................... 2
Assessment Development ......................................................................................................... 12
HSTW Validity Studies ............................................................................................................. 13
1. Concurrent Validity of the HSTW Assessment Scores ............................................................. 13
Correlation Results.................................................................................................................... 14
2. Relating Implementation to Outcomes ..................................................................................... 18
The 11 Indices of Key Practices: .............................................................................................. 18
3. Relationship of the HSTW Indices to Changes in School Performance .................................... 22
Revisions to the HSTW Student Survey .................................................................................... 26
Summary ................................................................................................................................... 32
Discussion ..................................................................................................................................... 32
References ..................................................................................................................................... 33
Appendix A – Score Changes by School Quartiles and ANOVA Results for All Indices ........... 35
Appendix B – Changes in HSTW Indices from 2008 to 2010 ...................................................... 43

i
List of Tables
Table 1 Correlations of HSTW Reading With Other Measures of Student Achievement ........ 15
Table 2 Correlations of HSTW Mathematics With Other Measures of Student Achievement . 16
Table 3 Correlations of HSTW Science With Other Measures of Student Achievement ......... 16
Table 4 Correlations of HSTW Assessment With SAT ............................................................. 17
Table 5 Correlations of HSTW Assessment With ACT ............................................................ 17
Table 6 Correlation Coefficients Between Indices and HSTW Assessment Scores .................. 19
Table 7 Summary of Forward Stepwise Multiple Regression Analysis for Indices Predicting HSTW Mathematics (N = 31,343) .............................................................. 20
Table 8 Summary of Forward Stepwise Multiple Regression Analysis for Indices Predicting HSTW Reading (N = 30,672) ...................................................................... 21
Table 9 Summary of Forward Stepwise Multiple Regression Analysis for Indices Predicting HSTW Science (N = 31,231) ....................................................................... 21
Table 10 Correlations of Changes in Mean HSTW Assessment Scores from 2004 to 2006 with Mean Index Score ................................................................................................. 24
Table 11 Score Change on Index 1 by School Quartiles ............................................................. 25
Table 12 ANOVA Results for Index 1......................................................................................... 25
Table 13 Summary of Proposed Changes to the Indices ............................................................. 29
Table 14 Emphasis on High Expectations Index from 2008 to 2010 .......................................... 30
Table 15 Correlations of Actual and Proposed Indices with HSTW Assessments ...................... 31
2
The Southern Regional Education Board (SREB) sponsors a number of school
improvement initiatives for high school leaders and teachers that are aimed at preparing
students for careers and further education by improving curriculum and instruction in schools.
The largest and oldest of the SREB initiatives is the High Schools That Work (HSTW)
program, which was established in 1987. HSTW is the nation’s first large-scale effort to
engage state education and school district officials, school-level leaders and teachers in
partnerships with students, parents, and the community in efforts to improve students’
preparation for postsecondary studies and careers. HSTW began as an initiative to improve
high school experiences for career/technical students in schools in the Southeastern United
States but has since evolved into a comprehensive school reform model for all high school
students with diverse postsecondary aspirations. Since its founding, more than 2,700 high
schools across the United States have been involved with HSTW. Currently, more than 1,200
schools in more than 31 states are involved in the effort. The purpose of this report is to
document the current status of the HSTW program with a particular emphasis on those aspects
in which ETS has been involved, namely the HSTW Assessments and Surveys, and to describe
the research that has been conducted to date, for evaluating different components of the
program.
What Is HSTW?
HSTW is an effort-based school-improvement initiative founded on the conviction that
most students can master rigorous academic and career/technical studies if school leaders and
teachers create an environment that motivates students to make the effort to succeed. HSTW’s
goal is to work with schools to create a culture of continuous improvement in which schools
implement a series of strategies to provide students with a high-quality, engaging learning
environment in order to make progress towards obtaining a 90 percent graduation rate with 85
percent of students being prepared for college, careers or advanced training.
Nationally, only 75 percent of students graduated from high school in 2008 (Stillwell,
2010). Furthermore, graduation rates vary dramatically by group—81 percent among White
students, 64 percent among Hispanic students, and 62 percent among Black students.
Moreover, even fewer students are adequately prepared for college and careers. According to
2010 ACT results, 52 percent of graduates met the reading benchmark, 43 percent met the
mathematics benchmark and 29 percent met the science benchmark (ACT, 2010) For the 2010
3
SAT® results, the College Board did not report the percentages of students who completed a
core curriculum, defined as taking four or more years of English, three or more years of
mathematics, three or more years of natural science, and three or more years of social science
and history. However, the College Board did report that students who completed a core
curriculum scored, on average, 151 points higher on the combined sections of the SAT than
those that did not.
In order to meet these goals, HSTW provides a comprehensive framework of practices
that collectively provide students with a high-quality, engaging learning environment,
including:
A challenging program of study built around students’ interests that join a college-
ready academic core (four college-preparatory English courses, four college-
preparatory mathematics courses, three lab-based science courses) with a
concentration (academic, career/technical, or a blend of the two).
Strategies to engage students intellectually, emotionally, socially and behaviorally,
as well as to promote literacy across the curriculum. To be engaged intellectually,
students are asked to work with new concepts, explain their reasoning, defend their
conclusions, and explore alternative strategies. Students also develop confidence in
their ability to succeed, and academic success is important to achieve future goals.
To be engaged emotionally, students should have opportunities to choose projects
or areas of further study related to their interests and goals. Students who are
engaged emotionally are able to relate what they are learning to their own lives.
Students are more socially engaged when they work in teams in class, participate
in extracurricular activities, have friends at school, feel a sense of loyalty and
belonging to the school, and believe in the legitimacy of school. Social
engagement motivates students to stay in school. To be engaged behaviorally,
students go to class prepared and actively participate, seek assistance when needed,
and take challenging classes.
Quality career/technical studies that embed academic content and skills and
include project-based learning.

4
High expectations for all students in that they should be given proficient-level
assignments that engage them in critical analysis. Teachers should be clear on their
expectations for student work. A “failure is not an option” policy should be in
place that requires students to redo work until it meets specified standards.
Extra help and extra time is provided to support students in mastering higher-level
content. Schools can use a variety of options—flexible scheduling, after school
sessions, before school sessions, web-based extra help—to provide students with
extra help and support.
Every student is connected to an adult mentor or advisor who assists her or him in
setting goals and developing a plan to meet them. This person serves as an
advocate for the student; parents are also involved in their student’s education. The
habits of success—building productive relationships, time management and study
skills, reading and writing skills, mathematics skills, goal setting, and accessing
resources—should be encouraged to help students become independent, lifelong
learners. These six habits are a blueprint for the knowledge and skills students
need in order to build on their interests and strengths in mastering challenging
content and preparing for college and careers.
Schools ensure smooth transitions into and out of high school. A ninth-grade
redesign can be used to provide incoming ninth-grade students with multiple
opportunities to familiarize themselves with and become prepared for high school
(through orientation sessions, summer bridge programs, etc.). The senior year is
used to prepare students for college, careers, or advanced training. Seniors who are
prepared for postsecondary pursuits are enrolled in rigorous courses. Seniors
unprepared for college are enrolled in transitions courses designed to get them
ready. Seniors planning to enter the workforce engage in activities that will
provide them with the experiences and skills valued by employers.
The school leadership team works with the faculty to engage in continuous school
improvement. Conditions are created such that teachers can engage in professional
development and other opportunities to improve their preparation of college- and
career-ready students.

5
Schools that implement the HSTW model with fidelity implement all of these key
features. They create a supportive environment in which all students are expected to achieve
at high levels. There is a culture of continuous improvement in which teachers work together
and constantly seek to improve the school. Professional development is provided regularly,
and there is follow-up to ensure that what is learned is implemented in the classroom and
refined. Successful schools have strong leadership and receive support from their district and
state to implement the model. Most importantly, schools have an improvement plan that
ensures their efforts are sustained over time.
The schools in the HSTW network are expected to commit themselves to raising the
achievement levels of students in reading, mathematics, and science, although there are
differences across schools in their level of commitment to and fidelity of implementation of
HSTW. These schools are further expected to show consistent progress until at least 85 percent
of the students meet the HSTW readiness goals in reading, mathematics, and science and until
the school improvement framework is fully implemented. To assess progress in school
improvement and student achievement, one key component of HSTW is the HSTW
Assessment, consisting of a set of three subject tests in reading, mathematics, and science.
Each subject test contains three separately timed sections; the battery is administered over a
period of two to three days. The Reading Assessment is 90 minutes in length, and the
Mathematics and Science Assessments are each 70 minutes in length. Each subject test
contains multiple-choice items as well as two extended constructed-response (or open-ended)
items. Although all students at participating HSTW sites are considered eligible to take the
assessment, it is administered to a random sample of high school seniors during even-
numbered years (typically, 60 students at each school site). The purpose of the assessment is
to track schools’ progress towards the HSTW improvement goals. Students who meet
readiness goals on the assessments and complete the SREB-recommended curriculum in the
core subjects receive an Award of Educational Achievement from SREB. Beginning with the
2008 administration, individual student reports were provided to all students who participated
in the assessment.
A complementary component to the HSTW Assessments is the HSTW Student Survey
which includes: student background and demographic information; a course-experience
survey using transcript information in which the students (or their teachers) indicate the

6
courses that they have taken and the credits they have acquired; and questions about students’
perceptions of school and classroom practices, expectations, experience in the workplace, and
post-graduation plans. This information enables administrators, academic and career/technical
teachers, and counselors to determine how well school and instructional practices advance
student achievement. For each participating school, ETS prepares a site report that
disaggregates performance data on the three subject tests in terms of the way students answer
questions on the student survey. This is the manner by which school experiences reflective of
the reform design are correlated with student achievement as reflected by performance on the
subject tests.
Many of the individual questions in the HSTW Student Survey are used to form index
scales. The HSTW Indices of Key Practices are designed to be measures of an HSTW school’s
implementation of the school reform model in key areas of student experiences. Schools are
encouraged to focus on improving the practices that are measured by the Indices as a means of
improving student achievement. The 11 Indices of Key Practices are:
1. High expectations
2. Literacy across the curriculum
3. Numeracy across the curriculum
4. Engaging science curriculum
5. Completion of HSTW-recommended curricula
6. Integrating academic and career/technical studies
7. Quality career/technical studies
8. Quality work-based learning
9. Timely guidance
10. Perceived importance of high school studies
11. Quality extra help

7
Prior Research on HSTW
HSTW is a Comprehensive School Reform or a Whole School Reform (CSR/WSR)
program. CSR/WSR programs are independently developed and self-contained school reform
programs ready to implement and are designed to improve schools and increase student
achievement. In addition, HSTW is a program that seeks to reform career/technical education
(CTE) by ensuring that a career/technical path of study is undergirded by the same rigorous
academic courses as undergird the path of study for college-bound students. CTE programs,
formerly known as agriculture, technical, or vocational programs, include school and
community partnerships to provide hands-on instruction in the specified fields. In the past,
CTE programs were also frequently the default program for students ill-prepared or
uninterested in postsecondary education (Castellano, Stringfield, & Stone, 2003). In the
scholarly literature, there are currently only a small number of published empirical studies that
have been conducted on or have included HSTW. This review analyzed the four evaluation
studies conducted by external evaluation teams of the HSTW program that have been
conducted to date. In addition, this review also discusses the two CSR/WSR national program
evaluations that included HSTW in their study. Finally, the review summarizes the numerous
reports that SREB has produced on the program since its inception, mostly in the form of case
studies of successful school sites and practices.
To date, the Kaufman, Bradby, and Teitelbaum (2000) and the Frome (2001) studies
remain the most rigorous external evaluation studies of the HSTW program. Kaufman,
Bradby, and Teitelbaum examined the relationship between academic achievement and key
practices of the program as measured by HSTW assessment results. They found positive
effects on student achievement for students who successfully completed their science and
mathematics courses and who also regularly interacted with their high school counselor or
teacher about their program. Further, academic, and vocational teachers who worked together
were associated with gains in students’ reading and mathematics scores (Kaufman, Bradby, &
Teitelbaum, 2000). However, the conclusions of this study were limited by the use of only the
HSTW Assessment results as outcomes data to evaluate the program. Further limitations
include the use of different cohorts of students combined with a pre-test and post-test cross-
sectional design.

8
Frome (2001) compared schools experienced with implementing HSTW with schools
just beginning to implement the program. Student achievement was assessed relative to (a) the
percentage of students meeting the HSTW achievement goals, (b) the curriculum goals, and (c)
the degree to which the HSTW key practices were implemented. Like Kaufman, Bradby, and
Teitelbaum (2000), Frome used the HSTW Assessment results in mathematics, science, and
reading, as well as results from the teacher and the student surveys to determine the
effectiveness of the program in 1996 and 1998. The level of implementation of the HSTW
curriculum goals was positively associated with the percentage of students meeting the HSTW
achievement goals. Further, the percentage of students meeting the HSTW achievement goals
and curriculum goals increased over the period from 1996 to 1998. There were no significant
differences in outcomes between schools that joined in 1996 and schools that had been in the
program for a longer period. Finally, Frome also found that the higher the level of
implementation of the key practices of the program, the higher the percentage of students
meeting the achievement goals.
A limitation of this study is that it used the assessment results and responses on student
and teacher surveys from HSTW as the only outcome measures to assess the effectiveness of
the program. These data, however, do not provide a complete picture of program effectiveness
and therefore may not capture all of the relevant elements necessary to evaluate the program.
Also note that all three of the outcomes Frome studied in 1998 differ slightly from the current
goals. At the time of the study, the achievement goals were based on single cut scores on the
HSTW assessments, although it is unclear how those cut scores were established. The current
readiness goals are equal to the cut score set as “Basic” by a standard setting panel. The
curriculum goals at that time were at least four college prep level courses in English, three
mathematics courses of which two were college prep level, three science courses of which two
were college prep level, and four courses in an academic or career/technical major. The
current recommended curriculum has increased to four college prep mathematics and three
college prep science courses. The level of implementation was based on specific questions
selected from the student and teacher surveys for the study and did not cover all the
implementation goals. The current survey provides information on implementation via indices
on all 11 key practices.

9
Two comprehensive or whole-school reform national program evaluations, Borman,
Hewes, Overman, and Brown (2002) and Herman, Aladjem, McMahon, Masem, Mulligan,
and O'Malley (1999) included the HSTW program in their evaluations. Borman et al.
conducted a meta-analysis of CSR/WSR programs to determine the overall effectiveness of
different CSR/WSR models as well as the specific effects of the 29 most commonly
implemented external programs. While Borman, Hewes, Overman, and Brown (2003)
determined HSTW to be promising with regard to its impact on achievement, they found it to
lack external comparison group studies which can be used to determine effect sizes. Herman
et al. developed a common rating system to compare 24 schoolwide reform programs based
on information provided by the programs and collected from existing literature. The programs
were rated on two characteristics: (a) indications of positive effects of the programs on student
achievement and; (b) support given to school sites. Additionally they compared financial and
staffing impact of each program. For the HSTW program, Herman et al. rated both the positive
effect on achievement and the support levels to be “strong” based on the studies they
examined, one of only two programs with the highest rating on both. Additionally, only four
programs were less expensive to implement. However, several weaknesses of the studies used
to determine the HSTW rating were noted, including the paucity of matched control groups,
the predominance of case studies, and the lack of research studies conducted by independent
researchers.
More recently, Kurtz, Young, and Cline (2009) analyzed HSTW data to investigate
students’ experiences with a CTE program. Classifying a student’s program of study has yet
to be standardized for American high schools, a problem already noted by other researchers.
Consequently, CTE curricula often differ widely among schools and programs. Kurtz, Young,
and Cline found that a higher percentage of low-SES students enrolled in CTE than in a
college preparatory curriculum. In addition, the degree of academic rigor in science and
reading courses in a CTE curriculum was found to be as predictive of performance on the
HSTW assessments for CTE students as for college preparatory students.
SREB’s own reports on HSTW include information guides, brochures, newsletters,
presentations, state progress reviews, updates on specific sites, case studies of particular sites
detailing their program and implementation, research briefs, and research reports. As noted in
the Borman, Hewes, Overman, and Brown (2002) and Herman et al. (1999) studies, SREB has

10
produced a considerable number of reports on different HSTW school sites. All of the
materials provide information and promote the program. However, the research briefs, reports,
and case studies provide the most detailed evidence of the program’s impact and
effectiveness. The research briefs contain specific findings and cite progress as related by
school leaders and teachers at school sites using the HSTW assessment scores and survey
responses. The research reports are fewer in number, focus on specific topics in the program,
tend to compare two or more schools, and are slightly more technical in form and format. The
case studies by SREB, and the few studies by external researchers, detail the impact of HSTW
on a chosen school and the changes in achievement of their seniors as measured by the HSTW
assessment. Another purpose of the case studies is to examine several schools and compare
the effectiveness of the different HSTW key practices or the success of particular schools
relative to a specific educational focus or goal such as educational focus on leadership to
achieve school and student goals or the key practice of focusing on guidance.
While somewhat more technical, the research reports do not meet the professional
standards of formal peer-reviewed journal articles in form or format. Specifically, these
reports provide limited background to orient the reader and do not review the current or past
literature to place the research in a context. Further, often times no research question or
hypothesis is presented, though the purpose of the report is generally clear. Additionally, the
methods used for the comparisons are often not specified in detail. However, the participants
and some of the demographic information are shared to indicate trends and student gains.
Similarly, though there are results and discussion sections, these do not necessarily contain
full descriptions of statistical tests performed, nor are all of the results presented. Finally, the
limitations inherent in the study are not presented. The reports and briefs give a succinct
description of applications of the HSTW program in varied settings and areas of the country. A
general finding is that students performed better on the HSTW assessment in schools that have
more fully implemented the program. However, the predominance of case studies compared
schools with varying degrees of program implementation rather than comparing schools
implementing the program to matched schools without the program. Comparing matched
schools without the program would provide a stronger design for evaluating the effectiveness
of HSTW. Consequently, these case study designs lacking a matched schools comparison
group restrict the results from being generalizable.
11
It should also be noted that given the considerable history and popularity of the HSTW
program, many articles in journals and association newsletters cite the HSTW program. These
articles often cite SREB publications including case studies and HSTW key practices
successes, the yearly staff development conference, or a presentation by an SREB
representative. Although these publications are valuable for disseminating information to the
public at large, they have not been peer-reviewed or published in the scholarly literature. The
studies previously described have begun to address the task of determining the effectiveness
of the HSTW program, its goals, and its key practices. However, each of the studies used
research methods which were observational in nature, rather than experimental research
designs that enabled causal conclusions. While the HSTW Assessments are convenient,
expedient, and affordable, the assessments were not designed specifically for program
evaluation purposes. The HSTW Assessments are designed primarily to measure the
performance of students as schools implement the HSTW reform design. Each study
acknowledged this shortcoming: using only the HSTW Assessment results, without additional
supporting outcome measures, ultimately weakens the research design employed. Further,
while use of the student and teacher questionnaires lends credibility to the program
evaluations, surveys in general are susceptible to bias and manipulation, and as such may be
considered to be weaker forms of evaluation evidence.
Using other appropriate outcome measures designed for use in program evaluation
studies would help to control for some of the factors that might explain differences between
groups or gains in achievement. In addition, random assignment of groups of students or
schools, paired with control or matched groups, would also strengthen arguments supporting
the program’s effectiveness. Further, all of the reports, even the more rigorous studies by
Herman et al. (1999) and Borman et al. (2002), compared the assessment results of graduating
seniors from two or more different cohorts in two or more different years. The use of true
longitudinal data, collected prior to high school graduation, would provide multiple data
points for each student and would allow for more appropriate analyses of the program’s
impact. SREB has also begun to survey students after graduating high school, which will
allow for richer analysis of the data and the program.
President Obama’s administration has stressed the necessity for students to acquire
sufficient levels of education and the skills necessary to compete in a global marketplace and

12
to maintain the nation’s position as a global leader. Many local, regional, and national
educational goals reflect the administration’s desires and also match the goals that are found
in CSR/WSR programs as well as in efforts aimed at the improvement, development or reform
of CTE programs. The HSTW program has a sustained presence, shows some evidence of
effectiveness, and is implemented widely in schools throughout the United States. However,
additional independent and rigorously designed research is needed to evaluate the HSTW
program’s impact and effectiveness as aligned with the HSTW program goals as well as with
broader educational goals.
Assessment Development
In order to meet the goal of introducing entirely new assessments in all three subject
areas for 2008, new HSTW frameworks in Mathematics, Reading, and Science were
developed (ETS, 2008). The content of past HSTW assessments was guided by the content of
Grade 12 National Assessment of Educational Progress (NAEP) assessments in these three
subject areas, so that the availability of new NAEP frameworks for 2009 for 12th grade in the
three subject areas proved to be fortuitous timing for the development of the new HSTW
assessments. The NAEP frameworks provided convenient starting points for tailoring and
modifying those frameworks to align with the specific needs of HSTW: primarily to measure
readiness for college or the workplace; assess comprehension, analysis, and reasoning skills;
and, for the first time, to provide individual student score reports for the HSTW Assessments.
The development process of the new HSTW Assessments began in the fall of 2006
with a review of the three new NAEP frameworks for 2009 in mathematics, reading, and
science. An external panel convened by SREB reviewed the 2009 NAEP frameworks and
made general recommendations as to how those frameworks could be modified to align with
the reporting goals and purpose of the new HSTW assessments. The expert panel included a
state Director of Public Instruction, a state Director of Adult Education, a state CTE Director,
several district superintendents, a school principal, and a state curriculum specialist. The
recommendations of the external panel also reflected thinking that is consistent with
professional organizations in education, including the National Council of Teachers of
English and the National Council of Teachers of Mathematics, that have produced
publications on the curriculum and assessment of content in mathematics, reading, and
science. Ultimately, the new HSTW Assessments for 2008 were designed to meet a subset of
13
skills and objectives described in the corresponding NAEP frameworks that were deemed to
be most critical in meeting the goals of HSTW.
A short time after the first panel met, a second set of external panels was convened by
SREB to translate the general recommendations of the first panel into specific subject level
revisions resulting in new HSTW frameworks for all three subject areas. There were three
panels—one for each subject—consisting of educators from HSTW schools and states with
subject-matter expertise. There were also SREB content leader for each subject area
participating, as well as one member of the business community on the committee for reading.
Subsequent to the establishment of the frameworks, in late 2006 and through the first
half of 2007, new items were developed for these assessments by ETS test development staff.
Items were reviewed by subject experts from the external panels that met in late 2006 as well
as staff from SREB. All items also underwent ETS editorial and fairness reviews. Assembly
and production work on the new assessments were completed in the spring and summer of
2007.
The HSTW Assessments consist of both multiple-choice (MC) and constructed-
response (CR) operational items. There is currently one operational form for each of the three
subject area tests. Each of the Mathematics and Science forms contain the same set of
operational items plus five unique MC field-test items. The Reading, Mathematics, and
Science subject tests consist of three timed sections; the Reading sections are 25, 40 and 25
minutes long; the Mathematics sections are 27, 28, and 15 minutes long; and the Science
sections are 28, 27, and 15 minutes long.
HSTW Validity Studies
Between 2006 and 2009 a series of studies were conducted on both the validity of the
HSTW Assessment and the utility of the information obtained from the Student Survey. The
first study focuses on the validity of the assessment scores and uses data from the revised
HSTW Assessment. The next two studies look at the relationship of the Indices of Key
Practices with the Assessment results—these studies use data prior to the 2008 revision.
1. Concurrent Validity of the HSTW Assessment Scores
As mentioned earlier, to assess progress in school improvement and student
achievement, one key component of HSTW is the HSTW Assessment, consisting of three
14
subject tests (mathematics, reading, and science). Because a new version of the assessment
was developed and administered for the first time in 2008, it was important to conduct validity
studies on the assessment results to evaluate whether the assessment is functioning as
designed. The main purpose of a concurrent validity study is to evaluate one or more
measures by investigating their relationship to other commonly used and established measures
given at or about the same time to a group of individuals. For example, one way to judge the
validity of scores from a new assessment is to see how well those scores correlate with current
school grades. If the new assessment is designed to measure a student’s knowledge or skills in
a particular content area, we would expect that the scores from the assessment would correlate
more highly with grades in the same content area and correlate less well with grades from
other content areas. If the pattern of results conforms to our model of students’ cognitive
skills, then this provides one type of evidence that our interpretation of the test scores is valid
and is supported by these results. A concurrent validity study differs from a predictive validity
study, which attempts to show that a measure is valid for predicting future performance; for
example, using SAT, or ACT scores of high school students to predict college grades.
This validity study was conducted in the fall of 2008 by ETS and SREB. When the
HSTW Assessment was administered in January and February of 2008, HSTW school sites
were asked if they would be interested in participating in future research studies. All HSTW
schools from six states (Georgia, Kentucky, Ohio, South Carolina, Texas, and West Virginia)
that expressed interest in research participation were contacted. These states were targeted for
participation because each has a large number of HSTW sites. Since the analyses for this study
used scores from state-specific content assessments, it was necessary to ensure that there
would be a sufficient number of students from each state to achieve valid and reliable results.
A total of 146 schools in the six states were contacted; of these, 68 schools agreed to
participate, although only 51 schools provided the data requested. HSTW sites were asked to
complete a spreadsheet with students’ information on cumulative high school grade point
average (GPA), state test results, and national admissions (ACT or SAT) test results. In total,
data from nearly 2,600 students were analyzed for this study.
Correlation Results
Pearson correlation coefficients were computed to determine the degree of association
among scores on the HSTW Assessment, cumulative high school GPA, scores on state high

15
school content tests, and scores on national college admissions tests. The results showed that
scores from the HSTW Assessment are generally moderately to highly correlated with all of the
other measures of student achievement (see Tables 1–3). These analyses were conducted state-
by-state because the state tests differed, such that reporting results based on a single sample
would have produced misleading findings. The patterns for the validity coefficients are as
expected: With few exceptions, HSTW Assessment scores correlated more highly with state test
scores in the same content area (e.g., HSTW reading with state-specific reading) than with state
test scores in a different content area or with high school GPA. The results for Texas, however,
are somewhat atypical in this study: HSTW Assessment scores had substantially lower
correlations with high school GPA than was found in the other five states. This does not appear
to indicate a problem with the HSTW Assessment in Texas as the study also found similarly low
correlations between the Texas state test scores and high school GPA.
Table 1
Correlations of HSTW Reading With Other Measures of Student Achievement
HS GPA State reading State writing
State Correlation N Correlation N Correlation N
GA 0.42 349 0.41 338 0.29 332
KY 0.56 447 0.66 116 0.47 214
OH 0.45 560 0.56 538 0.48 539
SC 0.55 674 0.64 557 — —
TX 0.26 133 0.52 291 — —
WV 0.57 310 0.56 193 — —
Note. South Carolina, Texas, and West Virginia do not include a separate writing section in
their statewide tests.

16
Table 2
Correlations of HSTW Mathematics With Other Measures of Student Achievement
HS GPA State mathematics State science
State Correlation N Correlation N Correlation N
GA 0.41 349 0.48 338 0.38 337
KY 0.52 447 0.70 270 0.59 270
OH 0.48 560 0.50 538 0.55 538
SC 0.43 674 0.64 557 — —
TX 0.25 133 0.55 289 0.56 290
WV 0.58 310 0.67 192 0.57 192
Note. South Carolina does not include a separate science section in its statewide test.
Table 3
Correlations of HSTW Science With Other Measures of Student Achievement
HS GPA State science State mathematics
State Correlation N Correlation N Correlation N
GA 0.45 349 0.47 337 0.40 338
KY 0.39 447 0.71 270 0.66 270
OH 0.38 560 0.55 538 0.39 538
SC 0.44 674 — — 0.57 557
TX 0.17 133 0.49 290 0.48 289
WV 0.53 310 0.60 192 0.51 192
Note. South Carolina does not include a separate science section in its statewide test.
Tables 4 and 5 show the correlations between HSTW Assessment scores and scores
from two national college admissions tests: the ACT and the SAT. In these analyses, we were
able to use a single sample because all students took the same tests. Note that the samples in
these analyses are smaller than the total sample for this study because some students in the
total sample did not take either admissions test. With one exception, all of the correlations
between the HSTW Assessment scores and the corresponding section scores from the ACT or
the SAT are above .50, which can be characterized as large. The only exception was a

17
correlation of .28 between HSTW reading and SAT writing, but because these represent
different skill areas, one would expect the correlation to be moderate. It is important to note
that because the admissions tests are high-stakes tests for high school students, one would
expect that students would be highly motivated to perform well. Given that assumption, the
fact that the HSTW Assessment scores are so highly correlated with those scores provides
evidence that these students also appeared to be motivated when they took the HSTW
Assessment. In other words, if a number of students were not motivated to do well on the
HSTW Assessment, the correlations with the admissions tests would have been much lower.
Table 4
Correlations of HSTW Assessment With SAT
SAT Reading SAT Writing SAT Mathematics
Correlation N Correlation N Correlation N
HSTW Reading 0.54 790 0.28 689 — —
HSTW Mathematics — — — — 0.59 734
HSTW Science — — — — 0.56 734
Note. Correlations across subject areas were not computed, as they are not meaningful.
Table 5
Correlations of HSTW Assessment With ACT
ACT Reading ACT English ACT Mathematics ACT Science
Correlation N Correlation N Correlation N Correlation N
HSTW Reading 0.57 1,127 0.59 1,127 — — — —
HSTW Mathematics — — — — 0.67 1,118 0.62 1,098
HSTW Science — — — — 0.55 1,118 0.56 1,098
Note. Correlations across subject areas were not computed as they are not meaningful.
Summary. The results from these analyses provide strong empirical support for the
concurrent validity of the new HSTW Assessment, given for the first time in 2008. The results
showed that the scores from the HSTW Assessment are generally moderately to highly

18
correlated with all of the other measures of student achievement, and that the correlations fit
an expected pattern since the HSTW Assessment scores correlated more highly with state test
scores in the same content area than with state test scores in a different content area or with
high school GPA. In addition, all of the correlations between the HSTW Assessment scores
and the corresponding section scores from both of the national college admissions tests are
substantial, which appears to indicate that low student motivation was not an issue for the
HSTW Assessment, at least for the subset of students in this study who also took the ACT or
SAT.
2. Relating Implementation to Outcomes
In 2007, ETS undertook a study to determine if the HSTW Indices of Key Practices are
predictive of students’ performance on the HSTW Assessments. Statistical analyses using data
for students who took the 2006 HSTW Assessment were conducted to determine the
relationships between the indices, based on responses to various questions in the HSTW
Student Survey, and scores on each of the three subject tests. These analyses were undertaken
to determine the predictive validity of values on the indices for forecasting performance on
each of the subject tests. The results are based on a total sample of more than 61,000 students
who took the 2006 HSTW Assessment.
The 11 Indices of Key Practices:
1. High expectations
2. Literacy across the curriculum
3. Numeracy across the curriculum
4. Engaging science curriculum
5. Completion of HSTW-recommended curricula
6. Integrating academic and career/technical studies
7. Quality career/technical studies
8. Quality work-based learning
9. Timely guidance
10. Perceived importance of high school studies
11. Quality extra help

19
Note that this study utilizes data prior to the revision of the HSTW Assessments in
2008 and the revision of the Indices in 2010 (which will be described later in this report).
Correlation results. Pearson correlation coefficients were computed to determine the
degree of association between values on the indices and scores on the HSTW Assessment. The
two HSTW Student Survey indices with the highest correlations with scores from the HSTW
Assessment are Index 5: Completion of HSTW-Recommended Curricula and Index 4:
Engaging Science. Index 5 had the highest correlations with the Assessment scores, with
values of .30 (Mathematics), .31 (Reading), and .36 (Science), while the correlations for Index
4 were .26 (Mathematics), .27 (Science), and .28 (Reading). The Indices with somewhat lower
correlations were 1, 2, 8, and 10, while Indices 3, 6, 7, 9, and 11 had the lowest correlations,
on average, with the HSTW Assessment scores. The matrix of correlation coefficients between
the indices and assessment scores is shown in Table 6. Because of the large sample size used
in this study, all of the correlations reported in Table 6 are considered to be highly statistically
significant.
Table 6
Correlation Coefficients Between Indices and HSTW Assessment Scores
Index 1 2 3 4 5 6 7 8 9 10 11
Mathematics .17 .14 .14 .26 .36 .04 .04 .19 .14 .16 .12
Reading .21 .18 .13 .28 .31 .07 .08 .20 .14 .19 .15
Science .15 .15 .12 .27 .30 .06 .06 .18 .11 .13 .11
N 59,510 59,510 59,510 59,510 59,510 39,753 44,762 44,762 59,510 59,510 59,510
Note. All correlations listed are statistically significant at p < .01 using a one-tail test based on
the sample sizes included in the table. The sample sizes vary by index due to different
amounts of missing data on the Student Survey questions.
Regression results. Students’ values on the HSTW Student Survey indices were used
to predict HSTW Assessment scores in the three subject areas. Regression analysis is a
common statistical technique for determining which, if any, variables are useful in predicting
values of an outcome measure. In this study, scores on each of the three subject tests were

20
used as outcome measures in separate regression analyses, with all 11 indices initially
available to predict the assessment scores. A specific version of regression analysis is forward
stepwise multiple regression analysis, which uses a statistical criterion to determine the best
subset of variables to use as predictors from a larger set of variables, leaving out variables that
do not significantly improve the prediction. Using forward stepwise multiple regression
analysis, we were able to determine which subset of the 11 indices is best able to predict the
assessment scores.
In summary, for both mathematics and science, the best set of predictors consisted of
Indices 5: Completion of HSTW-Recommended Curricula, 8: Quality Work-Based Learning,
and 4: Engaging Science. For reading, the best set of predictors consisted of Indices 5, 4, 8,
and 1: High Expectations. As a measure of predictive validity, the multiple correlation
coefficient (R) was calculated to be .38 for mathematics, .37 for reading, and .34 for science.
Squaring the multiple correlation coefficient yields an index for proportion of variance
explained in the assessment scores, which ranges from .12 (or 12 percent) for science to .15
(or 15 percent) for mathematics. In other words, 12 percent to 15 percent of the variation in
students’ performance on the HSTW Assessment is related to three or four of the indices from
the HSTW Student Survey. As a point of comparison, this is roughly the same degree of
predictive validity for SAT scores in forecasting first-year college grades. The indices are
listed in the order of importance in the regression equations reported in Table 7. For all three
assessment scores, the remaining indices added little to the predictive power of the indices
already mentioned.
Table 7
Summary of Forward Stepwise Multiple Regression Analysis for Indices Predicting HSTW
Mathematics (N = 31,343)
Variable B s. e. (B) Beta t-statistic sig. (p <)
(intercept) 238.88 0.883
Index 5 12.92 0.257 0.277 50.26 .001
Index 8 4.83 0.197 0.131 24.50 .001
Index 4 5.81 0.250 0.130 23.25 .001
Note. Multiple R = .384.
21
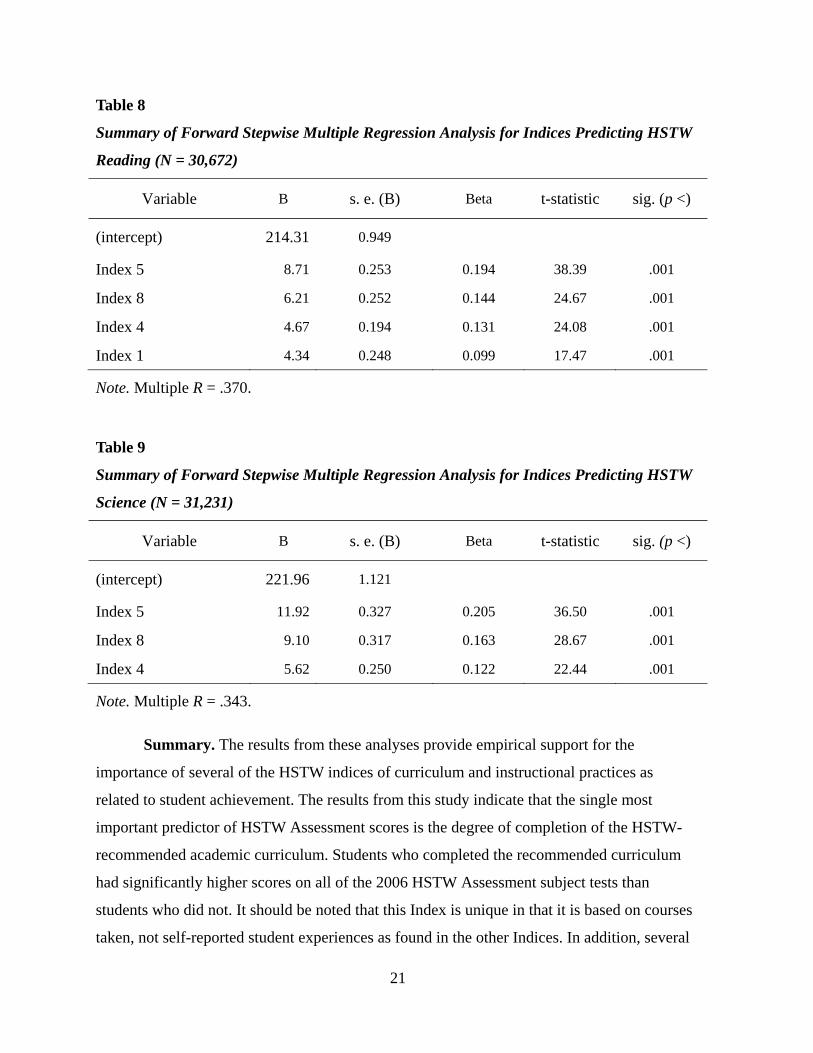
Table 8
Summary of Forward Stepwise Multiple Regression Analysis for Indices Predicting HSTW
Reading (N = 30,672)
Variable B s. e. (B) Beta t-statistic sig. (p <)
(intercept) 214.31 0.949
Index 5 8.71 0.253 0.194 38.39 .001
Index 8 6.21 0.252 0.144 24.67 .001
Index 4 4.67 0.194 0.131 24.08 .001
Index 1 4.34 0.248 0.099 17.47 .001
Note. Multiple R = .370.
Table 9
Summary of Forward Stepwise Multiple Regression Analysis for Indices Predicting HSTW
Science (N = 31,231)
Variable B s. e. (B) Beta t-statistic sig. (p <)
(intercept) 221.96 1.121
Index 5 11.92 0.327 0.205 36.50 .001
Index 8 9.10 0.317 0.163 28.67 .001
Index 4 5.62 0.250 0.122 22.44 .001
Note. Multiple R = .343.
Summary. The results from these analyses provide empirical support for the
importance of several of the HSTW indices of curriculum and instructional practices as
related to student achievement. The results from this study indicate that the single most
important predictor of HSTW Assessment scores is the degree of completion of the HSTW-
recommended academic curriculum. Students who completed the recommended curriculum
had significantly higher scores on all of the 2006 HSTW Assessment subject tests than
students who did not. It should be noted that this Index is unique in that it is based on courses
taken, not self-reported student experiences as found in the other Indices. In addition, several

22
other indices were significant incremental predictors of student achievement, including
Engaging Science, Quality Work-Based Learning, and High Expectations. Clearly, these
indices are capturing important evidence about curriculum and instructional practices, and the
findings of this study indicate that these key practices can, and do, produce higher student
scores on the HSTW Assessment in all three subjects. While these results suggest the role of
several HSTW indices in student outcomes, these analyses do not enable us to establish these
indices as causal factors.
3. Relationship of the HSTW Indices to Changes in School Performance
The HSTW Indices of Key Practices are designed to be measures of an HSTW school’s
implementation of the school reform model in key areas of student experiences. Schools are
encouraged to focus on improving the practices that are measured by the Indices as a means of
improving student achievement. The assumption is that as more students report experiences in
line with HSTW expectations for best practices, student achievement will increase due to
exposure to a challenging and engaging curriculum integrated with quality instructional
support.
As previously established in Study 2, there are moderate correlations among the
Indices and HSTW Assessment results at the student level, a fact that supports the notion that
the Indices do measure school practices related to achievement. Equally important from a
school perspective is whether a school’s overall performance on the Indices is related to
school-level academic performance. For this study, the objective was to examine the
relationship between a school’s standing on the HSTW Indices of Key Practices and changes
in a school’s HSTW Assessment scores over time. The hypothesis proposed is that schools
showing high Index scores, and therefore presumably implementing the HSTW model
effectively, are more likely to see growth over time on the HSTW Assessment while schools
with low Index scores, and therefore presumably not implementing the HSTW model as
effectively, are less likely to see score improvements.
Design. The revision of the HSTW Assessments (both the tests and the surveys) meant
that the most recent time frame when all data sources were consistent for two consecutive
administrations was for 2004 and 2006. All schools that were HSTW sites in both 2004 and
2006 and participated in the HSTW assessments were included in the analyses, comprising a
sample of approximately 750 schools. To measure improvement in test scores, for each school
23
the changes in average scale scores from 2004 to 2006 were calculated for the HSTW
Assessments in Reading, Science, and Mathematics. To measure relative Index level, the
mean Index score for each site was calculated, and schools were placed into quartiles. This
was only done for the eight Indices based on the survey responses appropriate for all students
and did not include the Career Technical indices (because only students in CTE programs
completed this section, and many schools had limited to no CTE students) or the Completion
of HSTW-Recommended Curricula (because of the potentially circular nature that only
students with stronger academic skills would be placed into college-prep level courses upon
entry to high school and therefore meet the curricula goals). The pool of schools used for the
quartile placement was all HSTW sites for 2006, a total of 1,031 sites. The reason for focusing
on the 2006 Index results was based on the nature of the survey, which focuses on four years
of student experiences, and so any changes in school environment would best be captured by
the later of the two cohorts. Consequently this study is not designed to show whether Index
scores will predict future changes in test scores but to show whether schools saw a benefit in
terms of test score changes due to their Index scores representing the last four years of student
experiences.
Note that when examining all of the participating sites in 2006, those schools that
participated in 2004 had overall higher index values and higher assessment scores than
schools that did not participate in 2004. Consequently, the actual distribution of schools skews
slightly higher across the Index quartiles for those who participated in both 2004 and 2006
compared to all of 2006. In other words, for the 2004 to 2006 sample, slightly more than 25%
of schools are in the top quartile (29%) and slightly less than 25% of schools are in the bottom
quartile (22%).
Results. At the school level, the correlations of the Indices to the change in mean test
scores from 2004 to 2006 are similar to the correlations seen for the Indices with test scores
for students. The Indices showed higher correlations with Mathematics scores generally and
lower with Science.

24
Table 10
Correlations of Changes in Mean HSTW Assessment Scores from 2004 to 2006 with Mean
Index Score
Correlations
Mathematics Science Reading
Index 1 .259** .165** .197**
Index 2 .170** .112** .165**
Index 3 .176** .094* .157**
Index 4 .271** .218** .210**
Index 8 .239** .194** .194**
Index 9 .226** .148** .192**
Index 10 .279** .210** .249**
Index 11 .228** .159** .212**
N 735 740 743
**Correlation is significant at the 0.01 level (2-tailed). *Correlation is significant at the 0.05
level (2-tailed).
Examining the relationship of score change with the Indices when schools were
divided into quartiles reveals that schools in the highest quartile for each Index showed the
largest gains in test scores between 2004 and 2006, with an average improvement of about 1/3
of a standard deviation across all Indices. Schools in the bottom quartile actually showed, on
average, slight score declines from 2004 to 2006. Table 11 shows the changes in scores for
Index 1. The difference between the highest and lowest schools was 7.2 points on the Math
scale, or .64 of a standard deviation. This difference was due not just to the increase in the
highest quartile but also the decrease in the lowest quartile. The largest score gain was for
science for the highest quartile schools for this Index, but the high-low difference was the
least due to no score decline for the lowest quartile. Full results for the other Indices can be
found in Appendix A.

25
Table 11
Score Change on Index 1 by School Quartiles
A series of Analyses of Variance (ANOVA) were conducted for each combination of
test scores by index ranking, with the changes in HSTW scores as the outcome measure and
the four quartiles of Index as the grouping variable. See Table 12 for the results for Index 1
where the ANOVA results indicate significant differences in test scores for all three measures.
Table 12
ANOVA Results for Index 1
ANOVA table
Sum of squares df Mean square F Sig.
Mathematics Between groups 4932.595 3 1644.198 13.591 .000
Within groups 88434.555 731 120.978
Total 93367.150 734
Science Between groups 3549.376 3 1183.125 5.699 .001
Within groups 152787.804 736 207.592
Total 156337.179 739
Reading Between groups 5395.455 3 1798.485 9.391 .000
Within groups 141520.975 739 191.503
Total 146916.430 742
For all but one combination of the three HSTW subjects and the eight indices we
studied, ANOVA results for the average change in scores showed significant differences
across quartiles. Only for Index 3 were the science scores not significantly different across
quartiles. Schools in the top quartile typically showed a score gain of about 1/3 to 2/3 of a
Mean score change Score change in effect size
Math Science Reading Math Science Reading
Lowest quartile -2.1 -0.1 -2.6 -0.19 0.00 -0.18
Second quartile 2.3 2.2 1.1 0.21 0.15 0.08
Third quartile 2.3 4.3 3.7 0.20 0.29 0.27
Highest quartile 5.1 5.7 4.2 0.45 0.39 0.30
Difference (highest–lowest)
7.2 5.8 6.8 0.64 0.40 0.48

26
standard deviation greater than those in the bottom quartile, or about 5 to 8 points for each
scale. For Indices 1, 2, 3, and 9, 10, 11, the largest differences were seen in Mathematics and
in Reading and the smallest in Science. For Indices 4 and 8, Science showed differences
similar to those shown by the other subjects. One of the two best predictors for score
differences for all subjects was the Engaging Science index, with Perceived Importance of
High School Studies also showing large differences. Results for the other Indices can be found
in Appendix A.
Summary.The HSTW model encourages schools to improve student experiences in the
classroom as a means to drive academic achievement. The Indices of Key Practices were
designed to measure the level of student experiences to inform schools of areas they could
improve. When compared to other HSTW schools, those that implemented the HSTW model at
a high level, as evidenced by the student reported Indices of school practices and experiences,
showed the largest score gains on the three HSTW Assessments. Those gains were
significantly higher than the results seen for the schools with low implementation of the
model, again as evidenced by the Index results; in fact schools that showed the lowest Index
scores often saw test scores decline.
Revisions to the HSTW Student Survey
By 2008, the student survey component of the HSTW Assessment included nearly 250
questions, ranging from ones regarding demographics, courses taken, and future goals to ones
regarding student experiences in the classroom, at home, and at work. Overall, the student
survey, though not timed, took 90 minutes or more to complete. Results from this survey form
the basis of reports provided to each school as a means to identify areas of improvement,
including the questions which contributed to the Indices of Key Practices. The need for the
survey results to be fully reflective of students’ experiences is high, and the extensiveness of
the instrument was potentially detrimental if fatigue or lack of interest resulted in inaccurate
or incomplete responses. Furthermore, interest in adding new questions and the lack of
removal of older questions resulted in the survey continually expanding, with nearly 40 new
questions proposed for the 2008 administration. The overabundance of data also could result
in obscuring the most important results; data overload could well diminish the impact of the
data. Based in part on comments from HSTW schools, SREB and ETS agreed that the survey
needed to be revised to ensure response accuracy, with a focus on shortening the instrument.

27
An analysis of the 2006 survey indicated that completion time could be reduced in two
ways. The first step was to revise the existing questions to improve clarity, reduce the reading
load, and reorder the survey to flow more logically. The second step was to revise the Indices
to improve their reliability and validity, and then remove questions that were neither directly
contributing to the Indices nor providing unique information.
Step one, simplifying the questions, was completed for the 2008 survey. For example,
these two questions were on the 2006 survey:
18. How many books have you read this year both in and out of school?
A. None B. 1–2 books C. Between 3 and 5 books D. Between 6 and 10 books E. Between 11 and 20 books F. More than 20 books 19. How many books have you read this year for your English class?
A. 0–1 books B. 2–3 books C. 4–5 books D. 6–7 books E. 8–10 books F. 11 or more books
These two questions were reformatted for the 2008 survey to look like this:
Questions 22–23. How many books have you read this year in:
0–1 2–3 4–5 6–7 8–10 11 or more 22. English class A B C D E F 23. Classes other than English A B C D E F
The revised version is easier to read and faster to complete, with less repetition (the
word “books” appeared 11 times in the answer options in the 2006 version) and comparable
categories between the two questions (allowing for easier comparisons of results). In addition,
the focus was changed in 2008 to reading in other classes, as compared to reading outside of
school in 2006. Information on reading in other classes provides information that a school can
reasonably control and look to improve, while reading outside of school, while important, is
more difficult for schools to impact. Overall, virtually every question was revised to some
28
extent, although most revisions were not as extreme as those shown in the above example. In
general, the primary goal was not to change the focus of the questions. Consequently, even
with the inclusion of 40 new questions (a 20% increase in questions), the overall length of the
survey in terms of page count only increased 6%, and the actual number of words decreased.
Step two was completed for the 2010 survey and focused on the Indices and removing
extraneous questions. Initial analysis of the Indices was undertaken during the 2008 revision
process, but the decision was made to not make changes until 2010. The main focus of the
Index revisions included:
No longer using the same question to contribute to more than one Index.
Not including questions intended only for CTE students in an Index for all
students.
Considering additional questions, if the number of questions supporting an Index
was low, in order to improve reliability and make the Index results more stable
over time.
Reviewing all Indices for statistical properties, including deleting questions that
did not increase the validity or reliability of the scale.
The first two considerations were automatic and did not require any additional
analyses. The last two considerations involved analysis of the individual questions and their
ability to add to an Index, both in terms of content and in terms of statistical properties. The
goal of the Indices, and the survey questions in general, is to differentiate performance on the
test by focusing on practices that HSTW believes drive academic success. Questions that do
not belong to an Index would need to stand alone as a predictor that SREB wished to focus on
in order to be retained in the survey. To facilitate this sorting of questions, any questions not
already assigned to an Index were organized into conceptual groups, starting with the current
Indices as the focal points.
Factor analysis of the conceptual groups was undertaken using the 2008 survey results
to determine if the current questions fit with the other questions in the Index and also if
additional questions formed a good fit. Questions that did not load on the primary factor for
each Index were flagged for possible exclusion. In some instances, questions being used in
one Index were placed into a second index pool and were found to load on that Index more

29
highly than on the current Index. After completing the factor analysis, all possible questions
for each Index were tested as part of a reliability analysis. Questions that did not add to the
reliability of the scale were flagged for exclusion. Although statistical properties drove the
initial analysis of revising the Indices, in a few instances questions that did not add much to
the scale were retained due to the content of those questions. As the Indices are meant to be
both descriptive and prescriptive, the desire to include some questions for purely content
reasons was understandable.
Table 13 below shows the revision of the Indices. For Index 8: Quality Work-Based
Learning Experiences, in 2008 for the first time the questions that comprised that Index were
only given to a very small subset of respondents who had a school-sponsored job or
internship. For 2010, the Index was going to revert to be asked of all students with jobs.
Hence, projected changes in reliability are not reported as the sample will significantly
change.
Table 13
Summary of proposed changes to the Indices
Index composition
2008 index Proposed 2010 index (using 2008 data)
N questions Reliability
Questions dropped
Questions added
N questions Reliability
Change in reliability
1: High exp 5 0.48 2 7 10 0.75 0.27
2: Literacy 10 0.64 3 3 10 0.75 0.11
3: Numeracy 11 0.64 6 3 8 0.72 0.08
4: Science 8 0.60 3 5 10 0.81 0.21
6: Acad in CT 6 0.85 0 2 8 0.89 0.04
7: Quality CT 11 0.75 6 3 8 0.79 0.04
8: Work-based 4 NA 0 5 9 NA NA
9: Guidance 8 0.38 2 4 10 0.67 0.29
10: Importance 9 0.59 4 5 9 0.78 0.19
11: Extra Help 4 0.59 0 2 6 0.69 0.10
An example of the changes made can be seen in the composition of the Emphasis on
High Expectations Index from 2008 to 2010. Two questions that were dropped because of
low factor loadings in the factor analysis are in italics. Both had been included in more than

30
one Index in 2008, and factor loadings suggested they were a better fit in the other Indices
they had been part of. The seven questions added are in bold. Three of the added questions
had been part of the Perceived Importance of High School Studies Index. Four of the added
questions had not been part of an Index prior to 2010.
Table 14
Emphasis on High Expectations Index from 2008 to 2010
2008 2010
My teachers often have clearly indicated the amount and quality of work that are necessary to earn a grade of A or B at the beginning of a project or unit.
I often have worked hard to meet high standards on assignments.
Usually spend one or more hours on homework each day.
Teachers are frequently available to you before, during, or after school to help with your studies.
I often have revised my essays or other written work several times to improve their quality.
My teachers often have clearly indicated the amount and quality of work that are necessary to earn a grade of A or B at the beginning of a project or unit.
I often have worked hard to meet high standards on assignments.
Usually spend one or more hours on homework each day.
My teachers often care about me enough that they will not let me get by without doing the work.
Most of my teachers often have encouraged me to do well in school.
My courses sometimes or often have been exciting and challenging.
My teachers often know their subject and make it interesting and useful.
My teachers often have set high standards forme and are willing to help me meet them.
I somewhat or strongly agree that with hard work, I can understand the material being taught in my classes.
I somewhat or strongly agree that the grades that I receive are the result of the amount of effort that I put forth in my classes.
31
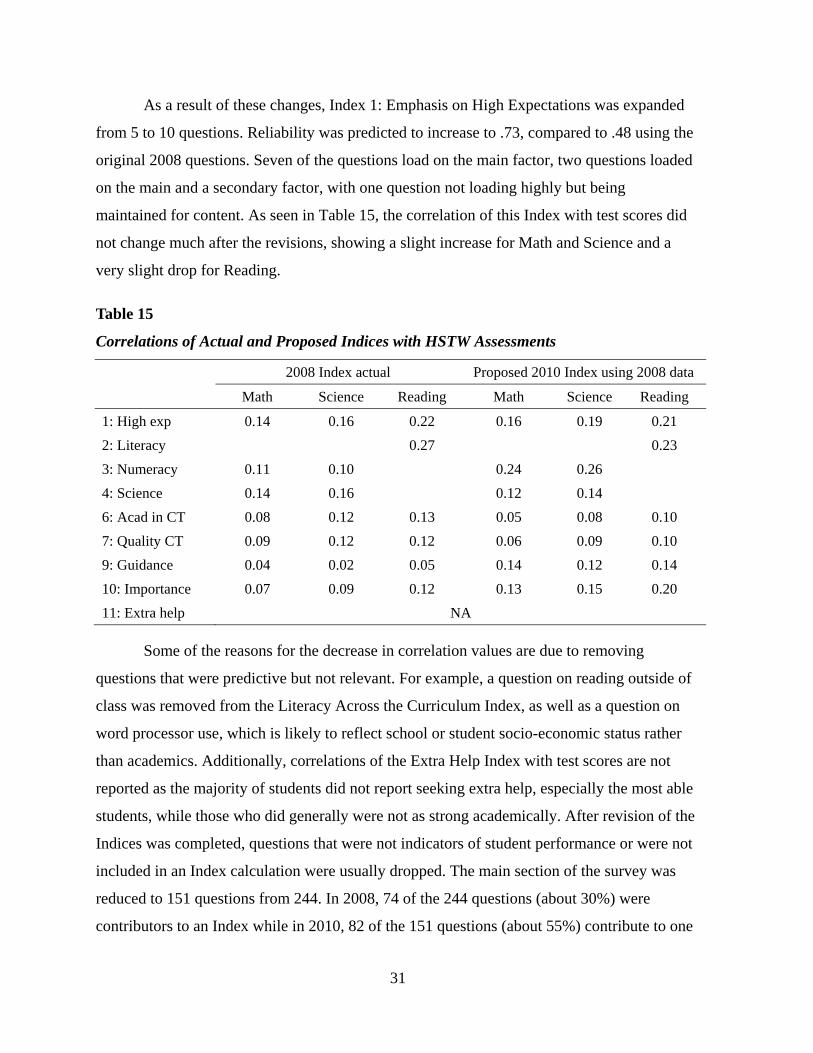
As a result of these changes, Index 1: Emphasis on High Expectations was expanded
from 5 to 10 questions. Reliability was predicted to increase to .73, compared to .48 using the
original 2008 questions. Seven of the questions load on the main factor, two questions loaded
on the main and a secondary factor, with one question not loading highly but being
maintained for content. As seen in Table 15, the correlation of this Index with test scores did
not change much after the revisions, showing a slight increase for Math and Science and a
very slight drop for Reading.
Table 15
Correlations of Actual and Proposed Indices with HSTW Assessments
2008 Index actual Proposed 2010 Index using 2008 data
Math Science Reading Math Science Reading
1: High exp 0.14 0.16 0.22 0.16 0.19 0.21
2: Literacy 0.27 0.23
3: Numeracy 0.11 0.10 0.24 0.26
4: Science 0.14 0.16 0.12 0.14
6: Acad in CT 0.08 0.12 0.13 0.05 0.08 0.10
7: Quality CT 0.09 0.12 0.12 0.06 0.09 0.10
9: Guidance 0.04 0.02 0.05 0.14 0.12 0.14
10: Importance 0.07 0.09 0.12 0.13 0.15 0.20
11: Extra help NA
Some of the reasons for the decrease in correlation values are due to removing
questions that were predictive but not relevant. For example, a question on reading outside of
class was removed from the Literacy Across the Curriculum Index, as well as a question on
word processor use, which is likely to reflect school or student socio-economic status rather
than academics. Additionally, correlations of the Extra Help Index with test scores are not
reported as the majority of students did not report seeking extra help, especially the most able
students, while those who did generally were not as strong academically. After revision of the
Indices was completed, questions that were not indicators of student performance or were not
included in an Index calculation were usually dropped. The main section of the survey was
reduced to 151 questions from 244. In 2008, 74 of the 244 questions (about 30%) were
contributors to an Index while in 2010, 82 of the 151 questions (about 55%) contribute to one

32
of the Indices. The full set of Indices and the changes made to their contents can be found in
Appendix B.
Summary
The two-step revision of the student survey resulted in a significant reduction in
reading load and time to completion as well improved Indices in terms of content and
reliability. Significant improvement in validity of the Indices was not seen; however the result
overall was similar for the 2008 and the expected 2010 survey results. We anticipate that the
2010 results will indicate higher completion rates of the survey and more accurate data as
fatigue or disinterest is decreased.
Discussion
In this report, we have provided an overview and summary of several key aspects of
the HSTW program to which ETS has contributed. This report includes a description of the
program’s philosophy and practices; a review of prior research on HSTW; a description of the
development of the new HSTW assessments, administered for the first time in 2008; and
descriptions of several recent validity studies conducted by ETS in support of HSTW. The
HSTW Assessments and Student Survey have undergone a number of substantial
improvements during the past few years. However, there is additional work to be carried out
with regard to additional validity and evaluation studies. Akin to the HSTW program’s
emphasis on continual improvement, ETS research staff expects to continue to work with
SREB in order to improve key components of the program where necessary. Likely studies to
be undertaken include validating the changes made to the Indices by looking at the actual
2010 results, replicating the concurrent validity study in additional states, and investigating
whether long term participation in HSTW shows improvement in academic achievement and
student experiences.
33
References
ACT. (2010). The condition of college and career readiness, 2010. Retrieved from
http://www.act.org/research/policymakers/cccr10/pdf/ConditionofCollegeandCareerRe
adiness2010.pdf.
Borman, G. D., Hewes, G. M., Overman, L. T., & Brown, S. A. (2002). Comprehensive
school reform and student achievement: A meta-analysis (CRESPAR Technical
Report No. 59). Baltimore, MD: Center for Research on the Education of Students
Placed at Risk, Johns Hopkins University.
Castellano, M., Stringfield, S., & Stone, J. R. (2003). Secondary career and technical
education and comprehensive school reform: Implications for research and practice.
Review of Educational Research, 73, 233–272.
ETS (2008). High Schools That Work technical manual. Princeton, NJ: Author.
Frome, P. (2001). High Schools That Work: Findings from the 1996 and 1998 assessments.
Research Triangle Park, NC: Research Triangle Institute.
Herman, R., Aladjem, D., McMahon, P., Masem, E., Mulligan, I., & O'Malley, A. (1999). An
educator's guide to schoolwide reform. Washington, DC: American Institutes for
Research.
Kaufman, P., Bradby, D., & Teitelbaum, P. (2000). "High Schools That Work" and whole
school reform: Raising academic achievement of vocational computers through the
reform of school practice (No. NCRVE-MDS-1295). Berkeley, CA: National Center
for Research in Vocational Education; MPR Associates.
Kurtz, R. H., Young, J. W., & Cline, F. (2009, April). Career tech and college prep: An
Exploratory analysis of High Schools That Work. Paper presented at the meeting of the
American Educational Research Association, San Diego, CA.
Northwest Regional Education Laboratory. (2004). Catalog of school reform models - whole
school models (Archived). Retrieved from
www.nwrel.org/csdi/products/archived/catalog/ArchivedWholeSchoolModels.pdf
Southern Regional Education Board. (n.d.-a). About high schools that work: message from
Gene Bottoms. Retrieved from http://www.sreb.org/programs/HSTW/background/
bottomsmessage.asp.

34
Southern Regional Education Board. (n.d.-b). Assessment and using data: About the HSTW
assessment. Retrieved from
http://www.sreb.org/programs/HSTW/Assessment/assessindex.asp.
Stillwell, R. (2010). Public school graduates and dropouts from the common core of data:
School year 2007–08 (NCES 2010-341). National Center for Education Statistics,
Institute
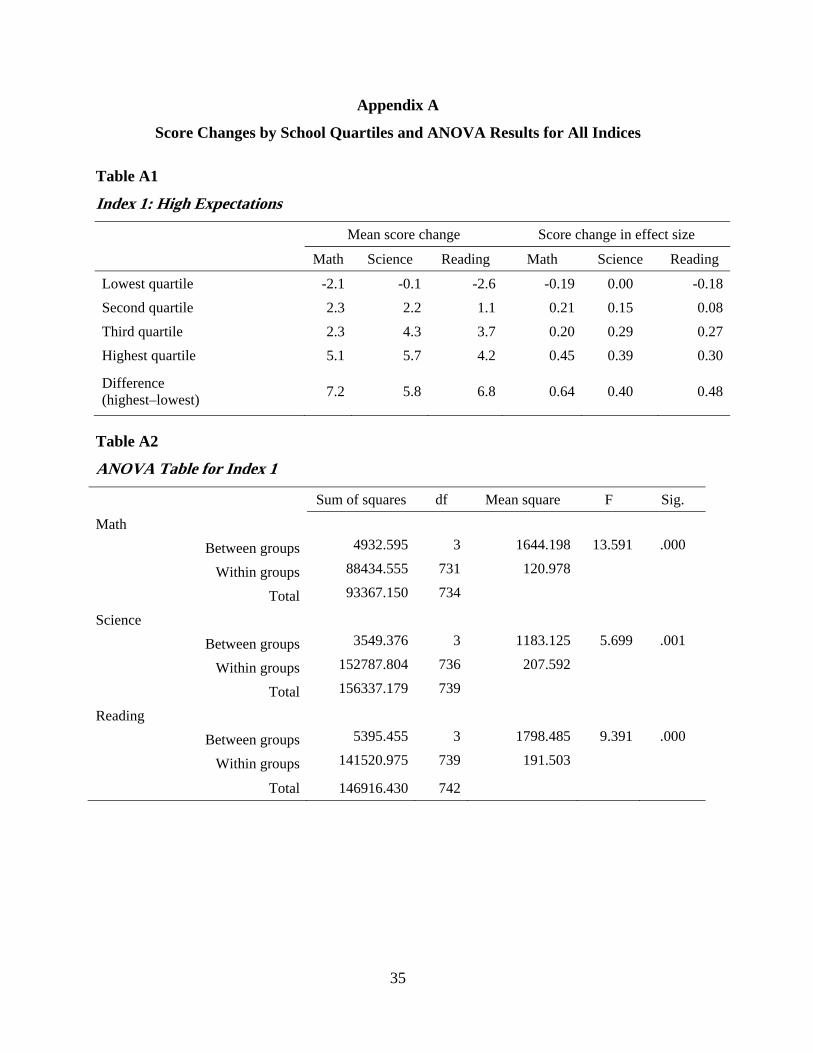
35
Appendix A
Score Changes by School Quartiles and ANOVA Results for All Indices
Table A1
Index 1: High Expectations
Mean score change Score change in effect size
Math Science Reading Math Science Reading
Lowest quartile -2.1 -0.1 -2.6 -0.19 0.00 -0.18
Second quartile 2.3 2.2 1.1 0.21 0.15 0.08
Third quartile 2.3 4.3 3.7 0.20 0.29 0.27
Highest quartile 5.1 5.7 4.2 0.45 0.39 0.30
Difference (highest–lowest)
7.2 5.8 6.8 0.64 0.40 0.48
Table A2
ANOVA Table for Index 1
Sum of squares df Mean square F Sig.
Math
Between groups 4932.595 3 1644.198 13.591 .000
Within groups 88434.555 731 120.978
Total 93367.150 734
Science
Between groups 3549.376 3 1183.125 5.699 .001
Within groups 152787.804 736 207.592
Total 156337.179 739
Reading
Between groups 5395.455 3 1798.485 9.391 .000
Within groups 141520.975 739 191.503
Total 146916.430 742

36
Table A3
Index 2: Literacy Across the Curriculum
Mean score change Score change in effect size
Math Science Reading Math Science Reading
Lowest quartile -0.9 0.6 -2.1 -0.08 0.04 -0.15
Second quartile 1.0 2.6 1.0 0.09 0.18 0.07
Third quartile 3.1 3.9 3.4 0.27 0.27 0.24
Highest quartile 4.1 4.7 3.9 0.36 0.33 0.28
Difference (highest–lowest)
5.0 4.1 6.0 0.44 0.28 0.43
Table A4
ANOVA Table for Index 2
Sum of squares df Mean square F Sig.
Math
Between groups 2682.537 3 894.179 7.208 .000
Within groups 90684.613 731 124.056
Total 93367.150 734
Science
Between Groups 1742.047 3 580.682 2.765 .041
Within groups 154595.132 736 210.048
Total 156337.179 739
Reading
Between groups 4109.900 3 1369.967 7.089 .000
Within groups 142806.530 739 193.243
Total 146916.430 742

37
Table A5
Index 3: Numeracy Across the Curriculum
Mean score change Score change in effect size
Math Science Reading Math Science Reading
Lowest quartile -1.0 1.2 -1.1 -0.09 0.09 -0.07
Second quartile 1.2 2.1 0.8 0.10 0.15 0.06
Third quartile 2.2 3.5 1.6 0.20 0.24 0.12
Highest quartile 4.9 5.1 4.9 0.43 0.35 0.35
Difference (highest –lowest)
5.9 3.8 6.0 0.52 0.26 0.42
Table A6
ANOVA Table for Index 3
Sum of squares df Mean square F Sig.
Math
Between groups 3268.602 3 1089.534 8.840 .000
Within groups 90098.548 731 123.254
Total 93367.150 734
Science
Between groups 1569.447 3 523.149 2.488 .059
Within groups 154767.732 736 210.282
Total 156337.179 739
Reading
Between groups 3528.793 3 1176.264 6.062 .000
Within groups 143387.636 739 194.029
Total 146916.430 742

38
Table A7
Index 4: Engaging Science Curriculum
Mean score change Score change in effect size
Math Science Reading Math Science Reading
Lowest quartile -3.0 -2.0 -3.1 -0.27 -0.14 -0.22
Second quartile 1.1 2.7 0.7 0.09 0.18 0.05
Third quartile 4.0 5.2 4.0 0.36 0.36 0.28
Highest quartile 4.9 5.7 4.4 0.44 0.39 0.31
Difference (highest–lowest)
7.9 7.7 7.4 0.70 0.53 0.53
Table A8
ANOVA Table for Index 1
Sum of squares df Mean square F Sig.
Math
Between groups 6888.285 3 2296.095 19.409 .000
Within groups 86478.865 731 118.302
Total 93367.150 734
Science
Between groups 6643.446 3 2214.482 10.888 .000
Within groups 149693.733 736 203.388
Total 156337.179 739
Reading
Between groups 6455.900 3 2151.967 11.322 .000
Within groups 140460.530 739 190.068
Total 146916.430 742

39
Table A9
Index 8: Quality Work-Based Learning
Mean score change Score change in effect size
Math Science Reading Math Science Reading
Lowest quartile -2.0 -2.0 -2.1 -0.18 -0.14 -0.15
Second quartile 1.3 2.7 1.2 0.11 0.18 0.08
Third quartile 2.9 4.9 2.3 0.25 0.34 0.17
Highest quartile 5.1 5.7 4.8 0.45 0.39 0.34
Difference (highest–lowest)
7.1 7.7 6.8 0.63 0.53 0.49
Table A10
ANOVA Table for Index 1
Sum of squares Df Mean square F Sig.
Math
Between groups 4617.899 3 1539.300 12.679 .000
Within groups 88749.251 731 121.408
Total 93367.150 734
Science
Between groups 5972.540 3 1990.847 9.745 .000
Within groups 150364.639 736 204.300
Total 156337.179 739
Reading
Between groups 4243.635 3 1414.545 7.327 .000
Within groups 142672.795 739 193.062
Total 146916.430 742
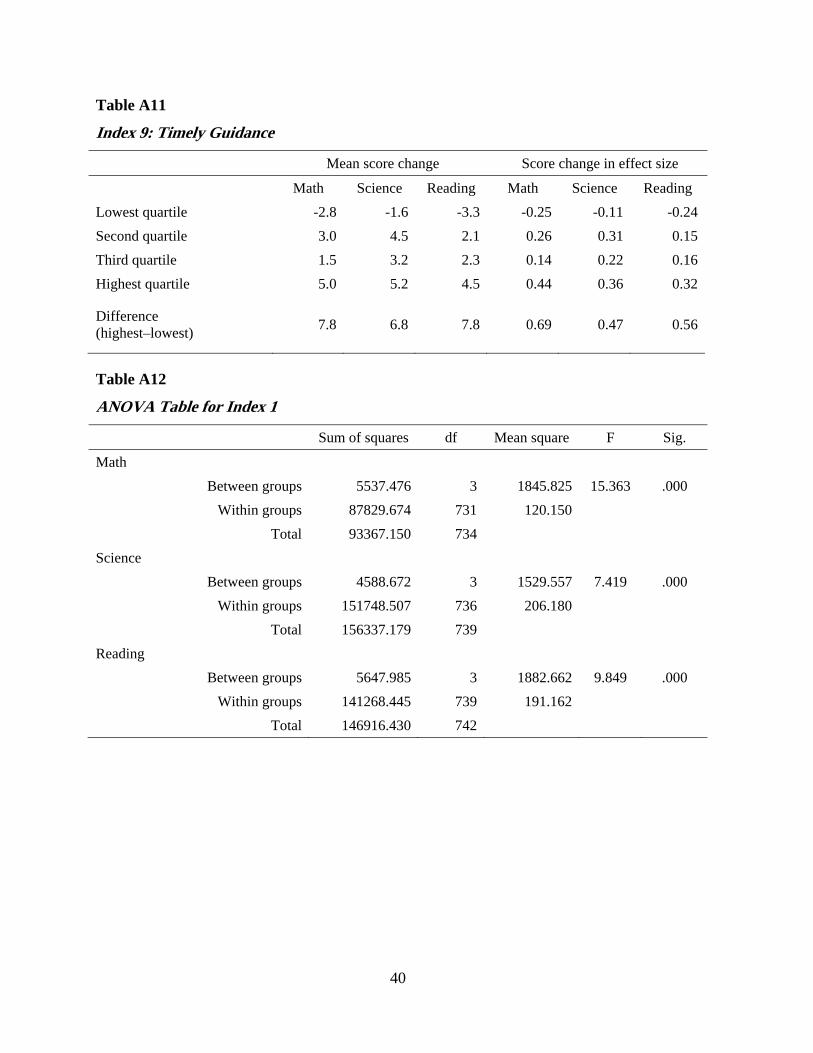
40
Table A11
Index 9: Timely Guidance
Mean score change Score change in effect size
Math Science Reading Math Science Reading
Lowest quartile -2.8 -1.6 -3.3 -0.25 -0.11 -0.24
Second quartile 3.0 4.5 2.1 0.26 0.31 0.15
Third quartile 1.5 3.2 2.3 0.14 0.22 0.16
Highest quartile 5.0 5.2 4.5 0.44 0.36 0.32
Difference (highest–lowest)
7.8 6.8 7.8 0.69 0.47 0.56
Table A12
ANOVA Table for Index 1
Sum of squares df Mean square F Sig.
Math
Between groups 5537.476 3 1845.825 15.363 .000
Within groups 87829.674 731 120.150
Total 93367.150 734
Science
Between groups 4588.672 3 1529.557 7.419 .000
Within groups 151748.507 736 206.180
Total 156337.179 739
Reading
Between groups 5647.985 3 1882.662 9.849 .000
Within groups 141268.445 739 191.162
Total 146916.430 742
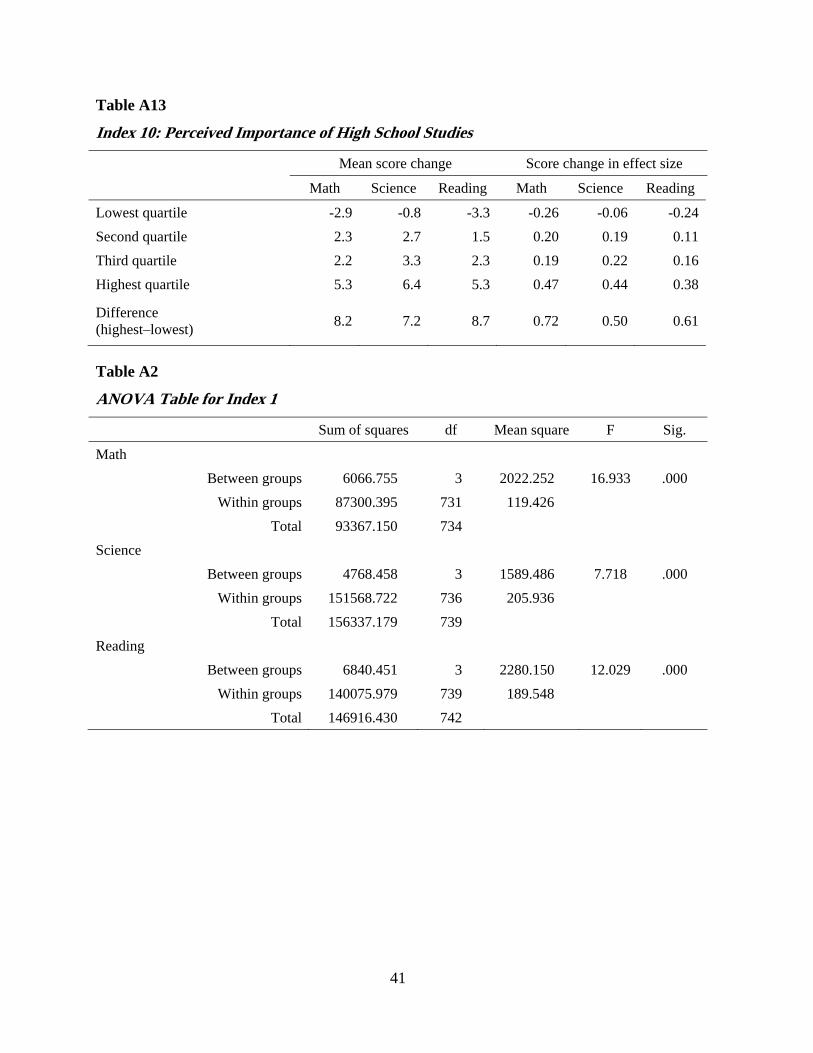
41
Table A13
Index 10: Perceived Importance of High School Studies
Mean score change Score change in effect size
Math Science Reading Math Science Reading
Lowest quartile -2.9 -0.8 -3.3 -0.26 -0.06 -0.24
Second quartile 2.3 2.7 1.5 0.20 0.19 0.11
Third quartile 2.2 3.3 2.3 0.19 0.22 0.16
Highest quartile 5.3 6.4 5.3 0.47 0.44 0.38
Difference (highest–lowest)
8.2 7.2 8.7 0.72 0.50 0.61
Table A2
ANOVA Table for Index 1
Sum of squares df Mean square F Sig.
Math
Between groups 6066.755 3 2022.252 16.933 .000
Within groups 87300.395 731 119.426
Total 93367.150 734
Science
Between groups 4768.458 3 1589.486 7.718 .000
Within groups 151568.722 736 205.936
Total 156337.179 739
Reading
Between groups 6840.451 3 2280.150 12.029 .000
Within groups 140075.979 739 189.548
Total 146916.430 742

42
Table A15
Index 11: Quality Extra Help
Mean score change Score change in effect size
Math Science Reading Math Science Reading
Lowest quartile -2.3 -0.4 -3.2 -0.21 -0.03 -0.23
Second quartile 3.0 4.0 2.7 0.26 0.28 0.19
Third quartile 3.2 3.4 3.3 0.29 0.24 0.23
Highest quartile 3.8 5.2 4.0 0.34 0.35 0.28
Difference (highest–lowest)
6.1 5.6 7.2 0.55 0.38 0.51
Table A2
ANOVA Table for Index 1
Sum of squares df Mean square F Sig.
Math
Between groups 4384.989 3 1461.663 12.008 .000
Within groups 88982.161 731 121.727
Total 93367.150 734
Science
Between groups 3188.348 3 1062.783 5.108 .002
Within groups 153148.831 736 208.083
Total 156337.179 739
Reading
Between groups 6063.739 3 2021.246 10.605 .000
Within groups 140852.690 739 190.599
Total 146916.430 742

43
Appendix B
Changes to HSTW Indices from 2008 to 2010
Index 1: Emphasis on High Expectations
Questions 1 to 3 were carried over from the 2008 Index, questions 4 to 10 were added in 2010, and questions A and B were dropped for 2010.
1. My teachers often have clearly indicated the amount and quality of work that are necessary to earn a grade of A or B at the beginning of a project or unit.
2. I often have worked hard to meet high standards on assignments. 3. Usually spend one or more hours on homework each day.
4. My teachers often care about me enough that they will not let me get by without doing
the work. (Moved from Index 10: Importance of HS) 5. Most of my teachers often have encouraged me to do well in school. (Moved from
Index 10: Importance of HS) 6. My courses sometimes or often have been exciting and challenging. (Moved from
Index 10: Importance of HS) 7. My teachers often know their subject and make it interesting and useful. 8. My teachers often have set high standards for me and are willing to help me meet
them. 9. I somewhat or strongly agree that with hard work, I can understand the material
being taught in my classes. 10. I somewhat or strongly agree that the grades that I receive are the result of the
amount of effort that I put forth in my classes.
A. Teachers are frequently available to you before, during or after school to help with your studies. (Included in Index 11: Extra Help)
B. I often have revised my essays or other written work several times to improve their quality. (Included in Index 2: Literacy).
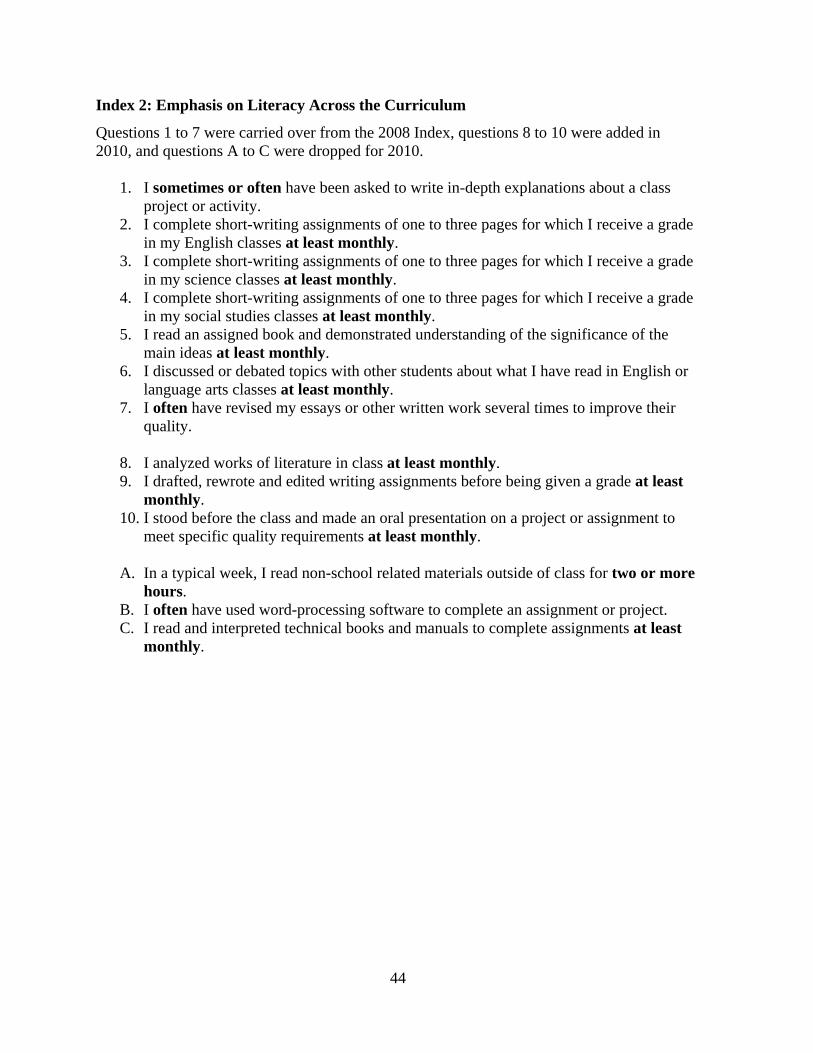
44
Index 2: Emphasis on Literacy Across the Curriculum
Questions 1 to 7 were carried over from the 2008 Index, questions 8 to 10 were added in 2010, and questions A to C were dropped for 2010.
1. I sometimes or often have been asked to write in-depth explanations about a class project or activity.
2. I complete short-writing assignments of one to three pages for which I receive a grade in my English classes at least monthly.
3. I complete short-writing assignments of one to three pages for which I receive a grade in my science classes at least monthly.
4. I complete short-writing assignments of one to three pages for which I receive a grade in my social studies classes at least monthly.
5. I read an assigned book and demonstrated understanding of the significance of the main ideas at least monthly.
6. I discussed or debated topics with other students about what I have read in English or language arts classes at least monthly.
7. I often have revised my essays or other written work several times to improve their quality.
8. I analyzed works of literature in class at least monthly. 9. I drafted, rewrote and edited writing assignments before being given a grade at least
monthly. 10. I stood before the class and made an oral presentation on a project or assignment to
meet specific quality requirements at least monthly.
A. In a typical week, I read non-school related materials outside of class for two or more hours.
B. I often have used word-processing software to complete an assignment or project. C. I read and interpreted technical books and manuals to complete assignments at least
monthly.

45
Index 3: Emphasis on Numeracy Across the Curriculum
Questions 1 to 5 were carried over from the 2008 Index, questions 6 to 8 were added in 2010, and questions A to F were dropped for 2010.
1. My mathematics teachers sometimes or often have shown how mathematics concepts are used to solve problems in real-life situations.
2. I solved mathematics problems with more than one possible answer at least monthly. 3. I solved mathematics problems other than those found in the textbook at least
monthly. 4. I used a graphing calculator to complete mathematics assignments at least weekly. 5. I worked in a group to brainstorm how to solve a mathematics problem at least
monthly.
6. I often have had to develop and analyze tables, charts and graphs in my school work. 7. I have been assigned word problems in mathematics at least monthly. 8. I used math in classes other than mathematics at least monthly.
A. I took a mathematics course my senior year. (Moved to Index 7: Quality CT) B. I completed a project that used mathematics in ways that most people would use it in a
real-world setting at least monthly. C. I worked with other students in my class on a challenging mathematics assignment and
received a group and individual grade at least monthly. D. I orally defended a process used to solve a mathematics problem at least monthly. E. I took at least four full-year courses in mathematics in grades 9 through 12. F. I used mathematics to complete challenging assignments at least monthly

46
Index 4: Emphasis on Challenging and Engaging Science Curriculum and Instruction
Questions 1 to 5 were carried over from the 2008 Index, questions 6 to 10 were added in 2010, and questions A to C were dropped for 2010.
1. My science teachers often have shown how scientific concepts are used to solve problems in real-life situations.
2. I read an assigned article or book (other than a textbook) dealing with science at least monthly.
3. I used science equipment to do science activities in a classroom at least weekly. 4. I prepared a written report of your lab results at least monthly. 5. I worked with other students in my class on a challenging science assignment or
project at least monthly.
6. I used computers or technology to do science activities at least monthly. 7. I used graphs, charts and diagrams to interpret and explain scientific phenomena at
least monthly. 8. I collected data from experiments and created graphic representations of the results at
least monthly. 9. I participated in a classroom discussion relating science to everyday life at least
monthly. 10. I used formulas and equations to solve questions in science at least weekly.
A. I took a science course my senior year. (Moved to Index 7: Quality CT) B. I used science equipment to do science activities in a laboratory with tables and sinks
at least weekly. C. I completed any three of CP physical science, CP biology/biology 2, anatomy, CP
chemistry, physics or AP science.
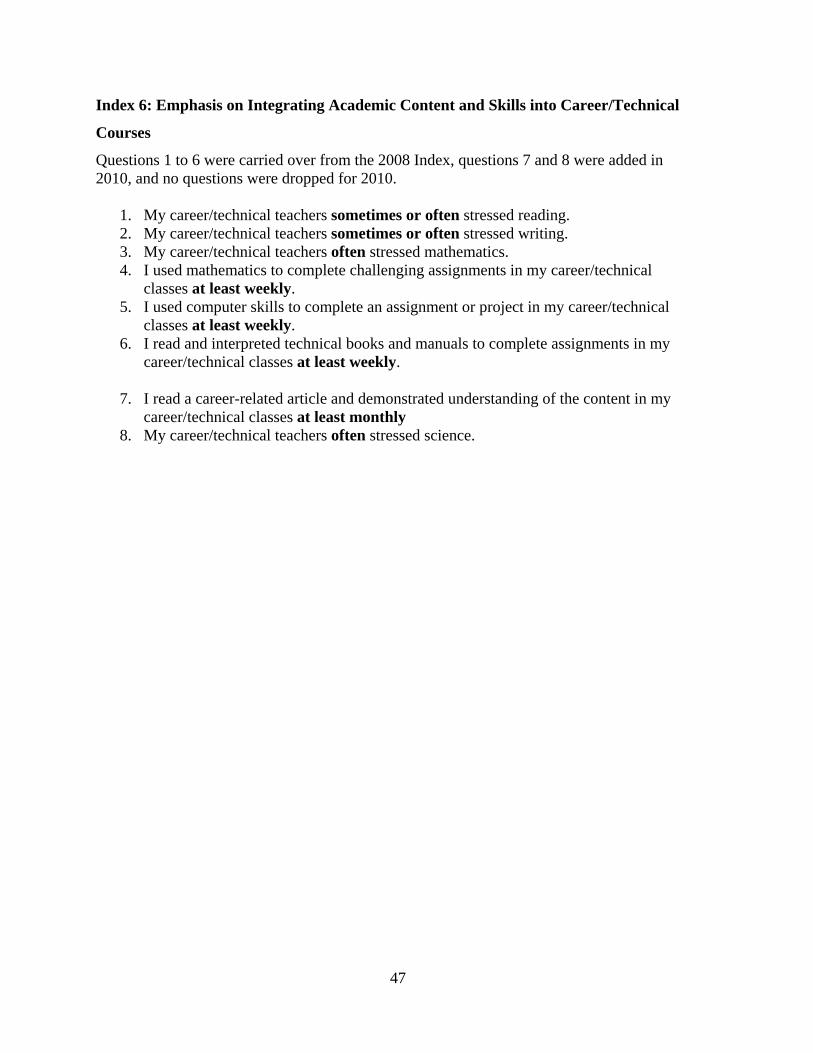
47
Index 6: Emphasis on Integrating Academic Content and Skills into Career/Technical
Courses
Questions 1 to 6 were carried over from the 2008 Index, questions 7 and 8 were added in 2010, and no questions were dropped for 2010.
1. My career/technical teachers sometimes or often stressed reading. 2. My career/technical teachers sometimes or often stressed writing. 3. My career/technical teachers often stressed mathematics. 4. I used mathematics to complete challenging assignments in my career/technical
classes at least weekly. 5. I used computer skills to complete an assignment or project in my career/technical
classes at least weekly. 6. I read and interpreted technical books and manuals to complete assignments in my
career/technical classes at least weekly.
7. I read a career-related article and demonstrated understanding of the content in my career/technical classes at least monthly
8. My career/technical teachers often stressed science.

48
Index 7: Emphasis on Quality Career/Technical Studies
Questions 1 to 5 were carried over from the 2008 Index, questions 6 to 8 were added in 2010, and questions A to F were dropped for 2010.
1. I completed a senior project that included researching a topic, creating a product or performing a service and presenting it to the class or others.
2. I had challenging assignments in my career/technical classes at least monthly. 3. I completed a project that first required some research and a written plan before
completing the task at least once a semester. 4. I was encouraged to take a combination of academic and career/technical courses. 5. I used computer software or other technology related to my career/technical area to
complete assignments at least weekly.
6. I made journal or lab manual entries that recorded my class work in my career/technical classes at least monthly.
7. I took a mathematics course during my senior year. (Moved from Index 3: Math) 8. I took a science course during my senior year. (Moved from Index 4: Science)
A. I spent time each day on homework assigned by career/technical teachers. B. I read non-school-related materials outside of class for one or more hours in a typical
week. C. I used mathematics to complete challenging assignments at least weekly. D. I used computer skills to complete an assignment or project at least monthly. E. I spoke with or visited someone in a career that I aspire to. F. I met certain standards on a written exam to pass a course.
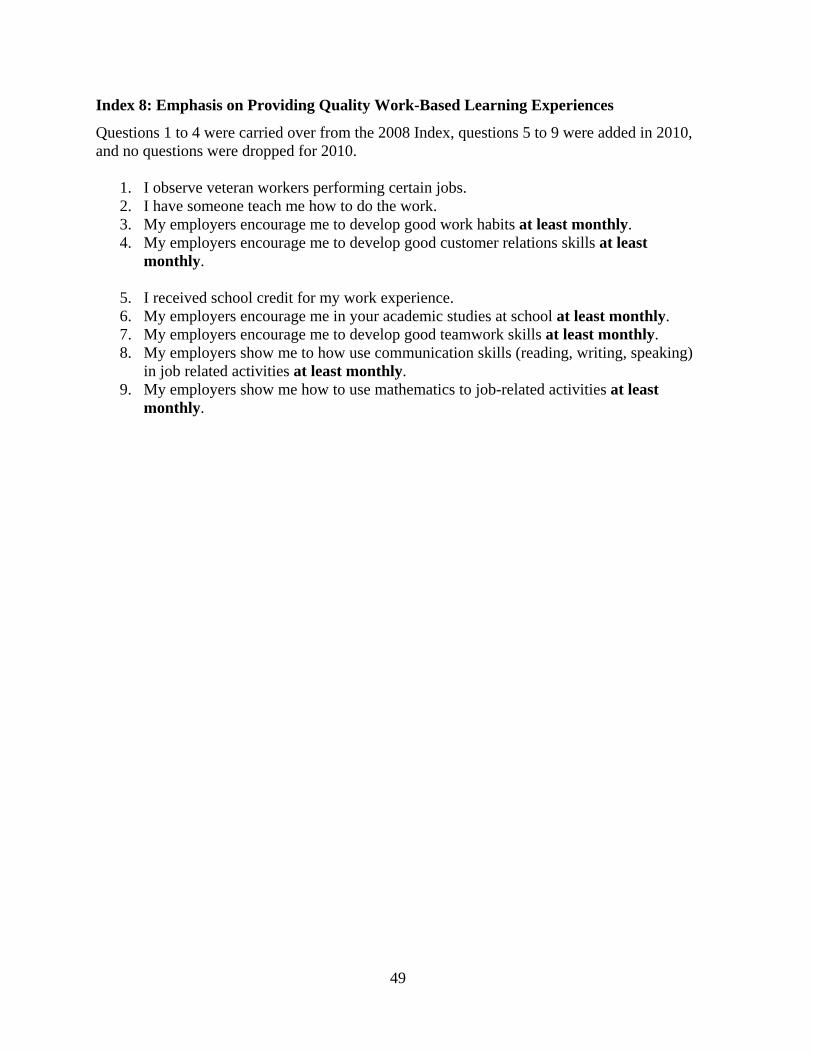
49
Index 8: Emphasis on Providing Quality Work-Based Learning Experiences
Questions 1 to 4 were carried over from the 2008 Index, questions 5 to 9 were added in 2010, and no questions were dropped for 2010.
1. I observe veteran workers performing certain jobs. 2. I have someone teach me how to do the work. 3. My employers encourage me to develop good work habits at least monthly. 4. My employers encourage me to develop good customer relations skills at least
monthly.
5. I received school credit for my work experience. 6. My employers encourage me in your academic studies at school at least monthly. 7. My employers encourage me to develop good teamwork skills at least monthly. 8. My employers show me to how use communication skills (reading, writing, speaking)
in job related activities at least monthly. 9. My employers show me how to use mathematics to job-related activities at least
monthly.
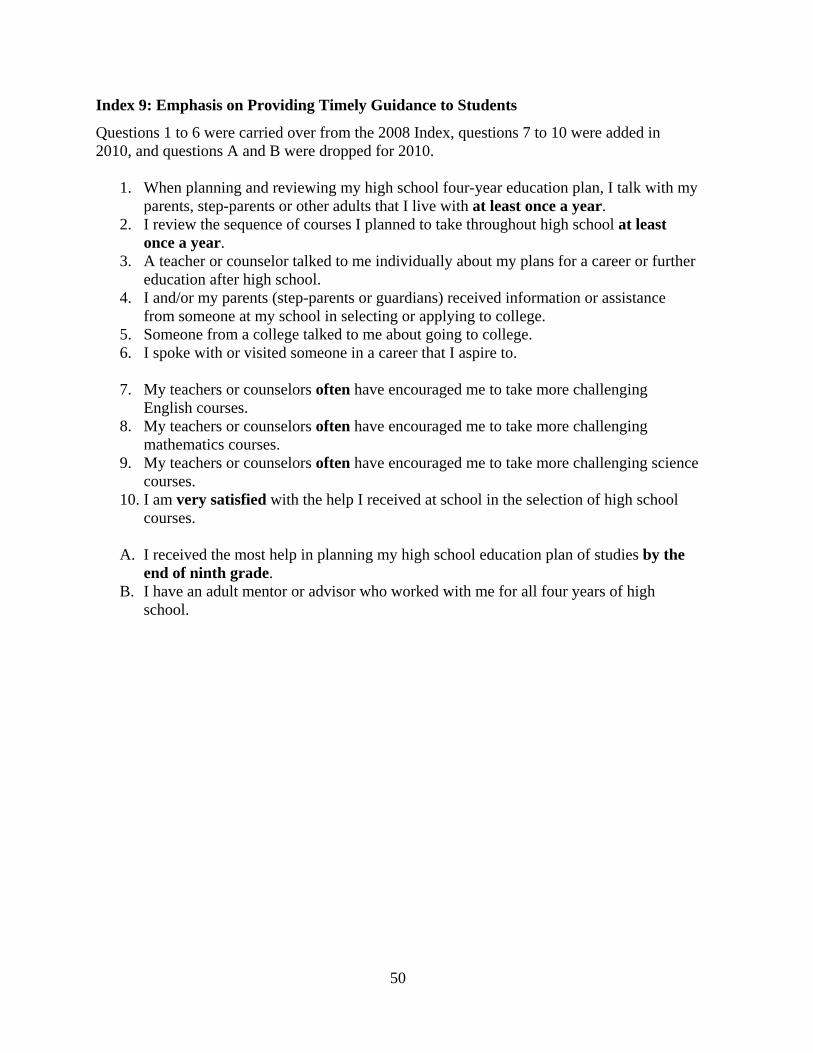
50
Index 9: Emphasis on Providing Timely Guidance to Students
Questions 1 to 6 were carried over from the 2008 Index, questions 7 to 10 were added in 2010, and questions A and B were dropped for 2010.
1. When planning and reviewing my high school four-year education plan, I talk with my parents, step-parents or other adults that I live with at least once a year.
2. I review the sequence of courses I planned to take throughout high school at least once a year.
3. A teacher or counselor talked to me individually about my plans for a career or further education after high school.
4. I and/or my parents (step-parents or guardians) received information or assistance from someone at my school in selecting or applying to college.
5. Someone from a college talked to me about going to college. 6. I spoke with or visited someone in a career that I aspire to.
7. My teachers or counselors often have encouraged me to take more challenging
English courses. 8. My teachers or counselors often have encouraged me to take more challenging
mathematics courses. 9. My teachers or counselors often have encouraged me to take more challenging science
courses. 10. I am very satisfied with the help I received at school in the selection of high school
courses.
A. I received the most help in planning my high school education plan of studies by the end of ninth grade.
B. I have an adult mentor or advisor who worked with me for all four years of high school.

51
Index 10: Perceived Importance of High School Studies
Questions 1 to 5 were carried over from the 2008 Index, questions 6 to 10 were added in 2010, and questions A to D were dropped for 2010.
1. I often have tried to do my best work in school. 2. It is very important to attend all of your classes. 3. It is very important to participate actively in class. 4. It is very important to study hard to get good grades. 5. It is very important to take a lot of college-preparatory classes.
6. I often know when projects are due. 7. I often actively manage my time in order to complete assignments. 8. I often keep my notes and handouts for each class separate. 9. It is very important to graduate from high school. 10. It is very important to continue my education beyond high school.
A. My teachers often care about me enough that they will not let me get by without doing
the work. (Moved to Index 1:High Expectations) B. Most of my teachers often have encouraged me to do well in school. (Moved to Index
1:High Expectations) C. My courses sometimes or often have been exciting and challenging. (Moved to Index
1:High Expectations) D. I never or seldom have failed to complete or turn in my assignments.

52
Index 11:Emphasis on Providing Quality Extra Help
Questions 1 to 4 were carried over from the 2008 Index, questions 5 and 6 were added in 2010, and no questions were dropped for 2010.
1. I often have been able to get extra help from my teachers when I need it without much difficulty.
2. Extra help I received often helps me to understand my schoolwork better. 3. Extra help I received often helps me to get better grades. 4. My teachers are frequently available before, during or after school to help me with
my studies.
5. My teachers often have encouraged students to help each other and to learn from each other.
6. Extra help I received often helps me to make a greater effort to meet expectations
Related Documents