Imaging, Diagnosis, Prognosis High-Risk Ovarian Cancer Based on 126-Gene Expression Signature Is Uniquely Characterized by Downregulation of Antigen Presentation Pathway Kosuke Yoshihara 1 , Tatsuhiko Tsunoda 3 , Daichi Shigemizu 3 , Hiroyuki Fujiwara 5 , Masayuki Hatae 6 , Hisaya Fujiwara 7 , Hideaki Masuzaki 8 , Hidetaka Katabuchi 9 , Yosuke Kawakami 10 , Aikou Okamoto 11 , Takayoshi Nogawa 15 , Noriomi Matsumura 16 , Yasuhiro Udagawa 17 , Tsuyoshi Saito 18 , Hiroaki Itamochi 19 , Masashi Takano 20 , Etsuko Miyagi 4 , Tamotsu Sudo 21 , Kimio Ushijima 22 , Haruko Iwase 12 , Hiroyuki Seki 23 , Yasuhisa Terao 13 , Takayuki Enomoto 24 , Mikio Mikami 25 , Kohei Akazawa 2 , Hitoshi Tsuda 14 , Takuya Moriya 26 , Atsushi Tajima 27 , Ituro Inoue 28 , and Kenichi Tanaka 1 for The Japanese Serous Ovarian Cancer Study Group Abstract Purpose: High-grade serous ovarian cancers are heterogeneous not only in terms of clinical outcome but also at the molecular level. Our aim was to establish a novel risk classification system based on a gene expression signature for predicting overall survival, leading to suggesting novel therapeutic strategies for high-risk patients. Experimental Design: In this large-scale cross-platform study of six microarray data sets consisting of 1,054 ovarian cancer patients, we developed a gene expression signature for predicting overall survival by applying elastic net and 10-fold cross-validation to a Japanese data set A (n ¼ 260) and evaluated the signature in five other data sets. Subsequently, we investigated differences in the biological characteristics between high- and low-risk ovarian cancer groups. Results: An elastic net analysis identified a 126-gene expression signature for predicting overall survival in patients with ovarian cancer using the Japanese data set A (multivariate analysis, P ¼ 4 10 20 ). We validated its predictive ability with five other data sets using multivariate analysis (Tothill’s data set, P ¼ 1 10 5 ; Bonome’s data set, P ¼ 0.0033; Dressman’s data set, P ¼ 0.0016; TCGA data set, P ¼ 0.0027; Japanese data set B, P ¼ 0.021). Through gene ontology and pathway analyses, we identified a significant reduction in expression of immune-response–related genes, especially on the antigen presentation pathway, in high-risk ovarian cancer patients. Conclusions: This risk classification based on the 126-gene expression signature is an accurate predictor of clinical outcome in patients with advanced stage high-grade serous ovarian cancer and has the potential to develop new therapeutic strategies for high-grade serous ovarian cancer patients. Clin Cancer Res; 18(5); 1374–85. Ó2012 AACR. Authors' Affiliations: 1 Department of Obstetrics and Gynecology, Niigata University Graduate School of Medical and Dental Sciences; 2 Department of Medical Informatics and Statistics, Niigata University Graduate School of Medical and Dental Sciences, Niigata; 3 Laboratory for Medical Informatics, Center for Genomic Medicine, RIKEN Yokohama Institute; 4 Department of Obstetrics and Gynecology, Yokohama City University Hospital, Yoko- hama; 5 Department of Obstetrics and Gynecology, Jichi Medical Univer- sity, Shimotsuke; 6 Department of Obstetrics and Gynecology, Kagoshima City Hospital, Kagoshima; 7 Department of Obstetrics and Gynecology, Hiroshima University Graduate School of Biomedical Sciences, Hiroshima; 8 Department of Obstetrics and Gynecology, School of Medicine, Nagasaki University, Nagasaki; 9 Department of Gynecology and Obstetrics, Faculty of Life Sciences, Kumamoto University, Kumamoto; 10 Department of Gynecology, National Hospital Organization, Kure Medical Center and Chugoku Cancer Center, Kure; 11 Department of Obstetrics and Gynecol- ogy, Jikei University School of Medicine; 12 Department of Gynecology, Cancer Institute Hospital; 13 Department of Obstetrics and Gynecology, Faculty of Medicine, Juntendo University; 14 Department of Pathology and Clinical Laboratories, National Cancer Center Hospital, Tokyo; 15 Department of Gynecology, National Hospital Organization, Shikoku Cancer Center, Matsuyama; 16 Department of Gynecology and Obstetrics, Kyoto University Graduate School of Medicine, Kyoto; 17 Department of Obstetrics and Gynecology, Fujita Health University School of Medicine, Toyoake; 18 Department of Obstetrics and Gynecology, Sapporo Medical University, Sapporo; 19 Department of Obstetrics and Gynecology, Tottori University School of Medicine, Yonago; 20 Department of Obstetrics and Gynecology, National Defense Medical College, Tokorozawa; 21 Depart- ment of Gynecologic Oncology, Hyogo Cancer Center, Akashi; 22 Depart- ment of Obstetrics and Gynecology, Kurume University School of Medi- cine, Kurume; 23 Department of Obstetrics and Gynecology, Saitama Med- ical Center, Saitama Medical University, Kawagoe; 24 Departments of Obstetrics and Gynecology, Osaka University Graduate School of Medi- cine, Suita; 25 Department of Obstetrics and Gynecology, Tokai University School of Medicine, Isehara; 26 Department of Pathology, Kawasaki Med- ical School, Kurashiki; 27 Department of Human Genetics and Public Health, Institute of Health Biosciences, The University of Tokushima Graduate School, Tokushima; and 28 Division of Human Genetics, National Institute of Genetics, Mishima, Japan Note: Supplementary data for this article are available at Clinical Cancer Research Online (http://clincancerres.aacrjournals.org/). The Japanese Ovarian Cancer Study Group listed in random order: Mitsuaki Suzuki (Jichi Medical University); Yoshitaka Onishi, Kazunobu Sueyoshi, and Sumika Matsukida (Kagoshima City Hospital); Yoshiki Kudo Clinical Cancer Research Clin Cancer Res; 18(5) March 1, 2012 1374 on May 24, 2020. © 2012 American Association for Cancer Research. clincancerres.aacrjournals.org Downloaded from Published OnlineFirst January 12, 2012; DOI: 10.1158/1078-0432.CCR-11-2725

Welcome message from author
This document is posted to help you gain knowledge. Please leave a comment to let me know what you think about it! Share it to your friends and learn new things together.
Transcript
Imaging, Diagnosis, Prognosis
High-Risk Ovarian Cancer Based on 126-Gene ExpressionSignature Is Uniquely Characterized by Downregulation ofAntigen Presentation Pathway
Kosuke Yoshihara1, Tatsuhiko Tsunoda3, Daichi Shigemizu3, Hiroyuki Fujiwara5, Masayuki Hatae6,Hisaya Fujiwara7, Hideaki Masuzaki8, Hidetaka Katabuchi9, Yosuke Kawakami10, Aikou Okamoto11,Takayoshi Nogawa15, Noriomi Matsumura16, Yasuhiro Udagawa17, Tsuyoshi Saito18, Hiroaki Itamochi19,Masashi Takano20, Etsuko Miyagi4, Tamotsu Sudo21, Kimio Ushijima22, Haruko Iwase12, Hiroyuki Seki23,Yasuhisa Terao13, Takayuki Enomoto24, Mikio Mikami25, Kohei Akazawa2, Hitoshi Tsuda14, Takuya Moriya26,Atsushi Tajima27, Ituro Inoue28, and Kenichi Tanaka1 for The Japanese Serous Ovarian Cancer Study Group
AbstractPurpose:High-grade serous ovarian cancers are heterogeneous not only in terms of clinical outcome but
also at the molecular level. Our aim was to establish a novel risk classification system based on a gene
expression signature for predicting overall survival, leading to suggesting novel therapeutic strategies for
high-risk patients.
Experimental Design: In this large-scale cross-platform study of six microarray data sets consisting of
1,054 ovarian cancer patients, we developed a gene expression signature for predicting overall survival by
applying elastic net and 10-fold cross-validation to a Japanese data set A (n ¼ 260) and evaluated the
signature in five other data sets. Subsequently, we investigated differences in the biological characteristics
between high- and low-risk ovarian cancer groups.
Results:Anelastic net analysis identified a 126-gene expression signature for predicting overall survival in
patients with ovarian cancer using the Japanese data set A (multivariate analysis, P ¼ 4 � 10�20). We
validated its predictive ability with five other data sets usingmultivariate analysis (Tothill’s data set, P¼ 1�10�5; Bonome’s data set, P¼ 0.0033; Dressman’s data set, P¼ 0.0016; TCGA data set, P¼ 0.0027; Japanese
data set B, P¼ 0.021). Through gene ontology and pathway analyses, we identified a significant reduction in
expression of immune-response–related genes, especially on the antigen presentation pathway, in high-risk
ovarian cancer patients.
Conclusions: This risk classification based on the 126-gene expression signature is an accurate predictor
of clinical outcome in patients with advanced stage high-grade serous ovarian cancer and has the potential
to develop new therapeutic strategies for high-grade serous ovarian cancer patients. Clin Cancer Res; 18(5);
1374–85. �2012 AACR.
Authors' Affiliations: 1Department of Obstetrics and Gynecology, NiigataUniversity Graduate School of Medical and Dental Sciences; 2DepartmentofMedical Informatics andStatistics,NiigataUniversityGraduateSchool ofMedical and Dental Sciences, Niigata; 3Laboratory forMedical Informatics,Center for Genomic Medicine, RIKEN Yokohama Institute; 4Department ofObstetrics and Gynecology, Yokohama City University Hospital, Yoko-hama; 5Department of Obstetrics and Gynecology, Jichi Medical Univer-sity, Shimotsuke; 6Department of Obstetrics and Gynecology, KagoshimaCity Hospital, Kagoshima; 7Department of Obstetrics and Gynecology,HiroshimaUniversity Graduate School of Biomedical Sciences, Hiroshima;8Department of Obstetrics and Gynecology, School of Medicine, NagasakiUniversity, Nagasaki; 9Department of Gynecology and Obstetrics, Facultyof Life Sciences, Kumamoto University, Kumamoto; 10Department ofGynecology, National Hospital Organization, Kure Medical Center andChugoku Cancer Center, Kure; 11Department of Obstetrics and Gynecol-ogy, Jikei University School of Medicine; 12Department of Gynecology,Cancer Institute Hospital; 13Department of Obstetrics and Gynecology,Faculty of Medicine, Juntendo University; 14Department of Pathologyand Clinical Laboratories, National Cancer Center Hospital, Tokyo;15Department of Gynecology, National Hospital Organization, ShikokuCancer Center, Matsuyama; 16Department of Gynecology and Obstetrics,Kyoto University Graduate School of Medicine, Kyoto; 17Department ofObstetrics and Gynecology, Fujita Health University School of Medicine,
Toyoake; 18Department of Obstetrics and Gynecology, Sapporo MedicalUniversity, Sapporo; 19Department of Obstetrics and Gynecology, TottoriUniversity School of Medicine, Yonago; 20Department of Obstetrics andGynecology, National Defense Medical College, Tokorozawa; 21Depart-ment of Gynecologic Oncology, Hyogo Cancer Center, Akashi; 22Depart-ment of Obstetrics and Gynecology, Kurume University School of Medi-cine, Kurume; 23Department of Obstetrics and Gynecology, Saitama Med-ical Center, Saitama Medical University, Kawagoe; 24Departments ofObstetrics and Gynecology, Osaka University Graduate School of Medi-cine, Suita; 25Department of Obstetrics and Gynecology, Tokai UniversitySchool of Medicine, Isehara; 26Department of Pathology, Kawasaki Med-ical School, Kurashiki; 27Department ofHumanGenetics andPublicHealth,Institute of Health Biosciences, The University of Tokushima GraduateSchool, Tokushima; and 28Division ofHumanGenetics,National Institute ofGenetics, Mishima, Japan
Note: Supplementary data for this article are available at Clinical CancerResearch Online (http://clincancerres.aacrjournals.org/).
The Japanese Ovarian Cancer Study Group listed in random order:
Mitsuaki Suzuki (Jichi Medical University); Yoshitaka Onishi, KazunobuSueyoshi, and SumikaMatsukida (Kagoshima City Hospital); Yoshiki Kudo
ClinicalCancer
Research
Clin Cancer Res; 18(5) March 1, 20121374
on May 24, 2020. © 2012 American Association for Cancer Research. clincancerres.aacrjournals.org Downloaded from
Published OnlineFirst January 12, 2012; DOI: 10.1158/1078-0432.CCR-11-2725

IntroductionHigh-grade serous ovarian cancer comprises approxi-
mately 40% of epithelial ovarian cancer cases and is themost aggressive histologic type (1–4). This type of cancerusually presents as advanced stage disease at the time ofdiagnosis because there are no symptoms present at theearly stage and no reliable screening test for early detection(1–4). Patients with advanced stage high-grade serous ovar-ian cancer generally undergo primary debulking surgeryfollowed by platinum–taxane chemotherapy. However,30% to 40% of patients recur within 12 months after thestandard treatment, and the overall 5-year survival rateremains at approximately 30% (5, 6). Clinicopathologiccharacteristics, such as the International Federation ofGynecology and Obstetrics (FIGO) stage, histologic grade,and debulking status after primary surgery, are clinicallyconsidered important clinical prognostic indicators of ovar-ian cancer but are insufficient for predicting survival time.The development of microarray technology has provided
new insights into cancer diagnosis and treatment. Large-scale microarray studies in breast cancer have succeeded inclarifying 5 molecular subtypes based on gene expressionprofiles and in developing genomic biomarker for predict-ing recurrence in early breast cancer (MammaPrint; refs. 7,8). Thus, breast cancer treatment strategies are being strat-ified according to molecular characteristics. In contrast,there are no gene expression signatures with high accuracy
and reproducibility for clinical diagnosis and managementin patients with ovarian cancer because there is a paucity ofovarian cancer samples available for microarray analysiscomparedwith breast cancer. Although TP53 somaticmuta-tion is present in almost all high-grade serous ovariancancer and plays an important role in the pathogenesis(9, 10), high-grade serous ovarian cancer exhibits muchbiological and molecular heterogeneity that should beconsidered when developing a novel therapeutic strategyfor ovarian cancer (10, 11).
In this study, we aimed to establish a novel system forpredicting the prognosis of patients with advanced stagehigh-grade serous ovarian cancer using large-scale micro-array data sets (n ¼ 1,054; refs. 10–13), leading to anoptimal treatment based on molecular characteristics (14).
Materials and MethodsClinical samples
Three hundred Japanese patients who were diagnosedwith advanced stage high-grade serous ovarian cancerbetween July 1997 and June 2010 were included in thisstudy. All patients provided written informed consent forthe collection of samples and subsequent analysis. Fresh-frozen samples were obtained from primary tumor tissuesduring debulking surgery prior to chemotherapy. Allpatients with advanced stage high-grade serous ovariancancer were treated with platinum–taxane standard chemo-therapy after surgery. In principle, patients were seen every 1to 3 months for the first 2 years. Thereafter, follow-up visitshad an interval of 3 to 6months in the third to fifth year, and6 to 12months in the sixth to tenth year. At every follow-upvisit, general physical and gynecologic examinations werecarried out. CA125 serum levels were routinely determined.
Staging of the disease was assessed according to thecriteria of the FIGO (15). Optimal debulking surgery wasdefined as less than 1 cm of gross residual disease, andsuboptimal debulking surgery was defined as more than 1cm of residual disease. Progression-free survival time wascalculated as the interval from primary surgery to diseaseprogression or recurrence. Based on the Response Evalua-tion Criteria in Solid Tumors (RECIST, version 1.1; 16),disease progression was defined as at least a 20% increase inthe sum of the diameters of target lesions, as unequivocalprogression of existing nontarget lesions, or as the appear-ance of one or more new lesions. Overall survival time wascalculated as the interval from primary surgery to the deathdue to ovarian cancer.
Translational RelevanceUsing large-scale microarray expression data sets (n¼
1,054) by applying an elastic net method, a novel riskclassification system for predicting overall survival ofpatients with advanced stage high-grade serous ovariancancer based on a 126-gene expression signature wasdeveloped and successfully validated. This study hasprofound significance in clarifying the downregulationof human leukocyte antigen class I antigen presentationmachinery that characterizes high-risk ovarian cancer.These results from comprehensive gene expression anal-ysis using large-scale microarray data suggest that ourrisk classification system might have the potential tooptimize treatment of high-grade serous ovarian cancerpatients.
(Hiroshima University); Hironori Tashiro (Kumamoto University); TomoyaMizunoe (Kure Medical Center and Chugoku Cancer Center); JunzoKigawa, KanaeNosaka, andHisao Ito (Tottori University); Sohei YamamotoandHideyuki Shimazaki (National DefenseMedical College); Ken Takizawa(Cancer Institute Hospital); Kiyoko Kato and Satoru Takeda (JuntendoUniversity); Yutaka Ueda, Yukari Miyoshi, Toshihiro Kimura, and TadashiKimura (Osaka University); Sosuke Adachi, Koji Nishino, Takehiro Ser-ikawa, Tetsuro Yahata, Junko Sakurada, Go Hasegawa, and NobutakaKitamura (Niigata University).
Corresponding Author: Kenichi Tanaka, Niigata University GraduateSchool of Medical and Dental Sciences, 1-757 Asahimachi-dori, Chuo-ku, Niigata 951-8510, Japan. Phone: 81-25-227-2317; Fax: 81-25-227-0789; E-mail: [email protected]
doi: 10.1158/1078-0432.CCR-11-2725
�2012 American Association for Cancer Research.
Novel Risk Classification in Ovarian Cancer
www.aacrjournals.org Clin Cancer Res; 18(5) March 1, 2012 1375
on May 24, 2020. © 2012 American Association for Cancer Research. clincancerres.aacrjournals.org Downloaded from
Published OnlineFirst January 12, 2012; DOI: 10.1158/1078-0432.CCR-11-2725
The histologic characteristics of surgically resected speci-mens, which were diagnosed as serous histologic type by 2pathologists at each institute, were at first assessed onformalin-fixed and paraffin-embedded hematoxylin andeosin sections by 8 gynecologic pathologists who belongto Department of Pathology in 4 institutes (Niigata Uni-versity, National Defense Medical Collage, Tottori Univer-sity, Kagoshima City Hospital). Next, these sections werereviewed under central pathologic review by 2 independentgynecologic pathologists (H.T. and T.M.) with no knowl-edge of patients’ clinical data. Histologic subtype was diag-nosed based onWHO classification of ovarian tumors (17).The degree of histologic differentiation is determinedaccording to Silverberg classification (18).
Microarray experimentsFrozen tissues containing more than 70% tumor cells
upon histologic evaluation were used for RNA extraction.Total RNA was extracted from tissue samples as previouslydescribed (19). Five hundred nanograms of total RNA wasconverted into labeled cRNA with nucleotides coupled to acyanine 3-CTP (Cy3; PerkinElmer) using the Quick AmpLabeling Kit, one-color (Agilent Technologies). Cy3-labeledcRNA (1.65 mg) was hybridized for 17 hours at 65�C toan Agilent Whole Human Genome Oligo Microarray(G4112F), which carries 60-mer probes to more than40,000 human transcripts. The hybridized microarray waswashed and then scanned in Cy3 channel with the AgilentDNA Microarray Scanner [model G2565CA, n ¼ 260 (Jap-anese data set A); G2565AA, n ¼ 40 (Japanese data set B)].Signal intensity per spot was generated from the scannedimage with Feature Extraction Software (version 10.1, Jap-anese data set A; version 9.1, Japanese data set B; AgilentTechnologies) with default settings. Spots that did not passquality control procedures were flagged as "Not Detected."
Next, we obtained Affymetrix HG-U133Plus2.0 micro-array (Affymetrix) data from 10 ovarian cancer samples thathad been already been analyzed by the Agilent WholeHuman Genome Oligo Microarray. Ten ovarian cancersamples were randomly selected from 260 samples in theJapanese data set A. Microarray experiments were carriedout according to the Affymetrix-recommended protocols.Briefly, biotinylated cRNAs were synthesized by GeneChip30IVT Express Kit (Affymetrix) from 250 ng total RNAaccording to the manufacturer’s instructions. BiotinylatedcRNA yield were checked with the NanoDrop ND-1000Spectrophotometer. Following fragmentation, 10 mg ofcRNA were hybridized for 16 hours at 45�C on GeneChipHuman Genome U133 Plus 2.0 Array. GeneChips werewashed and stained in the Affymetrix Fluidics Station450, and scanned with GeneChip Scanner 3000 7G.
The MIAME-compliant microarray data were depositedinto the Gene Expression Omnibus data repository (acces-sion number GSE32062 and GSE32063).
Microarray data analysisWeprepared 2 ourmicroarray data sets [Japanese data set
A (n ¼ 260) and B (n ¼ 40)] and 4 publicly available large
sample-sized (n > 100) microarray data sets [TCGA data set(http://tcga-data.nci.nih.gov/tcga/tcgaHome2.jsp; ref. 11),Tothill’s data set (GSE9891; ref. 12), Bonome’s data set(GSE26712; ref. 13), and Dressman’s data set (14)] todiscover predictive biomarkers. Clinical information ofpublicly available microarray data sets was obtained fromtheir articles andwebsites. FromTothill’s original data set (n¼ 285), we selected 131 samples that (i) were diagnosed asadvanced stage serous adenocarcinoma, (ii) were treated byplatinum/taxane–based chemotherapy, and (iii) have clin-ical data about onset age, stage, grade, surgery, and survivaltime. Publicly available clinical information in TCGA wasdownloaded from TCGA Data portal (http://tcga-data.nci.nih.gov/tcga/tcgaHome2.jsp) at June 25, 2011. By the samemethods above, 319 samples were selected from562micro-array data as TCGA data set (Affymetrix HT-HG-U133A).In this study, patients who were treated by adjuvantchemotherapy including molecular-targeted agents wereexcluded.
On the Agilent platform, data normalization was carriedout in GeneSpring GX 11.5 (Agilent Technologies) as fol-lows: (i) threshold raw signals were set to 1.0 and (ii) 75thpercentile normalization. Affymetrix microarray data werenormalized and summarized with robust multiple averagein GeneSpring GX 11.5 (Agilent Technologies). To comparethemicroarray data setsmeasuredwith 4different platforms(Agilent Whole Human Genome Oligo Microarray, Affy-metrixHG-U133A,HG-U133Plus2.0, andHT-HG-U133A),we selected genes common to all platforms based on theEntrez Gene ID and used the Median Rank Score method(20) for cross-platform normalization (Supplementary Fig.S1). Of 22,277 probes that were common among 3 Affy-metrix platforms, 20,331 probes were selected to be in oneto one relation between probe and gene. Using translationfunction based on Entrez Gene ID in GeneSpring GX 11.5,the 19,704 transcripts that matched to the 20,331 probes ofthe Affymetrix platform were extracted from all transcriptson the Agilent platform. Considering differences in micro-array platforms, coefficient of correlation (r) in each genebetween 2 microarray platforms were measured. Using 10ovarian cancer microarray data obtained from both AgilentWhole Human Genome Oligo Microarray and AffymetrixHG-U133Plus2.0 (GSE32062), 9,141 genes with high cor-relation (r > 0.8) were extracted. After Median Rank Scoreanalysis (20), we evaluated median value of each gene inboth platforms and selected 3,553 genes with high corre-lation (r > 0.8) in which absolute value of subtractingmedian values between 2 platforms was less than 1. Similaranalyses were conducted by 16 breast cancer microarraydata (GSE17700; ref. 21) from both Affymetrix HG-U133Plus2.0 and HG-U133A. From the resulting 1,746genes, we removed 60 that were not flagged as "Detected"in more than 90% of the Japanese data set A samples (n ¼260), considering them to have either missing or uncertainexpression signals. In addition, the data were normalizedper gene in each data set by transforming the expression ofeach gene to obtain a mean of 0 and SD of 1 (Z-transfor-mation) for the cross-platform study.
Yoshihara et al.
Clin Cancer Res; 18(5) March 1, 2012 Clinical Cancer Research1376
on May 24, 2020. © 2012 American Association for Cancer Research. clincancerres.aacrjournals.org Downloaded from
Published OnlineFirst January 12, 2012; DOI: 10.1158/1078-0432.CCR-11-2725
We analyzed Japanese data set A as a "training set,"Tothill’s data set as a "test set," and the other 4 data sets as"validation sets." We applied elastic net analysis (22) withthe R (23) package glmnet to identify survival-relatedgenes for prediction of prognosis in patients withadvanced stage high-grade serous ovarian cancer. Using10-fold cross-validation, we obtained regression coeffi-cients with optimal penalty parameter for the penalizedCox model, and calculated a prognostic index for eachpatient as defined by
Prognostic index ¼X126
i¼1
bi � Xi
where i is the estimated regression coefficient of each genein the Japanese data set A under elastic net (a¼ 0.05) andXi is the Z-transformed expression value of each gene. Theestimated regression coefficient of each survival-relatedgene given by elastic net (a ¼ 0.05) in the Japanese dataset A was also applied to calculate a prognostic index foreach patient in 5 other data sets using the equation above.We classified all patients into the 2 groups (high- and low-risk groups) by the optimal cutoff value of the prognosticindex in the Japanese data set A. Patients were assignedto the "high-risk" group if their prognostic index wasmore than or equal to cutoff value of prognostic index,whereas "low-risk" group was composed of cases with theprognostic indices that were less than cutoff value.Because risk classification divided by cutoff value0.1517 indicated a minimum P value (P ¼ 1 � 10�30)when log-rank test was used to compare differences inoverall survival between high- and low-risk groups in theJapanese data set A, this value was determined as optimalcutoff value.Both hierarchical clustering and non-negative factoriza-
tion (NMF) algorithm (24) were used to assess the similarityof gene expressionprofiles among126 survival-related genes.In the 2 major data sets (Japanese data set A and TCGA dataset), we constructed a heat map with hierarchical clusteringfor both samples and genes using Cluster 3.0 (http://bonsai.hgc.jp/~mdehoon/software/cluster/software.htm). Correla-tion (centered) and complete linkage were selected on sim-ilarity metrics and clustering method, respectively. A heatmap was visualized with Java TreeView (http://jtreeview.sourceforge.net/). NMF-consensus matrices averaging 50connectivity matrices were computed at K ¼ 2–7 (as thenumber of subclasses modeled) for 126 genes. With genesappearing along both the horizontal and vertical axes of theconsensusmatrices, consistency in the gene-pair clusters wasvisualized. We determined the optimal number of geneclusters by the cophenetic correlation coefficient that pro-vides a scalar summary of global clustering robustness acrossthe consensus matrix in the Japanese data set A and TCGAdata set.We conducted a volcano plot analysis to extract differ-
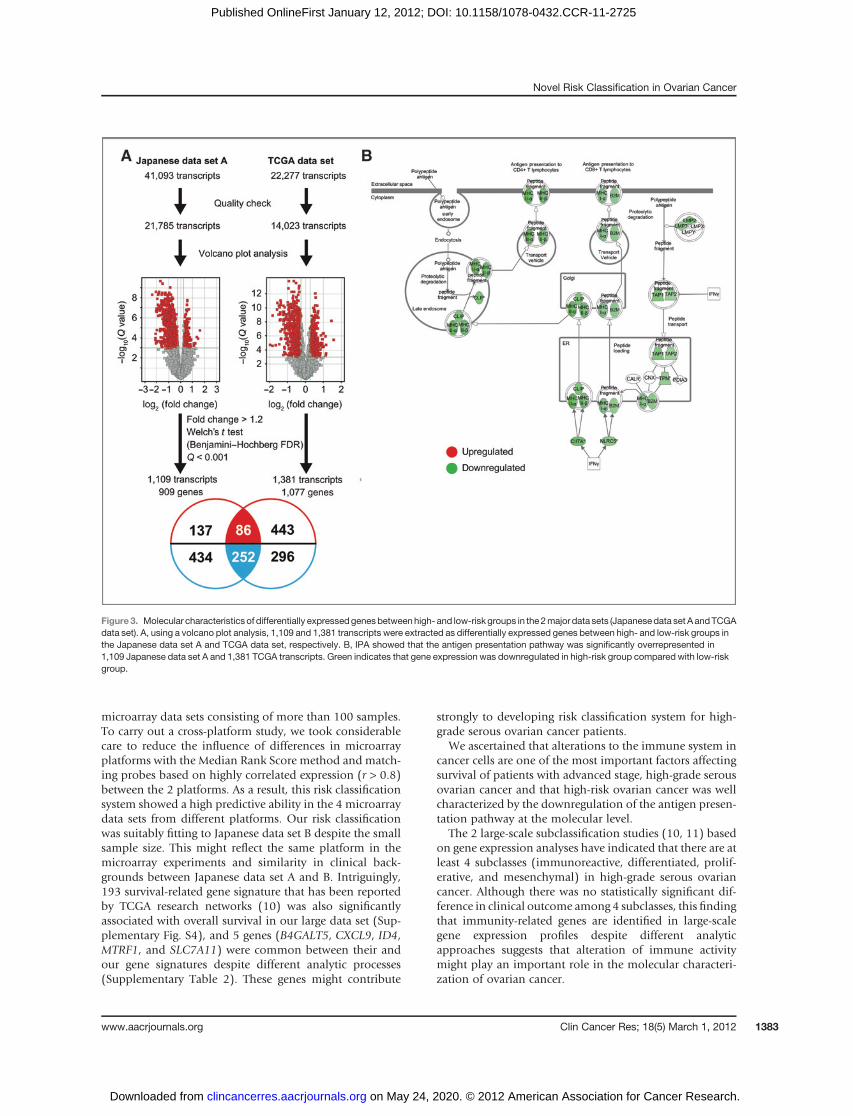
entially expressed transcripts between high- and low-riskovarian cancer groups with the 2 major data sets[Japanese data set A (n ¼ 260) and TCGA data set (n ¼
319)]. When the volcano plot analysis was conducted inGeneSpring GX 11.5 (Agilent Technologies), we usedgene expression data prior to Z-transformation normal-ization (Fig. 3).
To investigate the biological functions of gene expressionsignatures, we used GO Ontology Browser, embedded inGeneSpring GX11.5 (Agilent Technologies). The GOOntol-ogy Browser was used to analyze which categories of geneontology were statistically overrepresented among the genelist obtained. Statistical significance was determined byFisher exact test, followed by multiple testing corrections bythe Benjamini and Yekutieli false discovery ratemethod (25)To avoid bias of gene extraction by volcano plot analysis inGO analysis, Gene Set Enrichment Analysis (GSEA; ref. 26)was conducted with genes prior to gene selection by volcanoplot analysis. Analysis settings in GSEA (software version2.07) were as follows: (i) gene sets database: c5.all.v2.5.symbols.gmt [gene ontology], (ii) number of permutations:1,000, (iii) collapse data set to gene symbol: true, (iv)permutation type: phenotype, (v) chip platform(s): Agi-lent_HumanGenome.chip orHT_HG_U133A.chip, and (vi)other settings: default.
Furthermore, we used the Core Analysis tool in theIngenuity Pathway Analysis (IPA) system to analyze net-works and pathways for a set of genes. Q value was calcu-lated by Fisher exact test with the Benjamini and Hochbergcorrection (27). Q < 0.25 was considered as significant inGO, GSEA, and IPA.
Single-nucleotide polymorphism array experimentsWe isolated genomic DNA from tumor tissues with a
phenol-chloroform extraction method and from normallymphocytes using the QIAampDNA BloodMaxi Kit (QIA-GEN). Single-nucleotide polymorphism (SNP) arrayexperiments with the Genome-Wide Human SNP Array6.0 (Affymetrix) were carried out at Niigata University(details in the Supplementary Methods). SNP array datawere analyzed by the Partek Genomic Suite 6.5 (Partek Inc.)to investigate copy number variations in 30 genes involvedin the antigen presentation pathway.
Immunoshitochemical analysisA monoclonal anti-human CD8 antibody (M7103;
1:100; DAKO)was used for immunohistochemical stainingof CD8 T lymphocyte in tumor tissues. Details of theimmunohistochemistry method and sample selections aredescribed in the Supplementary Methods.
Statistical analysisStandard statistical tests including Pearson correlation
analysis, unpaired t tests, 1-way ANOVA, Fisher exact tests,log-rank tests, and Cox proportional hazardmodel analysiswere used to analyze the clinical data, as appropriate.Analyses of clinical data were conducted with JMP (version8; SAS Institute) and GraphPad PRISM (version 4.0; Graph-Pad Software).
Novel Risk Classification in Ovarian Cancer
www.aacrjournals.org Clin Cancer Res; 18(5) March 1, 2012 1377
on May 24, 2020. © 2012 American Association for Cancer Research. clincancerres.aacrjournals.org Downloaded from
Published OnlineFirst January 12, 2012; DOI: 10.1158/1078-0432.CCR-11-2725

ResultsThe distribution of the clinical variables for each micro-
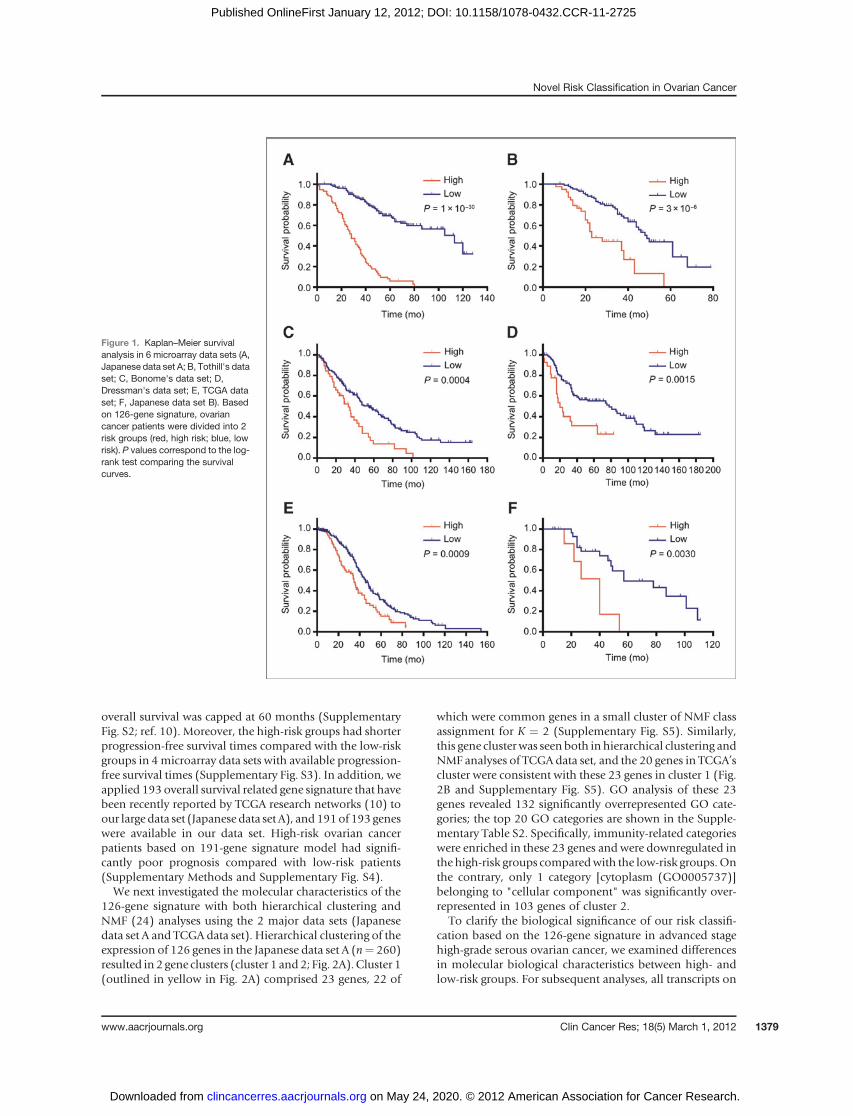
array data set is shown in Table 1. To compare themicroarray data sets measured with 4 different platforms,1,686 genes were selected (Supplementary Fig. S1). Anelastic net analysis (22) using 10-fold cross-validation onJapanese data set A (training set, n ¼ 260) identified a126-gene signature for predicting overall survival inpatents with advanced stage high-grade serous ovariancancer (Supplementary Table S1). After calculating theprognostic index for each sample from the 126-geneexpression signature as reported previously (19), wedivided the training set into high- and low-risk groupsbased on the optimal cutoff value (0.1517) of the prog-nostic index and verified the high predictive power of thisrisk classification (log-rank P ¼ 1 � 10�30; MultivariateCox P ¼ 4 � 10�20; HR ¼ 6.203; 95% CI ¼ 4.239–9.123; Fig. 1A and Table 2).
The predictive power of the 126-gene signature was testedwith Tothill’s data set (n¼ 131; ref. 12). Both Kaplan–Meiersurvival and multivariate analysis showed that this riskclassification was significantly associated with overall sur-vival time in Tothill’s data set (log-rank P ¼ 3 � 10�6;Multivariate Cox P ¼ 1 � 10�5; HR ¼ 3.728; 95% CI ¼2.110–6.532; Fig. 1B and Table 2). Next, we assessed thepredictive power of the 126-gene expression signature onthe 3 data sets inwhichmicroarray data were obtained fromAffymetrix platforms and confirmed that this risk classifi-cation indicated similar results in the 3 data sets (Fig. 1C–Eand Table 2). Furthermore, to exclude the influence ofdifferences in microarray platforms, we prepared Japanesedata set B from the sameplatformas the training set.Despitethe small sample size, our risk classification showed asignificant association with overall survival time in theJapanese data set B (Fig. 1F and Table 2). This risk classi-fication showed high predictive accuracy even though
Table 1. Clinicopathologic characteristics in 6 microarray data sets
Data setJapanesedata set A
Tothill'sdata seta
Bonome'sdata seta
Dressman'sdata seta
TCGAdata setc
Japanesedata set B
Number 260 131 185 119 319 40Age 58.2 � 10.8 58.4 � 9.8 62 � 12 N/Ab 59.5 � 11.3 56.2 � 9.6HistologySerous 260 131 166 119 319 40Others 0 0 19 0 0 0
StageIII 204 123 144 99 267 31IV 56 8 41 20 52 9
Grade Silverberg Silverberg N/Ab N/Ab N/Ab Silverberg1 0 0 0 3 0 02 131 51 40 57 29 233 129 80 144 59 289 174 — — 3 — 1 —
Surgery statusOptimal 103 78 92 63 236 19Suboptimal 157 45 93 56 83 21
ChemotherapyPlatinum 260 131 185 119 319 40Taxane 260 131 N/A 82 319 40
Follow-up period (mo)Median 42 29 38 34 31 39Range 1–128 6–79 1–164 1–185 1–154 7–111
Number of deaths 121 60 129 69 187 22Median survival (mo) 60 44 46 69 42 54Microarray platform Agilent Whole
Human GenomeOligo Microarray
AffymetrixHG-U133Plus2.0
AffymetrixHG-U133A
AffymetrixHG-U133A
AffymetixHT-HG-U133A
Agilent WholeHuman GenomeOligo Microarray
aClinical information in these 3 data sets were obtained from their articles and website.bNo available information was described as N/A.cPublicly available clinical information in TCGA was downloaded from TCGA Data portal (http://tcga-data.nci.nih.gov/tcga/tcga-Home2.jsp) at June 25, 2011.
Yoshihara et al.
Clin Cancer Res; 18(5) March 1, 2012 Clinical Cancer Research1378
on May 24, 2020. © 2012 American Association for Cancer Research. clincancerres.aacrjournals.org Downloaded from
Published OnlineFirst January 12, 2012; DOI: 10.1158/1078-0432.CCR-11-2725
overall survival was capped at 60 months (SupplementaryFig. S2; ref. 10). Moreover, the high-risk groups had shorterprogression-free survival times compared with the low-riskgroups in 4microarray data sets with available progression-free survival times (Supplementary Fig. S3). In addition, weapplied 193 overall survival related gene signature that havebeen recently reported by TCGA research networks (10) toour large data set (Japanese data set A), and 191of 193 geneswere available in our data set. High-risk ovarian cancerpatients based on 191-gene signature model had signifi-cantly poor prognosis compared with low-risk patients(Supplementary Methods and Supplementary Fig. S4).We next investigated the molecular characteristics of the
126-gene signature with both hierarchical clustering andNMF (24) analyses using the 2 major data sets (Japanesedata set A and TCGA data set). Hierarchical clustering of theexpression of 126 genes in the Japanese data set A (n¼ 260)resulted in 2 gene clusters (cluster 1 and2; Fig. 2A).Cluster 1(outlined in yellow in Fig. 2A) comprised 23 genes, 22 of
which were common genes in a small cluster of NMF classassignment for K ¼ 2 (Supplementary Fig. S5). Similarly,this gene clusterwas seen both in hierarchical clustering andNMF analyses of TCGA data set, and the 20 genes in TCGA’scluster were consistent with these 23 genes in cluster 1 (Fig.2B and Supplementary Fig. S5). GO analysis of these 23genes revealed 132 significantly overrepresented GO cate-gories; the top 20 GO categories are shown in the Supple-mentary Table S2. Specifically, immunity-related categorieswere enriched in these 23 genes and were downregulated inthe high-risk groups comparedwith the low-risk groups.Onthe contrary, only 1 category [cytoplasm (GO0005737)]belonging to "cellular component" was significantly over-represented in 103 genes of cluster 2.
To clarify the biological significance of our risk classifi-cation based on the 126-gene signature in advanced stagehigh-grade serous ovarian cancer, we examined differencesin molecular biological characteristics between high- andlow-risk groups. For subsequent analyses, all transcripts on
Figure 1. Kaplan–Meier survivalanalysis in 6 microarray data sets (A,Japanese data set A; B, Tothill's dataset; C, Bonome's data set; D,Dressman's data set; E, TCGA dataset; F, Japanese data set B). Basedon 126-gene signature, ovariancancer patients were divided into 2risk groups (red, high risk; blue, lowrisk). P values correspond to the log-rank test comparing the survivalcurves.
Novel Risk Classification in Ovarian Cancer
www.aacrjournals.org Clin Cancer Res; 18(5) March 1, 2012 1379
on May 24, 2020. © 2012 American Association for Cancer Research. clincancerres.aacrjournals.org Downloaded from
Published OnlineFirst January 12, 2012; DOI: 10.1158/1078-0432.CCR-11-2725

each platformwere used to avoid the previous gene numberlimitations, which were for the cross-platform study. Weextracted the genes differentially expressed between the 2groups by carrying out a volcano plot analysis with the 2major data sets (Japanese data set A and TCGA data set;Supplementary Table S3). Figure 3A shows that 1,109 and1,381 transcripts were differentially expressed between thehigh- and low-risk groups in the Japanese data set A andTCGA data set, respectively. GO analysis of these transcriptsindicated that 9 out of 20 top-ranked GO categories werecommon between both data sets and involved in theimmune system (Table 3 and 4).
To exclude the influence of cutoff in fold change or Pvalue in volcano plot analysis, we reevaluated differences inthe biological characteristics between high- and low-riskgroups using GSEA (26). Four immunity-related GO cate-gories (immune system response, immune response,defense response, and inflammatory response) were alsoincluded in the list of 20 top-ranked GO categories whenGSEAwas carried out with 21,785 (Japanese data set A) and14,023 (TCGA data set) transcripts prior to gene extraction(Supplementary Table S4).
Furthermore, possible functional relations among differ-entially expressed genes betweenhigh- and low-groupswere
investigated with pathway analysis. Of 20 top-ranked path-ways notably enriched in 1,109 transcripts of the Japanesedata set A and 1,381 transcripts of the TCGA data set, 14pathways were common between both data sets (Supple-mentary Table S5). In particular, the antigen presentationpathway (Fig. 3B) was the most significantly overrepresent-ed pathway in the 2 data sets (Japanese data set A,Q¼ 2.0�10�29; TCGA data set, Q ¼ 5.0 � 10�14). In the antigenpresentation pathway, 30 transcripts in this pathway weresignificantly downregulated in the high-risk group (Fig. 3Band Supplementary Table S6).We further examined wheth-er molecular defects of human leukocyte antigen (HLA)class I antigen presentation machinery components werecaused by structural alterations using SNP array data. OurSNP array data showed that genes of HLA class I antigenpresentation machinery were not deleted (SupplementaryTable S6). In the TCGA data set, only 10% of cases (24 of242) had deletions in HLA class I genes. On the other hand,89% of high-risk cases (55 of 62) without deletion in HLAclass I genes showed significantly lower expressions in HLAclass I genes compared with those in low-risk groups (Sup-plementary Fig. S6).
On thebasis of this result,we assessed the status of tumor-infiltrating lymphocyte reflecting an immune response
Table 2. Univariate and multivariate Cox's proportional hazard model analysis of prognostic factors foroverall survival
Univariate analysis
P
Multivariate analysis
PHR (95% CI) HR (95% CI)
Japanese data set AAge 1.011 (0.993–1.029) 0.21 1.006 (0.988–1.024) 0.52Stage IV (vs. stage III) 1.465 (0.968–2.165) 0.07 1.340 (0.884–1.984) 0.16Optimal surgery (vs. suboptimal) 0.499 (0.334–0.730) 0.0003 0.643 (0.428–0.949) 0.026High (vs. low) 6.823 (4.692–9.972) 2 � 10�22 6.203 (4.239–9.123) 4 � 10�20
Tothill's data setAge 1.005 (0.977–1.035) 0.73 1.006 (0.978–1.035) 0.67Stage IV (vs. stage III) 2.264 (0.785–5.176) 0.12 2.951 (0.983–7.235) 0.053Optimal surgery (vs. suboptimal) 0.887 (0.525–1.517) 0.66 0.910 (0.528–1.592) 0.74High (vs. low) 3.443 (1.967–5.962) 3 � 10�5 3.728 (2.110–6.532) 1 � 10�5
Bonome's data setOptimal surgery (vs. suboptimal) 0.592 (0.414–0.840) 0.0032 0.628 (0.438–0.894) 0.0097High (vs. low) 2.034 (1.341–3.012) 0.0011 1.897 (1.247–2.818) 0.0033
Dressman's data setOptimal surgery (vs. suboptimal) 0.685 (0.425–1.102) 0.12 0.602 (0.370–0.977) 0.04High (vs. low) 2.397 (1.335–4.140) 0.0042 2.687 (1.480–4.705) 0.0016
TCGA data setAge 1.014 (1.001–1.028) 0.038 1.011 (0.997–1.025) 0.13Stage IV (vs. stage III) 1.018 (0.683–1.469) 0.93 1.034 (0.692–1.499) 0.86Optimal surgery (vs. suboptimal) 0.909 (0.668–1.254) 0.56 0.903 (0.654–1.261) 0.54High (vs. low) 1.712 (1.234–2.345) 0.0015 1.680 (1.202–2.321) 0.0027
Japanese data set BAge 1.059 (1.007–1.118) 0.024 1.058 (0.999–1.131) 0.057Stage IV (vs. stage III) 1.696 (0.542–4.501) 0.34 2.998 (0.808–10.60) 0.098Optimal surgery (vs. suboptimal) 0.582 (0.231–1.364) 0.22 0.510 (0.175–1.413) 0.20High (vs. low) 4.100 (1.376–11.25) 0.013 4.468 (1.265–15.49) 0.021
Yoshihara et al.
Clin Cancer Res; 18(5) March 1, 2012 Clinical Cancer Research1380
on May 24, 2020. © 2012 American Association for Cancer Research. clincancerres.aacrjournals.org Downloaded from
Published OnlineFirst January 12, 2012; DOI: 10.1158/1078-0432.CCR-11-2725

against ovarian cancer. By immunohistochemically stainingfor CD8-positive T lymphocytes in a subset of the Japanesedata set (n ¼ 30), we revealed that the number of CD8 Tlymphocytes infiltrating into tumor tissues was significantly
decreased in the high-risk group (n ¼ 10) compared withthe low-risk group (n¼ 20) and was clearly correlated withthe expression level of HLA class I genes (SupplementaryFig. S7).
Figure 2. Molecular characteristicsof 126 survival-related genes. A, heatmap with a hierarchical classificationof 260 patient samples with theexpression profile of 126 survival-related genes in the Japanese dataset A. B, heat map with a hierarchicalclassification of 319 patient sampleswith the expression profile of 126survival-related genes in TCGA dataset.
Table 3. EnrichedGOcategories among the transcripts significantly differentially expressedbetween high-and low-risk groups: top-ranked 20 of 534 significantly overrepresented categories (Q < 0.25) among 1,109transcripts in Japanese data set A
Genes within GO category
GO categorya Number Percentage �Log10 Qb
Immune system process (GO:0002376) 206 29.0 45.0Immune response (GO:0006955) 172 24.2 45.0Defense response (GO:0006952, 0002217, 0042829) 110 15.5 40.3Response to stimulus (GO:0050896, 0051869) 251 35.4 29.2Inflammatory response (GO:0006954) 68 9.6 26.2Positive regulation of immune system process (GO:0002684) 40 5.6 25.2Regulation of immune system process (GO:0002682) 52 7.3 24.5Antigen processing and presentation (GO:0019882,0030333) 31 4.4 22.7Signal transducer activity (GO:0004871, 0005062, 0009369, 0009370) 169 23.8 22.1Molecular transducer activity (GO:0060089) 169 23.8 22.1Signal transduction (GO:0007165) 224 31.5 20.8Leukocyte activation (GO:0045321) 47 6.6 20.1Cell activation (GO:0001775) 48 6.8 19.7Regulation of immune response (GO:0050776) 32 4.5 18.9Response to wounding (GO:0009611, 0002245) 70 9.9 18.7Signal transmission (GO:0023060) 224 31.5 18.2Signaling process (GO:0023046) 224 31.5 18.2Regulation of cell activation (GO:0050865) 30 4.2 17.2Positive regulation of cell activation (GO:0050867) 24 3.4 17.0Regulation of lymphocyte activation (GO:0051249) 29 4.1 17.0
aBold font denotes common categories included in top 20 lists both Japanese data set A and TCGA data set.bQ value was determined by Fisher's exact test with Benjamini–Yekutieli correction.
Novel Risk Classification in Ovarian Cancer
www.aacrjournals.org Clin Cancer Res; 18(5) March 1, 2012 1381
on May 24, 2020. © 2012 American Association for Cancer Research. clincancerres.aacrjournals.org Downloaded from
Published OnlineFirst January 12, 2012; DOI: 10.1158/1078-0432.CCR-11-2725

DiscussionIn this study, we established a novel risk classification
system based on the 126-gene expression signature forpredicting overall survival time in patients with advancedstage high-grade serous ovarian cancer. The significantassociation between our risk classification and overallsurvival time was indicated among the 6 microarray datasets.
In expression microarray analyses, there is a well-known"curse of dimensionality" problem that the number ofgenes is much larger than the number of samples. The curseof dimensionality leads to a concern about the reliability ofthe selected genes or an overfitting phenomenon, and usinga large-scale microarray data is a simple and effective meth-od to overcome this problem. From this theory, we planneda large-scale cross-platform study using 4 publicly available
Table 4. EnrichedGOcategories among the transcripts significantly differentially expressedbetween high-and low-risk groups: top-ranked 20 of 83 significantly overrepresented GO categories (Q < 0.25) among1,381 transcripts in TCGA data set
Genes within GO category
GO categorya Number Percentage �Log10 Qb
Immune system process (GO:0002376) 129 20.5 20.9Immune response (GO:0006955) 115 18.3 20.8Defense response (GO:0006952,0002217, 0042829)
78 12.4 10.3
Antigen processing and presentation(GO:0019882, 0030333)
25 4.0 8.4
Inflammatory response (GO:0006954) 50 7.9 8.2Antigen processing and presentationof peptide antigen (GO:0048002)
13 2.1 6.9
Antigen processing and presentationof exogenous peptide antigen(GO:0002478)
6 1.0 5.2
MHC class I peptide loading complex(GO:0042824)
9 1.4 5.2
MHC protein complex (GO:0042611) 18 2.9 5.2TAP complex (GO:00042825) 8 1.3 5.2MHC protein binding (GO:0042287) 12 1.9 5.2Antigen processing and presentationof exogenous antigen (GO:0019884)
7 1.1 5.0
Response to stimulus(GO:0050896, 0051869)
183 29.1 4.4
Antigen processing and presentationof peptide antigen via MHC class I(GO:0002474)
7 1.1 3.9
Antigen processing and presentationof peptide or polysaccharide antigenvia MHC class II (GO:0002504)
12 1.9 3.9
Regulation of immune response(GO:0050776)
6 1.0 3.8
MHC class I protein binding(GO:0042288)
10 1.6 3.8
Response to wounding(GO:0009611, 0002245)
50 7.9 3.8
Positive regulation of immuneresponse (GO:0050778)
6 1.0 3.8
Positive regulation of immunesystem process (GO:0002684)
6 1.0 3.8
aBold font denotes common categories included in top 20 lists both Japanese data set A and TCGA data set.bQ value was determined by Fisher's exact test with Benjamini–Yekutieli correction.
Yoshihara et al.
Clin Cancer Res; 18(5) March 1, 2012 Clinical Cancer Research1382
on May 24, 2020. © 2012 American Association for Cancer Research. clincancerres.aacrjournals.org Downloaded from
Published OnlineFirst January 12, 2012; DOI: 10.1158/1078-0432.CCR-11-2725
microarray data sets consisting of more than 100 samples.To carry out a cross-platform study, we took considerablecare to reduce the influence of differences in microarrayplatforms with the Median Rank Score method and match-ing probes based on highly correlated expression (r > 0.8)between the 2 platforms. As a result, this risk classificationsystem showed a high predictive ability in the 4 microarraydata sets from different platforms. Our risk classificationwas suitably fitting to Japanese data set B despite the smallsample size. This might reflect the same platform in themicroarray experiments and similarity in clinical back-grounds between Japanese data set A and B. Intriguingly,193 survival-related gene signature that has been reportedby TCGA research networks (10) was also significantlyassociated with overall survival in our large data set (Sup-plementary Fig. S4), and 5 genes (B4GALT5, CXCL9, ID4,MTRF1, and SLC7A11) were common between their andour gene signatures despite different analytic processes(Supplementary Table 2). These genes might contribute
strongly to developing risk classification system for high-grade serous ovarian cancer patients.
We ascertained that alterations to the immune system incancer cells are one of the most important factors affectingsurvival of patients with advanced stage, high-grade serousovarian cancer and that high-risk ovarian cancer was wellcharacterized by the downregulation of the antigen presen-tation pathway at the molecular level.
The 2 large-scale subclassification studies (10, 11) basedon gene expression analyses have indicated that there are atleast 4 subclasses (immunoreactive, differentiated, prolif-erative, and mesenchymal) in high-grade serous ovariancancer. Although there was no statistically significant dif-ference in clinical outcome among 4 subclasses, this findingthat immunity-related genes are identified in large-scalegene expression profiles despite different analyticapproaches suggests that alteration of immune activitymight play an important role in the molecular characteri-zation of ovarian cancer.
Figure 3. Molecular characteristics of differentially expressedgenesbetweenhigh- and low-risk groups in the2major data sets (Japanesedata set AandTCGAdata set). A, using a volcano plot analysis, 1,109 and 1,381 transcripts were extracted as differentially expressed genes between high- and low-risk groups inthe Japanese data set A and TCGA data set, respectively. B, IPA showed that the antigen presentation pathway was significantly overrepresented in1,109 Japanese data set A and 1,381 TCGA transcripts. Green indicates that gene expression was downregulated in high-risk group compared with low-riskgroup.
Novel Risk Classification in Ovarian Cancer
www.aacrjournals.org Clin Cancer Res; 18(5) March 1, 2012 1383
on May 24, 2020. © 2012 American Association for Cancer Research. clincancerres.aacrjournals.org Downloaded from
Published OnlineFirst January 12, 2012; DOI: 10.1158/1078-0432.CCR-11-2725
Previous findings (28–30) that the presence of tumor-infiltrating T lymphocytes is associatedwith long survival inovarian cancer patients are consistent with the results fromour comprehensive gene expression analysis using large-scalemicroarray data, suggests that the presence of immuneresponses to cancer cells would influence the biologicalphenotype of ovarian cancer. Although several antigen-specific active immunotherapy studies have been con-ducted, the clinical benefit of this approach has not yetbeen shown in large randomized-controlled trials (31, 32).Previous reports (28, 33, 34) and our data indicated thatdefects in HLA class I antigen presentation machinerywould decrease recruitment of tumor-infiltrating lympho-cytes, leading to poor prognosis in cancer patients becauseof a reduction in antitumor immune activity. Therefore,upregulation of HLA class I antigen presentation pathwaymight be one of efficient therapeutic approach for patientswith high-risk serous ovarian cancer, especially when anti-gen-specific active immunotherapy is selected as a thera-peutic strategy (35).
Defects of HLA class I gene expression occurs at thegenetic, epigenetic, transcriptional, and posttranscriptionallevels, and are classified into the 2 main groups: reversibleand irreversible defects (36). Our data show that the fre-quency of deletion leading to irreversible defect ofHLA classI gene expression was low in high-grade serous ovariancancer. Only a few HLA class I gene mutations have beendescribed thus far (36). Downregulation of antigen presen-tation machinery components such as TAP1/2 or B2M alsoresult in reversible defects in HLA class I molecules (37).Interestingly, the expression levels of genes in the antigenpresentation pathway were positively correlated in theJapanese data set A (Supplementary Fig. S8). IFN-g or other
cytokines stimulation induces the expression of genes in theantigen presentation pathway (38). Moreover, histone dea-cetylase (HDAC) inhibitors increase the expression of genesin the antigenpresentationpathway such asTAP1/2 (39, 40)and B2M (41) in several cancer cells leading to upregulatingthe antigen presentation pathway. In addition, HDAC inhi-bitors that are promising anticancer drugs showa synergisticeffect with taxane or platinum drugs, which were used asstandard adjuvant chemotherapy for ovarian cancer, both invitro and in vivo (42, 43). These genetic and epigeneticactivations of the antigen presentation pathway mightinduce immune recognition of ovarian cancer cells andenhance antitumor immune responses.
In summary, our data suggest that this predictive bio-marker based on the 126-gene signature could identifypatients who should not expect long-term survival by stan-dard treatment and that activation of the antigen presen-tation pathway in tumor cells is an important key in newtherapeutic strategies for ovarian cancer.
Disclosure of Potential Conflicts of InterestNo potential conflicts of interest were disclosed.
AcknowledgmentsThe authors thank Prof. Y. Nakamura for his help, the tissue donors and
supporting medical staff for making this study possible, C. Seki and A.Yukawa for their technical assistance, T. Mizuochi for discussion, Prof. S. G.Silverberg for his enthusiastic help with the pathologic review, and K.Boroevich for helpful comments on the manuscript.
The costs of publication of this article were defrayed in part by thepayment of page charges. This article must therefore be hereby markedadvertisement in accordance with 18 U.S.C. Section 1734 solely to indicatethis fact.
ReceivedOctober 24, 2011; revisedDecember 9, 2011; acceptedDecember23, 2011; published OnlineFirst January 12, 2012.
References1. Cannistra SA. Cancer of the ovary. N Engl J Med 2004;351:2519–29.2. KurmanRJ, Visvanathan K, RodenR,Wu TC, Shih IeM. Early detection
and treatment of ovarian cancer: shifting from early stage to minimalvolume of disease based on a new model of carcinogenesis. Am JObstet Gynecol 2008;198:351–6.
3. Levanon K, Crum C, Drapkin R. New insights into the pathogenesis ofserous ovarian cancer and its clinical impact. J Clin Oncol 2008;26:5284–93.
4. Bowtell DD. The genesis and evolution of high-grade serous ovariancancer. Nat Rev Cancer 2010;10:803–8.
5. Winter WE 3rd, Maxwell GL, Tian C, Carlson JW, Ozols RF, Rose PG,et al. Prognostic factors for stage III epithelial ovarian cancer: aGynecologic Oncology Group Study. J Clin Oncol 2007;25:3621–7.
6. du Bois A, Reuss A, Pujade-Lauraine E, Harter P, Ray-Coquard I,Pfisterer J. Role of surgical outcome as prognostic factor in advancedepithelial ovarian cancer: a combined exploratory analysis of 3 pro-spectively randomized phase 3 multicenter trials: by the Arbeitsge-meinschaft Gynaekologische Onkologie Studiengruppe Ovarialkarzi-nom (AGO-OVAR) and theGroupe d'Investigateurs Nationaux Pour lesEtudes desCancers de l'Ovaire (GINECO). Cancer 2009;115:1234–44.
7. DowsettM, Dunbier AK. Emerging biomarkers and new understandingof traditional markers in personalized therapy for breast cancer. ClinCancer Res 2008;14:8019–26.
8. Weigelt B, Baehner FL, Reis-Filho JS. The contribution of geneexpression profiling to breast cancer classification, prognostication
and prediction: a retrospective of the last decade. J Pathol 2010;220:263–80.
9. Ahmed AA, Etemadmoghadam D, Temple J, Lynch AG, Riad M,Sharma R, et al. Driver mutations in TP53 are ubiquitous in high gradeserous carcinoma of the ovary. J Pathol 2010;221:49–56.
10. The Cancer Genome Atlas Research Network. Integrated genomicanalyses of ovarian carcinoma. Nature 2011;474:609–15.
11. Tothill RW, Tinker AV, George J, Brown R, Fox SB, Lade S, et al. Novelmolecular subtypes of serous and endometrioid ovarian cancer linkedto clinical outcome. Clin Cancer Res 2008;14:5198–208.
12. Bonome T, Levine DA, Shih J, Randonovich M, Pise-Masison CA,Bogomolniy F, et al. A gene signature predicting for survival in sub-optimally debulked patients with ovarian cancer. Cancer Res 2008;68:5478–86.
13. Dressman HK, Berchuck A, Chan G, Zhai J, Bild A, Sayer R, et al. Anintegrated genomic-based approach to individualized treatment ofpatients with advanced-stage ovarian cancer. J Clin Oncol 2007;25:517–25.
14. Majewski IJ, Bernards R. Taming the dragon: genomic biomarkers toindividualize the treatment of cancer. Nat Med 2011;17:304–12.
15. Heintz AP,Odicino F,Maisonneuve P, Beller U, Benedet JL, CreasmanWT, et al. Carcinoma of the ovary. J Epidemiol Biostat 2001;6:107–38.
16. Eisenhauer EA, Therasse P, Bogaerts J, Schwartz LH, Sargent D, FordR, et al.: New response evaluation criteria in solid tumours: RevisedRECIST guideline (version 1.1). Eur J Cancer 2009;45:228–47.
Yoshihara et al.
Clin Cancer Res; 18(5) March 1, 2012 Clinical Cancer Research1384
on May 24, 2020. © 2012 American Association for Cancer Research. clincancerres.aacrjournals.org Downloaded from
Published OnlineFirst January 12, 2012; DOI: 10.1158/1078-0432.CCR-11-2725
17. Tavassoli FA, Devilee P. World Health Organization Classification ofTumors. Pathology & Genetics. Tumors of the breast and femalegenital organs. Lyon (France): IARC Press; 2003. p. 117–45.
18. Silverberg SG. Histopathologic grading of ovarian carcinoma: a reviewand proposal. Int J Gynecol Pathol 2000;19:7–15.
19. Yoshihara K, Tajima A, Yahata T, Kodama S, Fujiwara H, Suzuki M,et al. Gene expression profile for predicting survival in advanced-stageserous ovarian cancer across two independent datasets. PLoS One2010;5:e9615.
20. Glaab E, Garibaldi J, Krasnogor N. ArrayMining: a modular web-application for microarray analysis combining ensemble and consen-sus methods with cross-study normalization. BMC Bioinformatics2009;10:358.
21. Symmans WF, Hatzis C, Sotiriou C, Andre F, Peintinger F, Regitnig P,et al. Genomic index of sensitivity to endocrine therapy for breastcancer. J Clin Oncol 2010;28:4111–9.
22. Simon N, Friedman J, Hastie T. Regularization paths for Cox's pro-portional hazardsmodel via coordinate descent. J Stat Softw 2010;39:1–22.
23. R Development Core Team. R: A language and environment forstatistical computing. 2011
24. Brunet JP, Tamayo P, Golub TR, Mesirov JP. Metagenes and molec-ular pattern discovery using matrix factorization. Proc Natl Acad SciU S A 2004;101:4164–9.
25. Benjamini Y, Yekutieli D. The control of the false discovery rate inmultiple testing under dependency. Ann Stat 2001;29:1165–88.
26. SubramanianA, TamayoP,Mootha VK,Mukherjee S, Ebert BL,GilletteMA, et al. Gene set enrichment analysis: A knowledge-basedapproachfor interpreting genome-wide expression profiles. Proc Natl Acad SciU S A 2005;102:15545–50.
27. Benjamini Y, Hochberg Y. Controlling the false discovery rate: apractical and powerful approach to multiple testing. J R Statist SocB 1995;57:289–300.
28. Han LY, Fletcher MS, Urbauer DL, Mueller P, Landen CN, Kamat AA,et al. HLAclass I antigenprocessingmachinery component expressionand intratumoral T-Cell infiltrate as independent prognostic markers inovarian carcinoma. Clin Cancer Res 2008;14:3372–9.
29. Leffers N, Fehrmann RS, Gooden MJ, Schulze UR, Ten Hoor KA,Hollema H, et al. Identification of genes and pathways associated withcytotoxic T lymphocyte infiltration of serous ovarian cancer. Br JCancer 2010;103:685–92.
30. Gooden MJ, de Bock GH, Leffers N, Daemen T, Nijman HW. Theprognostic influence of tumour-infiltrating lymphocytes in cancer: asystematic review with meta-analysis. Br J Cancer 2011;105:93–103.
31. Leffers N, Daemen T, Helfrich W, Boezen HM, Cohlen BJ, Melief K,et al. Antigen-specific active immunotherapy for ovarian cancer.Cochrane Database Syst Rev 2010;1:CD007287.
32. Kandalaft LE, Powell DJ Jr, Singh N, Coukos G. Immunotherapy forovarian cancer: what's next? J Clin Oncol 2011;29:925–33.
33. Rolland P, Deen S, Scott I, Durrant L, Spendlove I. Human leukocyteantigen class I antigen expression is an independent prognostic factorin ovarian cancer. Clin Cancer Res 2007;13:3591–6.
34. Shehata M, Mukherjee A, Deen S, Al-Attar A, Durrant LG, Chan S.Human leukocyte antigen class I expression is an independent prog-nostic factor in advanced ovarian cancer resistant to first-line platinumchemotherapy. Br J Cancer 2009;101:1321–8.
35. TanakaK,Hayashi H,HamadaC,KhouryG, JayG. Expressionofmajorhistocompatibility complex class I antigens as a strategy for thepotentiation of immune recognition of tumor cells. Proc Natl Acad SciU S A 1986;83:8723–7.
36. Garrido F, Cabrera T, Aptsiauri N. "Hard" and "soft" lesions underlyingthe HLA class I alterations in cancer cells: implications for immuno-therapy. Int J Cancer 2010;127:249–56.
37. Khong HT, Restifo NP. Natural selection of tumor variants in thegeneration of "tumor escape" phenotypes. Nat Immunol 2002;3:999–1005.
38. Dunn GP, Koebel CM, Schreiber RD. Interferons, immunity and cancerimmunoediting. Nat Rev Immunol 2006;6:836–48.
39. Khan AN, Gregorie CJ, Tomasi TB. Histone deacetylase inhibitorsinduce TAP, LMP, Tapasin genes and MHC class I antigen presenta-tion by melanoma cells. Cancer Immunol Immunother 2008;57:647–54.
40. Setiadi AF, Omilusik K, David MD, Seipp RP, Hartikainen J, GopaulR, et al. Epigenetic enhancement of antigen processing and pre-sentation promotes immune recognition of tumors. Cancer Res2008;68:9601–7.
41. Kitamura H, Torigoe T, Asanuma H, Honma I, Sato N, Tsukamoto T.Down-regulation of HLAclass I antigens in prostate cancer tissues andup-regulation by histone deacetylase inhibition. J Urol 2007;178:692–6.
42. ChobanianNH,Greenberg VL, Gass JM, DesimoneCP, VanNagell JR,Zimmer SG. Histone deacetylase inhibitors enhance paclitaxel-induced cell death in ovarian cancer cell lines independent of p53status. Anticancer Res 2004;24:539–45.
43. Qian X, LaRochelle WJ, Ara G, Wu F, Petersen KD, Thougaard A,et al. Activity of PXD101, a histone deacetylase inhibitor, inpreclinical ovarian cancer studies. Mol Cancer Ther 2006;5:2086–95.
Novel Risk Classification in Ovarian Cancer
www.aacrjournals.org Clin Cancer Res; 18(5) March 1, 2012 1385
on May 24, 2020. © 2012 American Association for Cancer Research. clincancerres.aacrjournals.org Downloaded from
Published OnlineFirst January 12, 2012; DOI: 10.1158/1078-0432.CCR-11-2725

2012;18:1374-1385. Published OnlineFirst January 12, 2012.Clin Cancer Res Kosuke Yoshihara, Tatsuhiko Tsunoda, Daichi Shigemizu, et al. Presentation PathwaySignature Is Uniquely Characterized by Downregulation of Antigen High-Risk Ovarian Cancer Based on 126-Gene Expression
Updated version
10.1158/1078-0432.CCR-11-2725doi:
Access the most recent version of this article at:
Material
Supplementary
http://clincancerres.aacrjournals.org/content/suppl/2012/01/12/1078-0432.CCR-11-2725.DC1
Access the most recent supplemental material at:
Cited articles
http://clincancerres.aacrjournals.org/content/18/5/1374.full#ref-list-1
This article cites 40 articles, 16 of which you can access for free at:
Citing articles
http://clincancerres.aacrjournals.org/content/18/5/1374.full#related-urls
This article has been cited by 14 HighWire-hosted articles. Access the articles at:
E-mail alerts related to this article or journal.Sign up to receive free email-alerts
Subscriptions
Reprints and
To order reprints of this article or to subscribe to the journal, contact the AACR Publications Department at
Permissions
Rightslink site. Click on "Request Permissions" which will take you to the Copyright Clearance Center's (CCC)
.http://clincancerres.aacrjournals.org/content/18/5/1374To request permission to re-use all or part of this article, use this link
on May 24, 2020. © 2012 American Association for Cancer Research. clincancerres.aacrjournals.org Downloaded from
Published OnlineFirst January 12, 2012; DOI: 10.1158/1078-0432.CCR-11-2725
Related Documents