MNRAS 481, 1427–1440 (2018) doi:10.1093/mnras/sty2352 Advance Access publication 2018 August 29 High-resolution spatial analysis of a z ∼ 2 lensed galaxy using adaptive coadded source-plane reconstruction Soniya Sharma, 1,2 ‹ Johan Richard, 3 Tiantian Yuan, 2,4 Anshu Gupta, 1,2 Lisa Kewley, 1,2 Vera Patr´ ıcio, 5 Nicha Leethochawalit, 6 and Tucker A. Jones 7 1 Research School of Astronomy and Astrophysics, Australian National University, Cotter Road, ACT 2611, Australia 2 ARC Centre of Excellence for All Sky Astrophysics in 3 Dimensions (ASTRO 3D), Australia 3 Univ Lyon, Univ Lyon1, Ens de Lyon, CNRS, Centre de Recherche Astrophysique de Lyon UMR5574, F-69230 Saint-Genis-Laval, France 4 Centre for Astrophysics and Supercomputing, Swinburne University of Technology, Hawthorn, Victoria 3122, Australia 5 Dark Cosmology Centre, Niels Bohr Institute, University of Copenhagen, Juliane Maries Vej 30, DK-2100 Copenhagen, Denmark 6 Cahill Center for Astronomy and Astrophysics, California Institute of Technology, MS 249-17, Pasadena, CA 91125, USA 7 Department of Physics, University of California Davis, 1 Shields Avenue, Davis, CA 95616, USA Accepted 2018 August 24. Received 2018 August 18; in original form 2018 June 25 ABSTRACT We present spatially resolved analysis of a lensed galaxy, SDSS1958+5950 at z = 2.225, from the Cambridge Sloan Survey of Wide Arcs in the Sky. We use our new high-resolution imaging data to construct a robust lens model for the galaxy group at z = 0.214. We employ the updated lens model to combine the Integral Field Spectrographic observations on two highly distorted images of the lensed target. We adopt a forward-modelling approach to deconvolve the effects of point spread function from the combined source-plane reconstruction. The approach is adapted to the lens model magnification and enables a resolution of ∼170 pc in the galaxy- source plane. We propose an ongoing merger as the origin of the lensed system on the basis of its source-plane morphology, kinematics and rest-frame emission-line ratios. Using our novel technique of adaptive coadded source plane reconstruction, we are able to detect different components in the velocity gradient that were not seen in previous studies of this object, plausibly belonging to different components in the merging system. Key words: gravitational lensing: strong – galaxies: groups: individual (SDSS1958+5950) – galaxies: kinematics and dynamics. 1 INTRODUCTION Spatially resolved studies of high redshift galaxies, particularly in the peak of galaxy formation epoch 1 z 3 (Madau & Dick- inson 2014) hold the key for understanding the physics of galaxy formation and evolution. The development of Integral Field Spec- trographs (IFS) and Adaptive Optics (AO) Imaging techniques in the last decade have revealed the diverse kinematic state of galaxies in this epoch, ranging from rotationally supported clumpy discs to more dispersion dominated systems (see Glazebrook 2013, for a review). Observationally, AO aided IFS surveys (Flores et al. 2006;F¨ orster Schreiber et al. 2006; Maiolino et al. 2008; Genzel et al. 2011; Gnerucci et al. 2011; Contini et al. 2012; F¨ orster Schreiber et al. 2018) have allowed us to achieve an improved resolution of up to 100 mas (∼800 pc at 1 ≤ z ≤ 3), enabling the sampling of z ∼ 1–3 galaxies in a few coarse resolution elements. However, in order to E-mail: [email protected] understand the physical conditions of H II regions and the evo- lution of interstellar medium (ISM) properties with redshift, it is imperative to resolve star-forming (SF) regions at high-z in the same manner as we resolve them in the local universe. For example, the physical scales of H II regions in the local uni- verse span at least an order of magnitude, from small OB as- sociates (∼60 pc), stellar aggregates (∼240 pc) to large star complexes (∼600 pc), with a decrease in surface brightness from the smallest to the largest scales (Elmegreen et al. 2006; Gusev 2014). Therefore, current high-redshift observations are highly biased towards the H II physics on the largest scales. Similar systematic biases also exist in kinematic and metallicity gradient analysis of high-z galaxies (e.g. Jones et al. 2013; Yuan, Kewley & Rich 2013; Yuan et al. 2017). The improved spatial resolution provided by IFS observa- tions of gravitationally lensed galaxies (e.g. Jones et al. 2010b; Livermore et al. 2012; Livermore et al. 2015; Wisnioski et al. 2015; Leethochawalit et al. 2016; Mason et al. 2017; Patr´ ıcio et al. 2018) has played a pivotal role in probing the SF regions with a physi- cal resolution down to a few hundred parsecs in the galaxy-source C 2018 The Author(s) Published by Oxford University Press on behalf of the Royal Astronomical Society Downloaded from https://academic.oup.com/mnras/article-abstract/481/2/1427/5086085 by California Institute of Technology user on 05 December 2018

Welcome message from author
This document is posted to help you gain knowledge. Please leave a comment to let me know what you think about it! Share it to your friends and learn new things together.
Transcript
MNRAS 481, 1427–1440 (2018) doi:10.1093/mnras/sty2352Advance Access publication 2018 August 29
High-resolution spatial analysis of a z ∼ 2 lensed galaxy using adaptivecoadded source-plane reconstruction
Soniya Sharma,1,2‹ Johan Richard,3 Tiantian Yuan,2,4 Anshu Gupta,1,2 Lisa Kewley,1,2
Vera Patrıcio,5 Nicha Leethochawalit,6 and Tucker A. Jones7
1Research School of Astronomy and Astrophysics, Australian National University, Cotter Road, ACT 2611, Australia2ARC Centre of Excellence for All Sky Astrophysics in 3 Dimensions (ASTRO 3D), Australia3Univ Lyon, Univ Lyon1, Ens de Lyon, CNRS, Centre de Recherche Astrophysique de Lyon UMR5574, F-69230 Saint-Genis-Laval, France4Centre for Astrophysics and Supercomputing, Swinburne University of Technology, Hawthorn, Victoria 3122, Australia5Dark Cosmology Centre, Niels Bohr Institute, University of Copenhagen, Juliane Maries Vej 30, DK-2100 Copenhagen, Denmark6Cahill Center for Astronomy and Astrophysics, California Institute of Technology, MS 249-17, Pasadena, CA 91125, USA7Department of Physics, University of California Davis, 1 Shields Avenue, Davis, CA 95616, USA
Accepted 2018 August 24. Received 2018 August 18; in original form 2018 June 25
ABSTRACTWe present spatially resolved analysis of a lensed galaxy, SDSS1958+5950 at z = 2.225, fromthe Cambridge Sloan Survey of Wide Arcs in the Sky. We use our new high-resolution imagingdata to construct a robust lens model for the galaxy group at z = 0.214. We employ the updatedlens model to combine the Integral Field Spectrographic observations on two highly distortedimages of the lensed target. We adopt a forward-modelling approach to deconvolve the effectsof point spread function from the combined source-plane reconstruction. The approach isadapted to the lens model magnification and enables a resolution of ∼170 pc in the galaxy-source plane. We propose an ongoing merger as the origin of the lensed system on the basis ofits source-plane morphology, kinematics and rest-frame emission-line ratios. Using our noveltechnique of adaptive coadded source plane reconstruction, we are able to detect differentcomponents in the velocity gradient that were not seen in previous studies of this object,plausibly belonging to different components in the merging system.
Key words: gravitational lensing: strong – galaxies: groups: individual (SDSS1958+5950) –galaxies: kinematics and dynamics.
1 IN T RO D U C T I O N
Spatially resolved studies of high redshift galaxies, particularly inthe peak of galaxy formation epoch 1 � z � 3 (Madau & Dick-inson 2014) hold the key for understanding the physics of galaxyformation and evolution. The development of Integral Field Spec-trographs (IFS) and Adaptive Optics (AO) Imaging techniques inthe last decade have revealed the diverse kinematic state of galaxiesin this epoch, ranging from rotationally supported clumpy discs tomore dispersion dominated systems (see Glazebrook 2013, for areview).
Observationally, AO aided IFS surveys (Flores et al. 2006; ForsterSchreiber et al. 2006; Maiolino et al. 2008; Genzel et al. 2011;Gnerucci et al. 2011; Contini et al. 2012; Forster Schreiber et al.2018) have allowed us to achieve an improved resolution of up to100 mas (∼800 pc at 1 ≤ z ≤ 3), enabling the sampling of z ∼ 1–3galaxies in a few coarse resolution elements. However, in order to
� E-mail: [email protected]
understand the physical conditions of H II regions and the evo-lution of interstellar medium (ISM) properties with redshift, itis imperative to resolve star-forming (SF) regions at high-z inthe same manner as we resolve them in the local universe. Forexample, the physical scales of H II regions in the local uni-verse span at least an order of magnitude, from small OB as-sociates (∼60 pc), stellar aggregates (∼240 pc) to large starcomplexes (∼600 pc), with a decrease in surface brightnessfrom the smallest to the largest scales (Elmegreen et al. 2006;Gusev 2014). Therefore, current high-redshift observations arehighly biased towards the H II physics on the largest scales. Similarsystematic biases also exist in kinematic and metallicity gradientanalysis of high-z galaxies (e.g. Jones et al. 2013; Yuan, Kewley &Rich 2013; Yuan et al. 2017).
The improved spatial resolution provided by IFS observa-tions of gravitationally lensed galaxies (e.g. Jones et al. 2010b;Livermore et al. 2012; Livermore et al. 2015; Wisnioski et al. 2015;Leethochawalit et al. 2016; Mason et al. 2017; Patrıcio et al. 2018)has played a pivotal role in probing the SF regions with a physi-cal resolution down to a few hundred parsecs in the galaxy-source
C© 2018 The Author(s)Published by Oxford University Press on behalf of the Royal Astronomical Society
Dow
nloaded from https://academ
ic.oup.com/m
nras/article-abstract/481/2/1427/5086085 by California Institute of Technology user on 05 D
ecember 2018
1428 S. Sharma et al.
plane. Magnification factors of strongly lensed systems can easilyrange between 1 and 10 (e.g. Richard et al. 2011), with reasonablelensing uncertainties (Collett 2015). In extreme cases of giant arcsaround galaxy groups and galaxy clusters, the magnification canreach up to a few ×10, rendering a physical resolution of less than100 pc at z ∼ 2. Therefore, giant distorted arcs are ideal candidatesto study the physics of high-redshift SF regions at highest spatialresolution possible (Swinbank et al. 2006; Jones et al. 2010b; Yuanet al. 2012; Bayliss et al. 2014b; Livermore et al. 2015; Johnsonet al. 2017; Girard et al. 2018).
While it is the giant arcs that offer the largest magnification, mod-elling of these arcs is also the most challenging. One of the biggestchallenges of studying the giant lensed arcs is the large uncertaintyin the lens model. The lensing mass distribution very sensitivelycontrols the accuracy and precision of source-plane reconstructionsof these arcs. The current strong lens modelling is unable to matchthe angular resolution of the imaging data (for e.g. HST ∼ 0.′′05)with a residual rms of up to a few arcseconds (Limousin et al.2007; Caminha et al. 2017; Lagattuta et al. 2017). Line-of-sightsubstructures, redshift information of multiple image systems havealso been shown to have a significant contribution to the systematicserrors arising in strong lens models of lensing clusters (Bayliss et al.2014a; Johnson & Sharon 2016; Acebron et al. 2017).
However, even with the use of accurate lens models, simplesource reconstructions removing the lens deflection from the obser-vations does not allow us to correctly recover the intrinsic source-plane surface brightness. This is because of the point spread function(PSF) convolving with the data in the image plane. PSF remains inthe source plane and varies as a function of the source position.The impact of PSF is even more severe in the vicinity of the criti-cal lines. Thus, the resulting source-plane resolution limits us fromconfidently combining independent reconstructions from differentmultiple images of the same lensed galaxy. In order to fully utilizethe power of lensing and recover the physical properties of galaxydelensed, it is important to simultaneously combine the informationfrom different images. This has been shown before by certain casestudies (for e.g Coe et al. 2010; Jones et al. 2010a, 2015) of lensedsystems.
To easily combine the observations and deal with instrumen-tal PSF, a forward modelling approach is ideal to reconstruct thegalaxy on the source plane. The use of forward source modellingtechniques has gained increasing popularity in the past decade ow-ing to the fast growing data set of strongly lensed systems. Previouslensing studies (Warren & Dye 2003; Nightingale & Dye 2015;Tessore, Bellagamba & Metcalf 2016; Dessauges-Zavadsky et al.2017; Johnson et al. 2017) have demonstrated the advantages ofthese techniques in accurately studying source profiles at scalesotherwise unachievable through traditional image inversion meth-ods. However, most of these techniques rely on computationallyexpensive algorithms to optimize lens model parameters and theextended source simultaneously.
In this work, we conduct a detailed study of z ∼ 2 lensed galaxyusing a unique forward modelling approach to combine all the avail-able data from different multiple images of the lensed target. Theapproach is computationally fast and exploits the best-fitting lensingmass model in rendering the physical properties from the combinedsource-plane data. We choose one of the brightest targets in TheCambridge Sloan Survey of Wide Arcs in the Sky (CASSOWARY),SDSS1958+5950 (hereafter referred by its survey-ID: cswa128;z = 2.225). CASSOWARY survey presented a large sample ofabout 100 group-scale gravitationally lensed systems at z ∼ 1–3 from the Sloan Digital Sky Survey (SDSS; York et al. 2000)
imaging data (Stark et al. 2013). The survey targeted SF galaxies(z ∼ 1–3) being lensed by an early-type galaxy (or group) at z ∼0.2–0.7. Leethochawalit et al. (2016; hereafter L16) presented IFUobservations of a representative sample of 15 lensed galaxies fromthe survey.
cswa128 is lensed by a galaxy group at z = 0.214 and reported tohave high [N II]/H α at the outer edges, by previous work of (L16). Alens model based on SDSS imaging data was used to interpret IFUobservations on a single lensed arc of this target. In this work, wepresent high-resolution imaging data from the NIRC2 instrumenton the Keck I telescope that enables us to build a more complexlens model for this system.
We also discuss new spectroscopic observations on anotherlensed image of the galaxy than previously observed by L16. Weuse the updated lens model to reconstruct two images of cswa128on the source plane. To overcome the challenges posed by the PSF,we test a forward modelling approach to merge the two IFS datareconstructions on the source plane. Using our novel technique, wefind that cswa128 is highly evident of a merging system.
The paper is organised as follows. In Section 2, we present differ-ent observations of the lensed system and an overview of the datareduction process. In Section 3, we describe the lensing method-ology and the new lens model of the galaxy group. In Section 4,we detail our technique of coadding different images of the lensedgalaxy on the source plane and the resulting source plane prop-erties from the reconstruction. We discuss the overall results andsummarize the conclusions under Section 6 of the paper.
Throughout this paper we adopt a standard �-cold dark matter(�-CDM) cosmology with �m = 0.3, �� = 0.7, and h = 0.7. Allmagnitudes are given in the AB system (Oke & Gunn 1983).
2 O B S E RVAT I O N S A N D DATA R E D U C T I O N
2.1 Previous data
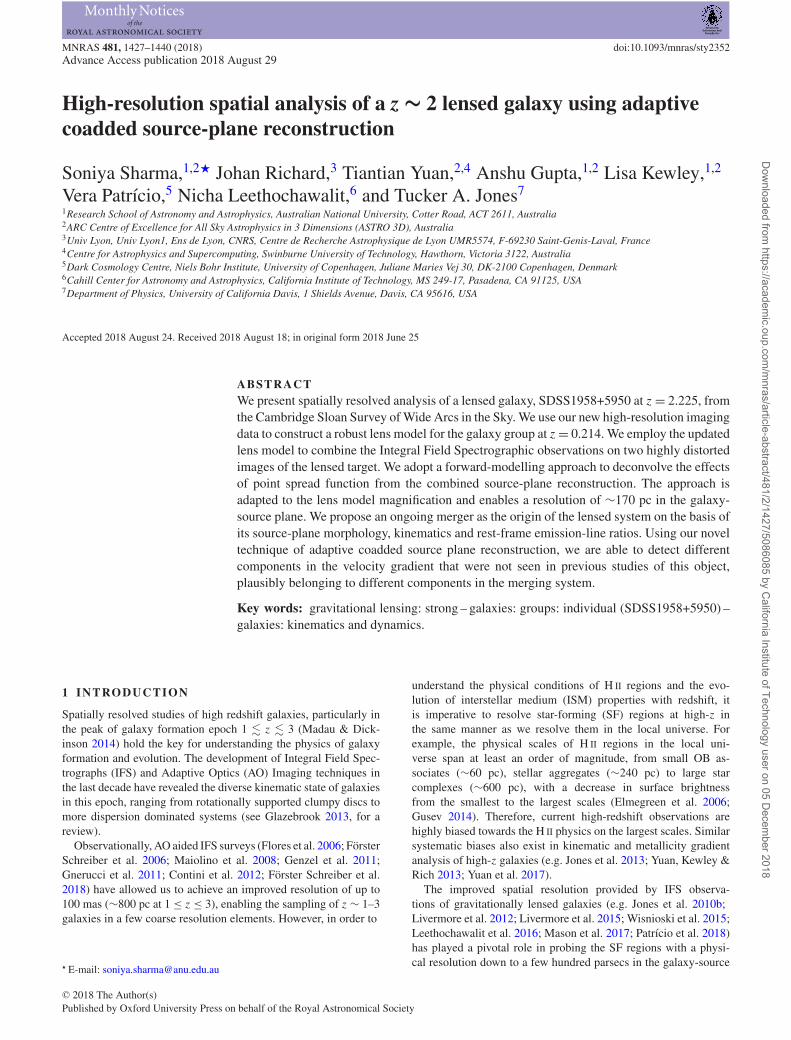
cswa128 is one of the brightest (r = 19.6) lensed galaxies included inthe CASSOWARY survey with a mean systemic redshift of 2.225derived using H α and [O III] λ 5007 emission lines (Stark et al.2013). Publicly available gri imaging data from SDSS DR8 (Fig. 1)had been used previously for creating a lens model for this system.The lensing galaxy group was spectroscopically confirmed to be at z= 0.214 (Stark et al. 2013). L16 conducted a follow-up study usingAO-aided near-infrared IFU observations with OSIRIS (Larkin et al.2006) instrument on the W. M. Keck I 10-m telescope. The physicallocation of their OSIRIS field is shown in yellow on the SDSScolour composite in Fig. 1.
2.2 New data
2.2.1 NIRC2 imaging data
To obtain a higher resolution image of the lensed system, cswa128was observed with the near-infrared Camera (NIRC2) on 2017,September 8 UT using the laser-guide star (LGS) AO system onKeck II (PI: S.Sharma). Observations were taken in wide field mode(40 arcsec × 40 arcsec, plate scale 0.′′04/pixel) using two filters Kp
(λ0 = 2.12 μm, �λ = 0.35 μm), J (λ0 = 1.24 μm, �λ = 0.16 μm).Wide field mode was an optimal choice to obtain high resolutionand cover the group members in the field of view (FOV) at the sametime. A tip-tilt (TT) star with R ∼ 15.8 mag was chosen outside theFOV for these observations. Three point dithering (5 arcsec) patternwas adopted to avoid the noisy fourth quadrant of the detector. The
MNRAS 481, 1427–1440 (2018)
Dow
nloaded from https://academ
ic.oup.com/m
nras/article-abstract/481/2/1427/5086085 by California Institute of Technology user on 05 D
ecember 2018
High Resolution spatial analysis of z ∼ 2 galaxy 1429
Figure 1. Left: SDSS colour composite image of cswa128, lensed galaxy behind a galaxy group at z = 0.214 (red: SDSS z’ filter, green: SDSS r’ filter, blue:SDSS g’ filter). The OSIRIS pointings are indicated by two rectangles, each covering a different multiple image of the lensed galaxy at a mean systemic redshiftof z = 2.225. Yellow rectangle a1 (texp = 5.4 ks) represents OSIRIS field for previous observations by L16 while our new observations are shown by the cyanrectangle a2 (texp = 5.4 ks). Right: Our new NIRC2 Kp band imaging data (texp = 8.4 ks) with OSIRIS pointings overlaid on top. The spatial resolution hasimproved by a factor of 10 with NIRC2 observations. The length of the compass indicates an angular scale of 5.′′0.
0 5 10 15 20X(pixels)
0
5
10
15
20
Y(p
ixel
s)
0
5
10
15
20
(1)
(2)
(3)
2.10 2.11 2.12 2.13 2.14
−10
0
10
20
30
40
2.10 2.11 2.12 2.13 2.14Wavelength (x104Å)
−10
0
10
20
30
40
Flu
x (1
0−18
ergs
/s/c
m2 /Å
)
Hα [NII]
2.11 2.12 2.13
−0.5
0.0
0.5
1.0
2.11 2.12 2.13
−0.5
0.0
0.5
1.0(1)
2.11 2.12 2.13 2.11 2.12 2.13 Observed Wavelength (x104Å)
(2)
2.11 2.12 2.13 2.11 2.12 2.13
(3)
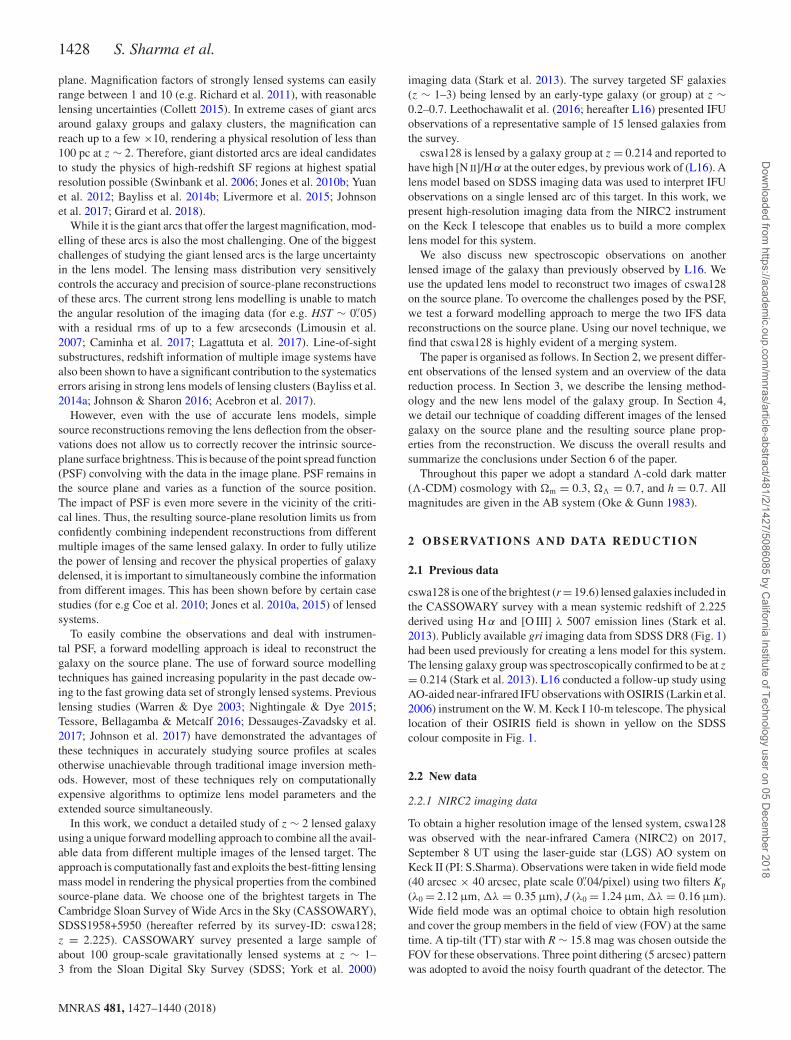
Figure 2. Examples of 1D spectra and H α 2D intensity map from emission-line fitting of new OSIRIS spectroscopic data on multiple image a2 of the lensedarc. Top left: H α 2D intensity map in units of 10−18 erg s−1 cm2 arcsec−2 in the observed frame. 78 individual spaxels in the image plane achieve H α SNRabove 5σ . 1D spectra of the three green pixels in the 2D map are shown in the bottom three panels. Top right: Integrated 1-D spectrum in the vicinity of H α
and [N II] lines obtained after summing all the IFU pixels with H α detections above 5σ . The flux density is in units of 10−18 erg s−1 cm2Å−1
. We achieve aSNR of 25 on H α and 5 on [N II]. Note that the weaker [N II] λ6548 line is fixed to be 1/3 of the [N II] λ6584 line. The negative level of continuum is due to theits oversubtraction especially in the red part of the spectrum. Bottom: Panels shows the spectrum of individual spaxels. Yellow and cyan vertical lines in Panels1–4 indicate the location of redshifted H α and red [N II] emission lines at z = 2.225, respectively. The raw spectrum is plotted in black; rms of sky residualsin green, and gaussian fits to the three lines are shown in blue.
MNRAS 481, 1427–1440 (2018)
Dow
nloaded from https://academ
ic.oup.com/m
nras/article-abstract/481/2/1427/5086085 by California Institute of Technology user on 05 D
ecember 2018
1430 S. Sharma et al.
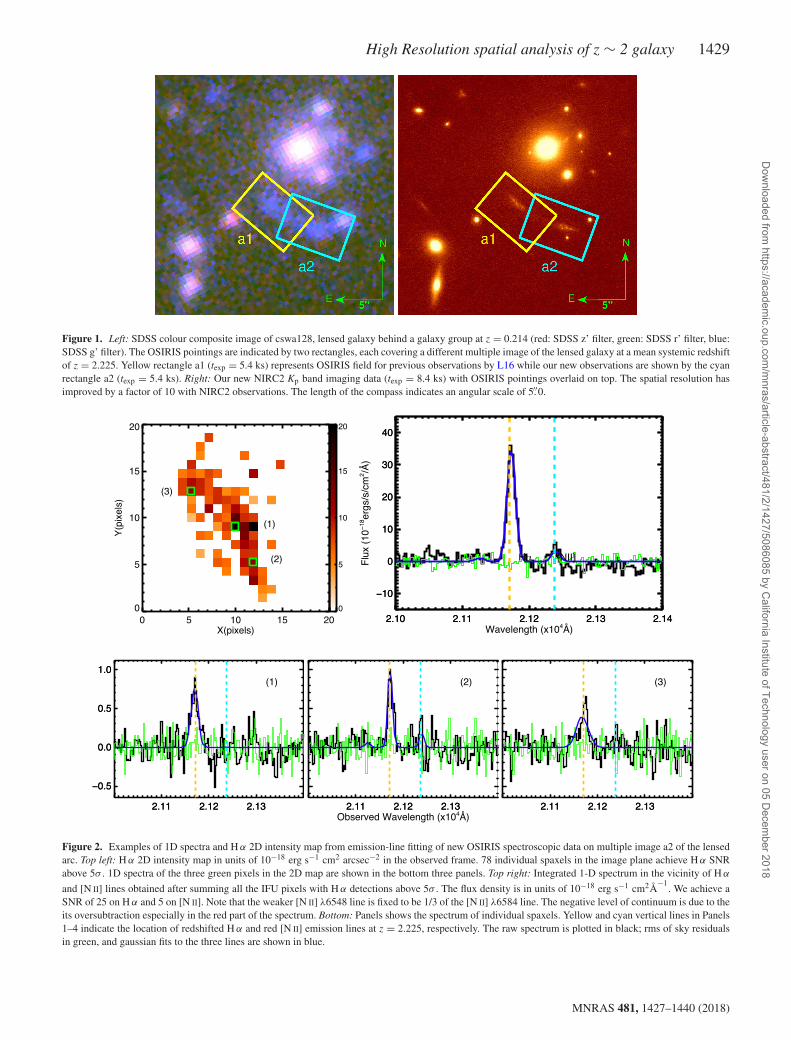
Figure 3. Our lens model of CSWA128. Left: NIRC2 imaging of CSWA128 in Kp band. Labelled in green circles (a1, a2, a3, a4) are the different multipleimages of the lensed galaxy at z = 2.225. IFU data for a1 and a2 confirm their mean redshifts at 2.225 whereas a3 and a4 have been identified on the basis ofsimilar morphology using NIRC2 image and initial predictions from our lens model. The critical lines at z = 2.225 are shown in red and the correspondingcaustics in yellow. System 10 has been identified as a separate system and included in our model with redshift as a free parameter. Right: Close-up image ofthe lensed arc to show smaller substructures used as constraints in our mass model. Each colour corresponds to a different set of constraint, matched across inthe two multiple images.
total on-target exposure time was 8.4 ks (Kp band) and 4.2 ks (Jband). J–Kp colour image was mostly used for selecting the groupmembers in our lens model, however due to relatively less exposuretime in J band, we only present Kp band in this paper. Fig. 1 showsthe NIRC2 FOV for our observation. The spatial resolution of 0.′′04obtained using NIRC2 allows us to resolve fainter substructures inthe lensed galaxy as shown in Fig. 3.
The NIRC2 images were reduced with IRAF using the basic pro-cedures that involved flat-fielding, sky subtraction, and distortioncorrection. Flat-fielding was done by subtracting a stack median oflamp-off from lamp-on dome flats. The process of sky-subtractionwas done iteratively. We constructed a sky image for every expo-sure using a sigma-clipped mean of its neighbouring exposures atdifferent dither positions. After subtracting sky from the respec-tive exposures, images were corrected for geometrical distortionand then stacked together to create an object mask. The objectsidentified in this mask were rejected for the next round of sky sub-traction. Sky subtraction was repeated for a few more iterationstill we converged on the final image after combining all the sky-subtracted frames. We used the 2MASS photometry to perform theflux calibration of our NIRC2 image. The astrometry was calibratedusing SDSS imaging data by aligning location of the bright stars inthe FOV.
2.2.2 OSIRIS IFU data
We obtained new data using OSIRIS with the natural guide star(NGS) AO system (Wizinowich et al. 2006) on the a1 multipleimage (Fig. 1) of the lensed galaxy. The observation was con-ducted on 2015, September 22 UT at (α2000, δ2000) = (19:58:35.117,+59:50:51.51) (PI:T.Yuan). The target was observed in the Kn2 bandto cover the redshifted H α and [N II] emission lines. We used a platescale of 0.′′1 which gave a field of view of 4.5 × 6.4 arcsec (Fig. 1).The Ks = 9.8 mag NGS was chosen inside the NGS FOV of OSIRIS.A position angle (P.A.) of 70 deg. was used for the observation. Weobtained five individual exposures of 900 s in an ABAB ditheringsequence to optimize sky subtraction. The net on-target exposuretime was 4.5 ks. The average spectral resolution was R ∼ 3000which corresponds to a resolution in velocity ∼40 km s−1. Center-ing of the IFU was done through short exposures of the TT starprior to science target exposure. The AO-corrected PSF was 0.′′12.
We use the latest available OSIRIS data reduction pipeline(Larkin et al. 2006) to reduce the individual exposure frames. Majorsteps in the reduction pipeline include: dark and bias subtraction,flat-fielding, spectral extraction, wavelength calibration, and telluriccorrection. Adjacent pairs of images were used as reference framesto perform sky subtraction through the IDL code of Davies (2007).The individual exposures were then combined using a 3σ meanclip to reject cosmic rays and bad lenslets. An A0D type standardstar FS147 was used to perform telluric correction and flux calibra-tion. The uncertainty in absolute flux calibration is estimated to bewithin 20 per cent. The absolute astrometry calibration of the pro-duced datacube was done using the high-resolution NIRC2 imagewith an uncertainty of about 1 spaxel (∼0.′′1).
The critical analysis for this work is the extraction of emission-line maps. We fitted gaussian profiles simultaneously to the threeemission lines [N II] λ6548, 6583, and H α after constraining theratio of [N II] λ6548 and [N II] λ6583 to the theoretical value of 0.33as described in Osterbrock (1989). We also constrained the meanand velocity width of [N II] λ6548, 6583 lines to be the same as H α
λ6563. Fitting of emission lines was initially done for every spaxelin the image and source plane using a weighted χ2 minimizationprocedure. Since the wavelength range covering [N II] and H α lineswas not dominated by the atmospheric OH lines, we followed theweighting procedure outlined in L16. For a given wavelength, thefitted spectra were weighted by a variance spectrum calculated usingan emission-line free region of the data cube. The generated 2D mapfrom the emission-line fitting had 78 spaxels with H α signal-to-noise ratio (SNR) ≥ 5 and 15 spaxels with [N II] SNR ≥ 3 (Fig. 2).We also present the coadded spectrum of all spaxels for comparisonin Fig. 2. Moreover, we notice that the spatial averaging of 3 × 3surrounding spaxels fails to improve the SNR significantly. Wepresent an adaptive binning technique using our new lens modelto achieve higher SNR. The details of the method are discussed inSection 4.
3 LENS MODELLI NG
The previous mass model for the galaxy group of cswa128 wasconstructed using the procedure described in Auger et al. (2013).The gri SDSS imaging data was used to fit a single Sersic profile toeach of the lensing galaxy and the background source galaxy using
MNRAS 481, 1427–1440 (2018)
Dow
nloaded from https://academ
ic.oup.com/m
nras/article-abstract/481/2/1427/5086085 by California Institute of Technology user on 05 D
ecember 2018
High Resolution spatial analysis of z ∼ 2 galaxy 1431
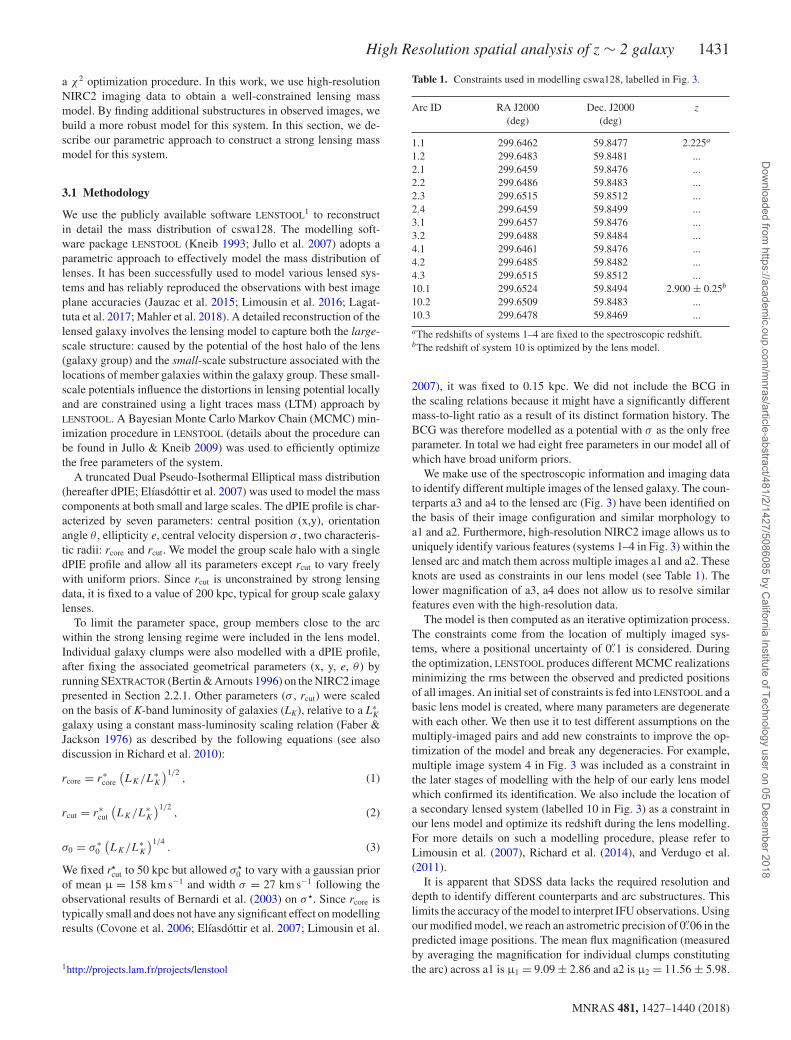
a χ2 optimization procedure. In this work, we use high-resolutionNIRC2 imaging data to obtain a well-constrained lensing massmodel. By finding additional substructures in observed images, webuild a more robust model for this system. In this section, we de-scribe our parametric approach to construct a strong lensing massmodel for this system.
3.1 Methodology
We use the publicly available software LENSTOOL1 to reconstructin detail the mass distribution of cswa128. The modelling soft-ware package LENSTOOL (Kneib 1993; Jullo et al. 2007) adopts aparametric approach to effectively model the mass distribution oflenses. It has been successfully used to model various lensed sys-tems and has reliably reproduced the observations with best imageplane accuracies (Jauzac et al. 2015; Limousin et al. 2016; Lagat-tuta et al. 2017; Mahler et al. 2018). A detailed reconstruction of thelensed galaxy involves the lensing model to capture both the large-scale structure: caused by the potential of the host halo of the lens(galaxy group) and the small-scale substructure associated with thelocations of member galaxies within the galaxy group. These small-scale potentials influence the distortions in lensing potential locallyand are constrained using a light traces mass (LTM) approach byLENSTOOL. A Bayesian Monte Carlo Markov Chain (MCMC) min-imization procedure in LENSTOOL (details about the procedure canbe found in Jullo & Kneib 2009) was used to efficiently optimizethe free parameters of the system.
A truncated Dual Pseudo-Isothermal Elliptical mass distribution(hereafter dPIE; Elıasdottir et al. 2007) was used to model the masscomponents at both small and large scales. The dPIE profile is char-acterized by seven parameters: central position (x,y), orientationangle θ , ellipticity e, central velocity dispersion σ , two characteris-tic radii: rcore and rcut. We model the group scale halo with a singledPIE profile and allow all its parameters except rcut to vary freelywith uniform priors. Since rcut is unconstrained by strong lensingdata, it is fixed to a value of 200 kpc, typical for group scale galaxylenses.
To limit the parameter space, group members close to the arcwithin the strong lensing regime were included in the lens model.Individual galaxy clumps were also modelled with a dPIE profile,after fixing the associated geometrical parameters (x, y, e, θ ) byrunning SEXTRACTOR (Bertin & Arnouts 1996) on the NIRC2 imagepresented in Section 2.2.1. Other parameters (σ , rcut) were scaledon the basis of K-band luminosity of galaxies (LK), relative to a L∗
K
galaxy using a constant mass-luminosity scaling relation (Faber &Jackson 1976) as described by the following equations (see alsodiscussion in Richard et al. 2010):
rcore = r∗core
(LK/L∗
K
)1/2, (1)
rcut = r∗cut
(LK/L∗
K
)1/2, (2)
σ0 = σ ∗0
(LK/L∗
K
)1/4. (3)
We fixed r�cut to 50 kpc but allowed σ �
0 to vary with a gaussian priorof mean μ = 158 km s−1 and width σ = 27 km s−1 following theobservational results of Bernardi et al. (2003) on σ �. Since rcore istypically small and does not have any significant effect on modellingresults (Covone et al. 2006; Elıasdottir et al. 2007; Limousin et al.
1http://projects.lam.fr/projects/lenstool
Table 1. Constraints used in modelling cswa128, labelled in Fig. 3.
Arc ID RA J2000 Dec. J2000 z
(deg) (deg)
1.1 299.6462 59.8477 2.225a
1.2 299.6483 59.8481 ...2.1 299.6459 59.8476 ...2.2 299.6486 59.8483 ...2.3 299.6515 59.8512 ...2.4 299.6459 59.8499 ...3.1 299.6457 59.8476 ...3.2 299.6488 59.8484 ...4.1 299.6461 59.8476 ...4.2 299.6485 59.8482 ...4.3 299.6515 59.8512 ...10.1 299.6524 59.8494 2.900 ± 0.25b
10.2 299.6509 59.8483 ...10.3 299.6478 59.8469 ...
aThe redshifts of systems 1–4 are fixed to the spectroscopic redshift.bThe redshift of system 10 is optimized by the lens model.
2007), it was fixed to 0.15 kpc. We did not include the BCG inthe scaling relations because it might have a significantly differentmass-to-light ratio as a result of its distinct formation history. TheBCG was therefore modelled as a potential with σ as the only freeparameter. In total we had eight free parameters in our model all ofwhich have broad uniform priors.
We make use of the spectroscopic information and imaging datato identify different multiple images of the lensed galaxy. The coun-terparts a3 and a4 to the lensed arc (Fig. 3) have been identified onthe basis of their image configuration and similar morphology toa1 and a2. Furthermore, high-resolution NIRC2 image allows us touniquely identify various features (systems 1–4 in Fig. 3) within thelensed arc and match them across multiple images a1 and a2. Theseknots are used as constraints in our lens model (see Table 1). Thelower magnification of a3, a4 does not allow us to resolve similarfeatures even with the high-resolution data.
The model is then computed as an iterative optimization process.The constraints come from the location of multiply imaged sys-tems, where a positional uncertainty of 0.′′1 is considered. Duringthe optimization, LENSTOOL produces different MCMC realizationsminimizing the rms between the observed and predicted positionsof all images. An initial set of constraints is fed into LENSTOOL and abasic lens model is created, where many parameters are degeneratewith each other. We then use it to test different assumptions on themultiply-imaged pairs and add new constraints to improve the op-timization of the model and break any degeneracies. For example,multiple image system 4 in Fig. 3 was included as a constraint inthe later stages of modelling with the help of our early lens modelwhich confirmed its identification. We also include the location ofa secondary lensed system (labelled 10 in Fig. 3) as a constraint inour lens model and optimize its redshift during the lens modelling.For more details on such a modelling procedure, please refer toLimousin et al. (2007), Richard et al. (2014), and Verdugo et al.(2011).
It is apparent that SDSS data lacks the required resolution anddepth to identify different counterparts and arc substructures. Thislimits the accuracy of the model to interpret IFU observations. Usingour modified model, we reach an astrometric precision of 0.′′06 in thepredicted image positions. The mean flux magnification (measuredby averaging the magnification for individual clumps constitutingthe arc) across a1 is μ1 = 9.09 ± 2.86 and a2 is μ2 = 11.56 ± 5.98.
MNRAS 481, 1427–1440 (2018)
Dow
nloaded from https://academ
ic.oup.com/m
nras/article-abstract/481/2/1427/5086085 by California Institute of Technology user on 05 D
ecember 2018
1432 S. Sharma et al.
4 LENSING ANALYSIS
Lensing mass models play an important role in deriving the source-plane properties of the background lensed galaxies. We derive theimage to source-plane mapping using the lens model and correctIFU observations for lensing distortion. The focus of this studyis mainly threefold: examine the source in terms of its morphol-ogy; derive kinematical patterns through velocity gradients andinvestigate chemical gradient through emission-line ratios in thegalaxy. In order to optimize the SNR of emission lines in thesource plane, we merge the two independent observations, eachfrom a different multiple image of the galaxy. The derived quan-tities from the coadded distribution undoubtedly provide a morereliable means to understand the physical conditions within thegalaxy.
Using the lens model, we employ a forward modelling approachto combine the matching spaxels (which map to the same sourceposition) from the two IFU datacubes. Then we fit the emissionlines for the combined data to derive line fluxes, velocity, and ve-locity dispersion in the source plane. Moreover, since our techniqueis adapted to lens-model magnification, we are able to achieve en-hanced H α SNR at a resolution of ∼170 pc in highly magnifiedsubregions of the source.
4.1 Traditional ray tracing approach: direct image tosource-plane mapping
We first use the cleanlens task in LENSTOOL2 to convert the im-age plane maps to their corresponding source-plane distributions.For each position in the image plane, this task computes the corre-sponding position in the source plane using the ray-tracing providedby our best-fitting lensing model. We preserve the surface bright-ness to obtain the intrinsic source-plane fluxes. The source-planereconstructions are shown in Fig. 4.
This method breaks down as we proceed further with combin-ing the individual reconstructions to obtain the overall source-planeprofile. Because lensing preferentially shears the galaxy along aspecific direction, there is a source-plane PSF associated with ev-ery reconstruction. The size of the source-plane PSF provides areliable measure of the physical resolution we can achieve in thesource plane. The orientation of the source-plane PSF is defined bythe direction of lensing amplification. Reconstruction of differentlensed images on the source plane will vary in their source-planePSFs, both in size and orientation, making the co-adding a non-trivial problem. Traditionally, multiply lensed arcs were combinedby a simple averaging after correcting for the offsets in positionand PSF orientation (Colley, Tyson & Turner 1996; Livermore et al.2012; Sharon et al. 2012; Yuan et al. 2017). However, as illustratedin Fig. 4, a simple averaging of two images a1 and a2 will notprovide an ideal improvement in the achievable SNR in the sourceplane, thus being of no significantly better use than the individualreconstructions.
4.2 Forward modelling approach: source to image planemapping
In this section, we describe our forward modelling approach to com-bine the IFU observations of two images (a1, a2) of cswa128. Weray-trace every spaxel from source to image plane at the location of
2https://projets.lam.fr/projects/lenstool/wiki/LenstoolManual
two multiple images and convolve them with their respective PSFs.Following this technique, we generate a co-added 1-D spectrum forevery source-plane spaxel by summing together the correspondingray-traced spaxels convolved with the respective PSFs in the re-spective image-plane datacubes. This method not only circumventsthe problem of combining different source-plane PSFs but also pro-vides a clever way to bin the image spaxels to maximize SNR in thesource plane.
The overall procedure is outlined in the following steps:
(i) We use the cleanlens task of LENSTOOL with a grid oversam-pling of ech = 10 on the image and sech = 5 on the source plane tocreate a template source-plane frame. The source plane pixel-scaleafter over-sampling is 0.′′02. This template frame is only created fordetermining the source plane region that corresponds to the FOV ofobservations in the image plane.
(ii) Next, we create a series of source-plane masks, each contain-ing certain number of selected pixels. These masks, when addedtogether cover adequately the entire region of the template sourceframe created in the previous step. The number of highlighted pixelsin each mask depend on their location with respect to the causticin the source plane. Because the source-plane pixels lying close tothe caustic are highly magnified, they map to a larger part of imagearea. In such regions, we define masks of individual pixels whereasfor regions with lower magnification, we increase the number ofselected pixels. In low μ–high SNR regions of the data cube weresort to single pixel masks.
(iii) Each of the source-plane masks are then sent to the im-age plane using LENSTOOL. The simulated image plane masks foreach multiple image involve convolution by image PSF so that theycan be directly compared with the observed images. We matchthe simulated masks with the observed datacubes to determinethe image-plane spaxels ray traced from each of the source-planemasks.
(iv) This set of image plane pixels from the two IFU datacubes arethen averaged together for each wavelength to create a 1D spectrumassociated with every source-plane mask.
(v) Emission lines, H α and [N II], are fit simultaneously for each1D spectra following the same fitting procedure as described inSection 2.2.2. We then manually inspect each fitted spectrum toreject spurious detections. We also note that the fitted parameters donot change significantly with a range of different initial conditionsfor the source-plane spaxels in the fitting routine. We set a SNR cutof 5σ on H α and 3σ on [N II] emission lines. If the achieved H α
SNR < 5σ as a result of our fitting routine, we increase the size ofour masks and repeat steps (i)–(v). For source-plane pixels selectedin more than one mask, we choose the fitting result with betterH α SNR.
We notice that a mask size of upto 5 × 5 pixels is sufficient toobtain an emission-line fitting result of H α SNR ≥ 5σ in differentregions of the source. Using our adaptive forward modelling tech-nique, we exploit the lensing amplification to optimize the spatialresolution in the source plane. This allows us to confidently analysethe dynamics of the lensed target which was previously limited onlyto the high SNR regions of the image plane.
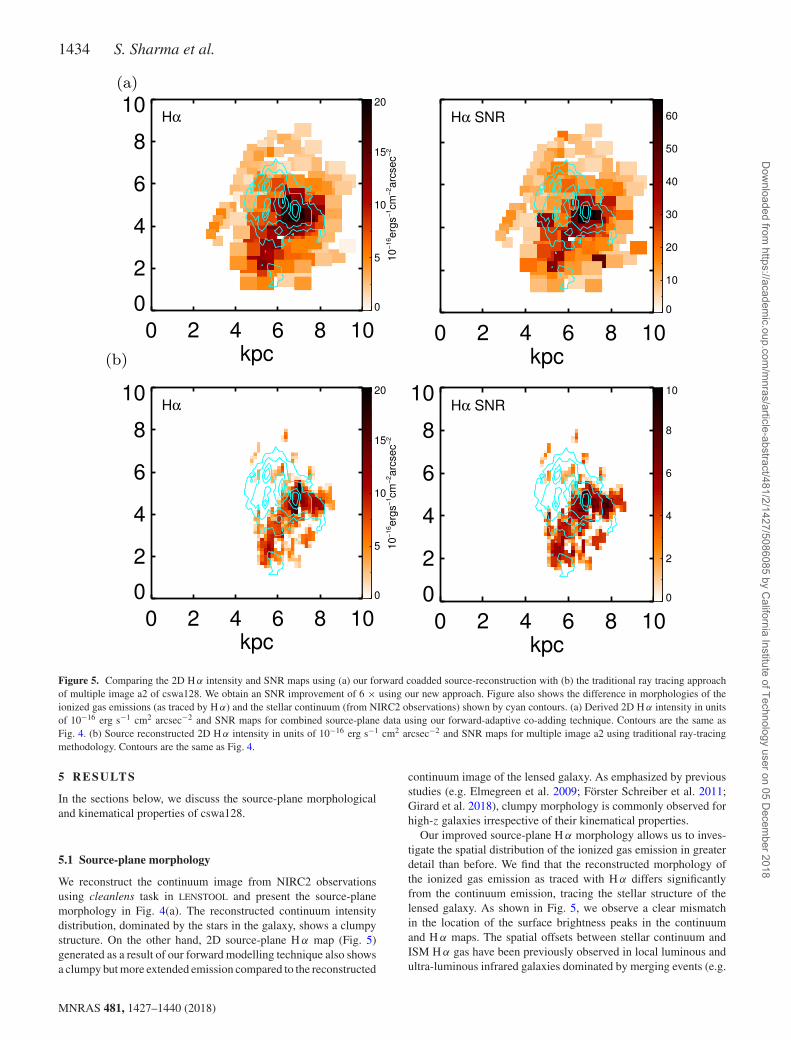
In Fig. 5, we compare the source reconstructions from our for-ward modelling technique with the traditional ray tracing method-ology. We ray-trace the image plane fitted 2D H α intensity mapfor multiple image a2 (as shown in Fig. 2) and H α SNR map backto the source plane and compare them to our coadded source-planereconstruction. As apparent in Fig. 5, we are able to obtain a SNRimprovement by a factor >5 in the source plane. The improved
MNRAS 481, 1427–1440 (2018)
Dow
nloaded from https://academ
ic.oup.com/m
nras/article-abstract/481/2/1427/5086085 by California Institute of Technology user on 05 D
ecember 2018
High Resolution spatial analysis of z ∼ 2 galaxy 1433
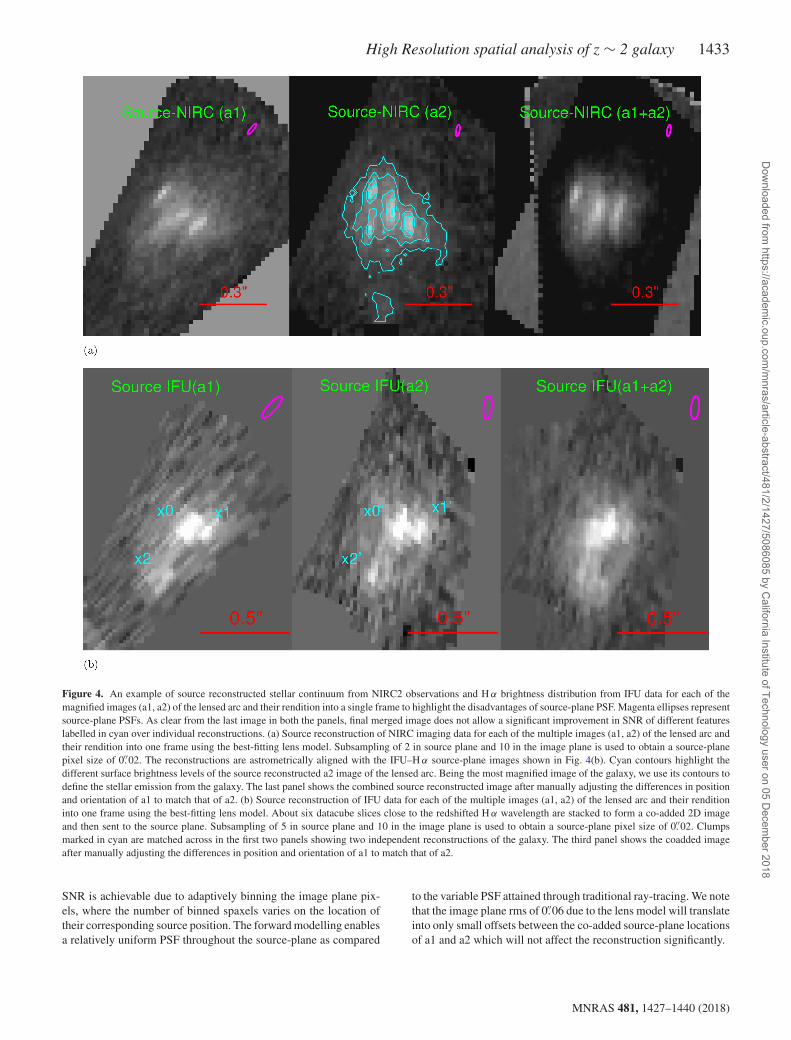
Figure 4. An example of source reconstructed stellar continuum from NIRC2 observations and H α brightness distribution from IFU data for each of themagnified images (a1, a2) of the lensed arc and their rendition into a single frame to highlight the disadvantages of source-plane PSF. Magenta ellipses representsource-plane PSFs. As clear from the last image in both the panels, final merged image does not allow a significant improvement in SNR of different featureslabelled in cyan over individual reconstructions. (a) Source reconstruction of NIRC imaging data for each of the multiple images (a1, a2) of the lensed arc andtheir rendition into one frame using the best-fitting lens model. Subsampling of 2 in source plane and 10 in the image plane is used to obtain a source-planepixel size of 0.′′02. The reconstructions are astrometrically aligned with the IFU–H α source-plane images shown in Fig. 4(b). Cyan contours highlight thedifferent surface brightness levels of the source reconstructed a2 image of the lensed arc. Being the most magnified image of the galaxy, we use its contours todefine the stellar emission from the galaxy. The last panel shows the combined source reconstructed image after manually adjusting the differences in positionand orientation of a1 to match that of a2. (b) Source reconstruction of IFU data for each of the multiple images (a1, a2) of the lensed arc and their renditioninto one frame using the best-fitting lens model. About six datacube slices close to the redshifted H α wavelength are stacked to form a co-added 2D imageand then sent to the source plane. Subsampling of 5 in source plane and 10 in the image plane is used to obtain a source-plane pixel size of 0.′′02. Clumpsmarked in cyan are matched across in the first two panels showing two independent reconstructions of the galaxy. The third panel shows the coadded imageafter manually adjusting the differences in position and orientation of a1 to match that of a2.
SNR is achievable due to adaptively binning the image plane pix-els, where the number of binned spaxels varies on the location oftheir corresponding source position. The forward modelling enablesa relatively uniform PSF throughout the source-plane as compared
to the variable PSF attained through traditional ray-tracing. We notethat the image plane rms of 0.′′06 due to the lens model will translateinto only small offsets between the co-added source-plane locationsof a1 and a2 which will not affect the reconstruction significantly.
MNRAS 481, 1427–1440 (2018)
Dow
nloaded from https://academ
ic.oup.com/m
nras/article-abstract/481/2/1427/5086085 by California Institute of Technology user on 05 D
ecember 2018
1434 S. Sharma et al.
Figure 5. Comparing the 2D H α intensity and SNR maps using (a) our forward coadded source-reconstruction with (b) the traditional ray tracing approachof multiple image a2 of cswa128. We obtain an SNR improvement of 6 × using our new approach. Figure also shows the difference in morphologies of theionized gas emissions (as traced by H α) and the stellar continuum (from NIRC2 observations) shown by cyan contours. (a) Derived 2D H α intensity in unitsof 10−16 erg s−1 cm2 arcsec−2 and SNR maps for combined source-plane data using our forward-adaptive co-adding technique. Contours are the same asFig. 4. (b) Source reconstructed 2D H α intensity in units of 10−16 erg s−1 cm2 arcsec−2 and SNR maps for multiple image a2 using traditional ray-tracingmethodology. Contours are the same as Fig. 4.
5 R ESULTS
In the sections below, we discuss the source-plane morphologicaland kinematical properties of cswa128.
5.1 Source-plane morphology
We reconstruct the continuum image from NIRC2 observationsusing cleanlens task in LENSTOOL and present the source-planemorphology in Fig. 4(a). The reconstructed continuum intensitydistribution, dominated by the stars in the galaxy, shows a clumpystructure. On the other hand, 2D source-plane H α map (Fig. 5)generated as a result of our forward modelling technique also showsa clumpy but more extended emission compared to the reconstructed
continuum image of the lensed galaxy. As emphasized by previousstudies (e.g. Elmegreen et al. 2009; Forster Schreiber et al. 2011;Girard et al. 2018), clumpy morphology is commonly observed forhigh-z galaxies irrespective of their kinematical properties.
Our improved source-plane H α morphology allows us to inves-tigate the spatial distribution of the ionized gas emission in greaterdetail than before. We find that the reconstructed morphology ofthe ionized gas emission as traced with H α differs significantlyfrom the continuum emission, tracing the stellar structure of thelensed galaxy. As shown in Fig. 5, we observe a clear mismatchin the location of the surface brightness peaks in the continuumand H α maps. The spatial offsets between stellar continuum andISM H α gas have been previously observed in local luminous andultra-luminous infrared galaxies dominated by merging events (e.g.
MNRAS 481, 1427–1440 (2018)
Dow
nloaded from https://academ
ic.oup.com/m
nras/article-abstract/481/2/1427/5086085 by California Institute of Technology user on 05 D
ecember 2018
High Resolution spatial analysis of z ∼ 2 galaxy 1435
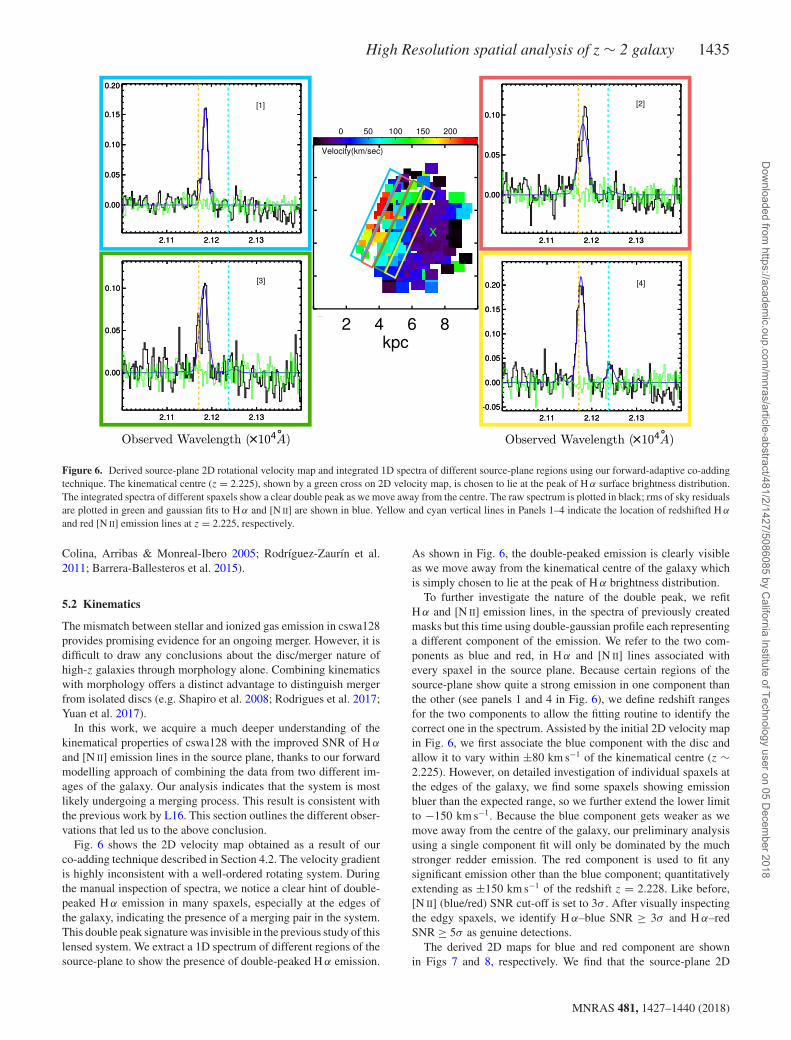
Figure 6. Derived source-plane 2D rotational velocity map and integrated 1D spectra of different source-plane regions using our forward-adaptive co-addingtechnique. The kinematical centre (z = 2.225), shown by a green cross on 2D velocity map, is chosen to lie at the peak of H α surface brightness distribution.The integrated spectra of different spaxels show a clear double peak as we move away from the centre. The raw spectrum is plotted in black; rms of sky residualsare plotted in green and gaussian fits to H α and [N II] are shown in blue. Yellow and cyan vertical lines in Panels 1–4 indicate the location of redshifted H α
and red [N II] emission lines at z = 2.225, respectively.
Colina, Arribas & Monreal-Ibero 2005; Rodrıguez-Zaurın et al.2011; Barrera-Ballesteros et al. 2015).
5.2 Kinematics
The mismatch between stellar and ionized gas emission in cswa128provides promising evidence for an ongoing merger. However, it isdifficult to draw any conclusions about the disc/merger nature ofhigh-z galaxies through morphology alone. Combining kinematicswith morphology offers a distinct advantage to distinguish mergerfrom isolated discs (e.g. Shapiro et al. 2008; Rodrigues et al. 2017;Yuan et al. 2017).
In this work, we acquire a much deeper understanding of thekinematical properties of cswa128 with the improved SNR of H α
and [N II] emission lines in the source plane, thanks to our forwardmodelling approach of combining the data from two different im-ages of the galaxy. Our analysis indicates that the system is mostlikely undergoing a merging process. This result is consistent withthe previous work by L16. This section outlines the different obser-vations that led us to the above conclusion.
Fig. 6 shows the 2D velocity map obtained as a result of ourco-adding technique described in Section 4.2. The velocity gradientis highly inconsistent with a well-ordered rotating system. Duringthe manual inspection of spectra, we notice a clear hint of double-peaked H α emission in many spaxels, especially at the edges ofthe galaxy, indicating the presence of a merging pair in the system.This double peak signature was invisible in the previous study of thislensed system. We extract a 1D spectrum of different regions of thesource-plane to show the presence of double-peaked H α emission.
As shown in Fig. 6, the double-peaked emission is clearly visibleas we move away from the kinematical centre of the galaxy whichis simply chosen to lie at the peak of H α brightness distribution.
To further investigate the nature of the double peak, we refitH α and [N II] emission lines, in the spectra of previously createdmasks but this time using double-gaussian profile each representinga different component of the emission. We refer to the two com-ponents as blue and red, in H α and [N II] lines associated withevery spaxel in the source plane. Because certain regions of thesource-plane show quite a strong emission in one component thanthe other (see panels 1 and 4 in Fig. 6), we define redshift rangesfor the two components to allow the fitting routine to identify thecorrect one in the spectrum. Assisted by the initial 2D velocity mapin Fig. 6, we first associate the blue component with the disc andallow it to vary within ±80 km s−1 of the kinematical centre (z ∼2.225). However, on detailed investigation of individual spaxels atthe edges of the galaxy, we find some spaxels showing emissionbluer than the expected range, so we further extend the lower limitto −150 km s−1. Because the blue component gets weaker as wemove away from the centre of the galaxy, our preliminary analysisusing a single component fit will only be dominated by the muchstronger redder emission. The red component is used to fit anysignificant emission other than the blue component; quantitativelyextending as ±150 km s−1 of the redshift z = 2.228. Like before,[N II] (blue/red) SNR cut-off is set to 3σ . After visually inspectingthe edgy spaxels, we identify H α–blue SNR ≥ 3σ and H α–redSNR ≥ 5σ as genuine detections.
The derived 2D maps for blue and red component are shownin Figs 7 and 8, respectively. We find that the source-plane 2D
MNRAS 481, 1427–1440 (2018)
Dow
nloaded from https://academ
ic.oup.com/m
nras/article-abstract/481/2/1427/5086085 by California Institute of Technology user on 05 D
ecember 2018
1436 S. Sharma et al.
0 2 4 6 8 10kpc
0
2
4
6
8
100 10 20 30 40
Hα (10−16erg/s/cm−2 arcsec−2)
0 2 4 6 8 10kpc
0
2
4
6
8
100.0 0.5 1.0 1.5 2.0 2.5 3.0
[NII] (10−16erg/s/cm−2 arcsec−2)
0 2 4 6 8 10kpc
0
2
4
6
8
100 20 40 60 80 100 120 140
Dispersion (km/sec)
0 2 4 6 8 10kpc
0
2
4
6
8
10−150 −100 −50 0 50 100
Velocity (km/sec)
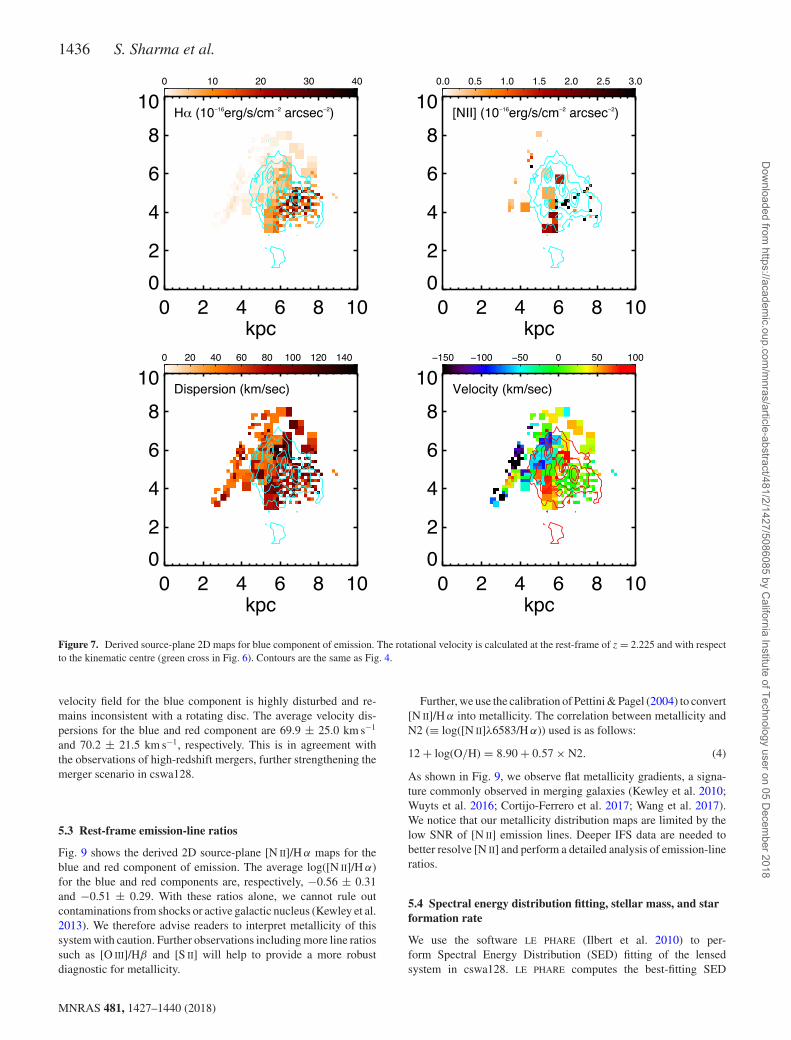
Figure 7. Derived source-plane 2D maps for blue component of emission. The rotational velocity is calculated at the rest-frame of z = 2.225 and with respectto the kinematic centre (green cross in Fig. 6). Contours are the same as Fig. 4.
velocity field for the blue component is highly disturbed and re-mains inconsistent with a rotating disc. The average velocity dis-persions for the blue and red component are 69.9 ± 25.0 km s−1
and 70.2 ± 21.5 km s−1, respectively. This is in agreement withthe observations of high-redshift mergers, further strengthening themerger scenario in cswa128.
5.3 Rest-frame emission-line ratios
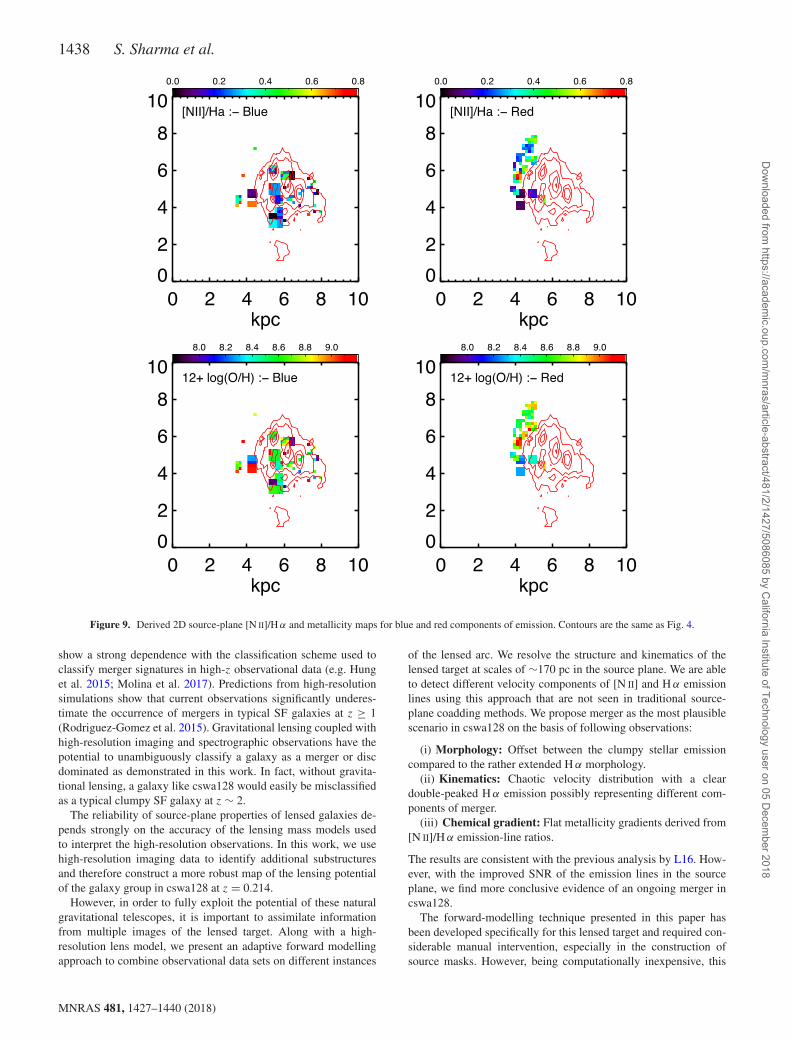
Fig. 9 shows the derived 2D source-plane [N II]/H α maps for theblue and red component of emission. The average log([N II]/H α)for the blue and red components are, respectively, −0.56 ± 0.31and −0.51 ± 0.29. With these ratios alone, we cannot rule outcontaminations from shocks or active galactic nucleus (Kewley et al.2013). We therefore advise readers to interpret metallicity of thissystem with caution. Further observations including more line ratiossuch as [O III]/Hβ and [S II] will help to provide a more robustdiagnostic for metallicity.
Further, we use the calibration of Pettini & Pagel (2004) to convert[N II]/H α into metallicity. The correlation between metallicity andN2 (≡ log([N II]λ6583/H α)) used is as follows:
12 + log(O/H) = 8.90 + 0.57 × N2. (4)
As shown in Fig. 9, we observe flat metallicity gradients, a signa-ture commonly observed in merging galaxies (Kewley et al. 2010;Wuyts et al. 2016; Cortijo-Ferrero et al. 2017; Wang et al. 2017).We notice that our metallicity distribution maps are limited by thelow SNR of [N II] emission lines. Deeper IFS data are needed tobetter resolve [N II] and perform a detailed analysis of emission-lineratios.
5.4 Spectral energy distribution fitting, stellar mass, and starformation rate
We use the software LE PHARE (Ilbert et al. 2010) to per-form Spectral Energy Distribution (SED) fitting of the lensedsystem in cswa128. LE PHARE computes the best-fitting SED
MNRAS 481, 1427–1440 (2018)
Dow
nloaded from https://academ
ic.oup.com/m
nras/article-abstract/481/2/1427/5086085 by California Institute of Technology user on 05 D
ecember 2018
High Resolution spatial analysis of z ∼ 2 galaxy 1437
0 2 4 6 8 10kpc
0
2
4
6
8
100 2 4 6 8
Hα (10−16erg/s/cm−2 arcsec−2)
0 2 4 6 8 10kpc
0
2
4
6
8
100.0 0.5 1.0 1.5 2.0 2.5
[NII] (10−16erg/s/cm−2 arcsec−2)
0 2 4 6 8 10kpc
0
2
4
6
8
100 20 40 60 80 100 120
Dispersion (km/sec)
0 2 4 6 8 10kpc
0
2
4
6
8
100 50 100 150 200 250 300
Velocity (km/sec)
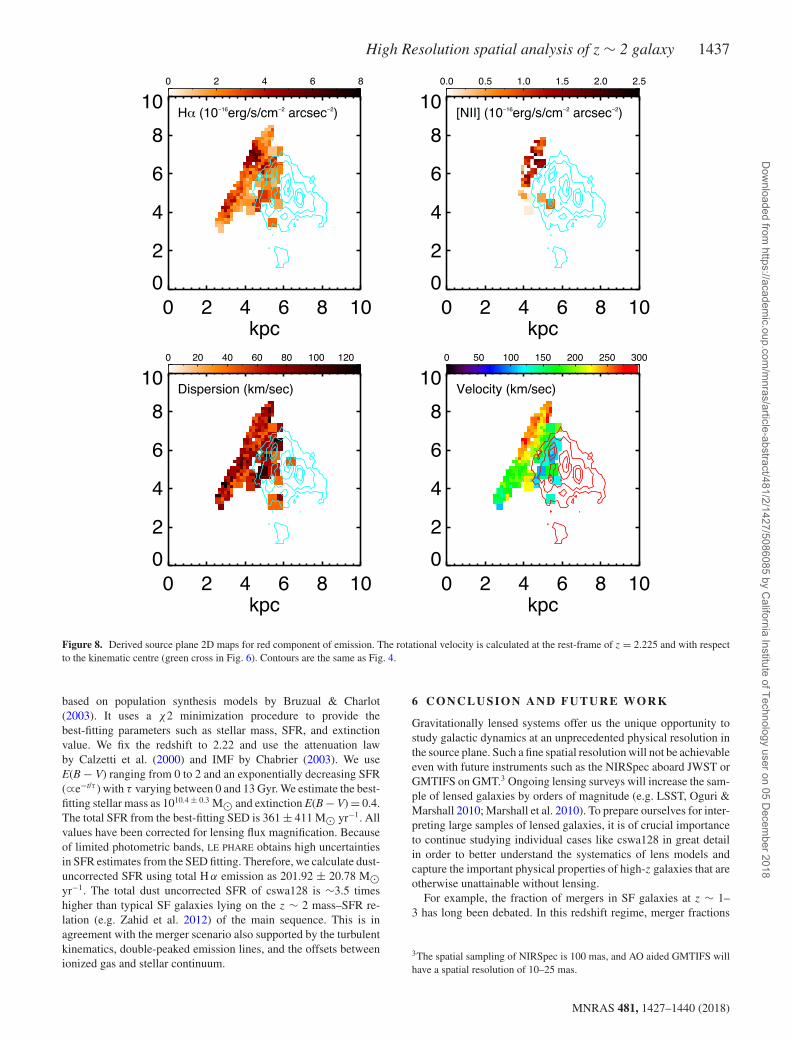
Figure 8. Derived source plane 2D maps for red component of emission. The rotational velocity is calculated at the rest-frame of z = 2.225 and with respectto the kinematic centre (green cross in Fig. 6). Contours are the same as Fig. 4.
based on population synthesis models by Bruzual & Charlot(2003). It uses a χ2 minimization procedure to provide thebest-fitting parameters such as stellar mass, SFR, and extinctionvalue. We fix the redshift to 2.22 and use the attenuation lawby Calzetti et al. (2000) and IMF by Chabrier (2003). We useE(B − V) ranging from 0 to 2 and an exponentially decreasing SFR(∝e−t/τ ) with τ varying between 0 and 13 Gyr. We estimate the best-fitting stellar mass as 1010.4 ± 0.3 M and extinction E(B − V) = 0.4.The total SFR from the best-fitting SED is 361 ± 411 M yr−1. Allvalues have been corrected for lensing flux magnification. Becauseof limited photometric bands, LE PHARE obtains high uncertaintiesin SFR estimates from the SED fitting. Therefore, we calculate dust-uncorrected SFR using total H α emission as 201.92 ± 20.78 Myr−1. The total dust uncorrected SFR of cswa128 is ∼3.5 timeshigher than typical SF galaxies lying on the z ∼ 2 mass–SFR re-lation (e.g. Zahid et al. 2012) of the main sequence. This is inagreement with the merger scenario also supported by the turbulentkinematics, double-peaked emission lines, and the offsets betweenionized gas and stellar continuum.
6 C O N C L U S I O N A N D F U T U R E WO R K
Gravitationally lensed systems offer us the unique opportunity tostudy galactic dynamics at an unprecedented physical resolution inthe source plane. Such a fine spatial resolution will not be achievableeven with future instruments such as the NIRSpec aboard JWST orGMTIFS on GMT.3 Ongoing lensing surveys will increase the sam-ple of lensed galaxies by orders of magnitude (e.g. LSST, Oguri &Marshall 2010; Marshall et al. 2010). To prepare ourselves for inter-preting large samples of lensed galaxies, it is of crucial importanceto continue studying individual cases like cswa128 in great detailin order to better understand the systematics of lens models andcapture the important physical properties of high-z galaxies that areotherwise unattainable without lensing.
For example, the fraction of mergers in SF galaxies at z ∼ 1–3 has long been debated. In this redshift regime, merger fractions
3The spatial sampling of NIRSpec is 100 mas, and AO aided GMTIFS willhave a spatial resolution of 10–25 mas.
MNRAS 481, 1427–1440 (2018)
Dow
nloaded from https://academ
ic.oup.com/m
nras/article-abstract/481/2/1427/5086085 by California Institute of Technology user on 05 D
ecember 2018
1438 S. Sharma et al.
0 2 4 6 8 10kpc
0
2
4
6
8
100.0 0.2 0.4 0.6 0.8
[NII]/Ha :− Blue
0 2 4 6 8 10kpc
0
2
4
6
8
100.0 0.2 0.4 0.6 0.8
[NII]/Ha :− Red
0 2 4 6 8 10kpc
0
2
4
6
8
108.0 8.2 8.4 8.6 8.8 9.0
12+ log(O/H) :− Blue
0 2 4 6 8 10kpc
0
2
4
6
8
108.0 8.2 8.4 8.6 8.8 9.0
12+ log(O/H) :− Red
Figure 9. Derived 2D source-plane [N II]/H α and metallicity maps for blue and red components of emission. Contours are the same as Fig. 4.
show a strong dependence with the classification scheme used toclassify merger signatures in high-z observational data (e.g. Hunget al. 2015; Molina et al. 2017). Predictions from high-resolutionsimulations show that current observations significantly underes-timate the occurrence of mergers in typical SF galaxies at z ≥ 1(Rodriguez-Gomez et al. 2015). Gravitational lensing coupled withhigh-resolution imaging and spectrographic observations have thepotential to unambiguously classify a galaxy as a merger or discdominated as demonstrated in this work. In fact, without gravita-tional lensing, a galaxy like cswa128 would easily be misclassifiedas a typical clumpy SF galaxy at z ∼ 2.
The reliability of source-plane properties of lensed galaxies de-pends strongly on the accuracy of the lensing mass models usedto interpret the high-resolution observations. In this work, we usehigh-resolution imaging data to identify additional substructuresand therefore construct a more robust map of the lensing potentialof the galaxy group in cswa128 at z = 0.214.
However, in order to fully exploit the potential of these naturalgravitational telescopes, it is important to assimilate informationfrom multiple images of the lensed target. Along with a high-resolution lens model, we present an adaptive forward modellingapproach to combine observational data sets on different instances
of the lensed arc. We resolve the structure and kinematics of thelensed target at scales of ∼170 pc in the source plane. We are ableto detect different velocity components of [N II] and H α emissionlines using this approach that are not seen in traditional source-plane coadding methods. We propose merger as the most plausiblescenario in cswa128 on the basis of following observations:
(i) Morphology: Offset between the clumpy stellar emissioncompared to the rather extended H α morphology.
(ii) Kinematics: Chaotic velocity distribution with a cleardouble-peaked H α emission possibly representing different com-ponents of merger.
(iii) Chemical gradient: Flat metallicity gradients derived from[N II]/H α emission-line ratios.
The results are consistent with the previous analysis by L16. How-ever, with the improved SNR of the emission lines in the sourceplane, we find more conclusive evidence of an ongoing merger incswa128.
The forward-modelling technique presented in this paper hasbeen developed specifically for this lensed target and required con-siderable manual intervention, especially in the construction ofsource masks. However, being computationally inexpensive, this
MNRAS 481, 1427–1440 (2018)
Dow
nloaded from https://academ
ic.oup.com/m
nras/article-abstract/481/2/1427/5086085 by California Institute of Technology user on 05 D
ecember 2018
High Resolution spatial analysis of z ∼ 2 galaxy 1439
approach offers a very quick and effective way of combining thedata from multiple images to enhance the SNR of emission-linemaps in the source plane. In our follow-up work, we extend thisforward source-modelling approach to a fully automated inversionof extended lensed images in a Bayesian manner. We present analgorithm in LENSTOOL to obtain a discretized surface brightnessdistribution in the source plane for a fixed mass profile of the lens.We use a pixelized grid and Bayesian MCMC optimization algo-rithm implemented in LENSTOOL to employ a forward-modellingapproach to deconvolve PSF effects from the source profile. Thealgorithm allows higher flexibility than traditional parametric waysof modelling source galaxies thus allowing for unbiased recon-structions of irregular source morphologies. Moreover, this methodwill be widely applicable in studying a variety of lensed systemsthat will become available with the future instruments and lensedsurveys (Agnello et al. 2018; Rydberg et al. 2018).
AC K N OW L E D G E M E N T S
We thank the comments of the anonymous referee, which helped toimprove the paper. This work is based on data obtained at the W. M.Keck Observatory. We are grateful to the Keck Observatory stafffor assistance with our observations, especially Randy Campbelland Jason. This research was supported by the Australian ResearchCouncil Centre of Excellence for All Sky Astrophysics in 3 Dimen-sions (ASTRO 3D), through project number CE170100013. Wethank Richard Ellis for sharing his OSIRIS data. SS thanks usefuldiscussions with Prasun Dutta, GEARS3D, and CALENDS group.SS is also thankful to Surya Narayan Sahoo for technical help informatting some of the figures in the paper. The authors wish torecognize and acknowledge the very significant cultural role andreverence that the summit of Mauna Kea has always had within theindigenous Hawaiian community.
RE FERENCES
Acebron A., Jullo E., Limousin M., Tilquin A., Giocoli C., Jauzac M.,Mahler G., Richard J., 2017, MNRAS, 470, 1809
Agnello A. et al., 2018, MNRAS, 479, 4345Auger M. W., Budzynski J. M., Belokurov V., Koposov S. E., McCarthy I.
G., 2013, MNRAS, 436, 503Barrera-Ballesteros J. K. et al., 2015, A&A, 582, A21Bayliss M. B., Johnson T., Gladders M. D., Sharon K., Oguri M., 2014a,
ApJ, 783, 41Bayliss M. B., Rigby J. R., Sharon K., Wuyts E., Florian M., Gladders M.
D., Johnson T., Oguri M., 2014b, ApJ, 790, 144Bernardi M. et al., 2003, AJ, 125, 1849Bertin E., Arnouts S., 1996, A&AS, 117, 393Bruzual G., Charlot S., 2003, MNRAS, 344, 1000Calzetti D., Armus L., Bohlin R. C., Kinney A. L., Koornneef J., Storchi-
Bergmann T., 2000, ApJ, 533, 682Caminha G. B. et al., 2017, A&A, 607, A93Chabrier G., 2003, PASP, 115, 763Coe D., Benıtez N., Broadhurst T., Moustakas L. A., 2010, ApJ, 723, 1678Colina L., Arribas S., Monreal-Ibero A., 2005, ApJ, 621, 725Collett T. E., 2015, ApJ, 811, 20Colley W. N., Tyson J. A., Turner E. L., 1996, ApJ, 461, L83Contini T. et al., 2012, A&A, 539, A91Cortijo-Ferrero C. et al., 2017, MNRAS, 467, 3898Covone G., Adami C., Durret F., Kneib J.-P., Lima Neto G. B., Slezak E.,
2006, A&A, 460, 381Davies R. I., 2007, MNRAS, 375, 1099Dessauges-Zavadsky M. et al., 2017, A&A, 605, A81Elıasdottir A. et al., 2007, preprint (arXiv:0710.5636)
Elmegreen B. G., Elmegreen D. M., Chandar R., Whitmore B., Regan M.,2006, ApJ, 644, 879
Elmegreen D. M., Elmegreen B. G., Marcus M. T., Shahinyan K., Yau A.,Petersen M., 2009, ApJ, 701, 306
Faber S. M., Jackson R. E., 1976, ApJ, 204, 668Flores H., Hammer F., Puech M., Amram P., Balkowski C., 2006, A&A,
455, 107Forster Schreiber N. M. et al., 2006, The Messenger, 125Forster Schreiber N. M. et al., 2011, ApJ, 739, 45Forster Schreiber N. M. et al., 2018, preprint (arXiv:1802.07276)Genzel R. et al., 2011, ApJ, 733, 101Girard M. et al., 2018, A&A, 613, A72Glazebrook K., 2013, PASA, 30, e056Gnerucci A. et al., 2011, A&A, 528, A88Gusev A. S., 2014, MNRAS, 442, 3711Hung C.-L. et al., 2015, ApJ, 803, 62Ilbert O. et al., 2010, ApJ, 709, 644Jauzac M. et al., 2015, MNRAS, 446, 4132Johnson T. L., Sharon K., 2016, ApJ, 832, 82Johnson T. L. et al., 2017, ApJ, 843, 78Jones T., Ellis R., Jullo E., Richard J., 2010a, ApJ, 725, L176Jones T. A., Swinbank A. M., Ellis R. S., Richard J., Stark D. P., 2010b,
MNRAS, 404, 1247Jones T., Ellis R. S., Richard J., Jullo E., 2013, ApJ, 765, 48Jones T. et al., 2015, AJ, 149, 107Jullo E., Kneib J.-P., 2009, MNRAS, 395, 1319Jullo E., Kneib J.-P., Limousin M., Elıasdottir A., Marshall P. J., Verdugo
T., 2007, New J. Phys., 9, 447Kewley L. J., Rupke D., Zahid H. J., Geller M. J., Barton E. J., 2010, ApJ,
721, L48Kewley L. J., Maier C., Yabe K., Ohta K., Akiyama M., Dopita M. A., Yuan
T., 2013, ApJ, 774, L10Kneib J.-P., 1993, PhD thesis, Universite Paul Sabatier, ToulouseLagattuta D. J. et al., 2017, MNRAS, 469, 3946Larkin J. et al., 2006, New Astron. Rev., 50, 362Leethochawalit N., Jones T. A., Ellis R. S., Stark D. P., Richard J., Zitrin A.,
Auger M., 2016, ApJ, 820, 84Limousin M. et al., 2007, ApJ, 668, 643Limousin M. et al., 2016, A&A, 588, A99Livermore R. C. et al., 2012, MNRAS, 427, 688Livermore R. C. et al., 2015, MNRAS, 450, 1812Madau P., Dickinson M., 2014, ARA&A, 52, 415Mahler G. et al., 2018, MNRAS, 473, 663Maiolino R. et al., 2008, A&A, 488, 463Marshall P. J. et al., 2010, BAAS, 42, American Astronomical Society
Meeting Abstracts #215, 219Mason C. A. et al., 2017, ApJ, 838, 14Molina J., Ibar E., Swinbank A. M., Sobral D., Best P. N., Smail I., Escala
A., Cirasuolo M., 2017, MNRAS, 466, 892Nightingale J. W., Dye S., 2015, MNRAS, 452, 2940Oguri M., Marshall P. J., 2010, MNRAS, 405, 2579Oke J. B., Gunn J. E., 1983, ApJ, 266, 713Patrıcio V. et al., 2018, MNRAS, 477, 18Pettini M., Pagel B. E. J., 2004, MNRAS, 348, L59Richard J. et al., 2010, MNRAS, 404, 325Richard J., Jones T., Ellis R., Stark D. P., Livermore R., Swinbank M., 2011,
MNRAS, 413, 643Richard J. et al., 2014, MNRAS, 444, 268Rodrigues M., Hammer F., Flores H., Puech M., Athanassoula E., 2017,
MNRAS, 465, 1157Rodriguez-Gomez V. et al., 2015, MNRAS, 449, 49Rodrıguez-Zaurın J., Arribas S., Monreal-Ibero A., Colina L., Alonso-
Herrero A., Alfonso-Garzon J., 2011, A&A, 527, A60Rydberg C.-E., Whalen D. J., Maturi M., Collett T., Carrasco M., Magg M.,
Klessen R. S., 2018, preprint (arXiv:1805.02662)Shapiro K. L. et al., 2008, ApJ, 682, 231Sharon K., Gladders M. D., Rigby J. R., Wuyts E., Koester B. P., Bayliss M.
B., Barrientos L. F., 2012, ApJ, 746, 161
MNRAS 481, 1427–1440 (2018)
Dow
nloaded from https://academ
ic.oup.com/m
nras/article-abstract/481/2/1427/5086085 by California Institute of Technology user on 05 D
ecember 2018
1440 S. Sharma et al.
Stark D. P. et al., 2013, MNRAS, 436, 1040Swinbank A. M., Bower R. G., Smith G. P., Smail I., Kneib J.-P., Ellis R.
S., Stark D. P., Bunker A. J., 2006, MNRAS, 368, 1631Tessore N., Bellagamba F., Metcalf R. B., 2016, MNRAS, 463, 3115Verdugo T., Motta V., Munoz R. P., Limousin M., Cabanac R., Richard J.,
2011, A&A, 527, A124Wang X. et al., 2017, ApJ, 837, 89Warren S. J., Dye S., 2003, ApJ, 590, 673Wisnioski E. et al., 2015, ApJ, 799, 209Wizinowich P. L. et al., 2006, PASP, 118, 297Wuyts E. et al., 2016, ApJ, 827, 74
York D. G. et al., 2000, AJ, 120, 1579Yuan T. et al., 2017, ApJ, 850, 61Yuan T.-T., Kewley L. J., Swinbank A. M., Richard J., 2012, ApJ, 759, 66Yuan T.-T., Kewley L. J., Rich J., 2013, ApJ, 767, 106Zahid H. J., Dima G. I., Kewley L. J., Erb D. K., Dave R., 2012, ApJ, 757,
54
This paper has been typeset from a TEX/LATEX file prepared by the author.
MNRAS 481, 1427–1440 (2018)
Dow
nloaded from https://academ
ic.oup.com/m
nras/article-abstract/481/2/1427/5086085 by California Institute of Technology user on 05 D
ecember 2018
Related Documents


![Spatially Resolved [C ii] Emission in SPT0346-52: A Hyper ... · Spilker et al. 2016;Strandetetal.2016). SPT0346-52 is a gravitationally lensed galaxy at z = 5.6559 (Weiß et al.](https://static.cupdf.com/doc/110x72/60befdb4b03e8f6452112455/spatially-resolved-c-ii-emission-in-spt0346-52-a-hyper-spilker-et-al-2016strandetetal2016.jpg)
