High-Resolution Satellite Imagery Is an Important yet Underutilized Resource in Conservation Biology Sarah A. Boyle 1 *, Christina M. Kennedy 2 , Julio Torres 3 , Karen Colman 4 , Pastor E. Pe ´ rez-Estigarribia 5 , Noe ´ U. de la Sancha 6 1 Department of Biology, Rhodes College, Memphis, Tennessee, United States of America, 2 Development by Design Program, The Nature Conservancy, Fort Collins, Colorado, United States of America, 3 Unidad de Investigacio ´ n Sistema ´ tica, Diversidad y Evolucio ´ n, Centro Nacional Patago ´ nico, Puerto Madryn, Chubut, Argentina, 4 Direccio ´ n de Vida Silvestre, Secretarı ´a del Ambiente, Asuncio ´ n, Paraguay, 5 Programa de Magister en Ciencias, Mencio ´ n en Zoologı ´a, Universidad de Concepcio ´ n, Concepcio ´ n, Chile, 6 Science and Education, The Field Museum of Natural History, Chicago, Illinois, United States of America Abstract Technological advances and increasing availability of high-resolution satellite imagery offer the potential for more accurate land cover classifications and pattern analyses, which could greatly improve the detection and quantification of land cover change for conservation. Such remotely-sensed products, however, are often expensive and difficult to acquire, which prohibits or reduces their use. We tested whether imagery of high spatial resolution (#5 m) differs from lower-resolution imagery ($30 m) in performance and extent of use for conservation applications. To assess performance, we classified land cover in a heterogeneous region of Interior Atlantic Forest in Paraguay, which has undergone recent and dramatic human- induced habitat loss and fragmentation. We used 4 m multispectral IKONOS and 30 m multispectral Landsat imagery and determined the extent to which resolution influenced the delineation of land cover classes and patch-level metrics. Higher- resolution imagery more accurately delineated cover classes, identified smaller patches, retained patch shape, and detected narrower, linear patches. To assess extent of use, we surveyed three conservation journals (Biological Conservation, Biotropica, Conservation Biology) and found limited application of high-resolution imagery in research, with only 26.8% of land cover studies analyzing satellite imagery, and of these studies only 10.4% used imagery #5 m resolution. Our results suggest that high-resolution imagery is warranted yet under-utilized in conservation research, but is needed to adequately monitor and evaluate forest loss and conversion, and to delineate potentially important stepping-stone fragments that may serve as corridors in a human-modified landscape. Greater access to low-cost, multiband, high-resolution satellite imagery would therefore greatly facilitate conservation management and decision-making. Citation: Boyle SA, Kennedy CM, Torres J, Colman K, Pe ´ rez-Estigarribia PE, et al. (2014) High-Resolution Satellite Imagery Is an Important yet Underutilized Resource in Conservation Biology. PLoS ONE 9(1): e86908. doi:10.1371/journal.pone.0086908 Editor: Hans-Ulrich Peter, Institute of Ecology, Germany Received August 4, 2013; Accepted December 16, 2013; Published January 23, 2014 Copyright: ß 2014 Boyle et al. This is an open-access article distributed under the terms of the Creative Commons Attribution License, which permits unrestricted use, distribution, and reproduction in any medium, provided the original author and source are credited. Funding: GeoEye Foundation provided a grant of IKONOS imagery (please note: the URL of GeoEye no longer exists as the company was purchased by DigitalGlobe). Fieldwork was supported by funding to SAB, CMK, and NUD by U.S. Fulbright ‘‘Creating Regional Partnerships in the America’s’’ Grant sponsored by LASPAU (http://www.laspau.harvard.edu/). The funders had no role in study design, data collection and analysis, decision to publish, or preparation of the manuscript. Competing Interests: The authors have declared that no competing interests exist. * E-mail: [email protected] Introduction Since the 1972 launch of the Earth Resources Technology Satellite (renamed Landsat 1), remotely sensed imagery has been increasingly used to monitor Earth’s ecosystems [1–5] by quantifying land cover change [6], deforestation [7], carbon stocks and emissions [8], habitat degradation and disease [9], [10], species diversity [11], [12], invasive species [13], habitat suitability [14], and species populations [15]. Satellite imagery products, however, vary in their spatial and spectral resolution, geographic and temporal coverage, cloud cover, security regulations, and price [4], [6], [16], [17]–variables that can hamper their consistent application in conservation. For example, not all areas of the globe have equal access to high-resolution data, with tropical areas having the least coverage available [18]. Satellite imagery employed in conservation research ranges from 1000 m to ,1 m in resolution [4], [5]. Global- to biome- scale monitoring of forest clearing is often conducted at spatial resolutions of 250–1000 m [5], [6]. Landsat imagery (30 m multispectral resolution) has been integral in scientific research since 1972 [19], particularly in mapping and assessments of land cover change [20], and it is currently available at no cost [21]. High-resolution imagery (e.g., IKONOS and QuickBird at #5m resolution) is typically used to map regional-to-local areas and species, and to inform land cover classifications derived from coarser imagery; but often such imagery is expensive and cost- prohibitive [5]. One exception is the free, high-resolution imagery provided via Google Earth that is increasingly being used in scientific research [22], [23], can aid in the selection of field sampling locations [10], and can be used as training samples for classification [24]. Imagery analysis based on Google Earth images, however, is limited as the different satellite bands are not available for manipulation by the user. Previous comparisons of land cover classifications based on imagery of varying spatial resolutions (i.e., IKONOS, Landsat) have revealed mixed results, with one type of satellite imagery failing to consistently perform best across different studies and systems [25–29]. Although high-resolution imagery often PLOS ONE | www.plosone.org 1 January 2014 | Volume 9 | Issue 1 | e86908

Welcome message from author
This document is posted to help you gain knowledge. Please leave a comment to let me know what you think about it! Share it to your friends and learn new things together.
Transcript
High-Resolution Satellite Imagery Is an Important yetUnderutilized Resource in Conservation BiologySarah A. Boyle1*, Christina M. Kennedy2, Julio Torres3, Karen Colman4, Pastor E. Perez-Estigarribia5,
Noe U. de la Sancha6
1 Department of Biology, Rhodes College, Memphis, Tennessee, United States of America, 2 Development by Design Program, The Nature Conservancy, Fort Collins,
Colorado, United States of America, 3 Unidad de Investigacion Sistematica, Diversidad y Evolucion, Centro Nacional Patagonico, Puerto Madryn, Chubut, Argentina,
4 Direccion de Vida Silvestre, Secretarıa del Ambiente, Asuncion, Paraguay, 5 Programa de Magister en Ciencias, Mencion en Zoologıa, Universidad de Concepcion,
Concepcion, Chile, 6 Science and Education, The Field Museum of Natural History, Chicago, Illinois, United States of America
Abstract
Technological advances and increasing availability of high-resolution satellite imagery offer the potential for more accurateland cover classifications and pattern analyses, which could greatly improve the detection and quantification of land coverchange for conservation. Such remotely-sensed products, however, are often expensive and difficult to acquire, whichprohibits or reduces their use. We tested whether imagery of high spatial resolution (#5 m) differs from lower-resolutionimagery ($30 m) in performance and extent of use for conservation applications. To assess performance, we classified landcover in a heterogeneous region of Interior Atlantic Forest in Paraguay, which has undergone recent and dramatic human-induced habitat loss and fragmentation. We used 4 m multispectral IKONOS and 30 m multispectral Landsat imagery anddetermined the extent to which resolution influenced the delineation of land cover classes and patch-level metrics. Higher-resolution imagery more accurately delineated cover classes, identified smaller patches, retained patch shape, and detectednarrower, linear patches. To assess extent of use, we surveyed three conservation journals (Biological Conservation,Biotropica, Conservation Biology) and found limited application of high-resolution imagery in research, with only 26.8% ofland cover studies analyzing satellite imagery, and of these studies only 10.4% used imagery #5 m resolution. Our resultssuggest that high-resolution imagery is warranted yet under-utilized in conservation research, but is needed to adequatelymonitor and evaluate forest loss and conversion, and to delineate potentially important stepping-stone fragments that mayserve as corridors in a human-modified landscape. Greater access to low-cost, multiband, high-resolution satellite imagerywould therefore greatly facilitate conservation management and decision-making.
Citation: Boyle SA, Kennedy CM, Torres J, Colman K, Perez-Estigarribia PE, et al. (2014) High-Resolution Satellite Imagery Is an Important yet UnderutilizedResource in Conservation Biology. PLoS ONE 9(1): e86908. doi:10.1371/journal.pone.0086908
Editor: Hans-Ulrich Peter, Institute of Ecology, Germany
Received August 4, 2013; Accepted December 16, 2013; Published January 23, 2014
Copyright: � 2014 Boyle et al. This is an open-access article distributed under the terms of the Creative Commons Attribution License, which permitsunrestricted use, distribution, and reproduction in any medium, provided the original author and source are credited.
Funding: GeoEye Foundation provided a grant of IKONOS imagery (please note: the URL of GeoEye no longer exists as the company was purchased byDigitalGlobe). Fieldwork was supported by funding to SAB, CMK, and NUD by U.S. Fulbright ‘‘Creating Regional Partnerships in the America’s’’ Grant sponsored byLASPAU (http://www.laspau.harvard.edu/). The funders had no role in study design, data collection and analysis, decision to publish, or preparation of themanuscript.
Competing Interests: The authors have declared that no competing interests exist.
* E-mail: [email protected]
Introduction
Since the 1972 launch of the Earth Resources Technology
Satellite (renamed Landsat 1), remotely sensed imagery has been
increasingly used to monitor Earth’s ecosystems [1–5] by
quantifying land cover change [6], deforestation [7], carbon
stocks and emissions [8], habitat degradation and disease [9], [10],
species diversity [11], [12], invasive species [13], habitat suitability
[14], and species populations [15]. Satellite imagery products,
however, vary in their spatial and spectral resolution, geographic
and temporal coverage, cloud cover, security regulations, and
price [4], [6], [16], [17]–variables that can hamper their consistent
application in conservation. For example, not all areas of the globe
have equal access to high-resolution data, with tropical areas
having the least coverage available [18].
Satellite imagery employed in conservation research ranges
from 1000 m to ,1 m in resolution [4], [5]. Global- to biome-
scale monitoring of forest clearing is often conducted at spatial
resolutions of 250–1000 m [5], [6]. Landsat imagery (30 m
multispectral resolution) has been integral in scientific research
since 1972 [19], particularly in mapping and assessments of land
cover change [20], and it is currently available at no cost [21].
High-resolution imagery (e.g., IKONOS and QuickBird at #5 m
resolution) is typically used to map regional-to-local areas and
species, and to inform land cover classifications derived from
coarser imagery; but often such imagery is expensive and cost-
prohibitive [5]. One exception is the free, high-resolution imagery
provided via Google Earth that is increasingly being used in
scientific research [22], [23], can aid in the selection of field
sampling locations [10], and can be used as training samples for
classification [24]. Imagery analysis based on Google Earth
images, however, is limited as the different satellite bands are
not available for manipulation by the user.
Previous comparisons of land cover classifications based on
imagery of varying spatial resolutions (i.e., IKONOS, Landsat)
have revealed mixed results, with one type of satellite imagery
failing to consistently perform best across different studies
and systems [25–29]. Although high-resolution imagery often
PLOS ONE | www.plosone.org 1 January 2014 | Volume 9 | Issue 1 | e86908
outperforms lower-resolution imagery in capturing small habitat
patches [27], [30], it can produce more canopy shadow [31], and
complicate multi-image comparisons and processing [9].
We assert that conservation research would benefit from a
better understanding of satellite imagery performance. The ability
to detect forest disturbance and degradation (e.g. as a result of
selective logging) with satellite imagery varies greatly [32], [33],
and missed detection can lead to false conclusions that natural
systems are intact when in fact they have undergone high levels of
disturbance [34], [35]. Furthermore, readily available vegetation
maps and data sets often mosaic multiple imagery from various
time periods [5], which may lead to difficulties in comparing land
cover change. Articles focusing on the applications of satellite
imagery and remote sensing are often published in remote-sensing,
physical geography, informatics, and ecology journals (see reviews
by [2], [4], [36–44]), which may limit the extent to which
conservation biologists encounter these topics. The increasing
availability of high-resolution imagery has the potential to provide
more accurate detection and quantification of habitat conversion,
degradation and fragmentation [35], [37], but we suspect such
imagery are not being taken advantage of by conservation
biologists, even though their usage can result in more accurate
habitat and ecosystem assessments. To test this assertion, we
compared land cover classifications in the Interior Atlantic Forest
of Paraguay (an area of current conservation concern due to recent
and extensive forest loss [20]), using 4 m multispectral IKONOS
and 30 m multispectral Landsat imagery and evaluated whether
imagery resolution significantly influences delineation of land
cover classes and fragmentation metrics of forest patches. We then
reviewed current literature from three conservation journals to
determine the extent and the type of usage of satellite imagery for
conservation purposes. Our findings have important implications
regarding the utility of higher-resolution imagery to monitor
habitat change, and to potentially model connectivity for species
within a fragmented landscape.
Materials and Methods
Imagery Analysis of Interior Atlantic ForestThe Atlantic Forest of South America is one of the major global
‘‘hotspots’’ for biodiversity due to its large number of endemic
species and its dramatic decrease in size due to human-induced
habitat loss and fragmentation [45], [46]. Paraguay has lost 85
percent of its Atlantic Forest during the past 60 years [47–49], and
it is one of the least-studied countries in South America [50], with
little known regarding lost species and those in imminent danger of
disappearing. This pattern of deforestation has continued in
Paraguay to present [51]. We assessed a heterogeneous landscape
directly surrounding and including Reserva Natural Privada
Morombi (centroid coordinates: 24u 399 S, 55u 229 W), a private
25,000 ha reserve in the Departments of Canindeyu and
Caaguazu, Paraguay (Fig. 1). Reserva Morombi consists of
remnant patches of semi-deciduous Interior Atlantic Forest,
surrounded by a matrix of agriculture (pasture and cropland),
wetlands, and grasslands.
We obtained cloud-free, geometrically corrected, and orthor-
ectified IKONOS (4 m multispectral resolution) and Landsat
(30 m multispectral resolution) imagery for the study region. Both
imagery types spanned a 43,200 ha area that contained forest
patches within the reserve, as well as the surrounding heteroge-
neous matrix. We selected Landsat imagery because it is readily
and freely available, and frequently used for land cover
classification [52]; we selected IKONOS imagery because it is
often used for vegetation assessment [5]. Dates of imagery were
paired relatively close in time (September 2008 and July 2009 for
IKONOS and Landsat, respectively) to help ensure consistency in
cover classes and phenology; we were, however, limited by the
available date for IKONOS imagery and the inability to use
Landsat imagery from September 2008 due to sensor malfunction
(ETM+ on Landsat 7; [16]) and cloud coverage (Landsat 5). The
differences in imagery dates (2008 and 2009) and date of field data
collection (2010) did not impact our results, given that there were
no major changes in land cover from 2008 to 2010 in the study
area (as referenced from Landsat images during this time period,
and likely a result of the protection status of the study area).
We collected 250 ground-truth points in the study area in June
2010 to serve as training samples for the classification; these points
were taken throughout the private reserve. Using ERDAS Imagine
10, we drew polygons around each point and assigned the polygon
to a land cover class. Training samples (number of locations and
number of pixels) were distributed evenly across classes, with the
exception of water because this class was limited in its spatial
distribution across the study area (,1% of study area). We used
the same 250 locations for both IKONOS and Landsat
classifications. We used transformed divergence [53], to validate
the suitability of these training classes; all comparisons met the
standards with values .1700. We conducted pixel-based, super-
vised classifications of both images based on the maximum
likelihood algorithm, and delineated six general cover classes
(forest, wetlands, grasslands, agriculture, cleared, and water;
definitions of land cover classes available in Table 1). The
agricultural class originally consisted of two separate classes of
crops and pasture, but during post-classification processing these
classes were merged into a single ‘agriculture’ class to facilitate
more general comparisons with other land cover classes, as is
commonly done in conservation studies [54], [55]. We measured
classification accuracy by randomly selecting 204 point locations
(evenly distributed among the six classes) from a 1 m resolution
panchromatic IKONOS image from the study area. We
calculated accuracy and kappa statistics (k) for the overall
classification and for each of the six land cover classes [56],
determining the accuracy of the 204 locations in both the
IKONOS and Landsat classified data sets.
We converted raster data to vector data in ArcGIS 9.3 to
calculate patch-level metrics. Continuous pixels were combined
into a single vector patch, allowing for the quick delineation of
number of patches and their sizes. We converted raster data to
vector data instead of using object-based landscape analysis [57],
[58], due to the ease of working with vector data in ArcGIS 9.3,
software commonly used by authors in our literature review. Due
to differences in pixel size we expected the high-resolution
classification to result in a greater number of patches; therefore,
we compared metrics based on all patches as well as only patches
$0.5 ha, following previous fragmentation studies [59], [60], that
used a 0.5 ha minimum patch size.
A grid consisting of 36 rows and 12 columns (432 1-km61-km
grid cells) was overlaid on both IKONOS- and Landsat-derived
classifications (Fig. 1c). For each grid cell, we calculated the area
(in ha) and number of patches occupied by each of the six land
cover classes. We then tested whether area and/or number of
patches significantly differed between the two imagery types based
on Multivariable Analysis of Variance (MANOVA) with the six
land cover types as variables (a= 0.05). Post-hoc Tukey tests were
used to test significant differences between the imagery types
(IKONOS and Landsat) for individual land cover classes (with
familywise a= 0.05).
We calculated patch-level fragmentation metrics (i.e. patch area,
patch edge, shape index, perimeter-area ratio) using Patch Analyst
Importance of High-Resolution Satellite Imagery
PLOS ONE | www.plosone.org 2 January 2014 | Volume 9 | Issue 1 | e86908
5.0 [61], based on all patches and patches $0.5 ha. We calculated
the distance from each forest patch’s centroid to the closest patch’s
centroid (nearest neighbor) and the mean distance from a target
patch centroid to all other centroids using Hawth’s Tools for
ArcGIS [62], to test for differences in forest patch configuration.
We used Euclidean nearest neighbor distances because they are
the most widely used connectivity metrics [63]. Differences
between IKONOS and Landsat imagery classifications in patch-
level and connectivity metrics were determined by t-tests.
Linear habitat features, such as riparian corridors, have been
found to be important conduits for species movement, thus,
facilitating landscape-level connectivity [64]. To determine the
effects of imagery resolution on the detection of such narrow
features, we chose 40 random locations in forest widths ranging
from 3.5–100 m from a 1 m panchromatic IKONOS image. We
then tested for differences between IKONOS and Landsat in
detectability of these linear habitat features using a paired t-test,
and the correlation between patch width and its detection using
Pearson’s correlations. All statistical analyses were conducted in
Matlab 6.5.01 (The MathWorks, Inc., 2006).
Extent of Imagery Use by Conservation BiologistsWe conducted a literature review of three top-tier conservation
journals (Biological Conservation, Biotropica, and Conservation Biology) to
assess the extent to which satellite imagery is currently utilized in
conservation research. We reviewed all articles published in these
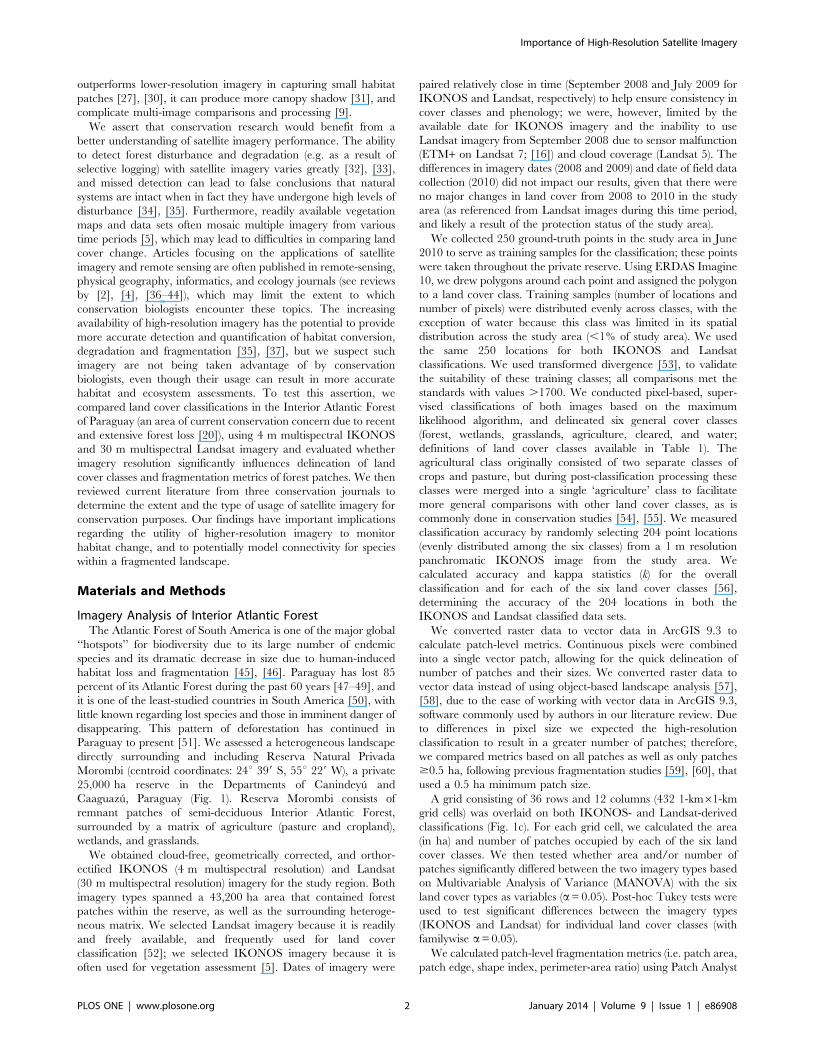
Figure 1. Study location. The site (a) is located in eastern Paraguay at a private forest reserve, Reserva Morombi. Forest patches (b) are shown indark, surrounded by a heterogeneous matrix, in the grey-scale Landsat TM image. Comparison of IKONOS- and Landsat-based classification extendedacross 43,200 ha, and was based on subsampling (c) using 432 1 km61 km grid cells.doi:10.1371/journal.pone.0086908.g001
Table 1. Description of land cover classes delineated in this study.
Class Description
Forest Semi-deciduous trees .2 m in height
Agriculture Crop (e.g., maize, soybean, wheat) fields and cattle pasturea
Cleared Barren ground lacking vegetative cover, including roads, and infrastructure such as houses and barns
Wetland 75–100% herbaceous vegetation cover and water-saturated soil
Grassland 75–100% perennial grasses not used for cattle grazing
Water Bodies of water, including lakes and ponds
aAgricultural components (i.e. crop fields, pasture) were combined into one class for general comparisons across the broader land cover classes.doi:10.1371/journal.pone.0086908.t001
Importance of High-Resolution Satellite Imagery
PLOS ONE | www.plosone.org 3 January 2014 | Volume 9 | Issue 1 | e86908
three journals for the past two completed calendar years (January
2011 to December 2012), examining the methods to determine if
satellite imagery was used in analyses. We did not include book
reviews, editorials, or letters commenting on previous articles, and
we limited our analysis to studies examining terrestrial (non-
marine) patterns. For those studies utilizing remotely sensed data,
we documented the satellite type (e.g. IKONOS, Landsat), the
spatial resolution of the imagery, the type of analysis (e.g. land
cover change, patch-based metrics), and the scale of analysis (i.e.
global, continental, country, state, local).
Results
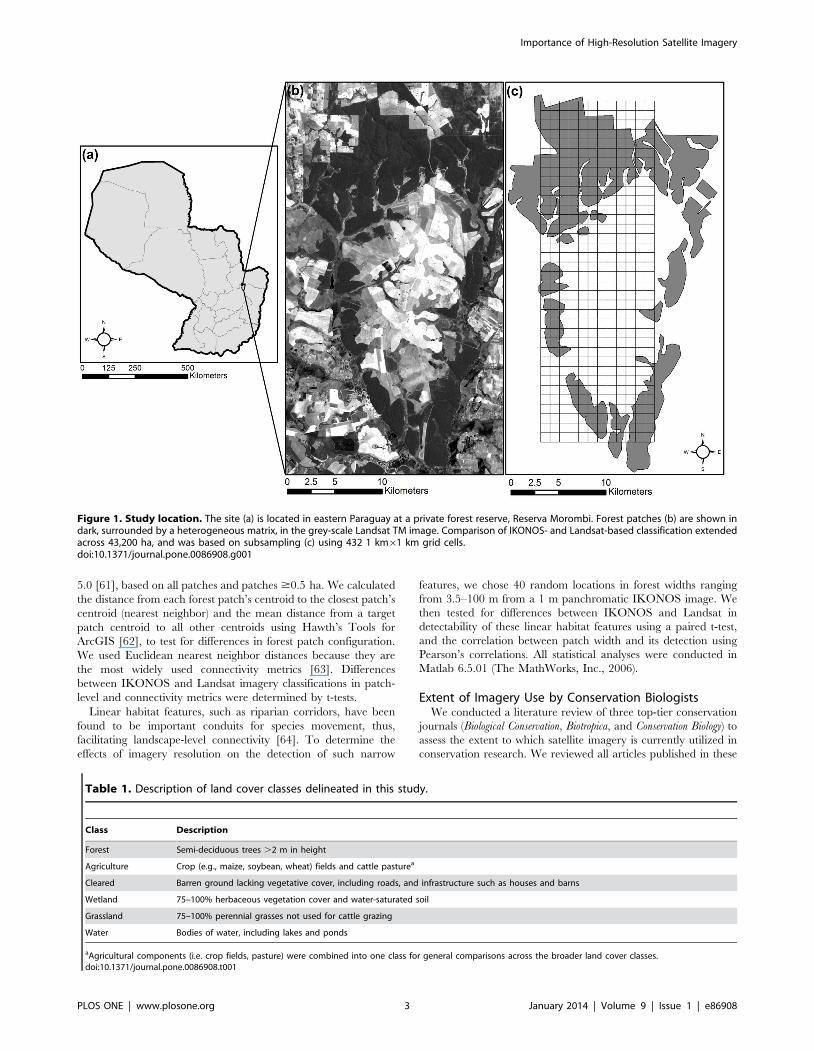
Imagery Classification PerformanceOverall classification accuracy was 90.3% for IKONOS
(k = 0.89) and 87.9% for Landsat (k = 0.86). For both IKONOS
and Landsat, kappa statistics were lowest for the wetland class
(k = 0.68 and k = 0.54, respectively). The sample within a section of
Reserva Morombi and its environs were dominated by forest,
followed by agriculture, based on both IKONOS and Landsat
classifications (Fig. 2a). Land cover classifications based on the two
satellites, however, significantly differed in area of the six land
cover classes (MANOVA, F6, 857 = 5.53, p,0.001), with significant
differences in cleared (pairwise Tukey test: F1, 862 = 3.88,
p = 0.006), water (F1, 862 = 5.04, p,0.001), and wetland (F1,
862 = 6.21, p,0.001) classes. Land cover based on IKONOS
resulted in a greater number of patches overall for all six cover
types (F6, 857 = 160.69, p,0.001; Fig. 2b) and for all six classes
(Tukey test: p,0.01 for all pairwise comparisons) relative to
Landsat.
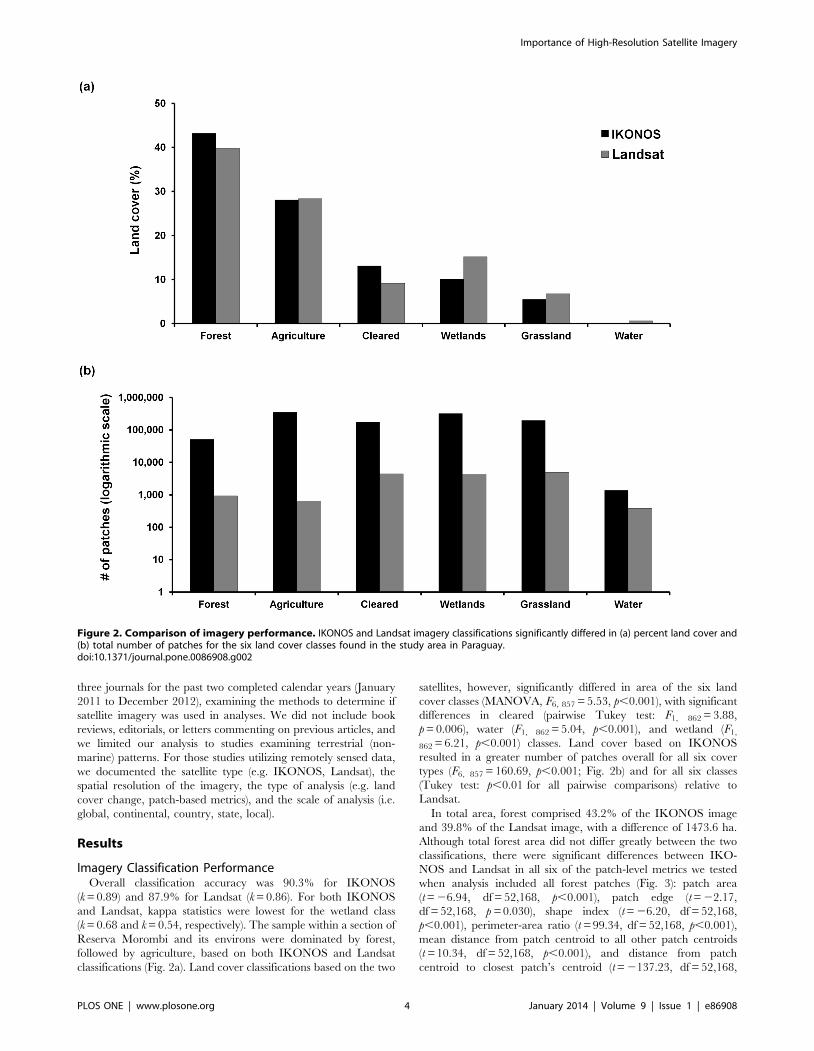
In total area, forest comprised 43.2% of the IKONOS image
and 39.8% of the Landsat image, with a difference of 1473.6 ha.
Although total forest area did not differ greatly between the two
classifications, there were significant differences between IKO-
NOS and Landsat in all six of the patch-level metrics we tested
when analysis included all forest patches (Fig. 3): patch area
(t = 26.94, df = 52,168, p,0.001), patch edge (t = 22.17,
df = 52,168, p = 0.030), shape index (t = 26.20, df = 52,168,
p,0.001), perimeter-area ratio (t = 99.34, df = 52,168, p,0.001),
mean distance from patch centroid to all other patch centroids
(t = 10.34, df = 52,168, p,0.001), and distance from patch
centroid to closest patch’s centroid (t = 2137.23, df = 52,168,
Figure 2. Comparison of imagery performance. IKONOS and Landsat imagery classifications significantly differed in (a) percent land cover and(b) total number of patches for the six land cover classes found in the study area in Paraguay.doi:10.1371/journal.pone.0086908.g002
Importance of High-Resolution Satellite Imagery
PLOS ONE | www.plosone.org 4 January 2014 | Volume 9 | Issue 1 | e86908
p,0.001). When we included only forest patches $0.5 ha,
significant differences existed between IKONOS and Landsat in
three of the six patch-level metrics: shape index (t = 8.180,
df = 464, p,0.001), perimeter-area index (t = 15.71, df = 464,
p,0.001), and mean distance from patch centroid to all other
patch centroids (t = 2.90, df = 464, p = 0.004).
Although mean patch size was smaller with IKONOS imagery,
IKONOS had the largest patch (15,565 ha vs. 10,562 ha with
Figure 3. Patch metrics varied with imagery type. IKONOS and Landsat classifications significantly differed in patch metrics for all forestpatches and those $0.5 ha in (a) patch area; (b) patch edge; (c) shape index; (d) perimeter-area ratio; (e) mean distance from patch centroid to allother patch centroids; and (f) distance from patch centroid to the closest patch’s centroid. Asterisks (*, **, ***) indicate significant differences atp#0.05, 0.01, 0.001, respectively; with df = 52,168 and df = 464 for all t-tests using data from all patches and from patches $0.50 ha, respectively.Error bars represent one standard error.doi:10.1371/journal.pone.0086908.g003
Importance of High-Resolution Satellite Imagery
PLOS ONE | www.plosone.org 5 January 2014 | Volume 9 | Issue 1 | e86908
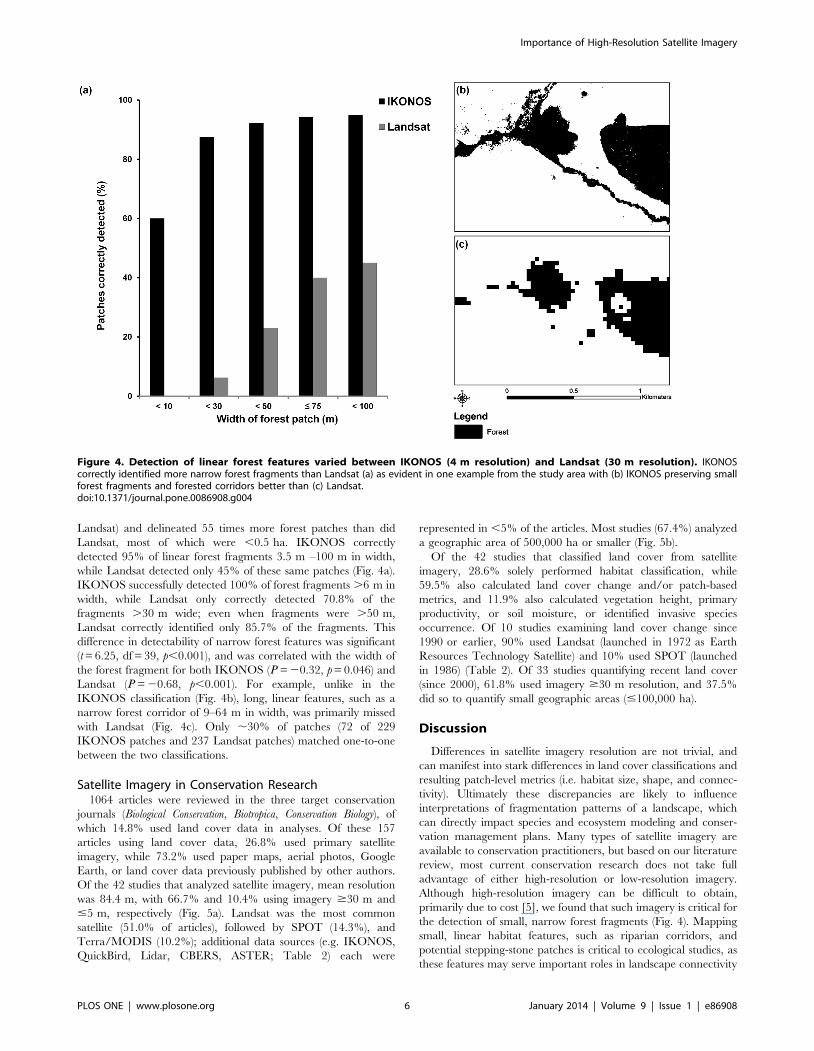
Landsat) and delineated 55 times more forest patches than did
Landsat, most of which were ,0.5 ha. IKONOS correctly
detected 95% of linear forest fragments 3.5 m –100 m in width,
while Landsat detected only 45% of these same patches (Fig. 4a).
IKONOS successfully detected 100% of forest fragments .6 m in
width, while Landsat only correctly detected 70.8% of the
fragments .30 m wide; even when fragments were .50 m,
Landsat correctly identified only 85.7% of the fragments. This
difference in detectability of narrow forest features was significant
(t = 6.25, df = 39, p,0.001), and was correlated with the width of
the forest fragment for both IKONOS (R = 20.32, p = 0.046) and
Landsat (R = 20.68, p,0.001). For example, unlike in the
IKONOS classification (Fig. 4b), long, linear features, such as a
narrow forest corridor of 9–64 m in width, was primarily missed
with Landsat (Fig. 4c). Only ,30% of patches (72 of 229
IKONOS patches and 237 Landsat patches) matched one-to-one
between the two classifications.
Satellite Imagery in Conservation Research1064 articles were reviewed in the three target conservation
journals (Biological Conservation, Biotropica, Conservation Biology), of
which 14.8% used land cover data in analyses. Of these 157
articles using land cover data, 26.8% used primary satellite
imagery, while 73.2% used paper maps, aerial photos, Google
Earth, or land cover data previously published by other authors.
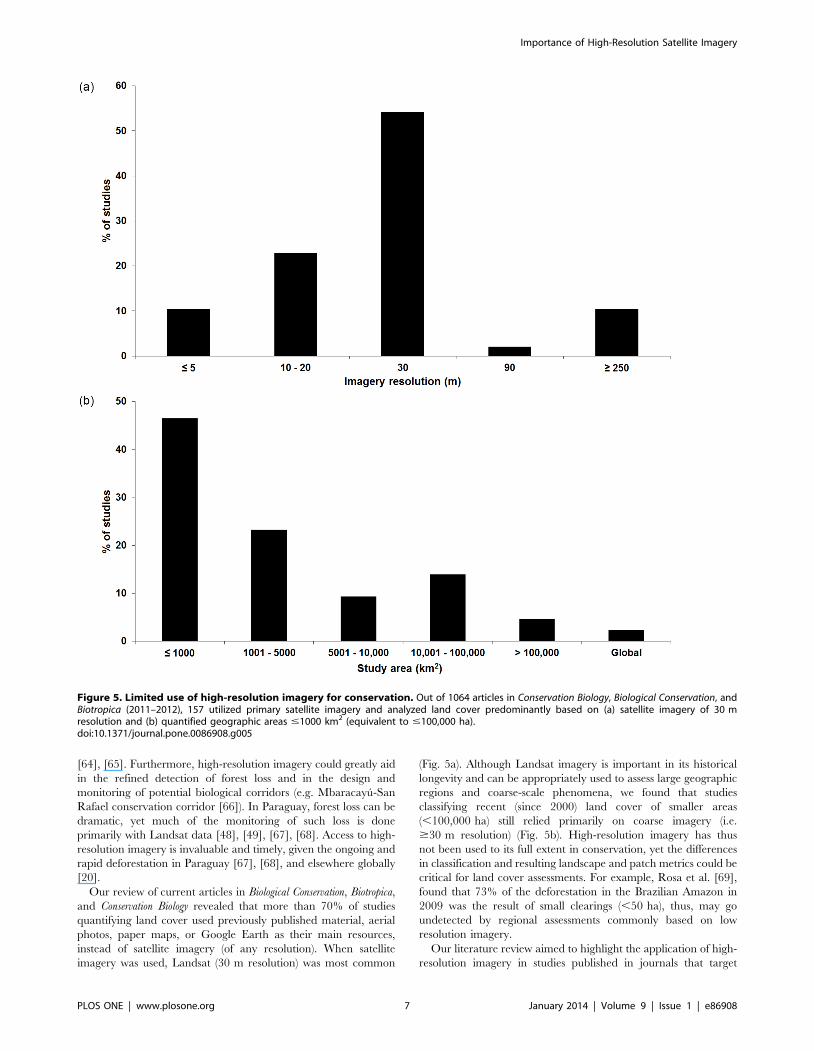
Of the 42 studies that analyzed satellite imagery, mean resolution
was 84.4 m, with 66.7% and 10.4% using imagery $30 m and
#5 m, respectively (Fig. 5a). Landsat was the most common
satellite (51.0% of articles), followed by SPOT (14.3%), and
Terra/MODIS (10.2%); additional data sources (e.g. IKONOS,
QuickBird, Lidar, CBERS, ASTER; Table 2) each were
represented in ,5% of the articles. Most studies (67.4%) analyzed
a geographic area of 500,000 ha or smaller (Fig. 5b).
Of the 42 studies that classified land cover from satellite
imagery, 28.6% solely performed habitat classification, while
59.5% also calculated land cover change and/or patch-based
metrics, and 11.9% also calculated vegetation height, primary
productivity, or soil moisture, or identified invasive species
occurrence. Of 10 studies examining land cover change since
1990 or earlier, 90% used Landsat (launched in 1972 as Earth
Resources Technology Satellite) and 10% used SPOT (launched
in 1986) (Table 2). Of 33 studies quantifying recent land cover
(since 2000), 61.8% used imagery $30 m resolution, and 37.5%
did so to quantify small geographic areas (#100,000 ha).
Discussion
Differences in satellite imagery resolution are not trivial, and
can manifest into stark differences in land cover classifications and
resulting patch-level metrics (i.e. habitat size, shape, and connec-
tivity). Ultimately these discrepancies are likely to influence
interpretations of fragmentation patterns of a landscape, which
can directly impact species and ecosystem modeling and conser-
vation management plans. Many types of satellite imagery are
available to conservation practitioners, but based on our literature
review, most current conservation research does not take full
advantage of either high-resolution or low-resolution imagery.
Although high-resolution imagery can be difficult to obtain,
primarily due to cost [5], we found that such imagery is critical for
the detection of small, narrow forest fragments (Fig. 4). Mapping
small, linear habitat features, such as riparian corridors, and
potential stepping-stone patches is critical to ecological studies, as
these features may serve important roles in landscape connectivity
Figure 4. Detection of linear forest features varied between IKONOS (4 m resolution) and Landsat (30 m resolution). IKONOScorrectly identified more narrow forest fragments than Landsat (a) as evident in one example from the study area with (b) IKONOS preserving smallforest fragments and forested corridors better than (c) Landsat.doi:10.1371/journal.pone.0086908.g004
Importance of High-Resolution Satellite Imagery
PLOS ONE | www.plosone.org 6 January 2014 | Volume 9 | Issue 1 | e86908
[64], [65]. Furthermore, high-resolution imagery could greatly aid
in the refined detection of forest loss and in the design and
monitoring of potential biological corridors (e.g. Mbaracayu-San
Rafael conservation corridor [66]). In Paraguay, forest loss can be
dramatic, yet much of the monitoring of such loss is done
primarily with Landsat data [48], [49], [67], [68]. Access to high-
resolution imagery is invaluable and timely, given the ongoing and
rapid deforestation in Paraguay [67], [68], and elsewhere globally
[20].
Our review of current articles in Biological Conservation, Biotropica,
and Conservation Biology revealed that more than 70% of studies
quantifying land cover used previously published material, aerial
photos, paper maps, or Google Earth as their main resources,
instead of satellite imagery (of any resolution). When satellite
imagery was used, Landsat (30 m resolution) was most common
(Fig. 5a). Although Landsat imagery is important in its historical
longevity and can be appropriately used to assess large geographic
regions and coarse-scale phenomena, we found that studies
classifying recent (since 2000) land cover of smaller areas
(,100,000 ha) still relied primarily on coarse imagery (i.e.
$30 m resolution) (Fig. 5b). High-resolution imagery has thus
not been used to its full extent in conservation, yet the differences
in classification and resulting landscape and patch metrics could be
critical for land cover assessments. For example, Rosa et al. [69],
found that 73% of the deforestation in the Brazilian Amazon in
2009 was the result of small clearings (,50 ha), thus, may go
undetected by regional assessments commonly based on low
resolution imagery.
Our literature review aimed to highlight the application of high-
resolution imagery in studies published in journals that target
Figure 5. Limited use of high-resolution imagery for conservation. Out of 1064 articles in Conservation Biology, Biological Conservation, andBiotropica (2011–2012), 157 utilized primary satellite imagery and analyzed land cover predominantly based on (a) satellite imagery of 30 mresolution and (b) quantified geographic areas #1000 km2 (equivalent to #100,000 ha).doi:10.1371/journal.pone.0086908.g005
Importance of High-Resolution Satellite Imagery
PLOS ONE | www.plosone.org 7 January 2014 | Volume 9 | Issue 1 | e86908
conservation biologists. We found the usage of high-resolution
imagery to be minimal. Moreover, most studies used previously
published data sets, and some were found to use land cover data
from .14 years prior to the field data collection. Although
conservation biologists are not limited to these journals, conser-
vation practitioners may not be reached by the remote-sensing,
physical geography, informatics, and ecology journals that often
focus on the applications of satellite imagery (see reviews by [2],
[4], [36–44]). Furthermore, these journals do not necessarily focus
on conservation applications, and therefore the utility and
relevance of high-resolution imagery may be missed by conserva-
tion scientists. Even within the field of ecology, there has been a
disconnect between ecologists, who may not fully utilize imagery
because of the perception that it is useful at only relatively coarse
spatial scales, and remote sensing specialists who tend to focus on
technological issues of remote-sensing applications [36]. With
increasing availability of higher-resolution imagery, however,
spatial scale is no longer a limiting factor. Our findings reinforce
that high-resolution imagery is important for conservation
applications, but that many conservation biologists are not taking
full advantage of this resource.
Our results highlight that small or narrow patches in a
landscape may fail to be delineated with coarser imagery.
Although the total area of a particular land cover class (e.g.,
forest) may not substantially increase, higher-resolution imagery is
more likely to discern small and linear habitat features, which may
be vital to landscape connectivity. Given that human activities
have caused the conversion of more than 50% of the world’s
terrestrial surface [70], most landscapes have lost the vast majority
of their historic, native habitat. Such habitat loss necessitates our
ability to design conservation plans and strategies that are able to
reconnect or improve the functionality of remaining land cover
[71]. For example, in the human-modified landscapes of
Paraguay, narrow forest patches may serve as valuable corridors
between core habitat areas (as outlined in [66]) for megafauna (e.g.
jaguar, Panthera onca [72]; tapir, Tapirus terrestris [73]), medium-
sized rare mesocarnivores (e.g. bushdog, Speothos venaticus [74];
oncilla, Leopardus tigrinus [75]; margay, Leopardus wiedii [75]), or
arboreal species (e.g. howler monkey, Alouatta caraya [76]; capuchin
monkey, Sapajus cay [77]). They may also provide important
conduits of movement for pollinators and seed dispersers, which
help ensure ecosystem functioning and forest regeneration and
succession [78–81]. Therefore, research linking remotely-sensed
land use change with species movement and persistence is
particularly important in Paraguay given that much of what is
known regarding the country’s fauna is from approximate
distributions or preliminary field data [82]. Recent and notewor-
thy species records for Paraguay [83], including records of rodent
[82], [84], [85], and bat [86] species in the Interior Atlantic Forest,
exemplify the need for further field studies in the region. We
propose that future conservation studies would be enhanced by
access to low-cost, high-resolution imagery.
Additionally, high-resolution imagery will be valuable for more
precise evaluation of habitat area and edge in landscapes. While
species-area relationships have been widely used for conservation
[87–92], improved imagery will help to better understand the
effects of patch area, edge, shape, and configuration, as well as the
matrix, on biodiversity. These patterns are species-specific, may
vary across systems, and are often complex [93–97]. In Paraguay,
for example, small mammal diversity increased toward the edges
of large forest remnants [98]; therefore high-resolution imagery
could help in precisely defining these edges and any area-to-edge
(shape) relationships.
Classification using IKONOS imagery improved the delinea-
tion of forest fragments, with smaller mean size than fragments
delineated using Landsat imagery. These differences were not
surprising, however, given the smaller pixel size of IKONOS.
Unexpectedly, however, the IKONOS-based classification led to a
delineation of fewer forest patches (229) than did Landsat (237
patches) for patches $0.5 ha. While a difference of 8 patches may
seem trivial, a classification using higher resolution imagery is
expected to result in a greater number of patches (not less), due to
a greater ability to distinguish smaller features. In contrast, we
found that Landsat missed detecting several small forest fragments
and narrow riparian corridors that connected other habitat
patches, thus resulting in a classification of more disjunct,
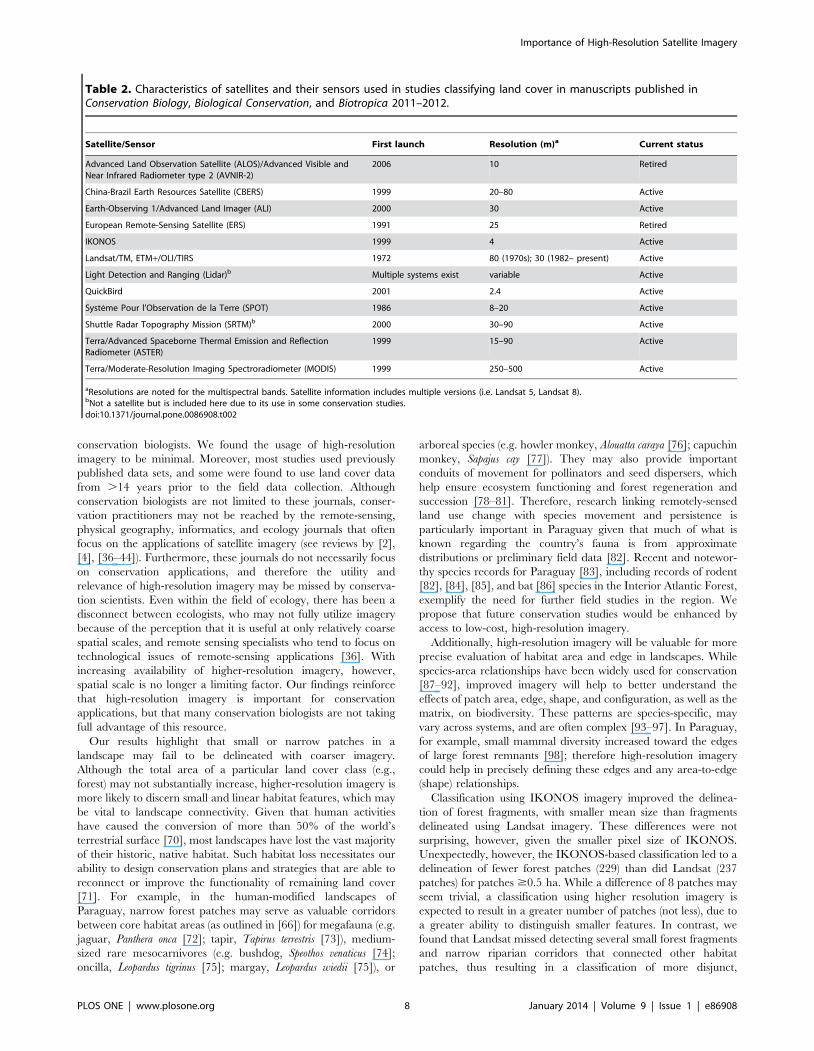
Table 2. Characteristics of satellites and their sensors used in studies classifying land cover in manuscripts published inConservation Biology, Biological Conservation, and Biotropica 2011–2012.
Satellite/Sensor First launch Resolution (m)a Current status
Advanced Land Observation Satellite (ALOS)/Advanced Visible andNear Infrared Radiometer type 2 (AVNIR-2)
2006 10 Retired
China-Brazil Earth Resources Satellite (CBERS) 1999 20–80 Active
Earth-Observing 1/Advanced Land Imager (ALI) 2000 30 Active
European Remote-Sensing Satellite (ERS) 1991 25 Retired
IKONOS 1999 4 Active
Landsat/TM, ETM+/OLI/TIRS 1972 80 (1970s); 30 (1982– present) Active
Light Detection and Ranging (Lidar)b Multiple systems exist variable Active
QuickBird 2001 2.4 Active
Systeme Pour l’Observation de la Terre (SPOT) 1986 8–20 Active
Shuttle Radar Topography Mission (SRTM)b 2000 30–90 Active
Terra/Advanced Spaceborne Thermal Emission and ReflectionRadiometer (ASTER)
1999 15–90 Active
Terra/Moderate-Resolution Imaging Spectroradiometer (MODIS) 1999 250–500 Active
aResolutions are noted for the multispectral bands. Satellite information includes multiple versions (i.e. Landsat 5, Landsat 8).bNot a satellite but is included here due to its use in some conservation studies.doi:10.1371/journal.pone.0086908.t002
Importance of High-Resolution Satellite Imagery
PLOS ONE | www.plosone.org 8 January 2014 | Volume 9 | Issue 1 | e86908
parcellated patches instead of one larger, interconnected patch.
These findings have important consequences when evaluating
fragmentation effects, especially in the case of heterogeneous and
complex landscapes where habitat patches may be irregular and/
or linear in shape, and where corridors may be critical for the
movement of individuals and populations of a variety of species.
Although our findings are site-specific to eastern Paraguay, like
Masuoka et al. [27], we found that Landsat classified total areas of
common cover types comparable to IKONOS but the latter is
only able to capture smaller habitat patches. Similarly, Kennedy
[30], found that Landsat data (unlike IKONOS) failed to capture
the majority of native forest patches within the karst countryside in
central Jamaica, which is characterized by small forested hilltops,
often ,10 ha in size, but that support extensive native bird
assemblages in the region [99] as well as maintain essential
landscape-level connectivity (inter-patch recolonization) [100].
Landsat has also been found to insufficiently quantify selective
logging due to its low resolution [7]. These findings stress the
importance of using high-resolution imagery to monitor land cover
change, classify small, linear, or irregularly-shaped remnants,
detect narrow corridors, and delineate areas of disturbance within
a larger habitat patches. Many of the protected areas and reserves
in eastern Paraguay are relatively small in size: Reserva Ecologica
de Capiibary (3,082 ha), Monumento Natural Macizo Acahay
(2,500 ha), Reserva para Parque Nacional Nacunday (2,000 ha),
and Monumento Cientıfico Moises Bertoni (199 ha). Yet, despite
their size, we would expect these areas to provide critical refugia
for Atlantic Forest species, and increasingly so if current rates and
patterns of land-cover transformation continue. Thus, being able
to effectively monitor fine-scale habitat changes in these important
yet small reserves and parks has increasing conservation impor-
tance in Paraguay (e.g. via management projects like Paraguay
Biodiversidad, [101]), as well as in other tropical regions
undergoing rapid change [20].
Although free data sets and free satellite imagery are available
online [40], many of these resources are at lower resolutions (e.g.
MODIS, Landsat), limited by the dates available (e.g. 4-m
multispectral OrbView-3 data are available for free, but only
from 2003–2007 without full global coverage) and/or not
modifiable (e.g. Google Earth). When using lower-resolution
imagery to analyze land cover without field verification of the
modeling results, evaluations of connectivity and appropriate
corridors may be incorrect and/or misleading [102]. We agree
with Arponen et al. [103], that analyses using high-resolution data
are feasible and important, especially when assessing connectivity
of habitat. Alongside the need to match spatial resolution
appropriately with spatial problems, we emphasize the need to
use an appropriate temporal scale and to be cautious in
extrapolating from imagery and land cover data that are
temporally distant from field data. Access to a variety of imagery
dates is also important as seasonality can impact land cover
classification accuracy [104], and land cover change can occur
quickly.
High-resolution imagery, as well as long-term, time-series data
(e.g. Landsat), are essential for conservation, economic, and social
research and applications [52]. Although various governments and
private satellite companies (e.g. GeoEye, DigitalGlobe) have
provided much-needed access to satellite imagery for environ-
mental research, access to these products should increase [17],
[20]. A recent call by Lynch et al. [105] to governments to use
satellites for monitoring illegal logging highlights the importance of
this issue. Habitat conversion can happen quickly and covertly
[106], and at times illegally; therefore, high-resolution imagery
needs to be available for regular ecosystem monitoring. Informa-
tion derived from satellite imagery should also be shared in user-
friendly formats with environmental policy groups [1], as well as
conservation and education leaders. To better ensure the
prevalence of satellite image analyses for conservation purposes,
we recommend increasing interdisciplinary training and collabo-
ration among conservation, environmental, and remote-sensing
fields [4], [13], and improving the accessibility to high-resolution
imagery at low (or no) cost.
Acknowledgments
We thank Victor Vera, Abilio Ramırez, Derlis Ojeda, and Reserva Natural
Privada Morombi for logistical support with field work. We also thank two
anonymous reviewers for their helpful comments that improved the
manuscript.
Author Contributions
Conceived and designed the experiments: SAB NUD CMK. Performed
the experiments: SAB NUD CMK JT KC PPE. Analyzed the data: SAB
NUD. Wrote the paper: SAB NUD CMK PPE KC JT.
References
1. Boyd DS, Danson FM (2005) Satellite remote sensing of forest resources: three
decades of research development. Prog Phys Geog 29: 1–26.
2. Gillespie TW, Foody GM, Rocchini D, Giorgi AP, Saatchi S (2008) Measuring
and modelling biodiversity from space. Prog Phys Geog 32: 203–221.
3. Hurtt G, Xiao X, Keller M, Palace M, Asner GP, et al. (2003) IKONOS
imagery for the Large Scale Biosphere-Atmosphere Experiment in Amazonia
(LBA). Remote Sens Environ 88: 111–127.
4. Turner W, Spector S, Gardiner N, Fladeland M, Sterling E, et al. (2003)
Remote sensing for biodiversity science and conservation. Trends Ecol Evol 18:
306–314.
5. Xie Y, Sha Z, Yu M (2008) Remote sensing imagery in vegetation mapping: a
review. J Plant Ecol 1: 9–23.
6. Hansen MC, Stehman SV, Potapov PV, Loveland TR, Townshend JRG, et al.
(2008) Humid tropical forest clearing from 2000 to 2005 quantified by using
multitemporal and multiresolution remotely sensed data. Proc Nat Acad Sci
USA 105: 9439–9444.
7. Asner GP, Keller M, Pereira R, Zweede JC (2002) Remote sensing of selective
logging in Amazonia: Assessing limitations based on detailed field observations,
Landsat ETM+, and textural analysis. Remote Sens Environ 80: 483–496.
8. Asner GP, Powell GVN, Mascaro J, Knapp DE, Clark JK, et al. (2010) High-
resolution forest carbon stocks and emissions in the Amazon. Proc Nat Acad
Sci USA 107: 16738–16742.
9. Dennison PE, Brunelle AR, Carter VA (2010) Assessing canopy mortality
during a mountain pine beetle outbreak using GeoEye-1 high spatial resolution
satellite data. Remote Sens Environ 114: 2431–2435.
10. Tang L, Shao G, Piao Z, Dai L, Jenkins MA, et al. (2010) Forest degradation
deepens around and within protected areas in East Asia. Biol Conserv 143:
1295–1298.
11. Hall K, Reitalu T, Sykes MT, Prentice HC (2011) Spectral heterogeneity of
QuickBird satellite data is related to fine-scale plant species spatial turnover in
semi-natural grasslands. Appl Veg Sci 15: 145–147.
12. Rocchini D (2007) Effects of spatial and spectral resolution in estimating
ecosystem a-diversity by satellite imagery. Remote Sens Environ 111: 423–434.
13. He KS, Rocchini D, Neteler M, Nagendra H (2011) Benefits of hyperspectral
remote sensing for tracking plant invasions. Biodivers Rev 17: 381–392.
14. Lahoz-Monfort JJ, Guillera-Arroita G, Milner-Gulland EJ, Young RP,
Nicolson E (2010) Satellite imagery as a single source of predictor variables
for habitat suitability modelling: how Landsat can inform the conservation of a
critically endangered lemur. J Appl Ecol 47: 1094–1102.
15. Sanchez-Azofeifa A, Rivard B, Wright J, Feng JL, Li P, et al. (2011) Estimation
of the distribution of Tabebuia guayacan (Bignoniaceae) using high-resolution
remote sensing imagery. Sensors 11: 3831–3851.
16. Goetz S (2007) Crisis in Earth observation. Science 315: 1767.
17. Loarie SR, Joppa LN, Pimm SL (2007) Satellites miss environmental priorities.
Trends Ecol Evol 22: 630–632.
18. Nagendra H, Rocchini D (2008) High resolution satellite imagery for tropical
biodiversity studies: the devil is in the detail. Biodivers Conserv 17: 3431–3442.
19. Williams DL, Goward S, Arvidson T (2006) Landsat: Yesterday, today, and
tomorrow. Photogramm Eng Rem Sens 72: 1171–1178.
Importance of High-Resolution Satellite Imagery
PLOS ONE | www.plosone.org 9 January 2014 | Volume 9 | Issue 1 | e86908
20. Hansen MC, Potapov PV, Moore R, Hancher M, Turubanova SA, et al.(2013) High-resolution global maps of 21st-century forest cover change. Science
342: 850–853.
21. Wallace J, Behn G, Furby S (2006) Vegetation condition assessment and
monitoring from sequences of satellite imagery. Ecol Manag Restor 7: S31-S36.
22. Madin EMP, Madin JS, Booth DJ (2011) Landscape of fear visible from space.
Sci Reports 1: 14doi:10.1038/srep00014.
23. Pringle H (2010) Google Earth shows clandestine worlds. Science 329: 1008–
1009.
24. Estes AB, Kuemmerle T, Kushnir H, Radeloff VC, Shugart HH (2012) Land-
cover change and human population trends in the Serengeti ecosystem from
1984–2003. Biol Conserv 147: 255–263.
25. Andrefouet S, Kramer P, Torres-Pulliza D, Joyce KE, Hochberg EJ, et al.
(2003) Multi-site evaluation of IKONOS data for classification of tropical coralreef environments. Remote Sens Environ 88: 128–143.
26. Capolsini P, Andrefouet S, Rion C, Payri C (2003) A comparion of LandsatETM+, SPOT HRV, Ikonos, ASTER, and airborne MASTER data for coral
reef habitat mapping in South Pacific islands. Can J Remote Sens 29: 187–200.
27. Masuoka PM, Claborn DM, Andre RG, Nigro J, Gordon SW, et al. (2003) Use
of IKONOS and Landsat for malaria control in the Republic of Korea.Remote Sens Environ 88: 187–194.
28. Nagendra H, Rocchini D, Ghate R, Sharma B, Pareeth S (2010) Assessing
plant diversity in a dry tropical forest: comparing the utility of Landsat andIkonos satellite images. Remote Sens 2: 478–496.
29. Stickler CM, Southworth J (2008) Application of multi-scale spatial and spectralanalysis for predicting primate occurrence and habitat associations in Kibale
National Park, Uganda. Remote Sens Environ 112: 2170–2186.
30. Kennedy CM (2009) Matrix effects on individual and community-level
responses of birds to forest fragmentation in Jamaica. Dissertation. Universityof Maryland, College Park, Maryland, USA.
31. Asner GP, Warner AS (2003) Canopy shadow in IKONOS satelliteobservations of tropical forests and savannas. Remote Sens Environ 87: 521–
533.
32. Asner GP, Knapp DE, Broadbent EN, Oliveira PJC, Keller M, et al. (2005)
Selective logging in the Brazilian Amazon. Science 310: 480–482.
33. Souza CM, Roberts DA, Cochrane MA (2005) Combining spectral and spatial
information to map canopy damage from selective logging and forest fires.
Remote Sens Environ 98: 329–343.
34. Matricardi EAT, Skole DL, Pedlowski MA, Chomentowski W, Fernandes LC
(2010) Assessment of tropical forest degradation by selective logging and fireusing Landsat imagery. Remote Sens Environ 114: 1117–1129.
35. Peres CA, Barlow J, Laurance WF (2006) Detecting anthropogenic disturbancein tropical forests. Trends Ecol Evol 21: 227–229.
36. Aplin P (2005) Remote sensing: ecology. Prog Phys Geog 29: 104–113.
37. Boyd DS, Foody GM (2011) An overview of recent remote sensing and GIS
based research in ecological informatics. Ecol Inform 6: 25–36.
38. Duro DC, Coops NC, Wulder MA, Han T (2007) Development of a large area
biodiversity monitoring system driven by remote sensing. Prog Phys Geog 31:235–260.
39. Foody GM (2003) Remote sensing of tropical forest environments: towards themonitoring of environmental resources for sustainable development.
Int J Remote Sens 20: 4035–4046.
40. Kerr JT, Ostrovsky M (2003) From space to species: ecological applications forremote sensing. Trends Ecol Evol 18: 299–305.
41. Mulder VL, de Bruin S, Schaepman ME, Mayr TR (2011) The use of remotesensing in soil and terrain mapping–a review. Geoderma 162: 1–19.
42. Nagendra H (2001) Using remote sensing to assess biodiversity. Int J RemoteSens 22: 2377–2400.
43. Newton AC, Hill RA, Echeverria C, Golicher D, Benayas JMR, et al. (2009)Remote sensing and the future of landscape ecology. Prog Phys Geog 33: 528–
546.
44. Wang K, Franklin SE, Guo X, Cattet M (2010) Remote sensing of ecology,
biodiversity and conservation: a review from the perspective of remote sensingspecialists. Sensors 10: 9647–9667.
45. Galindo-Leal CG, Camara IIG (2003) Atlantic Forest hotspot status: anoverview. In: Galindo-Leal CG, Camara IIG, editors. The Atlantic Forest of
South America: Biodiversity status, threats, and outlook. Washington, DC:
Island Press, 3–11.
46. Mittermeier RA, Myers N, Thomsen JB, da Fonseca GAB, Oliveri S (1998)
Biodiversity hotspots and major tropical wilderness areas: approaches to settingconservation priorities. Conserv Biol 12: 516–520.
47. Fleytas MC (2007) Cambios en el paisaje: evolucion de la cobertura vegetal enla Region Oriental del Paraguay. In: Bertoni FM, editor, Biodiversidad del
Paraguay: Una aproximacion a sus realidades. Asuncion: Fundacion MoisesBertoni, pp. 77–87.
48. Huang C, Kim S, Altstatt A, Townshend JRG, Davis P, et al. (2007) Rapid loss
of Paraguay’s Atlantic forest and the status of protected areas - A Landsatassessment. Remote Sens Environ 106, 460–466.
49. Huang C, Kim S, Song K, Townshend JRG, Davis P, et al. (2009) Assessmentof Paraguay’s forest cover change using Landsat observations. Global Planet
Change 67: 1–12.
50. Myers P, Taber A, Gamarra de Fox I (2002) Mamıferos de Paraguay. In:
Ceballos G, Simonetti JA, editors. Diversidad y conservacion de los mamıferosneotropicales. Mexico City: CONABIO-UNAM, pp. 453–502.
51. Aide TM, Clark ML, Grau HR, Lopez-Carr D, Levy MA, et al. (2012)
Deforestation and reforestation of Latin America and the Caribbean (2001–
2010). Biotropica 45: 262–271.
52. Wulder MA, White JC, Goward SN, Masek JG, Irons JR, et al. (2008) Landsat
continuity: issues and opportunities for land cover monitoring. Remote Sens
Environ 112: 955–969.
53. Jensen JR (1996) Introductory digital image processing: a remote sensing
perspective. Englewood Cliffs, NJ: Prentice-Hall. 316 p.
54. DeFries R, Karanth KK, Pareeth S (2010) Interactions between protected
areas and their surroundings in human-dominated tropical landscapes. Biol
Conserv 143: 2870–2880.
55. Estes AB, Kuemmerle T, Kushnir H, Radeloff VC, Shugart HH (2012) Land-
cover change and human population trends in the greater Serengeti ecosystem
from 1984–2003. Biol Conserv 147: 255–263.
56. Congalton RG (1991) A review of assessing the accuracy of classifications of
remotely sensed data. Remote Sens Environ 37: 35–46.
57. Aplin P, Smith GM (2011) Introduction to object-based landscape analysis.
Int J Geogr Inf Sci 25: 869–875.
58. Blaschke T (2010) Object based image analysis for remote sensing.
ISPRS J Photogramm 65: 2–16.
59. Boyle SA, Smith AT (2010) Can landscape and species characteristics predict
primate presence in forest fragments in the Brazilian Amazon? Biol Conserv
143: 1134–1143.
60. Mandujano S, Escobedo-Morales LA, Palacios-Silva R, Arroyo-Rodrıguez V,
Rodriguez-Toledo EM (2005) A metapopulation approach to conserving the
howler monkey in a highly fragmented landscape in Los Tuxtlas, Mexico. In:
Estrada A, Garber PA, Pavelka MSM, Luecke L, editors. New perspectives in
the study of Mesoamerican primates: Distribution, ecology, behavior, and
conservation. New York: Springer, pp. 513–538.
61. Rempel RS, Kaukinen D, Carr AP (2012) Patch Analyst and Patch Grid.
Thunder Bay, Ontario: Ontario Ministry of Natural Resources. Centre for
Northern Forest Ecosystem Research.
62. Beyer HL (2004) Hawth’s analysis tools for ArcGIS. www.spatialecology.com/
htools.
63. Calabrese JM, Fagan WF (2004) A comparison-shopper’s guide to connectivity
metrics. Front Ecol Environ 2: 529–536.
64. Gillies CS, St. Clair CC (2008) Riparian corridors enhance movement of a
forest specialist bird in fragmented tropical forest. Proc Nat Acad Sci USA 105:
19774–19779.
65. Lechner AM, Stein A, Jones SD, Ferwerda JG (2009) Remote sensing of small
and linear features: quantifying the effects of patch size and length, grid
position and detectability on land cover mapping. Remote Sens Environ 113:
2194–2204.
66. Acerbi MH (2013) Paraguay - Conservation of biodiversity and sustainable
land management in the Atlantic Forest of eastern Paraguay. P094335 -
Implementation Status Results Report: Sequence 14. Washington, DC: World
Bank. http://documents.worldbank.org/curated/en/2013/11/18481418/
paraguay-conservation-biodiversity-sustainable-land-management-atlantic-
forest-eastern-paraguay-p094335-implementation-status-results-report-
sequence-14.
67. Palacios F, Cardozo R, Caballero J, Paradeda C, Yanosky A (2013) Resultados
del monitoreo de los cambios de uso de la tierra, incendios e inundaciones
Gran Chaco Americano. Guyra Paraguay, 22 p.
68. World Wildlife Fund Paraguay (2013) Alarmante deforestacion en tierras de
Teixeira, en Paso Kurusu. http://www.wwf.org.py/?211756/Alarmante-
deforestacion-en-tierras-de-Teixeira-en-Paso-Kurusu#.
69. Rosa IMD, Souza Jr C, Ewers RM (2012) Changes in size of deforested patches
in the Brazilian Amazon. Conserv Biol 26: 932–937.
70. Ellis EC (2011) Anthropogenic transformation of the terrestrial biosphere. Phil
Trans R Soc A 369: 1010–1035.
71. Melo FPL, Arroyo-Rodrıguez V, Fahrig L, Martınez-Ramos M, Tabarelli M
(2013) On the hope for biodiversity-friendly tropical landscapes. Trends Ecol
Evol 28: 462–468.
72. De Angelo C, Paviolo A, Wiegand T, Kanagaraj R, Di Bitetti MS (2013)
Understanding species persistence for defining conservation actions: a
management landscape for jaguars in the Atlantic Forest. Biol Conserv 159:
422–433.
73. Fragano F, Clay R (2003) Atlantic Forest hotspot status: an overview. In:
Galindo-Leal CG, Camara IIG, editors. The Atlantic Forest of South America:
Biodiversity status, threats, and outlook. Washington, DC: Island Press, pp.
288–309.
74. Zuercher GL, Gipson PS, Carrillo O (2005) Diet and habitat associations of
bush dogs Speothos venaticus in the Interior Atlantic Forest of eastern Paraguay.
Oryx 39: 86–89.
75. Zuercher GL, Gipson PS, Hill K (2001) A predator-habitat assessment for felids
in the inland Atlantic Forest of eastern Paraguay: a preliminary analysis.
Endangered Species Update 18: 115–119.
76. Giordano AJ, Ballard WB (2010) Noteworthy record of a black howler monkey
(Alouatta caraya) from the central dry chaco of Paraguay. Neotrop Primates 17:
74–75.
77. Casado F, Bonvicino CR, Nagle C, Comas B, Manzur TD, et al. (2010)
Mitochondrial divergence between 2 populations of the hooded capuchin,
Cebus (Sapajus) cay (Platyrrhini, Primates). J Hered 101: 261–269.
Importance of High-Resolution Satellite Imagery
PLOS ONE | www.plosone.org 10 January 2014 | Volume 9 | Issue 1 | e86908
78. Gorresen PM, Willig MR (2004) Landscape responses of bats to habitat
fragmentation in Atlantic Forest of Paraguay. J Mammal 85: 688–697.79. McCulloch ES (2012) Environmental and landscape determinants of
population genetic structure and diversity of the great fruit-eating bat, Artibeus
lituratus, in Atlantic Forest remnants in South America. Dissertation. LouisianaState University, Baton Rouge, Louisiana, USA.
80. O’Farrill G, Galetti M, Campos-Arceiz A (2013) Frugivory and seed dispersalby tapirs: an insight on their ecological role. Integrative Zoology 8: 4–17.
81. Sekercioglu CH (2006) Increasing awareness of avian ecological function.
Trends Ecol Evol 21: 464–471.82. D’Elıa G, Mora I, Myers P, Owen RD (2008) New and noteworthy records of
Rodentia (Erethizontidae, Sciuridae, and Cricetidae) from Paraguay. Zootaxa1784: 39–57.
83. De La Sancha NU, D’Elıa G, Teta P (2012) Systematics of the subgenus ofmouse opossums Marmosa (Micoureus) (Didelphimorphia, Didelphidae) with
noteworthy records from Paraguay. Mamm Biol 77: 229–236.
84. De La Sancha NU, D’Elıa, Netto F, Perez P, Salazar-Bravo J (2009) Discoveryof Juliomys (Rodentia, Sigmodontinae) in Paraguay, a new genus of
Sigmodontinae for the country’s Atlantic Forest. Mammalia 73: 162–167.85. De La Sancha NU, D’Elıa G, Tribe CJ, Perez PE, Valdez L, et al. (2011)
Rhipidomys (Rodentia, Cricetidae) from Paraguay: noteworthy new records and
indentity of the Paraguayan species. Mammalia 75: 269–276.86. Stevens RD, Lopez-Gonzalez C, McCulloch ES, Netto F, Ortiz ML (2010)
Myotis levis (Geoffroy Saint-Hilaire) realmente ocurre en Paraguay. Mastozoo-logıa Neotropical 17: 195–200.
87. Benchimol M, Peres C (2013) Anthropogenic modulators of species-arearelationships in Neotropical primates: a continental-scale analysis of fragment-
ed forest landscapes. Divers Distrib 19: 1339–1352.
88. Desmet P, Cowling R (2004) Using the species-area relationship to set baselinetargets for conservation. Ecol Soc 9: 11.
89. Harcourt AH, Doherty DA (2005) Species-area relationships of primates intropical forest fragments: a global analysis. Journal of Appl Ecol 42: 630–637.
90. He F, Hubbell SP (2011) Species-area relationships always overestimate
extinction rates from habitat loss. Nature 473: 368–371.91. Hill JL, Curran PJ (2001) Species composition in fragmented forests:
conservation implications of changing forest area. Appl Geogr 21: 157–174.92. Ulrich W (2005) Predicting species numbers using species-area and endemics-
area relations. Biodivers Conserv 14: 3351–3362.93. Ewers RM, Didham RK (2006) Confounding factors in the detection of species
responses to habitat fragmentation. Biol Rev 81: 117–142.
94. Ewers RM, Didham RK (2006) Continuous response functions for quantifying
the strength of edge effects. J Appl Ecol 43: 527–536.
95. Ewers RM, Didham RK (2007) The effect of fragment shape and species’
sensitivity to habitat edges on animal population size. Conserv Biol 21: 926–
936.
96. Koh LP, Lee TM, Sodhi NS, Ghazoul J. 2010. An overhaul of the species-area
approach for predicting biodiversity loss: incorporating matrix and edge effects.
J Appl Ecol 47: 1063–1070.
97. Laurance WF, Camargo JLC, Luizao RCC, Laurance SG, Pimm SL et al.
(2011) The fate of Amazonian forest fragments: a 32-year investigation. Biol
Conserv 144: 56–67.
98. De La Sancha NU (In press) Patterns of small mammal diversity in fragments of
subtropical Interior Atlantic Forest in eastern Paraguay. Mammalia.
99. Kennedy C, Marra P, Fagan W, Neel M (2010) Landscape matrix and species
traits mediate responses of Neotropical resident birds to forest fragmentation in
Jamaica. Ecol Monogr 80: 651–669.
100. Kennedy C, Grant E, Neel M, Fagan W, Marra P (2011) Landscape matrix
mediates occupancy dynamics of Neotropical avian insectivores. Ecol Appl 21:
1837–1850.
101. International Bank for Reconstruction and Development and Itaipu Binacional
(2011) Global environment facility grant agreement (Conservation of
biodiversity and sustainable land management in the Atlantic Forest of eastern
Paraguay project). 29 p. http://www.paraguaybio.com.py/documentos/1_
Acuerdo%20de%20Donacion%20Ingles.pdf.
102. Zeller KA, Nijhawan S, Salom-Perez R, Potosme SH, Hines JE (2011)
Integrating occupancy modeling and interview data for corridor identification:
A case study for jaguars in Nicaragua. Biol Conserv 144: 892–901.
103. Arponen A, Lehtomaki J, Leppanen J, Tomppo E, Moilanen A (2012) Effects
of connectivity and spatial resolution of analyses on conservation prioritization
across large extents. Conserv Biol 26: 294–304.
104. Saadat H, Adamowski J, Bonnell R, Sharifi F, Namdar M, et al. (2011) Land
use and land cover classification over a large area in Iran based on single date
analysis of satellite imagery. ISPRS J Photogramm Remote Sens 66: 608–619.
105. Lynch J, Maslin M, Balzter H, Sweeting M (2013) Choose satellites to monitor
deforestation. Nature 496: 293–294.
106. Asner GP, Llactayo W, Tupayachi R, Luna ER (2013) Elevated rates of gold
mining in the Amazon revealed through high-resolution monitoring. Proc Nat
Acad Sci USA 110: 18454–18459.
Importance of High-Resolution Satellite Imagery
PLOS ONE | www.plosone.org 11 January 2014 | Volume 9 | Issue 1 | e86908
Related Documents