High resolution observations of free tropospheric humidity from METEOSAT over the Indian Ocean. R´ emy Roca, H´ el` ene Brogniez, Laurence Picon and Michel Desbois Laboratoire de M´ et´ eorologie Dynamique, CNRS, Palaiseau,France MEGHA-TROPIQUES 2nd Scientific Workshop, 2-6 July 2001, Paris, France. Abstract Water vapor is a central element of the tropical climate through its interactions with longwave radiation as well as through its forcing onto convective activity. The scales of interest for water vapor span the Hadley circulation and its subsiding dry branches down to mesoscale features of around 50km. The satellite observations from METEOSAT-5 over the Indian Ocean in the 6.3 microns band are used to derive an estimate of the free tropospheric relative humidity at 5x5 km resolution in order to better document the various scale of the moisture field. The retrieval algorithm is similar to the operational algorithm run at EUMETSAT with slight modifications in the interpretation of the inverted signal. It relies on the use of lo- cal look up table and radiative transfer computations. The ancillary data needed for the algorithm are composed of the temperature profile taken from the ECMWF analysis. The final product is the weighting function weighted mean relative humidity over the free tro- posphere (FTH). The algorithm is fully presented and is validated thanks to an ensemble of radiosondes acquired during the INDOEX campaign. It is shown that the satellite derived FTH is in excellent agreement with the in-situ measurements with a bias of -2.7% and a standard de- viation of 6%. The calibration of the captor is further investigated and shown to agree with radiosondes simulated brightness temperatures within 0.5K ruling out the idea of a calibra- tion induced bias. The full resolution FTH imagery reveals the dryness of the intertropical troposphere with value often below 10% as well as the strong horizontal gradients associ- ated with the FTH fields. Perspectives in the frame of the MEGHA-TROPIQUES mission are given. 1 Introduction Water vapor plays a key role in the climate of the Tropics through two major mechanisms: • First, in the convective regions, its vertical distribution contributes to the inhibition of vertical motions. A very dry sounding in the troposphere will usually exhibits a strong inver- sion which prevents the air particle to consume the available energy. These dry tongues in the convectively active regions were shown to strongly interact with convection during TOGA- COARE (Brown and Zhang, 1997). The origin of these quite frequent dry air masses appears to 1

Welcome message from author
This document is posted to help you gain knowledge. Please leave a comment to let me know what you think about it! Share it to your friends and learn new things together.
Transcript

High resolution observations of free tropospherichumidity from METEOSAT over the Indian Ocean.
Remy Roca, Helene Brogniez, Laurence Picon and Michel DesboisLaboratoire de Meteorologie Dynamique, CNRS, Palaiseau,France
MEGHA-TROPIQUES 2nd Scientific Workshop, 2-6 July 2001, Paris, France.
Abstract
Water vapor is a central element of the tropical climate through its interactions withlongwave radiation as well as through its forcing onto convective activity. The scales ofinterest for water vapor span the Hadley circulation and its subsiding dry branches downto mesoscale features of around 50km. The satellite observations from METEOSAT-5over the Indian Ocean in the 6.3 microns band are used to derive an estimate of the freetropospheric relative humidity at 5x5 km resolution in order to better document the variousscale of the moisture field.
The retrieval algorithm is similar to the operational algorithm run at EUMETSAT withslight modifications in the interpretation of the inverted signal. It relies on the use of lo-cal look up table and radiative transfer computations. The ancillary data needed for thealgorithm are composed of the temperature profile taken from the ECMWF analysis. Thefinal product is the weighting function weighted mean relative humidity over the free tro-posphere (FTH).
The algorithm is fully presented and is validated thanks to an ensemble of radiosondesacquired during the INDOEX campaign. It is shown that the satellite derived FTH is inexcellent agreement with the in-situ measurements with a bias of -2.7% and a standard de-viation of 6%. The calibration of the captor is further investigated and shown to agree withradiosondes simulated brightness temperatures within 0.5K ruling out the idea of a calibra-tion induced bias. The full resolution FTH imagery reveals the dryness of the intertropicaltroposphere with value often below 10% as well as the strong horizontal gradients associ-ated with the FTH fields. Perspectives in the frame of the MEGHA-TROPIQUES missionare given.
1 Introduction
Water vapor plays a key role in the climate of the Tropics through two major mechanisms:• First, in the convective regions, its vertical distribution contributes to the inhibition of
vertical motions. A very dry sounding in the troposphere will usually exhibits a strong inver-sion which prevents the air particle to consume the available energy. These dry tongues inthe convectively active regions were shown to strongly interact with convection during TOGA-COARE (Brown and Zhang, 1997). The origin of these quite frequent dry air masses appears to
1
be extra-tropical associated with some instability of the subtropical jet streams. The distributionmid-tropospheric water vapor hence modulates convection. Examples of these dry intrusionsare seen over the Warm Pool but also the Atlantic ocean and tropical Africa ( Redelsperger,2001 this issue) and were observed during INDOEX over the Indian Ocean as well.
• Second, water vapor acts as an important greenhouse gas in the atmosphere and is usu-ally associated with a strong positive feedback mechanism on the surface temperature. Due tosome non-linearities in the sensitivity of the outgoing longwave radiation to the vertical profileof water vapor, the low humidity regions have been shown to have the more potential leveragepower on the climate (e.g., Spencer and Braswell, 1997). In the intertropical belt, these lowhumidity regions are found essentially in the upper troposphere over the ITCZ and the wholefree troposphere over the subtropical large-scale subsiding regions. The latter, being extremelydry, were suggested to govern the tropical climate equilibrium, acting as fins that would allowexcess energy to be efficiently radiated to space (Pierrehumbert, 1995). The tight connectionbetween large scale transport and the moisture distribution in these subsiding regions was re-cently demonstrated (Pierrehumbert and Roca, 1998) and the role of the fine scale structureshighlighted. The role of the former region have been central to a large polemical debate inthe community over the last decade (Lindzen’s negative feedback theory). At the intraseasonalscale, the variability of the upper tropospheric humidity field over the Indian Ocean explains alarge fraction of the clear sky greenhouse effect variability (Roca et al., 2001). Tropical deepconvection can be thought of as the source of moisture for these two regions.
In order to further our understanding of the interplay between convection, dynamics andwater vapor in the climate, the crucial link between these systems need to be fully captured.On the observations side, one basically needs to scale down to the distribution of moisture atmesoscale, both in the immediate environment of the organized convective clouds as well overthe extended subtropical dry zones. By the time SAPHIR data are available, the MEGHA-TROPIQUES mission can gain insight from readily available infrared imager data analysis.The present paper offers one of such insight into the upper tropospheric humidity distributionusing the full resolution (5x5km) observations of the METEOSAT-5 so-called ”water vapor”channel.
2 Design and validation of the algorithm
2.1 Design
The present algorithm extends the Upper Tropospheric Humidity (UTH) operational algorithmof EUMETSAT (Schmetz et al., 1995) to the full resolution with slight modifications drawn onto the interpretation of the UTH parameters. It is based on the relationship between the meanrelative humidity over a layer of the troposphere and the brightness temperature. Indeed Sodenand Bretherton (1993) introduced the following relationship based on a simplified radiativetransfer theory:
ln(p0RH/cosθ) = aTB + b (1)
wherep0 is a normalizing parameter equal to the ratio of the pressure of the 240K isothermto 300 hPa which allows to account for the latitudinal and seasonal variation of the tropical lapse
2

rate (Engelen and Stephens, 1998). TheRH corresponds to the relative humidity (with respectto water) averaged over a given layer of the troposphere whose the satellite captor is sensitive to.In the EUMETSAT approach, this layer is 600-300 hPa and in the present work it is detailed inthe next section.θ is the satellite viewing angle andTB the 6.3 microns brightness temperature.The coefficientsa and b are the linear fitting coefficient. While the simplified formulationof the relationship of theTB to the humidity has been used by a number of authors, the maindifferences arises from the way to compute the fitting coefficients. Soden and Bretherton (1993)obtain the coefficients from a global fit using one month of observations of GOES-7. Similarly,Spencer and Braswell (1997) inverted the 183GHz signal of SSM/T2 using equation 1 and anensemble of radiosondes. Unlike the global approach, Schmetz et al. (1995) build a look uptable where the fitting coefficients are computedlocally using ECMWF forecasts. We herefollow the latter approach which better takes into account the high frequency variability of thelapse rate.
The local look up table relies onto radiative transfer computations that are performed usingan improved version of the narrow band model of Morcrette and Fouquart (1985). The codedescribes the METEOSAT spectral region (5.7-7.1 microns) using 10 unevenly spaced intervals.The filter function of the instrument is explicitly introduced in the computation as well as thegeometry of the observations. Despite not including the water vapor continuum effect over thisstrong absorption band which could impact the retrieval (Soden et al., 2000), the model wasshown to agree with the code used at EUMETSAT for former operational calibration within0.5K over a wide range of atmospheric situations (Roca, 2000b). The weighting function iscomputed at the time as the brightness temperature.
2.2 Result for a standard atmosphere
The figure 1 shows the expected linear relationship between the brightness temperature and thelogarithm of the relative humidity in a layer of the atmosphere. Computations are performed atnadir withp0 = 1 for 10 values of the mean profile.
The linearity is excellent with a slight departure for the driest cases (RH=1%). This indicatesthat for these simplified profiles of relative humidity, the inversion model is performing verywell.
2.3 Interpretation of the Free Tropospheric Humidity (FTH)
In the case of more realistic profiles of relative humidity, some caution need to be taken in orderto interpret properly the retrieved relative humidity. Figure 2 shows the weighting function ofthe METEOSAT-5 water vapor channel for the standard tropical atmosphere. The weightingfunction is wide and peaks around 350 hPa. The sensitivity is significant over the 600-200 hPalayer, while the humidity above 200 hPa do not contribute to the measured signal. Similarly themoisture below 800 hPa do not influence the METEOSAT-5 radiance.
In consequence, the signal measured by the satellite corresponds to the mean relative hu-midity over the layer where the sensitivity of the captor is non zero. Recall that the width, peakaltitude are function of the thermodynamical profile under considerations as well as the geome-try of view. We hence define the Free Tropospheric Humidity (FTH) as the weighting functionweighted mean relative humidity over the whole free troposphere (800-100 hPa). Because of
3

Tropical Standard Atmosphere
240 250 260 270Brightness Temperature (K)
-1
0
1
2
3
4
5
Log
(UT
H/c
osθ)
Figure 1: log(UTH/cosθ) as a function of the WV brightness temperature for a tropical standardatmosphere temperature profile. The relative humidity of the free troposphere (800-100hPa) is fixed atthe values of 1,2,3,4,5,10,20,...,100% from right to left. Computations performed at nadir geometry. Thevalue indicates the FTH corresponding to the standard tropical relative humidity profile. Dash line isthe linear regression fit.
Figure 2: Left: The tropical standard profile of relative humidity. Right: METEOSAT-5 WV channelweighting function for a standard tropical atmosphere seen at nadir.
the strong linearity, only 2 radiative computations per temperature profile are needed to obtainthe fitting coefficients. These are performed using a dry (5%) and moist (50%) constant profileof relative humidity over the 800-100 hPa layer which allows to span the range of usually en-countered moisture conditions. The sensitivity of the retrieval to the choice of the dry and moistvalues is very weak.
4
2.4 Validation of the algorithm
Prior to the evaluation of the satellite product which encompasses different sources of uncer-tainties (ancillary data, calibration, algorithm bias), we briefly present the intrinsic behavior ofthe algorithm which is estimated using the ensemble of radiosondes.
2.4.1 INDOEX Radiosondes
During the INDOEX campaign, radiosondes were launched every 6 hours from the island ofHulule, Rep. of Maldives (4.96N,73.5E) as well as from the Ron Brown vessel which travelledover the Ocean during the campaign. The full resolution soundings were acquired at NCARand were subsampled over 31 pressure levels to ease their manipulation and radiative transfercomputations. Furthermore, an in-house quality checking was applied on the data in order to re-move soundings that exhibited supersaturation in the free troposphere as well as extremely lowvalues (RH<0.5%). Given that the retrieval is restricted to the clear sky areas, the METEOSATcloud classification of Roca et al. (2001) is further used to filter out the scenes potentially con-taminated with upper level cloudiness. The matching is performed at± 15 minutes, 50km. Thefinal database is composed of 215 soundings representative of the situations encountered overthe Indian Ocean during the winter monsoon.
2.4.2 Results
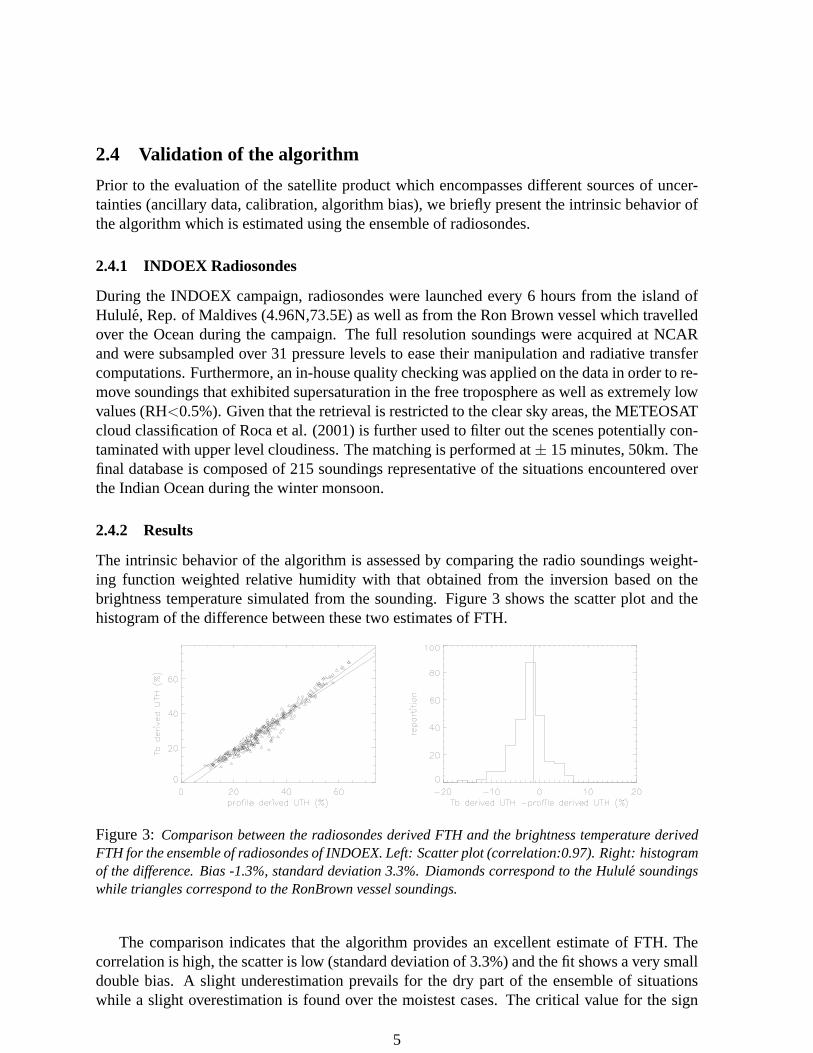
The intrinsic behavior of the algorithm is assessed by comparing the radio soundings weight-ing function weighted relative humidity with that obtained from the inversion based on thebrightness temperature simulated from the sounding. Figure 3 shows the scatter plot and thehistogram of the difference between these two estimates of FTH.
Figure 3: Comparison between the radiosondes derived FTH and the brightness temperature derivedFTH for the ensemble of radiosondes of INDOEX. Left: Scatter plot (correlation:0.97). Right: histogramof the difference. Bias -1.3%, standard deviation 3.3%. Diamonds correspond to the Hulule soundingswhile triangles correspond to the RonBrown vessel soundings.
The comparison indicates that the algorithm provides an excellent estimate of FTH. Thecorrelation is high, the scatter is low (standard deviation of 3.3%) and the fit shows a very smalldouble bias. A slight underestimation prevails for the dry part of the ensemble of situationswhile a slight overestimation is found over the moistest cases. The critical value for the sign
5
of the bias is 50%. Below this value, the algorithm slightly, but systematically, underestimatesFTH. The overall bias is very low (1.3%). Similar estimates of the algorithm behavior are foundwhen using ECMWF water vapor profile as database instead of the soundings.
3 The METEOSAT-derived FTH product
The satellite product relies on the use of the ECMWF temperature profile for the building of thelook up tables. This ancillary data set can impact the retrieval quality as well as the calibrationof the instrument.
3.1 The local look up table from ECMWF analysis
The local look up table are constructed using the ECMWF analysis at a spatial resolution of0.5x0.5 degrees every 6 hours. Up to March 9th, 31 levels are used in the radiative computationsand after the 50 levels available are used. For each pixel of METEOSAT, the closest neighbor inthe analysis in space and time is found to provide the fitting coefficients for the inversion. Theuncertainty stemming from the use of these temperature profile is discussed in the followingsections.
3.2 The WV channel calibration
The absolute calibration of the METEOSAT water vapor channel can also impact the retrieval.Briefly, the numerical raw counts measured by the captor are linearly related to a set of radiancescomputed from radiosondes. The final set of calibration coefficient depends upon the radiativetransfer model and the radiosondes. From the beginning of the operation of METEOSAT up tonowadays, much variation of the quality of this vicarious method were noticed (see Roca, 2000afor a review) and were recently corrected for the nominal satellite ISCCP archive from 1983to 1995 (Picon et al., 1999). Concerning the METEOSAT-5 spacecraft, detailed comparisonsand inter satellites calibration exercises indicates that, especially over the INDOEX period, thecalibration of the sensor was particularly stable and close to consensual estimates (Tjemkes etal., 2001). Figure 4 shows the scatter diagram of the observed brightness temperature versusthe brightness temperature simulated from our radiation code and radiosondes dataset.
The correlation is high (R=0.88) and the linearity is good. The total bias is 0.5K, the ob-servations being warmer than the simulation. The scatter is low with a standard deviation of1.8K. Note that is the warmest case (WVEBBT> 253K), corresponding to the dry end of theFTH spectrum, the satellite temperature are overall warmer than the simulations by around 1Kwhich implies a small underestimation of the product there. More generally, by differentiatingequation 1, the relative error in FTH due to a absolute error inTB reads
p0
cosθ
∆FTH
FTH= a∆TB (2)
Typical values fora range from -0.106 to -0.225 and average around -0.123. So that in thecase of the standard atmosphere seen at nadir, the calibration bias induces a relative error onFTH around 5%. Most of the satellite derived FTH errors should hence be associated with the
6

Figure 4: Scatter diagram of observed vs simulated WV channel brightness temperature. Diamondscorrespond to the Hulule soundings while triangles correspond to the RonBrown vessel soundings. Onlyclear sky scenes. 215 points form the diagram. R=0.88. Bias = 0.46K. Standard deviation: 1.8K
convolution of the intrinsic bias of the algorithm and the use of ECMWF temperature profilesfor the building of the look up table, ruling out strong calibration effect onto the product.
3.3 Evaluation of the product
The sum of the intrinsic errors of the algorithm plus the use of ancillary data is estimated bycomparing the weighting function weighted relative humidity from the radiosondes databasewith the satellite derived FTH. Figure 5 shows the scatter diagram of these two parameters.
Figure 5:Scatter diagram of satellite derived FTH versus the radiosondes estimated FTH. Diamondscorrespond to the Hulule soundings while triangles correspond to the RonBrown vessel soundings. Onlyclear sky scenes. Number of points: 215. R=0.84. Bias=-2.7%. Standard deviation 5.8%
In the low humidity regime, the product suffers from a slight underestimation of the driestcases by 3-4% which might be associated with the slight overestimation of the calibration over
7
the warmest brightness temperature. In the other part of the spectrum, the satellite derived FTHagrees well with the radiosondes with a slight average underestimation (2.7%). The standarddeviation of the product versus the in-situ estimates is also low around 6%. The distributionof the difference (Figure 5 b) confirms the slight underestimation and the low bias. The finalproduct quality closely resembles the intrinsic algorithm behavior but for a more negative biaswhich could be attributed to the ancillary data. Indeed most of the retrieved observations ofFTH are lower than the 50% threshold previously mentioned for which the behavior of theretrieval tends to systematic slight underestimation. Overall, the satellite derived FTH appearsin very good agreement with the independent in-situ estimates.
4 Example of High Resolution FTH imagery
Figure 6 shows the resulting FTH image deduced from the raw METEOSAT measurementsand the algorithm for the 15th of February, 1999 at 12:00Z over the whole INDOEX region.The cloudiness which could interfere with the 6.3µm measurements, that is, mid to upper levelclouds have been flagged in white. The cloud classification procedure from which this informa-tion is extracted is detailed in (Roca et al., 2001).
The image reveals the extreme dryness of the free troposphere over the Indian Ocean. Eventhough the product was previously shown to underestimate the FTH in the driest cases, themethodological and calibration bias is only of a few percents and cannot explain the large areasfound with value less than 10%. Comparison with similar layered relative humidity productsobtained from the microwave measurements of the SSM/T2 instrument should provide a wayfor increasing our confidence in these absolute values. The moistest areas (FTH∼ 50%) arefound to cover only a small fraction of the tropical region under consideration and is confinedto the immediate environment of the mesoscale convective systems. The maximum value ofFTH nevertheless do not exceed 55-60%. Recall that the relative humidities are here computedwith respect to liquid water. Such values are close to saturation with respect to ice water in theupper troposphere. The second main feature that is exhibited by the FTH field is the extrememagnitude of the spatial gradients. Saturation and very low humidity are separated in manycases by only around 50km.
The high resolution retrieved distribution of mid-to-upper tropospheric relative humidityshown here is very consistent with the fact that, over the intertropical belt air masses are sub-siding everywhere but in the convective towers which cover a small fraction of the whole area.Convection acts to moisten locally the upper troposphere as advocated in Roca et al. (2001)amongst others. The quantitative estimation of the local impact of convection could benefitfrom the technique proposed by (Udelhofen and Hartmann, 1995) where UTH is related to thedistance to cloud edges, even though the role of transport in building the WV field should betaken into account. The filamentary structures reveals by the satellite product is one signatureof the role of dynamics in shaping up the moisture distribution. These observations could beused to validate the very high resolution computations of water vapor relying on the chaoticadvection hypothesis proposed by Pierrehumbert (1998).
8

0
7
15
23
31
38
46
54
62
70F
ree
Tro
posp
heric
Hum
idity
(%
)
Figure 6: Free Tropospheric Humidity for the 15th of February, 1999 at 12:00Z. Mid to upper levelcloudiness is colored in white.
5 Conclusions
The METEOSAT-5 observations in the 6.3 microns band are used to interpret the signal in termsof weighting function weighted relative humidity over the free troposphere (800-100 hPa). Thealgorithm is similar to the one operationally run at EUMETSAT. It relies simply through a linearfit the brightness temperature to the FTH. The intrinsic behavior of the algorithm is evaluatedthanks to a ensemble of radiosondes. It shown to provide an excellent inversion. The satelliteproduct derivation relies on the use of ancillary data (ECMWF temperature profiles) and isshown to compare very well with the radio-soundings with a bias of 2.7% and standard deviationof 6%. The high resolution FTH imagery reveals the strong horizontal gradients in the freetropospheric moisture field as well as the extreme dryness of the subtropical atmosphere withintegrated values lower than 10%. The MEGHA-TROPIQUES mission through the SAPHIRinstrument will provide the needed vertical description at high spatial resolution of the moisturefield. The SAPHIR instrument will furthermore be of strong interested because of its soundingscapabilities which in the microwave should allow to get sensitive information in the very nearenvironment of clouds. By then, the availability of the present high resolution observations willbe used to better understand the moisture-dynamics-convection relationships.
Acknowledgements Most of this work was performed in the frame of the second author (HB)master’s thesis from the University of Paris 7 Denis Diderot. The never weakening effortswith data and CPU management of Jean-Louis Monge and the Climserv system are greatly
9

acknowledged.
6 References
Brown R.G. and Zhang C., 1997, Variability of mid-tropospheric moisture and its effect on cloud topheight distribution during TOGA-COARE, J. Atmos. Sci., 54, pp 2760-2774.Engelen R.J. and Stephens G.L, 1998, Comparison between TOVS/HIRS and SSM/T2 derived uppertropospheric humidity, Bull. Am. Met. Soc., 79, 12, pp 2748-2751.Morcrette JJ. and Fouquart Y., 1985, On systematic errors in parametrized calculations of longwaveradiation transfer, Q.J.R. Meteorol. Soc., 111, pp 691-708.Picon L., Serrar S., Desbois M., Roca R. and Monge J.-L., 1999, Homogeneity of the METEOSAT watervapor data from 1983 to 1994 , EUMETSAT Contract, EUM/CO/98/606/HW.Pierrehumbert R.T., 1998, Lateral mixing as a source of subtropical water vapor, Geophysical ResearchLetters, vol. 25, pp 151-154.Pierrehumbert R.T. and R. Roca, 1998, Evidence for control of atlantic subtropical humidity by largescale advection. , Geophysical Research Letters, vol. 25, pp 4537-4540.Redelsperger JL., 2001, Issues in tropical MCS understanding in the megha-tropiques context, 2ndMEGHA-TROPIQUES scientific workshop, July 2-6, Paris, France, this issue.Roca R, 2000a, Contributiona l’etude de la convection, de la vapeur d’eau et de leurs interactions dansles Tropiques l’aide d’observations satellites et de modele, PhD of the University of Paris 7.Roca R, 2000b, Validation of GCMs cloudiness using METEOSAT observations, ECMWF/EuroTRMMWorkshop on the Assimilation of precipitation and cloud radiances in NWP models, Reading, UK, 6-10November, in press, 20 pp.Roca R, M. Viollier, L. Picon and M. Desbois, 2001, A multi satellite analysis of deep convection andits moist environment over the Indian Ocean during the winter monsoon. , J. Geophys. Res, INDOEXspecial issue, in press.Schmetz J., C. Geijo, W. Menzel, K. Strabala, L. van de Berg, K. Holmund, and Tjemkes S., 1995,Satellite observations of upper tropospheric relative humidity, clouds and wind field divergence, Contr.to Atmos. Phys., 68, pp 345-357.Soden B.J. and F.P. Bretherton, 1993, Upper tropospheric humidity from the GOES 6.7 microns channel:method and climatology for July 1987, J. Geophys. Res., 98, pp 16669-16688.Soden B.J. and 22 co-authors, 2000, An intercomparison od radiation codes for retrieving upper tropo-spheric humidity in the 6.3 microns band: a report from the first Gvap workshop, Bull. Am. Met. Soc.,81, 4, pp 797-808.Spencer R and Braswell W, 1997, How dry is the tropical free troposphere ? Implications for globalwarming theory, Bull. Am. Met. Soc., 78, pp 1097-1106.Tjemkes S.A., Konig M., Lutz H-J., van de Berg L., and Schmetz J., 2001, Calibration of METEOSATwater vapor channel observations with independent satellite observations, J. Geophys. Res., 106, pp5199-5209.Udelhofen P. and Hartmann D., 1995, Influence of tropical cloud systems on the relative humidity in theupper troposphere, J. Geophys. Res., 100, pp 7423-7440.
10
Related Documents