HIGH RESOLUTION MASS SPECTROMETRY (HRMS) IN DISCOVERY PROTEOMICS Michael L. Merchant, PhD School of Medicine, University of Louisville Louisville, KY A clinical proteomics perspective

Welcome message from author
This document is posted to help you gain knowledge. Please leave a comment to let me know what you think about it! Share it to your friends and learn new things together.
Transcript

HIGH RESOLUTION MASS SPECTROMETRY (HRMS) IN DISCOVERY PROTEOMICS
Michael L. Merchant, PhDSchool of Medicine, University of LouisvilleLouisville, KY
A clinical proteomics perspective
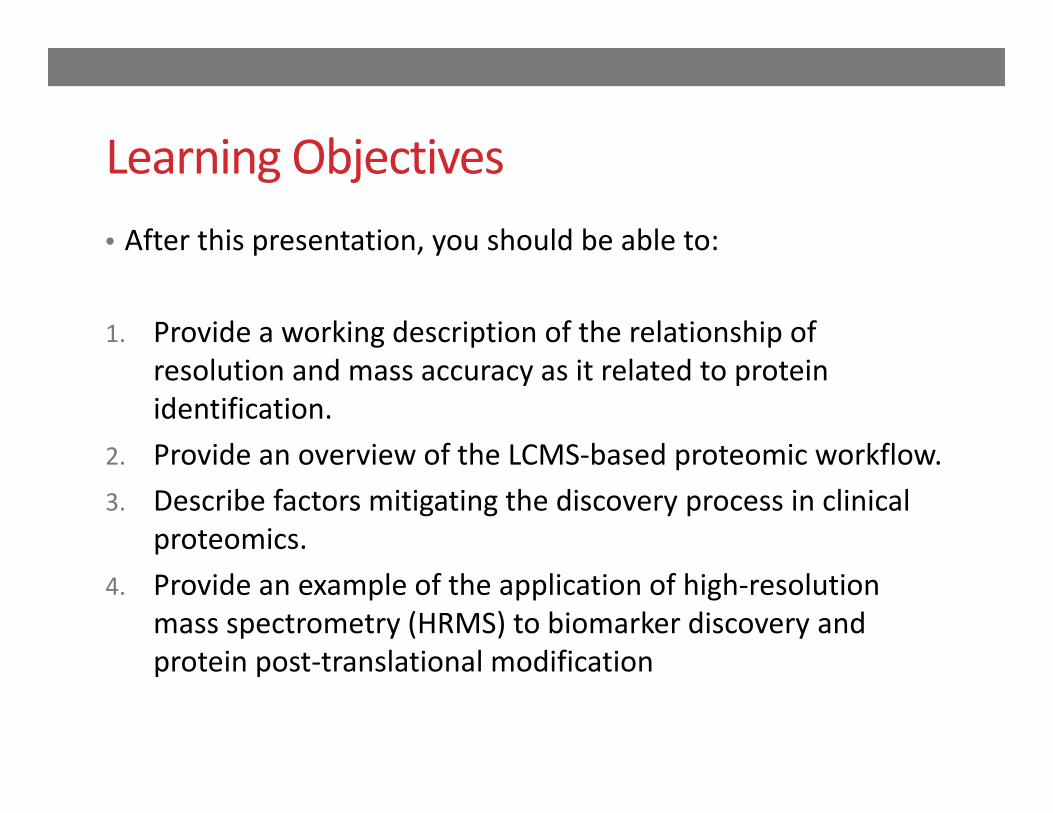
Learning Objectives• After this presentation, you should be able to:
1. Provide a working description of the relationship of resolution and mass accuracy as it related to protein identification.
2. Provide an overview of the LCMS‐based proteomic workflow. 3. Describe factors mitigating the discovery process in clinical
proteomics.4. Provide an example of the application of high‐resolution
mass spectrometry (HRMS) to biomarker discovery and protein post‐translational modification
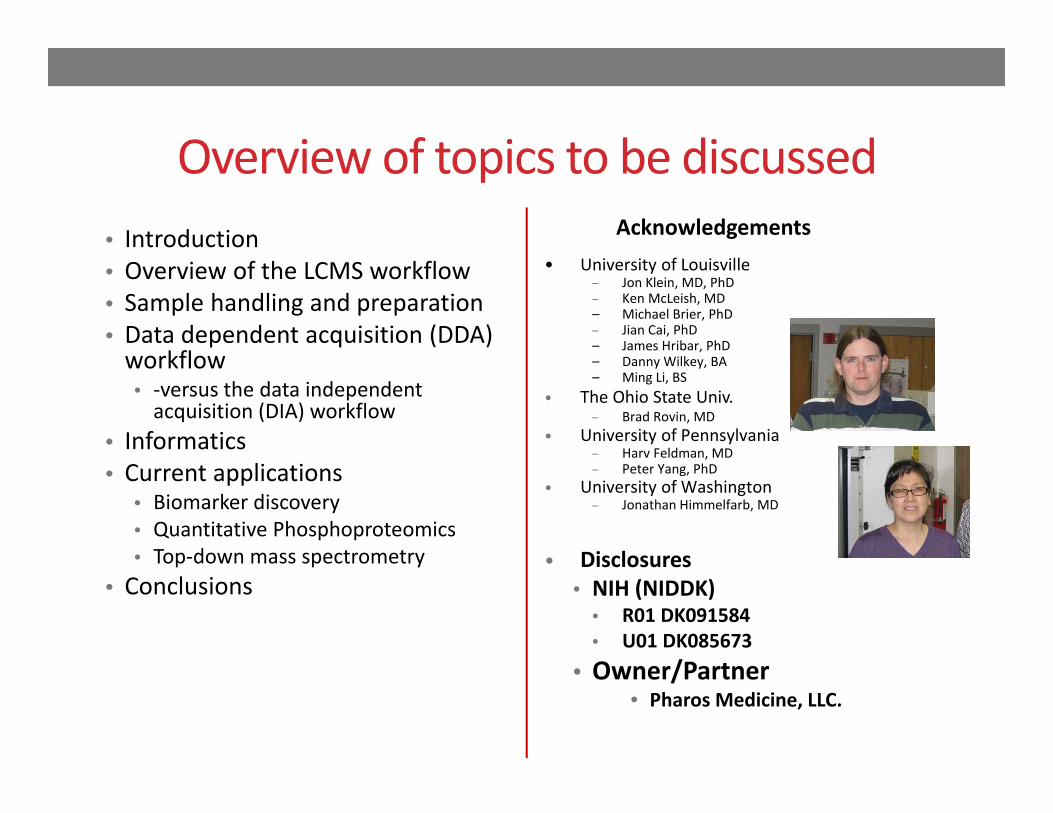
Overview of topics to be discussed• Introduction• Overview of the LCMS workflow• Sample handling and preparation• Data dependent acquisition (DDA) workflow• ‐versus the data independent acquisition (DIA) workflow
• Informatics• Current applications
• Biomarker discovery• Quantitative Phosphoproteomics• Top‐down mass spectrometry
• Conclusions
• University of Louisville– Jon Klein, MD, PhD– Ken McLeish, MD– Michael Brier, PhD– Jian Cai, PhD– James Hribar, PhD– Danny Wilkey, BA– Ming Li, BS
• The Ohio State Univ.– Brad Rovin, MD
• University of Pennsylvania– Harv Feldman, MD– Peter Yang, PhD
• University of Washington– Jonathan Himmelfarb, MD
• Disclosures• NIH (NIDDK)
• R01 DK091584• U01 DK085673
• Owner/Partner• Pharos Medicine, LLC.
Acknowledgements
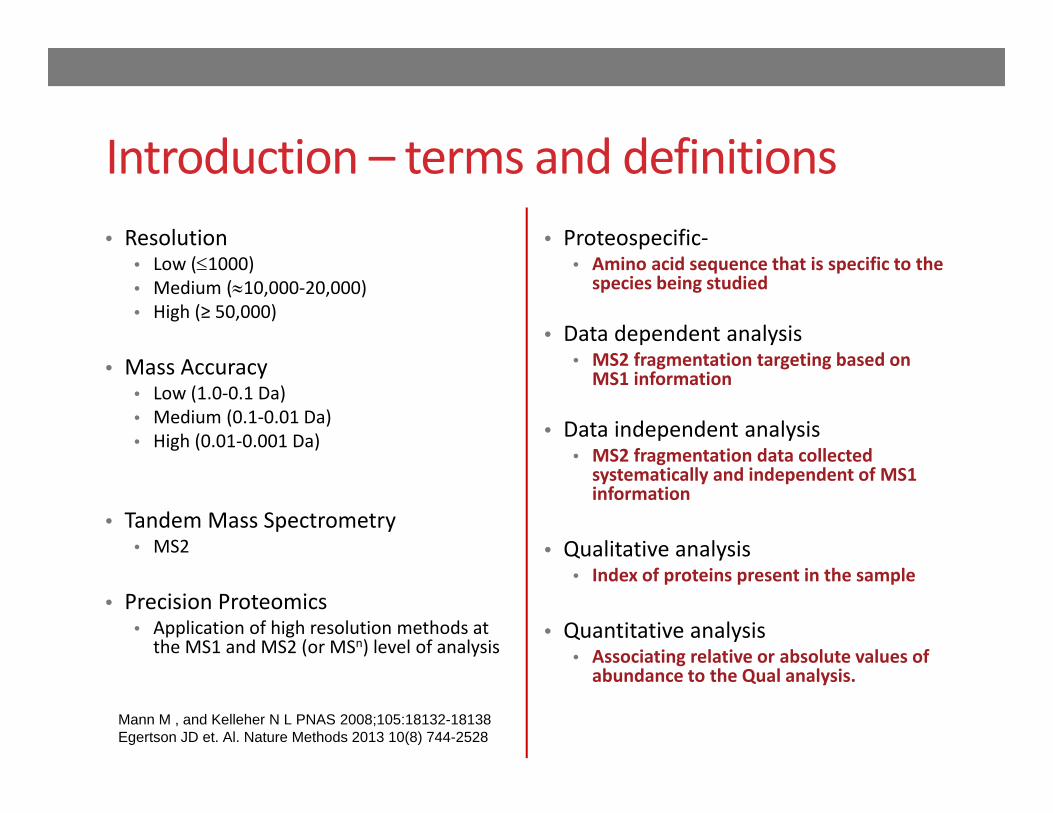
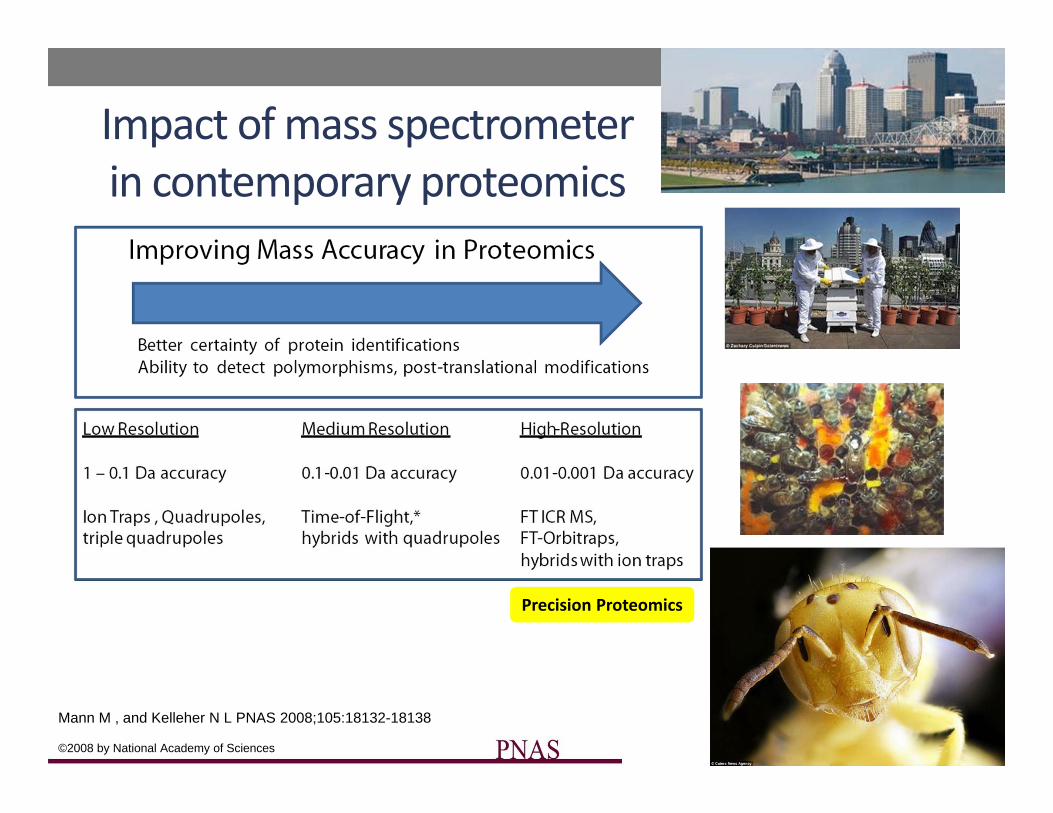
Introduction – terms and definitions• Resolution
• Low (1000)• Medium (10,000‐20,000)• High (≥ 50,000)
• Mass Accuracy• Low (1.0‐0.1 Da)• Medium (0.1‐0.01 Da)• High (0.01‐0.001 Da)
• Tandem Mass Spectrometry• MS2
• Precision Proteomics• Application of high resolution methods at the MS1 and MS2 (or MSn) level of analysis
• Proteospecific‐• Amino acid sequence that is specific to the species being studied
• Data dependent analysis• MS2 fragmentation targeting based on MS1 information
• Data independent analysis• MS2 fragmentation data collected systematically and independent of MS1 information
• Qualitative analysis• Index of proteins present in the sample
• Quantitative analysis• Associating relative or absolute values of abundance to the Qual analysis.
Mann M , and Kelleher N L PNAS 2008;105:18132-18138Egertson JD et. Al. Nature Methods 2013 10(8) 744-2528

Proteomic workflow
Traditional “ Bottom‐up” Approach Bottlenecks
• Amount of isolated protein• Sample complexity• Protein separation methods• Protease digestion• Peptide separation methods• Sensitivity, mass accuracy, and scan speed of mass spectrometer
• Prior knowledge of PTM• Protein database• False positive assignments
Protein Peptidesprotease
Mass Spectrometer
Bench work(Variability)
Informatics
Peptide assignment
Protein assignment
In Silico(Statistics)
Mann M , and Kelleher N L PNAS 2008;105:18132-18138
©2008 by National Academy of Sciences
Precision Proteomics
Impact of mass spectrometer in contemporary proteomics
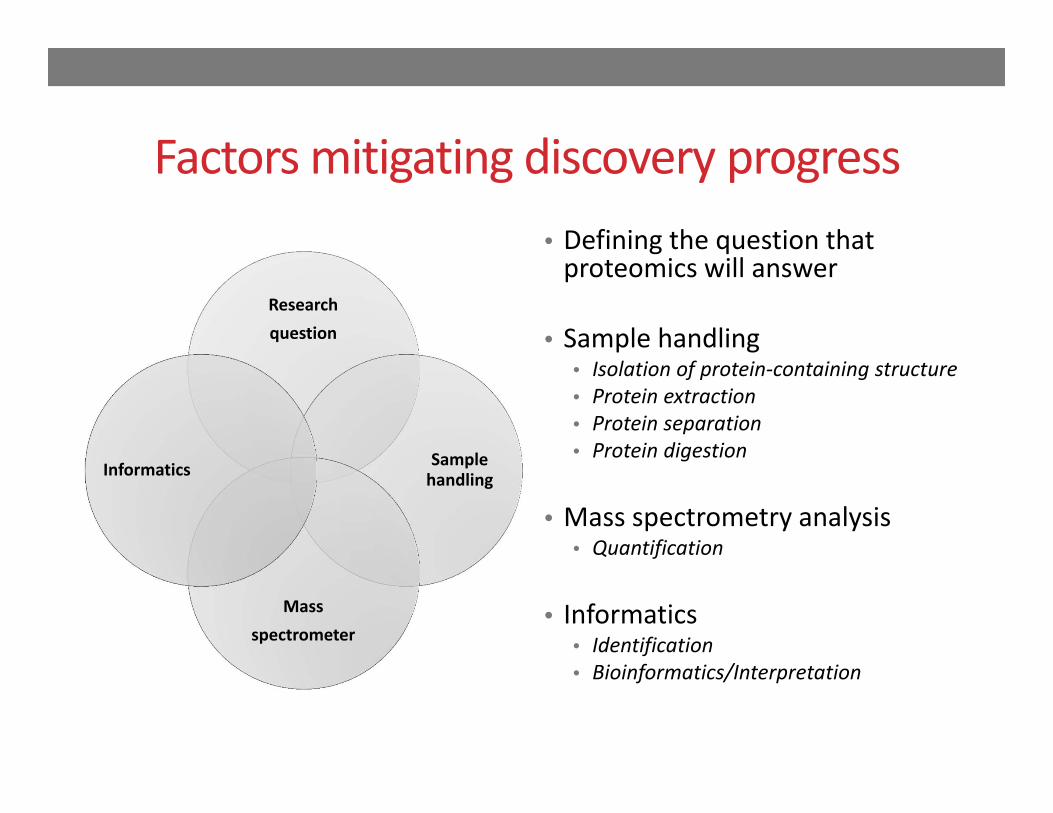
Factors mitigating discovery progress
Research question
Sample handling
Mass spectrometer
Informatics
• Defining the question that proteomics will answer
• Sample handling• Isolation of protein‐containing structure• Protein extraction• Protein separation• Protein digestion
• Mass spectrometry analysis• Quantification
• Informatics• Identification• Bioinformatics/Interpretation
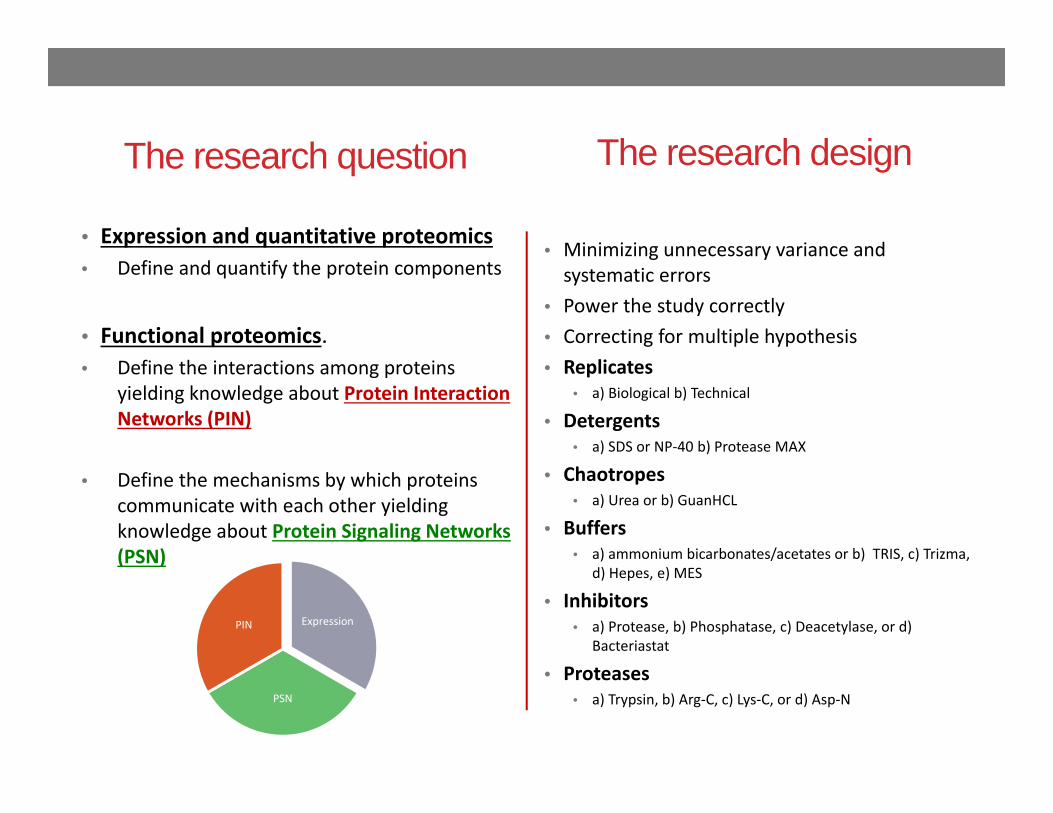
The research question
• Expression and quantitative proteomics• Define and quantify the protein components
• Functional proteomics.• Define the interactions among proteins
yielding knowledge about Protein Interaction Networks (PIN)
• Define the mechanisms by which proteins communicate with each other yielding knowledge about Protein Signaling Networks (PSN)
• Minimizing unnecessary variance and systematic errors
• Power the study correctly• Correcting for multiple hypothesis• Replicates
• a) Biological b) Technical
• Detergents• a) SDS or NP‐40 b) Protease MAX
• Chaotropes• a) Urea or b) GuanHCL
• Buffers• a) ammonium bicarbonates/acetates or b) TRIS, c) Trizma,
d) Hepes, e) MES
• Inhibitors• a) Protease, b) Phosphatase, c) Deacetylase, or d)
Bacteriastat
• Proteases• a) Trypsin, b) Arg‐C, c) Lys‐C, or d) Asp‐N
Expression
PSN
PIN
The research design

Protein Expression System
Lysis
Subcellular Fractionation
Chromatography
Ion Exchange
Affinity
Antibody Lectin Metal Chelate
Reversed Phase
SECHILIC
Electrophoresis
NativeDenaturing
1‐DE 2‐DE
Addressing complexity before mass measurement
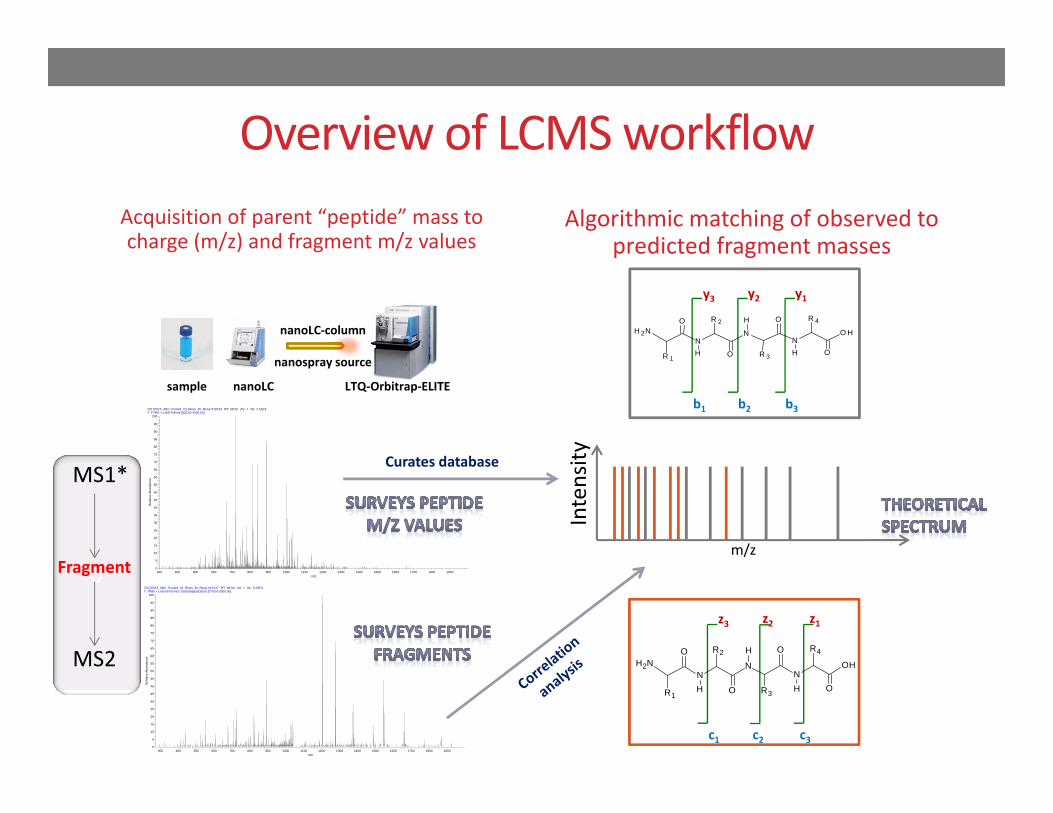
Overview of LCMS workflowAcquisition of parent “peptide” mass to charge (m/z) and fragment m/z values
Algorithmic matching of observed to predicted fragment masses
sample nanoLC LTQ‐Orbitrap‐ELITE
nanoLC‐column
nanospray source
20120524_ABC_Pooled_2d_Rovin_30_Recal #19133 RT: 68.93 AV: 1 NL: 2.51E6T: FTMS + c NSI Full ms [300.00-2000.00]
300 400 500 600 700 800 900 1000 1100 1200 1300 1400 1500 1600 1700 1800 1900m/z
0
5
10
15
20
25
30
35
40
45
50
55
60
65
70
75
80
85
90
95
100
Rel
ativ
e A
bund
ance
20120524_ABC_Pooled_2d_Rovin_30_Recal #19137 RT: 68.94 AV: 1 NL: 5.26E3T: ITMS + c NSI d Full ms2 [email protected] [275.00-2000.00]
300 400 500 600 700 800 900 1000 1100 1200 1300 1400 1500 1600 1700 1800 1900m/z
0
5
10
15
20
25
30
35
40
45
50
55
60
65
70
75
80
85
90
95
100
Rel
ativ
e A
bund
ance
y1y2y3
b3b2b1
NN
NO H
O
OH
H O
H O
NH 2
R 1
R 2
R 3
R 4
z1z2z3
c3c2c1
NN
NOH
O
OH
H O
H O
NH2
R1
R2
R3
R4
0
MS1*
MS2
FragmentIntensity
m/z
Curates database
Advantages of HRMS in proteomic discovery research
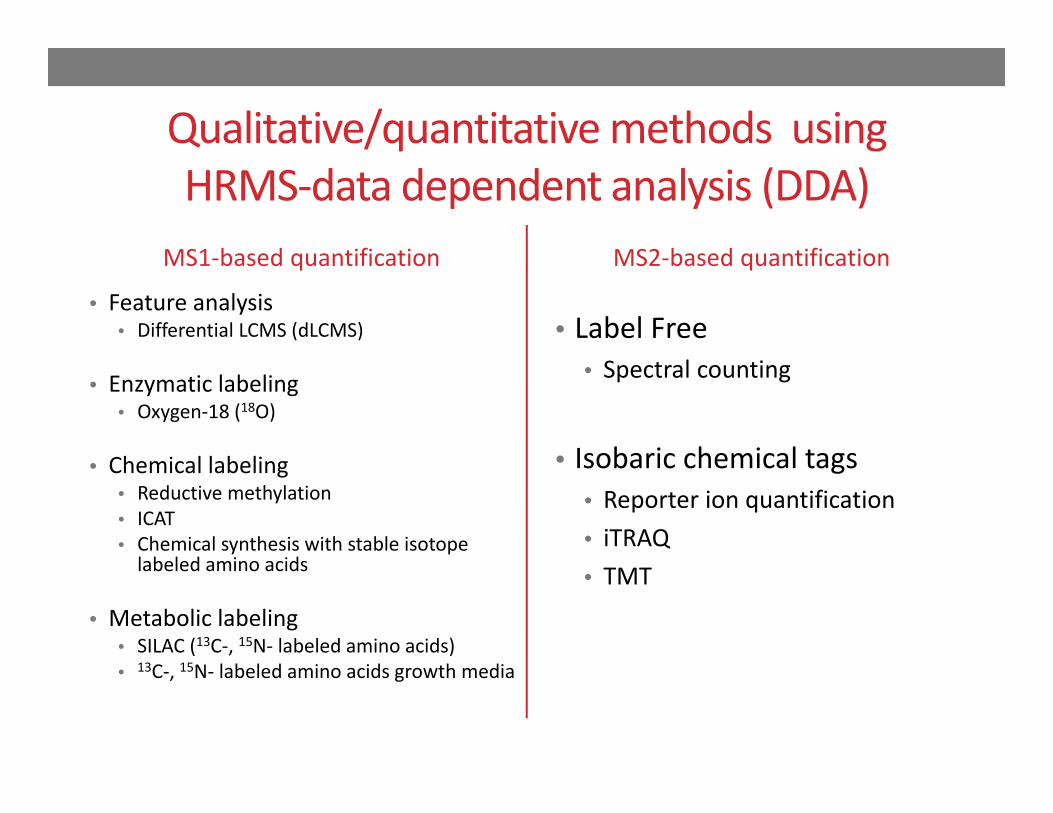
Qualitative/quantitative methods using HRMS‐data dependent analysis (DDA)
MS1‐based quantification
• Feature analysis• Differential LCMS (dLCMS)
• Enzymatic labeling• Oxygen‐18 (18O)
• Chemical labeling• Reductive methylation• ICAT• Chemical synthesis with stable isotope labeled amino acids
• Metabolic labeling• SILAC (13C‐, 15N‐ labeled amino acids)• 13C‐, 15N‐ labeled amino acids growth media
MS2‐based quantification
• Label Free• Spectral counting
• Isobaric chemical tags• Reporter ion quantification• iTRAQ• TMT
McLeish_13_20121203_Recal #11491 RT: 49.10 AV: 1 NL: 2.32E7T: FTMS + p NSI Full ms [300.00-2000.00]
400 600 800 1000 1200 1400 1600 1800m/z
0
5
10
15
20
25
30
35
40
45
50
55
60
65
70
75
80
85
90
95
100
Relative Abu
ndan
ce
636.6413m/zz=+3
McLeish_6_20121203_Recal #11740 RT: 49.53 AV: 1 NL: 1.34E7T: FTMS + p NSI Full ms [300.00-2000.00]
400 600 800 1000 1200 1400 1600 1800m/z
0
5
10
15
20
25
30
35
40
45
50
55
60
65
70
75
80
85
90
95
100Relative Abu
ndan
ce
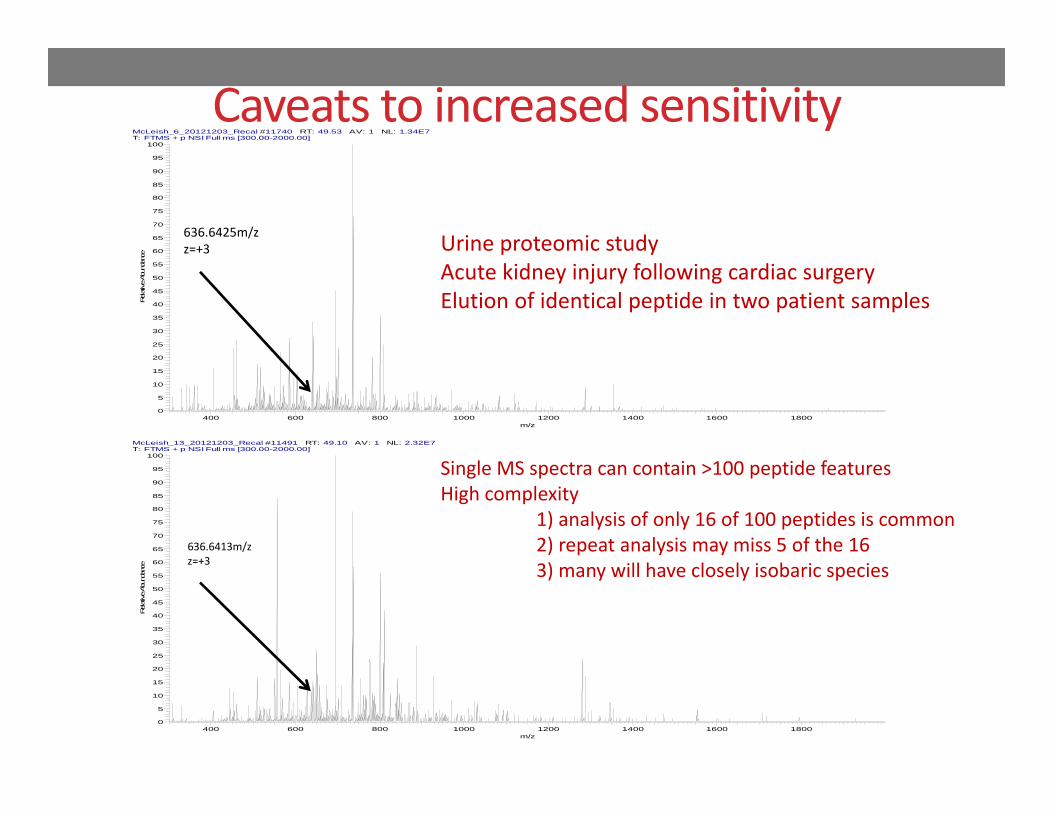
636.6425m/zz=+3 Urine proteomic study
Acute kidney injury following cardiac surgeryElution of identical peptide in two patient samples
Single MS spectra can contain >100 peptide featuresHigh complexity
1) analysis of only 16 of 100 peptides is common2) repeat analysis may miss 5 of the 163) many will have closely isobaric species
Caveats to increased sensitivity
McLeish_13_20121203_Recal #11491 RT: 49.10 AV: 1 NL: 6.36E6T: FTMS + p NSI Full ms [300.00-2000.00]
600 610 620 630 640 650 660 670 680m/z
0
5
10
15
20
25
30
35
40
45
50
55
60
65
70
75
80
85
90
95
100
Relative Abu
ndan
ce
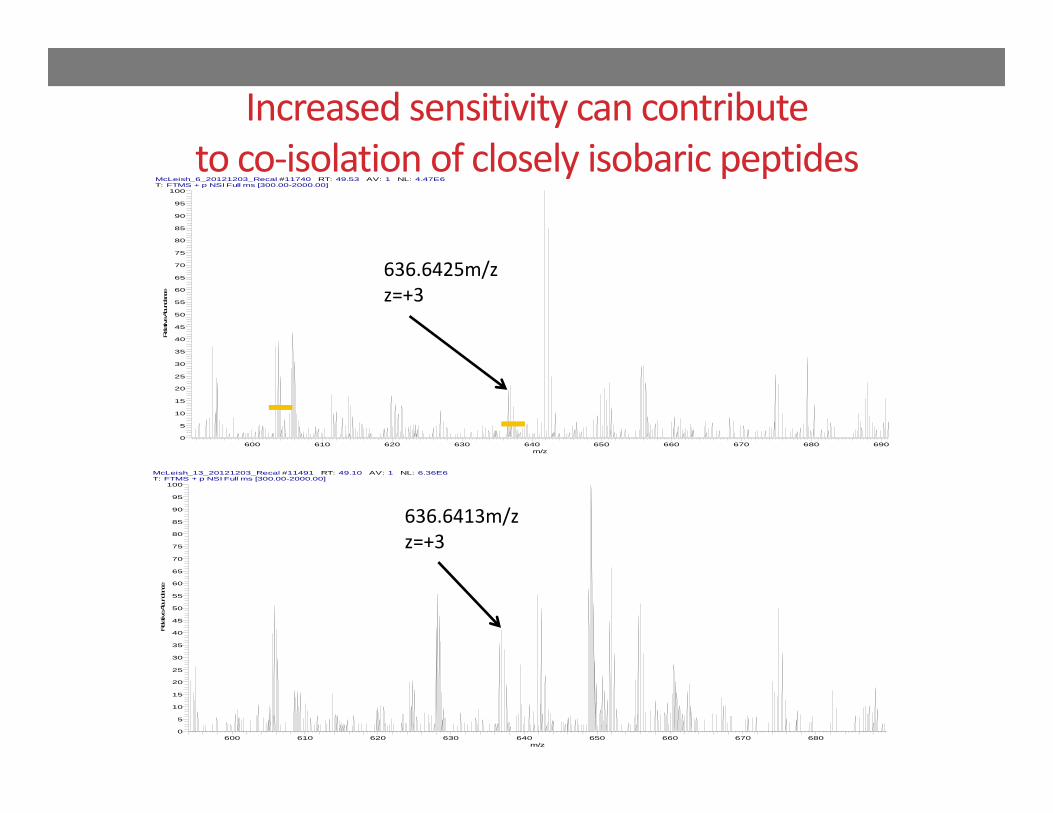
636.6413m/zz=+3
McLeish_6_20121203_Recal #11740 RT: 49.53 AV: 1 NL: 4.47E6T: FTMS + p NSI Full ms [300.00-2000.00]
600 610 620 630 640 650 660 670 680 690m/z
0
5
10
15
20
25
30
35
40
45
50
55
60
65
70
75
80
85
90
95
100
Relative Abu
ndan
ce
636.6425m/zz=+3
Increased sensitivity can contribute to co‐isolation of closely isobaric peptides
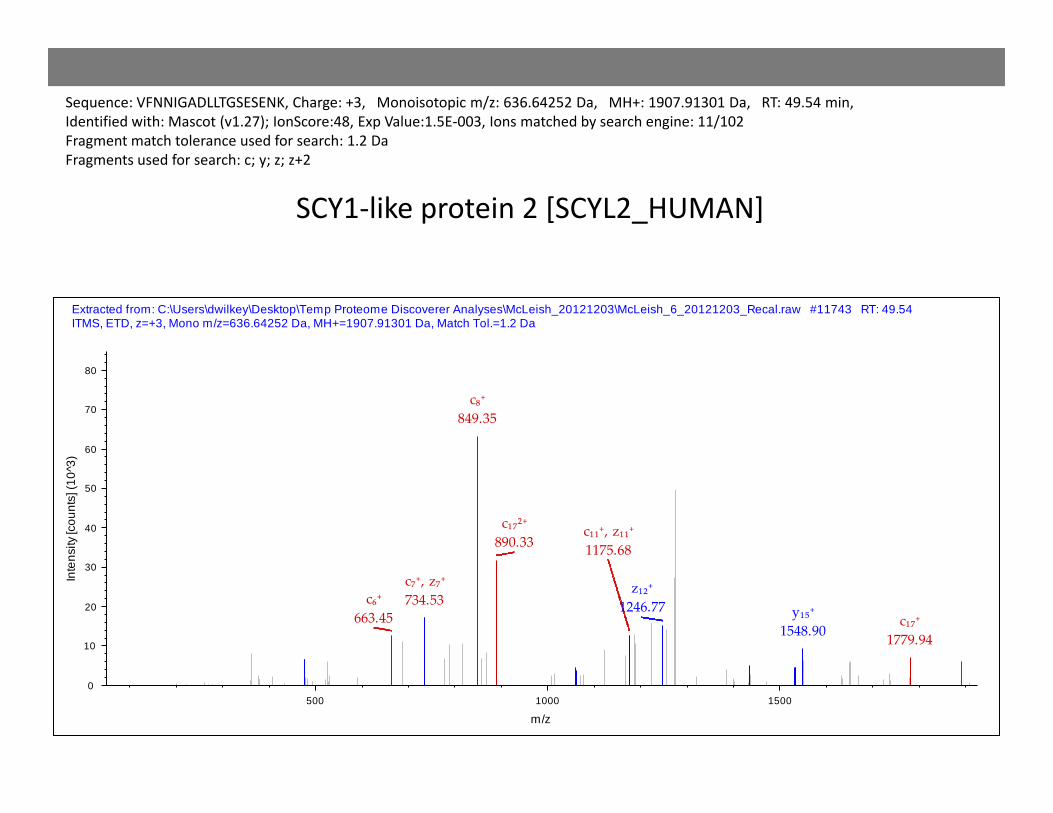
c₁₇⁺1779.94
y₁₅⁺1548.90
c₆⁺663.45
c₁₁⁺, z₁₁⁺1175.68
z₁₂⁺1246.77
c₇⁺, z₇⁺734.53
c₁₇²⁺890.33
c₈⁺849.35
500 1000 1500
m/z
0
10
20
30
40
50
60
70
80
Inte
nsity
[cou
nts]
(10^
3)
Extracted from: C:\Users\dwilkey\Desktop\Temp Proteome Discoverer Analyses\McLeish_20121203\McLeish_6_20121203_Recal.raw #11743 RT: 49.54 ITMS, ETD, z=+3, Mono m/z=636.64252 Da, MH+=1907.91301 Da, Match Tol.=1.2 Da
Sequence: VFNNIGADLLTGSESENK, Charge: +3, Monoisotopic m/z: 636.64252 Da, MH+: 1907.91301 Da, RT: 49.54 min,Identified with: Mascot (v1.27); IonScore:48, Exp Value:1.5E‐003, Ions matched by search engine: 11/102Fragment match tolerance used for search: 1.2 DaFragments used for search: c; y; z; z+2
SCY1‐like protein 2 [SCYL2_HUMAN]

HRMS in clinical proteomic studies• Label‐free identification and quantification of biomarkers of human disease (urine proteomics)• Addressing over‐abundant proteins
• Post‐translational modifications• Cell signaling and the phosphoproteome
• Direct analysis of whole proteins via top‐down MS• Histones and epigentics
URINE PROTEOMICS AND LUPUS NEPHRITISEfforts to support diagnosis without renal biopsies
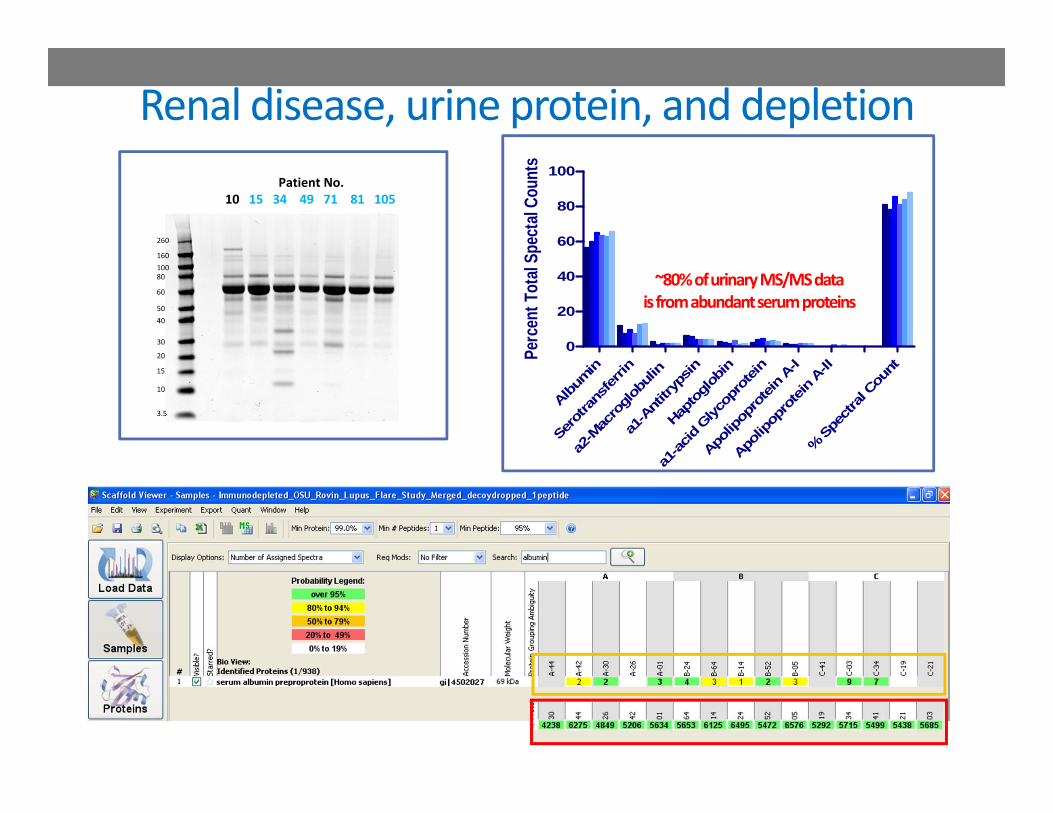
Renal disease, urine protein, and depletionPatient No.
10 15 34 49 71 81 105
Perc
ent T
otal
Spec
tal C
ount
s
Albumin
Sero
trans
ferrin
a2-M
acro
globu
lin
a1-A
ntitr
ypsin
Hapto
globin
a1-a
cid G
lycop
rotei
n
Apolip
opro
tein
A-I
Apolip
opro
tein
A-II%
Spe
ctral
Count
0
20
40
60
80
100
~80% of urinary MS/MS datais from abundant serum proteins
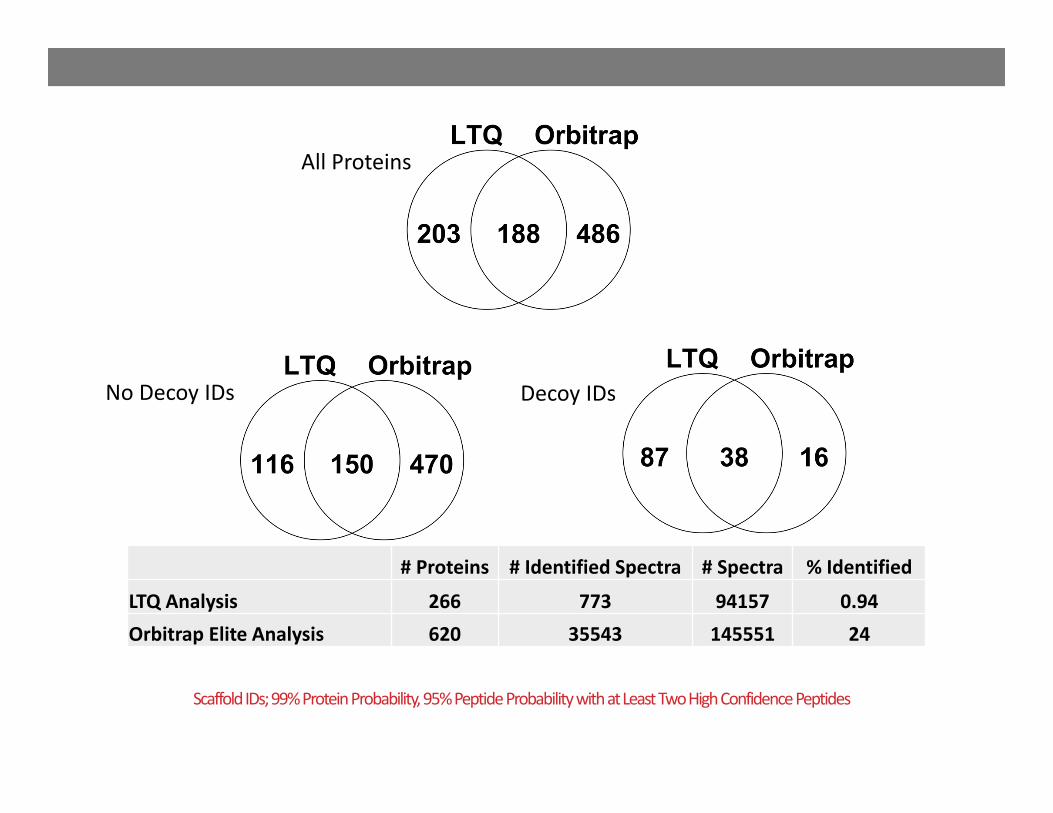
Scaffold IDs; 99% Protein Probability, 95% Peptide Probability with at Least Two High Confidence Peptides
All Proteins
Decoy IDsNo Decoy IDs
# Proteins # Identified Spectra # Spectra % Identified
LTQ Analysis 266 773 94157 0.94Orbitrap Elite Analysis 620 35543 145551 24

TIC for 0.15M Salt Step of SCX Fractionation
LTQ LTQ‐Orbitrap
RT: 20.00 - 120.00
20 25 30 35 40 45 50 55 60 65 70 75 80 85 90 95 100 105 110 115 120Time (min)
0
5
10
15
20
25
30
35
40
45
50
55
60
65
70
75
80
85
90
95
100
Rel
ativ
e A
bund
ance
NL: 3.55E7TIC F: ITMS + c NSI Full ms [300.00-2000.00] MS 20120523_ABCPooled_2d_Rovin_30
RT: 5.00 - 105.00
5 10 15 20 25 30 35 40 45 50 55 60 65 70 75 80 85 90 95 100 105Time (min)
0
5
10
15
20
25
30
35
40
45
50
55
60
65
70
75
80
85
90
95
100
Rel
ativ
e A
bund
ance
NL: 2.55E9TIC F: FTMS + c NSI Full ms [300.00-2000.00] MS 20120524_ABC_Pooled_2d_Rovin_30_Recal
Scan #19133
E+7 E+9
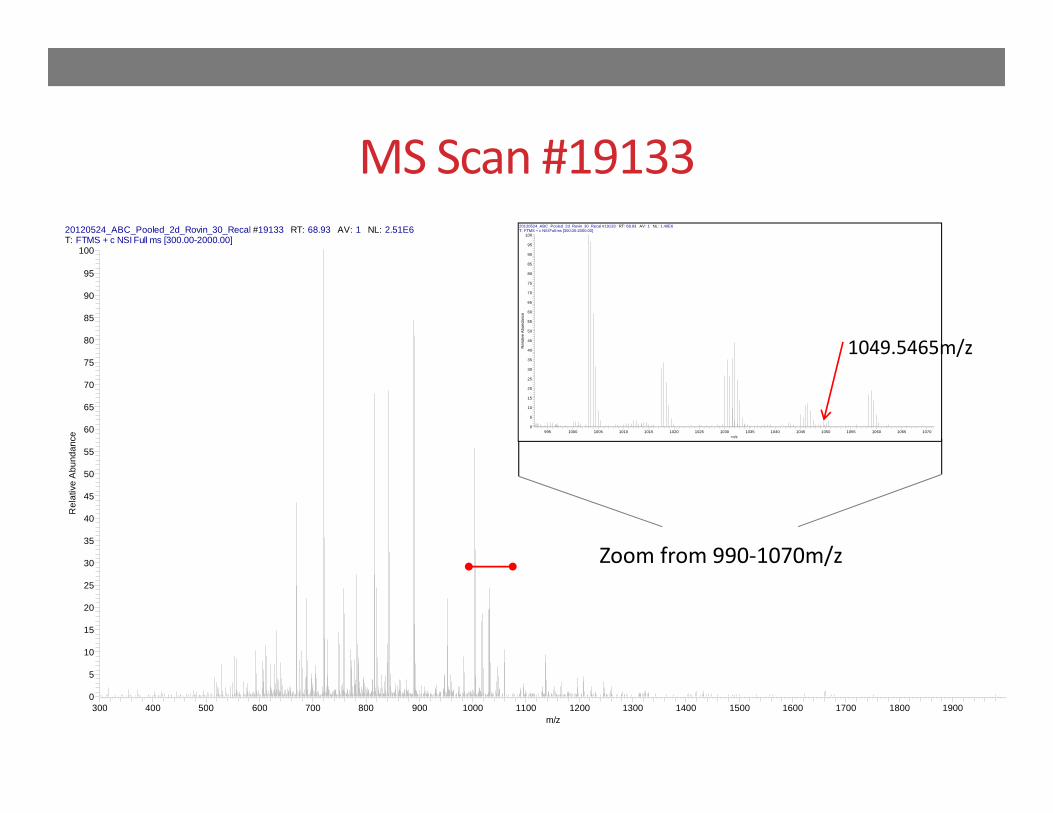
MS Scan #1913320120524_ABC_Pooled_2d_Rovin_30_Recal #19133 RT: 68.93 AV: 1 NL: 2.51E6T: FTMS + c NSI Full ms [300.00-2000.00]
300 400 500 600 700 800 900 1000 1100 1200 1300 1400 1500 1600 1700 1800 1900m/z
0
5
10
15
20
25
30
35
40
45
50
55
60
65
70
75
80
85
90
95
100
Rel
ativ
e A
bund
ance
Zoom from 990‐1070m/z
20120524_ABC_Pooled_2d_Rovin_30_Recal #19133 RT: 68.93 AV: 1 NL: 1.40E6T: FTMS + c NSI Full ms [300.00-2000.00]
995 1000 1005 1010 1015 1020 1025 1030 1035 1040 1045 1050 1055 1060 1065 1070m/z
0
5
10
15
20
25
30
35
40
45
50
55
60
65
70
75
80
85
90
95
100
Rel
ativ
e A
bund
ance
1049.5465m/z
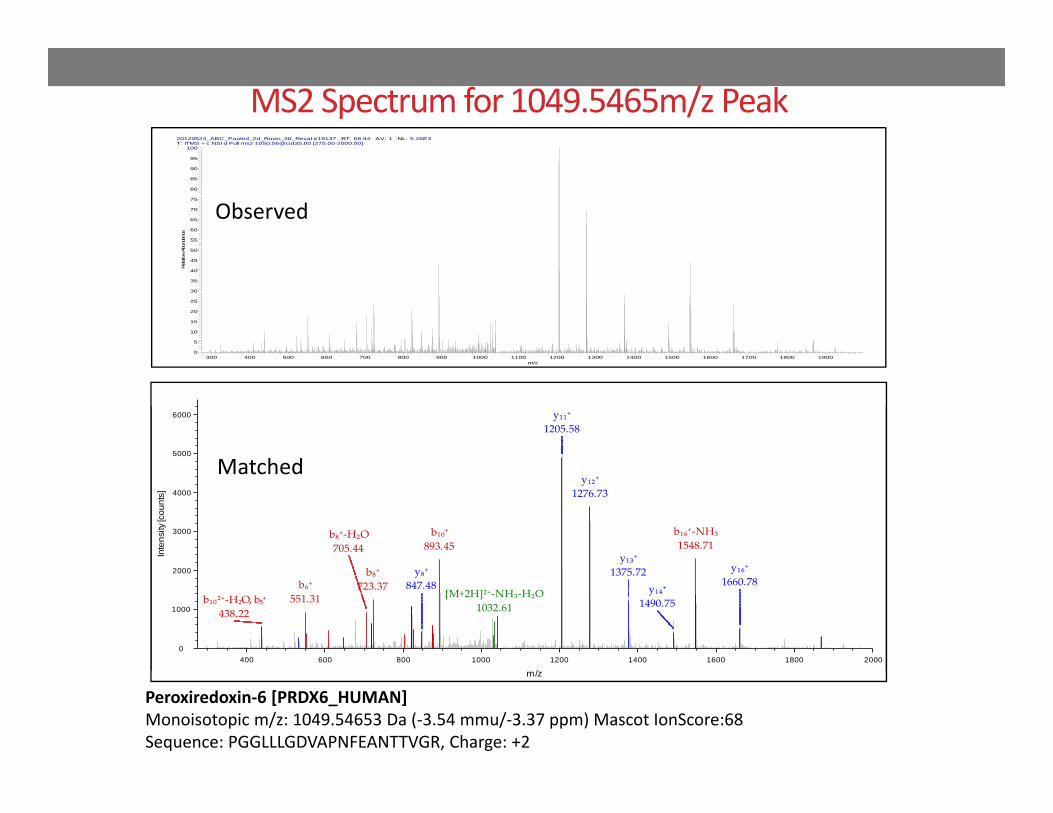
MS2 Spectrum for 1049.5465m/z Peak20120524_ABC_Pooled_2d_Rovin_30_Recal #19137 RT: 68.94 AV: 1 NL: 5.26E3T: ITMS + c NSI d Full ms2 [email protected] [275.00-2000.00]
300 400 500 600 700 800 900 1000 1100 1200 1300 1400 1500 1600 1700 1800 1900m/z
0
5
10
15
20
25
30
35
40
45
50
55
60
65
70
75
80
85
90
95
100
Relative Abu
ndan
ce
y₁₄⁺1490.75
y₈⁺847.48
y₁₆⁺1660.78
b₁₀²⁺‐H₂O, b₅⁺438.22
[M+2H]²⁺‐NH₃‐H₂O1032.61
b₆⁺551.31
b₈⁺‐H₂O705.44
y₁₃⁺1375.72b₈⁺
723.37
b₁₀⁺893.45
b₁₆⁺‐NH₃1548.71
y₁₂⁺1276.73
y₁₁⁺1205.58
400 600 800 1000 1200 1400 1600 1800 2000
m/z
0
1000
2000
3000
4000
5000
6000
Inte
nsity
[cou
nts]
, , , , ,
Peroxiredoxin‐6 [PRDX6_HUMAN] Monoisotopic m/z: 1049.54653 Da (‐3.54 mmu/‐3.37 ppm) Mascot IonScore:68Sequence: PGGLLLGDVAPNFEANTTVGR, Charge: +2
Observed
Matched
Phosphoproteome Studies
Identification of low abundant (rare) , protein post‐translational modifications to gain information on molecular signaling events…
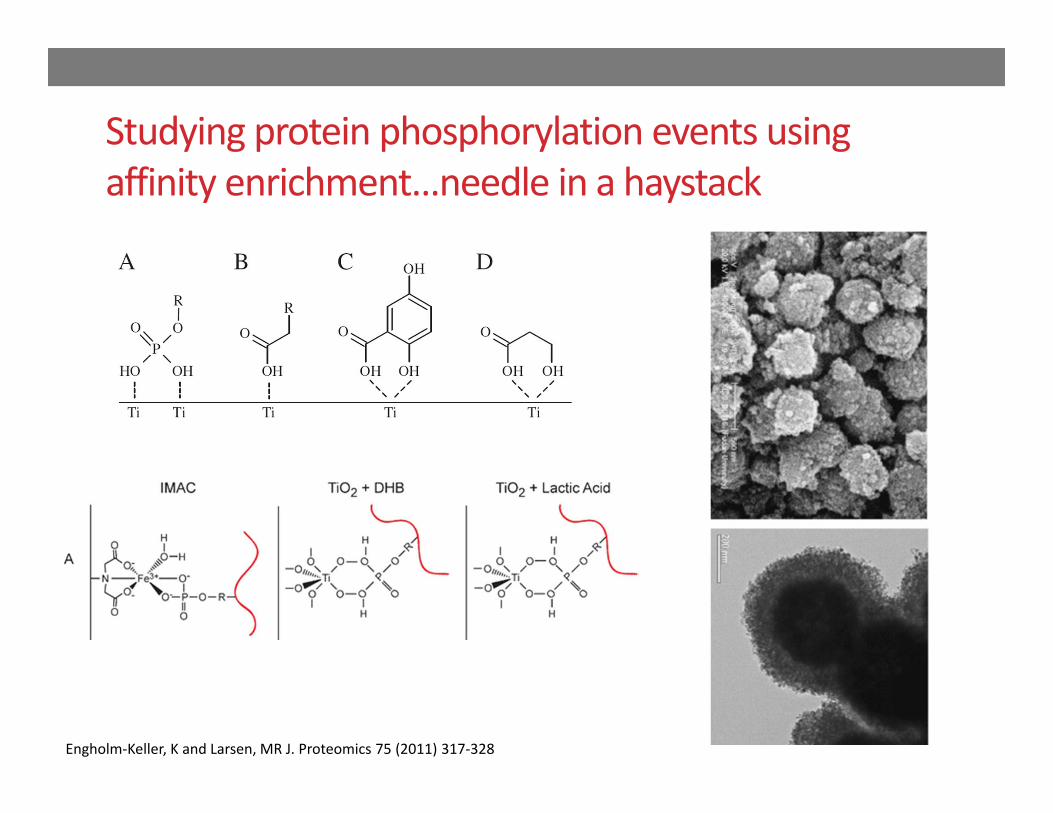
Studying protein phosphorylation events using affinity enrichment…needle in a haystack
Engholm‐Keller, K and Larsen, MR J. Proteomics 75 (2011) 317‐328
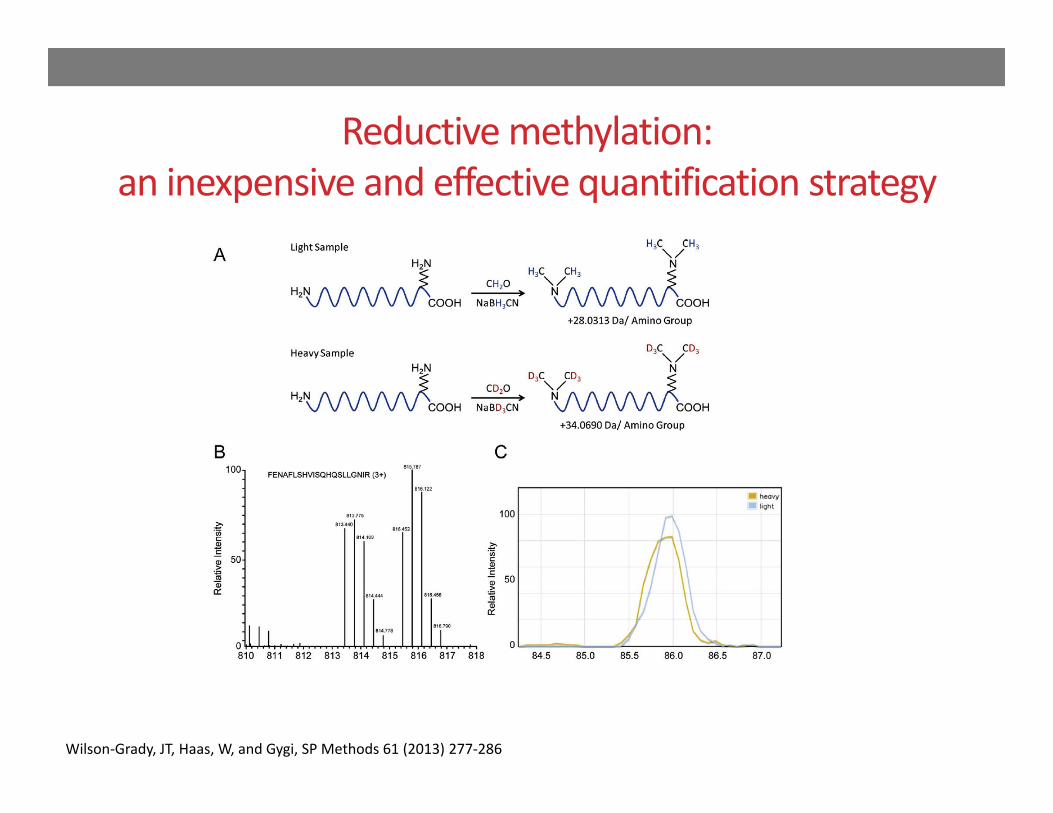
Reductive methylation:an inexpensive and effective quantification strategy
Wilson‐Grady, JT, Haas, W, and Gygi, SP Methods 61 (2013) 277‐286
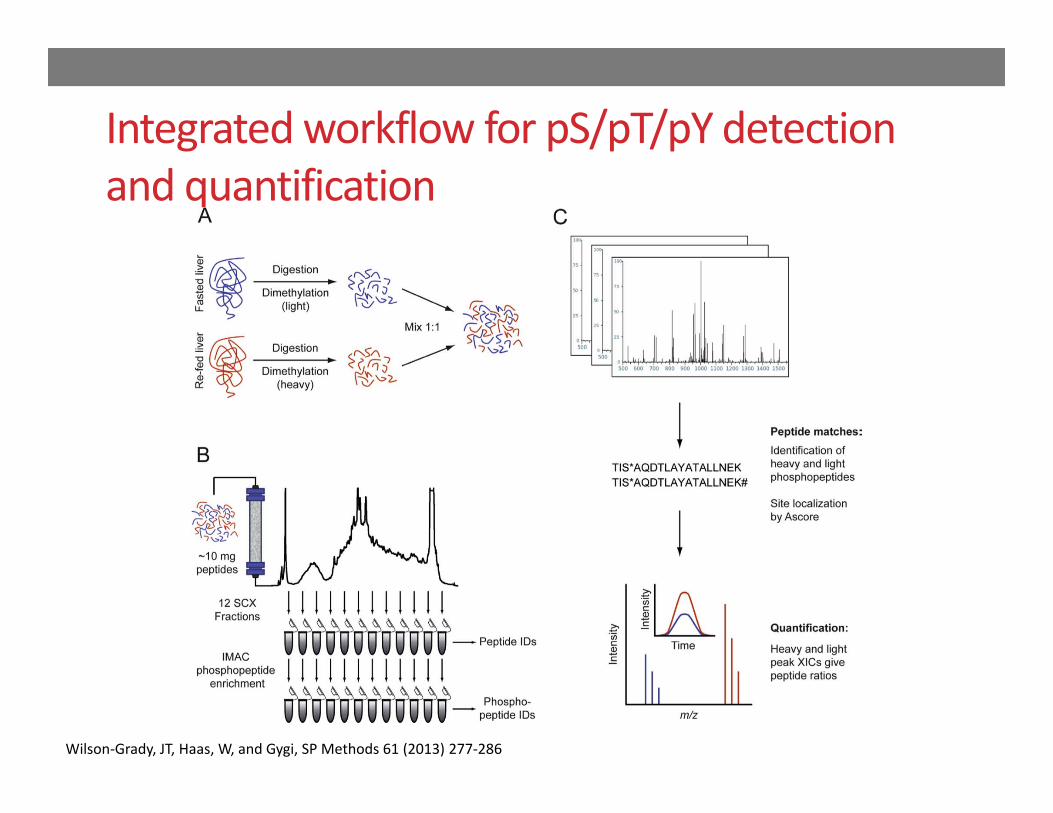
Integrated workflow for pS/pT/pY detection and quantification
Wilson‐Grady, JT, Haas, W, and Gygi, SP Methods 61 (2013) 277‐286
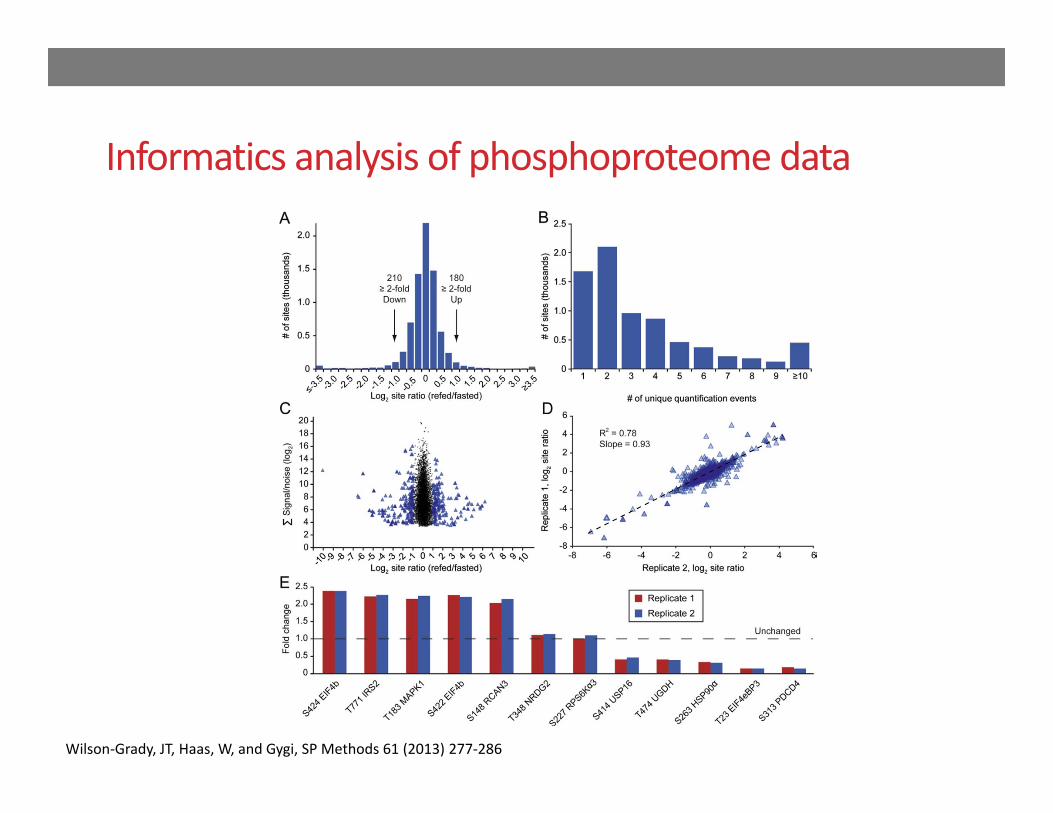
Informatics analysis of phosphoproteome data
Wilson‐Grady, JT, Haas, W, and Gygi, SP Methods 61 (2013) 277‐286
HRMS AND TOP DOWN PROTEOMICS
Analysis of protein post‐translational modifications from the whole protein level.
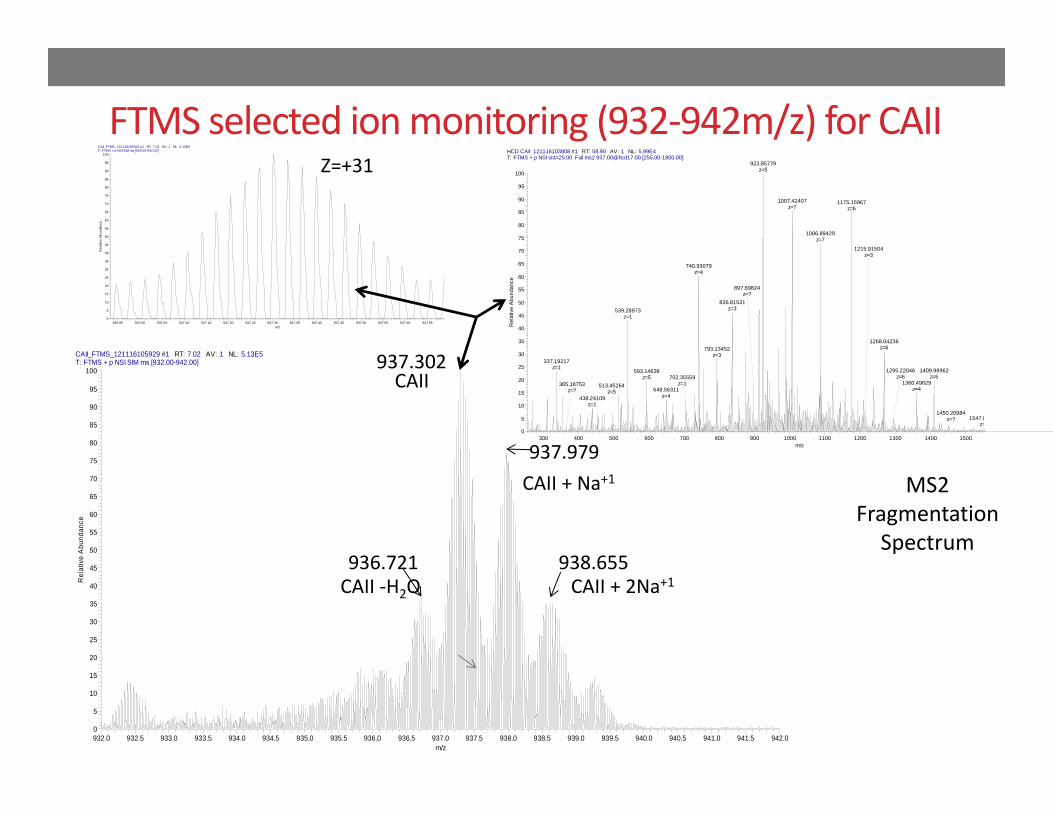
FTMS selected ion monitoring (932‐942m/z) for CAIICAII_FTMS_121116105929 #1 RT: 7.02 AV: 1 NL: 5.13E5T: FTMS + p NSI SIM ms [932.00-942.00]
936.95 937.00 937.05 937.10 937.15 937.20 937.25 937.30 937.35 937.40 937.45 937.50 937.55 937.60 937.65m/z
0
5
10
15
20
25
30
35
40
45
50
55
60
65
70
75
80
85
90
95
100
Rel
ativ
e A
bund
ance
CAII_FTMS_121116105929 #1 RT: 7.02 AV: 1 NL: 5.13E5T: FTMS + p NSI SIM ms [932.00-942.00]
932.0 932.5 933.0 933.5 934.0 934.5 935.0 935.5 936.0 936.5 937.0 937.5 938.0 938.5 939.0 939.5 940.0 940.5 941.0 941.5 942.0m/z
0
5
10
15
20
25
30
35
40
45
50
55
60
65
70
75
80
85
90
95
100
Rel
ativ
e A
bund
ance
937.302
937.979
936.721 938.655CAII ‐H2O
CAII + Na+1
CAII + 2Na+1
CAII
Z=+31HCD CAII_121116103808 #1 RT: 58.90 AV: 1 NL: 5.99E4T: FTMS + p NSI sid=25.00 Full ms2 [email protected] [255.00-1800.00]
300 400 500 600 700 800 900 1000 1100 1200 1300 1400 1500m/z
0
5
10
15
20
25
30
35
40
45
50
55
60
65
70
75
80
85
90
95
100
Rel
ativ
e A
bund
ance
923.85779z=5
1175.15967z=6
1007.42407z=7
1086.89429z=7
740.93079z=4
836.81531z=3539.28973
z=1
1268.04236z=6793.13452
z=3337.19217
z=1 1409.98962z=5
593.14636z=5
897.69824z=?
1360.49829z=4513.45264
z=5 648.56311z=4
702.35559z=1
438.24109z=1
1215.91504z=3
1295.22046z=6
365.18753z=?
1450.20984z=? 1547.8
z=
MS2Fragmentation
Spectrum
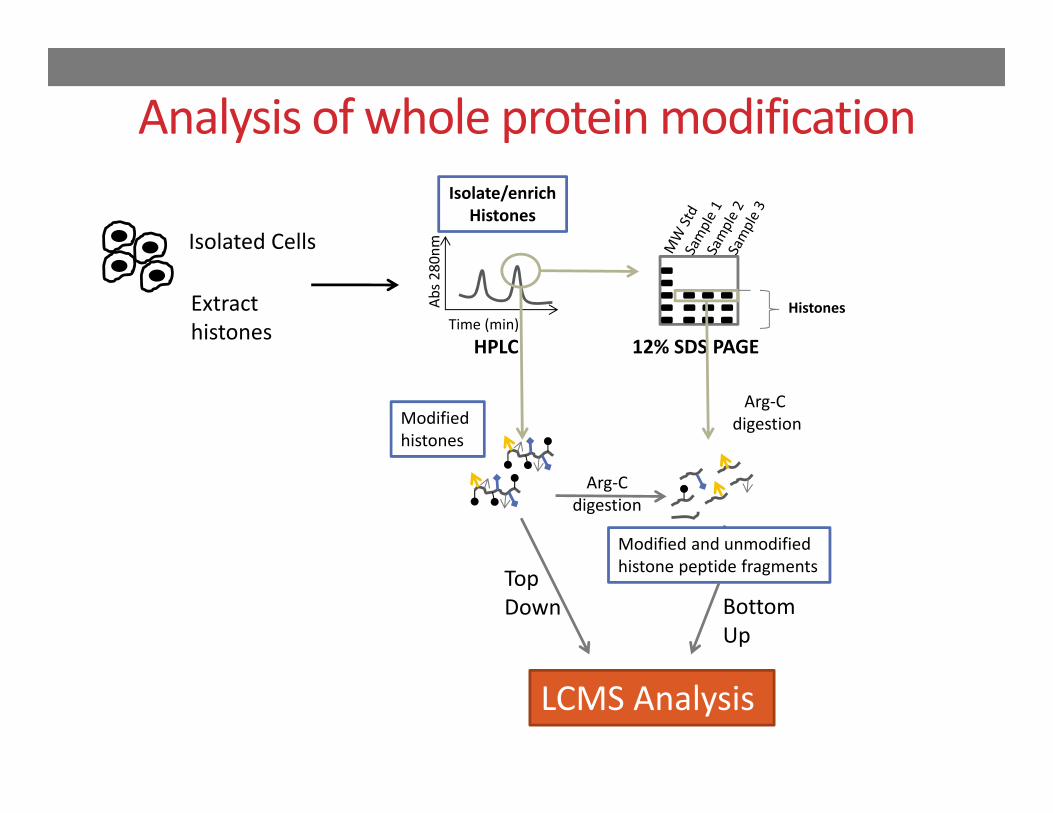
Modified histones
Histones
HPLC 12% SDS PAGE
Abs 280n
m
Time (min)
Isolate/enrichHistones
Arg‐Cdigestion
Modified and unmodified histone peptide fragments
Arg‐C digestion
Extracthistones
LCMS Analysis
Isolated Cells
TopDown Bottom
Up
Analysis of whole protein modification
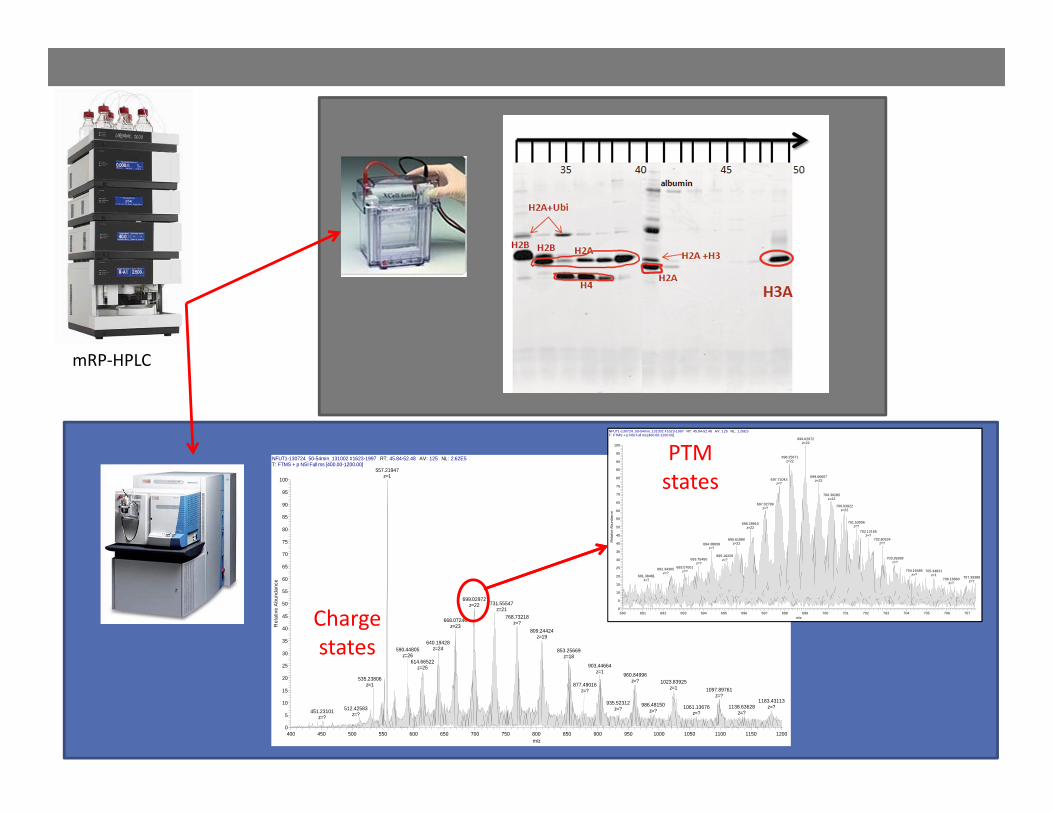
NFUT1-130724_50-54min_131002 #1623-1997 RT: 45.84-52.48 AV: 125 NL: 2.62E5T: FTMS + p NSI Full ms [400.00-1200.00]
400 450 500 550 600 650 700 750 800 850 900 950 1000 1050 1100 1150 1200m/z
0
5
10
15
20
25
30
35
40
45
50
55
60
65
70
75
80
85
90
95
100
Rel
ativ
e A
bund
ance
557.21947z=1
699.02972z=22 731.55547
z=21768.73218
z=?668.07246z=23
809.24424z=19
640.19428z=24 853.25669
z=18614.66522
z=25 903.44664z=1 960.84996
z=?535.23806z=1
590.44805z=26
1023.83925z=1 1097.89761
z=?
877.49016z=?
1183.43113z=?986.48150
z=?935.52312
z=? 1138.63628z=?
1061.13676z=?
512.42583z=?451.23101
z=?
NFUT1-130724_50-54min_131002 #1623-1997 RT: 45.84-52.48 AV: 125 NL: 1.26E5T: FTMS + p NSI Full ms [400.00-1200.00]
690 691 692 693 694 695 696 697 698 699 700 701 702 703 704 705 706 707m/z
0
5
10
15
20
25
30
35
40
45
50
55
60
65
70
75
80
85
90
95
100
Rel
ativ
e A
bund
ance
699.02972z=22
698.25671z=22
699.66607z=22697.71043
z=?
700.30285z=22
697.02799z=? 700.93922
z=22
701.53006z=?
696.29910z=22
702.80224z=?
695.61880z=22
702.12165z=?
694.38839z=?
695.16229z=? 703.39289
z=?693.75450
z=?693.07001
z=? 704.16485z=?
705.34821z=1
692.34305z=?
691.38481z=?
707.39389z=?706.16880
z=?
mRP‐HPLC
Chargestates
PTMstates

Conclusions• The sensitivity and analytic power of current HRMS platforms are pushing the boundaries of discovery work.
• Given the increased sensitivity of state‐of‐the‐art mass spectrometers, sample (mis‐)handling can significantly impact the quality of the data regardless of the proteomic end goal.
• With regards to clinical proteomics experiments, maximizing reproducible sample handling is vital to the success of all clinical proteomic projects.
• LCMS based proteomics methods are important tools that can be used to aid in the study human health and disease.
• Efficient utilization of proteomic resources are often times best achieved through collaboration.
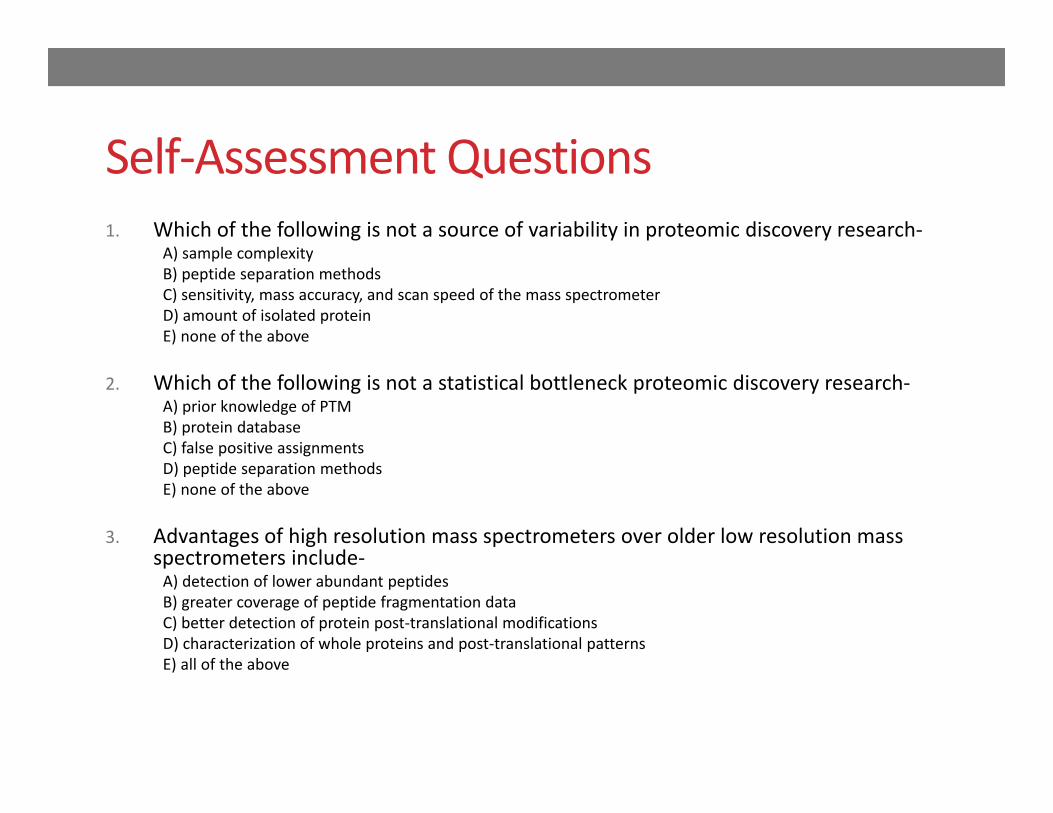
Self‐Assessment Questions1. Which of the following is not a source of variability in proteomic discovery research‐
A) sample complexityB) peptide separation methodsC) sensitivity, mass accuracy, and scan speed of the mass spectrometerD) amount of isolated proteinE) none of the above
2. Which of the following is not a statistical bottleneck proteomic discovery research‐A) prior knowledge of PTMB) protein databaseC) false positive assignmentsD) peptide separation methodsE) none of the above
3. Advantages of high resolution mass spectrometers over older low resolution mass spectrometers include‐A) detection of lower abundant peptidesB) greater coverage of peptide fragmentation dataC) better detection of protein post‐translational modificationsD) characterization of whole proteins and post‐translational patternsE) all of the above
Related Documents