High-resolution genomic profiling of chromosomal aberrations using Infinium whole-genome genotyping Daniel A. Peiffer, 1 Jennie M. Le, 1 Frank J. Steemers, 1 Weihua Chang, 1 Tony Jenniges, 1 Francisco Garcia, 1 Kirt Haden, 1 Jiangzhen Li, 2 Chad A. Shaw, 2 John Belmont, 2 Sau Wai Cheung, 2 Richard M. Shen, 1 David L. Barker, 1 and Kevin L. Gunderson 1,3 1 Illumina, Inc., San Diego, California 92121, USA; 2 Baylor College of Medicine, Houston, Texas 77030, USA Array-CGH is a powerful tool for the detection of chromosomal aberrations. The introduction of high-density SNP genotyping technology to genomic profiling, termed SNP-CGH, represents a further advance, since simultaneous measurement of both signal intensity variations and changes in allelic composition makes it possible to detect both copy number changes and copy-neutral loss-of-heterozygosity (LOH) events. We demonstrate the utility of SNP-CGH with two Infinium whole-genome genotyping BeadChips, assaying 109,000 and 317,000 SNP loci, to detect chromosomal aberrations in samples bearing constitutional aberrations as well tumor samples at sub-100 kb effective resolution. Detected aberrations include homozygous deletions, hemizygous deletions, copy-neutral LOH, duplications, and amplifications. The statistical ability to detect common aberrations was modeled by analysis of an X chromosome titration model system, and sensitivity was modeled by titration of gDNA from a tumor cell with that of its paired normal cell line. Analysis was facilitated by using a genome browser that plots log ratios of normalized intensities and allelic ratios along the chromosomes. We developed two modes of SNP-CGH analysis, a single sample and a paired sample mode. The single sample mode computes log intensity ratios and allelic ratios by referencing to canonical genotype clusters generated from ∼120 reference samples, whereas the paired sample mode uses a paired normal reference sample from the same individual. Finally, the two analysis modes are compared and contrasted for their utility in analyzing different types of input gDNA: low input amounts, fragmented gDNA, and Phi29 whole-genome pre-amplified DNA. [Supplemental material is available online at www.genome.org.] A variety of chromosomal aberrations underlies developmental abnormalities (constitutional aberration) and cancer (acquired aberration) (Albertson and Pinkel 2003). Many of these aberra- tions are characterized by rearrangements in genomic DNA or changes in copy number such as deletions, duplications, and amplifications (Kallioniemi et al. 1992, 1994, 1996; Hayashizaki et al. 1993; Wang et al. 2002). Historically, two key techniques have been used to measure DNA copy number in DNA samples: comparative genomic hybridization (CGH) and loss of heterozy- gosity (LOH). CGH has been used extensively to detect amplifi- cations and large homozygous deletions, and LOH has been used to detect regions of allelic homogeneity indicative of hemizygous deletions or copy-neutral LOH. LOH is typically assessed through the analysis of polymorphic genetic markers, traditionally either VNTRs or RFLPs (Singh et al. 1993; Dockhorn-Dworniczak et al. 1994), and more recently single nucleotide polymorphisms (SNPs) (Slater et al. 2005; Zheng et al. 2005). The importance of LOH is underscored by its extensive history in the discovery of many classical tumor-suppressor genes (TSGs) including RB1, WT1, and TP53, involved in the formation of retinoblastoma, Wilm’s tumor, and Li-Fraumeni syndrome, respectively (Gray and Collins 2000; Hanahan and Weinberg 2000; Albertson and Pinkel 2003; Albertson et al. 2003). CGH has been used widely to characterize DNA copy changes in tumors. Originally this technique was implemented using metaphase chromosomal spreads but has been adapted to array-CGH using BAC, cDNA, and oligonucleotide arrays (Soli- nas-Toldo et al. 1997; Pinkel et al. 1998; Albertson and Pinkel 2003; Barrett et al. 2004; Ylstra et al. 2006). Development of high-density array-CGH technology has enabled 100-kb resolu- tion using whole-genome BAC arrays containing >33,000 BAC clones (Ishkanian et al. 2004), or with oligonucleotide arrays con- taining >390,000 probes (Selzer et al. 2005). The effective resolu- tion is not just a function of the number of probes on the array, but also depends on the signal-to-noise ratio (SNR) of the system. Typically, oligonucleotide probes have a much lower SNR than BAC arrays, and as a result oligonucleotide arrays require averag- ing over greater numbers of probes to achieve the same effective resolution (Ylstra et al. 2006). Nonetheless, oligonucleotide ar- rays are easily manufactured, and the technology is amenable to scaling improvements allowing ever-increasing feature density. The ability to detect microdeletions and microduplications is essential in the study of constitutional disorders. Several dis- ease states have been attributed to both microdeletion haploin- sufficiency and duplication-mediated overexpression in regions harboring known transcription factors and tumor-suppressor genes (Santarosa and Ashworth 2004). As such, microsatellite LOH and FISH have been instrumental in detecting microdele- tions, such as the Williams-Beuren Syndrome (WBS) caused by a heterozygous deletion of a 1.5-Mb region on chromosome 7q11.23 (Francke 1999). Surprisingly, duplications in this region also lead to a phenotype that is nearly the inverse of the WBS phenotype (Somerville et al. 2005). In spite of the progress in this 3 Corresponding author. E-mail [email protected]; fax (858) 202-4680. Article published online before print. Article and publication date are at http:// www.genome.org/cgi/doi/10.1101/gr.5402306. Freely available online through the Genome Research Open Access option. Methods 1136 Genome Research www.genome.org 16:1136–1148 ©2006 by Cold Spring Harbor Laboratory Press; ISSN 1088-9051/06; www.genome.org

Welcome message from author
This document is posted to help you gain knowledge. Please leave a comment to let me know what you think about it! Share it to your friends and learn new things together.
Transcript
High-resolution genomic profiling of chromosomalaberrations using Infinium whole-genome genotypingDaniel A. Peiffer,1 Jennie M. Le,1 Frank J. Steemers,1 Weihua Chang,1 Tony Jenniges,1
Francisco Garcia,1 Kirt Haden,1 Jiangzhen Li,2 Chad A. Shaw,2 John Belmont,2
Sau Wai Cheung,2 Richard M. Shen,1 David L. Barker,1 and Kevin L. Gunderson1,3
1Illumina, Inc., San Diego, California 92121, USA; 2Baylor College of Medicine, Houston, Texas 77030, USA
Array-CGH is a powerful tool for the detection of chromosomal aberrations. The introduction of high-density SNPgenotyping technology to genomic profiling, termed SNP-CGH, represents a further advance, since simultaneousmeasurement of both signal intensity variations and changes in allelic composition makes it possible to detect bothcopy number changes and copy-neutral loss-of-heterozygosity (LOH) events. We demonstrate the utility of SNP-CGHwith two Infinium whole-genome genotyping BeadChips, assaying 109,000 and 317,000 SNP loci, to detectchromosomal aberrations in samples bearing constitutional aberrations as well tumor samples at sub-100 kb effectiveresolution. Detected aberrations include homozygous deletions, hemizygous deletions, copy-neutral LOH,duplications, and amplifications. The statistical ability to detect common aberrations was modeled by analysis of anX chromosome titration model system, and sensitivity was modeled by titration of gDNA from a tumor cell withthat of its paired normal cell line. Analysis was facilitated by using a genome browser that plots log ratios ofnormalized intensities and allelic ratios along the chromosomes. We developed two modes of SNP-CGH analysis, asingle sample and a paired sample mode. The single sample mode computes log intensity ratios and allelic ratios byreferencing to canonical genotype clusters generated from ∼120 reference samples, whereas the paired sample modeuses a paired normal reference sample from the same individual. Finally, the two analysis modes are compared andcontrasted for their utility in analyzing different types of input gDNA: low input amounts, fragmented gDNA, andPhi29 whole-genome pre-amplified DNA.
[Supplemental material is available online at www.genome.org.]
A variety of chromosomal aberrations underlies developmentalabnormalities (constitutional aberration) and cancer (acquiredaberration) (Albertson and Pinkel 2003). Many of these aberra-tions are characterized by rearrangements in genomic DNA orchanges in copy number such as deletions, duplications, andamplifications (Kallioniemi et al. 1992, 1994, 1996; Hayashizakiet al. 1993; Wang et al. 2002). Historically, two key techniqueshave been used to measure DNA copy number in DNA samples:comparative genomic hybridization (CGH) and loss of heterozy-gosity (LOH). CGH has been used extensively to detect amplifi-cations and large homozygous deletions, and LOH has been usedto detect regions of allelic homogeneity indicative of hemizygousdeletions or copy-neutral LOH. LOH is typically assessed throughthe analysis of polymorphic genetic markers, traditionally eitherVNTRs or RFLPs (Singh et al. 1993; Dockhorn-Dworniczak et al.1994), and more recently single nucleotide polymorphisms(SNPs) (Slater et al. 2005; Zheng et al. 2005). The importance ofLOH is underscored by its extensive history in the discovery ofmany classical tumor-suppressor genes (TSGs) including RB1,WT1, and TP53, involved in the formation of retinoblastoma,Wilm’s tumor, and Li-Fraumeni syndrome, respectively (Grayand Collins 2000; Hanahan and Weinberg 2000; Albertson andPinkel 2003; Albertson et al. 2003).
CGH has been used widely to characterize DNA copy
changes in tumors. Originally this technique was implementedusing metaphase chromosomal spreads but has been adapted toarray-CGH using BAC, cDNA, and oligonucleotide arrays (Soli-nas-Toldo et al. 1997; Pinkel et al. 1998; Albertson and Pinkel2003; Barrett et al. 2004; Ylstra et al. 2006). Development ofhigh-density array-CGH technology has enabled 100-kb resolu-tion using whole-genome BAC arrays containing >33,000 BACclones (Ishkanian et al. 2004), or with oligonucleotide arrays con-taining >390,000 probes (Selzer et al. 2005). The effective resolu-tion is not just a function of the number of probes on the array,but also depends on the signal-to-noise ratio (SNR) of the system.Typically, oligonucleotide probes have a much lower SNR thanBAC arrays, and as a result oligonucleotide arrays require averag-ing over greater numbers of probes to achieve the same effectiveresolution (Ylstra et al. 2006). Nonetheless, oligonucleotide ar-rays are easily manufactured, and the technology is amenable toscaling improvements allowing ever-increasing feature density.
The ability to detect microdeletions and microduplicationsis essential in the study of constitutional disorders. Several dis-ease states have been attributed to both microdeletion haploin-sufficiency and duplication-mediated overexpression in regionsharboring known transcription factors and tumor-suppressorgenes (Santarosa and Ashworth 2004). As such, microsatelliteLOH and FISH have been instrumental in detecting microdele-tions, such as the Williams-Beuren Syndrome (WBS) caused by aheterozygous deletion of a 1.5-Mb region on chromosome7q11.23 (Francke 1999). Surprisingly, duplications in this regionalso lead to a phenotype that is nearly the inverse of the WBSphenotype (Somerville et al. 2005). In spite of the progress in this
3Corresponding author.E-mail [email protected]; fax (858) 202-4680.Article published online before print. Article and publication date are at http://www.genome.org/cgi/doi/10.1101/gr.5402306. Freely available onlinethrough the Genome Research Open Access option.
Methods
1136 Genome Researchwww.genome.org
16:1136–1148 ©2006 by Cold Spring Harbor Laboratory Press; ISSN 1088-9051/06; www.genome.org
field, neither microsatellite LOH nor FISH analysis has the abilityto quickly demarcate the extent and breakpoints of aberrations.There is a clear need for technology that can map breakpoints ofthese aberrations to delineate genes involved in a syndrome.
The ability of SNP-CGH to simultaneously measure bothintensity differences and allelic ratios in a genomic sample allowsboth DNA copy number and copy-neutral LOH to be assessed.This is particularly important since copy-neutral LOH is receivinggreater attention as a mechanism of possible tumor initiation(Langdon et al. 2006). In tumorigenesis, copy-neutral LOH isthought to arise from mitotic recombination, caused by the oc-currence of a rare crossover event during mitotic cell division.The products of mitotic recombination are regions of the genomeexhibiting uniparental disomy (UPD), in which both genomicregions originate from the same parent (Ledbetter and Engel1995).
In this study, we demonstrate the utility of SNP-CGH withtwo Infinium whole-genome genotyping BeadChips, Human-1and the HumanHap300, assaying 109K and 317K SNP loci respec-tively, to detect chromosomal aberrations in constitutional andtumor samples. The Whole Genome Genotyping (WGG) assayhas previously been described and is composed of four basic com-ponents: a whole-genome amplification, hybridization captureon a 50mer probe array (BeadChip), array-based primer extensionSNP scoring, and immunohistochemistry-based signal amplifica-tion (Gunderson et al. 2005; Steemers et al. 2006). This assaydesign allows almost any SNP to be assayed and virtually unlim-ited multiplexing dependent only on the array feature density.Using a model system of cell lines harboring from one to four Xchromosomes, we show that this technology has very fine detec-tion limits (sub-100 kb for the 317K BeadChip) and can detectsingle copy changes in chromosomal copy number with low vari-ability levels. We demonstrate the detection of various chromo-somal aberrations including both homozygous and hemizygousdeletions as well as duplications with a set of constitutional ab-errations and tumor cell lines previously characterized by FISH,BAC array-CGH, or SKY karyotyping. For the analysis of tumorsamples, we address the effect of tumorheterogeneity and mosaicism on detec-tion limits by showing that this assaycan detect LOH in tumor samples mixedwith ∼67% normal stroma. Finally, wecompare single sample analysis to pairedsample analysis and evaluate the prosand cons of both approaches.
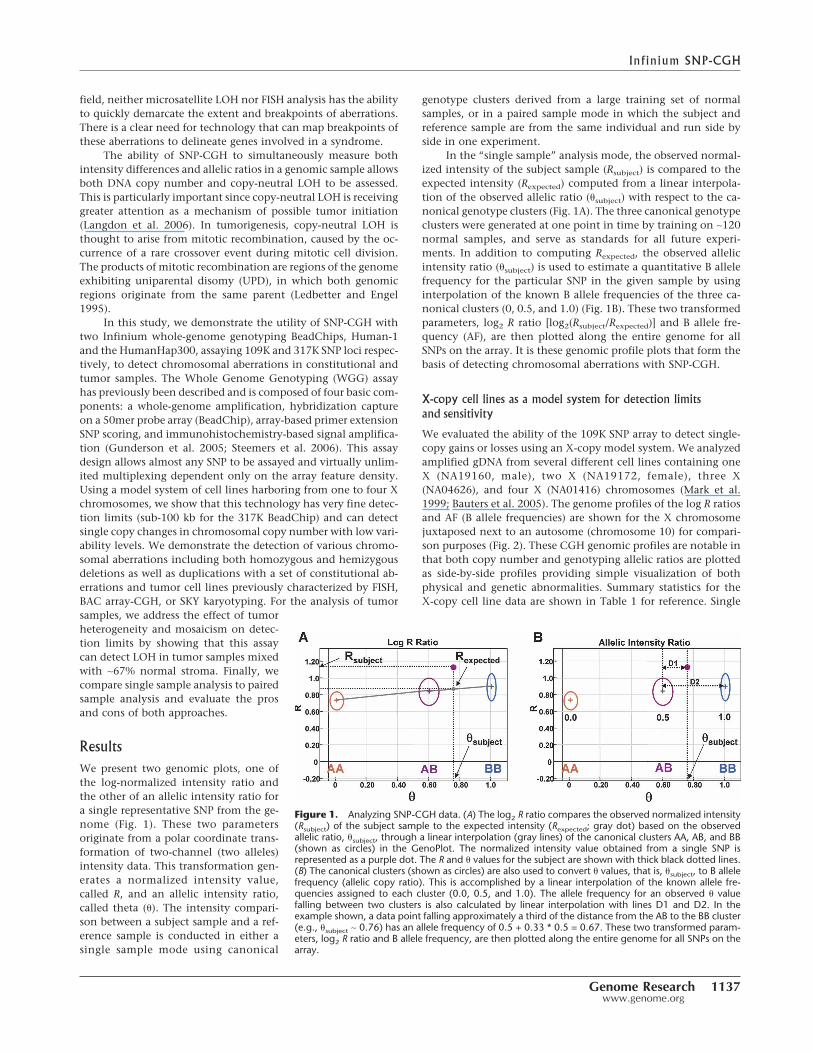
ResultsWe present two genomic plots, one ofthe log-normalized intensity ratio andthe other of an allelic intensity ratio fora single representative SNP from the ge-nome (Fig. 1). These two parametersoriginate from a polar coordinate trans-formation of two-channel (two alleles)intensity data. This transformation gen-erates a normalized intensity value,called R, and an allelic intensity ratio,called theta (�). The intensity compari-son between a subject sample and a ref-erence sample is conducted in either asingle sample mode using canonical
genotype clusters derived from a large training set of normalsamples, or in a paired sample mode in which the subject andreference sample are from the same individual and run side byside in one experiment.
In the “single sample” analysis mode, the observed normal-ized intensity of the subject sample (Rsubject) is compared to theexpected intensity (Rexpected) computed from a linear interpola-tion of the observed allelic ratio (�subject) with respect to the ca-nonical genotype clusters (Fig. 1A). The three canonical genotypeclusters were generated at one point in time by training on ∼120normal samples, and serve as standards for all future experi-ments. In addition to computing Rexpected, the observed allelicintensity ratio (�subject) is used to estimate a quantitative B allelefrequency for the particular SNP in the given sample by usinginterpolation of the known B allele frequencies of the three ca-nonical clusters (0, 0.5, and 1.0) (Fig. 1B). These two transformedparameters, log2 R ratio [log2(Rsubject/Rexpected)] and B allele fre-quency (AF), are then plotted along the entire genome for allSNPs on the array. It is these genomic profile plots that form thebasis of detecting chromosomal aberrations with SNP-CGH.
X-copy cell lines as a model system for detection limitsand sensitivity
We evaluated the ability of the 109K SNP array to detect single-copy gains or losses using an X-copy model system. We analyzedamplified gDNA from several different cell lines containing oneX (NA19160, male), two X (NA19172, female), three X(NA04626), and four X (NA01416) chromosomes (Mark et al.1999; Bauters et al. 2005). The genome profiles of the log R ratiosand AF (B allele frequencies) are shown for the X chromosomejuxtaposed next to an autosome (chromosome 10) for compari-son purposes (Fig. 2). These CGH genomic profiles are notable inthat both copy number and genotyping allelic ratios are plottedas side-by-side profiles providing simple visualization of bothphysical and genetic abnormalities. Summary statistics for theX-copy cell line data are shown in Table 1 for reference. Single
Figure 1. Analyzing SNP-CGH data. (A) The log2 R ratio compares the observed normalized intensity(Rsubject) of the subject sample to the expected intensity (Rexpected; gray dot) based on the observedallelic ratio, �subject, through a linear interpolation (gray lines) of the canonical clusters AA, AB, and BB(shown as circles) in the GenoPlot. The normalized intensity value obtained from a single SNP isrepresented as a purple dot. The R and � values for the subject are shown with thick black dotted lines.(B) The canonical clusters (shown as circles) are also used to convert � values, that is, �subject, to B allelefrequency (allelic copy ratio). This is accomplished by a linear interpolation of the known allele fre-quencies assigned to each cluster (0.0, 0.5, and 1.0). The allele frequency for an observed � valuefalling between two clusters is also calculated by linear interpolation with lines D1 and D2. In theexample shown, a data point falling approximately a third of the distance from the AB to the BB cluster(e.g., �subject ∼ 0.76) has an allele frequency of 0.5 + 0.33 * 0.5 = 0.67. These two transformed param-eters, log2 R ratio and B allele frequency, are then plotted along the entire genome for all SNPs on thearray.
Infinium SNP-CGH
Genome Research 1137www.genome.org
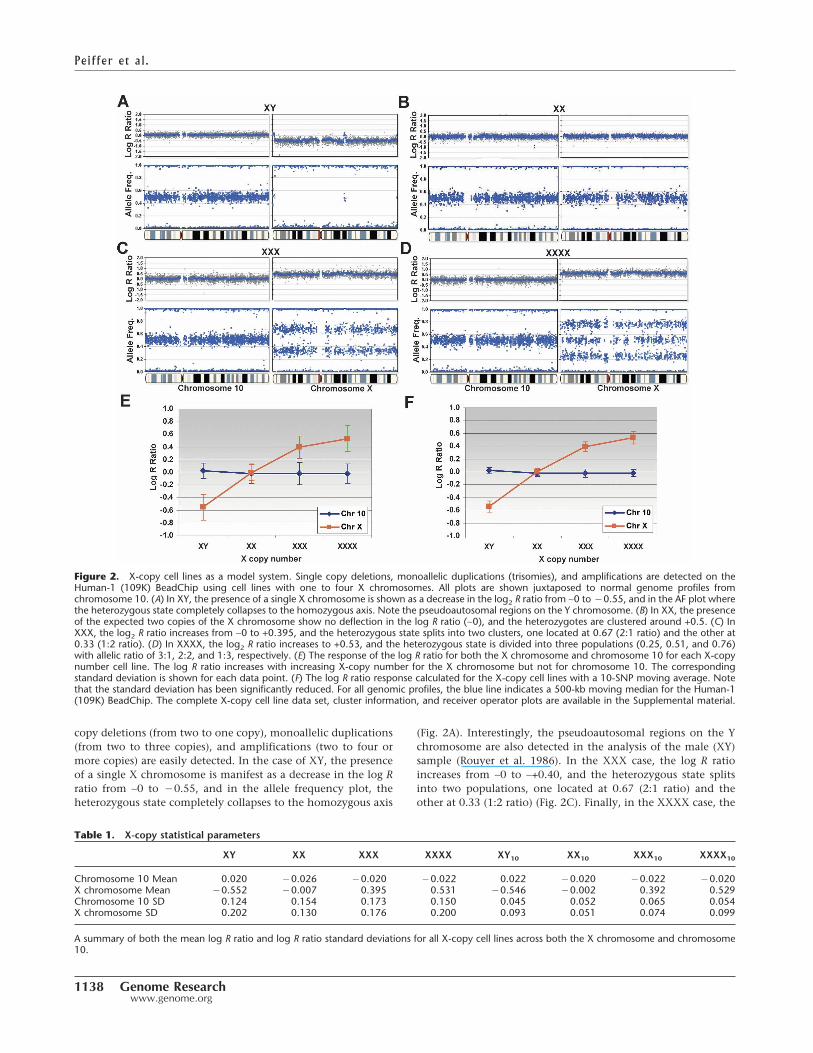
copy deletions (from two to one copy), monoallelic duplications(from two to three copies), and amplifications (two to four ormore copies) are easily detected. In the case of XY, the presenceof a single X chromosome is manifest as a decrease in the log Rratio from ∼0 to �0.55, and in the allele frequency plot, theheterozygous state completely collapses to the homozygous axis
(Fig. 2A). Interestingly, the pseudoautosomal regions on the Ychromosome are also detected in the analysis of the male (XY)sample (Rouyer et al. 1986). In the XXX case, the log R ratioincreases from ∼0 to ∼+0.40, and the heterozygous state splitsinto two populations, one located at 0.67 (2:1 ratio) and theother at 0.33 (1:2 ratio) (Fig. 2C). Finally, in the XXXX case, the
Table 1. X-copy statistical parameters
XY XX XXX XXXX XY10 XX10 XXX10 XXXX10
Chromosome 10 Mean 0.020 �0.026 �0.020 �0.022 0.022 �0.020 �0.022 �0.020X chromosome Mean �0.552 �0.007 0.395 0.531 �0.546 �0.002 0.392 0.529Chromosome 10 SD 0.124 0.154 0.173 0.150 0.045 0.052 0.065 0.054X chromosome SD 0.202 0.130 0.176 0.200 0.093 0.051 0.074 0.099
A summary of both the mean log R ratio and log R ratio standard deviations for all X-copy cell lines across both the X chromosome and chromosome10.
Figure 2. X-copy cell lines as a model system. Single copy deletions, monoallelic duplications (trisomies), and amplifications are detected on theHuman-1 (109K) BeadChip using cell lines with one to four X chromosomes. All plots are shown juxtaposed to normal genome profiles fromchromosome 10. (A) In XY, the presence of a single X chromosome is shown as a decrease in the log2 R ratio from ∼0 to �0.55, and in the AF plot wherethe heterozygous state completely collapses to the homozygous axis. Note the pseudoautosomal regions on the Y chromosome. (B) In XX, the presenceof the expected two copies of the X chromosome show no deflection in the log R ratio (∼0), and the heterozygotes are clustered around +0.5. (C) InXXX, the log2 R ratio increases from ∼0 to +0.395, and the heterozygous state splits into two clusters, one located at 0.67 (2:1 ratio) and the other at0.33 (1:2 ratio). (D) In XXXX, the log2 R ratio increases to +0.53, and the heterozygous state is divided into three populations (0.25, 0.51, and 0.76)with allelic ratio of 3:1, 2:2, and 1:3, respectively. (E) The response of the log R ratio for both the X chromosome and chromosome 10 for each X-copynumber cell line. The log R ratio increases with increasing X-copy number for the X chromosome but not for chromosome 10. The correspondingstandard deviation is shown for each data point. (F) The log R ratio response calculated for the X-copy cell lines with a 10-SNP moving average. Notethat the standard deviation has been significantly reduced. For all genomic profiles, the blue line indicates a 500-kb moving median for the Human-1(109K) BeadChip. The complete X-copy cell line data set, cluster information, and receiver operator plots are available in the Supplemental material.
Peiffer et al.
1138 Genome Researchwww.genome.org
log R ratio increases to +0.53, and the heterozygous state splitsinto three populations (0.25, 0.51, and 0.76) (Fig. 2D). The reasonfor the three clusters in XXXX derives from 3:1, 2:2, and 1:3allelic ratios originating from the nondisjunction event in boththe male and female gametes leading to four independently in-herited chromosomes (Cammarata et al. 1999).
We plotted the response of the log R ratio for both the Xchromosome and an autosome of similar size, chromosome 10,for each X-copy number cell line. As expected, the log R ratioincreases with increasing X-copy number for the X chromosomebut not chromosome 10 (Fig. 2E). The corresponding standarddeviation of the log R ratio is also shown. Statistical noise can bereduced by using a moving window average across neighboringSNPs. The corresponding log R ratio response plot is shown inFigure 2F for a 10-SNP moving average.In this case, the standard deviation ofthe moving average log R ratio is signifi-cantly reduced, and the effective SNR iscorrespondingly increased (Table 2). In-terestingly, the response profile of thelog R ratio is attenuated at higher copylevels potentially because of saturationeffects in both the hybridization and im-munohistochemistry staining steps inthe assay. Receiver operator curves(ROC), which plot the true versus falsepositive rate for the detection of aberra-tions (deletions, duplications, and am-plifications), were generated for both theraw X-copy data and data generatedwith a 5- and a 10-SNP moving average(see Supplemental material).
The SNR for a single measurementpoint is much higher for the allele fre-quency (AF) measurement than the log Rratio parameter. The combination ofboth the log R ratio and AF is quite pow-erful since the precision of the allelic ra-tio measurement allows robust detectionof the aberration and the log R ratio canbe used to interpret the nature of the ab-erration. Furthermore, the statisticalconfidence of detecting an aberrationcan be greatly increased by using a mov-ing window average of neighboringSNPs. We derived a 10-SNP “rule-of-thumb” based on analysis of the ROCsfor various numbers of SNPs in a moving
median window; a window size of 10 generated the most idealROC curves (see Supplemental material). This window size of 10also encompasses, on average, three to four heterozygous SNPsper window based on an average heterozygosity of 30%–40%.Based on only the log R ratio parameter, we achieved a deletiondetection rate of 90% (true positives) with a ∼1% false-positiverate for a single SNP. When we used a 10-SNP moving median, weachieved a remarkable detection rate of 99.9% with a 1.2% false-positive rate. This 10-SNP rule implies that the 109K BeadChip(26 kb mean spacing; 13 kb median spacing) has an effectiveresolution <260 kb, and the 317K BeadChip (9 kb mean spacing)has an effective resolution of <90 kb. As such, we typically plot asmoothing function for the log R ratio profile using a movingaverage of 300 kb for the 109K array, and 100 kb for the 317Karray.
Examples of common aberrations using HL-60
After assessing the ability to detect aberrations using the X-copymodel system, we analyzed a common tumor cell line, HL-60(human promyelocytic leukemia cell line; ATCC No. HL60). HL-60 contains a modicum of several well-characterized chromo-somal deletions and amplifications (Volpi et al. 1996; Cottier etal. 2004). In addition, HL-60 was recently analyzed on the Af-fymetrix 10K array-CGH platform by the Sanger Institute as partof the Cancer Genome Project (http://www.sanger.ac.uk/cgi-bin/genetics/CGP/10kCGHviewer.cgi?dna=HL-60). Karyotype analy-sis on HL-60 has also been performed using the SKY karyotype
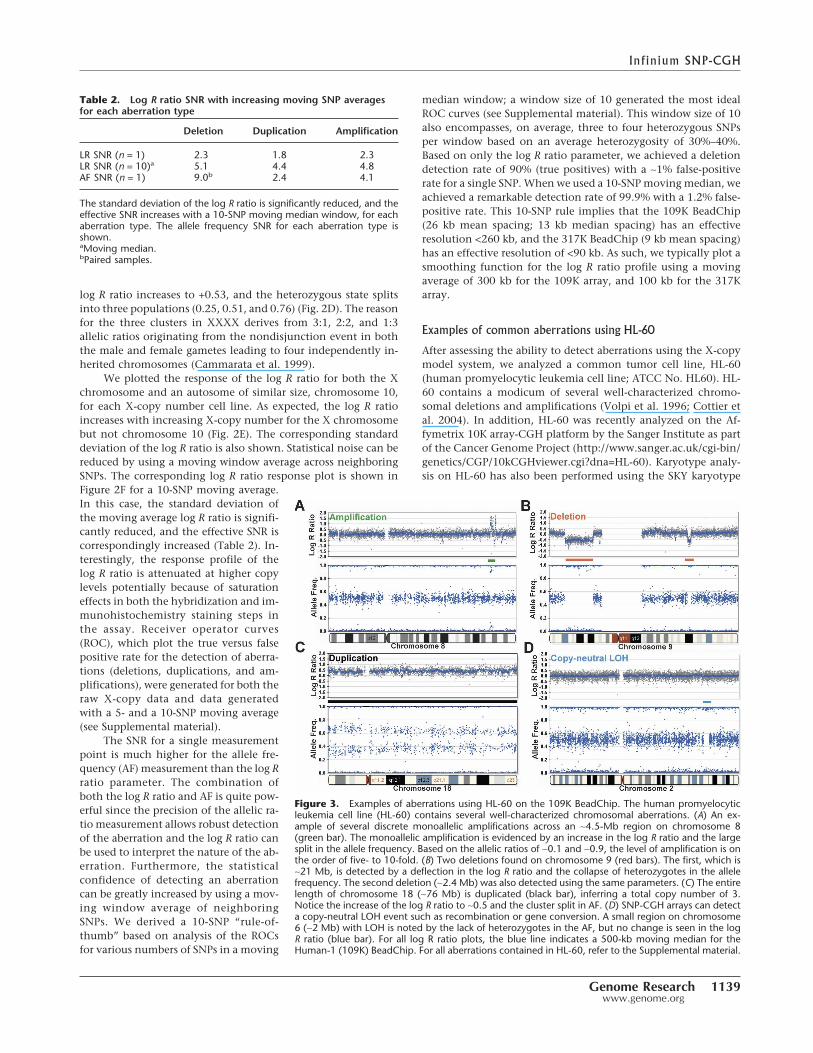
Figure 3. Examples of aberrations using HL-60 on the 109K BeadChip. The human promyelocyticleukemia cell line (HL-60) contains several well-characterized chromosomal aberrations. (A) An ex-ample of several discrete monoallelic amplifications across an ∼4.5-Mb region on chromosome 8(green bar). The monoallelic amplification is evidenced by an increase in the log R ratio and the largesplit in the allele frequency. Based on the allelic ratios of ∼0.1 and ∼0.9, the level of amplification is onthe order of five- to 10-fold. (B) Two deletions found on chromosome 9 (red bars). The first, which is∼21 Mb, is detected by a deflection in the log R ratio and the collapse of heterozygotes in the allelefrequency. The second deletion (∼2.4 Mb) was also detected using the same parameters. (C) The entirelength of chromosome 18 (∼76 Mb) is duplicated (black bar), inferring a total copy number of 3.Notice the increase of the log R ratio to ∼0.5 and the cluster split in AF. (D) SNP-CGH arrays can detecta copy-neutral LOH event such as recombination or gene conversion. A small region on chromosome6 (∼2 Mb) with LOH is noted by the lack of heterozygotes in the AF, but no change is seen in the logR ratio (blue bar). For all log R ratio plots, the blue line indicates a 500-kb moving median for theHuman-1 (109K) BeadChip. For all aberrations contained in HL-60, refer to the Supplemental material.
Table 2. Log R ratio SNR with increasing moving SNP averagesfor each aberration type
Deletion Duplication Amplification
LR SNR (n = 1) 2.3 1.8 2.3LR SNR (n = 10)a 5.1 4.4 4.8AF SNR (n = 1) 9.0b 2.4 4.1
The standard deviation of the log R ratio is significantly reduced, and theeffective SNR increases with a 10-SNP moving median window, for eachaberration type. The allele frequency SNR for each aberration type isshown.aMoving median.bPaired samples.
Infinium SNP-CGH
Genome Research 1139www.genome.org
method and is available at NCI and NCBI’s SKY/M-FISH and CGHDatabase (http://www.ncbi.nlm.nih.gov/sky/skyweb.cgi). Suchkaryotype analyses have proven successful in analyzing varioustypes of chromosomal aberrations (Liyanage et al. 1996; Macvilleet al. 1997).
Using the 109K BeadChip, we successfully detected all of theaberrations previously detected by both platforms (SKY karyo-type and array-CGH) in the HL-60 cell line. Several types of suchaberrations are shown in Figure 3. A 1.9-Mb amplification, de-noted by a green arrow in Figure 3A, was found on chromosome8. This amplification is detected by an increase in the log R ratioand a split in the heterozygous B allele frequency from a normalvalue of 0.5 (1:1 allelic ratio) to ∼0.1 and ∼0.9 (roughly 1:9, 9:1allelic ratios), indicating allelic amplification in this region. Ex-amples of two hemizygous deletions were found on chromosome9, and they are shown in Figure 3B (denoted with red arrows).The two deletions, 21 Mb and 2.4 Mb in size, were visually de-tected by observing a negative deflection in the log R ratio plotand the lack of heterozygotes in the allele frequency plot cor-roborating the reduction in copy number. The smallest aberra-tion observed in the HL-60 cell line was an ∼25-kb homozygousdeletion on chromosome 17 in the ATP1B2 gene (Supplementalmaterial). The HL-60 cell line also presents an example of amonoallelic duplication as illustrated by the trisomy present onthe majority of chromosome 18 (∼76 Mb). This duplication ischaracterized by an upward deflection in the log R ratio plot anda split in the heterozygous allele frequencies corresponding to a2:1 and 1:2 allelic ratio (Fig. 3C) similar to the results with theXXX cell line. Finally, an illustration of detecting a copy-neutralLOH event is depicted in the genomic profile from the Coriell cellline NA09208 (Fig. 3D, blue arrow). We find a small region onchromosome 2 (∼2 Mb) containing LOH as noted by the lack ofheterozygotes in the AF without an observed change in the log Rratio. This analysis demonstrates the power of SNP-CGH to dif-ferentiate between LOH events with a reduction in copy numberfrom copy-neutral events; this should prove particularly valuablein evaluating genome-wide aberrations in tumor samples.
Detection of constitutional chromosomal aberrations
As illustrated by the previous examples, high-density SNP-CGHBeadChips should have the power to easily detect most commonconstitutional chromosomal aberrations. This has particular im-portance in the field of neo and postnatal analysis of chromo-somal aberrations. Currently, most clinical tests of aberrationsuse a combination of karyotyping and fluorescence in situ hy-bridization (FISH). These karyotypes are useful for outlining theoverall chromosomal structures and detecting aberrations in-cluding translocations and inversions. However, karyotypingresolution is limited to 10–20 Mb. As such, follow-up studies onpatients usually employ FISH probes for detection of small dele-tions and duplications. Clinics currently use panels of FISHprobes for ∼25 microdeletion syndromes including DiGeorge,Prader-Willi (Angleman), Williams-Beuren, and Wolf-Hirschhorn syndromes (Scambler et al. 1991; Driscoll et al. 1992;Clayton-Smith et al. 1993; Wright et al. 1997; Francke 1999). Incontrast, genomic profiling with SNP-CGH arrays enables discov-ery of aberrations throughout the genome and allows for a pre-cise localization of chromosomal breakpoints of those aberra-tions.
To demonstrate the feasibility of using high-density Bead-Chips for detection of congenital chromosomal aberrations in
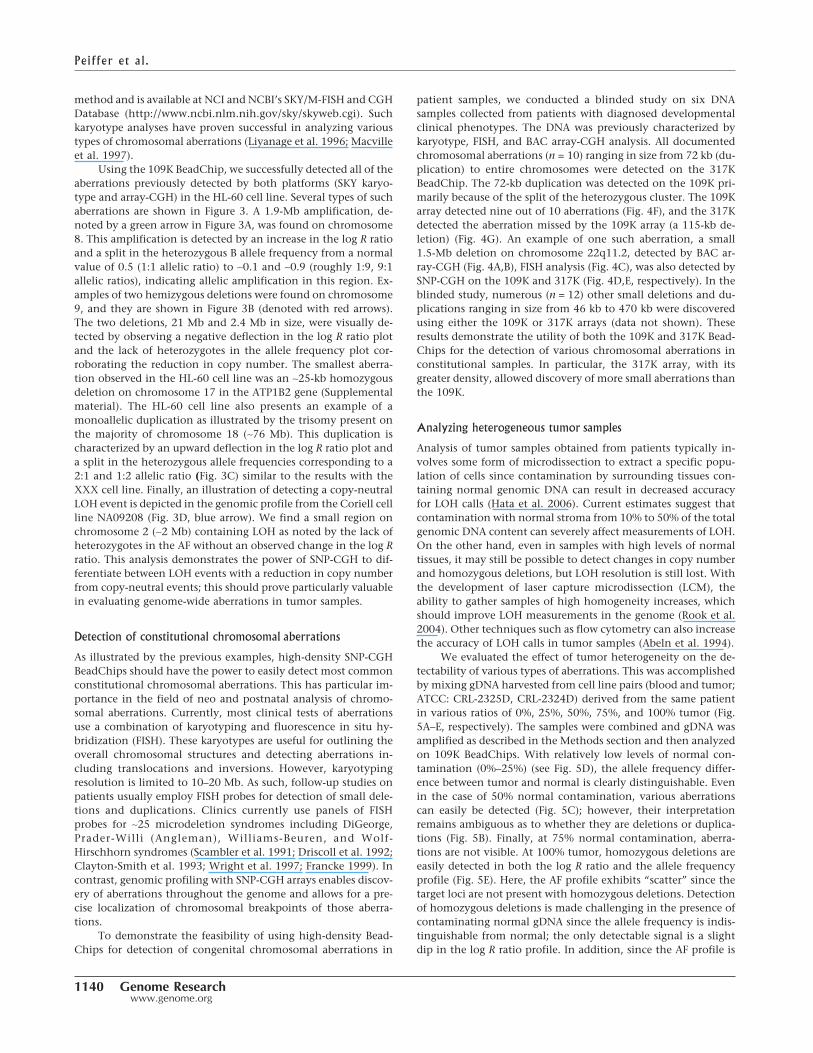
patient samples, we conducted a blinded study on six DNAsamples collected from patients with diagnosed developmentalclinical phenotypes. The DNA was previously characterized bykaryotype, FISH, and BAC array-CGH analysis. All documentedchromosomal aberrations (n = 10) ranging in size from 72 kb (du-plication) to entire chromosomes were detected on the 317KBeadChip. The 72-kb duplication was detected on the 109K pri-marily because of the split of the heterozygous cluster. The 109Karray detected nine out of 10 aberrations (Fig. 4F), and the 317Kdetected the aberration missed by the 109K array (a 115-kb de-letion) (Fig. 4G). An example of one such aberration, a small1.5-Mb deletion on chromosome 22q11.2, detected by BAC ar-ray-CGH (Fig. 4A,B), FISH analysis (Fig. 4C), was also detected bySNP-CGH on the 109K and 317K (Fig. 4D,E, respectively). In theblinded study, numerous (n = 12) other small deletions and du-plications ranging in size from 46 kb to 470 kb were discoveredusing either the 109K or 317K arrays (data not shown). Theseresults demonstrate the utility of both the 109K and 317K Bead-Chips for the detection of various chromosomal aberrations inconstitutional samples. In particular, the 317K array, with itsgreater density, allowed discovery of more small aberrations thanthe 109K.
Analyzing heterogeneous tumor samples
Analysis of tumor samples obtained from patients typically in-volves some form of microdissection to extract a specific popu-lation of cells since contamination by surrounding tissues con-taining normal genomic DNA can result in decreased accuracyfor LOH calls (Hata et al. 2006). Current estimates suggest thatcontamination with normal stroma from 10% to 50% of the totalgenomic DNA content can severely affect measurements of LOH.On the other hand, even in samples with high levels of normaltissues, it may still be possible to detect changes in copy numberand homozygous deletions, but LOH resolution is still lost. Withthe development of laser capture microdissection (LCM), theability to gather samples of high homogeneity increases, whichshould improve LOH measurements in the genome (Rook et al.2004). Other techniques such as flow cytometry can also increasethe accuracy of LOH calls in tumor samples (Abeln et al. 1994).
We evaluated the effect of tumor heterogeneity on the de-tectability of various types of aberrations. This was accomplishedby mixing gDNA harvested from cell line pairs (blood and tumor;ATCC: CRL-2325D, CRL-2324D) derived from the same patientin various ratios of 0%, 25%, 50%, 75%, and 100% tumor (Fig.5A–E, respectively). The samples were combined and gDNA wasamplified as described in the Methods section and then analyzedon 109K BeadChips. With relatively low levels of normal con-tamination (0%–25%) (see Fig. 5D), the allele frequency differ-ence between tumor and normal is clearly distinguishable. Evenin the case of 50% normal contamination, various aberrationscan easily be detected (Fig. 5C); however, their interpretationremains ambiguous as to whether they are deletions or duplica-tions (Fig. 5B). Finally, at 75% normal contamination, aberra-tions are not visible. At 100% tumor, homozygous deletions areeasily detected in both the log R ratio and the allele frequencyprofile (Fig. 5E). Here, the AF profile exhibits “scatter” since thetarget loci are not present with homozygous deletions. Detectionof homozygous deletions is made challenging in the presence ofcontaminating normal gDNA since the allele frequency is indis-tinguishable from normal; the only detectable signal is a slightdip in the log R ratio profile. In addition, since the AF profile is
Peiffer et al.
1140 Genome Researchwww.genome.org
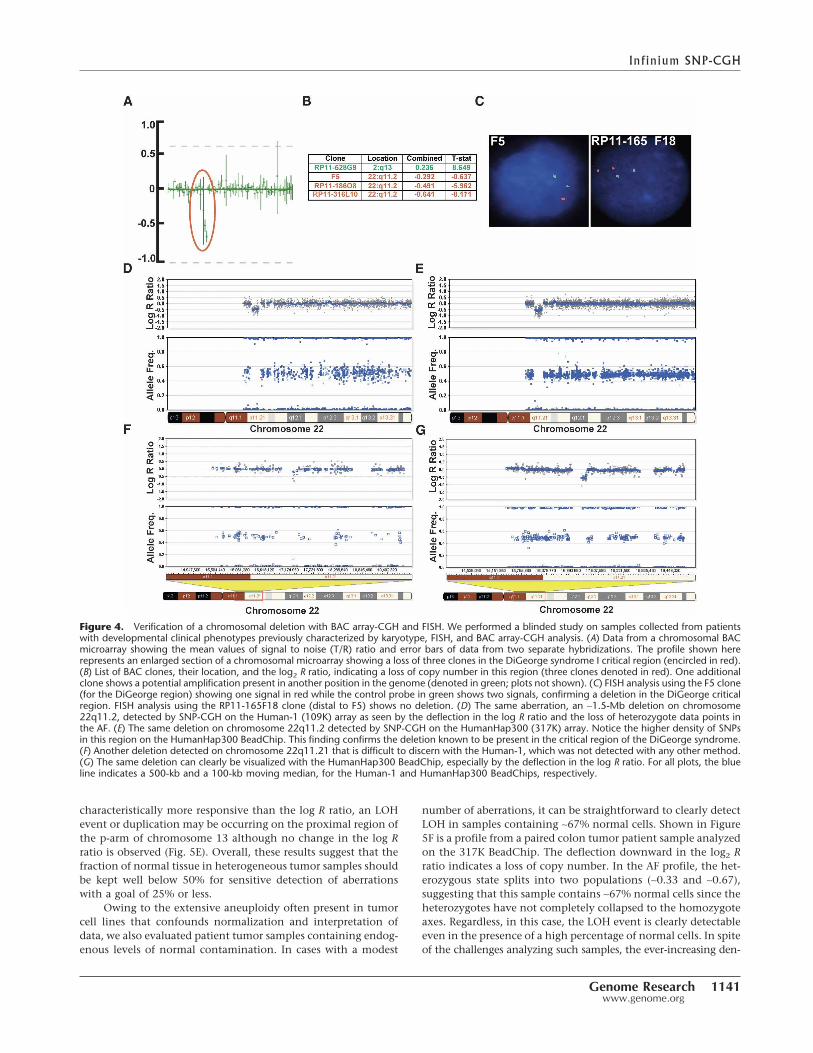
characteristically more responsive than the log R ratio, an LOHevent or duplication may be occurring on the proximal region ofthe p-arm of chromosome 13 although no change in the log Rratio is observed (Fig. 5E). Overall, these results suggest that thefraction of normal tissue in heterogeneous tumor samples shouldbe kept well below 50% for sensitive detection of aberrationswith a goal of 25% or less.
Owing to the extensive aneuploidy often present in tumorcell lines that confounds normalization and interpretation ofdata, we also evaluated patient tumor samples containing endog-enous levels of normal contamination. In cases with a modest
number of aberrations, it can be straightforward to clearly detectLOH in samples containing ∼67% normal cells. Shown in Figure5F is a profile from a paired colon tumor patient sample analyzedon the 317K BeadChip. The deflection downward in the log2 Rratio indicates a loss of copy number. In the AF profile, the het-erozygous state splits into two populations (∼0.33 and ∼0.67),suggesting that this sample contains ∼67% normal cells since theheterozygotes have not completely collapsed to the homozygoteaxes. Regardless, in this case, the LOH event is clearly detectableeven in the presence of a high percentage of normal cells. In spiteof the challenges analyzing such samples, the ever-increasing den-
Figure 4. Verification of a chromosomal deletion with BAC array-CGH and FISH. We performed a blinded study on samples collected from patientswith developmental clinical phenotypes previously characterized by karyotype, FISH, and BAC array-CGH analysis. (A) Data from a chromosomal BACmicroarray showing the mean values of signal to noise (T/R) ratio and error bars of data from two separate hybridizations. The profile shown hererepresents an enlarged section of a chromosomal microarray showing a loss of three clones in the DiGeorge syndrome I critical region (encircled in red).(B) List of BAC clones, their location, and the log2 R ratio, indicating a loss of copy number in this region (three clones denoted in red). One additionalclone shows a potential amplification present in another position in the genome (denoted in green; plots not shown). (C) FISH analysis using the F5 clone(for the DiGeorge region) showing one signal in red while the control probe in green shows two signals, confirming a deletion in the DiGeorge criticalregion. FISH analysis using the RP11-165F18 clone (distal to F5) shows no deletion. (D) The same aberration, an ∼1.5-Mb deletion on chromosome22q11.2, detected by SNP-CGH on the Human-1 (109K) array as seen by the deflection in the log R ratio and the loss of heterozygote data points inthe AF. (E) The same deletion on chromosome 22q11.2 detected by SNP-CGH on the HumanHap300 (317K) array. Notice the higher density of SNPsin this region on the HumanHap300 BeadChip. This finding confirms the deletion known to be present in the critical region of the DiGeorge syndrome.(F) Another deletion detected on chromosome 22q11.21 that is difficult to discern with the Human-1, which was not detected with any other method.(G) The same deletion can clearly be visualized with the HumanHap300 BeadChip, especially by the deflection in the log R ratio. For all plots, the blueline indicates a 500-kb and a 100-kb moving median, for the Human-1 and HumanHap300 BeadChips, respectively.
Infinium SNP-CGH
Genome Research 1141www.genome.org
sity of array technology, such as the HumanHap550 BeadChip,should further improve the sensitivity with heterogeneoussamples, especially since one can average over greater numbers ofprobes.
Effect of varying DNA input amount and fragmentation onSNP-CGH data
The requirement to obtain relatively pure tumor samples mayplace limits on the amount and quality of starting gDNA avail-able for the assay. As such, we evaluated the effect of decreasedgDNA input amounts and the effect of fragmented DNA on thequality of the data from the SNP-CGH assay. For these experi-ments, we used a multisample BeadChip format allowing analy-sis of ∼10,000 SNP assays across 12 samples (subset of 109K prod-uct). We titrated gDNA from the standard 1� input (750 ngequivalent) down to 1/64th input (∼12 ng), and a “zero DNA”
control was included (data not shown). The effect of degradedDNA was evaluated by artificially digesting DNA with a titrationof DNase I (Fig. 6A, Fragments 1, 2, and 3) for a fixed input level1� (750 ng equivalent). Interestingly, we find that the overallcall rate is relatively insensitive to quantity and fragmentationlength across the entire range of DNA inputs (Fig. 6B). The callrates for all levels of input DNA were above 0.996 even at thelowest input amount. Additionally, the total variation (standarddeviation, SD) in the allelic ratios was minimally affected by in-put amount; however, the variation in the log R ratio increaseddramatically with a decrease in input amount from 200 ng (0.24)to 12 ng (0.47) (Fig. 6C,E,F). The log R ratio and AF genomicprofiles are shown for chromosome 1 at input levels of 1� and(1/64)�, respectively (Fig. 6E,F). Similarly to reduced inputamounts, fragmented DNA also exhibited an increase in thevariation of the log R ratio from 0.19 (Fragment 1) to 0.37 (Frag-ment 3) (Fig. 6C). It is not known, however, how these fragmen-
Figure 5. Analyzing heterogeneous tumor samples. DNA from a tumor cell line was mixed with matched normal DNA at ratios of 0%, 25%, 50%,75%, and 100% and analyzed on the Human-1 (109K) BeadChip. The genome profile of chromosome 13 is shown as an example. (A) No aberrationsare seen in the sample containing 100% normal gDNA. (B) No discernable differences in the log R ratio are seen in a sample composed of 75% normaland 25% tumor. It is also difficult to determine if there are any changes in the allelic frequency. (C) At 50% normal and 50% tumor DNA, deflectionsin the log R ratio appear. Changes in the AF are also seen, although it is difficult to establish the nature of each aberration. At these levels, an allelicduplication event and allelic LOH bear resemblance to each other. (D) At 25% normal and 75% tumor gDNA, the nature of each type of aberrationbecomes more apparent. For example, the large decrease in the log R ratio in the center of the plot denotes a potential region with a deletion, whichwas not easily discernable in C. (E) The genoplot from a pure (100%) tumor sample. A homozygous deletion can be seen in the center of the plot,visualized by a decrease in the log R ratio. (F) A region exhibiting LOH is observed on chromosome 3 in a paired colon tumor patient sample analyzedon the HumanHap300 BeadChip. A decrease in the log R ratio indicates a loss of copy number. The AF is divided into two populations (∼0.33 and ∼0.67),suggesting that this sample contains ∼67% normal cells. The blue line shown for all log R ratio profiles indicates a 250-kb and a 100-kb moving medianfor the Human-1 and HumanHap300 BeadChips, respectively.
Peiffer et al.
1142 Genome Researchwww.genome.org
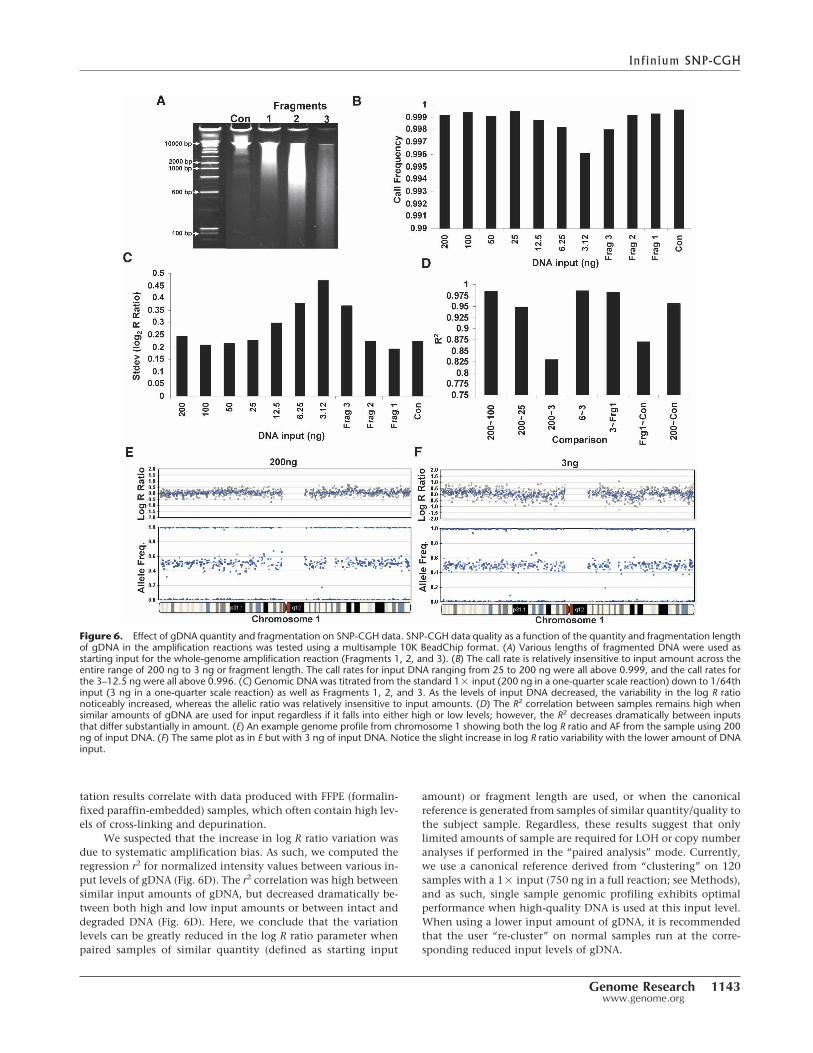
tation results correlate with data produced with FFPE (formalin-fixed paraffin-embedded) samples, which often contain high lev-els of cross-linking and depurination.
We suspected that the increase in log R ratio variation wasdue to systematic amplification bias. As such, we computed theregression r2 for normalized intensity values between various in-put levels of gDNA (Fig. 6D). The r2 correlation was high betweensimilar input amounts of gDNA, but decreased dramatically be-tween both high and low input amounts or between intact anddegraded DNA (Fig. 6D). Here, we conclude that the variationlevels can be greatly reduced in the log R ratio parameter whenpaired samples of similar quantity (defined as starting input
amount) or fragment length are used, or when the canonicalreference is generated from samples of similar quantity/quality tothe subject sample. Regardless, these results suggest that onlylimited amounts of sample are required for LOH or copy numberanalyses if performed in the “paired analysis” mode. Currently,we use a canonical reference derived from “clustering” on 120samples with a 1� input (750 ng in a full reaction; see Methods),and as such, single sample genomic profiling exhibits optimalperformance when high-quality DNA is used at this input level.When using a lower input amount of gDNA, it is recommendedthat the user “re-cluster” on normal samples run at the corre-sponding reduced input levels of gDNA.
Figure 6. Effect of gDNA quantity and fragmentation on SNP-CGH data. SNP-CGH data quality as a function of the quantity and fragmentation lengthof gDNA in the amplification reactions was tested using a multisample 10K BeadChip format. (A) Various lengths of fragmented DNA were used asstarting input for the whole-genome amplification reaction (Fragments 1, 2, and 3). (B) The call rate is relatively insensitive to input amount across theentire range of 200 ng to 3 ng or fragment length. The call rates for input DNA ranging from 25 to 200 ng were all above 0.999, and the call rates forthe 3–12.5 ng were all above 0.996. (C) Genomic DNA was titrated from the standard 1� input (200 ng in a one-quarter scale reaction) down to 1/64thinput (3 ng in a one-quarter scale reaction) as well as Fragments 1, 2, and 3. As the levels of input DNA decreased, the variability in the log R rationoticeably increased, whereas the allelic ratio was relatively insensitive to input amounts. (D) The R2 correlation between samples remains high whensimilar amounts of gDNA are used for input regardless if it falls into either high or low levels; however, the R2 decreases dramatically between inputsthat differ substantially in amount. (E) An example genome profile from chromosome 1 showing both the log R ratio and AF from the sample using 200ng of input DNA. (F) The same plot as in E but with 3 ng of input DNA. Notice the slight increase in log R ratio variability with the lower amount of DNAinput.
Infinium SNP-CGH
Genome Research 1143www.genome.org
Single versus paired sample analysis
The analysis of paired gDNA samples (tumor tissue and adjacentnormal tissue or blood) is a common experimental design incancer research that allows detection of LOH using a limitednumber of polymorphic markers (Zauber et al. 1999). The powerto detect LOH is greatly increased with paired sample analysissince LOH can be confidently asserted for even a single SNP dif-fering in state between the pairs. Without normal or parentalgenotype information, however, one can only rely on statisticalprobabilities of obtaining runs of homozygosity. In general, a runof 10–20 contiguous homozygous SNPs is required to statisticallyassert LOH (assuming an average heterozygosity of 30%–40%and that SNPs are independent of one another) (Huang et al.2004), and even then it might be explained by chance haplotypesharing (Altshuler et al. 2005).
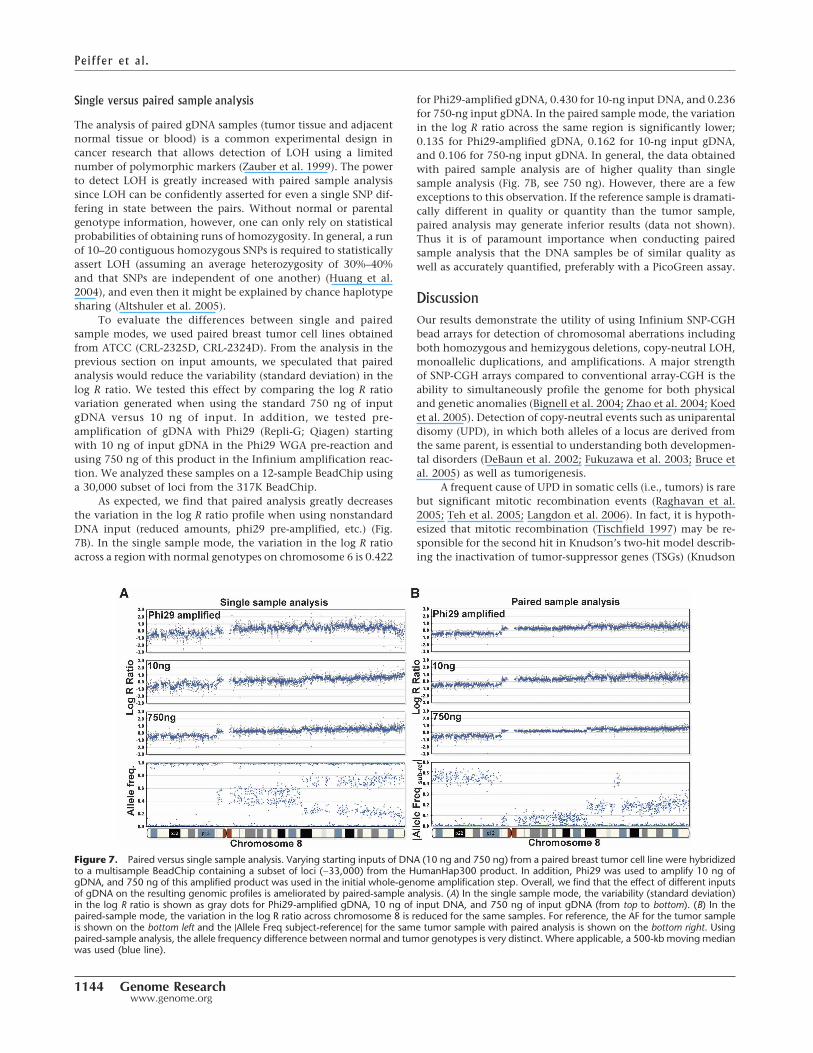
To evaluate the differences between single and pairedsample modes, we used paired breast tumor cell lines obtainedfrom ATCC (CRL-2325D, CRL-2324D). From the analysis in theprevious section on input amounts, we speculated that pairedanalysis would reduce the variability (standard deviation) in thelog R ratio. We tested this effect by comparing the log R ratiovariation generated when using the standard 750 ng of inputgDNA versus 10 ng of input. In addition, we tested pre-amplification of gDNA with Phi29 (Repli-G; Qiagen) startingwith 10 ng of input gDNA in the Phi29 WGA pre-reaction andusing 750 ng of this product in the Infinium amplification reac-tion. We analyzed these samples on a 12-sample BeadChip usinga 30,000 subset of loci from the 317K BeadChip.
As expected, we find that paired analysis greatly decreasesthe variation in the log R ratio profile when using nonstandardDNA input (reduced amounts, phi29 pre-amplified, etc.) (Fig.7B). In the single sample mode, the variation in the log R ratioacross a region with normal genotypes on chromosome 6 is 0.422
for Phi29-amplified gDNA, 0.430 for 10-ng input DNA, and 0.236for 750-ng input gDNA. In the paired sample mode, the variationin the log R ratio across the same region is significantly lower;0.135 for Phi29-amplified gDNA, 0.162 for 10-ng input gDNA,and 0.106 for 750-ng input gDNA. In general, the data obtainedwith paired sample analysis are of higher quality than singlesample analysis (Fig. 7B, see 750 ng). However, there are a fewexceptions to this observation. If the reference sample is dramati-cally different in quality or quantity than the tumor sample,paired analysis may generate inferior results (data not shown).Thus it is of paramount importance when conducting pairedsample analysis that the DNA samples be of similar quality aswell as accurately quantified, preferably with a PicoGreen assay.
DiscussionOur results demonstrate the utility of using Infinium SNP-CGHbead arrays for detection of chromosomal aberrations includingboth homozygous and hemizygous deletions, copy-neutral LOH,monoallelic duplications, and amplifications. A major strengthof SNP-CGH arrays compared to conventional array-CGH is theability to simultaneously profile the genome for both physicaland genetic anomalies (Bignell et al. 2004; Zhao et al. 2004; Koedet al. 2005). Detection of copy-neutral events such as uniparentaldisomy (UPD), in which both alleles of a locus are derived fromthe same parent, is essential to understanding both developmen-tal disorders (DeBaun et al. 2002; Fukuzawa et al. 2003; Bruce etal. 2005) as well as tumorigenesis.
A frequent cause of UPD in somatic cells (i.e., tumors) is rarebut significant mitotic recombination events (Raghavan et al.2005; Teh et al. 2005; Langdon et al. 2006). In fact, it is hypoth-esized that mitotic recombination (Tischfield 1997) may be re-sponsible for the second hit in Knudson’s two-hit model describ-ing the inactivation of tumor-suppressor genes (TSGs) (Knudson
Figure 7. Paired versus single sample analysis. Varying starting inputs of DNA (10 ng and 750 ng) from a paired breast tumor cell line were hybridizedto a multisample BeadChip containing a subset of loci (∼33,000) from the HumanHap300 product. In addition, Phi29 was used to amplify 10 ng ofgDNA, and 750 ng of this amplified product was used in the initial whole-genome amplification step. Overall, we find that the effect of different inputsof gDNA on the resulting genomic profiles is ameliorated by paired-sample analysis. (A) In the single sample mode, the variability (standard deviation)in the log R ratio is shown as gray dots for Phi29-amplified gDNA, 10 ng of input DNA, and 750 ng of input gDNA (from top to bottom). (B) In thepaired-sample mode, the variation in the log R ratio across chromosome 8 is reduced for the same samples. For reference, the AF for the tumor sampleis shown on the bottom left and the |Allele Freq subject-reference| for the same tumor sample with paired analysis is shown on the bottom right. Usingpaired-sample analysis, the allele frequency difference between normal and tumor genotypes is very distinct. Where applicable, a 500-kb moving medianwas used (blue line).
Peiffer et al.
1144 Genome Researchwww.genome.org
Jr. 1975, 2001). An example of this type of TSG inactivation hasbeen documented in leukemia, in which a first-hit mutation ismade homozygous through mitotic recombination (Fitzgibbonet al. 2005). As such, the widespread application of SNP-CGHarrays should facilitate the unearthing of novel tumor-suppressorgenes. In addition to UPD, genetic information collected by SNP-CGH is valuable for assessing the allelic origin of deletions, du-plications, and amplifications (LaFramboise et al. 2005).
We used an X chromosome titration model system to assessthe signal to variability ratio of our Infinium SNP-CGH platformfor various types of chromosomal aberrations. Averaging datafrom neighboring SNPs along the genome greatly increases theeffective SNR. The average variation in the log2 intensity ratio forthe Infinium SNP-CGH platform is relatively low (∼0.13 to ∼0.20)as compared to other BAC or oligonucleotide array-CGH plat-forms, which exhibit variation levels of ∼0.16 (BAC arrays) and∼0.26 and ∼0.66 for two different oligonucleotide array formats(Ylstra et al. 2006). We find, overall, that the allele frequencyparameter is much more precise (standard deviation of ∼0.04)and is less affected by DNA quantity and quality than the log2
intensity ratio. However, we found that the variability in the logR ratio parameter can be greatly reduced by analyzing eitherpaired samples or analyzing a single sample with appropriateGenTrain clusters derived from DNA samples of similar quantity(starting input amount) and fragment length. As such, for opti-mal performance with low input amounts such as 10 ng (vs. thestandard 750 ng), the matching sample or the samples used tocreate GenTrain clusters should also be at this input level. Giventhe limited input requirement, this approach should be of use foranalyzing samples generated from laser capture microdissection(LCM), permitting analysis of relatively homogeneous tumorsamples (Curran et al. 2000).
Practical validation of the SNP-CGH platform was accom-plished by a blinded study of six congenital samples containingvarious constitutional aberrations. We identified all previouslydocumented chromosomal aberrations, as assessed by karyotype,FISH, and BAC array-CGH analysis. The detected aberrationsranged in size from a duplication of 72 kb to an entire duplicatedchromosome. These results reveal the utility of using high-density SNP-CGH to screen for various chromosomal aberrationsin constitutional samples. For future clinical applications, onecan envision a custom SNP-CGH array containing perhaps from20,000 to 50,000 elements designed to known regions of consti-tutional aberrations.
We find that the use of SNP-CGH for constitutional analysisof congenital samples is relatively straightforward. However, theheterogeneity typically found in tumor samples can make analy-sis and interpretation of results more challenging. Nonetheless,we have demonstrated sufficient sensitivity in mixed tumor–normal samples to detect single copy changes in tumor samplescontaminated by as much as 50% normal background and LOHevents in paired samples with ∼67% normal background. Robustidentification of both various aberrations and copy numberchanges, in addition to the precise localization of breakpoints intumor samples, will likely require refined statistical analysis al-gorithms (Lai et al. 2005; Nannya et al. 2005). Furthermore, iden-tification of the exact aberration type may need to be followed upwith supplemental approaches such as FISH or real-time PCR(Brinkschmidt et al. 1997; Shearer et al. 1999).
In conclusion, we have shown that SNP-CGH arrays offerseveral distinct advantages over conventional array-CGH. SNP-CGH arrays profile the genome for both physical and genetic
anomalies allowing detection of copy-neutral genetic events. Ad-ditionally, these arrays provide allelic information on deletions,duplications, and amplifications, which is important since manyhigh-level amplification events are monoallelic. Finally, a signifi-cant advantage of SNP-CGH bead arrays is their ease of manu-facture and intrinsic scalability. Just recently, the density of SNP-CGH beads has been extended to >550,000 SNPs (Illumina Hu-manHap550), and future innovations may drive this densityeven higher. Given these advantages, SNP-CGH may replace ar-ray-CGH as a standard for measuring genome-wide chromosomalaberrations.
Methods
High-density SNP genotyping arrays for SNP-CGHIllumina currently manufactures multiple formats of high-density SNP genotyping arrays (BeadChips); from 109K to 650KSNPs. A brief description of their content is provided in this sec-tion. All experimental processes for SNP-CGH described werecompleted with Infinium I and Infinium II WGG reagents fromIllumina.
Sentrix Genotyping BeadChipsThe genotyping data contained in this paper were collected ei-ther on the Sentrix Human-1 (109,000 exon-centric SNPs) orHumanHap300 (317,000 tag SNPs) Genotyping BeadChips fromIllumina. The principles described within apply to the 550K array(HumanHap550). The Human-1 BeadChip employs the InfiniumWGG assay to interrogate >109,000 single nucleotide polymor-phism (SNP) loci on a single BeadChip. The Infinium assay gen-erates high genotyping quality as assessed by call rates and accu-racy on 120 DNA samples. The overall call rate was 99.94% andthe concordance with HapMap data was 99.6%. The SNP assayswere chosen from a combination of exon-centric, highly con-served, and putative functional SNPs. These include SNPs locateddirectly within coding, promoter, and highly conserved, non-coding regions. It is probable that a large fraction of disease-related variants, including nonsynonymous, splice site, and regu-latory variants, will lie in conserved and exon-rich regions. Morethan 85% of all SNPs on this BeadChip are within 10 kb of anexon or within evolutionarily conserved sequences. In addition,“gene deserts” were filled in with at least 5 SNPs per 200 kbdensity. The genome-wide average spacing between SNPs is 26kb, and the median spacing is 13 kb (higher density in gene-richregions).
The 10K linkage multisample BeadChip contains uniformlyspaced SNPs that are a subset of the SNPs from the 109K Bead-Chip, and the average spacing between each SNP probe is ∼300kb, which should allow for the detection of typical amplificationsand deletions of several megabases. The 317K BeadChip (Human-Hap300) consists of >300,000 tagSNP assays derived from theHapMap project with a 9-kb mean spacing between SNPs, en-abling an effective resolution of 90 kb.
DNA samplesThe three canonical genotype clusters for both the Human-1 andthe HumanHap 300 BeadChips were created from ∼120 individu-als representing a subset of the HapMap samples (which maycontain structural polymorphisms) collected from the Yorubapopulation (YRI), the CEPH project in Utah (CEU; Northern andWestern European ancestry), the Han Chinese population of Bei-jing (CHB), and the Japanese population (JPT) (http://
Infinium SNP-CGH
Genome Research 1145www.genome.org
www.illumina.com/general/support/downloads/SuplMat_GenRes_Peiffer.zip).
DNA from cell lines X (NA19160, male), 2X (NA12236, fe-male), NA04626 (3X), and NA01416 (4X) were obtained fromCoriell. The paired breast tumor cell lines (CRL-2325D and CRL-2324D) were obtained from American Type Culture Collection(ATCC). The acute promyelocytic leukemia cell line (HL-60) wasalso obtained from ATCC (ATCC No. HL60). The paired colontumor genomic DNA was obtained from BioChain (A704198).For the DNA fragmentation experiments, cell line NA60136 wasobtained from Coriell as was the cell line exhibiting the copy-neutral LOH event (NA09208). Genomic DNA from patientsamples was isolated from peripheral blood lymphocytes, cul-tured amniocytes, or fibroblasts by using a PureGene DNA-purification kit according to the manufacturer’s protocol (GentraSystems).
Sample amplification and hybridization for BeadChipsThe whole-genome amplification process requires 250–750 ng ofinput gDNA and creates a sufficient quantity of DNA (1000�
amplification) to be used on a single BeadChip in the Infiniumassay (Illumina MP1 and AMM). After amplification, the productis fragmented using a proprietary reagent (FRG), precipitatedwith 2-propanol (plus precipitating reagent; PA1), and resus-pended in formamide-containing hybridization buffer (RA1).The DNA samples are denatured at 95°C for 20 min, loaded intothe Tecan Flow Through Chambers (Tecan Part No. 760,810),and placed in a humidified container for a minimum of 16 h at48°C allowing SNP loci to hybridize to the 50mer capture probes(Steemers and Gunderson 2005).
For the DNA fragmentation experiments, Coriell NA60136was digested with 0.0125 U, 0.025 U, and 0.05 U of DNase I(Invitrogen), respectively. Briefly, 2 µg of gDNA was digestedwith DNase I in a 20-µL reaction, using 1-Phor-All Plus buffer and0.5 mM CaCl2. The reactions were incubated at 37°C for 15 min,inactivated by 1 µL of 0.5 M EDTA, purified with MultiScreenPCR Plate (Millipore), resuspended in 40 µL of TE, and visualizedon a 6% TBE/urea gel with SYBR Gold Staining (Invitrogen). ForPhi29 amplifications, 10 µg of genomic DNA was amplified withthe Repli-G kit from Qiagen (#59045) according to the manufac-turer’s protocol.
Infinium I (ASPE) and Infinium II (SBE) on BeadChipsFollowing hybridization, the BeadChip/Te-Flow chamber assem-bly was placed on the temperature-controlled TecanFlowthrough Rack, and all subsequent washing, extension, andstaining were performed by addition of reagents to the Te-Flowchamber.
For the allele-specific primer extension (ASPE; Infinium I)assay, the BeadChip was first washed (Illumina RA1 and PB1) toremove unhybridized and nonspecifically hybridized DNA. Nextthe BeadChip was blocked for 10 min prior to addition of theextension mix (XB1). The extension step extends correctlymatched probes hybridized to DNA on the BeadChip and incor-porates biotin-labeled nucleotides (EMM). After extension, a for-mamide wash removed the hybridized DNA to reduce extraneoussignal. The array then underwent a multilayer staining process tosignal amplify and detect the incorporated label (LMM, ASM, andXB3). Finally, the BeadChips were washed (PB1) and dried beforesubsequent imaging.
For the single-base extension (SBE) (Infinium II) assay, prim-ers were extended with a polymerase and labeled nucleotide mix(TEM), and stained with repeated application of LTM (stainingreagent) and ASM (anti-staining reagent). After staining was com-
plete, the slides were washed with low salt wash buffer (PB1),immediately coated with XC4, and then imaged on the IlluminaBeadArray Reader.
Imaging the BeadChip and data analysisThe Illumina BeadArray Reader is a two-color (543 nm/643 nm)confocal fluorescent scanner with 0.84-µm pixel resolution. Thescanner excites the fluorophors generated during signal amplifi-cation/staining of the allele-specific (one color) or single-base(two colors) extension products on the BeadChips. The imageintensities are extracted using Illumina’s BeadScan software.
The data for each BeadChip is self-normalized using infor-mation contained within the array. This normalization algo-rithm removes outliers, adjusts for channel-dependent back-ground and global intensity differences, and also scales the data.The X and Y color channels undergo an affine coordinate trans-formation to make the data appear as canonical as possible withthe homozygotes lying along the transformed x- and y-axes. Thefollowing five steps are applied: (1) outlier removal; (2) a trans-lation correction in which the asymptotes are fitted to candidateAA and BB homozygotes; the intersection of these fit lines de-fines the translated origin; (3) rotational correction: the angle ofthe AA homozygote asymptote with respect to the translatedX-axis is used to define the rotational correction; (4) shear cor-rection: the angle of the BB homozygote asymptote with respectto the translated and rotated y-axis is used to define the shearcorrection; (5) scaling correction: statistical centroids are com-puted for the candidate AA homozygotes to define an x-axis scal-ing parameter, and for candidate BB homozygotes to define ay-axis scaling parameter. The translated, rotated, shear-correcteddata are normalized to a scale of ∼1 using the scaling parameters.
After normalization, the genotyping data are transformed toa polar coordinate plot of normalized intensity R = Xnorm + Ynorm
and allelic intensity ratio � = (2/�) * arctan(Ynorm/Xnorm), whereXnorm and Ynorm represent transformed normalized signals fromalleles A and B for a particular locus. The log R ratio of signalintensities is shown as log2(Rsubject/Rexpected) and is the base 2logarithm of the ratio of observed intensity versus expected in-tensity (see Results section). Genomic profiles were created usingthe Illumina Genome Viewer (IGV) and Chromosome Browser(ICV) of Illumina’s BeadStudio2.0 software, which plots SNPgenotyping data to view, identify, and annotate chromosomalaberrations.
The SNR for both the log R ratio and allele frequency (AF)were calculated with the following equations (where µX_XY rep-resents the mean log R ratio intensity or mean heterozygous(nonhomozygous) AF for the X chromosome of the XY sample.The other parameters are similarly defined.
SNRDeletion =|�X_XY − �10_XY|
��X_XY2 + �10_XY
2
SNRDuplication =|�X_3X − �10_3X|
��X_3X2 + �10_3X
2
SNRAmplification =|�X_4X − �10_4X|
��X_4XX2 + �10_4X
2
BAC array-CGHThe targeted chromosomal BAC microarrays contain 860 FISH-verified BAC clones that covered >70 known genetic disorders, 41subtelomeric regions, and 43 pericentromeric regions.
Patient genomic DNA was isolated as described above. Con-trol DNA was from a healthy individual male and female usingthe same DNA extraction method. For CGH BAC-arrays, genomic
Peiffer et al.
1146 Genome Researchwww.genome.org
DNA was fragmented to a smear between 600 and 2000 bp bysonication with a microcup horn (Sonics & Materials) and thenpurified (Zymo Research).
The fragmented 500 ng of genomic DNA from patient andcontrol was differentially labeled with cy3 and cy5 (Perkin Elmer)using Bioprime labeling (Invitrogen). To avoid dye bias, we per-formed dye swap experiments on each sample. Sixty microgramsof human cot-1 were added to each sample to block repetitivesequences (Invitrogen). The labeled DNA probe was dissolved in30 µL of ULTRAhyb buffer (Ambion) and hybridized to the arraysin a sealed moisture hybridization chamber at 37°C in a rockingincubator for 22 h. After hybridization, washes were performed(2� SSC brief rinse, 50% formamide/2� SSC twice for 15 min,0.5� SSC for 5 min, 0.07� SSC rinse twice, and nitrogen gasdry).
Arrays were scanned into 16-bit tiff image files with an Axon4000B microarray scanner and quantified using GenePix Pro 6.0(Axon Instruments). Data analysis was performed as previouslydescribed (Cheung et al. 2005). In addition to the uniform cutoffvalue of 0.2 for the test/reference ratios, a single clone T-statisticand permutation-based P-value were computed, providing addi-tional criteria to determine whether a clone significantly devi-ated from the Mean.
FISH analysisMetaphase spreads for detection of deletions were prepared fromamniocytes or CVS using standard procedures. Interphase nucleiwere analyzed for duplications/copy number gains. MiniprepBAC DNA (100 ng) was labeled with Spectrum Orange-dUTP orSpectrum Green-dUTP (Vysis) according to the manufacturer’sprotocol and used as probes for FISH analysis using establishedprotocols (Trask 1991).
AcknowledgmentsWe thank our many Illumina colleagues involved in the devel-opment of the Infinium genotyping products including those inassay development, high-throughput oligonucleotide synthesis,bead production, bioinformatics and software, marketing, andmanufacturing. This work was supported, in part, by a grant fromthe NIH/NCI (2 R44 CA103406-02). Illumina, Sentrix, BeadArray,and Infinium are registered trademarks or trademarks of Illu-mina, Inc.
References
Abeln, E.C., Corver, W.E., Kuipers-Dijkshoorn, N.J., Fleuren, G.J., andCornelisse, C.J. 1994. Molecular genetic analysis of flow-sortedovarian tumour cells: Improved detection of loss of heterozygosity.Br. J. Cancer 70: 255–262.
Albertson, D.G. and D. Pinkel. 2003. Genomic microarrays in humangenetic disease and cancer. Hum. Mol. Genet. 12: R145–R152.
Albertson, D.G., Collins, C., McCormick, F., and Gray, J.W. 2003.Chromosome aberrations in solid tumors. Nat. Genet. 34: 369–376.
Altshuler, D., Brooks, L.D., Chakravarti, A., Collins, F.S., Daly, M.J., andDonnelly, P. 2005. A haplotype map of the human genome. Nature437: 1299–1320.
Barrett, M.T., Scheffer, A., Ben-Dor, A., Sampas, N., Lipson, D., Kincaid,R., Tsang, P., Curry, B., Baird, K., Meltzer, P.S., et al. 2004.Comparative genomic hybridization using oligonucleotidemicroarrays and total genomic DNA. Proc. Natl. Acad. Sci.101: 17765–17770.
Bauters, M., Van Esch, H., Marynen, P., and Froyen, G. 2005. Xchromosome array-CGH for the identification of novel X-linkedmental retardation genes. Eur. J. Med. Genet. 48: 263–275.
Bignell, G.R., Huang, J., Greshock, J., Watt, S., Butler, A., West, S.,Grigorova, M., Jones, K.W., Wei, W., Stratton, M.R., et al. 2004.High-resolution analysis of DNA copy number using oligonucleotide
microarrays. Genome Res. 14: 287–295.Brinkschmidt, C., Christiansen, H., Terpe, H.J., Simon, R., Boecker, W.,
Lampert, F., and Stoerkel, S. 1997. Comparative genomichybridization (CGH) analysis of neuroblastomas—An importantmethodological approach in paediatric tumour pathology. J. Pathol.181: 394–400.
Bruce, S., Leinonen, R., Lindgren, C.M., Kivinen, K., Dahlman-Wright,K., Lipsanen-Nyman, M., Hannula-Jouppi, K., and Kere, J. 2005.Global analysis of uniparental disomy using high densitygenotyping arrays. J. Med. Genet. 42: 847–851.
Cammarata, M., Di Simone, P., Graziano, L., Giuffre, M., Corsello, G.,and Garofalo, G. 1999. Rare sex chromosome aneuploidies inhumans: Report of six patients with 48,XXYY, 49,XXXXY, and48,XXXX karyotypes. Am. J. Med. Genet. 85: 86–87.
Cheung, S.W., Shaw, C.A., Yu, W., Li, J., Ou, Z., Patel, A., Yatsenko, S.A.,Cooper, M.L., Furman, P., Stankiewicz, P., et al. 2005. Developmentand validation of a CGH microarray for clinical cytogeneticdiagnosis. Genet. Med. 7: 422–432.
Clayton-Smith, J., Webb, T., Cheng, X.J., Pembrey, M.E., and Malcolm,S. 1993. Duplication of chromosome 15 in the region 15q11–13 in apatient with developmental delay and ataxia with similarities toAngelman syndrome. J. Med. Genet. 30: 529–531.
Cottier, M., Tchirkov, A., Perissel, B., Giollant, M., Campos, L., andVago, P. 2004. Cytogenetic characterization of seven human cancercell lines by combining G- and R-banding, M-FISH, CGH andchromosome- and locus-specific FISH. Int. J. Mol. Med. 14: 483–495.
Curran, S., McKay, J.A., McLeod, H.L., and Murray, G.I. 2000. Lasercapture microscopy. Mol. Pathol. 53: 64–68.
DeBaun, M.R., Niemitz, E.L., McNeil, D.E., Brandenburg, S.A., Lee, M.P.,and Feinberg, A.P. 2002. Epigenetic alterations of H19 and LIT1distinguish patients with Beckwith-Wiedemann syndrome withcancer and birth defects. Am. J. Hum. Genet. 70: 604–611.
Dockhorn-Dworniczak, B., Poremba, C., Dantcheva, R., Stucker, A.,Brommelkamp, E., Blasius, S., Mellin, W., Roessner, A., Yandell,D.W., and Bocker, W. 1994. Rapid detection of loss of heterozygosityof chromosome 17p by polymerase chain reaction-based variablenumber of tandem repeat analysis and detection of single-strandconformation polymorphism of intragenic p53 polymorphisms.Virchows Arch. 424: 337–342.
Driscoll, D.A., Budarf, M.L., and Emanuel, B.S. 1992. A genetic etiologyfor DiGeorge syndrome: Consistent deletions and microdeletions of22q11. Am. J. Hum. Genet. 50: 924–933.
Fitzgibbon, J., Smith, L.L., Raghavan, M., Smith, M.L., Debernardi, S.,Skoulakis, S., Lillington, D., Lister, T.A., and Young, B.D. 2005.Association between acquired uniparental disomy and homozygousgene mutation in acute myeloid leukemias. Cancer Res.65: 9152–9154.
Francke, U. 1999. Williams-Beuren syndrome: Genes and mechanisms.Hum. Mol. Genet. 8: 1947–1954.
Fukuzawa, R., Hata, J., Hayashi, Y., Ikeda, H., and Reeve, A.E. 2003.Beckwith-Wiedemann syndrome-associated hepatoblastoma: wntsignal activation occurs later in tumorigenesis in patients with11p15.5 uniparental disomy. Pediatr. Dev. Pathol. 6: 299–306.
Gray, J.W. and Collins, C. 2000. Genome changes and gene expressionin human solid tumors. Carcinogenesis 21: 443–452.
Gunderson, K.L., Steemers, F.J., Kuhn, K., Ren, H., Zhou, L., Ng, P.,King, C., Lee, G., Tsan, C., Chang, W., et al. 2005. Genetic variancedetection: Technologies for pharmacogenomics, pp. 221–235. DNA Press,Eagleville, PA.
Hanahan, D. and Weinberg, R.A. 2000. The hallmarks of cancer. Cell100: 57–70.
Hata, N., Yoshimoto, K., Yokoyama, N., Mizoguchi, M., Shono, T.,Guan, Y., Tahira, T., Kukita, Y., Higasa, K., Nagata, S., et al. 2006.Allelic losses of chromosome 10 in glioma tissues detected byquantitative single-strand conformation polymorphism analysis.Clin. Chem. 52: 370–378.
Hayashizaki, Y., Hirotsune, S., Okazaki, Y., Hatada, I., Shibata, H.,Kawai, J., Hirose, K., Watanabe, S., Fushiki, S., Wada, S., et al. 1993.Restriction landmark genomic scanning method and its variousapplications. Electrophoresis 14: 251–258.
Huang, J., Wei, W., Zhang, J., Liu, G., Bignell, G.R., Stratton, M.R.,Futreal, P.A., Wooster, R., Jones, K.W., and Shapero, M.H. 2004.Whole genome DNA copy number changes identified by highdensity oligonucleotide arrays. Hum. Genomics 1: 287–299.
Ishkanian, A.S., Malloff, C.A., Watson, S.K., DeLeeuw, R.J., Chi, B., Coe,B.P., Snijders, A., Albertson, D.G., Pinkel, D., Marra, M.A., et al.2004. A tiling resolution DNA microarray with complete coverage ofthe human genome. Nat. Genet. 36: 299–303.
Kallioniemi, A., Kallioniemi, O.P., Waldman, F.M., Chen, L.C., Yu, L.C.,Fung, Y.K., Smith, H.S., Pinkel, D., and Gray, J.W. 1992. Detectionof retinoblastoma gene copy number in metaphase chromosomes
Infinium SNP-CGH
Genome Research 1147www.genome.org
and interphase nuclei by fluorescence in situ hybridization.Cytogenet. Cell Genet. 60: 190–193.
Kallioniemi, O.P., Kallioniemi, A., Piper, J., Isola, J., Waldman, F.M.,Gray, J.W., and Pinkel, D. 1994. Optimizing comparative genomichybridization for analysis of DNA sequence copy number changes insolid tumors. Genes Chromosomes Cancer 10: 231–243.
Kallioniemi, A., Visakorpi, T., Karhu, R., Pinkel, D., and Kallioniemi,O.P. 1996. Gene copy number analysis by fluorescence in situhybridization and comparative genomic hybridization. Methods9: 113–121.
Knudson Jr., A.G. 1975. The genetics of childhood cancer. Cancer35: 1022–1026.
———. 2001. Two genetic hits (more or less) to cancer. Nat. Rev. Cancer1: 157–162.
Koed, K., Wiuf, C., Christensen, L.L., Wikman, F.P., Zieger, K., Moller,K., von der Maase, H., and Orntoft, T.F. 2005. High-density singlenucleotide polymorphism array defines novel stage andlocation-dependent allelic imbalances in human bladder tumors.Cancer Res. 65: 34–45.
LaFramboise, T., Weir, B.A., Zhao, X., Beroukhim, R., Li, C., Harrington,D., Sellers, W.R., and Meyerson, M. 2005. Allele-specificamplification in cancer revealed by SNP array analysis. PLoS Comput.Biol. 1: e65.
Lai, W.R., Johnson, M.D., Kucherlapati, R., and Park, P.J. 2005.Comparative analysis of algorithms for identifying amplificationsand deletions in array CGH data. Bioinformatics 21: 3763–3770.
Langdon, J.A., Lamont, J.M., Scott, D.K., Dyer, S., Prebble, E., Bown, N.,Grundy, R.G., Ellison, D.W., and Clifford, S.C. 2006. Combinedgenome-wide allelotyping and copy number analysis identifyfrequent genetic losses without copy number reduction inmedulloblastoma. Genes Chromosomes Cancer 45: 47–60.
Ledbetter, D.H. and Engel, E. 1995. Uniparental disomy in humans:Development of an imprinting map and its implications for prenataldiagnosis. Hum. Mol. Genet. 4: 1757–1764.
Liyanage, M., Coleman, A., du Manoir, S., Veldman, T., McCormack, S.,Dickson, R.B., Barlow, C., Wynshaw-Boris, A., Janz, S., Wienberg, J.,et al. 1996. Multicolour spectral karyotyping of mousechromosomes. Nat. Genet. 14: 312–315.
Macville, M., Veldman, T., Padilla-Nash, H., Wangsa, D., O’Brien, P.,Schrock, E., and Ried, T. 1997. Spectral karyotyping, a 24-colourFISH technique for the identification of chromosomalrearrangements. Histochem. Cell Biol. 108: 299–305.
Mark, H.F., Bai, H., Sotomayor, E., Mark, S., Zolnierz, K., Airall, E., andSigman, M. 1999. A variant Klinefelter syndrome patient with anXXY/XX/XY karyotype studied by GTG-banding and fluorescence insitu hybridization. Exp. Mol. Pathol. 67: 50–56.
Nannya, Y., Sanada, M., Nakazaki, K., Hosoya, N., Wang, L., Hangaishi,A., Kurokawa, M., Chiba, S., Bailey, D.K., Kennedy, G.C., et al. 2005.A robust algorithm for copy number detection using high-densityoligonucleotide single nucleotide polymorphism genotyping arrays.Cancer Res. 65: 6071–6079.
Pinkel, D., Segraves, R., Sudar, D., Clark, S., Poole, I., Kowbel, D.,Collins, C., Kuo, W.L., Chen, C., Zhai, Y., et al. 1998. Highresolution analysis of DNA copy number variation usingcomparative genomic hybridization to microarrays. Nat. Genet.20: 207–211.
Raghavan, M., Lillington, D.M., Skoulakis, S., Debernardi, S., Chaplin,T., Foot, N.J., Lister, T.A., and Young, B.D. 2005. Genome-widesingle nucleotide polymorphism analysis reveals frequent partialuniparental disomy due to somatic recombination in acute myeloidleukemias. Cancer Res. 65: 375–378.
Rook, M.S., Delach, S.M., Deyneko, G., Worlock, A., and Wolfe, J.L.2004. Whole genome amplification of DNA from lasercapture-microdissected tissue for high-throughput single nucleotidepolymorphism and short tandem repeat genotyping. Am. J. Pathol.164: 23–33.
Rouyer, F., Simmler, M.C., Vergnaud, G., Johnsson, C., Levilliers, J.,Petit, C., and Weissenbach, J. 1986. The pseudoautosomal region ofthe human sex chromosomes. Cold Spring Harb. Symp. Quant. Biol.51: 221–228.
Santarosa, M. and Ashworth, A. 2004. Haploinsufficiency for tumoursuppressor genes: When you don’t need to go all the way. Biochim.Biophys. Acta 1654: 105–122.
Scambler, P.J., Carey, A.H., Wyse, R.K., Roach, S., Dumanski, J.P.,
Nordenskjold, M., and Williamson, R. 1991. Microdeletions within22q11 associated with sporadic and familial DiGeorge syndrome.Genomics 10: 201–206.
Selzer, R.R., Richmond, T.A., Pofahl, N.J., Green, R.D., Eis, P.S., Nair, P.,Brothman, A.R., and Stallings, R.L. 2005. Analysis of chromosomebreakpoints in neuroblastoma at sub-kilobase resolution usingfine-tiling oligonucleotide array CGH. Genes Chromosomes Cancer44: 305–319.
Shearer, P.D., Valentine, M.B., Grundy, P., DeCou, J.M., Banavali, S.D.,Komuro, H., Green, D.M., Beckwith, J.B., and Look, A.T. 1999.Hemizygous deletions of chromosome band 16q24 in Wilms tumor:Detection by fluorescence in situ hybridization. Cancer Genet.Cytogenet. 115: 100–105.
Singh, S., Simon, M., Meybohm, I., Jantke, I., Jonat, W., Maass, H., andGoedde, H.W. 1993. Human breast cancer: Frequent p53 allele lossand protein overexpression. Hum. Genet. 90: 635–640.
Slater, H.R., Bailey, D.K., Ren, H., Cao, M., Bell, K., Nasioulas, S., Henke,R., Choo, K.H., and Kennedy, G.C. 2005. High-resolutionidentification of chromosomal abnormalities using oligonucleotidearrays containing 116,204 SNPs. Am. J. Hum. Genet. 77: 709–726.
Solinas-Toldo, S., Lampel, S., Stilgenbauer, S., Nickolenko, J., Benner, A.,Dohner, H., Cremer, T., and Lichter, P. 1997. Matrix-basedcomparative genomic hybridization: Biochips to screen for genomicimbalances. Genes Chromosomes Cancer 20: 399–407.
Somerville, M.J., Mervis, C.B., Young, E.J., Seo, E.J., del Campo, M.,Bamforth, S., Peregrine, E., Loo, W., Lilley, M., Perez-Jurado, L.A., etal. 2005. Severe expressive-language delay related to duplication ofthe Williams-Beuren locus. N. Engl. J. Med. 353: 1694–1701.
Steemers, F.J. and Gunderson, K.L. 2005. Illumina, Inc.Pharmacogenomics 6: 777–782.
Steemers, F.J., Chang, W., Lee, G., Barker, D.L., Shen, R., andGunderson, K.L. 2006. Whole-genome genotyping with thesingle-base extension assay. Nat. Methods 3: 31–33.
Teh, M.T., Blaydon, D., Chaplin, T., Foot, N.J., Skoulakis, S., Raghavan,M., Harwood, C.A., Proby, C.M., Philpott, M.P., Young, B.D., et al.2005. Genomewide single nucleotide polymorphism microarraymapping in basal cell carcinomas unveils uniparental disomy as akey somatic event. Cancer Res. 65: 8597–8603.
Tischfield, J.A. 1997. Loss of heterozygosity or: How I learned to stopworrying and love mitotic recombination. Am. J. Hum. Genet.61: 995–999.
Trask, B.J. 1991. Fluorescence in situ hybridization: Applications incytogenetics and gene mapping. Trends Genet. 7: 149–154.
Volpi, E.V., Vatcheva, R., Labella, T., and Gan, S.U. 1996. More detailedcharacterization of some of the HL60 karyotypic features byfluorescence in situ hybridization. Cancer Genet. Cytogenet.87: 103–106.
Wang, T.L., Maierhofer, C., Speicher, M.R., Lengauer, C., Vogelstein, B.,Kinzler, K.W., and Velculescu, V.E. 2002. Digital karyotyping. Proc.Natl. Acad. Sci. 99: 16156–16161.
Wright, T.J., Ricke, D.O., Denison, K., Abmayr, S., Cotter, P.D.,Hirschhorn, K., Keinanen, M., McDonald-McGinn, D., Somer, M.,Spinner, N., et al. 1997. A transcript map of the newly defined 165kb Wolf-Hirschhorn syndrome critical region. Hum. Mol. Genet.6: 317–324.
Ylstra, B., van den Ijssel, P., Carvalho, B., Brakenhoff, R.H., and Meijer,G.A. 2006. BAC to the future! or Oligonucleotides: A perspective formicro array comparative genomic hybridization (array CGH). NucleicAcids Res. 34: 445–450.
Zauber, N.P., Sabbath-Solitare, M., Marotta, S.P., McMahon, L., andBishop, D.T. 1999. Comparison of allelic ratios from paired bloodand paraffin-embedded normal tissue for use in a polymerase chainreaction to assess loss of heterozygosity. Mol. Diagn. 4: 29–35.
Zhao, X., Li, C., Paez, J.G., Chin, K., Janne, P.A., Chen, T.H., Girard, L.,Minna, J., Christiani, D., Leo, C., et al. 2004. An integrated view ofcopy number and allelic alterations in the cancer genome usingsingle nucleotide polymorphism arrays. Cancer Res. 64: 3060–3071.
Zheng, H.T., Peng, Z.H., Li, S., and He, L. 2005. Loss of heterozygosityanalyzed by single nucleotide polymorphism array in cancer. WorldJ. Gastroenterol. 11: 6740–6744.
Received April 13, 2006; accepted in revised form July 5, 2006.
Peiffer et al.
1148 Genome Researchwww.genome.org
Related Documents