This article was published in an Elsevier journal. The attached copy is furnished to the author for non-commercial research and education use, including for instruction at the author’s institution, sharing with colleagues and providing to institution administration. Other uses, including reproduction and distribution, or selling or licensing copies, or posting to personal, institutional or third party websites are prohibited. In most cases authors are permitted to post their version of the article (e.g. in Word or Tex form) to their personal website or institutional repository. Authors requiring further information regarding Elsevier’s archiving and manuscript policies are encouraged to visit: http://www.elsevier.com/copyright

Welcome message from author
This document is posted to help you gain knowledge. Please leave a comment to let me know what you think about it! Share it to your friends and learn new things together.
Transcript

This article was published in an Elsevier journal. The attached copyis furnished to the author for non-commercial research and
education use, including for instruction at the author’s institution,sharing with colleagues and providing to institution administration.
Other uses, including reproduction and distribution, or selling orlicensing copies, or posting to personal, institutional or third party
websites are prohibited.
In most cases authors are permitted to post their version of thearticle (e.g. in Word or Tex form) to their personal website orinstitutional repository. Authors requiring further information
regarding Elsevier’s archiving and manuscript policies areencouraged to visit:
http://www.elsevier.com/copyright
Author's personal copy
High-resolution cyclostratigraphic analysis from magnetic susceptibility in aLower Kimmeridgian (Upper Jurassic) marl–limestone succession
(La Méouge, Vocontian Basin, France)
Slah Boulila a,b, Bruno Galbrun a,⁎, Linda A. Hinnov c, Pierre-Yves Collin a
a Université Paris VI, CNRS - UMR 7072 Tectonique – Evolution et modélisation des Bassins Sédimentaires, case 117, 4 place Jussieu, 75252 Paris cedex 5, Franceb Département de Géologie, Faculté des Sciences de Tunis, Université de Tunis-El Manar, Campus Universitaire, 2092, Tunis, Tunisie
c Morton K. Blaustein Department of Earth and Planetary Sciences, Johns Hopkins University, 3400 North Charles Street, Baltimore, Maryland 21218, USA
Received 20 March 2007; received in revised form 4 July 2007; accepted 30 October 2007
Abstract
High-resolution magnetic susceptibility (MS) analysis was carried out on a Lower Kimmeridgian alternating marl–limestone succession ofpelagic origin that crops out at La Méouge (Vocontian Basin, southeastern France). The aim of the study was to characterize the strong, dm-scalesedimentary cyclicity of the succession at a very high resolution, and to analyze the cycles for evidence of astronomical forcing. From marl tolimestone, MS varies progressively and closely tracks the highest frequency cyclicity corresponding to the basic marl–limestone couplets. Long-term wavelength cycling modulates the high-frequency cyclicity (couplets), and appears to be controlled by clay content. Spectral analysis of theMS record reveals the presence of the complete suite of orbital frequencies in the precession, obliquity, and eccentricity (95–128 ka and 405 ka)bands with very high amplitude of the precession index cycles originating from dm-scale couplets. 405 ka-eccentricity cycles are very pronouncedin the MS maxima of the marl members of the couplets, suggesting eccentricity-driven detrital input to the basin. 405 ka-orbital tuning of the MSmaxima further sharpens all of the orbital frequencies present in the succession. These results are similar to those of previous studies at La Méougethat used carbonate content observed in field. Our results are also in accordance with cyclostratigraphic studies in Spain and Canada that reportdominant precession index forcing. By contrast, in the Kimmeridge Clay (Dorset, UK), obliquity forcing dominates cyclic sedimentation, withweaker influence from the precession index. Ammonite zone duration estimates are made by counting the interpreted precession cycles, andprovide an ultra-high resolution assessment of geologic time. In sum, this study demonstrates the power of the MS as a proxy in characterizing thehigh-resolution cyclostratigraphy of Mesozoic sections, particularly in alternating marl–limestone successions, and for high-resolution correlationand astronomical calibration of the geologic time scale.© 2007 Elsevier B.V. All rights reserved.
Keywords: Magnetic susceptibility; Cyclostratigraphy; Pelagic marl–limestone succession; Lower Kimmeridgian; Vocontian Basin; France
1. Introduction
Chemical and physical proxies from sedimentary rock se-quences are frequently used for palaeoclimatic studies and fordetecting orbitally forced cyclicity in marine Cenozoic sequencesand calibrating recognized sedimentary cycles to time-periodicity.For pre-Cenozoic marine sequences, cyclostratigraphic studiesusing these proxies are relatively fewwith difficulties arising from
diagenesis that affect chemical and physical properties of rocks.Moreover, cyclostratigraphic studies need high-resolution sam-pling and analysis, and their implementation can quickly becomeexpensive and time-consuming.
Magnetic susceptibility (MS) is an indicator of how sus-ceptible a substance is to becoming magnetized when placed ina magnetic field. The MS of rock samples is largely a functionof the concentration of the magnetizable materials they contain(e.g., Ellwood et al., 2000). The different behaviors of mag-netic minerals are categorized as a function of their MS val-ues. Ferrimagnetic minerals such as magnetite have high and
Available online at www.sciencedirect.com
Sedimentary Geology 203 (2008) 54–63www.elsevier.com/locate/sedgeo
⁎ Corresponding author.E-mail address: [email protected] (B. Galbrun).
0037-0738/$ - see front matter © 2007 Elsevier B.V. All rights reserved.doi:10.1016/j.sedgeo.2007.10.004

Author's personal copy
positive MS values. Paramagnetic minerals such as clays haveweak and positive MS values, and diamagnetic minerals suchas calcium carbonate and quartz have very weak and negativeMS values. Thus, high-frequency variations in MS in sedimentsreflect slight variations in lithology, primarily due to changes inthe detrital component fluxes mineralogy, which are largelyclimatically influenced. Thus MS constitutes a very useful pa-rameter for detecting palaeoclimatic change (Shackleton et al.,1999; Weedon et al., 1999).
MS has been used with great success to characterize marineCenozoic sequences (e.g., Shackleton et al., 1995, 1999). Formarine pre-Cenozoic sequences, cyclostratigraphic studiesusing MS are still relatively rare but nonetheless have alsodemonstrated that MS is a powerful tool for the cyclostrati-graphy of geologically older sequences (e.g., Weedon et al.,1999; Crick et al., 2000; Latta et al., 2006). MS can be analyzedat a cm-scale, either in boreholes or on small samples obtainedfrom outcroppings. MS is not costly, measurement can be rap-id (a few seconds of time per measurement), easy and non-destructive. Thus, MS is very useful for high-resolution cy-clostratigraphic analysis.
The purpose of this paper is to apply the MS methodologyto Jurassic alternating marl–limestone successions. We per-formed MS high-resolution analysis on the La Méouge sectionsituated in the Vocontian Basin of southeastern France (Fig. 1),an epicontinental basin surrounded during the Jurassic bydifferent emergent terrains, the likely detrital source region(Debrand-Passard et al., 1984; Dercourt et al., 1993). Conse-quently, the La Méouge section provides a sensitive geologicrecord of ancient conditions of hydrologic weathering and is anideal area for geodynamic, paleogeographic and paleoclimaticstudies.
The section was examined previously by Colombié (2002)and Colombié and Strasser (2003) who used cycle bedthicknesses, interpreted from carbonate content (%CaCO3)variations observed in the field, to identify elementary se-quences as precession controlled (15 ka to 32 ka with a meanof 22 ka), superimposed small-scale sequences as 100 ka-eccentricity controlled, that in turn are superimposed onmedium-scale sequences as 400 ka-eccentricity controlled.Here we apply the MS method to recover this cyclicity at amuch finer scale, for detailed assessment of the internalstructure of the elementary cycles (couplets), and to betterunderstand the climate–sediment linkages that led to theobserved cyclic stratigraphy.
MS detected the complete range of orbital frequencies(precession, obliquity, 95–130 ka and 405 ka-eccentricitycycles) with compelling evidence for precession and eccen-tricity cycles. The former, characterized by the sedimentarycouplets, can be used to estimate short-term ammonite zonedurations. The latter modulates the precession index cycles andhence detrital input in the basin, and can be used for as-tronomical calibration of the geologic time scale at least as farback as the beginning of the Mesozoic (Laskar et al., 2004).
2. Geologic setting and stratigraphic framework
2.1. Geologic setting
Paleogeographically, the sub-alpine terrain of southeasternFrance (Fig. 1) was located on the proximal part of the South-European Tethys margin. It includes the Vocontian Basin, whichexperienced relatively high rates of subsidence during Jurassicand Early Cretaceous times, bordered by carbonate platforms
Fig. 1. Structural map of the Vocontian Basin, southeast of France (Graciansky et al., 1999). The La Méouge section location is indicated by the white star. HB =Hercynian basement; JuCP = Jurassic carbonate platforms; Ba = basinal area; SF = synsedimentary Jurassic faults; Ch = main thrust faults.
55S. Boulila et al. / Sedimentary Geology 203 (2008) 54–63

Author's personal copy
limited by a net of extensional or strike–slip faults (Gracianskyet al., 1999). The western border of the basin on the MassifCentral side was defined by steep fault scarps. By contrast, theeastern side was a long and gentle submarine slope that sep-arated the Digne Basin from the Provence Platform in the Nicearea (Graciansky et al., 1999).
The Vocontian Basin is also characterized by tilted blocksdating to Jurassic time (Dardeau et al., 1988; Dardeau andGraciansky, 1990). Extensional tectonics during the Middle andLate Jurassic was related to the opening of the Tethyan ocean(Graciansky et al., 1999) and possibly northern Atlantic rifting(Graciansky and Lemoine, 1988). This epicontinental basin wassurrounded by emergent areas during Jurassic time: the Corso–Sarde terrain to the south, the Massif Central to the west, theArdennaise area to the north and the Briançonnais terrain to
the east, where derivation of detrital components was likely(Debrand-Passard et al., 1984; Dercourt et al., 1993).
2.2. Stratigraphic framework — geologic time
The La Méouge section is located in the Vocontian Basinalong road D942 between the villages of Laragne-Montéglinand Barret-le-Bas. It is a ca. 95-meter thick section, spanningthe Upper Oxfordian (Bimammatun zone p.p.) to the UpperKimmeridgian (Acanthicum zone p.p.) (Atrops, 1982;de Rafélis, 2000). Forty three meters of this section (Fig. 2)are the focus of this study, which covers 37 meters of LowerKimmeridgian and 6 meters of Upper Kimmeridgian. Thisinterval is composed of clastic to carbonate dominated mud-stone couplets that are well defined within the Lothari subzone
Fig. 2. Stratigraphy, magnetic susceptibility (MS) variations and 405 ka-orbital tuning of the La Méouge section in the Vocontian Basin, SE France.
56 S. Boulila et al. / Sedimentary Geology 203 (2008) 54–63
Author's personal copy
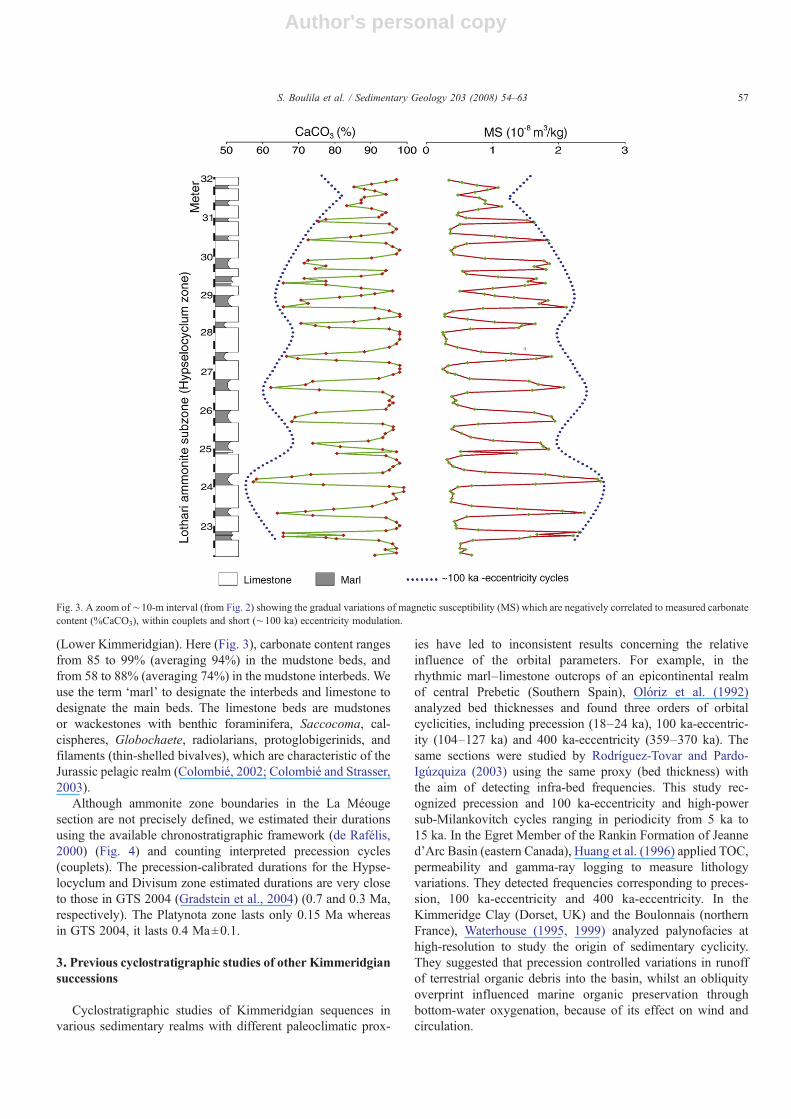
(Lower Kimmeridgian). Here (Fig. 3), carbonate content rangesfrom 85 to 99% (averaging 94%) in the mudstone beds, andfrom 58 to 88% (averaging 74%) in the mudstone interbeds. Weuse the term ‘marl’ to designate the interbeds and limestone todesignate the main beds. The limestone beds are mudstonesor wackestones with benthic foraminifera, Saccocoma, cal-cispheres, Globochaete, radiolarians, protoglobigerinids, andfilaments (thin-shelled bivalves), which are characteristic of theJurassic pelagic realm (Colombié, 2002; Colombié and Strasser,2003).
Although ammonite zone boundaries in the La Méougesection are not precisely defined, we estimated their durationsusing the available chronostratigraphic framework (de Rafélis,2000) (Fig. 4) and counting interpreted precession cycles(couplets). The precession-calibrated durations for the Hypse-locyclum and Divisum zone estimated durations are very closeto those in GTS 2004 (Gradstein et al., 2004) (0.7 and 0.3 Ma,respectively). The Platynota zone lasts only 0.15 Ma whereasin GTS 2004, it lasts 0.4 Ma±0.1.
3. Previous cyclostratigraphic studies of other Kimmeridgiansuccessions
Cyclostratigraphic studies of Kimmeridgian sequences invarious sedimentary realms with different paleoclimatic prox-
ies have led to inconsistent results concerning the relativeinfluence of the orbital parameters. For example, in therhythmic marl–limestone outcrops of an epicontinental realmof central Prebetic (Southern Spain), Olóriz et al. (1992)analyzed bed thicknesses and found three orders of orbitalcyclicities, including precession (18–24 ka), 100 ka-eccentric-ity (104–127 ka) and 400 ka-eccentricity (359–370 ka). Thesame sections were studied by Rodríguez-Tovar and Pardo-Igúzquiza (2003) using the same proxy (bed thickness) withthe aim of detecting infra-bed frequencies. This study rec-ognized precession and 100 ka-eccentricity and high-powersub-Milankovitch cycles ranging in periodicity from 5 ka to15 ka. In the Egret Member of the Rankin Formation of Jeanned'Arc Basin (eastern Canada), Huang et al. (1996) applied TOC,permeability and gamma-ray logging to measure lithologyvariations. They detected frequencies corresponding to preces-sion, 100 ka-eccentricity and 400 ka-eccentricity. In theKimmeridge Clay (Dorset, UK) and the Boulonnais (northernFrance), Waterhouse (1995, 1999) analyzed palynofacies athigh-resolution to study the origin of sedimentary cyclicity.They suggested that precession controlled variations in runoffof terrestrial organic debris into the basin, whilst an obliquityoverprint influenced marine organic preservation throughbottom-water oxygenation, because of its effect on wind andcirculation.
Fig. 3. A zoom of ∼10-m interval (from Fig. 2) showing the gradual variations of magnetic susceptibility (MS) which are negatively correlated to measured carbonatecontent (%CaCO3), within couplets and short (∼100 ka) eccentricity modulation.
57S. Boulila et al. / Sedimentary Geology 203 (2008) 54–63

Author's personal copy
In this same formation (Kimmeridge Clay), Weedon et al.(1999, 2004) used MS, a photoelectric factor and total gamma-ray measurements from outcrops and boreholes to demon-strate that lithological variations were likely dominated byobliquity forcing. In the lime mudstone succession of an out-er ramp now exposed at Aguilón, North Iberian Ranges, Spain,Bádenas et al. (2003, 2005) applied facies analysis to inter-pret stratigraphic bundles as resulting from precession driven
processes and super-bundles as due to 100 ka-eccentricity driv-en processes.
The dominance of different orbital parameters observedin these studies may be linked to paleogeographic position,hydrologic reservoir distribution, sedimentary facies, and/or paleoclimatic proxy (Berger, 1978b; Hinnov and Park,1999; Röhl et al., 2001; Van Vugt et al., 2001; Rey et al.,2003).
Fig. 4. Interpreted eccentricity cycles from magnetic susceptibility (MS) (this study) and carbonate content observed in field (%CaCO3) (Colombié, 2002) in the LaMéouge section in the Vocontian Basin, SE France.
58 S. Boulila et al. / Sedimentary Geology 203 (2008) 54–63

Author's personal copy
4. Methodology
4.1. Measurements
The studied interval was sampled at ∼0.07 m intervals(Fig. 2), a spacing that is much smaller than the thinnest beds,to prevent aliasing of the stratigraphic information. In lime-stone beds, we drilled samples, and in marls, we sampled usinga hammer.
The 604 collected samples were measured for MS using aKappabridge KLY-2. Each sample was measured three times,and the mean of these values is reported relative to specificmass.
4.2. Spectral analysis: methods
The data were linearly interpolated to an even spacing of0.02 m, then submitted to spectral analysis (Fig. 5) using themultitaper method (MTM) (Thomson, 1982) as implemented
in the freeware AnalySeries (Paillard et al., 1996). The har-monic F-test was used to seek evidence for individual lineswithin frequency bands with elevated power that could berelated to specific orbital frequencies.
We applied the method of frequency ratios (Huang et al.,1992; Mayer and Appel, 1999) to compare the observed spectralfrequencies with orbital frequencies estimated for Late Jurassictime (Berger and Loutre, 1994) (Tables 1A and B). First, wecorrelated spectral wavelength ratios to orbital period ratios.This allows calculation of the equation of correlation and cor-relation coefficient for the interpretation of sedimentary wave-lengths in terms of the orbital parameter periods.
4.3. Orbital tuning
Orbital tuning is problematic for Mesozoic cyclostratigra-phy. The main challenge is related to the lack of accurate orbitalsolutions (Laskar et al., 2004) that can be used for tuningstratigraphy older than about 50–60 Ma. Fortunately, there is
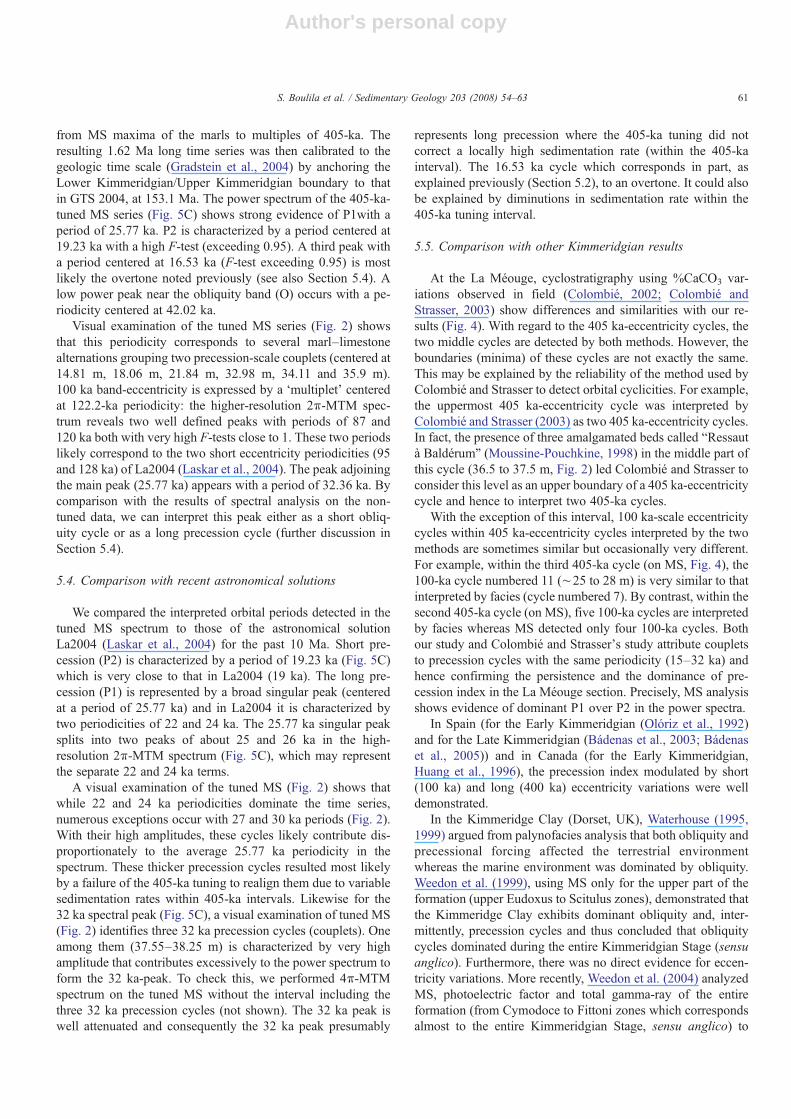
Fig. 5. MTM power spectra and F-test values of A. Original MS data, B. Maxima MS of marls, C. 405 ka-tuned MS.
59S. Boulila et al. / Sedimentary Geology 203 (2008) 54–63

Author's personal copy
one notable exception: the 405 ka-orbital eccentricity term,which can be estimated with high accuracy throughout theMesozoic Era.
Therefore, we tuned the original data to the 405 ka-eccentricity cycle, by fitting the solution to the minima of∼11-m cycles deduced from the variations of MS maximarecorded in successive marls (Fig. 2), and anchoring EarlyKimmeridgian/Late Kimmeridgian boundary (∼38 m strati-graphic position) to that in GTS 2004 (Gradstein et al., 2004).The output 405 ka tuned series can then be examined foralignment of other, higher frequency terms associated with 95 to130-ka scale orbital eccentricity, obliquity, and the precessionindex (further discussion in Section 5.3).
To tune our data, we used the “LinAge” function providedin AnalySeries (Paillard et al., 1996).
5. Cyclostratigraphy: results and discussion
5.1. MS variations
The La Méouge section is characterized by low MS values(0.12 to 2.73×10⁻⁸ m3/kg) (Fig. 2). The marls, dominated byclays, are characterized by the highest MS values and limestoneby lower MS values. MS variations follow a strongly cyclicpattern. From marl to limestone, MS changes progressively andclosely tracks the highest frequency cyclicity corresponding toobserved lithological couplets (Fig. 3). Low-frequency cyclingmodulates the high-frequency cyclicity (couplets), and appearsto be controlled by clay content. We picked MS maxima fromthe succession of marls as a measure of this low-frequencymodulation (Fig. 2). The ∼11-m low-frequency variation oc-curs in the 18% weighted average smoothed curve of MS max-ima of marls. These results are confirmed by spectral analysis,as follows.
5.2. Spectral analysis and discussion
We performed MTM spectral analysis on the original MSdata and MS-maxima series recorded in the marls.
5.2.1. Original MS dataThe spectrum of the entire 43-m succession of MS values
(Fig. 5A) shows numerous peaks with high F-test values oftenexceeding 0.95. The 0.56 m and 0.74 m wavelengths cor-respond to the thickness of couplets. To interpret these wave-
lengths in terms of possible orbital periods, we calculated theirratios (Table 1A) and compared them to orbital period ratiosrelative to the Late Jurassic time (Table 1B). Spectral periodratios are very close to orbital period ratios with a high cor-relation coefficient of 0.989. Thus, we interpret the 0.56 m and0.74 m wavelengths as precession index terms (P2 and P1,respectively), 1.16 m and 1.65 m wavelengths as obliquitycycles (O1 and O2, respectively), 2.54 m and 3.48 mwavelengths to 95 ka and 130 ka-eccentricity cycles (e2 ande1, respectively) and 11.30 m wavelength to the 405 ka-eccentricity cycle (E). The 0.43-meter peak may be the result ofsuperposition of precession harmonics (see Section 5.4, below)and is demonstrably an overtone of 0.74 m, confirmed by thefollowing test: we selected an interval of 5.5 meters (23 to28.5 m, Fig. 3) representing seven regular precession cycles(couplets). The 2π-MTM spectrum of this interval (not shown)detects a 0.74 m wavelength consistent with the average coupletthickness and a 0.43 m wavelength that is not represented byany of the couplet thicknesses in the interval. This latter derivesfrom residuals of disharmonic variations in the MS. Spectralanalysis of an equivalent 5.5 m interval of seven 0.74 m-cyclesof a rectangular function simulating this disharmonic variationgives the same results, and indicates that the 0.43 m spectralpeak is formed at least in part by an overtone of 0.74 m.
5.2.2. MS maxima of the marlsThe MS of the marls (Fig. 2) modulate the amplitudes of
the precession cycles (couplets) and point to a modulating de-trital input to the basin. Spectral analysis of the MS-maximaseries (Fig. 5B) shows two main peaks centered at 11.37 m(F-test significanceN0.95). and at 3.10 m (F-test significance∼0.95). We interpret the 11.37 m-wavelength cycle as 405 ka–eccentricity (E) and 3.10 m-wavelength cycles as ∼100 ka-eccentricity (approximately the mean of e1 and e2). Powerrecorded at frequencies higher than ∼0.5 cycles/meter, are ar-tifacts from the interpolation procedure we performed, whichresampled the MS-maxima series from their average spacingof 0.5 to 0.7 m intervals, to a uniform 0.125 cm spacing forthe spectral analysis.
5.3. Orbital tuning
We tuned only the four complete low-frequency cycles (from0.85 to 40.55 m, Fig. 2) to 405 ka by fitting the minima deduced
Table 1BOrbital frequency ratios calculated assuming Late Jurassic orbital periods(Berger and Loutre, 1994; with additional terms from Hinnov, 2000) as follows:P1=21.9 ka, P2=18.2 ka, O1=37.7 ka; O2=48.5 ka, e1=128 ka, e2=95 ka,E=405 ka
P2 P1 O1 O2 e2 e1 E
P2 1P1 0.831 1O1 0.483 0.581 1O2 0.375 0.451 0.782 1e2 0.191 0.230 0.397 0.510 1e1 0.142 0.171 0.294 0.379 0.742 1E 0.045 0.054 0.093 0.120 0.234 0.316 1
Table 1ASpectral frequency ratios calculated from peaks observed in the 4π-MTMspectrum, Fig. 5A
In meter 0.56 0.74 1.16 1.65 2.54 3.48 11.30
0.56 10.74 0.757 11.16 0.474 0.627 11.65 0.339 0.448 0.703 12.54 0.193 0.255 0.457 0.569 13.48 0.140 0.185 0.333 0.413 0.730 111.30 0.049 0.065 0.103 0.146 0.225 0.308 1
60 S. Boulila et al. / Sedimentary Geology 203 (2008) 54–63
Author's personal copy
from MS maxima of the marls to multiples of 405-ka. Theresulting 1.62 Ma long time series was then calibrated to thegeologic time scale (Gradstein et al., 2004) by anchoring theLower Kimmeridgian/Upper Kimmeridgian boundary to thatin GTS 2004, at 153.1 Ma. The power spectrum of the 405-ka-tuned MS series (Fig. 5C) shows strong evidence of P1with aperiod of 25.77 ka. P2 is characterized by a period centered at19.23 ka with a high F-test (exceeding 0.95). A third peak witha period centered at 16.53 ka (F-test exceeding 0.95) is mostlikely the overtone noted previously (see also Section 5.4). Alow power peak near the obliquity band (O) occurs with a pe-riodicity centered at 42.02 ka.
Visual examination of the tuned MS series (Fig. 2) showsthat this periodicity corresponds to several marl–limestonealternations grouping two precession-scale couplets (centered at14.81 m, 18.06 m, 21.84 m, 32.98 m, 34.11 and 35.9 m).100 ka band-eccentricity is expressed by a ‘multiplet’ centeredat 122.2-ka periodicity: the higher-resolution 2π-MTM spec-trum reveals two well defined peaks with periods of 87 and120 ka both with very high F-tests close to 1. These two periodslikely correspond to the two short eccentricity periodicities (95and 128 ka) of La2004 (Laskar et al., 2004). The peak adjoiningthe main peak (25.77 ka) appears with a period of 32.36 ka. Bycomparison with the results of spectral analysis on the non-tuned data, we can interpret this peak either as a short obliq-uity cycle or as a long precession cycle (further discussion inSection 5.4).
5.4. Comparison with recent astronomical solutions
We compared the interpreted orbital periods detected in thetuned MS spectrum to those of the astronomical solutionLa2004 (Laskar et al., 2004) for the past 10 Ma. Short pre-cession (P2) is characterized by a period of 19.23 ka (Fig. 5C)which is very close to that in La2004 (19 ka). The long pre-cession (P1) is represented by a broad singular peak (centeredat a period of 25.77 ka) and in La2004 it is characterized bytwo periodicities of 22 and 24 ka. The 25.77 ka singular peaksplits into two peaks of about 25 and 26 ka in the high-resolution 2π-MTM spectrum (Fig. 5C), which may representthe separate 22 and 24 ka terms.
A visual examination of the tuned MS (Fig. 2) shows thatwhile 22 and 24 ka periodicities dominate the time series,numerous exceptions occur with 27 and 30 ka periods (Fig. 2).With their high amplitudes, these cycles likely contribute dis-proportionately to the average 25.77 ka periodicity in thespectrum. These thicker precession cycles resulted most likelyby a failure of the 405-ka tuning to realign them due to variablesedimentation rates within 405-ka intervals. Likewise for the32 ka spectral peak (Fig. 5C), a visual examination of tuned MS(Fig. 2) identifies three 32 ka precession cycles (couplets). Oneamong them (37.55–38.25 m) is characterized by very highamplitude that contributes excessively to the power spectrum toform the 32 ka-peak. To check this, we performed 4π-MTMspectrum on the tuned MS without the interval including thethree 32 ka precession cycles (not shown). The 32 ka peak iswell attenuated and consequently the 32 ka peak presumably
represents long precession where the 405-ka tuning did notcorrect a locally high sedimentation rate (within the 405-kainterval). The 16.53 ka cycle which corresponds in part, asexplained previously (Section 5.2), to an overtone. It could alsobe explained by diminutions in sedimentation rate within the405-ka tuning interval.
5.5. Comparison with other Kimmeridgian results
At the La Méouge, cyclostratigraphy using %CaCO3 var-iations observed in field (Colombié, 2002; Colombié andStrasser, 2003) show differences and similarities with our re-sults (Fig. 4). With regard to the 405 ka-eccentricity cycles, thetwo middle cycles are detected by both methods. However, theboundaries (minima) of these cycles are not exactly the same.This may be explained by the reliability of the method used byColombié and Strasser to detect orbital cyclicities. For example,the uppermost 405 ka-eccentricity cycle was interpreted byColombié and Strasser (2003) as two 405 ka-eccentricity cycles.In fact, the presence of three amalgamated beds called “Ressautà Baldérum” (Moussine-Pouchkine, 1998) in the middle part ofthis cycle (36.5 to 37.5 m, Fig. 2) led Colombié and Strasser toconsider this level as an upper boundary of a 405 ka-eccentricitycycle and hence to interpret two 405-ka cycles.
With the exception of this interval, 100 ka-scale eccentricitycycles within 405 ka-eccentricity cycles interpreted by the twomethods are sometimes similar but occasionally very different.For example, within the third 405-ka cycle (on MS, Fig. 4), the100-ka cycle numbered 11 (∼25 to 28 m) is very similar to thatinterpreted by facies (cycle numbered 7). By contrast, within thesecond 405-ka cycle (on MS), five 100-ka cycles are interpretedby facies whereas MS detected only four 100-ka cycles. Bothour study and Colombié and Strasser's study attribute coupletsto precession cycles with the same periodicity (15–32 ka) andhence confirming the persistence and the dominance of pre-cession index in the La Méouge section. Precisely, MS analysisshows evidence of dominant P1 over P2 in the power spectra.
In Spain (for the Early Kimmeridgian (Olóriz et al., 1992)and for the Late Kimmeridgian (Bádenas et al., 2003; Bádenaset al., 2005)) and in Canada (for the Early Kimmeridgian,Huang et al., 1996), the precession index modulated by short(100 ka) and long (400 ka) eccentricity variations were welldemonstrated.
In the Kimmeridge Clay (Dorset, UK), Waterhouse (1995,1999) argued from palynofacies analysis that both obliquity andprecessional forcing affected the terrestrial environmentwhereas the marine environment was dominated by obliquity.Weedon et al. (1999), using MS only for the upper part of theformation (upper Eudoxus to Scitulus zones), demonstrated thatthe Kimmeridge Clay exhibits dominant obliquity and, inter-mittently, precession cycles and thus concluded that obliquitycycles dominated during the entire Kimmeridgian Stage (sensuanglico). Furthermore, there was no direct evidence for eccen-tricity variations. More recently, Weedon et al. (2004) analyzedMS, photoelectric factor and total gamma-ray of the entireformation (from Cymodoce to Fittoni zones which correspondsalmost to the entire Kimmeridgian Stage, sensu anglico) to
61S. Boulila et al. / Sedimentary Geology 203 (2008) 54–63
Author's personal copy
confirm the dominance of the obliquity in the Kimmeridgeversus the precession, indicating a high-latitude climatic forcingtransferred to lower latitudes via sea-level variations. They alsodemonstrated that the precession cycles were amplitude-mod-ulated by 100 and 85 ka-eccentricity cycles; the absence of405 ka-eccentricity cycles was thought to be due to distortioncaused by the irregularly distributed diagenetic stone bands.
The equivalent time-interval with La Méouge covers onlythe two lower ammonite zones (Cymodoce p.p. and Mutabilisp.p. zones; their equivalent Tethyan zones are Planula p.p.,Platynota, Hypselocyclum, Divisum and Acanthicum p.p.).Here, in the La Méouge, MS measurements show that preces-sion cycles dominated and were modulated by the eccentricity.In this same interval, precession and eccentricity cycles werealso found to dominate other sections in Canada and Spain.
6. Conclusions
High-resolution magnetic susceptibility (MS) analysis ofLower Kimmeridgian La Méouge section (Vocontian Basin,France) exhibits evidence of high and low-frequency cyclicitiesconfirmed by spectral analysis. Frequency ratios of both de-tected sedimentary cyclicities and astronomical cyclicities are inexcellent agreement and allow us to identify the complete suiteof orbital frequencies (precession, obliquity, 95 to 128 ka and405 ka-eccentricity cycles). Precession and 405 ka-eccentricitycycles are very pronounced in the MS signal. The former, whichis characterized by limestone/marl couplets, show progressivevariations of MS from marl to limestone. The latter, whichgroup about twenty couplets not evident in the outcrop, showmodulation of the amplitude of the precession scale cycles andhence detrital input in the basin.
To convert from thickness to time, we performed orbitaltuning with the 405 ka-eccentricity cycle as the target (Laskaret al., 2004). Spectral analysis of the tuned MS shows strongevidence of the complete range of orbital frequencies and sup-ports our frequency ratios interpretation.
We used the tuned MS series to estimate short-term am-monite zone durations. We obtained very similar results to thosein GTS 2004 (Gradstein et al., 2004) for the Hypselocyclum andDivisum zones (0.7 and 0.3 Ma respectively) but a potentiallysignificant difference for the Platynota zone (0.15 Ma). Theseestimates need cross-checking by correlating to other well-datedsections in the basin to refine the chronostratigraphic frame-work, which is not well determined at La Méouge, to investigatepossible presence of hiatuses.
The visually expressed 405 ka-eccentricity cycles can beused for astronomical calibration of the Kimmeridgian timescale by extending this study to other sections in the basincovering longer Kimmeridgian stratigraphic intervals, such asthe Crussol section (Atrops, 1982; Colombié and Strasser,2005).
Finally, we have demonstrated that MS is a powerful tool forthe cyclostratigraphic analysis of Mesozoic sections, particu-larly in alternating marl–limestone successions, thus is veryuseful for high-resolution correlation and astronomical calibra-tion of the geologic time scale.
Acknowledgments
S. Boulila acknowledges the “Institut Français de Coopéra-tion—Tunis” for the support of his PhD Thesis. We thankJohann Schnyder (from Paris VI University) who helped us inthe field. L.A. Hinnov was supported by the US NationalScience Foundation Grant EAR-0137799. We also thank EditorB.W. Sellwood and the reviewers for their comments thatgreatly improved the manuscript.
References
Atrops, F., 1982. La sous-famille des Ataxioceratinae (Ammonitina) dans leKimméridgien inférieur du Sud-Est de la France. Systématique, évolution,chronostratigraphie des genres Orthosphinctes et Ataxioceras. Doc. Lab.Géol. Lyon 83 463 p.
Bádenas, B., Aurell, M., Darren, R.G., 2005. Facies analysis and correlation ofhigh-order sequences in middle-outer ramp successions: variations inexported carbonate on basin-wide δ13Ccarb (Kimmeridgian, NE Spain).Sedimentology 52, 1253–1275.
Bádenas, B., Aurell, M., Rodríguez-Tovar, F.J., Pardo-Igúzquiza, E., 2003.Sequence stratigraphy and bedding rhythms of an outer ramp limestonesuccession (Late Kimmeridgian, Northeast Spain). Sed. Geol. 161, 153–174.
Berger, A., 1978b. Long-term variations of caloric insolation resulting from theEarth's orbital elements. Quat. Res. 9, 139–167.
Berger, A., Loutre, M.F., 1994. Astronomical forcing through geological time.Int. Ass. Sediment. Spec. Publ. 19, 15–24.
Colombié, C., 2002. Sédimentologie, stratigraphie séquentielle et cyclostrati-graphie du Kimméridgien du Jura suisse et du Bassin vocontien (France):relations plate-forme–bassin et facteurs determinants. GeoFocus 4 198 p.
Colombié, C., Strasser, A., 2003. Depositional sequences in the Kimmeridgianof the Vocontian Basin (France) controlled by carbonate export fromshallow-water platforms. Geobios 36, 675–683.
Colombié, C., Strasser, A., 2005. Facies, cycles, and controls on the evolution ofa keep-up carbonate platform (Kimmeridgian, Swiss Jura). Sedimentology52, 1207–1227.
Crick, R.E., Ellwood, B.B., El Hassani, A., Feist, R., 2000. Proposed mag-netostratigraphy susceptibility magnetostratotype for the Eifelian–GivetianGSSP (Anti-Atlas Morocco). Episodes, 23, 93–101.
Dardeau, G., Atrops, F., Fortwengler, D., Graciansky, P.C.de., Marchand, D.,1988. Jeu de blocs et tectonique distensive au Callovien et à l'Oxfordiendans le bassin du Sud-Est de la France. Bull. Soc. Géol. 5, 771–777 France8, IV.
Dardeau, G., Graciansky, P.C.de., 1990. Halocinèse et rifting téthysien dans lesAlpes-Maritimes (France). Bull. Centres Rech. Explor. Prod. Elf Aquitaine14, (2), 443–464.
Debrand-Passard, S., Courbouleix, S., Lienhardt, M.J., 1984. Synthèsegéologique du Sud-Est de la France. Mém. B.R.G.M. 614 p.
de Rafélis, S.S.M., 2000. Apport de l'étude de la spéciation du manganèse dansles carbonates pélagiques à la compréhension du contrôle des séquenceseustatiques de 3ème ordre. Ph.D. Thesis, P. et M. Curie Univ. Paris, France,214 p.
Dercourt, J., Ricou, L.E., Vrielynck, B., 1993. Atlas Tethys Palaeoenviron-mental maps. Gauthier-Villars, Paris. 307 p., 14 maps, 1 pl.
Ellwood, B.B., Crick, R.E., Hassani, A., Benoist, S.L., Young, R.H., 2000.Magnetosusceptibility event and cyclostratigraphy method applied to marinerock: detrial input versus carbonate productivity. Geology 28, 1135–1138.
Graciansky, P.C.de., Dardeau, G., Bodeur, Y., Elmi, S., Fortwengler, D., Jacquin,T., Marchand, D., Thierry, J., 1999. Les Terres Noires du Sud-Est de laFrance (Jurassique moyen et supérieur), interprétation en termes destratigraphie séquentielle. Bull. Centre Rech. Explor. Prod. Elf Aquitaine22 (1), 35–69.
Graciansky, P.C.de., Lemoine, M., 1988. Early Cretaceous extentional tectonicsin the southern French Alps: a consequence of North-Atlantic rifting duringTethyan spreading. Bull. Soc. Géol. 5, 733–737 France 8, IV.
62 S. Boulila et al. / Sedimentary Geology 203 (2008) 54–63

Author's personal copy
Gradstein, F.M., Ogg, J.G., Smith, A.G., 2004. A Geologic Time Scale 2004,Part III, Geologic Periods, Section 18: The Jurassic Period (Ogg, J. G.).Cambridge University Press, pp. 307–343.
Hinnov, L.A., 2000. New perspectives on orbitally forced stratigraphy. Annu.Rev. Earth Planet. Sci. 28, 419–475.
Hinnov, L.A., Park, J.J., 1999. Strategies for assessing Early–Middle(Pliensbachien–Aalenian) Jurassic cyclochronologies. Phil. Trans. R. Soc.Lond. A. 357, 1831–1860.
Huang, Z., Boyd, R., O'Connel, S., 1992. Upper Cretaceous cyclic sedimentsfrom hole 762C, Exmouth Plateau, Northwest Australia. In: Van Rad, U.,Haq, B.U., et al. (Eds.), Proc. Ocean Drilling Program. Sci. Res, vol. 122,pp. 259–277.
Huang, Z., Williamson, M.A., Bateman, J., McAlpine, K.D., Fowler, M.G.,1996. Cyclicity in the Egret Member (Kimmeridgian) oil source rock, Jeanned'Arc Basin, offshore eastern Canada. Mar. Pet. Geol. 13 (1), 91–105.
Laskar, J., Robutel, P., Joutel, F., Gastineau, M., Correia, A.C.M., Levrard, B.,2004. A long-term numerical solution for the insolution quantities of theEarth. Astron. & Astrophys. 428 (1), 261–285.
Latta, D.K., Anastasio, D.J., Hinnov, L.A., Elrick, M., Kodama, K.P., 2006.Magnetic record of Milankovitch rhythms in lithologically noncyclic marinecarbonates. Geology 34 (1), 29–32.
Mayer, H., Appel, E., 1999. Milankovitch cyclicity and rock-magneticsignatures of paleoclimatic changes in the Early Cretaceous BianconeFormation of the Southern Alps, Italy. Cretac. Res. 20, 189–214.
Moussine-Pouchkine, A., Amard, B., Atrops, F., Séguret, M., 1998. Lesalternances marne-calcaire du Kimméridgien inférieur du Bassin du SE(France): stratigraphie haute-résolution et cycles de Milankovitch, 6ème
Congrès Français de Sédimentologie. Pub. ASF 27, 205.Olóriz, F., Rodríguez-Tovar, F.J., Chica-Olmo, M., Pardo-Igúzquiza, E., 1992.
The marl–limestone rhythmites from the Lower Kimmeridgian (Platynotazone) of the central Prebetic and their relationship with variations in orbitalparameters. Earth Planet. Sci. Lett. 111, 407–424.
Paillard, D., Labeyrie, L., Yiou, P., 1996. Macintosch program performs time-series analysis. Eos 77, 379.
Rey, O., Lorente, M.A., Simo, T., 2003. Orbital forcing of organic-rich depositsformation: record of the Coniacian–Santonian OAE3 (La Luna Formation,
San Miguel River Section, Venezuela). AAPG International Conference,Barcelona, Spain. Sept. 21–24, 2003.
Rodríguez-Tovar, F.J., Pardo-Igúzquiza, E., 2003. Strong evidence of high-frequency (sub-Milankovitch) orbital forcing by amplitude modulation ofMilankovitch signals. Earth Planet. Sci. Lett. 210, 179–189.
Röhl, U., Ogg, J.G., Geib, T.L., Wefer, G., 2001. Astronomical calibration of theDanian time scale. In: Norris, R.D., Kroon, D., Klaus, A. (Eds.), WesternNorth Atlantic Paleogene and Cretaceous Paleoceanography. Geol. Soc.Lond., Spec. Publ., vol. 183, pp. 163–183.
Shackleton, N.J., Crowhurst, S., Hagelberg, T., Pisias, N.G., Schneider, D.A.,1995. A late Neogene time scale: application to leg 138 sites. In: Pisias,N.G., Janacek, T.R., Palmer-Julson, A., Van Andel, T.H. (Eds.), Pro-ceedings of the Ocean Drilling Program, Scientific Results, vol. 138,pp. 73–101.
Shackleton, N.J., Crowhurst, S.J., Weedon, G.P., Laskar, J., 1999. Astronomicalcalibration of Oligocene-Miocene time. Phil. Trans. R. Soc. Lond. A. 357,1909–1927.
Thomson, D.J., 1982. Spectrum estimation and harmonic analysis. IEEE Proc.70, 1055–1096.
Van Vugt, N., Langereis, C.G., Hilgen, F.J., 2001. Orbital forcing in Pliocene–Pleistocene Mediterranean lacustrine deposits: dominant expression ofeccentricity versus precession. Palaeogeogr. Palaeoclimatol. Palaeoecol.172, 193–205.
Waterhouse, H.K., 1995. High-resolution palynofacies investigation ofKimmeridgian sedimentary cycles. In: House, M.R., Gale, A.S. (Eds.),Orbital Forcing Timescales and Cyclostratigraphy. Geol. Soc. Lond. Spec.Publ. 85, pp. 75–114.
Waterhouse, H.K., 1999. Orbital forcing of palynofacies in the Jurassic ofFrance and the United Kingdom. Geology 27 (6), 511–514.
Weedon, G.P., Coe, A.L., Gallois, R.W., 2004. Cyclostratigraphy, orbital tuningand inferred productivity for the type Kimmeridge Clay (Late Jurassic),southern England. J. Geol. Soc. Lond. 161, 655–666.
Weedon, G.P., Jenkyns, H.C., Coe, A.L., Hesselbo, S.P., 1999. Astronomicalcalibration of the Jurassic time-scale from cyclostratigraphy in Britishmudrock formations. Phil. Trans. R. Soc. Lond. 357, 1787–1813.
63S. Boulila et al. / Sedimentary Geology 203 (2008) 54–63
Related Documents